enterprise information system (eis) value assurance...
TRANSCRIPT
1
Enterprise Information System (EIS) Value Assurance Framework (VAF) Risk-Reward Optimization
C.R. Gunderson, Naval Postgraduate School
Supporting Office of the Undersecretary of Defense for Intelligence 16 May 2014
Abstract
Projects that intend to deliver large Enterprise Information Systems (EIS) fail at an alarming rate – especially within the government. Hence, by definition, EIS project managers do not typically manage risk effectively. Meanwhile according to Moore’s Law, available computational power continues to increase exponentially, or equivalently, cost-per unit of computational power decreases exponentially. Exponentially expanding computational power continues to fuel exponentially better information technology (IT) device performance in terms of latencies, resolutions, capacities, etc. Exponentially improving IT device performance results in exponentially improving customer experiences for device customers. Moore’s Law is only the most recent formulation of the long-observed phenomena of exponentially decreasing cost per unit of functionality enabled by continuously improving manufacturing processes. This exponential law is not only based on physics. Rather, it is a self-sustaining artifact of industrial competitive pressures. I.e. to compete successfully, members of an industrial ecosystem must continually evolve their offerings in keeping with customer expectations of exponential improvement. Successful risk management strategies peg all activities to the overarching requirement to a) sustain or harvest the baseline exponential performance-per-cost growth rate, and b) differentiate their specific offerings on the basis of customer perceptions of delivered value-per-cost. Value Assurance Framework (VAF) translates best practices for risk management from traditional exponentially evolving manufacturing sectors, to the much more abstract requirements and less well-established discipline of EIS engineering and acquisition. On the other hand, VAF also applies successful practices for predicting risk in the volatile financial sector to capture additional departures from traditional systems engineering approaches necessary to harvest value from the volatile COTS IT sector.
Introduction
Gigantic, highly successful, Internet-based information-centric enterprises such as Amazon.com, Travelocity, or the eFile tax return ecosystem, seem ubiquitous. However, these impressive success cases notwithstanding, projects that aim to develop large complex, software-intensive distributed information systems often fail to meet their objectives, overrun their budgets, and are delivered late if at all (Bloch M, 2012) (GAO, 2014). The situation is particularly bad within military and other government programs (Defense Science Board, 2009).
2
Many industrial think tanks and government watch dog organizations have highlighted this issue. They have delivered myriad reports that provide damning statistics. These reports point out both the general failure patterns to avoid, and the rare successful patterns to emulate. However, these studies usually fall short of providing pragmatic, detailed, how-to, execution guidelines (GAO, 2014). Research being conducted by the Naval Postgraduate School (NPS) on behalf of the Office of the Secretary of Defense (OSD) hypothesizes that creation of Enterprise Information System (EIS) Value Assurance Framework (VAF) (Gunderson, 2014) can close that gap. In this sense, VAF is generally consistent with ideas presented in “Eating the IT Elephant.” That is, that book’s authors present a technical and business construct for collecting and applying demonstrated best practices for delivering large IT systems aimed at improvement in the global success rate of large IT projects. (Hokins & Jenkins, 2008) VAF asserts that software engineering is much less mature than traditional engineering disciplines (Brooks F. , 1995) so that traditional engineering assurance methods are not necessarily effective on large software-intensive projects. VAF hypothesizes that the volatility associated with rapidly evolving Information Technology makes risks associated with EIS similar to those associated with volatile financial markets. Therefore, a critical component of VAF is a value-based risk management rubric that applies lessons learned from both traditional systems engineering and financial management. A common definition of “risk” is: “The possibility that something bad will happen.” It follows that the rationale for accepting risk is the possibility that something good will happen as a result of the risky behavior. In this sense, risk and associated reward are contextually coupled. That is, acceptability of risk depends on how likely and how bad the potential bad consequences might be, compared to how likely and how good the good consequences might be. For a person who likes golf, it might be worth teeing off on a cloudy day despite a 30% risk that the game might get rained out. Even for a person who loves golf, it might not be worth teeing off near an ominous thunderhead even if there is just a .1% chance of getting struck by lightening. Risk acceptance, then, becomes a value-based decision. The golfer must weigh the relative value of he fun of playing golf, the comfort of staying dry, and the need to continue breathing against the likelihood of each of those valued outcomes occurring or not occurring. By definition, managing risk is equivalent to increasing the probability of success, i.e. achieving the desired reward. There are at least two, often complimentary, approaches to managing risk. Controlling risk means taking positive upstream actions that actually reduce downstream risks to acceptable levels. For example removing bullets from the chamber of a gun reduces the risk that it will fire accidentally. Hedging against risk means taking actions that leverage one risk against another. For example, making a side bet on rolling 7 in a game of craps hedges against the risk of crapping out before rolling the point. Paying more up

3
front for a more expensive product, because of its demonstrated higher reliability, controls the risk by reducing the odds that a particular component will ever fail. Paying extra for a product warrantee hedges against the risk that the component will fail, by “making a bet” that the part will indeed fail. The perceived value of an investment portfolio is either its current or anticipated future worth measured in monetary units. To investors, reward is defined as positive Return on Investment (RoI), i.e. a measurable increase in monetary worth. Financial risk is manageable. Investors weigh the value proposition of potentially large RoI vs. higher probability of getting any positive RoI. Investors who choose conservative strategies have high probability of earning at least some positive RoI, especially over the long term. Investors who choose aggressive strategies have higher probability of greater positive RoI, but also greater risk that their return will be negative. Both conservative and aggressive investment portfolios include a blend of investments that hedge against risks in a way that increases probability of success. Success in this case is either assurance of at least some RoI, or increased likelihood of large RoI. Understanding the factors that contribute to success and failure, and their associated probabilities is crucial. It is also crucial to understand the likely degree of success or failure. In other words, wise investors need to understand both the likelihood of the risk/reward factor occurring, and the likely financial magnitude of the consequence (positive or negative) of that occurrence. In this sense, risk is the probability that the investment will lose measurable value. The amount of potential reward is highly correlated to the amount of associated risk. That is, riskier investments, like start up companies, have the potential to net very large RoI. Safer investments, like government bonds, don’t have that potential. In the financial market, risk is essentially equivalent to uncertainty. Ergo, financial success depends on successfully managing uncertainty. Not surprisingly, therefore, the financial industry has evolved sophisticated methods for modeling uncertainty. Successful investors use these models, for the most part, to hedge against risk rather than to control it. On average, the value of managed financial portfolios is equal to the state of the market – some do a little better, some a little worse. However, a very small number of the most successful investment portfolio management firms consistently perform well above the average. These very successful firms manage risk by literally equating the value of an investment to the probabilistic balance between its associated risk and reward. For example, some sophisticated investors apply tools such as Shannon’s Theorem and Bayesian techniques to determine the actual risk associated with a particular investment compared to what the “market” believes the risk is. Mismatches either way are equivalent to knowledge of whether investments are over or under valued. That knowledge in turn provides sure bets for buyers or sellers who have the more precise understanding. (Weatherall, 2014)
4
RoI is clearly the most important MOE for an EIS that supports the financial management ecosystem. VAF aims to apply these effective, ROI-focused, practices more broadly to EIS associated with other domains, especially defense-related domains.
VAF EIS Risk-Reward Assumptions and Boundary Conditions
Assumptions and boundary conditions are descriptions of facts of life that constrain both risk and reward. Governance policies are almost always boundary conditions for EIS projects; i.e., projects must comply with, or waive, policy. Given the rapid evolution of IT, the perishability of the value of any particular Information Technology component or platform is almost always a critical BC for EIS projects. The specific security regimes involved are almost always critical boundary conditions for EIS projects. Etc. Here are some typical boundary conditions for government EIS acquisitions:
• Congressional mandates (e.g. title code, Goldwater/Nichols, Clinger Cohen Act, National Defense Authorization Acts, Sarbanes/Oxley)
• Defense acquisition policy (e.g. Federal Acquisition Regulations including color of money constraints; DOD Instructions, e.g. 5000/8510/6212, mandated standards.)
• Defense and Intelligence Community security policies. • Budget/Schedule • The relative utility of Information Technology decays exponentially per
Moore’s Law • Adversary has access to up-to-date COTS technology
Intended policy outcomes may or may not align with desired project outcomes, but policy compliance in-and-of-itself is not a reward. Expending project funding according to a budget schedule is required, but is not a reward. Adopting a new technology because it is new is not a reward. Complying with a standard because it is mandated is not a reward. Nevertheless, government EIS acquisition process typically make demonstration of compliance with this or that policy, burn rate, or new technical standard the objective of acquisition oversight activities. (Department of Defense (DoD), 2008) By contrast, successful industrial EIS projects make the focus “how can we minimize the effort and cost of regulatory compliance (e.g. by automating Sarbanes/Oxley reporting); apply better security tools to reduce losses due to cyber attack; and optimize RoI by harvesting the efficiencies enabled by new technologies?” VAF applies industrial best practices for reward-focused, compliance-is-a-boundary-condition, risk-reward optimization to government acquisition artifacts.
EIS Risk-Reward Management
5
As previously stated, the key to success is effectively managing the risks that might prevent achieving objectives with respect to cost, schedule, and performance. According to the Defense Acquisition Risk Management Guide (Department of Defense, 2006):
Risks have three components:
• A future root cause (yet to happen), which, if eliminated or corrected, would prevent a potential consequence from occurring,
• A probability (or likelihood) assessed at the present time of that future
root cause occurring, and
• The consequence (or effect) of that future occurrence.
A future root cause is the most basic reason for the presence of risk.
Traditionally, Program Managers artfully identify future root causes of risks that are both: a) likely to occur, and b) have severely bad consequences if they do occur. The PM’s task is to take actions that reduce both the likelihood of occurrence, and severity of the consequences. For example, consider traditionally defined requirements for Reliability, Availability and Maintainability (RAM) (Department of Defense, 2009 ). If the reliability threshold requirement for a system component is a demanding Mean Time Between Failure (MTBF) of “X” hours, the risk might be that a critical technology solution will not be sufficiently reliable. Risk probability mitigation might include trading more cost-per-capability (or size-per-capability or power-required-per-capability, etc.) in favor of technology solutions with greater demonstrated reliability. Consequence mitigation might include providing ready spares for the critical component so that if a component does fail, Mean Time to Repair (MTTR) will be reduced. Similarly, traditional readiness metrics provide insight into the probability that the system of interest, where “system” typically includes a man/machine mix, will successfully perform its mission. E.g., a military unit that is evaluated as highly “ready” will most likely succeed in the field. Training, testing, and adapting tactics, techniques, and procedures to evolving missions are typical risk mitigation steps. In either case “availability” is a useful concept for expressing the probability of success. Availability, in general, takes the form of (useful units of resource) ÷ (total units of the same resource). A system’s operational availability, i.e. (demonstrated up time) ÷ (total time), is essentially equivalent to the probability that it will work when you need it. A unit’s operational availability, i.e. (human
6
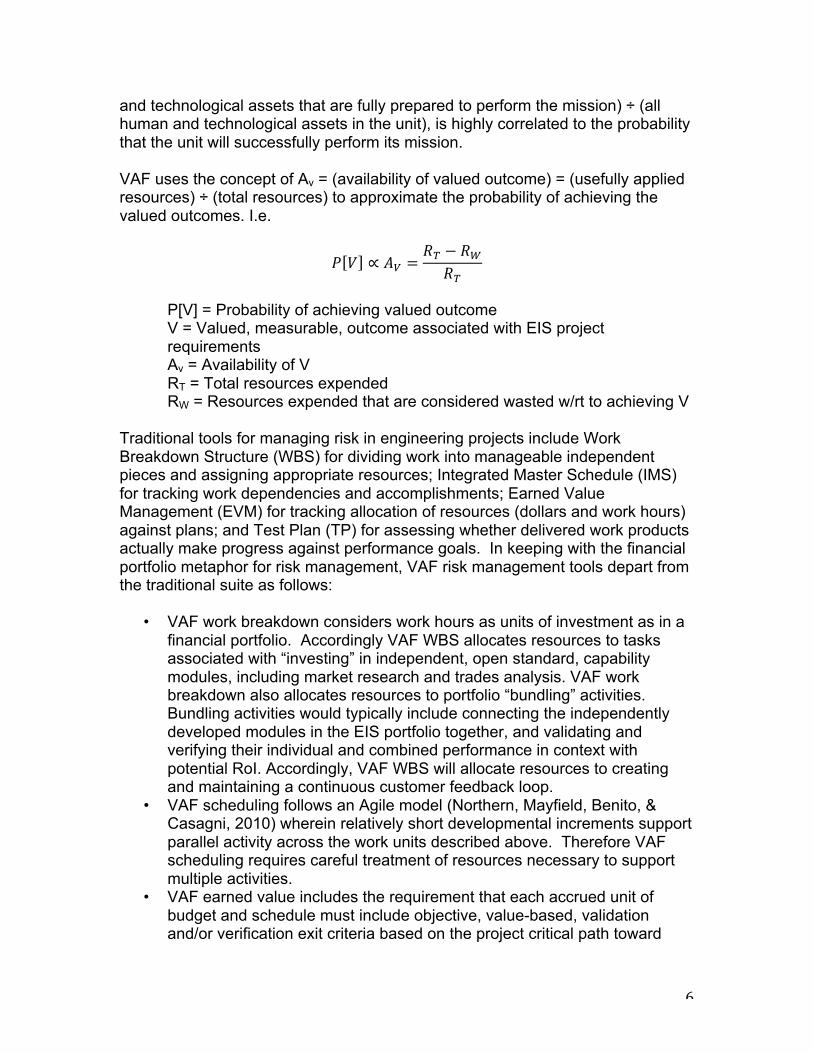
and technological assets that are fully prepared to perform the mission) ÷ (all human and technological assets in the unit), is highly correlated to the probability that the unit will successfully perform its mission. VAF uses the concept of Av = (availability of valued outcome) = (usefully applied resources) ÷ (total resources) to approximate the probability of achieving the valued outcomes. I.e.
𝑃 𝑉 ∝ 𝐴! =𝑅! − 𝑅!𝑅!
P[V] = Probability of achieving valued outcome V = Valued, measurable, outcome associated with EIS project requirements Av = Availability of V RT = Total resources expended RW = Resources expended that are considered wasted w/rt to achieving V
Traditional tools for managing risk in engineering projects include Work Breakdown Structure (WBS) for dividing work into manageable independent pieces and assigning appropriate resources; Integrated Master Schedule (IMS) for tracking work dependencies and accomplishments; Earned Value Management (EVM) for tracking allocation of resources (dollars and work hours) against plans; and Test Plan (TP) for assessing whether delivered work products actually make progress against performance goals. In keeping with the financial portfolio metaphor for risk management, VAF risk management tools depart from the traditional suite as follows:
• VAF work breakdown considers work hours as units of investment as in a financial portfolio. Accordingly VAF WBS allocates resources to tasks associated with “investing” in independent, open standard, capability modules, including market research and trades analysis. VAF work breakdown also allocates resources to portfolio “bundling” activities. Bundling activities would typically include connecting the independently developed modules in the EIS portfolio together, and validating and verifying their individual and combined performance in context with potential RoI. Accordingly, VAF WBS will allocate resources to creating and maintaining a continuous customer feedback loop.
• VAF scheduling follows an Agile model (Northern, Mayfield, Benito, & Casagni, 2010) wherein relatively short developmental increments support parallel activity across the work units described above. Therefore VAF scheduling requires careful treatment of resources necessary to support multiple activities.
• VAF earned value includes the requirement that each accrued unit of budget and schedule must include objective, value-based, validation and/or verification exit criteria based on the project critical path toward
7
RoI. In particular, dependencies across project work units must be thus identified, and required interoperability and/or cross-functionality validated and verified.
• VAF test plans validate and verify incremental accrual of objectively defined value throughout the EIS lifecycle. Accordingly, VAF test plans are tightly coupled to work break down, scheduling, and earned value as described above. VAF testing either measures or models the mathematical correlation between EIS system-level and process-level leading metrics, with the corresponding operational-level lagging measures of RoI.
Traditionally risk management strategy assumes that the project contract deliverables represent value, and that this value is constant (DoD , 2006). Consequently, having made a plan to deliver a static assumed value, the PM traditionally addresses risk and risk mitigation without further consideration of the relevance of risk to the anticipated reward
In contrast to the traditional approach, VAF assumes that Value (V) is a volatile variable as it is in a financial portfolio. Indeed, Value depends on the Utility returned per-delivered-capability, and monetary Cost-expended-per-delivered capability (c). Utility is a measure of the degree to which the fielded IT satisfies rapidly evolving requirements. The variable c is highly dependent on the calendar time (t) it takes to deliver value. Therefore, V, t, c, and u are all variables that are dependent on each other. E.g.
• The state of the art of IT evolves rapidly over time, according more or less to Moore’s Law
• Requirements for EIS utility evolve according to, and at nearly the same pace as, the evolving IT
• The value of EIS capability depends on its ability to satisfy requirements, i.e. provide utility, at acceptable cost, and in time to make a difference.
• The value of any particular IT solution decreases rapidly with time • Cost variability is highly correlated to the man-hours it takes to invent or
discover, and assemble EIS components, as well as the time the components in question have been on the market.
Accordingly, VAF suggests carefully tracking the co-evolution of risk and reward, and their mutual dependency, throughout the life of the project. The approach should be analogous to the way financial managers manage risk and reward potential in investment portfolios. Specifically, VAF:
• Parametrically models targeted value, i.e. “reward”, as in terms of
variables that are highly dependent on Time and Cost and evolving requirements for Utility
• Parametrically models critical risks in terms of variables that are highly dependent on Time and Cost and evolving requirements for Utility
8
• Models risk/reward “value factors” associated with EIS project people, processes, and technology in terms of both likelihood and consequence of occurrence
• Mathematically optimizes risk and reward as co-dependent variables
Modeling EIS “Reward”, i.e. Value Returned
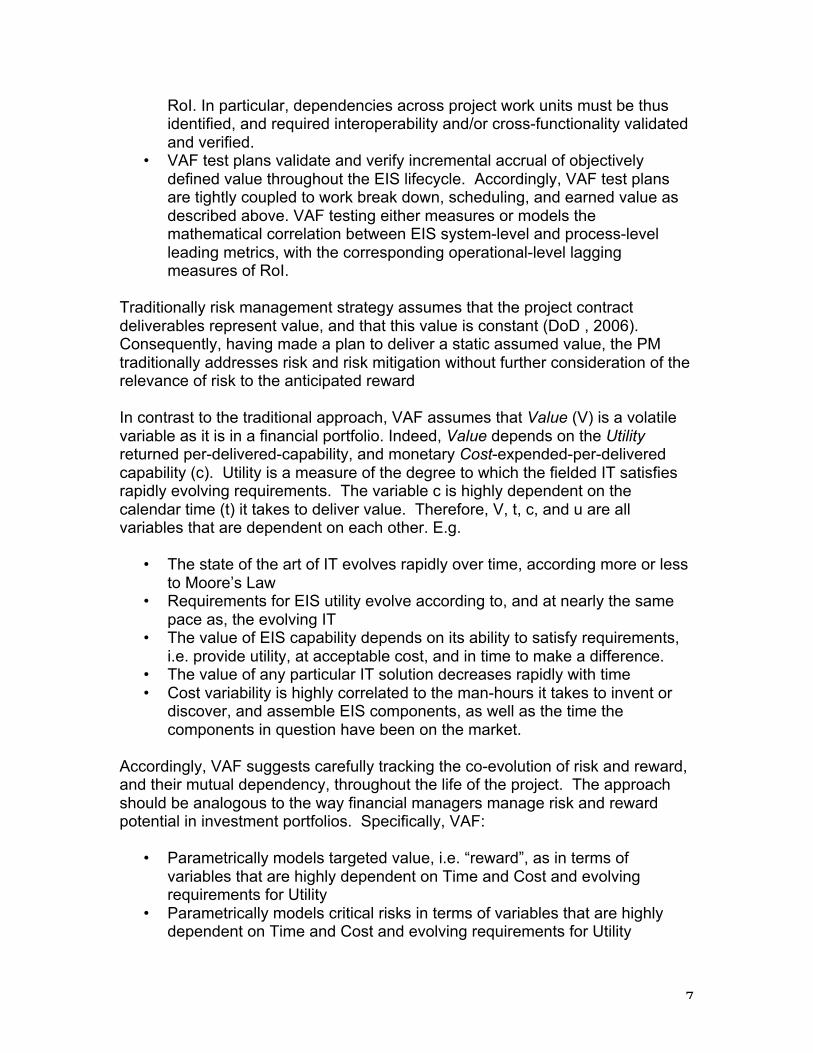
Generally, then, VAF equates RoI to operational utility delivered, per lifecycle monetary cost of the utility, per time increment required to turn a monetary investment into utility. In the sense of risk vs. reward, “reward” is equivalent to the ROI earned via developing an increment of EIS capability.
RoI = V u, c, t = u t × (c t )!! × t!!!
RoI = Return on Investment V(u,c,t) = Value of an EIS, or component(s) thereof, as a function of u, c, and t u(t) = Utility of an EIS, or component(s) thereof, as a function of time c(t) = Monetary lifecycle cost of an EIS, or component(s) thereof, as a function of time td = Time it takes to design, develop, test, certify, and deploy an increment of capability to an EIS
Because utility is equivalent to the degree to which a capability satisfies requirements, we can measure and model u in terms of the same measures that are used to measure requirements satisfaction. VAF defines measures of effectiveness (ME) as lagging indicators, i.e. objective parameters that describe operational effectiveness. For government EIS, ME typically defines RoI. VAF defines measures of performance (MP), as leading indicators, i.e. objective parameters that describe important attributes of system or process efficiency that are only important if they lead demonstrably to greater RoI. Typical ME for EIS include:
• Probabilities of achieving desired outcomes (e.g. probability of detection) • Time required for completing tasks (e.g. planning cycle time) • Numbers of good or bad things that happen (e.g. number of training days
complete) • Proficiency scores (e.g. training evolution grade)
Typical MP for EIS include:
• Latencies (e.g. message latency) • Reliability, Availability, and Maintainability (RAM) (e.g. operational
availability)
9
• Standard compliance (e.g. software version, security protection level, etc.) • Capacity (e.g. data storage) • Precision (e.g. camera resolution) • Size weight and power
Note that the distinction between ME an MP can in some cases depend on where the systems boundaries are drawn. The ME for an upstream EIS might be an MP for a downstream EIS. For example Probability of Detection might be an ME for an upstream surveillance subsystem, but an MP for a downstream targeting subsystem, the ME of which is Probability of Interdiction. VAF suggests identifying risk-reward optimization factors, (RX), i.e. an ability to achieve critical system-level, or process-level, performance characteristics X. Each RX (pun intended!) should have at least one corresponding MP and/or ME. Ability depends on taking positive actions aligned with desired ability. Examples of typical RX follow:
RO = Ability to continuously capture evolving the operational customers’ perception of value within rapidly evolving operational domains (e.g. by designating specific operational “beta users” and establishing continuous feedback loop. An MP might be “customer contact hours.”) RT = Ability to continuously harvest technological value in rapidly evolving technological domains (e.g. by applying best commercial practices for open standard product line architecture, and conducting test and certification in parallel to development. An MP might be “time required to configure component in the EIS stack.”) R$ = Ability to predict lifecycle costs for continuously evolving capability (e.g. by heavily leveraging existing off-the-shelf technologies that come with well established life cycle tech refresh cost models. MP might be “lifecycle costs are known and are less than ‘X’.”) RIA = Ability to balance the need-to-protect information and EIS network resources with the need-to-share them across security domains (e.g. by working with customers to define need-to-share and need-to-protect policies and implementing them with high assurance virtual technology. An MP/E might be “run time demonstration of dynamic-policy-based PL4-equivalent need-to-share decision execution.”) RVI = Ability to find and deliver valued information bits within tightly constrained decision windows, given large and growing backdrop of available information bits (e.g. by working with customers to identify
10
critical conditions of interest and associated threshold values and implementing automated “smart push” alerts. MP/E might be “run time demonstration of decision cycle time compression against use case of interest.”) RPS = Availability of professional skills required for rapid evolutionary development (e.g. by performing careful due diligence of vendors prior performance against similar open standard EIS projects. MP might be “documented success in prior performance on similar open system project.”) Retc = Various others
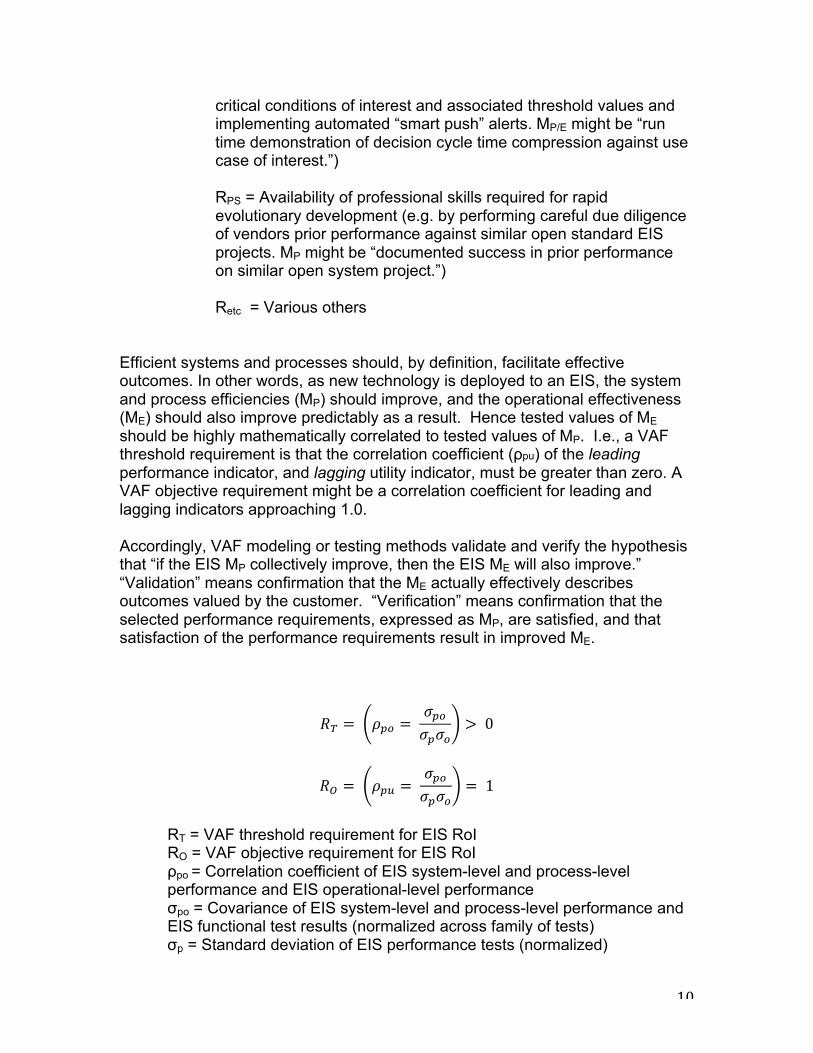
Efficient systems and processes should, by definition, facilitate effective outcomes. In other words, as new technology is deployed to an EIS, the system and process efficiencies (MP) should improve, and the operational effectiveness (ME) should also improve predictably as a result. Hence tested values of ME should be highly mathematically correlated to tested values of MP. I.e., a VAF threshold requirement is that the correlation coefficient (ρpu) of the leading performance indicator, and lagging utility indicator, must be greater than zero. A VAF objective requirement might be a correlation coefficient for leading and lagging indicators approaching 1.0. Accordingly, VAF modeling or testing methods validate and verify the hypothesis that “if the EIS MP collectively improve, then the EIS ME will also improve.” “Validation” means confirmation that the ME actually effectively describes outcomes valued by the customer. “Verification” means confirmation that the selected performance requirements, expressed as MP, are satisfied, and that satisfaction of the performance requirements result in improved ME.
𝑅! = 𝜌!" = 𝜎!"𝜎!𝜎!
> 0
𝑅! = 𝜌!" = 𝜎!"𝜎!𝜎!
= 1
RT = VAF threshold requirement for EIS RoI RO = VAF objective requirement for EIS RoI ρpo = Correlation coefficient of EIS system-level and process-level performance and EIS operational-level performance σpo = Covariance of EIS system-level and process-level performance and EIS functional test results (normalized across family of tests) σp = Standard deviation of EIS performance tests (normalized)
11
σo = Standard deviation of EIS operational tests (normalized)
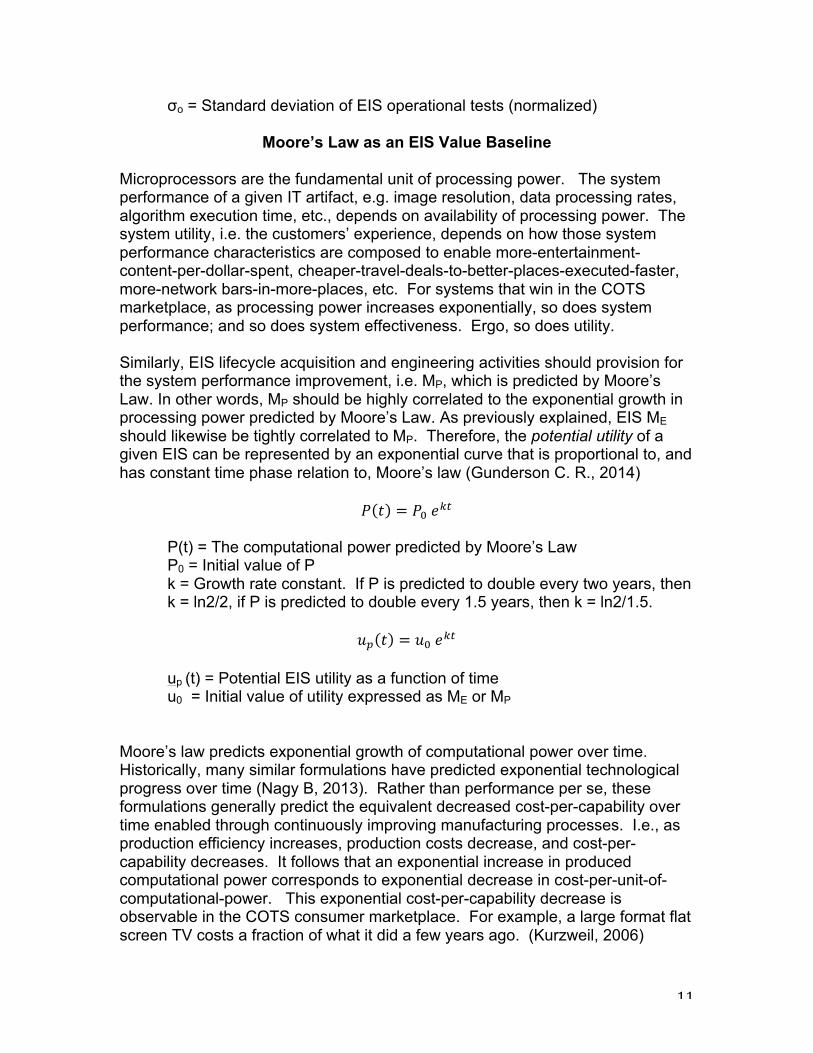
Moore’s Law as an EIS Value Baseline Microprocessors are the fundamental unit of processing power. The system performance of a given IT artifact, e.g. image resolution, data processing rates, algorithm execution time, etc., depends on availability of processing power. The system utility, i.e. the customers’ experience, depends on how those system performance characteristics are composed to enable more-entertainment-content-per-dollar-spent, cheaper-travel-deals-to-better-places-executed-faster, more-network bars-in-more-places, etc. For systems that win in the COTS marketplace, as processing power increases exponentially, so does system performance; and so does system effectiveness. Ergo, so does utility. Similarly, EIS lifecycle acquisition and engineering activities should provision for the system performance improvement, i.e. MP, which is predicted by Moore’s Law. In other words, MP should be highly correlated to the exponential growth in processing power predicted by Moore’s Law. As previously explained, EIS ME should likewise be tightly correlated to MP. Therefore, the potential utility of a given EIS can be represented by an exponential curve that is proportional to, and has constant time phase relation to, Moore’s law (Gunderson C. R., 2014)
𝑃 𝑡 = 𝑃! 𝑒!"
P(t) = The computational power predicted by Moore’s Law P0 = Initial value of P k = Growth rate constant. If P is predicted to double every two years, then k = ln2/2, if P is predicted to double every 1.5 years, then k = ln2/1.5.
𝑢! 𝑡 = 𝑢! 𝑒!"
up (t) = Potential EIS utility as a function of time u0 = Initial value of utility expressed as ME or MP
Moore’s law predicts exponential growth of computational power over time. Historically, many similar formulations have predicted exponential technological progress over time (Nagy B, 2013). Rather than performance per se, these formulations generally predict the equivalent decreased cost-per-capability over time enabled through continuously improving manufacturing processes. I.e., as production efficiency increases, production costs decrease, and cost-per-capability decreases. It follows that an exponential increase in produced computational power corresponds to exponential decrease in cost-per-unit-of-computational-power. This exponential cost-per-capability decrease is observable in the COTS consumer marketplace. For example, a large format flat screen TV costs a fraction of what it did a few years ago. (Kurzweil, 2006)

12
As the cost-per-capability decreases, the capability-per-cost increases. Therefore, a constant outlay for IT across any given time period should return exponentially improving capability over that period. The VAF value model includes this tight coupling between u and c by treating the utility to cost ratio, u/c, as a single exponentially increasing function, or the cost-to-utility ratio (c/u) as an exponentially decreasing function, with respect to time. That is, as raw computing power increases exponentially, delivered information value should likewise increase exponentially. At the same time, cost-per-unit-of-capability should decrease exponentially. (See figure 1.) Moore’s Law and the other models of exponential manufacturing process improvement are not only based on physics. They are self-sustained by the competitive forces around satisfying customer expectations. Customers demand that the exponential improvement on which they depend will continue. (Schaller, 1997) Fred Brooks, in his famous “No Silver Bullet” essay (Brooks, 1986) explained why software productivity, unlike IT hardware productivity does not follow Moore’s law. Essentially, he explains that very complex nature of software, contrasted with the simplicity of the digital transistor, precludes exponential improvement. Nevertheless, VAF suggests that EIS PMs can harness that self-sustaining competitive force just as well as savvy business managers in other sectors have done by hedging against, rather than controlling, risks associated with software complexity. They can do that hedging by applying various risk-reward optimization practices. Arguably, Brooks suggested the same thing when he discussed the various promising software paradigms that cumulatively might help the software engineering discipline improve going forward. However to achieve assured exponential improvement, EIS PMs must make harvesting potentially exponential RoI their prime directive. This is exactly what chip manufacturers do to stay on the Moore’s Law power curve; and what auto manufactures do to deliver each years new model on schedule.
Recall
RoI = V u, c, t = u t × (c t )!! × t!!! Assuming u and c are tightly coupled via Moore’s Law as explained above, then:
u t × (c(t))!! = 𝑢𝑐 (𝑡)
And:
𝑅! = 𝜌 !! ,!!!
!" > 0.00 𝑅! = 𝜌 !
! ,!!!!" → 1.00
13
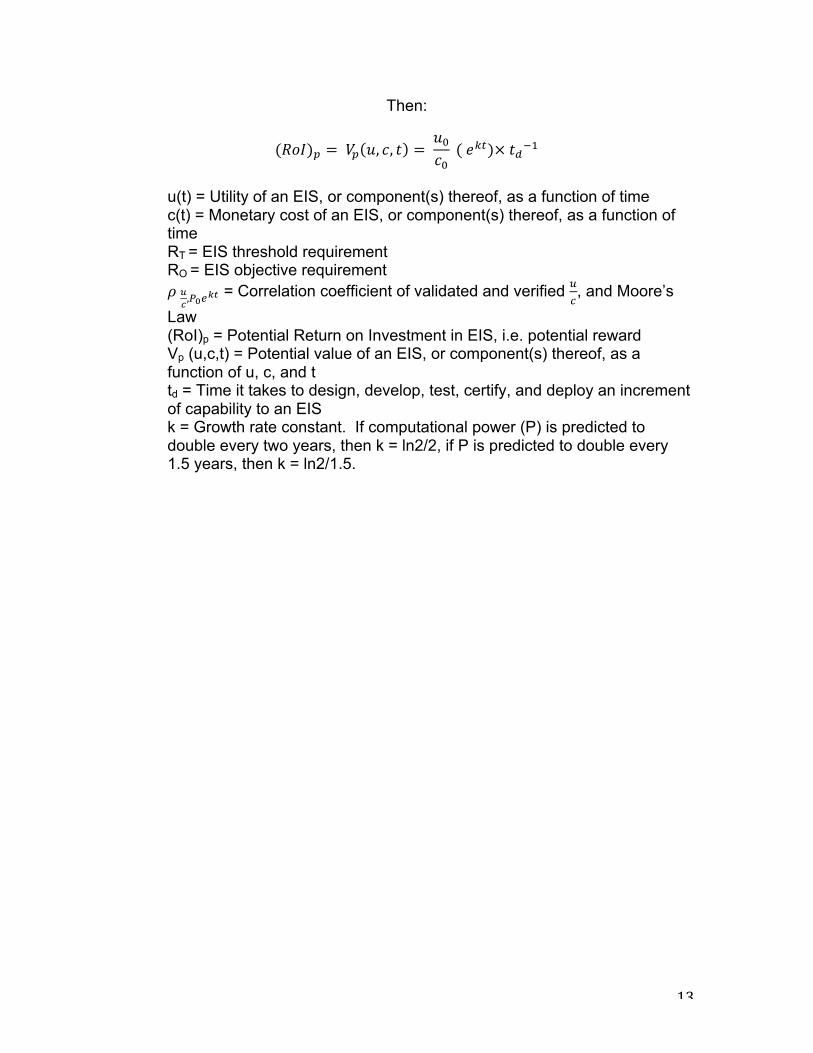
Then:
(𝑅𝑜𝐼)! = 𝑉! 𝑢, 𝑐, 𝑡 = 𝑢!𝑐! ( 𝑒!")× 𝑡!!!
u(t) = Utility of an EIS, or component(s) thereof, as a function of time c(t) = Monetary cost of an EIS, or component(s) thereof, as a function of time RT = EIS threshold requirement RO = EIS objective requirement 𝜌 !
! ,!!!!" = Correlation coefficient of validated and verified !
!, and Moore’s
Law (RoI)p = Potential Return on Investment in EIS, i.e. potential reward Vp (u,c,t) = Potential value of an EIS, or component(s) thereof, as a function of u, c, and t td = Time it takes to design, develop, test, certify, and deploy an increment of capability to an EIS k = Growth rate constant. If computational power (P) is predicted to double every two years, then k = ln2/2, if P is predicted to double every 1.5 years, then k = ln2/1.5.

14
Figure 1: VAF forces utility-‐per-‐cost to improve in step with Moore’s Law by tightly coupling software and hardware performance metrics with customer-‐centric utility metrics. That is, EIS PMs must harness the predicable, quantum (inverted “bathtub”), performance improvement associated with each generation of new hardware, and the nearly continuous improvement (saw tooth) associated with software evolution by assuring h/w and s/w applications focus narrowly on the things customers care about and can measure. This approach is consistent with the way COTS information service and device providers stay on top of the market.
Modeling Reward Probability The fundamental “objective” requirement for any EIS engineering and acquisition project is to achieve the maximum possible RoI, i.e. Vp, by efficiently harvesting exponentially improving products and services from the IT marketplace. PMs should design threshold requirements for particular EIS projects according to acceptable departures from the carefully determined potential RoI. Establishing appropriate threshold and objective requirements for u/c demands carefully scaling and base lining the current value of u/c in enterprise terms that are appropriate for predicable, exponential improvement over the period of interest. For example, in a particular surveillance system, u might be defined as Probability of Detection locally as follows:

15
𝑢 = (𝑃!)! = (𝑇! − 𝑇!)!(𝑇!)!
u = utility (PD)L = Probability of Detecting the target of interest within a local area under surveillance by an information system of interest. (T+ - T-)L = Difference between number of correct target identifications (T+) and incorrect target identifications (T-) within a local period/area of interest, L (TT)L = Total number of targets of interest that traversed the local period/area of interest, L
In this case, the baseline evaluation of u will likely be relatively high. That is the local surveillance system might correctly detect most of the targets that traverse its very limited field of view. In this case, (PD)L will not lend itself to predicable exponential growth. On the other hand, the international law and enforcement counter trafficking enterprise might define u as Probability of Detection as follows:
𝑢 = (𝑃!)! = (𝑇! − 𝑇!)!(𝑇!)!
u = utility (PD)E = Probability of Detecting the target of interest anywhere within the enterprise area/time of interest via information system of systems (T+ - T-)E = Difference between number of correct target identifications (T+) and incorrect target identifications (T-) anywhere within the enterprise area/time of interest, E. (TT)L = Total number of targets of interest that traversed the enterprise period/area of interest, E
In this case, the baseline value of u/c is very small. After all, the enterprise area of interest is the entire world and the number of successfully detected illicit transactions miniscule. However, as the efficiency and effectiveness of the information system of systems improves - i.e. more, better, cheaper, more interoperable sensors and processors are deployed in more places by more partners - then improvement in u/c can be reasonably expected to achieve exponential growth.
VAF Calculation of Probability of Success Traditional program management doctrine categorizes and manages risks in terms of impact to cost, schedule, and performance. Traditionally, risks are identified in terms of their probability to occur, and the potential bad consequence of their occurrence. Likewise, VAF categorizes reward in terms of potential good

16
consequences, and the probability of their occurrence. In general, the probability of achieving the threshold requirement for RoI is equal to the product of the probabilities of achieving threshold requirements for cost, performance, and schedule.
𝑃 [𝑉!] = 𝑃[𝑐!]×𝑃[𝑢!]×𝑃[𝑠!]
Figure 2: Optimizing RoI depends on modeling and/or measuring co-‐dependence and evolution of risk and reward
VAF defines “cost” as monetary lifecycle costs for developing, testing, evaluating, certifying, deploying, maintaining, and upgrading an EIS or component(s) thereof. According to VAF, the probability of achieving threshold targets for cost depend on optimizing the combination of, for example: up front costs including initial
P[Vt] = Probability of achieving threshold level of valued outcome, i.e. RoI. P[ct] = Probability of satisfying threshold level of monetary budget requirements. P[ut] = Probability of achieving threshold level of utility requirements. P[st] = Probability of achieving threshold level of schedule requirements.

17
purchase and any required infrastructure investments; projected upgrade and maintenance costs; and the anticipated lifetime of the EIS. E.g.:
𝑃 𝑐! ∝ (𝐴!" = 𝐶! − 𝜎!"
𝐶! )
𝜎!"= (𝑐! − 𝑐!) !"#$%&'
!"#$%&'$"&%
! + (𝑐! − 𝑐!) !"#"$%&'"()*$!"#$ !"# !"#$ !"#$#
! + (𝑐! − 𝑐!) !"#$%&$"$'& !"# !"#$%&' !"#$#
!
P[ct] = Probability of achieving threshold requirement for cost (𝐴!" =
!!! !!"!!
) = Availability of cost efficiency Ce = Previously estimated total EIS lifecycle costs including upfront costs for infrastructure and initial purchases, engineering costs, and lifecycle upgrade and maintenance costs. 𝜎ce = Root mean square error of actual lifecycle costs vs. estimated costs ca = Actual costs for the )indicated activity ce = Previously estimated costs for the )indicated activity
In the VAF lexicon, “effectiveness” and/or “performance” are equivalent to utility. VAF suggests that the probability of achieving the targeted level of utility/performance/effectiveness depends on the quality of requirements, scope of the potential solution space, efficiency of the Analysis of Alternatives (AoA), efficiency of the capability integration platform, and the quality of Test and Evaluation (T&E.) Achieving sufficient quality of requirements demands a process that provides objective feedback from the operational customer community several times during any particular developmental cycle. Achieving sufficient scope of solution set demands a process that socializes the EIS project use cases broadly across the landscape of innovative industry. Achieving efficiency of AoA requires an automated process, objective measures, and incentives to allow and encourage solution providers to self-demonstrate the Vp of their offerings. Achieving efficiency in the integration platform requires well-defined architectural functions and open standard interfaces. Achieving quality of T&E requires test-based designs, persistent test frameworks, and iterative testing throughout project execution. To maximize the probability of satisfying EIS threshold performance/effectiveness requirements, the project work breakdown should scrupulously allocate the proper relative proportions of billable time spent: processing operational customers feedback; evaluating evolving capabilities in the market; carefully rationing any time spent developing immature technologies; and testing; etc. The project manager should adjust this schedule optimization model at each successive developmental cycle. Assuming that process is ongoing, PMs can model the probability of satisfying threshold levels of
18
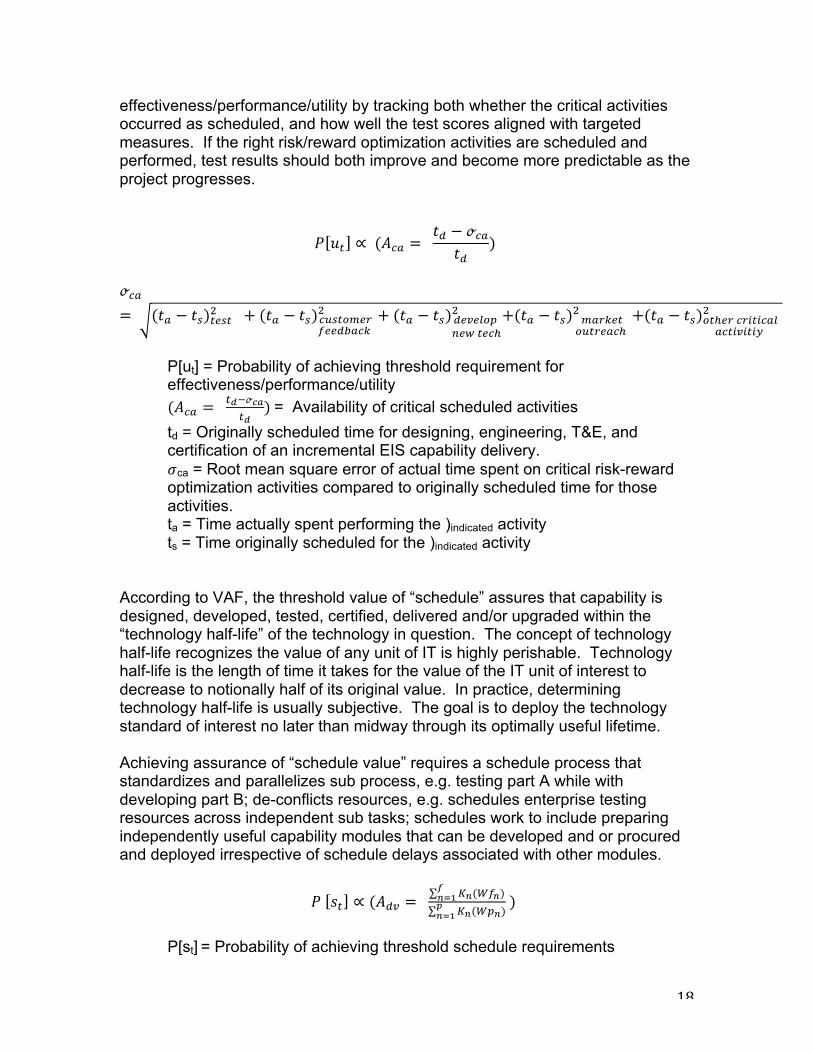
effectiveness/performance/utility by tracking both whether the critical activities occurred as scheduled, and how well the test scores aligned with targeted measures. If the right risk/reward optimization activities are scheduled and performed, test results should both improve and become more predictable as the project progresses.
𝑃 𝑢! ∝ (𝐴!" = 𝑡! − ℴ!"𝑡!
)
ℴ!"= (𝑡! − 𝑡!)!"#! ! + (𝑡! − 𝑡!)!"#$%&'(
!""#$%&'
! + (𝑡! − 𝑡!)!"#"$%& !"# !"#!
! +(𝑡! − 𝑡!) !"#$%& !"#$%&'!
! +(𝑡! − 𝑡!)!"!!" !"#$#!%& !"#$%$#$&
!
P[ut] = Probability of achieving threshold requirement for effectiveness/performance/utility (𝐴!" =
!!!ℴ!"!!
) = Availability of critical scheduled activities td = Originally scheduled time for designing, engineering, T&E, and certification of an incremental EIS capability delivery. 𝜎ca = Root mean square error of actual time spent on critical risk-reward optimization activities compared to originally scheduled time for those activities. ta = Time actually spent performing the )indicated activity ts = Time originally scheduled for the )indicated activity
According to VAF, the threshold value of “schedule” assures that capability is designed, developed, tested, certified, delivered and/or upgraded within the “technology half-life” of the technology in question. The concept of technology half-life recognizes the value of any unit of IT is highly perishable. Technology half-life is the length of time it takes for the value of the IT unit of interest to decrease to notionally half of its original value. In practice, determining technology half-life is usually subjective. The goal is to deploy the technology standard of interest no later than midway through its optimally useful lifetime. Achieving assurance of “schedule value” requires a schedule process that standardizes and parallelizes sub process, e.g. testing part A while with developing part B; de-conflicts resources, e.g. schedules enterprise testing resources across independent sub tasks; schedules work to include preparing independently useful capability modules that can be developed and or procured and deployed irrespective of schedule delays associated with other modules.
𝑃 𝑠! ∝ (𝐴!" = !!(!"!)
!!!!
!!(!"!)!!!!
)
P[st] = Probability of achieving threshold schedule requirements
19
Adv = Availability of developed value. I.e. weighted sum of completed work units divided by weighted sum of scheduled work units. Wfn = Successfully completed work unit. Scope of any designated work unit must include objective V&V of that unit as part of its completion criteria. Thus a completed work unit is equivalent to accruing actual measured, or robustly modeled, value. Wfn = Scheduled work unit. Kn = Weighting factor. Weighting should take into account a clear delineation of how any work unit relates to project critical path. n = Counting index f = Number of successfully completed and tested scheduled work units. p = Number of scheduled work units.
In traditional program management risk mitigation strategies, risks are often posed in the form of a conditional statement that includes a hypothesis and a conclusion. Note that in the VAF construct, risk and reward conditional statements are often deliberately contrapositives of each other or nearly so, e.g.:
If: Positive action is taken; Then: positive RoI is likely to occur If: Positive action is not taken; Then: positive RoI is not likely to occur
In these cases the same actions serve to maximize the probability and positive impact of reward, and minimize the probability and negative impact of risk. For example, establishing a feedback loop with operational customers maximizes the probability that the EIS capability will provide the targeted value. It also minimizes the risk that the EIS requirements will evolve faster than the EIS capability can be delivered. (See figure 2.) However, in some cases risks are orthogonal to rewards. The risk that bad weather will impact the cost, schedule, and performance associated with for operational testing is orthogonal to how well the operational test incorporates feedback from the customer. In these cases, VAF simply adds the orthogonal risks and risk mitigation strategies to the overall risk-reward rubric.
Works Cited Bloch M, B. S. (2012). Delivering large-‐scale IT projects on time, on budget, and on value. McKinsey & Company, Business Technology Office. McKinsey & Company. Brooks, F. (1995). No Silver Bullet Refined. In F. Brooks, The Mythical Man Month. United States: Addison Wesley. Brooks, F. P. (1986). No Silver Bullet. Information Processsing 1986, the Proceedings of the Tenth World Computing Conference (pp. 1069-‐1076). Amsterdam, The Netherlands: Elsevier Science B.V. Defense Science Board. (2009). DoD Policy and Procedures for the Acquisition of Information Technology. Washington DC: OUSD AT&L.
20
Department of Defense (DoD). (2008, December 15). DoD Instruction 5000.02: The Defense Acquisition System. 47. Washington, DC: USD AT&L. Department of Defense. (2009 ). Department of Defense Reliability, Availability, and Maintainability and Cost Rationale Report Manual. Washington DC: Office of the Secretary of Defense. Department of Defense. (2006). Risk Management Guide for DoD Acquisition (Sixth Edition). Washington DC : DoD. DoD . (2006). Earned Value Management Implementation Guide . DCMA. Washington DC: DoD. GAO. (2014). Major Automated Information Systems: Selected Defense Programs Need to Implement Key Acquisition Practies. Washington DC: GAO. Gunderson, C. R. (2014). Enterprise Information System Value Model. TBD . Washington , DC: TBD. Gunderson, C. R. (2014). Sustainment and Net-‐ready Key Performance Parameters (KPP) in an Enterprise Information System (EIS) Value Assurance Framework (VAF). Naval Postgraduate School, Information Science. Monterey, CA: NPS. Gunderson, C. R., & Minton, D. (2009). CWID 08 Demonstrates Rapid Evolutionary Acquisition Model of Coalition C2. 2009 AFCEA GMU Critical Issues in C4I Symposium. Fairfax VA: George Mason University. Hokins, R., & Jenkins, K. (2008). Eating the IT Elephant: Moving from Greenfield to Brownfield Development. IBM Press. Kurzweil, R. (2006). The Singularity is Near. London, England, UK: Penguin Books. Nagy B, F. J. (2013). Statistical Basis of Predicting Technological Progress. (N. U. Lis A. Nunes Amaral, Ed.) PLOS One (2). Northern, C., Mayfield, K., Benito, R., & Casagni, M. (2010). Handbook for Implementing Agile in Department of Defense Information Technology Acquisition. MITRE. The Mitre Corporation . Schaller, B. (1997). Moore's Law: The Benchmark of Progress in Semiconductor Electronics. IEEE Spectrum , 34 (6), 53-‐59. Weatherall, J. (2014). The Physics of Wall Street: A Brief History of Predicting the Unpredicable. New York, New York, USA: First Mariner Books.