entegris annual report 2006
TRANSCRIPT

ENTEGRIS ANNUAL REPORT 2006
57543_BC-FC.qxp 3/23/07 4:24 PM Page 2

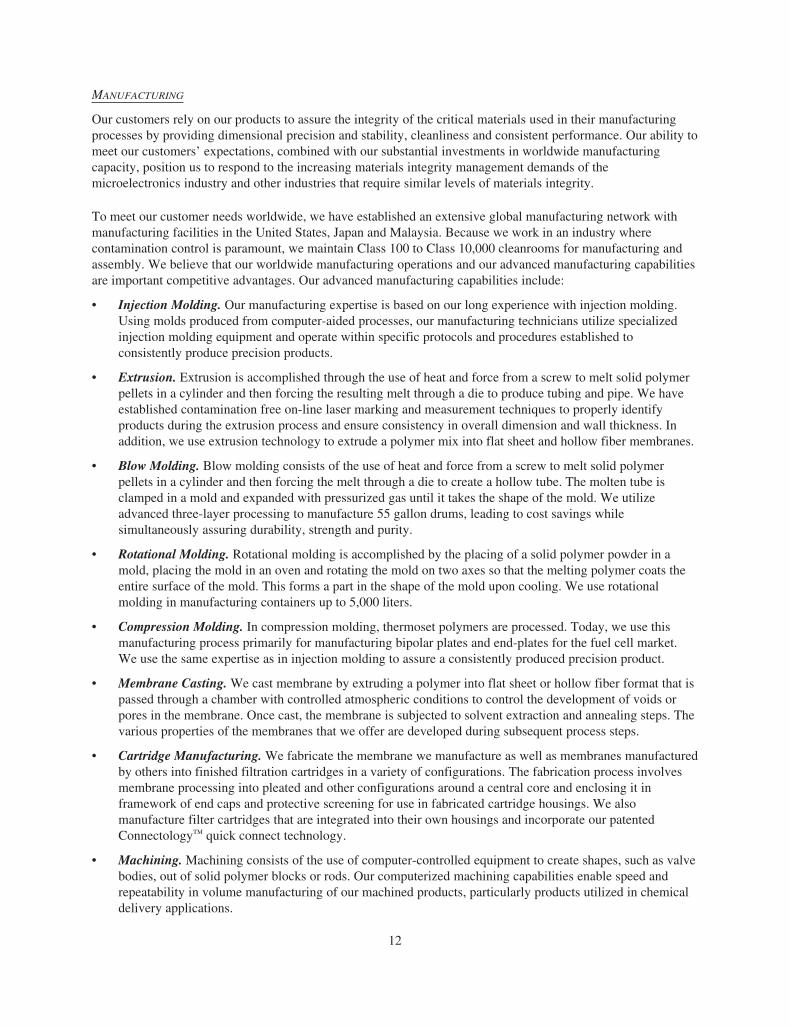
North America
29%
Europe
16%Japan
22%
Asia
33%
ABOUT ENTEGRIS
As a leader in materials integrity management, Entegris helps enable advanced technology
products that positively affect the lives of billions of people around the world. Entegris’ products
and systems are used to purify, protect and transport critical materials used in the semiconductor
and microelectronics manufacturing processes, and in doing so help increase productivity and
enhance yields. These products include: wafer carriers and shippers that protect the semiconductor
wafer from contamination and breakage; filtration products that purify process gases and liquids,
as well as the ambient environment; liquid systems, components and containers that dispense,
control or transport process fluids; and shippers and trays for protecting and transporting devices
and disk drive components. Entegris primarily sells direct, and its customer base includes virtually
every maker of semiconductor devices, wafers and semiconductor fabrication equipment, as well
as manufacturers of electronics such as disk drive components and flat panel displays.
WHAT IS MATERIALS INTEGRITY MANAGEMENT?
Materials integrity management is the process of purifying, protecting and transporting critical
materials as they go through manufacturing and become high-technology products. Entegris
delivers these critical materials as pure or purer than when manufactured.
SOLVING THE CONTAMINATION CHALLENGES
THAT ENABLE THE NEXT GENERATION OF ELECTRONICS
As the semiconductor industry moves down the technology roadmap to produce smaller and more
powerful devices, the need for Entegris’ materials integrity management products and services
increases. Whether it is the lithography, wet etch and clean, or CMP process, contamination
issues at the 65 nanometer and 45 nanometer technology generations are becoming more
difficult to solve than ever before, and have a greater impact on semiconductor production yields.
Today, contamination is measured and controlled on a molecular and nano level. To help enable
tomorrow’s electronics, Entegris is on the forefront of providing comprehensive microcontam-
ination control solutions to the semiconductor and microelectronics industries in North America,
Europe, Asia and Japan.
FISCAL 2006 SALES BY REGION
Sales from Continuing Operations: $678.7 million
57543_IFC-IBC.qxp 3/23/07 4:19 PM Page 1

A LETTER TO OUR SHAREHOLDERS
This was the first full year of the new, combined Entegrisoperating as one company, following the 2005 merger ofMykrolis and Entegris. The integration process was demand-ing, yet ultimately successful. As a team, we integrated bothpredecessor companies on time, on budget and in a way thatenabled our customers to continue operating with the knowl-edge that their tools, fabs and processes would be supportedby dedicated and well-trained professionals. We also exceededour initial estimates of annual integration savings, to morethan $20 million.
All in all, 2006 was a good year for Entegris. Sales from con-tinuing operations increased 15 percent from the prior yearon a comparable, pro forma basis. Reflecting cost controls and the impact from the integration savings, modified SG&Aexpenses as a percentage of revenue declined in each quarterof 2006 – from 26.2 percent in the first quarter to 21.7 percentin the fourth. Operating income, excluding amortization andintegration costs, was $111.2 million, or 16.3 percent of sales.Entegris also generated operating cash flow of nearly $100million during 2006, all of which was applied to an acceler-ated $100 million stock repurchase program.
We also continued to make strategic investments in new prod-uct and technology development – spending $39 million forthat purpose in 2006. By year-end, we had begun to see thefruits of this investment. Most exciting are the new products –such as our LiquidLensTM ultrapure water systems for use in immersion lithography and, more recently, our ClariliteCertified products, services and systems for controlling reticlehaze – that are providing critical contamination control solu-tions for our global customers. Our suite of Clarilite solutions,in particular, leverages the combined strengths gained fromthe merger.
No other company in the world is as focused on contamina-tion control in semiconductor and advanced electronicsproduction environments as Entegris. Moreover, many moreproducts are in development and will fuel our future growthas they are introduced into the market in 2007 and beyond.
During the first half of 2006, we successfully met the pressingdemands of integration, a buoyant semiconductor equipmentmarket and the need to get closer to our customers, while alsoreducing costs by shifting some production and infrastructureto Asia. Along with this success came some challenges. Certainmanufacturing inefficiencies impacted our margins in thethird and fourth quarters. Through our proactive efforts, however, we identified and addressed these inefficiencies,strengthened our operational processes and organization and entered 2007 with increased strength and confidence.
ALIGNING OUR INTERESTS
In the current business environment there is intense focus on management compensation. Consequently, I believe it isimportant to summarize how the senior leadership team atEntegris will be compensated for 2007. Our short-term variablecompensation is heavily based on two factors – the company’sprofits as a percentage of revenue and our relative revenuegrowth as measured against that of twenty peer and customercompanies. Our long-term compensation is heavily dependenton return on invested capital. In short, how well we performfor you, our shareholders, is directly tied to how we’re compen-sated – which further aligns our interests and yours.
The semiconductor and electronics industry environment in which we operate is one of the most scrutinized on theplanet. Ratios, margins and capacity utilization are analyzedand reanalyzed as portents of changes in industry momentum.At Entegris, we harbor no illusions about our ability to impactthese macro-industry factors. At the same time, it is apparentto us that – due to a variety of possi-ble factors, from consolidation in theequipment and device-making indus-try to the increasing role of globalfoundries – demand fluctuation overthe recent past has exhibited some-what muted cycles compared toearlier periods. As a company, we areconvinced of the following simple fact:the value of our company is bestexpressed as the present value offuture cash flows. With this comes acommitment to maximizing our returnon invested capital as well as growth.
GOALS FOR 2007
This brief letter is accompanied by others from incoming chieffinancial officer Greg Graves, chief operating officer Jean-Marc Pandraud and chief administrative officer Bertrand Loy.Together, they will highlight the 2006 financial and opera-tional aspects of Entegris and their goals for 2007.
These goals revolve around three pillars – Teamwork,Execution and Strategy – and can be summarized as follows:
• Achieve our target revenue from new products and furtherstreamline our new product development process
• Leverage our manufacturing operations and increase efficiencies
• Move even closer to our customers in both technology andphysical proximity
• Utilize our financial position to increase shareholder returns
• Continue to nurture and develop our talent
With 2007 already well under way, I am pleased with the startwe have made toward achieving these goals and look forwardto reporting to you on our progress next year.
I’d like to close this letter with special thanks to the nearly3,000 Entegris employees. We as a company are the sum of the capabilities, focus, energy and drive of many dedicatedpeople around the world. We also owe thanks to our cus-tomers around the world for relying on us to solve theirmicrocontamination control needs. Finally, we’d like to thank you, our shareholders, for your ongoing interest and support. We look forward to continuing to deliver value to you in this and future years.
Sincerely,
Gideon ArgovPresident and Chief Executive Officer
57543_Letter_1-4.qxp 3/23/07 4:16 PM Page 1

Dear Shareholder:
In my letter to you last year, I said that 2006 would be a year of building bridges for Entegris. Now, with 2007well under way, I’m pleased to report that we accom-plished that goal – successfully uniting two organizationsand reaching out to customers across the globe.
For 2006, our revenue growthreflected the strong performance of the side of our business drivenby capital spending, whichaccounted for 41 percent of thecompany’s total sales. Sales ofsuch capital-driven products asour gas microcontamination andliquid systems grew faster thanthe overall rate of market growth.The unit-driven side of our busi-ness, which represented 59 percentof sales this year, is linked to
production levels and factory utilization rates in thesemiconductor industry. Sales of these products, such as our liquid filters and data storage shipping products,were robust. Geographically, sales in Asia, Japan andEurope were strong, while sales in North America wereflat. While the year’s second half didn’t live up to thebullish predictions of some industry analysts, our sec-ond-half revenues exceeded the year’s first half.
So 2006 was a year of building; in 2007 we expect toreap the benefits of that building through a seamlessinteraction between our Global Supply Chain (GSC),Entegris’ business units and our global regions. The business units and regions form our customer-facingorganization, and GSC (comprising Entegris’ manufac-turing, quality and logistics functions) provide thesupporting infrastructure to the organization. With thismodel, we’ll continue to optimize that infrastructure dur-ing the year to deliver superior value to our customers.
In addition, to ensure the long-term success of Entegris,we are developing our leaders and managers so thatthey will perform extremely well in an environmentthat’s conducive to building a successful company overthe long term. We’ve empowered our leaders to act likeentrepreneurs – taking responsibility for the perform-ance of their businesses, while at the same timeleveraging the resources of the company’s overall technology portfolio.
In 2007, we intend and expect to achieve our targetedfinancial results in both revenue and profitability, andto focus on maximizing our return on invested capital.One goal is to grow our revenue faster than our peers,and to that end we have instituted business-unit plansgeared toward achieving $40 million in revenue fromnew products in 2007. Each of our businesses will use
a streamlined new product development process thatwill bring greater financial and strategic discipline toour operations.
In the marketplace, the capital investment by our cus-tomers in lithography equipment is expected to outgrowthe industry. At 193 nanometer wavelengths, airbornemolecular contamination is a significant industry chal-lenge affecting both optics and photochemical resists.Customers are realizing that contamination issues areextremely costly both in terms of quality and productiv-ity – and are turning to Entegris for solutions such asour new Clarilite Certified systems specifically designedto eliminate reticle haze.
In 2008 and beyond, Entegris will continue to pursueopportunities that help us extend our leadership inbringing innovative solutions to the semiconductorindustry and in solving micro and molecular contamina-tion issues. Those opportunities will come through a mixof acquisition, partnership and organic development.
Our strategy calls for us to take a twofold approach to business development. The first is to develop a coreexpertise relating to a specific component or consum-able, and to establish a leading cost position throughoperational efficiency and scale. We call that “owningthe box,” and prime examples include our leadership in wafer carriers and shippers. The second is to developa core expertise around a specific application or processstep such as CMP, photolithography and wet etch andclean applications, and then to deliver the right set ofcomponents to address that application more effectivelythan the competition. We call that “surrounding thestep.” We believe this approach brings us closer to thecustomer and enables us to leverage our knowledge in materials science and separations technology.
Our business unit technology roadmaps are gearedtoward one or both of these strategies, and are closelyaligned with the needs of key customers in our industry.We believe this gives us an excellent platform to trans-late our technology and market leadership into clearproduct differentiation, higher margins and improvedmarket share that ultimately lead to greater share-holder value.
We’re confident that by both “owning the box” and “surrounding the step” we can expect to achieve much on your behalf in 2007 and beyond.
Sincerely yours,
Jean-Marc PandraudExecutive Vice President and Chief Operating Officer
57543_Letter_1-4.qxp 3/22/07 2:22 PM Page 2

Dear Shareholder:
In 2006, Entegris delivered solid financial performanceand return to our shareholders. Our sales of $678.7 mil-lion from continuing operations grew 15 percent from theprior year on a pro forma basis adjusted for the calen-dar year change. Earnings per diluted share were $0.46on GAAP basis and $0.63 on a non-GAAP basis adjustedfor merger-related and other restructuring costs.
The company’s operating margin was 16.3 percent of sales, on an adjusted non-GAAP basis. This demon-strates our ability to control operating expenses and the favorable effect of the merger-related cost syner-gies, which offset the impact of some manufacturinginefficiencies on gross margins in the third and fourthquarters.
For all of fiscal 2006, Entegris generated $96 million in cash from operations, and completed a $100 millionaccelerated stock buyback. We ended the year in anexcellent financial position with $275 million in cash,cash equivalents and short-term investments and virtu-ally no long-term debt.
As is often the case, there’s a story behind the numbers.Fiscal 2006 was centered on completing the mergerintegration process while meeting customer demandduring an industry ramp in the first half of the year.From a financial perspective, we achieved several key goals including:
• Integrating the merged Entegris and Mykrolis – combining two ERP information systems into a single unified platform
• Selling our discontinued operations, in February 2006
• Streamlining our physical infrastructure through facility consolidations
• Implementing an effective planning process for thecombined organization
We experienced manufacturing challenges at certainNorth American facilities that impacted gross margins.As the incoming CFO, I was part of a team that under-took an in-depth review during the fourth quarter ofeach of our manufacturing facilities. We took severalaggressive corrective actions, such as implementingimproved procedures and check points, that webelieve will minimize the likelihood of such issuesgoing forward. We intend to continue to make regularreviews a key priority to leverage the strengths of ourmanufacturing operations.
Moving from 2006 to 2007, our focus has shifted fromintegration to optimization. From a financial stand-point, this means achieving three key goals:
First, we will work to find new and better ways to lever-age the financial and management reporting systemsthat drive our decision making.
Second, finance will play an activerole in helping to optimize ourmanufacturing cost structure andalso ensuring that we achievemaximum operating leverage from our global infrastructure.
Third, we plan to use our balancesheet and cash flows to continueto build shareholder value – the$100 million stock buyback weimplemented in 2006 and theremaining $50 million repurchaseauthorization being representativeexamples.
I am pleased and excited to serve as the new CFO ofEntegris. We are the market leader in products that areindispensable to our customers, and are well-positionedto capitalize on major changes in our industry in waysthat foster profitable growth. I thank CFO John Villas,who is leaving the company after 23 years of outstand-ing service, for his many contributions and for makingthe CFO transition a smooth one.
Sincerely,
Greg GravesSenior Vice President and Chief Financial Officer
57543_Letter_1-4.qxp 3/22/07 2:22 PM Page 3

Dear Shareholder:
A key goal of Entegris’ operations is to manage andoptimize the flow of raw materials, work-in-process and finished goods between our many locations and our trading partners (both suppliers and customers).Another is to manage and optimize information,
cash and process/work flow.Operational excellence in theseareas provides the foundationupon which Entegris’ successdepends.
From an operations standpoint,2006 proved to be an exceptionallybusy year, as we completed a sig-nificant range of merger-relatedprojects while managing the com-plexities associated with anupturn in demand. By the end of 2006, we had:
• Reduced our manufacturing footprint by 25 percent,moving several significant product lines in the process
• Improved the company’s quality metrics
• Re-launched Lean/Six Sigma initiatives
• Started redeploying manufacturing assets to Asia,including closing a facility in Germany and openingone in Malaysia
• Rolled out a common global ERP platform
• Improved delivery performance to our customers
While there were challenges, we were encouraged bythe way Entegris responded to them. During the secondhalf of the year, we identified a number of internal inef-ficiencies and dealt with them in a very proactive anddeliberate way. With these efforts, we believe we arewell on our way to greater operational excellence.
Significant new technologies, made real and supportedby superior operational performance, are the key toconsistently being ahead of the competition. ThomasEdison once said, “Genius is one percent inspiration,and 99 percent perspiration.” Perspiration is our abilityto consistently execute and deliver on our objectives,week after week, month after month, and deliver supe-rior returns to our shareholders. This will continue tobe our main focus in 2007.
As we plan for the future, the Entegris team will focuson the basic tenets of operational excellence:
• Emphasizing quality in everything we do
• Leading the Lean/Six Sigma way
• Simplifying and strengthening our core processes andbetter integrating them with those of our trading partners
• Establishing the critical metrics by which we want to measure our progress and promote accountability
To reach these goals, we will continue to invest in ourpeople, as no team and no individual can ever acquiretoo much skill and knowledge. To compete and thriveas a global corporation, we need to embrace the fast-paced technological changes that are sweeping ourindustry and capitalize on them. A prime example is our adoption of Lean/Six Sigma at all levels of the company. We believe it will provide our teams with tools and mindsets to efficiently face up to the many challenges and demands of the semiconductorindustry and of globalization.
Another important strategic initiative revolves aroundoutsourcing more components of our supply chain toimprove flexibility and increase our ability to handle the volatility of semiconductor demand cycles. Byfocusing on our core manufacturing capabilities, we will increase our agility and overall return on investedcapital through gained efficiencies.
Lastly, the semiconductor industry has long been drivenby the fast growth of the Asian markets. Today, morethan 55 percent of Entegris’ revenues are generated inthe Asia Pacific region, and that’s conservative giventhat many of the tools built by U.S. and European OEMbusinesses will ultimately be used in Asia. But 70 per-cent of Entegris’ manufacturing capacity is U.S.-based.Over the next three years, one of our main goals is torebalance this ratio, and we anticipate that ultimatelyno more than 50 percent of our manufacturing assetswill be in North America. As a global organization, wewill best achieve our operational and financial objec-tives if we think and plan centrally, manufacture ourproducts regionally and support our customers locally.To that end, we will transform Entegris to more closelymatch the changing market landscape.
I believe that the challenge facing many organizationsis not the lack of well-thought-out strategies, but thelack of disciplined execution. As a company, we deliv-ered on the merger-related goals that we set; goingforward, we will adhere to the principles and strategiesabove, and deliver superior operational and financialperformance. Our team looks forward to the challengeand to establishing a foundation upon which Entegriswill deliver the highest possible customer and share-holder value.
Sincerely yours,
Bertrand LoyExecutive Vice President and Chief AdministrativeOfficer
57543_Letter_1-4.qxp 3/22/07 2:22 PM Page 4
SECURITIES AND EXCHANGE COMMISSIONWashington, D.C. 20549
Form 10-K(Mark One)È Annual report pursuant to Section 13 or 15(d) of the Securities Exchange Act of 1934
For the fiscal year ended December 31, 2006or
‘ Transition report pursuant to Section 13 or 15(d) of the Securities Exchange Act of 1934For the transition period from to
Commission File Number 000-30789
ENTEGRIS, INC.(Exact name of registrant as specified in its charter)
Delaware 41-1941551(State or Other Jurisdiction ofIncorporation or Organization)
(I.R.S. EmployerIdentification No.)
3500 Lyman Boulevard, Chaska, MN 55318(Address of principal executive offices and zip code)
(952) 556-3131(Registrant’s telephone number, including area code)
Securities registered pursuant to Section 12(b) of the Act:Title of Class
Common Stock, $0.01 Par Value
Securities registered pursuant to Section 12(g) of the Act: None
Indicate by check mark if the registrant is a well known seasoned issuer, as defined in Rule 405 of the SecuritiesAct. È Yes ‘ No
Indicate by check mark if the registrant is not required to file reports pursuant to Section 13 or 15(d) of theAct. ‘ Yes È No
Indicate by check mark whether the registrant: (1) has filed all reports required to be filed by Section 13 or 15(d) of theSecurities Exchange Act of 1934 during the preceding 12 months (or for such shorter period that the registrant was required to filesuch reports), and (2) has been subject to such filing requirements for the past 90 days. Yes È No ‘
Indicate by check mark if disclosure of delinquent filers pursuant to Item 405 of Regulation S-K is not contained herein andwill not be contained, to the best of registrant’s knowledge, in definitive proxy or information statements incorporated by referencein Part III of Form 10-K or any amendment to this Form 10-K. ‘
Indicate by check mark whether the registrant is a large accelerated filer, an accelerated filer, or a non-accelerated filer (Checkone):
Large Accelerated Filer È Accelerated Filer ‘ Non-Accelerated Filer ‘
Indicate by check mark whether the registrant is a shell company (as defined in Rule 12b-2 of the ExchangeAct). Yes ‘ No È
The aggregate market value of voting stock held by non-affiliates of the registrant, based on the last sale price of the CommonStock on June 30, 2006, the last business day of registrant’s most recently completed second fiscal quarter, was $1,281,289,964.Shares held by each officer and director of the registrant and by each person who owned 10 percent or more of the outstandingCommon Shares have been excluded from this computation in that such persons may be deemed to be affiliates of the registrant.This determination of affiliate status for this purpose is not necessarily a conclusive determination for other purposes.
As of March 15, 2007, 134,453,641 shares of the registrant’s Common Stock were outstanding.
DOCUMENTS INCORPORATED BY REFERENCE
Document Incorporated into Form 10-K
Portions of the Definitive Proxy Statement, dated March 31,2007 Part III

PART I
Item 1. Business.
THE COMPANY
Entegris is a worldwide developer, manufacturer and supplier of materials integrity management solutions to themicroelectronics industry in general and to the semiconductor and data storage markets in particular. Ourmaterials integrity management solutions enable our customers to protect their investment in work-in-processand finished devices by facilitating the safe handling, purity and precision processing of the critical materialsused in their manufacturing processes. Our solutions for the semiconductor industry assure the integrity ofmaterials as they are handled, stored, processed and transported throughout the semiconductor manufacturingprocess, from raw silicon wafer manufacturing to packaging of completed integrated circuits. We have alsoleveraged our core technology capabilities to extend our materials integrity management solutions to other hightechnology applications such as the fuel cell market. Our products are also used to manufacture a range of otherproducts, such as flat panel displays, high purity chemicals, photoresists, solar cells, gas lasers, optical andmagnetic storage devices and fiber optic cables. We sell our products worldwide through a direct sales force andthrough distributors in selected regions.
We offer a diverse product portfolio which includes more than 13,000 standard and customized products that webelieve provide the most comprehensive offering of materials integrity management products and services to themicroelectronics industry. Our products include:
• Microenvironment products, including wafer shippers, wafer transport and process carriers, reticle transportand storage products, standard mechanical interface pods and work-in-process boxes. These products alsoinclude shippers and trays that enable the transportation and handling of completed integrated circuitsduring testing, assembly and packaging operations and that prevent the degradation and damage of magnetichard disk drives and read/write heads as they are processed and shipped.
• Liquid micro-contamination control products including consumable membrane filters and purifiers androller brushes for post Chemical Mechanical Planarization (CMP) cleaning applications.
• Liquid systems products including fluid handling products such as valves, fittings, tubing, pipe, fluidmeasuring and control products and containers that assure the consistent and safe delivery and storage ofsophisticated chemicals between chemical manufacturers and manufacturers’ point-of-use, as well as theprecision dispense of chemicals onto the wafer.
• Gas micro-contamination products, including gas purification components and systems, that purifysemiconductor process gases and the ambient manufacturing environment.
Certain of these products are unit driven and consumable products that rely on the level of semiconductormanufacturing activity to drive growth while others rely on expansion of manufacturing capacity to drive growth.Our unit driven and consumable product class includes wafer shippers, disk shipping containers and testassembly and packaging products, membrane based liquid filters and housings, metal based gas filters and resinbased gas purifiers. Our capital expense driven products include our process carriers that protect the integrity ofin-process wafers, components, systems and subsystems that use electro-mechanical, pressure differential andrelated technologies, to permit semiconductor and other electronics manufacturers to monitor and control theflow and condition of process liquids used in these manufacturing processes.
SIGNIFICANT DEVELOPMENTS
The Company was incorporated in Delaware in June 2005 in connection with a strategic merger of equalstransaction between Entegris, Inc., a Minnesota corporation (Entegris Minnesota), and Mykrolis Corporation, aDelaware corporation (Mykrolis). Effective August 6, 2005, Entegris Minnesota and Mykrolis were each mergedinto the Company with the Company as the surviving corporation to carry on the combined businesses. For moreinformation concerning the history of our predecessor companies see “Our History” below.
1
On December 13, 2005, the Company’s board of directors approved a change in fiscal year end from a 52-weekor 53-week fiscal year period ending on the last Saturday of August to December 31. As a result of this change,during 2005 the Company had a four-month transition period following the end of its prior fiscal year, runningfrom August 28, 2005, through December 31, 2005. As a result, the financial periods presented in the Company’sconsolidated financial statements appearing starting at page F-1 below cover the following periods: (i) the yearended December 31, 2006 covering the twelve months ended December 31, 2006; (ii) the four-month transitionperiod covering the four months ended December 31, 2005; (iii) the year ended August 27, 2005 covering thetwelve months ended August 27, 2005; and (iv) the year ended August 28, 2004 covering the twelve monthsended August 28, 2004.
Certain financial data included in the following discussion of the Company’s business is shown for twelve-monthperiods ended December 31, 2006, 2005 and 2004 and is presented on a pro forma combined basis.
On August 21, 2006, the Company’s Board of Directors authorized a share repurchase program of up to $150million over the succeeding 12 to 18 months. In connection with this share repurchase program the Companyentered into an Accelerated Share Repurchase Agreement (ASRA) and a Collared Accelerated Share RepurchaseAgreement (CASRA) with Goldman, Sachs & Co. (GS) effective August 30, 2006. Under the ASRA theCompany acquired 4,677,268 shares of common stock on September 5, 2006 from GS for $50.0 million. Thetransaction was accounted for as a share retirement resulting in a reduction of common stock, paid-in capital andretained earnings. Under the CASRA, the Company paid GS $50.0 million for a prepaid forward contract torepurchase the Company’s common stock and received an initial minimum delivery of common stock of2,976,444 shares on September 5, 2006. The Company received an additional 1,226,456 shares of common stockon October 6, 2006. The CASRA transaction was accounted for as a share retirement resulting in a reduction ofcommon stock, paid-in capital and retained earnings.
INDUSTRY BACKGROUND
Semiconductors, or integrated circuits, are the building blocks of today’s electronics and the backbone of theinformation age. The market for semiconductors has grown significantly over the past decade. This trend isexpected to continue due to increased internet usage and the continuing demand for applications in dataprocessing, wireless communications, broadband infrastructure, personal computers, handheld electronic devicesand other consumer electronics.
The semiconductor materials industry is comprised of a wide variety of materials and consumables that are usedthroughout the semiconductor production process. The extensive and complex process of turning bare siliconwafers into finished integrated circuits is dependent upon a variety of materials used repeatedly throughout themanufacturing process, such as silicon, chemicals, gases and metals. The handling and purification of thesematerials during the integrated circuit manufacturing process requires the use of a variety of products, such aswafer shippers, wafer transport and process carriers, liquid and gas filters and purifiers, fluid and gas handlingcomponents and integrated circuit trays. Semiconductor unit volume is the primary driver of the demand forcertain of these materials and products because they are used or consumed throughout the production process andmany are replenished or replaced on a regular basis. Demand for other products such as wafer transport andprocess carriers and equipment products are driven primarily by capacity expansion.
The manufacture of semiconductors is a highly complex process that consists of two principal segments:front-end processes and back-end processes. The front-end process begins with the delivery of raw silicon wafersfrom wafer manufacturers to semiconductor manufacturers and requires hundreds of highly complex andsensitive manufacturing steps, during which a variety of materials, including chemicals and gases, are introduced.We offer products for each of the primary front-end process steps which are listed below as well as ourtraditional businesses that provide products to transport in-process wafers between each of these steps.
Deposition. Deposition refers to placing layers of insulating or conductive materials on a wafer surface in thinfilms that make up the circuit elements of semiconductor devices. The two main deposition processes are
2

physical vapor deposition, where a thin film is deposited on a wafer surface in a low-pressure gas environment,and chemical vapor deposition, where a thin film is deposited on a wafer surface using a gas medium and achemical bonding process. In addition, electro-plating technology is utilized for the deposition of low resistanceconductive materials such as copper. The control of uniformity and thickness of these films through filtration andpurification of the fluids and materials used during the process is critical to the performance of the semiconductorcircuit and, consequently, the manufacturing yield.
Chemical Mechanical Planarization (CMP). CMP flattens, or planarizes, the topography of the film surface topermit the patterning of small features on the resulting smooth surface by the photolithography process.Semiconductor manufacturers need our filtration and purification systems to maintain acceptable manufacturingyields through the chemical mechanical planarization process by filtering the liquid slurries, which are solutionscontaining abrasive particles in a chemical mixture, to remove oversized particles and contaminants that cancause defects on a wafer’s surface while not affecting the functioning of the abrasive particles in the liquidslurries. In addition, manufacturers use our consumable PVA roller brushes to clean the wafer after completion ofthe CMP process to prepare the wafer for subsequent operations.
Photolithography. Photolithography is the process step that defines the patterns of the circuits to be built on thechip. Before photolithography, a wafer is pre-coated with photoresist, a light sensitive film composed of ultra-high purity chemicals in liquid form. The photoresist is exposed to specific forms of radiation, such as ultravioletlight, electrons or x-rays, to form patterns which eventually become the circuitry on the chip. This process isrepeated many times, using different patterns and interconnects between layers to form the complex, multi-layercircuitry on a semiconductor chip. As device geometries decrease and wafer sizes increase, it is even morecritical that these photoresists are dispensed on to the chip with accurate thickness and uniformity, as well as withlow levels of contamination, and that the process gases are free of micro-contamination so that manufacturers canachieve acceptable yields in the manufacturing process. Our liquid filtration and liquid dispense systems play acritical role in assuring the pure, accurate and uniform dispense of photoresists on to the wafer. In addition, ourgas micro-contamination systems eliminate airborne amine contaminants that can disrupt effectivephotolithography processes.
Etch and Resist Strip. Etch is the process of selectively removing precise areas of thin films that have beendeposited on the surface of a wafer. The hardened photoresist protects the remaining material that makes up thecircuits. During etch, specific areas of the film not covered by photoresist are removed to leave a desired circuitpattern. Similarly, resist strip is a process of removing the photoresist material from the wafer after the desiredpattern has been placed on the wafer. Emerging advanced etch and resist strip applications require preciselycontrolled gas chemistries and flow rates in order to achieve precise etch and resist strip characteristics. Our gasfilters and purifiers help assure the purity of these process gas streams.
Wet Cleaning. Ultra-high purity chemicals and photoresists of precise composition are used to clean the wafers,to pattern circuit images and to remove photoresists after etch. Before processes such as photoresist coating, thinfilm deposition, ion implantation, diffusion and oxidation, and after processes, such as ion implantation and etch,the photoresists must be stripped off, and the wafer cleaned in multiple steps of chemical processes. To maintainmanufacturing yields and avoid defective products, these chemicals must be maintained at very high purity levelswithout the presence of foreign material such as particles, ions or organic contaminants. Our liquid filters andpurifiers are used to assure the purity of these chemicals.
Our wafer and reticle carriers are high purity “mini-environments” which carry wafers between each of the aboveprocess steps protecting them from damage and contamination during these transport operations. Our fluidhandling components assure the delivery of pure liquid chemicals to each of these process steps. Front end waferprocessing can involve hundreds of steps and take several weeks. As a result, a batch of 25 fully processedwafers, the maximum number of wafers that can be transported in one of our products, can be worth severalmillion dollars. Since significant value is added to the wafer during each successive manufacturing step, it isessential that the wafer be handled carefully and precisely to minimize damage. Thus, in the case of wafer
3
carriers, precise wafer positioning, highly reliable and predictable cassette interface dimensions and advancedmaterials are crucial. The failure to prevent damage to wafers can severely impact integrated circuit performance,render an integrated circuit inoperable or disrupt manufacturing operations. Our material integrity managementproducts enable semiconductor manufacturers to: minimize contamination (semiconductor processing is now sosensitive that ionic contamination in certain processing chemicals is measured in parts per trillion); protectsemiconductor devices from electrostatic discharge and shock; avoid process interruptions; prevent damage orabrasion to wafers and materials during automated processing caused by contact with other materials orequipment; prevent damage due to abrasion or vibration of work-in-process and finished goods duringtransportation to and from customer and supplier facilities; and eliminate the dangers associated with handlingtoxic chemicals.
Once the front-end manufacturing process is completed, finished wafers are transferred to back-endmanufacturers or assemblers. The back-end semiconductor manufacturing process consists of test, assembly andpackaging of finished wafers into integrated circuits. Our traditional microenvironment products, such as wafershippers, wafer and reticle carriers and integrated circuit trays, facilitate the storage, transport, processing andprotection of wafers through these front-end and back-end manufacturing steps.
Semiconductor manufacturing has become increasingly complex in recent years as new technologies have beenintroduced to enhance device performance and as larger wafer sizes have been introduced to increase productionefficiencies. This increasing complexity of semiconductor devices has resulted in a number of challengesincluding the need for more complex, higher-precision liquid and gas delivery, measurement, control andpurification systems and subsystems in the front-end manufacturing processes and to improve time-to-market,reduce manufacturing costs, improve production quality and enhance product reliability and long-term serviceand support. To address these challenges, semiconductor equipment companies and device manufacturers areoutsourcing the design and manufacture of liquid delivery, measurement, control and purification systems,subsystems, components, and consumables to us and to other well-established subsystem and componentcompanies that have worldwide presence and leading technologies. The design and performance of those liquiddelivery systems, subsystems, components and consumables are critical to the front-end semiconductormanufacturing process because they directly affect cost of ownership and manufacturing yields. We continuallyseek opportunities to work with our customers to address these challenges.
Also in response to these challenges and to achieve continued productivity gains, semiconductor manufacturershave become increasingly focused on materials integrity management solutions that enable them to safely store,handle, process and transport critical materials throughout the manufacturing process to minimize the potentialfor damage or degradation to their materials and to protect their investment in processed wafers. The need forefficient and reliable materials integrity management is particularly important as new materials are introducedand as 300 mm semiconductor wafer manufacturing becomes a more prevalent manufacturing technology.Processing 300 mm wafers, currently the largest wafer size in a manufacturing environment, is more costly andmore complex because of the larger size of these wafers. In addition, new materials and circuit shrinkage createnew contamination and material compatibility risks, rendering 300 mm wafers more vulnerable to damage orcontamination. These trends will present new and increasingly difficult shipping, transport, process and storagechallenges. We seek to bring our advanced polymer manufacturing and advanced tool design capabilities to bearon these challenges to provide our customers with innovative materials integrity management solutions.
A key emerging market is the outsourced fab services market, which consists of logistics management, sparesand refurbishment, consumables and information technology. The market for outsource services remains largelyuntapped, as currently these activities are performed primarily by the owners of fabs. A rapidly growing segmentwithin this market is materials integrity management services, which includes sub-micron cleaning and certifiedre-use and recycling of materials management products. As the materials integrity management market continuesto grow, we believe that there is an increasing need for more effective and efficient application of solutionsthrough dedicated, outsourced service offerings.
4

Many of the processes used to manufacture semiconductors are also used to manufacture flat panel displays,magnetic and optical storage devices and fiber optic cables for telecommunications, resulting in the need forsimilar filtration, purification, control and measurement capabilities. We seek to leverage our products andexpertise in serving semiconductor applications to address these important market opportunities.
OUR BUSINESS STRATEGY
Our objective is to be a global leader providing innovative materials integrity management solutions to thesemiconductor and ancillary markets. We intend to build upon our position as a worldwide developer,manufacturer and supplier of liquid delivery systems, components and consumables used by semiconductor andother electronic device manufacturers to grow our business in these and other high value-added manufacturingprocess markets. Our strategy includes the following key elements:
Comprehensive and Diverse Product Offerings. The semiconductor manufacturing industry is driven by rapidtechnological changes and intense competition. We believe that semiconductor manufacturers are seekingprocess control suppliers who can provide a broad range of reliable, flexible and cost effective products, as wellas the technological and application design expertise necessary to deliver effective solutions. Our comprehensiveproduct offering enables us to meet a broad range of customer needs and provide a single source of flexibleproduct offerings for semiconductor device and capital equipment manufacturers as they seek to consolidate theirsupplier relationships to a smaller select group. In addition, we believe manufacturers of semiconductor tools arelooking to their suppliers for subsystems that provide more integrated functionality and seamlessly communicatewith other equipment. We believe our offering of consumables and equipment, as well as our ability to integratethem, allows us to provide advanced subsystems.
Diversified Revenue Stream. We target a diversified revenue stream by balancing our sales of wafer transport andprocess carriers as well as component and subsystem equipment products with sales of our unit driven andconsumable products. Our unit driven and consumable products provide a relatively more stable and recurringsource of revenue in an otherwise cyclical industry. Our capital expense driven products, which are generallydependent upon such factors as the construction and expansion of semiconductor manufacturing facilities and theretrofitting and renovation of existing semiconductor facilities, position us to benefit from increases in capitalspending that is typically more subject to the volatility of industry cycles.
Technology Leadership. With the emergence of smaller and more powerful semiconductor devices, and thedeployment of new materials and processes to produce them, we believe there is a need for greater materialsintegrity management within the semiconductor fabrication process. We seek to extend our technology bydeveloping advanced products that address more stringent requirements for greater purification, protection andtransport of high value added materials and for contamination control, fluid delivery and monitoring, and systemintegration. We have continuously improved our products as our customers’ needs have evolved. For example:we have developed proprietary materials blends, for use in our wafer handling product family which address thecontamination concerns of advanced semiconductor processing below 100 nanometers; we have also developed anext generation 300 mm front opening unified pod utilizing those materials targeting the needs of 65 nmproduction; and we have expanded upon our proprietary two-stage dispense technology with integrated filtrationfor photoresist delivery, where the photoresist is filtered through one pump and precisely dispensed through asecond pump at a different flow rate to reduce defects on wafers.
Strong Customer Base. We have established ongoing relationships with many leading original equipmentmanufacturers and materials suppliers in our key markets. These industry relationships have provided us with theopportunity for significant collaboration with our customers at the product design stage which has facilitated ourability to introduce new products and applications that meet our customers’ needs. For example, we work withour key customers at the pre-design and design stage to identify and respond to their requests for current andfuture generations of products. We target opportunities to offer new technologies in emerging applications, suchas copper plating, chemical mechanical planarization, wet- dry cleaning systems and photolithography. Webelieve that our large customer base will continue to be an important source of new product development ideas.
5

Global Presence. We have established a global infrastructure of design, manufacturing, distribution, service andsupport facilities to meet the needs of our customers. In addition, we may expand our global infrastructure, eitherthrough acquisition or internal development, to accommodate increased demand or we may consolidateinefficient operations to optimize our manufacturing and other capabilities. For example, we have establishedsales and service offices in China in anticipation of a growing semiconductor manufacturing base in that region.As semiconductor and other electronic device manufacturers have become increasingly global, they haverequired that suppliers offer comprehensive local repair and customer support services. We realigned ourregional structure in September 2006, transferring customer support and logistics to local regions in an effort toenhance our global customer contact and awareness. We maintain our customer relationships through acombination of direct sales and support personnel and selected independent sales representatives and distributorsin North America, Asia, Europe and the Middle East.
Ancillary Markets. We plan to leverage our accumulated expertise in the semiconductor industry by developingproducts for applications that employ similar production processes that utilize materials integrity management,high purity fluids and integrated dispense system technologies. Our products are used in manufacturing processesoutside of the semiconductor industry, including the manufacturing of flat panel displays, fuel cell components,high-purity chemicals, photoresists, solar cells, gas lasers, optical and magnetic storage devices and fiber opticcables. We plan to continue to identify and develop products that address materials integrity management andadvanced materials processing applications where fluid management plays a critical role. We believe that byutilizing our technology to provide manufacturing solutions across multiple industries we are able to increase thetotal available market for our products and reduce, to an extent, our exposure to the cyclicality of any particularmarket.
Strategic Acquisitions, Partnerships and Related Transactions. We plan to pursue strategic acquisitions andbusiness partnerships that enable us to address gaps in our product offerings, secure new customers, diversifyinto complementary product markets or broaden our technological capabilities and product offerings. As thedynamics of the markets that we serve shift, we will re-evaluate the ability of our existing businesses to providevalue added solutions to those markets in a manner that contributes to achieving our objectives; in the event thatwe conclude that a business is not able to do this, we expect to restructure or replace that business. Our decisionto divest three product lines in late 2005 and early 2006 was made pursuant to this strategy. Finally, we arecontinuously evaluating opportunities for strategic alliances and joint development efforts with key customersand other industry leaders.
OUR PRODUCTS
Our product portfolio includes four major categories of products: microenvironment products, liquidmicrocontamination control products, liquid subsystem products and gas micro-contamination products. Theseproduct categories fall into two major product classes: unit driven and consumable products, and capital spendingdriven products. Liquid micro-contamination control products are primarily unit driven and consumableproducts. Microenvironment products, liquid subsystem products and gas micro-contamination products includeboth unit-driven and consumable products as well as capital spending driven products. Unit driven andconsumable products, including service revenue, accounted for approximately 59%, 60% and 56% of our netsales for calendar years 2006, 2005 and 2004, respectively, and capital expense driven products accounted forapproximately 41%, 40% and 44% of our net sales for the calendar years 2006, 2005, and 2004, respectively.There follows a detailed description of each of these four categories of products:
Microenvironment Products
Our microenvironment products preserve the integrity of wafers, reticles and electronic components at variousstages of transport, processing and storage. Our microenvironment products fall into two sub-categories, waferhandling and finished electronic component products.
6

WAFER HANDLING PRODUCTS. We believe that we are a leading provider of critical shipping products thatpreserve the integrity of raw silicon wafers as they are transported from wafer manufacturers to semiconductormanufacturers. We lead the market with our extensive, high volume line of Ultrapak ® and Crystalpak ® productswhich are supplied to wafer manufacturers in a full range of sizes covering 100, 125, 150 and 200 mm wafers.We also offer a full-pitch front opening shipping box or FOSB for the transportation and automated interface of300 mm wafers. We offer a complete shipping system, including both wafer shipping containers as well assecondary packaging that provide another level of protection for wafers.
We believe that we are a market leader in wafer handling products. We offer a wide variety of products that holdand position wafers as they travel between each piece of equipment used in the automated manufacturingprocess. These specialized carriers provide precise wafer positioning, wafer protection and highly reliable andpredictable cassette interfaces in automated fabs. Semiconductor manufacturers rely on our products to improveyields by protecting wafers from abrasion, degradation and contamination during the manufacturing process. Weprovide standard and customized products that meet the full spectrum of industry standards and customers’ waferhandling needs including FOUPs, wafer transport and process carriers, SMIF pods and work-in-process boxes.To meet our customers’ varying wafer processing and transport needs, we offer wafer carriers in a variety ofmaterials and in sizes ranging from 100 mm through 300 mm.
We believe we are the only global provider currently offering outsourcing programs for wafer and devicetransportation and protection for both wafer manufacturing and wafer handling products. Our Wafercare ®, andDeviceCare SM services include product cleaning, certified re-use services for shipping products, on-site andoff-site product maintenance and optimization, and end-of-life recycling for our wafer, device and disk-handlingproducts. Re-use services can be customized depending on the customers needs to provide product cleaning,logistics, recovery, certification and supply solutions for our products.
FINISHED ELECTRONIC COMPONENT PRODUCTS. Rapidly changing packaging strategies for semiconductorapplications are creating new materials management challenges for back-end manufacturers. We offer chip andmatrix trays as well as carriers for bare die handling and integrated circuits. Our materials management productsare compatible with industry standards and available in a wide range of sizes with various feature sets. Ourstandard trays offer dimensional stability and permanent electrostatic discharge protection. Our trays also offer anumber of features including custom designs to minimize die movement and contact; shelves and pedestals tominimize direct die contact, special pocket features to handle various surface finishes to eliminate die sticking;and other features for automated or manual die placement and removal. In addition, we support our product linewith a full range of accessories to address specific needs such as static control, cleaning, chip washing and otherrelated materials management requirements. To better address this market, we have established ictray.com, awebsite which allows new and existing customers to select from our full range of standard and custom integratedcircuit trays.
Like the semiconductor industry, the data storage market continues to face new challenges and deploy newtechnologies at an accelerating rate. We provide materials management products and solutions to manage twocritical sectors of this industry: magnetic disks and the read/write heads used to read and write today’s higherdensity disks. Because both of these hard disk drive components are instrumental in the transition to morepowerful storage solutions, we offer products that carefully protect and maintain the integrity of thesecomponents during their processing, storage and shipment. Our product offerings for magnetic hard disk drivesinclude process carriers, boxes, packages, tools and shippers for aluminum and other disk substrates. Our opticalhard disk drive products include stamper cases, process carriers, boxes and glass master carriers. Our read/writehead products include transport trays, carriers, handles, boxes, individual disk substrate packages andaccessories.
7
Liquid Micro-contamination Control Products
Liquid processing occurs during multiple manufacturing steps including photolithography, deposition,planarization and surface etching and cleaning. The fluids that are used include various mixtures of acids, bases,solvents, slurries and photochemicals, which in turn are used over a broad range of operating conditions,including temperatures from 5 degrees Celsius up to 180 degrees Celsius. The design and performance of ourliquid filtration and purification products are critical to the semiconductor manufacturing process because theydirectly affect the cost of ownership and manufacturing yield. Specially designed proprietary filters removesub-micron sized particles and bubbles from the different fluid streams that are used in the manufacturingprocess. Some of our filters are constructed with ultra-high molecular weight polyethylene flat sheet membranesthat offer improved bubble clearance and gel removal, either of which can cause defects in the wafers if notremoved. Our low hold-up volume disposable filters, with flat sheet membranes, use our Connectology ™
technology to allow filter changes in less than a minute, significantly faster than conventional filters, to reducethe amount of expensive chemicals lost each time a filter is changed and to minimize operator exposure tohazardous solvents and vapors during changeout. We also offer a line of consumable PVA roller brush productsto clean the wafer following the chemical mechanical planarization process. Our unique Planacore ™ PVA rollerbrush is molded on the core to allow easy installation that reduces tool downtime and a dimensionally stableproduct that provides consistent wafer to wafer cleaning performance.
Liquid Systems
CHEMICAL DELIVERY PRODUCTS. Chemicals spend most of their time in contact with fluid storage andmanagement distribution systems, so it is critical for fluid storage and handling components to resist thesechemicals and avoid contributing contaminants to the fluid stream. We offer chemical delivery products thatallow the consistent and safe delivery of sophisticated chemicals from the chemical manufacturer to thepoint-of-use in the semiconductor fab. Most of these products are made from perfluoroalkoxy or PFA, afluoropolymer resin widely used in the industry because of its high purity and inertness to chemicals. Theinnovative design and reliable performance of our products and systems under the most stringent of processconditions has made us a recognized leader in high purity fluid transfer products and systems. Bothsemiconductor manufacturers and semiconductor OEMs use our chemical delivery products and systems. Ourcomprehensive product line provides our customers with a single source provider for their chemical storage andmanagement needs throughout the manufacturing process. Our chemical delivery products include valves,fittings, tubing, pipe, chemical containers and custom fabricated products for high purity chemical applications.
LIQUID DELIVERY AND CONTROL SYSTEMS. Our proprietary photochemical filtration and dispense systemsintegrate our patented two-stage, filter device and valve control technologies. We believe that we offer themicroelectronics industry the only dispense systems with integrated filtration capability and that our proprietarypatented two-stage technology has a significant advantage over conventional single-stage technology. Ourtwo-stage technology permits the filtering and dispense functions to operate independently so that filtering anddispensing of photochemicals can occur at different rates, reducing the differential pressure across the filter,conserving expensive photochemicals and resulting in reduced defects in wafers. As described above, we offer aline of proprietary filters specifically designed to efficiently connect with these systems. Our patented digitalvalve control technology improves chemical uniformity on wafers and improves ease of optimized systemoperation. In addition, our integrated high precision liquid dispense systems enable uniform application ofphotoresists for the spin-coating process where uniformity is measured in units of Angstroms, a tiny fraction ofthe thickness of a human hair.
We offer a wide variety of measurement and control products for high purity and corrosive applications. Forelectronic measurement and control of liquids, we provide a complete line of pressure and flow measurement andcontrol products as well as all-plastic capacitance sensors for leak detection, valve position, chemical level andother measurements. We also offer a complete line of sight tube-style flowmeters and mechanical gauge pressuremeasurement products.
8

Gas Micro-Contamination Products
Our Wafergard®, ChamberGard™ and Waferpure® particle and molecular filtration products purify the gasentering the process chamber in order to eliminate system and wafer problems due to particulate, atmosphericand chemical contaminants. These filters are able to retain all particles 0.003 microns and larger. Our metalfilters, such as stainless steel and nickel filters, reduce outgassing and improve corrosion resistance. OurWaferpure® and Aeronex Gatekeeper® purifiers chemically react with and absorb volatile contaminants, such asoxygen and water, to prevent contamination and our ChamberGard™ vent diffusers reduce particle contaminationand processing cycle times. We offer a wide variety of gas purification products to meet the stringentrequirements of semiconductor processing. Our Aeronex Gas Purification Systems contain dual resin bedsproviding a continuous supply of purified gas without process interruption. These gas purification systems arecapable of handling higher flow rates and longer duty cycles than cartridge purifiers. Our Extraction productsinclude filter housings and hybrid media chemical air filters which purify air entering exposure tool and processtool enclosures and remove airborne molecular contaminants.
In addition to the above four product categories, we have undertaken an initiative to transfer our advancedpolymer knowledge into the fuel cell market, where the properties of highly engineered polymers can be used invarious products and manufacturing processes.
Worldwide Applications Development and Field Support Capabilities
We provide strong technical support to our customers through local service groups and engineers consisting offield applications engineers, technical service groups, applications development groups and training capabilities.Our field applications engineers, located in the United States and in approximately ten other countries, workdirectly with our customers on product qualification and process improvement in their facilities. In addition, inresponse to customer needs for local technical service and fast turn-around time, we maintain regionalapplications laboratories. Our applications laboratories maintain process equipment that simulate customers’applications and industry test standards and provide product evaluation, technical support and complaintresolution for our customers.
OUR CUSTOMERS AND MARKETS
Our major customer groups include integrated circuit device manufacturers, original equipment manufacturersthat provide equipment to integrated circuit device manufacturers, gas and chemical manufacturing companiesand manufacturers of high precision electronics.
Our most significant customers based on sales in fiscal 2006 include industry leaders, such as AMD, DainipponScreen Manufacturing Co., Freescale Semiconductor, IBM, Komag, Inc., Samsung America Inc., SeagateTechnology, Siltronic AG, SUMCO Oregon Corp., Taiwan Semiconductor Manufacturing Co. Ltd., and UMCGroup. We also sell our products to flat panel display original equipment manufacturers, materials suppliers andend-users. The major manufacturers for flat panel displays and flat panel display equipment are concentrated inJapan, Korea and other parts of Asia.
In calendar years 2006, 2005 and 2004, net sales to our top ten customers accounted for approximately 28%, 32%and 33%, respectively, of our net sales. During those same periods no single customer accounted for more than10% of our net sales and international net sales represented approximately 71%, 71% and 71%, respectively, ofour net sales. Over 3,000 customers purchased products from us during 2006.
We may enter into supply agreements with our customers to govern the conduct of business between us and ourcustomers, including the manufacture of our products. These agreements generally have a term of one to threeyears but these agreements do not contain any long-term purchase commitments. Instead, we work closely withour customers to develop non-binding forecasts of the future volume of orders. However, customers may canceltheir orders, change production quantities from forecasted volumes or delay production for a number of reasonsbeyond our control.
9

SALES AND MARKETING
We sell our products worldwide primarily through our own direct sales force located in offices in all majorsemiconductor markets, as well as through independent distributors elsewhere. As of December 31, 2006, oursales and marketing force consisted of approximately 450 employees worldwide. Our direct sales force issupplemented by independent sales representatives and agents.
Our marketing efforts focus on our “push/pull” marketing strategy in order to maximize our selling opportunities.We work with original equipment manufacturers to persuade them to design tools that require our products andwe create end user “pull” demand by persuading semiconductor manufacturers to specify our products. Ourindustry relationships have provided us with the opportunity for significant collaboration with our customers atthe product design stage that has facilitated our ability to introduce new products and applications that meet ourcustomers’ needs. In addition, we are constantly identifying for our customers the variety of analytical,purification and process control challenges which may be addressed by our products. Further, we adapt ourproducts and technologies to resolve process control issues identified by our customers. Our sales representativesprovide our customers with worldwide support and information about our products.
We believe that our technical support services are important to our marketing efforts. These services includeassisting in defining a customer’s needs, evaluating alternative products, designing a specific system to performthe desired separation, training users and assisting customers in compliance with relevant governmentregulations. In addition, we maintain a network of service centers located in the United States and in keyinternational markets to support our products.
COMPETITION
The market for our products is highly competitive. While price is an important factor, we compete primarily onthe basis of the following factors:
• historical customer relationships; • breadth of product line;
• technical expertise; • breadth of geographic presence;
• product quality and performance; • advanced manufacturing capabilities; and
• total cost of ownership; • after-sales service.
• customer service and support;
We believe that we compete favorably with respect to all of the factors listed above, but we cannot assure youthat we will continue to do so. We believe that our key competitive strengths include our broad product line, thelow total cost of ownership of our products, our ability to provide our customers with quick order fulfillment andour technical expertise. However, our competitive position varies depending on the market segment and specificproduct areas within these segments. While we have longstanding relationships with a number of semiconductorand other electronic device manufacturers, we also face significant competition from companies that havelongstanding relationships with other semiconductor and electronic device manufacturers and, as a result, havebeen able to have their products specified by those customers for use in manufacturers’ fabrication facilities. Inthe markets for our consumable products, we believe that our differentiated membrane and materials integritymanagement technologies, strong supply chain capabilities, which allow us to provide our customers with quickorder fulfillment, and technical expertise, which enables us to develop membranes to meet specific customerneeds and assist our customers in improving the functionality of our membranes for particular applications, allowus to compete favorably. In these markets our competitors compete against us on the basis of price, as well asalternative membrane technology having different functionality, manufacturing capabilities and breadth ofgeographic presence.
10

The market for our products is highly fragmented, and we compete with a number of different companies. Ourmicroenvironment product lines face competition largely on a product-by-product basis. We have historicallyfaced competition from companies such as Miraial (formerly Kakizaki), Dainichi and Shin-Etsu Polymer. Thesecompanies compete with us primarily in 200 mm and 300 mm applications. Our liquid systems products also faceworldwide competition from companies such as Saint-Gobain, Parker, Gemu and Iwaki Co., Ltd. In finishedelectronic components products, we compete with companies such as ITW/Camtex, Peak International and 3Mand with regional suppliers. Our liquid micro-contamination control products compete with product offeringsfrom a wide range of companies including both large companies such as Pall Corporation as well as small Asianfilter manufacturers. In gas micro-contamination products we compete with companies such as SAES Puregasand Mott Metallurgical Corporation. Some of our competitors are larger and have greater resources than we do.In some cases, our competitors are smaller than us, but well-established in specific product niches. However, webelieve that none of our competitors competes with us across all of our product offerings and that, within themarkets that we serve, we offer a broader line of products, make use of a wider range of process controltechnologies and address a broader range of applications than any single competitor.
RESEARCH AND DEVELOPMENT
Our aggregate research and development expenses in calendar years 2006, 2005 and 2004 were $ 38.8 million,$36.3 million and $38.5 million, respectively. As of February 1, 2007, we had approximately 230 employees inengineering, research and development. We have followed a practice of supplementing our internal research anddevelopment efforts by licensing technology from unaffiliated third parties and/or acquiring distribution rightswith respect thereto when we believe it is in our long-term interests to do so.
To meet the global needs of our customers, we have research and development capabilities in Chaska, MN andBillerica, MA, as well as in Japan and Malaysia. Our research and development efforts are directed towarddeveloping and improving our technology platforms for semiconductor and advanced processing applications andidentifying and developing products for new applications for which fluid management plays a critical role.
We use sophisticated methodologies to research, develop and characterize our materials and products. Ourmaterials technology lab is equipped to analyze the physical, rheological, thermal, chemical and compositionalnature of the polymers we use. Our materials lab includes standard and advanced polymer analysis equipmentsuch as inductively coupled plasma mass spectrometry (ICP/MS), inductively coupled plasma atomic emissionspectrometry (ICP/AES), fourier transform infrared spectroscopy (FTIR) and automated thermal desorption gaschromatography/mass spectrometry (ATD-GC/MS). This advanced analysis equipment allows us to detectcontaminants in materials that could harm the semiconductor manufacturing process to levels as low as parts perbillion, and in many cases parts per trillion.
Our capabilities to test and characterize our materials and products are focused on continuously reducing risksand threats to the integrity of the critical materials that our customers use in their manufacturing processes. Weexpect that technology and product research and development will continue to represent an important element inour ability to develop and characterize our materials and products.
Key elements of our research and development expenditures over the past three years have included thedevelopment of new product platforms to meet the manufacturing needs for 90 and 65 nanometer semiconductordevices. Driven by the proliferation of new materials and chemicals in the manufacturing processes and increasedneeds for tighter process control for 300mm wafers, investments were made for new contamination controlproducts in the area of copper interconnects, deep ultra-violet (DUV) photolithography; and chemical and gasmanagement technologies for advanced wafer cleans, deposition and etch equipment. Additional investmentswere made in the area of advanced process control, monitoring and diagnostics capabilities for future generationsof semiconductor manufacturing processes. Our employees also work closely with our customers’ developmentpersonnel. These relationships help us identify and define future technical needs on which to focus our researchand development efforts. In addition, we participate in Semiconductor Equipment and Materials International(SEMI), a consortium of semiconductor equipment suppliers. We also support research at academic and otherinstitutions targeted at advances in materials science and semiconductor process development.
11
MANUFACTURING
Our customers rely on our products to assure the integrity of the critical materials used in their manufacturingprocesses by providing dimensional precision and stability, cleanliness and consistent performance. Our ability tomeet our customers’ expectations, combined with our substantial investments in worldwide manufacturingcapacity, position us to respond to the increasing materials integrity management demands of themicroelectronics industry and other industries that require similar levels of materials integrity.
To meet our customer needs worldwide, we have established an extensive global manufacturing network withmanufacturing facilities in the United States, Japan and Malaysia. Because we work in an industry wherecontamination control is paramount, we maintain Class 100 to Class 10,000 cleanrooms for manufacturing andassembly. We believe that our worldwide manufacturing operations and our advanced manufacturing capabilitiesare important competitive advantages. Our advanced manufacturing capabilities include:
• Injection Molding. Our manufacturing expertise is based on our long experience with injection molding.Using molds produced from computer-aided processes, our manufacturing technicians utilize specializedinjection molding equipment and operate within specific protocols and procedures established toconsistently produce precision products.
• Extrusion. Extrusion is accomplished through the use of heat and force from a screw to melt solid polymerpellets in a cylinder and then forcing the resulting melt through a die to produce tubing and pipe. We haveestablished contamination free on-line laser marking and measurement techniques to properly identifyproducts during the extrusion process and ensure consistency in overall dimension and wall thickness. Inaddition, we use extrusion technology to extrude a polymer mix into flat sheet and hollow fiber membranes.
• Blow Molding. Blow molding consists of the use of heat and force from a screw to melt solid polymerpellets in a cylinder and then forcing the melt through a die to create a hollow tube. The molten tube isclamped in a mold and expanded with pressurized gas until it takes the shape of the mold. We utilizeadvanced three-layer processing to manufacture 55 gallon drums, leading to cost savings whilesimultaneously assuring durability, strength and purity.
• Rotational Molding. Rotational molding is accomplished by the placing of a solid polymer powder in amold, placing the mold in an oven and rotating the mold on two axes so that the melting polymer coats theentire surface of the mold. This forms a part in the shape of the mold upon cooling. We use rotationalmolding in manufacturing containers up to 5,000 liters.
• Compression Molding. In compression molding, thermoset polymers are processed. Today, we use thismanufacturing process primarily for manufacturing bipolar plates and end-plates for the fuel cell market.We use the same expertise as in injection molding to assure a consistently produced precision product.
• Membrane Casting. We cast membrane by extruding a polymer into flat sheet or hollow fiber format that ispassed through a chamber with controlled atmospheric conditions to control the development of voids orpores in the membrane. Once cast, the membrane is subjected to solvent extraction and annealing steps. Thevarious properties of the membranes that we offer are developed during subsequent process steps.
• Cartridge Manufacturing. We fabricate the membrane we manufacture as well as membranes manufacturedby others into finished filtration cartridges in a variety of configurations. The fabrication process involvesmembrane processing into pleated and other configurations around a central core and enclosing it inframework of end caps and protective screening for use in fabricated cartridge housings. We alsomanufacture filter cartridges that are integrated into their own housings and incorporate our patentedConnectology™ quick connect technology.
• Machining. Machining consists of the use of computer-controlled equipment to create shapes, such as valvebodies, out of solid polymer blocks or rods. Our computerized machining capabilities enable speed andrepeatability in volume manufacturing of our machined products, particularly products utilized in chemicaldelivery applications.
12

• Assembly. We have established protocols, flow charts, work instructions and quality assurance proceduresto assure proper assembly of component parts. The extensive use of robotics throughout our facilitiesreduces labor costs, diminishes the possibility of contamination and assures process consistency.
• Tool Making. We employ approximately 60 tool development and tool making related staff at locations inthe United States and Malaysia. Our toolmakers produce the majority of the tools we use throughout theworld.
We have made significant investments in systems and equipment to create innovative products and tool designs.Our computer-aided design (CAD) equipment allows us to develop three-dimensional electronic models ofdesired customer products to guide design and tool-making activities. Our CAD equipment also aids in the rapidprototyping of products.
We also use computer-automated engineering in the context of mold flow analysis. Beginning with a three-dimensional CAD model, mold flow analysis is used to visualize and simulate how our molds will fill. The moldflow analysis techniques cut the time needed to bring a new product to market because of the reduced need forsampling and development. Also, our CAD equipment can create a virtual part with specific geometries, whichdrives subsequent tool design, tool manufacturing, mold flow analysis and performance simulation.
In conjunction with our three-dimensional product designs, we use finite element analysis software to simulatethe application of a variety of forces or pressures to observe what will happen during product use. This analysishelps us anticipate forces that affect our products under various conditions. The program also assists our productdesigners by measuring anticipated stresses against known material strengths and establishing proper margins ofsafety.
PATENTS AND OTHER INTELLECTUAL PROPERTY RIGHTS
We rely on a combination of patent, copyright, trademark and trade secret laws and license agreements toestablish and protect our proprietary rights. As of February 1, 2007 our patent portfolio included 323 current U.S.patents, 627 current foreign patents, including counterparts to U.S. filings, 141 pending U.S. patent applications,62 pending filings under the Patent Cooperation Treaty not yet nationalized and 824 pending foreign patentapplications. While we believe that patents may be important for aspects of our business, we believe that oursuccess also depends more upon close customer contact, innovation, technological expertise, responsiveness andworldwide distribution. Additionally, while our patented technology may delay or deter a competitor in offeringa competing product, we do not believe that our patent portfolio functions as a barrier to entry for any of ourcompetitors. In addition, while we license and will continue to license technology used in the manufacture anddistribution of products from third parties, except as described below, these licenses are not currently related toany of our core product technology. In connection with the separation of Mykrolis from Millipore Corporation,Mykrolis was granted licenses to certain Millipore technology. Our use of Millipore’s technology is governed bythe agreements governing the separation of Mykrolis from Millipore which prohibit our use of Millipore’stechnology in fields of use outside of the microelectronics industry. In general, where, at the time of theseparation, technology was used both by Millipore in the manufacture of its products and by us in themanufacture of our products, Millipore retained ownership of the technology and granted us a license to use thetechnology limited to fields of use in the microelectronics industry. These restrictions could limit our ability toexpand our business into markets outside the microelectronics industry, which could limit our growth.
We require each of our employees, including our executive officers, to enter into standard agreements pursuant towhich the employee agrees to keep confidential all of our proprietary information and to assign to us allinventions made while employed by us.
The patent position of any manufacturer, including us, is subject to uncertainties and may involve complex legaland factual issues. Litigation is currently necessary and will likely be necessary in the future to enforce our
13

patents and other intellectual property rights or to defend ourselves against claims of infringement or invalidity.The steps that we have taken in seeking patents and other intellectual property protections may prove inadequateto deter misappropriation of our technology and information. In addition, our competitors may independentlydevelop technologies that are substantially equivalent or superior to our technology.
GOVERNMENTAL REGULATION
Our operations are subject to federal, state and local regulatory requirements relating to environmental, wastemanagement and health and safety matters, including measures relating to the release, use, storage, treatment,transportation, discharge, disposal and remediation of contaminants, hazardous substances and wastes, as well aspractices and procedures applicable to the construction and operation of our plants. There can be no assurancethat we will not incur material costs and liabilities or that our past or future operations will not result in exposureto injury or claims of injury by employees or the public. Although some risk of costs and liabilities related tothese matters is inherent in our business, as with many similar businesses, we believe that our business isoperated in substantial compliance with applicable regulations. However, new, modified or more stringentrequirements or enforcement policies could be adopted, which could adversely affect us. While we expect thatcapital expenditures will be necessary to assure that any new manufacturing facility is in compliance withenvironmental and health and safety laws, we do not expect these expenditures to be material. Otherwise, we arenot presently aware of any facts or circumstances that would cause us to incur significant liabilities in the futurerelated to environmental, health and safety law compliance.
EMPLOYEES
As of February 1, 2007, we had approximately 3,000 full-time employees, including approximately 230 inengineering, research and development and approximately 450 in sales and marketing as well as approximately325 temporary employees. Given the variability of business cycles in the semiconductor industry and the quickresponse time required by our customers, it is critical that we be able to quickly adjust the size of our productionstaff to maximize efficiency. Therefore, we use skilled temporary labor as required.
None of our employees are represented by a labor union or covered by a collective bargaining agreement otherthan statutorily mandated programs in European countries.
INFORMATION ABOUT OUR OPERATING SEGMENT
The Company operates in one reportable business segment that develops, manufactures and sells consumablesand capital equipment products to semiconductor manufacturing companies and other companies using similarmanufacturing processes, as well as OEM suppliers to those companies. In calendar years 2006, 2005 and 2004approximately 71%, 71% and 71%, respectively, of our net sales were made to customers outside North America.Industry and geographic segment information is discussed in Note 20 to the Entegris, Inc. Consolidated FinancialStatements (the “Financial Statements”) included in response to Item 8 below, which Note is hereby incorporatedherein by reference.
OTHER INFORMATION
On July 27, 2005, our Board of Directors adopted a shareholder rights plan (the “Rights Plan”) pursuant to whichEntegris declared a dividend on August 8, 2005 to its shareholders of record on that date of one preferred sharepurchase right (a “Right”) for each share of Entegris common stock owned on August 8, 2005. Each Rightentitles the holder to purchase one-hundredth of a share of a series of preferred stock at an exercise price of $50,subject to adjustment as provided in the Rights Plan. The Rights Plan is designed to protect Entegris’shareholders from attempts by others to acquire Entegris on terms or by using tactics that could deny allshareholders the opportunity to realize the full value of their investment. The Rights are attached to the shares ofour common stock until certain triggering events specified in the Rights Agreement occur, including, unless
14

approved by our board of directors, an acquisition by a person or group of specified levels of beneficialownership of our common stock or a tender offer for our common stock. Upon the occurrence of any of thesetriggering events, the Rights authorize the holders to purchase shares of our common stock at the then-currentexercise price having a value equal to twice the exercise price. The Rights are redeemable by us for $0.01 andwill expire on August 8, 2015. One of the events which will trigger the Rights is the acquisition, orcommencement of a tender offer, by a person (an Acquiring Person, as defined in the shareholder rights plan),other than Entegris or any of our subsidiaries or employee benefit plans, of 15% or more of the outstandingshares of our common stock. An Acquiring Person may not exercise a Right.
Entegris’ products are made from a wide variety of raw materials which are generally available in quantity fromalternate sources of supply. However, certain materials included in the Company’s products are obtained from asingle source or a limited group of suppliers. Although the Company seeks to reduce dependence on those soleand limited source suppliers, the partial or complete loss of these sources could have at least a temporary adverseeffect on the Company’s results of operations. Furthermore, a significant increase in the price of one or more ofthese components could adversely affect the Company’s results of operations.
OUR HISTORY
Effective August 6, 2005 Entegris, Inc., a Minnesota corporation, and Mykrolis Corporation, a Delawarecorporation, completed a strategic merger of equals transaction, pursuant to which they were each merged intothe Company to carry on the combined businesses. Pursuant to this merger each stockholder of EntegrisMinnesota received one share of Entegris for each Entegris Minnesota share held and each Mykrolis stockholderreceived 1.39 shares of Entegris for each Mykrolis share held. Our board of directors is comprised of fivedirectors from Entegris Minnesota and five directors from Mykrolis. Our management team is drawn from bothMykrolis and Entegris Minnesota. Our executive offices are located at 3500 Lyman Boulevard, Chaska,Minnesota 55318, and our telephone number is (952) 556-3131. Unless the context otherwise requires, the terms“Entegris”, “we”, “our”, or the “Company” mean Entegris, Inc., a Delaware corporation, and its subsidiaries; theterm “Mykrolis” means Mykrolis Corporation and its subsidiaries when referring to periods prior to August 6,2005; “Entegris Minnesota” means Entegris, Inc., a Minnesota corporation and its subsidiaries other thanEntegris when referring to periods prior to August 6, 2005; and the term “Merger” refers to the transactionseffected on August 6, 2005 in which Entegris Minnesota merged into Entegris, followed by the merger ofMykrolis into Entegris.
We were incorporated in Delaware in June 2005 under the name Eagle DE, Inc. as a wholly owned subsidiary ofEntegris Minnesota. Effective August 6, 2005 Entegris Minnesota merged into us in a reincorporation merger ofwhich we were the surviving corporation. Immediately following that merger, Mykrolis merged into us and ourname was changed to Entegris, Inc. Our stock is traded on the NASDAQ under the symbol “ENTG”.
Entegris Minnesota was incorporated in June 1999 to effect the business combination of Fluoroware, Inc., whichbegan operating in 1966, and EMPAK, Inc., which began operating in 1980. On July 10, 2000 EntegrisMinnesota completed an initial public offering of approximately 19% of the total shares of the Company’scommon stock outstanding.
Mykrolis was organized as a Delaware corporation on October 16, 2000 under the name MilliporeMicroElectronics, Inc. in connection with the spin-off by Millipore Corporation of its microelectronics businessunit. On March 31, 2001, Millipore effected the separation of the Mykrolis business from Millipore’s business bytransferring to Mykrolis substantially all of the assets and liabilities associated with its microelectronics business.On August 9, 2001 Mykrolis completed an initial public offering of approximately 18% of the total shares of theCompany’s common stock outstanding. On February 27, 2002, Millipore completed the spin-off of Mykrolis bydistributing to its stockholders the 82% of the Mykrolis common stock that it held following the Mykrolis initialpublic offering.
15
EXECUTIVE OFFICERS
The following is a list, as of December 31, 2006, of our Executive Officers. All of the Executive Officers listedbelow were elected to serve until the first Directors Meeting following the 2007 Annual Stockholders Meeting.As previously reported, John D. Villas announced his intent to retire from his post as Senior Vice President,Chief Financial Officer and Treasurer, in early 2007. Gregory B. Graves will assume responsibility for theposition vacated by Mr. Villas, in addition to continuing his duties as Senior Vice President Strategic Planning &Business Development.
Name Age OfficeFirst ElectedTo Office*
CORPORATE OFFICERS
Gideon Argov . . . . . . . . . . . . 50 President & Chief Executive Officer 2004
Jean-Marc Pandraud . . . . . . . 53 Executive Vice President and Chief Operating Officer 2001
Bertrand Loy . . . . . . . . . . . . . 41 Executive Vice President and Chief Administrative Officer 2001
John D. Villas . . . . . . . . . . . . 48 Senior Vice President and Chief Financial Officer, Treasurer 1997
Peter W. Walcott . . . . . . . . . . 60 Senior Vice President, Secretary & General Counsel 2001
Gregory B. Graves . . . . . . . . 46 Senior Vice President Strategic Planning & BusinessDevelopment
2002
John J. Murphy . . . . . . . . . . . 54 Senior Vice President Human Resources 2005
John Goodman . . . . . . . . . . . 46 Senior Vice President Chief Technology & Innovation Officer 2005
* With either the Company or a predecessor company
Gideon Argov has been our President and Chief Executive Officer and a director since the effectiveness of ourmerger with Mykrolis. He served as the Chief Executive Officer and a director of Mykrolis since November2004. Prior to joining Mykrolis, Mr. Argov was a Special Limited Partner at Parthenon Capital, a Boston-basedprivate equity partnership, since 2001. He served as Chairman, Chief Executive Officer and President ofKollmorgen Corporation from 1991 to 2000. From 1988 to 1991 he served as Chief Executive Officer of HighVoltage Engineering Corporation. Prior to 1988, he led consulting engagement teams at Bain and Company. Heis a director of Interline Brands, Inc. and Fundtech Corporation.
Jean-Marc Pandraud has been our Executive Vice President and Chief Operating Officer since the effectivenessof the merger with Mykrolis. He served as the President and Chief Operating Officer of Mykrolis since January2001. Prior to that he served as Vice President and General Manager of the Microelectronics Divisions ofMillipore, a position he had held since July 1999. From 1994 until 1999, Mr. Pandraud served as the VicePresident and General Manager of Millipore’s Laboratory Water Division and was also Regional Manager ofMillipore’s Latin American operations from 1997 until 1999. Mr. Pandraud also served as the Managing Directorof Millipore’s French subsidiary and as European General Manager for the Millipore Analytical Division from1988 until 1994.
Bertrand Loy has been our Executive Vice President and Chief Administrative Officer since the effectiveness ofthe merger with Mykrolis. He served as the Vice President and Chief Financial Officer of Mykrolis since January2001. Prior to that, Mr. Loy served as the Chief Information Officer of Millipore from April 1999 untilDecember 2000. From 1995 until 1999, he served as the Division Controller for Millipore’s Laboratory WaterDivision. From 1989 until 1995, Mr. Loy served Sandoz Pharmaceuticals (now Novartis) in a variety offinancial, audit and controller positions located in Europe, Central America and Japan.
John D. Villas has been our Senior Vice President and Chief Financial Officer since the effectiveness of themerger with Mykrolis. He served as the Chief Financial Officer of Entegris Minnesota since March 2000. Prior to
16
that time, Mr. Villas had been Chief Financial Officer of Fluoroware since November 1997 and Vice PresidentFinance since April 1994. Mr. Villas joined Fluoroware in 1984 as controller and then served as corporatecontroller between 1991 and 1994.
Peter W. Walcott has been our Senior Vice President, Secretary and General Counsel since the effectiveness ofthe merger with Mykrolis. He served as the Vice President, Secretary and General Counsel of Mykrolis sinceOctober 2000. Mr. Walcott served as the Assistant General Counsel of Millipore from 1981 until March 2001.
Gregory B. Graves has been our Senior Vice President Strategic Planning & Business Development since theeffectiveness of the merger with Mykrolis. Mr. Graves served as the Chief Business Development Officer ofEntegris Minnesota since September 2002 and from September 2003 until August 2004 he also served as SeniorVice President of Finance. Prior to joining Entegris Minnesota, Mr. Graves held positions in investment bankingand corporate development, including at U.S. Bancorp Piper Jaffray from June 1998 to August 2002. Mr. Gravesis a director of Therma-Wave, Inc.
Joseph J. Murphy joined us as our Senior Vice President Human Resources in October of 2005. He served as theSenior Vice President Human Resources of HNTB, an engineering and architectural services firm from February2004 until October 2005 and as Corporate Vice President Human Resources of Cadence Design Systems, Inc.from May of 2000 through October 2003. Prior to that Mr. Murphy held senior human resource positions withL.M. Ericsson Telephone Company and with General Electric Company.
John Goodman has been our Senior Vice President Chief Technology & Innovation Officer since theeffectiveness of the merger with Mykrolis. He served as the Managing Director of the fuel cell market sector ofEntegris Minnesota since January 2005 and prior to that as president of the fuel cell market sector since June2002. Mr. Goodman served as Executive Vice President and Chief Technology Officer of Entegris Minnesotafrom 1999 to 2002. Prior to that time, Mr. Goodman held a variety of positions with Fluoroware (a predecessor toEntegris Minnesota) since 1982.
AVAILABLE INFORMATION
Our Annual Report on Form 10-K, our quarterly reports on Form 10-Q and any current reports on Form 8-K thatwe may file or furnish to the S.E.C. pursuant to Sections 13(a) or 15(d) of the Securities Exchange Act of 1934 aswell as any amendments to any of those reports are available free of charge on or through our website as soon asreasonably practicable after we file them with or furnish them to the S.E.C. electronically. Our website is locatedat http://www.Entegris.com; these reports can be found under “Investor Relations—SEC Filings”. In addition, theSEC maintains a website containing these reports that can be located at http://www.sec.gov. These reports mayalso be read and copied at the SEC’s Public Reference Room at 450 Fifth Street, N.W., Washington, D.C. 20549.Information on the operation of the Public Reference Room may be obtained by calling the SEC at1-800-SEC-0330.
At their first meeting following the Merger, on August 10, 2005, our Board of Directors adopted a code ofbusiness ethics, The Entegris Code of Business Ethics, applicable to all of our executives, directors andemployees as well as a set of corporate governance guidelines. The Entegris Code of Business Ethics, theGovernance Guidelines and the charters for our Audit & Finance Committee, Governance & NominatingCommittee and of our Management Development & Compensation Committee all appear on our website athttp://www.Entegris.com under “Investor Relations—Governance”. The Governance Guidelines and committeecharters are also available in print to any shareholder that requests a copy. Copies may be obtained by contactingPeter W. Walcott, our Senior Vice President & General Counsel through our corporate headquarters.
17

Item 1A. Risk Factors.
Risks Relating to our Business and Industry
The semiconductor industry has historically been highly cyclical, and industry downturns reduce revenueand profits.
Our business depends on the purchasing patterns of semiconductor manufacturers, which, in turn, depend on thecurrent and anticipated demand for semiconductors and products utilizing semiconductors. The semiconductorindustry has historically been highly cyclical with periodic downturns, which often have resulted in decreasedexpenditures by semiconductor manufacturers. While over the past twelve quarters this cyclicality has moderatedsomewhat, there can be no assurance that the semiconductor industry will not return to the high cyclicality of thepast. Even this somewhat moderated cyclicality could cause our operating results to decline significantly fromone period to the next.
Furthermore, even in periods of reduced demand, we must continue to maintain a satisfactory level of researchand development expenditures and continue to invest in our infrastructure. At the same time, we have to manageour operations to be able to respond to significant increases in demand. In addition, because we typically do nothave significant backlog, changes in order patterns have a more immediate impact on our revenues. We expectthe semiconductor industry to continue to be cyclical. Any future downturns will reduce revenue and possiblyincrease pricing pressure, affecting both gross margin and net income. Such fluctuations in our results couldcause our share price to decline substantially. We believe that period-to-period comparisons of our results ofoperations may not be meaningful, and you should not rely upon them as indicators of our future performance.
The semiconductor industry is subject to rapid demand shifts which are difficult to predict. As a result,our inability to meet demand in response to these rapid shifts may cause a reduction in our market share.
Our ability to increase sales of our products, particularly our capital equipment products, depends in part uponour ability to ramp up the use of our manufacturing capacity for such products in a timely manner and tomobilize our supply chain. In order to meet the demands of our customers, we may be required to ramp up ourmanufacturing capacity in as little as a few months. If we are unable to expand our manufacturing capacity on atimely basis or manage such expansion effectively, our customers could seek such products from other suppliers,and our market share could be reduced. Because demand shifts in the semiconductor industry are rapid anddifficult to foresee, we may not be able to increase capacity quickly enough to respond to such an increase indemand.
Our annual and quarterly operating results are subject to fluctuations as a result of rapid demand shiftsand our insignificant level of backlog and if we fail to meet the expectations of securities analysts orinvestors, the market price of our securities may decrease significantly.
Our sales and profitability can vary significantly from quarter to quarter and year to year. Because our expenselevels are relatively fixed in the short-term, an unanticipated decline in revenue in a particular quarter coulddisproportionately affect our net income in that quarter. In addition, we make a substantial portion of ourshipments shortly after we receive the order, and therefore we operate with a relatively modest level of backlog.As a consequence of the just-in-time nature of shipments and the modest level of backlog, our results ofoperations may decline quickly and significantly in response to changes in order patterns or rapid decreases indemand for our products. We anticipate that fluctuations in operating results will continue in the future. Suchfluctuations in our results could cause us to fail to meet the expectations of securities analysts or investors, whichcould cause the market price of our securities to decline substantially. We believe that period-to-periodcomparisons of our results of operations may not be meaningful, and you should not rely upon them as indicatorsof our future performance.
18

We may not be able to accurately forecast demand for our products.
As noted above, we typically operate our business on a just-in-time shipment basis with a modest level ofbacklog and we order supplies and plan production based on internal forecasts of demand. Due to these factors,we have, in the past, and may again in the future, fail to accurately forecast demand for our products, in terms ofboth volume and specific products for which there will be demand. This has led to, and may in the future lead to,delays in product shipments, disappointment of customer expectations, or, alternatively, an increased risk ofexcess inventory and of inventory obsolescence. If we fail to accurately forecast demand for our products, ourbusiness, financial condition and operating results could be materially and adversely affected.
Semiconductor industry up-cycles may not reach historic levels but instead may reflect a lower rate oflong-term growth, similar to the electronics industry.
Notwithstanding the severe and prolonged downturn in the semiconductor industry and the related reduction inmanufacturing operations during the period 2001 to 2003, there may still be excess manufacturing capacity. Inaddition, there is no new high opportunity application to drive growth in the semiconductor industry, as was thecase in 1998 with telecommunications and internet applications. Accordingly, some analysts have predicted thatthe semiconductor industry may experience lower growth rates during a recovery cycle than has historically beenthe case and that its longer-term performance may reflect this lower growth rate, which would be similar to thegrowth rate of the electronics industry.
If we are unable to maintain our technological expertise in design and manufacturing processes, we willnot be able to successfully compete.
The microelectronics industry is subject to rapid technological change, changing customer requirements andfrequent new product introductions. Because of this, the life cycle of our products is difficult to determine. Webelieve that our future success will depend upon our ability to develop and provide products that meet thechanging needs of our customers, including the transition from the use of 200 millimeter wafers to 300millimeter wafers, the shrinking of integrated circuit line-widths and the use of new classes of materials, such ascopper, titanium nitride and organic and inorganic dielectric materials, which are materials that have either a lowor high resistance to the flow of electricity. This requires that we successfully anticipate and respond totechnological changes in manufacturing processes in a cost-effective and timely manner. Any inability to developthe technical specifications for any of our new products or enhancements to our existing products or tomanufacture and ship these products or enhancements in volume in a timely manner could harm our businessprospects and significantly reduce our sales. In addition, if new products have reliability or quality problems, wemay experience reduced orders, higher manufacturing costs, delays in acceptance and payment, additionalservice and warranty expense and damage to our reputation.
Because our sales are concentrated on a small number of key customers, our revenue and profitability maymaterially decline if one or more of our key customers do not continue to purchase our existing and newproducts in significant quantities.
We depend and expect to continue to depend on a limited number of customers for a large portion of ourbusiness, and changes in several customers’ orders could have had a significant impact on our operating results.If any one of our key customers decides to purchase significantly less from us or to terminate its relationship withus, our revenue and profitability may decline significantly. We could also lose our key customers or significantsales to our key customers because of factors beyond our control, such as a significant disruption in ourcustomers’ businesses generally or in a specific product line. These customers may stop incorporating ourproducts into their products with limited notice to us and suffer little or no penalty for doing so. In addition, ifany of our customers merge, we may experience lower overall sales from the merged companies. Because one ofour strategies has been to develop long-term relationships with a few key customers in the product areas in whichwe focus and because we have a long product design and development cycle for most of our products andprospective customers typically require lengthy product qualification periods prior to placing volume orders, wemay be unable to replace these customers quickly or at all.
19

Because we are subject to order and shipment uncertainties and many of our costs are fixed, anysignificant changes, cancellations or deferrals of orders or shipments could cause our revenue andprofitability to decline or fluctuate.
As is typical in the microelectronics industry, we do not usually obtain long-term purchase orders orcommitments from our customers. Instead, we work closely with our customers to develop non-binding forecastsof the future volume of orders. Customers may cancel their orders, change production quantities from forecastedvolumes or delay production for reasons beyond our control. Order cancellations or deferrals could cause us tohold inventory for longer than anticipated, which could reduce our profitability, restrict our ability to fund ouroperations and cause us to incur unanticipated reductions or delays in our revenue. Our customers often changetheir orders multiple times between initial order and delivery. Such changes usually relate to quantities ordelivery dates, but sometimes relate to the specifications of the products we are supplying. If a customer does nottimely pay for these products, we could incur significant charges against our income. In addition, our profitabilitymay be affected by the generally fixed nature of our costs. Because a substantial portion of our costs is fixed, wemay experience deterioration in gross margins when volumes decline. From time to time, we make capitalinvestments in anticipation of future business opportunities. If we are unable to obtain the anticipated business,our revenue and profitability may decline.
Competition from existing or new companies in the microelectronics industry could cause us to experiencedownward pressure on prices, fewer customer orders, reduced margins, the inability to take advantage ofnew business opportunities and the loss of market share.
We operate in a highly competitive industry. We compete against many domestic and foreign companies thathave substantially greater manufacturing, financial, research and development and marketing resources than wedo. In addition, some of our competitors may have more developed relationships with our existing customersthan we do, which may enable them to have their products specified for use more frequently by these customers.We also face competition from the manufacturing operations of our current and potential customers, whocontinually evaluate the benefits of internal manufacturing versus outsourcing. As more original equipmentmanufacturers dispose of their manufacturing operations and increase the outsourcing of their products to liquidand gas delivery system and other component companies, we may face increasing competitive pressures to growour business in order to maintain our market share. If we are unable to maintain our competitive position, wecould experience downward pressure on prices, fewer customer orders, reduced margins, the inability to takeadvantage of new business opportunities and a loss of market share.
Competition in the semiconductor and data storage materials integrity management fields could intensify,which may limit our ability to maintain and increase our market share and raise prices.
We face substantial competition from a number of companies, some of which have greater financial, marketing,manufacturing and technical resources. Larger providers of materials integrity management solutions andproducts could emerge, with potentially broader product lines. Larger competitors could spend more time andresources on research and development, which could give those competitors an advantage in meeting customerdemand. We expect that existing and new competitors will improve the design of their existing products and willintroduce new products with enhanced performance characteristics. The introduction of new products or moreefficient production of existing products by our competitors could diminish our market share and increase pricingpressure on our products. Further, customers continue to demand lower prices, shorter delivery times andenhanced product capability. If we do not respond adequately to such pressures, we could lose customers ororders. If we are unable to compete successfully, we could experience pricing pressures, reduced gross marginsand order cancellations.
Lack of market acceptance of our 300 mm shipper products as well as our other products could harm ouroperating results.
The growing trend toward the use of 300 mm wafers has contributed to the increasing complexity of thesemiconductor manufacturing process. The greater diameter of these wafers requires higher tooling costs and
20
presents more complex handling, storage and transportation challenges. We have made substantial investments tocomplete a full line of 300 mm wafer shipping products, but there is no guarantee that our customers will adoptour 300 mm wafer shipping product lines as they convert existing 200 mm wafer fabrication facilities to 300 mmwafer fabrication, or build new 300 mm wafer fabrication facilities and sales of our shipping products for theseapplications would be minimal and we might not recover our development costs.
Semiconductor and other electronic device manufacturers may direct semiconductor capital equipmentmanufacturers to use a specified supplier’s product in their equipment. Accordingly, our success depends in parton our ability to have semiconductor and other electronic device manufacturers specify that our products be usedat their fabrication facilities. Some of our competitors may have more developed relationships withsemiconductor and other electronic device manufacturers, which enable them to have their products specified foruse in manufacturers’ fabrication facilities.
We may acquire other businesses, form joint ventures or divest businesses that could negatively affect ourprofitability, increase our debt and dilute your ownership of our company.
As part of our business strategy, we have, and we expect to continue to address gaps in our product offerings,diversify into complementary product markets or pursue additional technology and customers throughacquisitions, joint ventures or other types of collaborations. We also expect to adjust our portfolio of businessesto meet our ongoing strategic objectives. As a result, we may enter markets in which we have no or limited priorexperience and may encounter difficulties in divesting businesses that no longer meet our objectives.Competition for acquiring attractive businesses in our industry is substantial. In executing this part of ourbusiness strategy, we may experience difficulty in identifying suitable acquisition candidates or in completingselected transactions at appropriate valuations. Alternatively, we may be required to undertake multipletransactions at the same time in order to take advantage of acquisition opportunities that do arise; this could strainour ability to effectively execute and integrate these transactions. We intend to pay for these acquisitions withcash and/or our common stock which could impair our liquidity and dilute your ownership of our company.Further, we may not be able to successfully integrate any acquisitions that we do make into our existing businessoperations and we could assume unknown or contingent liabilities or experience negative effects on our reportedresults of operations from dilutive results from operations and/or from future potential impairment of acquiredassets including goodwill related to future acquisitions. We may experience difficulties in operating in foreigncountries or over significant geographical distances and in retaining key employees or customers of an acquiredbusiness, and our management’s attention could be diverted from other business issues. We may not identify orcomplete these transactions in a timely manner, on a cost effective basis or at all, and we may not realize thebenefits of any acquisition or joint venture.
Manufacturing Risks
Our dependence on single and limited source suppliers could affect our ability to manufacture ourproducts.
We rely on single or limited source suppliers for some plastic polymers that are critical to the manufacturing ofour products. At times, we have experienced a limited supply of certain polymers as well as the need to substitutepolymers, resulting in delays, increased costs and the risks associated with qualifying new polymers with ourcustomers. An industry-wide increase in demand for these polymers could affect the ability of our suppliers toprovide sufficient quantities to us. If we are unable to obtain an adequate quantity of such supplies, ourmanufacturing operations may be interrupted.
In addition, suppliers may discontinue production of polymers specified in certain of our products, requiring us insome instances to certify an alternative with our customers. If we are unable to obtain an adequate quantity ofsuch supplies for any of the above reasons, our manufacturing operations may be affected. Obtaining alternativesources would likely result in increased costs and shipping delays, which could decrease profitability and damageour relationships with current and potential customers.
21
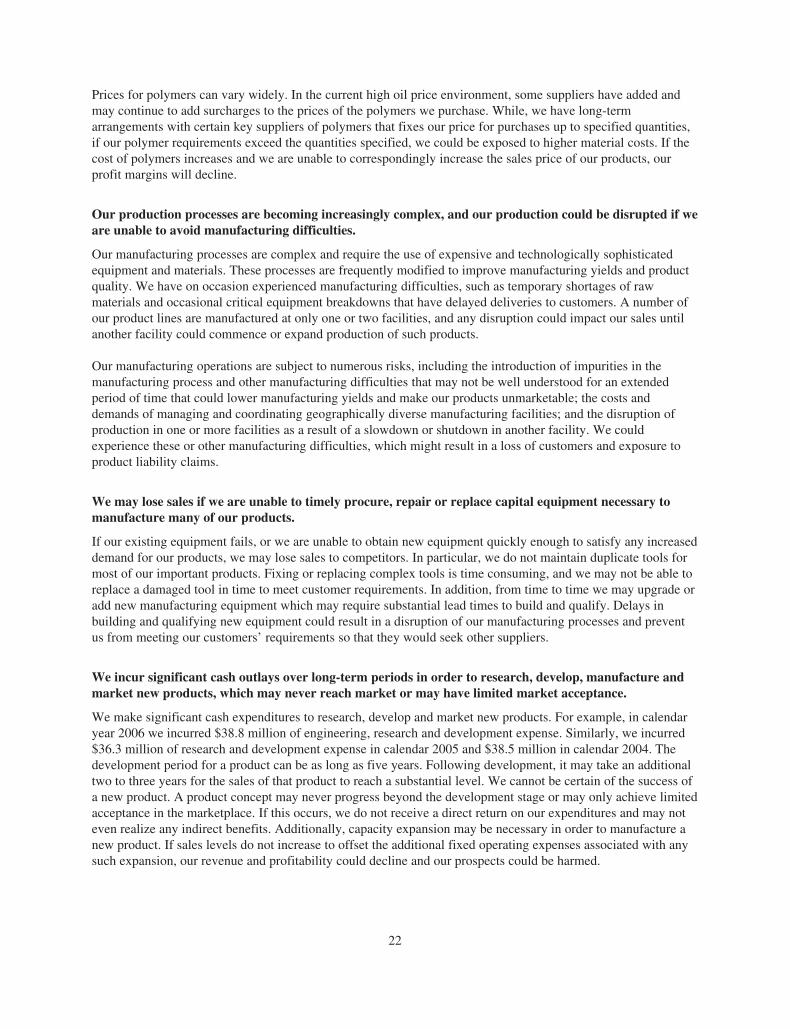
Prices for polymers can vary widely. In the current high oil price environment, some suppliers have added andmay continue to add surcharges to the prices of the polymers we purchase. While, we have long-termarrangements with certain key suppliers of polymers that fixes our price for purchases up to specified quantities,if our polymer requirements exceed the quantities specified, we could be exposed to higher material costs. If thecost of polymers increases and we are unable to correspondingly increase the sales price of our products, ourprofit margins will decline.
Our production processes are becoming increasingly complex, and our production could be disrupted if weare unable to avoid manufacturing difficulties.
Our manufacturing processes are complex and require the use of expensive and technologically sophisticatedequipment and materials. These processes are frequently modified to improve manufacturing yields and productquality. We have on occasion experienced manufacturing difficulties, such as temporary shortages of rawmaterials and occasional critical equipment breakdowns that have delayed deliveries to customers. A number ofour product lines are manufactured at only one or two facilities, and any disruption could impact our sales untilanother facility could commence or expand production of such products.
Our manufacturing operations are subject to numerous risks, including the introduction of impurities in themanufacturing process and other manufacturing difficulties that may not be well understood for an extendedperiod of time that could lower manufacturing yields and make our products unmarketable; the costs anddemands of managing and coordinating geographically diverse manufacturing facilities; and the disruption ofproduction in one or more facilities as a result of a slowdown or shutdown in another facility. We couldexperience these or other manufacturing difficulties, which might result in a loss of customers and exposure toproduct liability claims.
We may lose sales if we are unable to timely procure, repair or replace capital equipment necessary tomanufacture many of our products.
If our existing equipment fails, or we are unable to obtain new equipment quickly enough to satisfy any increaseddemand for our products, we may lose sales to competitors. In particular, we do not maintain duplicate tools formost of our important products. Fixing or replacing complex tools is time consuming, and we may not be able toreplace a damaged tool in time to meet customer requirements. In addition, from time to time we may upgrade oradd new manufacturing equipment which may require substantial lead times to build and qualify. Delays inbuilding and qualifying new equipment could result in a disruption of our manufacturing processes and preventus from meeting our customers’ requirements so that they would seek other suppliers.
We incur significant cash outlays over long-term periods in order to research, develop, manufacture andmarket new products, which may never reach market or may have limited market acceptance.
We make significant cash expenditures to research, develop and market new products. For example, in calendaryear 2006 we incurred $38.8 million of engineering, research and development expense. Similarly, we incurred$36.3 million of research and development expense in calendar 2005 and $38.5 million in calendar 2004. Thedevelopment period for a product can be as long as five years. Following development, it may take an additionaltwo to three years for the sales of that product to reach a substantial level. We cannot be certain of the success ofa new product. A product concept may never progress beyond the development stage or may only achieve limitedacceptance in the marketplace. If this occurs, we do not receive a direct return on our expenditures and may noteven realize any indirect benefits. Additionally, capacity expansion may be necessary in order to manufacture anew product. If sales levels do not increase to offset the additional fixed operating expenses associated with anysuch expansion, our revenue and profitability could decline and our prospects could be harmed.
22

We are subject to a variety of environmental laws which could cause us to incur significant expenses.
In addition to other regulatory requirements affecting our business, we are subject to a variety of federal, state,local and foreign regulatory requirements relating to the use, disposal, clean-up of, and human exposure to,hazardous chemicals. We generate and handle materials that are considered hazardous waste under applicablelaw. If we fail to comply with any present or future regulations, we could be subject to future liabilities or thesuspension of production. In addition, compliance with these or future laws could restrict our ability to expandour facilities or build new facilities or require us to acquire costly equipment, incur other significant expenses ormodify our manufacturing processes.
We are continually evaluating our manufacturing operations within our plants in order to achieveefficiencies and gross margin improvements. If we are unable to successfully manage transfers orrealignments of our manufacturing operations, our ability to deliver product to our customers could bedisrupted and our business, financial condition and results of operations could be adversely affected.
In order to enhance the efficiency and cost effectiveness of our manufacturing operations we expect to moveseveral product lines from one of our plants to another and to consolidate manufacturing operations in our plants.Our product lines involve technically complex manufacturing processes that require considerable expertise tooperate. If we are unable to effect these transfers, realignments and consolidations in a systematic manner withinestablished schedules or if we are unable to successfully operate relocated manufacturing processes in thedestination plant, production may be disrupted and we may not be able to deliver these products to meetcustomer orders in a timely manner, which could harm our business.
Loss of our key personnel could hurt our business because of their experience in the microelectronicsindustry and their technological expertise. Similarly, our inability to attract and retain new qualifiedpersonnel could inhibit our ability to operate and grow our business successfully.
We depend on the services of our key senior executives and other technological experts because of theirexperience in the microelectronics industry and their technical expertise. The loss of the services of one orseveral of our key employees or an inability to attract, train and retain qualified and skilled employees,specifically research and development and engineering personnel, could result in the loss of customers orotherwise inhibit our ability to operate and grow our business successfully. In the past, during the extendeddownturn in the semiconductor industry our predecessor companies have had to impose salary reductions onsenior employees and freeze or eliminate merit increases in an effort to maintain its financial position. Similarly,changes in accounting rules requiring fair value accounting for stock options will make it more expensive toprovide our employees with equity incentives, which may require us to reduce the level of equity compensation.These actions may have an adverse effect on employee loyalty and may make it more difficult for us to attractand retain key personnel.
If we are unable to protect our intellectual property rights, our business and prospects could be harmed.
Our future success and competitive position depend in part upon our ability to obtain and maintain proprietarytechnology used in our principal product families. We rely, in part, on patent, trade secret and trademark law toprotect that technology. We routinely enter into confidentiality agreements with our employees. However, therecan be no assurance that these agreements will not be breached, that we will have adequate remedies for anybreach or that our confidential and proprietary information and technology will not be independently developedby or become otherwise known to third parties. We have obtained a number of patents relating to our productsand have filed applications for additional patents. We cannot assure you that any of our pending patentapplications will be approved, that we will develop additional proprietary technology that is patentable, that anypatents owned by or issued to us will provide us with competitive advantages or that these patents will not bechallenged by third parties. Patent filings by third parties, whether made before or after the date of our filings,could render our intellectual property less valuable. Competitors may misappropriate our intellectual property,and disputes as to ownership of intellectual property may arise. In addition, if we do not obtain sufficient
23

international protection for our intellectual property, our competitiveness in international markets could besignificantly impaired, which would limit our growth and future revenue. Furthermore, there can be no assurancethat third parties will not design around our patents.
Protection of our intellectual property rights has and may continue to result in costly litigation.
We may from time to time be required to institute litigation in order to enforce our patents, copyrights or otherintellectual property rights, to protect our trade secrets, to determine the validity and scope of the proprietaryrights of others or to defend against claims of infringement. Such litigation could result in substantial costs anddiversion of resources and could negatively affect our sales, profitability and prospects regardless of whether weare able to successfully enforce our rights. For example, as described in Item 3. “Legal Proceedings” below weare engaged in multiple patent litigations with Pall Corporation. We intend to prosecute and defend these casesvigorously and expect that these lawsuits will continue for extended periods of time and that we will incursubstantial costs in pursuing them. In addition it may become necessary for us to initiate other costly patentlitigation against this or other competitors in order to protect and/or perfect our intellectual property rights.
If we infringe on the proprietary technology of others, our business and prospects could be harmed.
Our commercial success will depend, in part, on our ability to avoid infringing or misappropriating any patents orother proprietary rights owned by third parties. If we are found to infringe or misappropriate a third party’s patentor other proprietary rights, we could be required to pay damages to such third party, alter our products orprocesses, obtain a license from the third party or cease activities utilizing such proprietary rights, includingmaking or selling products utilizing such proprietary rights. If we are required to obtain a license from a thirdparty, there can be no assurance that we will be able to do so on commercially favorable terms, if at all.
International Risks
We conduct a significant amount of our sales activity and manufacturing efforts outside the United States,which subjects us to additional business risks and may cause our profitability to decline due to increasedcosts.
Sales to customers outside the United States accounted for approximately 71% of our net sales in each ofcalendar 2006, 2005 and 2004. We anticipate that international sales will continue to account for a majority ofour net sales. In addition, a number of our key domestic customers derive a significant portion of their revenuesfrom sales in international markets. We also manufacture a significant portion of our products outside the UnitedStates and are dependent on international suppliers for many of our parts. We intend to continue to pursueopportunities in both sales and manufacturing internationally. Our international operations are subject to anumber of risks and potential costs that could adversely affect our revenue and profitability, including:
• unexpected changes in regulatory requirements that could impose additional costs on our operations orlimit our ability to operate our business;
• greater difficulty in collecting our accounts receivable and longer payment cycles than is typical indomestic operations;
• changes in labor conditions and difficulties in staffing and managing foreign operations;
• liability for foreign taxes assessed at rates higher than those applicable to our domestic operations; and
• political and economic instability.
In the past, we have incurred costs or experienced disruptions due to the factors described above and expect to doso in the future. For example, our operations in Asia, and particularly Korea, Taiwan and Japan, have beennegatively impacted in the past as a result of regional economic instability. In addition, Taiwan and Koreaaccount for a growing portion of the world’s semiconductor manufacturing. There are currently strained relations
24

between China and Taiwan and there are continuing tensions between North Korea, and South Korea, Japan andthe United States. Any adverse developments in those relations could significantly disrupt the worldwideproduction of semiconductors, which would lead to reduced sales of our products.
Fluctuations in the value of the U.S. dollar in relation to other currencies may lead to lower net income ormay cause us to raise prices, which could result in reduced net sales.
Foreign currency exchange rate fluctuations could have an adverse effect on our net sales and results ofoperations. Unfavorable foreign currency fluctuations against the U.S. dollar could require us to increase pricesto foreign customers, which could result in lower net sales by us to such customers. Alternatively, if we do notadjust the prices for our products in response to unfavorable foreign currency fluctuations, our profitability coulddecline. In addition, sales made by our foreign subsidiaries usually will be denominated in the currency of thecountry in which these products are sold, and the currency we receive in payment for such sales could be lessvaluable at the time of receipt versus the time of sale as a result of foreign currency exchange rate fluctuations.
We may have exposure to income tax rate fluctuations as well as to additional tax liabilities, which wouldimpact our financial position.
As a corporation with operations in the United States as well as in numerous countries abroad, we are subject toincome taxes in the United States as well as in various foreign jurisdictions. Our effective tax rate is subject tofluctuation as the income tax rates for each year will be determined by the following factors, among others:
• The mix of profits and/or losses earned by us and our subsidiaries in various foreign tax jurisdictionswith a broad range of income tax rates;
• Our ability to utilize recorded deferred tax assets as well as tax holiday provisions available to us incertain jurisdictions;
• Changes in contingencies related to taxes, interest or penalties resulting from tax audits; and
• Changes in tax laws or the interpretation of such laws.
Changes in the mix of these items and other items could cause our effective tax rate to fluctuate between periods,which could have a material adverse effect on our financial position. Significant judgment is required indetermining our provision for income taxes and other tax liabilities. Although we believe that our tax estimatesare reasonable, we cannot assure you that the final determination of tax audits or tax disputes will not be differentfrom what is reflected in our historical income tax provisions and accruals.
An increased concentration of wafer manufacturing in Japan could result in lower sales of our wafershipper products.
A large percentage of the world’s 300 mm wafer manufacturing currently takes place in Japan. Our market sharein Japan is currently lower than in other regions we serve. If we are not able to successfully operate ourmanufacturing capability and increase market share in Japan, we might not be able to maintain our global marketshare in wafer shipper products, especially if 300 mm wafer manufacturing in Japan increases.
Terrorist attacks, such as the attacks that occurred in New York and Washington, D.C. on September 11,2001, and other acts of violence or war may affect the markets in which we operate and hurt ourprofitability.
Terrorist attacks may negatively affect our operations and your investment. There can be no assurance that therewill not be further terrorist attacks against the United States or United States businesses. These attacks or armedconflicts may directly impact our physical facilities or those of our suppliers or customers. Our primary facilitiesinclude headquarters, research and development and manufacturing facilities in the United States, sales, researchand development and manufacturing facilities in Japan and Malaysia, and sales and service facilities in Europe
25

and Asia. Also these attacks have disrupted the global insurance and reinsurance industries with the result that wemay not be able to obtain insurance at historical terms and levels for our facilities. Furthermore, these attacksmay make travel and the transportation of our supplies and products more difficult and more expensive and mayultimately affect the sales of our products in the United States and overseas. As a result of terrorism the UnitedStates may enter into additional armed conflicts, which could have a further impact on our domestic andinternational sales, our supply chain, our production capacity and our ability to deliver products to our customers.The consequences of these armed conflicts and instability are unpredictable and we may not be able to foreseeevents that could have an adverse effect on our business and your investment.
Risks Related to the Securities Markets and Ownership of our Securities
Because of the past volatility of the stock price of Entegris Minnesota and Mykrolis, the price of ourcommon stock in the future may likewise be volatile so that the ability to trade our common shares may beadversely affected and our ability to raise capital through future equity financing may be reduced.
The stock prices of both of our predecessor companies have been volatile in the past and the price of ourcommon stock may be volatile in the future. For example: in fiscal year 2006, the closing price of our stock onthe NASDAQ National Market ranged from a low of $8.45 to a high $11.92.
The trading price of our common shares is subject to wide fluctuations in response to various factors, some ofwhich are beyond our control, including factors discussed elsewhere in this report and including the following:the failure to meet the published expectations of securities analysts; changes in financial estimates by securitiesanalysts; press releases or announcements by, or changes in market values of, comparable companies; volatilityin the markets for high technology stocks, general stock market price and volume fluctuations, which areparticularly common among securities of high technology companies; stock market price and volumefluctuations attributable to inconsistent trading volume levels; additions or departures of key personnel; andinvolvement in or adverse results from litigation. These market fluctuations may cause the trading price of ourcommon stock to decrease.
Recently enacted changes in the securities laws and regulations are likely to increase our costs.
The Sarbanes-Oxley Act of 2002 has required changes in some of our corporate governance, securities disclosureand compliance practices. In response to the requirements of that Act, the Securities and Exchange Commissionand the NASDAQ have promulgated new rules and listing standards covering a variety of subjects. Compliancewith these new rules and listing standards has increased our legal and financial and accounting costs, and weexpect these increased costs to continue indefinitely. We also expect these developments to make it moredifficult and more expensive for us to obtain director and officer liability insurance, and we may be forced toaccept reduced coverage or incur substantially higher costs to obtain coverage. Likewise, these developmentsmay make it more difficult for us to attract and retain qualified members of our board of directors, particularlyindependent directors, or qualified executive officers.
If we fail to maintain an effective system of internal controls, we may not be able to accurately report ourfinancial results. As a result, current and potential stockholders could lose confidence in our financialreporting, which would harm our business and the trading price of our stock.
Effective internal controls are necessary for us to provide reliable financial reports. If we cannot provide reliablefinancial reports, our business and operating results could be harmed. We have in the past discovered, and may inthe future discover, areas of our internal controls that need improvement. For example, during the fiscal 2005year-end audit, a material weakness in internal control over financial reporting was identified; specifically we didnot have effective policies and procedures, or personnel with sufficient knowledge of accounting forcompensation related matters in purchase accounting transactions, to ensure that such transactions wereaccounted for in accordance with generally accepted accounting principles. This material weakness represented
26
more than a remote likelihood that a material misstatement of the Company’s annual or interim financialstatements would not have been prevented or detected. The impact of this adjustment did not require therestatement of any of our financial statements. Remediation actions with respect to this material weakness havebeen completed.
In 2006, management conducted an evaluation of the effectiveness of the Company’s internal control overfinancial reporting based on the framework in Internal Control—Integrated Framework issued by the Committeeof Sponsoring Organizations of the Treadway Commission (“COSO”). Based on this evaluation, managementconcluded that the Company’s internal control over financial reporting was not effective due to the materialweakness related to our accounting for income taxes. A material weakness in internal control over financialreporting is a significant deficiency, or combination of significant deficiencies, that results in more than a remotelikelihood that a material misstatement of the annual or interim financial statements will not be prevented ordetected. The Company plans to conduct remediation efforts throughout 2007 to address this material weakness.
Any failure to implement and maintain the improvements in the controls over our financial reporting, ordifficulties encountered in the implementation of these improvements in our controls, could cause us to fail tomeet our reporting obligations. Any failure to improve our internal controls to address the identified materialweakness could also cause investors to lose confidence in our reported financial information, which could have anegative impact on the trading price of our stock. There can be no assurance that we will not discover materialweaknesses in our internal control over financial reporting in the future.
Changes to financial accounting standards may affect our reported results of operations and could resultin a decrease in the value of your shares.
With the commencement of effectiveness of the requirement that employee stock option and employee stockpurchase plan shares should be treated as a compensation expense using the fair value method, we will incursignificant compensation charges and our results of operations could be adversely affected.
Provisions in our charter documents, Delaware law and our shareholder rights plan may delay or preventan acquisition of us, which could decrease the value of your shares.
Our certificate of incorporation and By-Laws, Delaware law and our shareholder rights plan contain provisionsthat could make it harder for a third party to acquire us without the consent of our board of directors. Theseprovisions include limitations on actions by our stockholders by written consent. In addition, our board ofdirectors has the right to issue preferred stock without stockholder approval, which could be used to dilute thestock ownership of a potential hostile acquirer. Our shareholder rights plan will permit our stockholders topurchase shares of our common stock at a 50% discount upon the occurrence of specified events, including theacquisition by anyone of 15% or more of our common stock, unless such event is approved by our board ofdirectors. Delaware law also imposes restrictions on mergers and other business combinations between us andany holder of 15% or more of our outstanding common stock. Although we believe these provisions provide foran opportunity to receive a higher bid by requiring potential acquirers to negotiate with our board of directors,these provisions apply even if the offer may be considered beneficial by stockholders. If a change of control orchange in management is delayed or prevented, the market price of our common stock could suffer.
Your percentage ownership in us may be diluted by future issuances of capital stock, which could reduceyour influence over matters on which stockholders vote.
Subject to applicable NASDAQ standards, our board of directors has the authority, without action or vote of ourstockholders, to issue all or any part of our authorized but unissued shares. Issuances of common stock or theexercise of employee and director stock options would dilute your percentage ownership interest, which willhave the effect of reducing your influence over matters on which our stockholders vote. In addition, we mayissue substantial quantities of our common stock in order to effect acquisitions which will also dilute yourownership interest. If the issuances are made at prices that reflect a discount from the then current trading priceof our common stock, your interest in the book value of our common stock might be diluted.
27

Item 1B. Unresolved Staff Comments.
Not Applicable.
Item 2. Properties.
Our principal executive offices are located in Chaska, Minnesota. We also have manufacturing, design andequipment cleaning facilities in the United States, Japan, France and Malaysia. Information about our principalfacilities is set forth below:
Location Principal FunctionApproximateSquare Feet Leased/Owned
Chaska, Minnesota . . . . . . . . . . . Executive Offices, Research & Manufacturing 370,000 OwnedBillerica, Massachusetts . . . . . . . Executive Offices, Research & Manufacturing 175,000 Leased(1)
Colorado Springs, Colorado . . . . Manufacturing 82,000 OwnedGilroy, California . . . . . . . . . . . . Manufacturing; Cleaning Services 60,000 Owned/LeasedMontpellier, France . . . . . . . . . . . Cleaning Services 53,000 OwnedYonezawa, Japan . . . . . . . . . . . . Manufacturing 196,000 OwnedKulim, Malaysia . . . . . . . . . . . . . Manufacturing 195,000 Owned
(1) This lease expires March 31, 2014, but is subject to two five-year renewal options.
We lease approximately 4,200 square feet of manufacturing space in Millipore’s facility located at 80 AshbyRoad, Bedford, MA pursuant to an Amended and Restated Membrane Manufacturing and Supply Agreement thatexpires December 31, 2010. We also lease approximately 21,000 square feet of research and development andmanufacturing space in two buildings located in San Diego, California, which was assumed pursuant to theMykrolis acquisition of Aeronex, Inc. in 2004. Approximately 31,000 square feet of office, research anddevelopment and manufacturing space located in Franklin, MA was assumed pursuant to the Mykrolisacquisition of Extraction Systems, Inc. in 2005. The leases for this space run for a term of approximately twoyears.
We maintain a worldwide network of sales, service, repair and cleaning centers in the United States, Germany,France, Japan, Taiwan, Singapore, China (Shanghai) and Korea. Leases for our facilities expire between October2008 and March 2014. We currently expect to be able to extend the terms of expiring leases or to find suitablereplacement facilities on reasonable terms.
We believe that our facilities are well-maintained and, except as described above, suitable for their respectiveoperations. Except for approximately 15,000 square feet in our Billerica facility and 90,000 square feet in ourKulim, Malaysia facility, all of our facilities are fully utilized.
Item 3. Legal Proceedings.
The following discussion provides information regarding certain litigation to which the Company was a partythat were pending as of December 31, 2006.
As previously disclosed, on March 3, 2003 the Company’s predecessor, Mykrolis Corporation, filed a lawsuitagainst Pall Corporation in the United States District Court for the District of Massachusetts alleginginfringement of two of the Company’s U.S. patents by certain fluid separation systems and related assembliesused in photolithography applications manufactured and sold by the defendant. The Company’s lawsuit alsosought a preliminary injunction preventing the defendant from the manufacture, use, sale, offer for sale orimportation into the U.S. of any infringing product. On April 30, 2004, the Court issued a preliminary injunctionagainst Pall Corporation and ordered Pall to immediately stop making, using, selling, or offering to sell withinthe U.S., or importing into the U.S., its PhotoKleen EZD-2 Filter Assembly products or “any colorable imitation”of those products. On January 18, 2005, the Court issued an order holding Pall Corporation in contempt of court
28

for the violation of the preliminary injunction and ordering Pall to disgorge all profits earned from the sale of itsPhotoKleen EZD-2 Filter Assembly products and colorable imitations thereof from the date the preliminaryinjunction was issued through January 12, 2005. In addition, Pall was also ordered to reimburse Mykrolis forcertain of its attorney’s fees associated with the contempt and related proceedings. The Court’s order alsodissolved the preliminary injunction, effective January 12, 2005, based on certain prior art cited by Pall which italleged raised questions as to the validity of the patents in suit. On February 17, 2005, the Company filed noticeof appeal to the U.S. Circuit Court of Appeals for the Federal Circuit appealing the portion of the Court’s orderthat dissolved the preliminary injunction and Pall filed a notice of appeal to that court with respect to the findingof contempt and the award of attorneys’ fees; these cross appeals are pending.
On April 6, 2006 the Company filed a lawsuit against Pall Corporation in the United States District Court for theDistrict of Massachusetts alleging infringement of the Company’s newly issued U.S. patent No. 7,021,667 bycertain filter assembly products used in photolithography applications that are manufactured and sold by thedefendant. The Company’s lawsuit also seeks a preliminary injunction preventing the defendant from themanufacture, use, sale, offer for sale or importation into the U.S. of the infringing products. On October 23, 2006the Company’s motion for preliminary injunction was argued before the court; a decision on this motion ispending.
On August 23, 2006 the Company filed a lawsuit against Pall Corporation in the United States District Court forthe District of Massachusetts alleging infringement of the Company’s newly issued U.S. patent No. 7,037,424 bycertain fluid separation modules and related separation apparatus, including the product known as the EZD-3Filter Assembly, used in photolithography applications that are manufactured and sold by the defendant. It isbelieved that the EZD-3 Filter Assembly was introduced into the market by the defendant in response to theaction brought by the Company in March of 2003 as described above. This case is currently in the preliminarystages.
As previously disclosed, on December 16, 2005 Pall Corporation filed suit against the Company in U.S. DistrictCourt for the Eastern District of New York alleging patent infringement. Specifically, the suit allegesinfringement of two of plaintiff’s patents by certain of the Company’s filtration products. Both products and theirpredecessor products have been on the market for a number of years and one is covered by patents held by theCompany. The Company intends to vigorously defend this suit and believes that it will ultimately prevail. Thiscase is currently in the discovery stage.
Item 4. Submission of Matters to a Vote of Security Holders.
None.
29

PART II
Item 5. Market for Entegris’ Common Stock, Related Stockholder Matters and Issuer Purchases ofEquity Securities.
Entegris’ Common Stock, $0.01 par value, trades on the NASDAQ National Market System (NMS) under thesymbol “ENTG”; prior to the Merger, Entegris Minnesota’s shares traded on the NMS under the same symbol.The following table sets forth the highest and lowest sale prices of the Company shares during fiscal 2006 andduring the four month Transition Period and the highest and lowest sale process of Entegris Minnesota shares atthe close of each day, as reported by the NASDAQ-NMS, for the fiscal periods indicated. As of February 6, 2007there were 881 shareholders of record.
Fiscal 2006Transition 2005
(8/28/05-12/31/05) Fiscal 2005
High Low High Low High Low
First quarter . . . . . . . . . . . . . . . . . . . . . . . . . . . . . . . . . . . . . . $11.01 $9.54 — — $ 9.91 $7.67Second quarter . . . . . . . . . . . . . . . . . . . . . . . . . . . . . . . . . . . . $11.83 $9.33 — — $10.41 $8.40Third quarter . . . . . . . . . . . . . . . . . . . . . . . . . . . . . . . . . . . . . $11.07 $8.45 $11.58 $10.19 $ 9.99 $8.24Fourth quarter . . . . . . . . . . . . . . . . . . . . . . . . . . . . . . . . . . . . $11.92 $9.57 $11.55 $ 9.42 $11.88 $9.50
The Company has never declared or paid any cash dividends on its capital stock. The Company currently intendsto retain all available earnings for use in its business or for share repurchase programs and does not anticipatepaying any cash dividends in the foreseeable future. On July 27, 2005 the Entegris Board of Directors declared adividend of one preferred share purchase right for each share of Entegris Common Stock outstanding toshareholders of record on August 8, 2005, payable on August 8, 2005. For a description of the Share Rights Plansee “Other Information” in Item 1 above. Each right entitles the holder to purchase one-hundredth of a preferredshare of Entegris at a price of $50.
30

Comparative Stock Performance
The following graph compares the cumulative total shareholder return on the common stock of EntegrisMinnesota and the Company from August 26, 2001 through December 31, 2006 with cumulative total return of(1) The NASDAQ Composite Index, (2) The Philadelphia Semiconductor Index and (3) a self-constructed peergroup of companies. The peer group companies are: ATMI, Inc., Advanced Energy Industries, Inc., BrooksAutomation, Inc., Electro Scientific Industries, Inc., FSI International, Inc., MKS Instruments, Inc. andPhotronics, Inc. Prior to fiscal 2006 Helix Technology Corporation and prior to fiscal 2005, Nortem TechnologyN.V. (formerly Metron Technology N.V.) and DuPont Photomasks, Inc. had been included in this peer group;however, they have been removed due to the fact that they were acquired by other companies during theCompany’s year ended August 27, 2005 and are no longer U.S. public reporting companies. Since consolidationhas rendered the above peer group a small sample, the Company intends to drop this peer group from thecomparison next year and to substitute the Philadelphia Semiconductor Index.
The graph assumes $100 was invested at the close of trading August 26, 2001 in Entegris, Inc. common stock,the NASDAQ Composite Index the Philadelphia Semiconductor Index and the peer group index listed above andthat all dividends are reinvested.
Comparison of 5 Year Cumulative Total ReturnAssumes Initial Investment of $100
August 2001 – December 2006
2001 2002 2003 2004 2005 20060.00
20.00
40.00
60.00
80.00
100.00
120.00
140.00
ENTEGRIS INC NASDAQ Composite - Total Returns Philadelphia Semiconductor Index PEER
August 26,2001
August 31,2002
August 30,2003
August 28,2004
August 27,2005
December 31,2006
Entegris, Inc. . . . . . . . . . . . . . . . . . . . . . 100.00 93.97 117.23 90.77 85.93 98.70NASDAQ Composite . . . . . . . . . . . . . . . 100.00 68.76 103.68 113.18 115.57 128.38Phila. Semi. Index . . . . . . . . . . . . . . . . . . 100.00 55.39 97.31 82.98 91.83 89.44Peer Group . . . . . . . . . . . . . . . . . . . . . . . . 100.00 53.99 84.56 63.77 64.91 71.53
31
Purchases of Equity Securities by the Company
The following table provides information concerning shares of the Company’s Common Stock $0.01 par valuepurchased during the year ended December 31, 2006.
Period
(a)Total Number
of SharesPurchased(1)
(b)Average
Price Paidper Share
(c)Total Number ofShares Purchasedas Part of PubliclyAnnounced Plans
or Programs
(d)Maximum Number
(or ApproximateDollar Value) ofShares that May
Yet Be PurchasedUnder the Plans or
Programs(5)(7)
September 2006 . . . . . . . . . . . . . . . . . . . . . . . . . . . 7,653,712(2) $11.1592(3)(4) 7,653,712 $50,000,000October 2006 . . . . . . . . . . . . . . . . . . . . . . . . . . . . . 1,226,456 $11.8965(6) 1,226,456 $50,000,000November 2006 . . . . . . . . . . . . . . . . . . . . . . . . . . . — — — —December 2006 . . . . . . . . . . . . . . . . . . . . . . . . . . . — — — —Total . . . . . . . . . . . . . . . . . . . . . . . . . . . . . . . . . . . 8,880,168 $11.2610(3)(4) 8,880,168 $50,000,000
(1) The Company announced on August 31, 2006, a plan to repurchase up to $150,000,000 of its outstandingcommon stock over a twelve to eighteen month period, $50,000,000 of this stock repurchase program to bepursuant to an Accelerated Stock Buyback Agreement with Goldman Sachs & Co.(ASRA), $50,000,000 tobe pursuant to a Collared Accelerated Stock Buyback Agreement with Goldman Sachs & Co.(CASRA) and$50,000,000 pursuant to a Rule 10b5-1 trading plan to be established by the Company after the completionof the ASRA and the CASRA.
(2) Includes 4,677,268 shares received on September 5, 2006 pursuant to the ASRA and 2,976,444 sharesreceived on September 5, 2006 pursuant to the CASRA.
(3) Based on an average purchase price of $10.6900 per share for shares received pursuant to the ASRA,calculated as of September 5, 2006. The Company’s per share purchase price pursuant to the ASRA may beadjusted as of September 4, 2007, based on the volume-weighted average trading price of the stock throughthat date.
(4) Based on an average purchase price $11.8965 for all shares received pursuant to the CASRA as ofOctober 6, 2006. The Company may receive additional shares pursuant to the CASRA at no additional costdepending on movements in the market price of the Company’s common stock through September 4, 2007.
(5) The Company made initial payments totaling $100,000,000 to Goldman Sachs under the ASRA and theCASRA. The Company has not repurchased any of its own shares except for those shares acquired pursuantto the ASRA and CASRA and currently has $50,000,000 remaining available for repurchases pursuant tothe plan. The total purchase price under the ASRA is subject to adjustment as of September 4, 2007 asdescribed in footnote (3) above. The $50,000,000 reserve for future repurchases may be used to make anyadditional payments to Goldman Sachs required under the ASRA (described in footnote (3) above) or torepurchase additional shares pursuant to an SEC Rule 10b5-1 Plan to be established by the Company.
(6) The per share purchase price is calculated by dividing the $50,000,000 paid pursuant to the CASRA by thetotal number of shares delivered pursuant to the CASRA to date, 2,976,444 shares received on September 5,2006 and 1,226,456 shares received on October 6, 2006.
(7) The Company may receive up to 933,978 additional shares at no additional cost pursuant to the CASRA,pending the adjustment described in footnote (4) above.
32

Item 6. Selected Financial Data
The table that follows presents selected financial data for each of the last five fiscal years and four months endedDecember 31, 2005 from the Company’s consolidated financial statements and should be read in conjunctionwith the Company’s Consolidated Financial Statements and the related Notes and with “Management’sDiscussion and Analysis of Financial Condition and Results of Operations” included elsewhere in this Form10-K Report.
On December 13, 2005, the Company’s board of directors approved a change in fiscal year end from a 52-weekor 53-week fiscal year period ending on the last Saturday of August to December 31, effective as ofDecember 31, 2005.
(In thousands, except per share amounts)
Year endedDecember 31,
2006
Four monthsended
December 31,2005
Yearended
August 27,2005
Year endedAugust 28,
2004
Year endedAugust 30,
2003
Year endedAugust 31,
2002
Operating ResultsNet sales . . . . . . . . . . . . . . . . . . . . . . $678,706 $202,296 $358,033 $337,154 $246,751 $222,997Gross profit . . . . . . . . . . . . . . . . . . . 306,149 69,964 139,590 150,259 98,036 88,706Selling, general and administrative
expenses . . . . . . . . . . . . . . . . . . . . 189,772 77,788 111,647 93,335 78,797 73,569Engineering, research and
development expenses . . . . . . . . . 38,830 13,914 18,482 18,813 17,370 17,408Operating profit (loss) . . . . . . . . . . . 77,547 (21,738) 9,461 38,111 271 (3,834)Income (loss) before income taxes
and equity in affiliate earnings . . 88,410 (19,360) 14,114 39,460 (3,416) (1,395)Income tax expense (benefit) . . . . . . 26,505 (9,009) 1,081 12,464 (5,717) (3,373)Income (loss) from continuing
operations . . . . . . . . . . . . . . . . . . . 62,436 (10,281) 12,786 26,983 2,157 2,776Net income (loss) . . . . . . . . . . . . . . . $ 63,466 $ (18,324) $ 9,393 $ 24,770 $ 1,275 $ 2,776
Earnings Per Share DataDiluted earnings (loss) per share—
continuing operations . . . . . . . . . . $ 0.45 $ (0.08) $ 0.16 $ 0.35 $ 0.03 $ 0.04Weighted average shares
outstanding—diluted . . . . . . . . . . 138,492 135,437 79,328 76,220 74,475 74,170
Operating Ratios—% of net salesGross profit . . . . . . . . . . . . . . . . . . . 45.1% 34.6% 39.0% 44.6% 39.7% 39.8%Selling, general and administrative
expenses . . . . . . . . . . . . . . . . . . . . 28.0 38.5 31.2 27.7 31.9 33.0Engineering, research and
development expenses . . . . . . . . . 5.7 6.9 5.2 5.6 7.0 7.8Operating profit (loss) . . . . . . . . . . . 11.4 (10.7) 2.6 11.3 0.1 (1.7)Income (loss) before income taxes
and other items . . . . . . . . . . . . . . . 13.0 (9.6) 3.9 11.7 (1.4) (0.6)Effective tax rate(1) . . . . . . . . . . . . . . 30.0 46.5 7.7 31.6 167.4 241.8Net income . . . . . . . . . . . . . . . . . . . . 9.4 (9.1) 2.6 7.3 0.5 1.2
33

(In thousands, except per share amounts)
Year endedDecember 31,
2006
Four monthsended
December 31,2005
Year endedAugust 27,
2005
Year endedAugust 28,
2004
Year endedAugust 30,
2003
Year endedAugust 31,
2002
Cash Flow Statement DataDepreciation and amortization . . . $ 43,661 $ 14,049 $ 24,475 $ 24,566 $ 26,535 $ 28,164Capital expenditures . . . . . . . . . . . 29,975 10,311 19,559 19,963 13,899 19,568Net cash provided by operating
activities . . . . . . . . . . . . . . . . . . 95,869 23,390 50,772 50,177 33,438 32,861Net cash provided by (used in)
investing activities . . . . . . . . . . (16,485) (13,116) 58,720 (87,227) (38,121) (38,333)Net cash provided by (used in)
financing activities . . . . . . . . . . (80,037) (15,432) 3,066 1,835 10,706 5,619
Balance Sheet and Other DataCurrent assets . . . . . . . . . . . . . . . . $ 554,557 $ 512,959 $ 542,801 $271,992 $216,459 $216,735Current liabilities . . . . . . . . . . . . . 104,829 111,017 124,856 63,895 54,289 39,621Working capital . . . . . . . . . . . . . . 449,728 401,942 417,945 208,097 162,170 177,114Current ratio . . . . . . . . . . . . . . . . . 5.29 4.62 4.35 4.25 3.99 5.47Long-term debt . . . . . . . . . . . . . . . 2,995 3,383 21,800 18,898 10,070 12,691Shareholders’ equity . . . . . . . . . . . 1,015,980 1,012,819 1,023,414 372,185 337,665 322,114Total assets . . . . . . . . . . . . . . . . . . 1,157,618 1,142,790 1,185,620 467,046 414,739 390,260Return on average shareholders’
equity—% . . . . . . . . . . . . . . . . . 6.3 (1.8) 1.3 7.0 0.4 0.7Shares outstanding at end of
period . . . . . . . . . . . . . . . . . . . . 132,771 136,044 135,299 73,380 72,512 71,161
(1) Effective tax rate represents income tax expense (benefit) as a percent of income (loss) before income taxesand equity in affiliates.
Operating results include the following charges or gains: 2006 costs of $5.3 million associated with consolidationof manufacturing facilities and integration expenses of $8.9 million; four months ended December 2005 a chargeof $17.8 million related to the sale of acquired inventory written up to fair value, costs of $4.8 million associatedwith consolidation of manufacturing facilities, and integration expenses of $12.8 million; 2005 a charge of $5.9million related to the sale of acquired inventory written up to fair value, costs of $3.7 million associated withconsolidation of manufacturing facilities, and integration expenses of $12.2 million and a gain of $2.9 millionassociated with the sale of an equity investment; 2004 a gain of $1.1 million associated with the sale of an equityinvestment; 2003 a charge of $1.5 million related to the closure of a facility and the impairment loss of $4.5million of an equity investment; and 2002 a charge of $4.0 million related to the closure of two facilities and thereversal of previous nonrecurring charges of $2.4 million.
Item 7. Management’s Discussion and Analysis of Financial Condition and Results of Operations.
You should read the following discussion and analysis of the Company’s consolidated financial condition andresults of operations with the consolidated financial statements and the accompanying notes to the consolidatedfinancial statements included elsewhere in this document. This discussion contains forward-looking statementsthat involve numerous risks and uncertainties, including, but not limited to, those described in the “FACTORSAND UNCERTAINTIES THAT MAY AFFECT FUTURE RESULTS” section of this Item 7. Our actual resultsmay differ materially from those contained in any forward-looking statements.
Overview
This overview is not a complete discussion of our financial condition, changes in financial condition and resultsof operations; it is intended merely to facilitate an understanding of the most salient aspects of our financial
34

condition and operating performance and to provide a context for the discussion that follows. The detaileddiscussion and analysis that follows must be read in its entirety in order to fully understand our financialcondition and results of operations.
Entegris, Inc. is a leading provider of materials integrity management products and services that purify, protectand transport the critical materials used in key technology-driven industries. Entegris derives most of its revenuefrom the sale of products and services to the semiconductor and data storage industries. The Company’scustomers consist primarily of semiconductor manufacturers, semiconductor equipment and materials suppliers,and hard disk manufacturers which are served through direct sales efforts, as well as sales and distributionrelationships, in North America, Asia, Europe and the Middle East.
Effective August 6, 2005 Entegris, Inc., a Minnesota corporation, and Mykrolis Corporation, a Delawarecorporation, completed a strategic merger of equals transaction, pursuant to which they were each merged into anew Delaware corporation named Entegris, Inc. to carry on the combined businesses. The transaction wasaccounted for as an acquisition of Mykrolis by Entegris. With the merger with Mykrolis Corporation, theCompany added liquid and gas filters, liquid delivery systems, components and consumables used to preciselymeasure, deliver, control and purify the process liquids, gases and chemicals that are used in the semiconductormanufacturing process to our materials integrity management product offerings. After the merger with Mykrolis,the Company offers a diverse product portfolio which includes more than 13,000 standard and customizedproducts that we believe provide the most comprehensive offering of materials integrity management productsand services to the microelectronics industry.
Certain of these products are unit driven and consumable products that rely on the level of semiconductormanufacturing activity to drive growth while others rely on expansion of manufacturing capacity to drive growth.The Company’s unit driven and consumable product class includes wafer shippers, disk shipping containers andtest assembly and packaging products, membrane based liquid filters and housings, metal based gas filters andresin based gas purifiers, as well as PVA roller brushes for use in post CMP cleaning applications. TheCompany’s capital expense driven products include its process carriers that protect the integrity of in-processwafers, components, systems and subsystems that use electro-mechanical, pressure differential and relatedtechnologies, to permit semiconductor and other electronics manufacturers to monitor and control the flow andcondition of process liquids used in these manufacturing processes.
On December 13, 2005, the Company’s board of directors approved a change in fiscal year end from a 52-weekor 53-week fiscal year period ending on the last Saturday of August to December 31, effective as ofDecember 31, 2005. As a result, the financial periods presented and discussed in this Annual Report on Form10-K will be defined as follows: (i) year ended December 31, 2006 representing the twelve months endedDecember 31, 2006; (ii) four-month transition period ended December 31, 2005 representing the four monthsended December 31, 2005; (iii) year ended August 27, 2005 representing the twelve months ended August 27,2005; and (iv) year ended August 28, 2004 representing the twelve months ended August 28, 2004
Key operating factors Key factors, which management believes have the largest impact on the overall results ofoperations of Entegris, Inc. include:
• Level of sales Since a large portion of the Company’s product costs (excepting raw materials,purchased components and direct labor) are largely fixed in the short/medium term, an increase ordecrease in sales affects gross profits and overall profitability significantly. Also, increases ordecreases in sales and operating profitability affects certain costs such as incentive compensation,commissions and donations, all of which are highly variable in nature.
• Variable margin on sales The Company’s variable margin on sales is determined by selling prices andthe cost of manufacturing and raw materials. This is also affected by a number of factors, whichinclude the Company’s sale mix, purchase prices of raw material (especially resin and purchasedcomponents), competition, both domestic and international, direct labor costs, and the efficiency of theCompany’s production operations, among others.
35
• Fixed cost structure The Company’s fixed cost structure is significant. Increases or decreases in saleshave a large impact on profitability. There are a number of large fixed or semi-fixed cost components,which include salaries, indirect labor, and benefits, and depreciation and amortization. It is not possibleto vary these costs easily in the short term as volumes fluctuate. Thus changes in sales volumes canaffect the usage and productivity of these cost components and can have a large effect on theCompany’s results of operations.
Overall Summary of Financial Results for the Year Ended December 31, 2006
For the year ended December 31, 2006 (2006), net sales were $678.7 million, up $235.9 million, or 53.3%, fromsales reported for the year ended December 31, 2005 (2005). The increase was principally driven by the benefitof a full year of sales from Mykrolis operations, acquired on August 6, 2005, with incremental sales ofapproximately $192.0 million. The sales comparison is adversely affected by approximately $4.5 million due tothe year-over-year currency fluctuations, principally related to the Japanese yen, versus the U.S. dollar.
Reflecting the year-over-year sales increase, the Company reported higher gross profit and improved grossmargins. The Company’s gross margin in 2006 was 45.1% versus 36.4% a year earlier. The absence of a $23.8million incremental cost of sales charge recorded in 2005 associated with the fair market value write-up ofinventory acquired in the merger with Mykrolis accounts for about two-thirds of the year-over-year improvementin 2006.
The Company’s selling, general and administrative (SG&A) expenses increased $32.2 million in 2006. Theincrease in SG&A costs primarily reflects the addition of SG&A expenses associated with Mykrolis’infrastructure offset by lower SG&A expenses in 2006 related to the completion of merger-related integrationactivities when compared to 2005, as well as the benefit of cost containment measures initiated during the latterhalf of 2006.
The Company reported income from continuing operations of $62.4 million for 2006 compared to a loss of $5.1million for 2005. Income from continuing operations increased due to the higher sales and gross profit levels, andlower levels of merger-related integration expenses.
During 2006, the Company generated cash of $95.9 million from operations as the cash generated by theCompany’s net earnings and non-cash charges exceeded the effect of working capital changes (increases inaccounts receivable and inventory along with decreases in accounts payable and accrued liabilities). Cash, cashequivalents and short-term investments were $275.0 million at December 31, 2006 compared with $274.4 millionat December 31, 2005.
Critical Accounting Policies
Management’s discussion and analysis of financial condition and results of operations are based upon theCompany’s consolidated financial statements, which have been prepared in accordance with accountingprinciples generally accepted in the United States. The preparation of these consolidated financial statementsrequires the Company to make estimates, assumptions and judgments that affect the reported amounts of assets,liabilities, revenues and expenses and related disclosure of contingent assets and liabilities. At each balance sheetdate, management evaluates its estimates, including, but not limited to, those related to accounts receivable,warranty and sales return obligations, inventories, long-lived assets, and income taxes. The Company bases itsestimates on historical experience and on various other assumptions that are believed to be reasonable under thecircumstances. Actual results may differ from these estimates under different assumptions or conditions. Thecritical accounting policies affected most significantly by estimates, assumptions and judgments used in thepreparation of the Company’s consolidated financial statements are discussed below.
Net Sales The Company’s net sales consist of revenue from sales of products net of trade discounts andallowances. Revenue for product sales is recognized upon delivery, when title and risk of loss have beentransferred to the customer; collectibility is reasonably assured, and pricing is fixed or determinable. In mosttransactions, the Company has no obligations to its customers after the date products are shipped other than
36

pursuant to warranty obligations. In the event that significant post- shipment obligations or uncertainties existsuch as customer acceptance, revenue recognition is deferred as appropriate until such obligations are fulfilled orthe uncertainties are resolved.
Accounts Receivable-Related Valuation Accounts The Company maintains allowances for doubtful accountsand for sales returns and allowances. Significant management judgments and estimates must be made and used inconnection with establishing these valuation accounts. Material differences could result in the amount and timingof the Company’s results of operations for any period if we made different judgments or utilized differentestimates. In addition, actual results could be different from the Company’s current estimates, possibly resultingin increased future charges to earnings.
The Company provides an allowance for doubtful accounts for all individual receivables judged to be unlikelyfor collection. For all other accounts receivable, the Company records an allowance for doubtful accounts basedon a combination of factors. Specifically, management analyzes the age of receivable balances, historical baddebts write-off experience, industry and geographic concentrations of customers, general customercreditworthiness and current economic trends when determining its allowance for doubtful accounts. TheCompany’s allowance for doubtful accounts was $0.8 million and $1.4 million at December 31, 2006 andDecember 31, 2005, respectively.
An allowance for sales returns and allowances is established based on historical trends and current trends inproduct returns. At December 31, 2006 and December 31, 2005, the Company’s reserve for sales returns andallowances was $1.8 million and $0.9 million, respectively.
Inventory Valuation The Company uses certain estimates and judgments to properly value inventory. Ingeneral, the Company’s inventories are recorded at the lower of manufacturing cost or market value. Eachquarter, the Company evaluates its ending inventories for obsolescence and excess quantities. This evaluationincludes analyses of inventory levels, historical write-off trends, expected product lives, sales levels by productand projections of future sales demand. Inventories that are considered obsolete are written off or a valuationallowance is recorded to establish a new carrying value for the identified items. In addition, valuation allowancesare established for inventory quantities in excess of forecasted demand. Inventory valuation allowances were$10.2 million at December 31, 2006 compared to $8.1 million at December 31, 2005.
The Company’s inventories comprise materials and products subject to technological obsolescence, which aresold in highly competitive industries. If future demand or market conditions are less favorable than currentanalyses, additional inventory write-downs or valuation allowances may be required and would be reflected incost of sales in the period the revision is made.
Impairment of Long-Lived Assets The Company routinely considers whether indicators of impairment of itsproperty and equipment assets, particularly its molding equipment, are present. If such indicators are present, it isdetermined whether the sum of the estimated undiscounted cash flows attributable to the assets in question is lessthan their carrying value. If less, an impairment loss is recognized based on the excess of the carrying amount ofthe assets over their respective fair values. Fair value is determined by discounting estimated future cash flows,appraisals or other methods deemed appropriate. If the assets determined to be impaired are to be held and used,the Company recognizes an impairment charge to the extent the present value of anticipated net cash flowsattributable to the assets are less than the assets’ carrying value. The fair value of the assets then becomes theassets’ new carrying value, which we depreciate over the remaining estimated useful life of the assets.
The Company tests goodwill for impairment on an annual basis. The Company assesses the impairment ofamortizable intangible assets whenever events or changes in circumstances indicate that the carrying value maynot be recoverable. Factors considered important which could trigger an impairment review, and potentially animpairment charge, include the following:
• significant underperformance relative to historical or projected future operating results;
37

• significant changes in the manner of use of the acquired assets or the Company’s overall businessstrategy;
• significant negative industry or economic trends; and
• significant decline in the Company’s stock price for a sustained period changing the Company’s marketcapitalization relative to its net book value;
Income Taxes In the preparation of the Company’s consolidated financial statements, management is required toestimate income taxes in each of the jurisdictions in which the Company operates. This process involvesestimating actual current tax exposures together with assessing temporary differences resulting from differingtreatment of items for tax and accounting purposes. These differences result in deferred tax assets and liabilities,which are included in the Company’s consolidated balance sheet.
The Company intends to continue to reinvest its undistributed international earnings in its internationaloperations; therefore, no U.S. tax has been recorded to cover the repatriation of such undistributed earnings.
The Company has significant amounts of deferred tax assets. Management reviews its deferred tax assets forrecoverability on a quarterly basis and assesses the need for valuation allowances. These deferred tax assets areevaluated by considering historical levels of income, estimates of future taxable income streams and the impactof tax planning strategies. A valuation allowance is recorded to reduce deferred tax assets when it is determinedthat it is more likely than not that the Company would not be able to realize all or part of its deferred tax assets.The Company carried a valuation allowance of $0.7 million and $2.2 million against its deferred tax assets atDecember 31, 2006 and December 31, 2005, respectively, in connection with a portion of a capital losscarryforward related to the Company’s discontinued operations that more likely than not will not be realized. Thechange in the valuation allowance resulted from the resolution of a matter with respect to the characterization ofcertain gains and losses.
Warranty Claims Accrual The Company records a liability for estimated warranty claims. The amount of theaccrual is based on historical claims data by product group and other factors. Claims could be materially differentfrom actual results for a variety of reasons, including a change in product failure rates and service delivery costsincurred in correcting a product failure, manufacturing changes that could impact product quality, or as yetunrecognized defects in products sold. At December 31, 2006 and December 31, 2005, the Company’s accrualfor estimated future warranty costs was $2.0 million and $2.1 million, respectively.
Business Acquisitions The Company accounts for acquired businesses using the purchase method of accountingwhich requires that the assets acquired and liabilities assumed be recorded at the date of acquisition at theirrespective fair values. The judgments made in determining the estimated fair value assigned to each class ofassets acquired and liabilities assumed, as well as asset lives, can materially impact net income. Accordingly, forsignificant items, the Company typically obtains assistance from independent valuation specialists.
There are several methods that can be used to determine the fair value of assets acquired and liabilities assumed.For intangible assets, the Company normally utilizes the “income method.” This method starts with a forecast ofall of the expected future net cash flows. These cash flows are then adjusted to present value by applying anappropriate discount rate that reflects the risk factors associated with the cash flow streams. Some of the moresignificant estimates and assumptions inherent in the income method or other methods include the projectedfuture cash flows (including timing) and the discount rate reflecting the risks inherent in the future cash flows.
Determining the useful life of an intangible asset also requires judgment. For example, different types ofintangible assets will have different useful lives and certain assets may even be considered to have indefiniteuseful lives. All of these judgments and estimates can significantly impact net income.
38

Results of Operations
Twelve months ended December 31, 2006 compared to twelve months ended December 31, 2005(Unaudited)
The following table sets forth the results of operations and the relationship between various components ofoperations, stated as a percent of net sales, for the years ended December 31, 2006 and December 31, 2005. TheCompany’s historical financial data were derived from its consolidated financial statements and related notesincluded elsewhere in this annual report.
(Dollars in thousands) Year ended December 31, 2006Year ended December 31, 2005
(Unaudited)
% of net sales % of net sales
Net sales . . . . . . . . . . . . . . . . . . . . . . . . . . . . . . . . . . . $678,706 100.0% $442,834 100.0%Cost of sales . . . . . . . . . . . . . . . . . . . . . . . . . . . . . . . . 372,557 54.9 281,569 63.6
Gross profit . . . . . . . . . . . . . . . . . . . . . . . . . . . . . . . . . 306,149 45.1 161,265 36.4Selling, general and administrative expenses . . . . . . . 189,772 28.0 157,583 35.6Engineering, research and development expenses . . . 38,830 5.7 26,247 5.9
Operating profit (loss) . . . . . . . . . . . . . . . . . . . . . . . . . 77,547 11.4 (22,565) (5.1)Interest income, net . . . . . . . . . . . . . . . . . . . . . . . . . . . (9,205) (1.4) (4,519) (1.0)Other income, net . . . . . . . . . . . . . . . . . . . . . . . . . . . . (1,658) (0.2) (2,138) (0.5)
Income (loss) before income taxes and equity inearnings of affiliates . . . . . . . . . . . . . . . . . . . . . . . . 88,410 13.0 (15,908) (3.6)
Income tax expense (benefit) . . . . . . . . . . . . . . . . . . . 26,505 3.9 (10,941) (2.4)Equity in net (earnings) loss of affiliates . . . . . . . . . . (531) (0.1) 149 —
Net income (loss) from continuing operations . . . . . . $ 62,436 9.2 $ (5,116) (1.2)
Net sales For the year ended December 31, 2006 (2006), net sales were $678.7 million, up $235.9 million, or53.3%, from sales reported for the year ended December 31, 2005 (2005). The increase in net sales reflects theinclusion of sales from the former Mykrolis operations for the full year in 2006 versus only the five-month periodfrom August 6, 2005 through December 31, 2005 for the prior period. Such incremental sales totaled $192.0million and accounted for approximately 80% of the year–over-year increase. Net sales for fiscal 2006 includedunfavorable foreign currency effects, principally related to the Japanese yen, versus the U.S. dollar in the amountof $4.5 million. On a geographic basis, total sales to North America were 27%, Asia Pacific 33%, Europe 15%and Japan 25% in 2006.
Demand drivers for the Company’s business primarily are comprised of semiconductor fab utilization andproduction (unit-driven) as well as capital spending for new or upgraded semiconductor fabrication facilities(capital-driven). The Company analyzes sales of its products by these two key drivers. Sales of unit drivenproducts represented 59% of sales and capital-driven products represented 41% of total sales in 2006. Thiscompares to a unit driven to capital driven ratio of 60:40 for the year ended December 31, 2005.
Sales of unit-driven products grew in 2006 as semiconductor fab utilization rates remained strong and stable.Unit-driven products have average lives of less than 18 months or need to be replaced based on usage levels.These products include liquid filters used in the photolithography, CMP and wet, etch and clean processes, and inwafer shippers, used to ship raw wafers, particularly at wafer sizes of 150mm and below, as well as in chip traysand data storage components used to ship 65mm and 95mm disk drives. Demand for liquid filters remainedrelatively stable for most of these semiconductor applications, but sales of these products to non-semiconductorcustomers declined modestly. Sales of wafer shippers increased modestly due to higher sales of 200mm wafershipper products. Sales of disk shippers for data storage products were also higher, as the market for 95mmdevices remained strong.
39

Year over year sales of capital driven products generally improved in 2006, reflecting strong sales during the firsthalf of the year and a decline during the second half of 2006 reflecting a general slowing of the industry,particularly in North America. Capital driven products include wafer process carriers, gas micro contaminationcontrol systems, used in the deployment of advanced photolithography processes, fluid handling systemsincluding dispense pumps used in the photolithography process, and integrated liquid flow controllers used invarious processes around the fab. Sales of liquid systems grew during the first half of the year, but declined laterin 2006 reflecting a general slowing in the industry.
Wafer transport products, such as 300mm FOUP products, also reflected slower capital spending, particularly atsome North American customers. Sales of gas microcontamination control products reached the all-time high in2006, reflecting the market acceptance of the Company’s gas purification systems and liquid lens system used onadvanced lithography steppers.
Sequentially, sales for the fourth quarter of 2006 were 1% lower than the third quarter of 2006 due to lower salesof capital-driven products. Unit-driven sales remained stable reflecting flat levels of wafer starts andsemiconductor production. This was in contrast to significantly lower sales of capital-driven products due in partto softening in demand, particularly from North American customers.
Gross profit Gross profit for the year ended December 31, 2006 increased by $144.9 million to $306.1 million,an increase of 89.8% from the $161.3 million for the comparable 2005 period. The gross margin percentage for2006 was 45.1% versus 36.4% for the comparable 2005 period.
The gross profit and gross margin improvements for the year ended December 31,2006 compared to the sameperiod a year ago were mainly due to the addition of the former Mykrolis operations, particularly the inclusion ofsales of gas micro contamination and liquid micro contamination product lines as these products typically carryhigher gross margins than the Company’s other products. The Company also benefited from improved saleslevels resulting in improved utilization of its manufacturing facilities. Prices for raw materials were relativelystable sequentially and compared to the year-ago period.
Gross profit in 2006 was reduced by costs of $2.8 million incurred in connection with the consolidation ofmanufacturing facilities in the U.S., Germany and Japan. Offsetting these charges to 2006 gross profit was a gainof $0.7 million on the sale of a facility recognized during the second quarter of 2006. Gross profit in the third andfourth quarters of 2006 was lower than the strong levels achieved earlier in the year due to manufacturinginefficiencies experienced at a North American plant in the third quarter and expenses incurred in the fourthquarter in connection with a comprehensive worldwide review of the Company’s manufacturing operations toidentify and resolve manufacturing inefficiencies.
Gross profit in 2005 was significantly affected by the inclusion of $23.8 million in incremental cost of salescharge associated with the fair market value write-up of inventory acquired in the merger with Mykrolis. Theinventory write-up was recorded as part of the purchase price allocation and was charged to cost of sales overinventory turns of the acquired inventory during the third and fourth quarters of 2005. Also during 2005, theCompany incurred costs of $8.4 million associated with the realignment of manufacturing facilities in the U.S.,Germany and Japan and its production and administrative activities, including $3.7 million in accelerateddepreciation and impairment charges associated with assets sold or in connection with realignment activities.
Selling, general and administrative expenses Selling, general and administrative (SG&A) expenses of $189.8million for 2006 increased $32.2 million, or 20.4% as compared to $157.6 million in the comparable period ayear ago. SG&A expenses, as a percent of net sales, fell to 28.0% from 35.6% a year earlier. The lower SG&Acosts as a percent of net sales reflects the benefit of cost reductions associated with the merging of the twoentities.
The year-over-year increase in SG&A costs reflect the addition of SG&A expenses associated with Mykrolis’infrastructure as well as increased amortization of intangibles of $7.4 million. Costs of $12.1 million were
40
incurred by the Company in connection with the integration and realignment activities associated with theMykrolis merger compared to $23.4 million in 2005. The costs included in the latter category generally relate toexpenses incurred to integrate Mykrolis’ operations and systems into the Company’s pre-existing operations andsystems. These costs include, but are not limited to, the integration of information systems, employee benefitsand compensation, accounting/finance, tax, treasury, risk management, compliance, administrative services, salesand marketing and other functions and includes severance and retention costs. SG&A costs fell during the secondhalf 2006 as cost containment measures were put in place in the face of slowing sales and as integration activitieswere completed.
Engineering, research and development expenses Engineering, research and development (ER&D) expensesrose by $12.6 million, or 47.9%, to $38.8 million in fiscal 2006 as compared to $26.2 million for the year endedDecember 31, 2005. The increases mainly reflect the inclusion of ER&D expenses associated with formerMykrolis operations. ER&D expenses as a percent of net sales were 5.7% compared to 5.9% a year ago. TheCompany continues to focus on supporting current product lines, and developing new products andmanufacturing technologies.
Interest income, net Net interest income was $9.2 million in fiscal 2006 compared to $4.5 million in theyear-ago period. The increases reflect the considerably higher rates of interest available on the Company’sinvestments in short-term debt securities as well as the higher average net invested balance compared to theyear-ago period, associated in part with the cash and short-term investments acquired in the Mykrolis merger.
Income tax expense The Company recorded income tax expense of $26.5 million in fiscal 2006 compared to anincome tax benefit of $10.9 million for the comparable period a year ago. The effective tax rate was 30.0% infiscal 2006 compared with a 68.8% rate a year earlier. The Company’s 2006 tax rate was lower than statutoryrates due to the benefits associated with export activities and a tax holiday in Malaysia whereby as a result ofemployment commitments and capital investments made by the Company, income from certain manufacturingactivities in Malaysia was exempt from tax with tax benefits in 2006 in the amount of $2.8 million. In 2005, theCompany benefited from a tax holiday in Malaysia whereby as a result of employment and R&D expenditurecommitments made by the Company, income from certain manufacturing activities in Malaysia was exempt fromtax with tax benefits of $1.0 million.
Discontinued operations The Company’s businesses classified as discontinued operations recorded nominallosses before income taxes for fiscal 2006. The year-to-date results of income from discontinued operationsincluded a tax benefit of $1.6 million recorded in the first quarter of 2006 related to the change in the deferred taxasset valuation allowance resulting from the resolution of a matter with respect to the characterization of certaingains and losses.
Net income The Company recorded net income of $63.5 million, or $0.46 per diluted share, in fiscal 2006,compared to a net loss of $15.5 million, or $0.16 per diluted share, in the comparable 2005 period. Income fromcontinuing operations for fiscal 2006 was $62.4 million, or $0.45 per diluted share, compared to a net loss of $5.1million, or $0.05 per diluted share, in the year ago period.
41

Four Months Ended December 31, 2005 Compared To Four Months Ended December 31, 2004(Unaudited)
The following table sets forth the results of operations and the relationship between various components ofoperations, stated as a percent of net sales, for the four months ended December 31, 2005 and December 31,2004. The Company’s historical financial data were derived from its consolidated financial statements andrelated notes included elsewhere in this annual report.
(Dollars in thousands)Four months ended December 31,
2005Four months ended December 31,
2004 (Unaudited)
% of net sales % of net sales
Net sales . . . . . . . . . . . . . . . . . . . . . . . . . . . . . . . . . . . $202,296 100.0% $117,626 100.0%Cost of sales . . . . . . . . . . . . . . . . . . . . . . . . . . . . . . . . 132,332 65.4 69,057 58.7
Gross profit . . . . . . . . . . . . . . . . . . . . . . . . . . . . . . . . . 69,964 34.6 48,569 41.3Selling, general and administrative expenses . . . . . . . 77,788 38.5 31,918 27.1Engineering, research and development expenses . . . 13,914 6.9 6,274 5.3
Operating (loss) profit . . . . . . . . . . . . . . . . . . . . . . . . . (21,738) (10.7) 10,377 8.8Interest income, net . . . . . . . . . . . . . . . . . . . . . . . . . . . (2,440) (1.2) (473) (0.4)Other expense, net . . . . . . . . . . . . . . . . . . . . . . . . . . . . 62 — 214 0.2
(Loss) income before income taxes and equity in(earnings) loss of affiliates . . . . . . . . . . . . . . . . . . . (19,360) (9.6) 10,636 9.0
Income tax (benefit) expense . . . . . . . . . . . . . . . . . . . (9,009) (4.5) 2,998 2.5Equity in net (earnings) loss of affiliates . . . . . . . . . . (70) — 27 —
Net (loss) income from continuing operations . . . . . . $ (10,281) (5.1) $ 7,611 6.5
Net sales Net sales were $202.3 million for the four months ended December 31, 2005, up 72% compared to$117.6 million in the four months ended December 31, 2004. Sales from Mykrolis operations totaled $89.6million, accounting for slightly more than the overall period-over-period increase. Sales were adversely affectedby approximately $3.5 million due to the weakening of international currencies versus the U.S. dollar, mostnotably in Japan. On a geographic basis, total regional sales to North America were 31%, Asia Pacific 33%,Europe 14% and Japan 22%.
Industry indicators during the 2005 period were largely positive. Semiconductor device makers and foundriesreported continued high fab utilization rates, both at the advanced technology nodes and for NAND flash andother memory devices. Capital spending was also generally favorable.
These trends were reflected across unit-driven products. In particular, sales of liquid filtration and purificationproducts, which represent almost half of unit-driven sales, improved over the comparable period a year ago.Strength in Japan and North America was offset by relative weakness in Europe, whose order trends typicallytrail those in other geographies.
Sales of wafer shippers rose during the period, driven by demand for product for 200mm and below. Other unit-driven products were mixed. Strong sales of gas microcontamination filters and purifiers, which are used on abroad spectrum of gas and vacuum based tools, offset lower sales of shippers for data storage devices and matrixtrays for finished electronic products.
Among capital-driven products, sales of 300mm wafer carriers improved over the comparable period a yearearlier. Sales of these products are primarily driven by the timing of new fab construction, and as such, demandcan be variable from period to period. Sales of liquid systems products were also higher than a year ago.
Gross profit Gross profit in the four months ended December 31, 2005 increased by $21.4 million to $70.0million, an increase of 44% from the $48.6 million reported in the four months ended December 31, 2004. Thegross margin percentage for the four months ended December 31, 2005, was 34.6 % versus 41.3% in thecomparable period of 2004.
42

The gross margin percentage figure for the four months ended December 31, 2005, was significantly below thefigure for the same period in the prior year for a number of reasons. The main factor was the $17.8 millionincremental cost of sales charge associated with the fair market value write-up of inventory acquired in themerger with Mykrolis. The inventory write-up was recorded as part of the purchase price allocation and wascharged to cost of sales over inventory turns of the acquired inventory and was fully expensed by the end of thequarter ended November 26, 2005. Costs of $4.8 million associated with the consolidation of manufacturingfacilities in the U.S., Germany and Japan also reduced gross profit. Although price increases for resins recentlybegan to moderate, on a year-over-year basis, the Company’s gross margin was lower due to higher materialcosts for certain products.
Selling, general and administrative expenses Selling, general and administrative (SG&A) expenses increased$45.9 million, or 144%, to $77.8 million in the four months ended December 31, 2005, up from $31.9 million inthe comparable four-month period a year earlier. Due to the magnitude of the increase, SG&A expenses, as apercent of net sales, rose to 38.5% from 27.1% a year earlier.
The increase in SG&A costs reflects the addition of SG&A expenses of $31.0 million associated with Mykrolis’infrastructure and increased amortization of intangibles of $4.7 million as well as costs of $11.3 million incurredby the Company in connection with the integration activities associated with the Mykrolis merger. The costsincluded in this category generally relate to expenses incurred to integrate Mykrolis’ operations and systems intothe Company’s pre-existing operations and systems. These costs include, but are not limited to, the integration ofinformation systems, employee benefits and compensation, accounting/finance, tax, treasury, risk management,compliance, administrative services, sales and marketing and other functions and includes severance and retentioncosts. The year-over-year increase also includes incremental share-based compensation expense of $9.6 million.
Engineering, research and development expenses Engineering, research and development (ER&D) expenseswere $13.9 million in the four months ended December 31, 2005, up 122% from $6.3 million in the four monthsended December 31, 2004. ER&D expenses, as a percent of net sales, increased to 6.9% from 5.3%, reflectingthe inclusion of Mykrolis ER&D expenses. The Company continued to focus on the support of current productlines, and the development of new products and manufacturing technologies.
Interest income, net Net interest income of $2.4 million in the four months ended December 31, 2005 compared to$0.5 million in the same four-month period a year ago. The increase reflects the higher rates of interest available onthe Company’s investments in short-term debt securities as well as the higher average net invested balancecompared to the year-ago period, associated in part with the investment funds acquired in the Mykrolis merger.
Income tax expense The Company recorded an income tax benefit of $9.0 million in the four months endedDecember 31, 2005 compared to income tax expense of $3.0 million in the four months ended December 31,2004. The effective tax rate was (46.5)% in the 2005 period, compared to 28.2% in the 2004 period.
During in the four months ended December 31, 2005, the Company recorded a tax benefit $1.1 million, plusinterest, related to the refund of certain Minnesota corporate income taxes previously paid for fiscal years 2000and 2001 based upon recent court rulings. In both periods, the Company’s effective tax rate benefited from a taxbenefit associated with export activities and a tax credit associated with research and development (R&D)activities. In addition, the Company benefited from a tax holiday in Malaysia whereby as a result of employmentand R&D expenditure commitments made by the Company, income from certain manufacturing activities inMalaysia was exempt from tax with tax benefits in the four months ended December 31, 2005 in the amount of$0.2 million.
Income tax expense in the four months ended December 31, 2004 also included a $0.5 million tax benefit thatwas recorded in connection with the resolution of a U.S. Federal income tax refund claim made by the Company.
Discontinued operations The Company’s businesses classified as discontinued operations recorded a net loss of$8.0 million, net of tax, in the four months ended December 31, 2005. The results included impairment chargesof $6.7 million, net of tax, associated with write-downs of long-lived assets to fair value less cost to sell. Theseproduct lines were sold in late calendar 2005 and the first quarter of calendar 2006.
43
Net (loss) income The Company recorded a net loss of $18.3 million, or $0.14 per diluted share, in the four-month period ended December 31, 2005 compared to net income of $6.6 million, or $0.09 per diluted share, inthe four-month period ended December 31, 2004. The loss from continuing operations for the 2005 four-monthperiod was $10.3 million, or $0.08 per share, compared to net income of $7.6 million, or $0.10 per share, in the2004 four-month period.
Fiscal 2005 Compared to Fiscal 2004
The following table sets forth the relationship between various components of operations, stated as a percent ofnet sales, for the years ended August 27, 2005 (fiscal 2005) and August 28, 2004 (fiscal 2004). The Company’shistorical financial data were derived from its consolidated financial statements and related notes includedelsewhere in this annual report.
(Percent of net sales)
Yearended
August 27,2005
Yearended
August 28,2004
Net sales . . . . . . . . . . . . . . . . . . . . . . . . . . . . . . . . . . . . . . . . . . . . . . . . . . . . . . . . . . . . . . . . . 100.0% 100.0%Cost of sales . . . . . . . . . . . . . . . . . . . . . . . . . . . . . . . . . . . . . . . . . . . . . . . . . . . . . . . . . . . . . . 61.0 55.4
Gross profit . . . . . . . . . . . . . . . . . . . . . . . . . . . . . . . . . . . . . . . . . . . . . . . . . . . . . . . . . . . . . . 39.0 44.6Selling, general and administrative expenses . . . . . . . . . . . . . . . . . . . . . . . . . . . . . . . . . . . . 31.2 27.7Engineering, research and development expenses . . . . . . . . . . . . . . . . . . . . . . . . . . . . . . . . . 5.2 5.6
Operating profit . . . . . . . . . . . . . . . . . . . . . . . . . . . . . . . . . . . . . . . . . . . . . . . . . . . . . . . . . . . 2.6 11.3Interest income, net . . . . . . . . . . . . . . . . . . . . . . . . . . . . . . . . . . . . . . . . . . . . . . . . . . . . . . . . (0.7) (0.1)Other income, net . . . . . . . . . . . . . . . . . . . . . . . . . . . . . . . . . . . . . . . . . . . . . . . . . . . . . . . . . . (0.6) (0.3)
Income before income taxes and equity in loss of affiliates . . . . . . . . . . . . . . . . . . . . . . . . . 3.9 11.7Income tax expense . . . . . . . . . . . . . . . . . . . . . . . . . . . . . . . . . . . . . . . . . . . . . . . . . . . . . . . . 0.3 3.7Equity in net loss of affiliates . . . . . . . . . . . . . . . . . . . . . . . . . . . . . . . . . . . . . . . . . . . . . . . . 0.1 —
Net income from continuing operations . . . . . . . . . . . . . . . . . . . . . . . . . . . . . . . . . . . . . . . . . 3.6 8.0
Net sales Net sales increased 6.2% to $358.0 million in the year ended August 27, 2005 from $337.2 million inthe year ended August 28, 2004. The slight increase reflected improvement in certain product lines and theimpact of the merger with Mykrolis which closed on August 6, 2005, three weeks prior to the end of theCompany’s fiscal year. Approximately two-thirds of the sales increase for 2005 was associated with the Mykrolismerger.
The semiconductor market generated about 75% of the Company’s overall sales for fiscal 2005, compared toabout 77% in fiscal 2004. Exclusive of the Mykrolis sales recorded late in fiscal 2005, sales of semiconductorproducts decreased by 3% from fiscal 2004 to 2005. Both unit-driven product lines such as wafer shippers, andtest, assembly and packaging products and capital-spending driven products, such as wafer and reticle carrierproducts and fluid handling products saw slight sales declines.
During fiscal 2005, the Company’s data storage products increased by 32% as customers experienced significantincreased demand for a wide range of consumer driven electronic products. The increase in sales was particularlydriven by results in the first three quarters of the fiscal year with sales moderating in the fourth quarter of thefiscal 2005. Sales of services rose 30% from fiscal 2004. The increase reflects growth from a service facilityacquired in France in the third quarter of fiscal 2004 along with increased sales of equipment used to clean wafershippers, disk carriers and other shipping products.
During fiscal 2005 sales in all geographies increased with the highest increase in the Asia-Pacific region. Thefiscal 2005 regional sales breakdown, as a percentage of total sales, was as follows: North America 37%, Asia-Pacific 32%, Europe 16% and Japan 15%.
44

Gross profit Gross profit in fiscal 2005 decreased by 7.1% to $139.6 million, compared to $150.3 million infiscal 2004. As a percentage of net sales, the fiscal 2005 gross margin was 39.0%, compared to 44.6% in 2004.The reductions in the fiscal 2005 gross margin percentage figures were primarily the result of higher resin prices,estimated at slightly over 100 basis points; a change in product mix to some relatively lower margin waferprocess products, the fourth quarter $5.9 million reduction in gross profit associated with the write-up ofinventory to fair value in connection with the Merger with Mykrolis and costs of $3.6 million associated withconsolidation of manufacturing facilities, mainly incurred in the fourth quarter.
Selling, general and administrative expenses (SG&A) SG&A expenses increased $18.3 million, or 19.6%, to$111.6 million in fiscal 2005, up from $93.3 million in fiscal 2004. SG&A costs, as a percent of net sales,increased to 31.2% from 27.7%. This increase mainly reflects costs of $12.1 incurred by the Company inconnection with the merger with Mykrolis and includes severance and retention costs and costs associated withintegration of the two operations as well the additional SG&A expenses recorded by Mykrolis after the date ofthe Merger.
Engineering, research and development expenses (ER&D) ER&D expenses were essentially flat in 2005 at$18.5 million compared to $18.8 million in 2004. Due to the slight decrease in ER&D expenses and theCompany’s higher net sales, such costs as a percent of net sales, decreased to 5.2% from 5.6%. The Company’sER&D efforts continued to focus on the support or extension of current product lines, and the development ofnew products and manufacturing technologies.
Operating profit Operating profit, stated as a percent of net sales, was 2.6% for fiscal 2005, compared to 11.3%in fiscal 2004. The decline in fiscal 2005 was mainly due to lower gross profit and higher SG&A expenses asdescribed above.
Interest income, net The Company reported net interest income was $2.5 million in fiscal 2005 as comparedwith $0.3 million in fiscal 2004. The increases reflect higher average net invested balances and higher rates ofinterest available on the Company’s investment in debt securities, when compared to a year ago. In addition,interest income in the third quarter of fiscal 2005 included $0.2 million related to interest on a tax refundreceived during the period.
Other (income) expense, net Other income was $2.1 million in fiscal 2005 compared to $1.1 million in fiscal2004. Other income in fiscal 2005 included gains of $2.9 million associated with the sale of about 1.1 millionshares of Nortem N.V. common stock as described in Note 6 to the Company’s consolidated financialsstatements. Other income in fiscal 2004 included gains of $1.1 million associated with the sale of an aggregate512,800 shares of Nortem N.V. common stock made periodically over the course of fiscal 2004.
The Company also recorded foreign currency remeasurement losses of $0.9 million in fiscal 2005 compared toforeign currency remeasurement losses of $0.2 million in fiscal 2004.
Income tax (benefit) expense The Company recorded an income tax expense of $1.1 million in fiscal 2005compared to income tax expense of $12.5 million for fiscal 2004. The effective tax rate for fiscal 2005 was 7.7%compared to 31.6 % in fiscal 2004. The Company’s effective tax rate in fiscal 2005 is lower than the statutoryfederal rate of 35% in the United States due to a tax benefit associated with export activities, a tax benefit fromthe Company’s investment in tax exempt securities, a tax credit associated with research and development(R&D) activities, and a benefit of $1.4 million from the resolution of tax contingencies. In addition, theCompany benefited from a tax holiday in Malaysia whereby as a result of employment and R&D expenditurecommitments made by the Company, income from certain manufacturing activities in Malaysia was exempt fromtax with tax benefits in fiscal 2005 in the amount of $1.0 million compared to $0.7 million in fiscal 2004.
The Company’s effective tax rate in fiscal 2004 was lower than the statutory federal rate of 35% in the UnitedStates due to lower taxes on foreign operations, a tax benefit associated with export activities, and a tax creditassociated with R&D activities.
45

Quarterly Results of Operations
The following table presents selected data from the Company’s consolidated statements of operations for theeight quarters and four-month transition period ended December 31, 2006. This unaudited information has beenprepared on the same basis as the audited consolidated financial statements appearing elsewhere in this annualreport. All adjustments which management considers necessary for the fair presentation of the unauditedinformation have been included in the quarters presented.
QUARTERLY STATEMENTS OF OPERATIONS DATA (UNAUDITED)
Year Ended August 28, 2005
Four MonthsEnded
December 31,2005 Year Ended December 31, 2006
Q1 Q2 Q3 Q4 Q1 Q2 Q3 Q4
(In thousands)Net sales . . . . . . . . . . . . . . . . $89,102 $83,589 $84,948 $100,394 $202,296 $157,662 $180,701 $171,262 $169,081Gross profit . . . . . . . . . . . . . . 37,159 34,685 35,095 32,651 69,964 72,959 87,107 76,262 69,821Selling, general and . . . . . . . .administrative expenses . . . . 23,822 23,719 22,518 41,588 77,788 52,068 51,977 43,672 42,055Engineering, research and . . .development expenses . . . . . 4,358 3,972 4,539 5,613 13,914 9,176 10,219 9,840 9,595Operating profit (loss) . . . . . . 8,979 6,994 8,038 (14,550) (21,738) 11,715 24,911 22,750 18,171Net income (loss) . . . . . . . . . 5,739 4,475 7,109 (7,930) (18,324) 11,353 18,193 17,821 16,099
Q1 Q2 Q3 Q4
Four MonthsEnded
December 31,2005 Q1 Q2 Q3 Q4
(Percent of net sales)Net sales . . . . . . . . . . . . . . . . 100.0% 100.0% 100.0% 100.0% 100.0% 100.0% 100.0% 100.0% 100.0%Gross profit . . . . . . . . . . . . . . 41.7 41.5 41.3 32.5 34.6 46.3 48.2 44.5 41.3Selling, general and . . . . . . . .administrative expenses . . . . 26.7 28.4 26.5 41.4 38.5 33.0 28.8 25.5 24.9Engineering, research and . . .development expenses . . . . . 4.9 4.8 5.3 5.6 6.9 5.8 5.7 5.7 5.7Operating profit (loss) . . . . . . 10.1 8.4 9.5 (14.5) (10.7) 7.4 13.8 13.3 10.7Net income (loss) . . . . . . . . . 6.4 5.4 8.4 (7.9) (9.1) 7.2 10.1 10.4 9.5
In the four months ended December 31, 2005 and the fourth quarter of year ended August 28, 2005, theCompany’s results included incremental charges of $17.8 million and $5.9 million, respectively, associated withthe write-up of inventory to fair value in connection with the merger with Mykrolis.
Our quarterly results of operations have been, and will likely continue to be, subject to significant fluctuationsdue to a variety of factors, a number of which are beyond the Company’s control.
Liquidity and Capital Resources
The Company has historically financed its operations and capital requirements through cash flow from operatingactivities, long-term loans, lease financing and borrowings under domestic and international short-term lines ofcredit. In August 2005, the company financed its merger with Mykrolis Corporation through the issuance ofcommon stock and stock options.
Operating activities Net cash flow provided by operating activities totaled $95.9 million in for the year endedDecember 31, 2006. Cash flow primarily related to non-cash charges, including depreciation and amortization of$43.7 million, and share-based compensation expense of $14.8 million. Offsetting these items was the impact ofchanges in operating assets and liabilities, most notably receivables and inventory increases and a decrease inaccounts payable.
46
Net cash flow provided by operating activities totaled $23.4 million in the four months ended December 31,2005. The Company’s net loss from continuing operations of $10.3 million was offset by various noncashcharges, including depreciation and amortization of $14.0 million, the incremental cost of sales charge of $17.8million associated with the write-up of inventory and share-based compensation expense of $11.1 million.Operating cash flow was only nominally affected by the impact of changes in working capital accounts.
Working capital stood at $449.7 million at December 31, 2006, including $154.8 million in cash and cashequivalents, and short-term investments of $120.2 million.
During 2006, accounts receivable, net of foreign currency translation adjustments, increased by $16.4 million,reflecting the increase in net sales levels. The Company’s days sales outstanding stood at 70 days compared to 69days at the beginning of the year. Inventories rose by $23.2 million from December 31, 2005 due to a generalincrease in production activity associated with higher order and sales levels, and increases in inventories atvarious locations worldwide related to a change in distribution model and in order to improve customer deliverytimes. The increase was also due to inventory builds to support the Company’s manufacturing facilityconsolidations.
Investing activities Net cash flow used in investing activities totaled $16.5 million in the twelve months endedDecember 31, 2006. Acquisition of property and equipment totaled $30.0 million, primarily for additions ofmanufacturing equipment, tooling and information systems, and the expansion of the Company’s Kulim,Malayisia facility in anticipation of moving the manufacture of certain products to Kulim, as well as expandingengineering and applications support capabilities there. The Company currently expects total capital expendituresof approximately $35 million for calendar 2007. Proceeds of $3.9 million from the sale of various property andequipment were recorded in the twelve months ended December 31, 2006.
During the year ended December 31, 2006, short term investments in the amount of $11.2 million, net ofpurchases, matured. Short-term investments stood at $120.2 million at December 31, 2006.
Net cash used in investing activities totaled $13.1 million for the four months ended December 31, 2005.Acquisition of property and equipment of $10.3 million, primarily for additions of manufacturing, computer andlaboratory equipment.
Financing activities Net cash used in financing activities totaled $80.0 million during fiscal 2006. The Companymade payments of $3.1 million on borrowings. No proceeds from new borrowings were received during thecurrent year. The Company received proceeds of $20.0 million in connection with common shares issued underthe Company’s stock option and employee stock purchase plans.
On August 21, 2006 the Company’s Board of Directors authorized a share repurchase program of up to $150million over the succeeding 12 to 18 months. In connection with the share repurchase program the Companyentered into an accelerated share repurchase agreement (ASRA) and a collared accelerated share repurchaseagreement (CASRA) with Goldman, Sachs & Co. (GS) on August 30, 2006. Under the ASRA, which waseffective as of August 30, 2006, the Company acquired 4,677,268 shares of common stock on September 5, 2006from GS for $50.0 million. The transaction was accounted for as a share retirement with common stock, paid-incapital and retained earnings reduced by $47 thousand, $28.2 million, and $21.7 million, respectively.
Under the CASRA, the Company paid $50.0 million for a prepaid forward contract, which was effectiveAugust 30, 2006, to repurchase the Company’s common stock. The Company received deliveries of commonstock of 3.0 million shares and 1.2 million shares on September 5, 2006 and October 6, 2006, respectively. Thetransaction was accounted for as a share retirement with common stock, paid-in capital and retained earningsreduced by $42 thousand, $25.2 million, and $19.8 million, respectively. $5.0 million of the $50.0 millionpayment is reflected as a prepaid forward contract for share repurchase in shareholders’ equity, which will becredited as the Company receives additional shares under the CASRA.
47

Under both the accelerated share repurchase (ASRA) and the collared accelerated share repurchase agreements(CASRA), GS may repurchase an equivalent number of shares in the open market through September 4, 2007. Atthat date, the Company’s price under the ASRA will be adjusted up or down based on the volume-weightedaverage price of the stock during this period. Such adjustment may be settled in cash or stock at the Company’sdiscretion. The Company may also receive additional shares pursuant to the CASRA, depending on movementsin the market price of the Company’s common stock. The Company financed the ASRA and CASRA with itsavailable cash equivalents and short-term investments.
Cash used in financing activities totaled $15.4 million for the four month transition period ended December 31,2005. Principal payments on short-term borrowings and long-term debt were $22.9 million. Proceeds fromborrowings of $3.5 million and proceeds from the issuance of common stock of $3.8 million partially offset thiscash outflow.
As of December 31, 2006, the Company’s sources of available funds comprised $154.8 million in cash and cashequivalents, $120.2 million in short-term investments, as well as funds available under various credit facilities.Entegris has an unsecured revolving credit agreement with one domestic commercial bank with aggregateborrowing capacity of $10 million, with no borrowings outstanding at December 31, 2006 and lines of credit withthree international banks that provide for borrowings of currencies for the Company’s overseas subsidiaries,equivalent to an aggregate of approximately $4.8 million. There were no borrowings outstanding on these linesof credit at December 31, 2006.
The Company’s unsecured revolving credit agreement, which expires in May 2008, allows for aggregateborrowings of up to $10.0 million with interest at Eurodollar rates plus 0.875%. Under the unsecured revolvingcredit agreement, the Company is prohibited from paying cash dividends. The Company is also subject to, and isin compliance with, certain financial covenants including a leverage ratio of funded debt to EBITDA (as definedtherein) of not more than 2.25 to 1.00. In addition, the Company must maintain a calculated consolidated tangiblenet worth, which, as of December 31, 2006, was $294.0 million, while also maintaining consolidated aggregateamounts of cash and cash equivalents (which under the agreement may also include auction rate securitiesclassified as short-term investments) of not less than $75.0 million.
At December 31, 2006, the Company’s shareholders’ equity stood at $1,016.0 million, up slightly from $1,012.8million at the beginning of the year. This change reflects the Company’s net earnings of $63.5 million, theproceeds of $20.0 million received in connection with shares issued under the Company’s stock option and stockpurchase plans, and the increase in additional paid-in capital of $14.8 million associated with the recording ofshare-based compensation expense, offset in part by the $100.0 million repurchase of the Company’s commonstock.
The Company believes that its cash and cash equivalents, short-term investments, cash flow from operations andavailable credit facilities will be sufficient to meet its working capital and investment requirements for the next12 months. However, future growth, including potential acquisitions, may require the Company to raise capitalthrough additional equity or debt financing. There can be no assurance that any such financing would beavailable on commercially acceptable terms.
48

The following table summarizes the maturities of the Company’s significant financial obligations:
Maturity by fiscal year
(In thousands) Total 2007 2008 2009 2010 2011 Thereafter
Contractual obligations related tooff-balance sheet arrangements:Operating leases . . . . . . . . . . . . . . . . . . . . . . $32,555 $8,285 $5,986 $4,682 $4,231 $3,065 $6,306Foreign currency contracts . . . . . . . . . . . . . . 1,269 1,269 — — — — —
Total . . . . . . . . . . . . . . . . . . . . . . . . . . . . . . . $33,824 $9,554 $5,986 $4,682 $4,231 $3,065 $6,306
Contractual obligations reflected in thebalance sheet:Long-term debt . . . . . . . . . . . . . . . . . . . . . . . $ 3,396 $ 401 $ 433 $ 467 $ 504 $ 55 $1,536Pension obligations . . . . . . . . . . . . . . . . . . . . 5,367 906 625 618 209 403 2,606
Total . . . . . . . . . . . . . . . . . . . . . . . . . . . . . . . $ 8,763 $1,307 $1,058 $1,085 $ 713 $ 458 $4,142
Quantitative and Qualitative Disclosure About Market Risks
Entegris’ principal financial market risks are sensitivities to interest rates and foreign currency exchange rates.The Company’s interest-bearing cash equivalents and short-term investments, and long-term debt and short-termborrowings are subject to interest rate fluctuations. Most of its long-term debt at December 31, 2006 carries fixedrates of interest. The Company’s cash equivalents and short-term investments are debt instruments withmaturities of 24 months or less. A 100 basis point change in interest rates would potentially increase or decreaseannual net income by approximately $1.7 million annually.
The cash flows and earnings of the Company’s foreign-based operations are subject to fluctuations in foreignexchange rates. The Company occasionally uses derivative financial instruments to manage the foreign currencyexchange rate risks associated with its foreign-based operations. At December 31, 2006, the Company was partyto forward contracts to deliver Japanese yen, Taiwanese dollars, Euros, Korean won, Malaysia ringgits, andSingapore dollars with notional values of approximately $10.0 million, $18.7 million, $16.0 million, $2.0million, $8.0 million and $3.6 million, respectively. A hypothetical 10% change in the foreign currency exchangerates would potentially result in exchange gains or losses that would increase or decrease net income byapproximately $3.4 million.
Impact of Inflation
The Company’s consolidated financial statements are prepared on a historical cost basis, which does notcompletely account for the effects of inflation. Material and labor expenses are the Company’s primary costs.The cost of certain materials, including polymers and stainless steel, were flat compared to one year ago due toincreased production capacity of suppliers and relatively stable oil prices. Entegris expects the cost of thesematerials to increase in the upcoming fiscal year due to tightening of production capacity of its suppliers and aprojected increase in oil prices. Labor costs, including taxes and fringe benefits rose slightly in fiscal 2006 andmoderate increases also can be reasonably anticipated for fiscal 2007. The Company’s products are sold undercontractual arrangements with our large customers and at current market prices to other customers.Consequently, the Company can adjust its selling prices, to the extent allowed by competition and contractualarrangements, to reflect cost increases caused by inflation. However, many of these cost increases may not berecoverable.
49

FACTORS AND UNCERTAINTIES THAT MAY AFFECT FUTURE RESULTS
The matters discussed in this Annual Report on Form 10-K include forward-looking statements within themeaning of the Private Securities Litigation Reform Act of 1995. These forward-looking statements include butare not limited to statements about:
• our strategy;
• our revenues;
• sufficiency of our cash resources;
• product development;
• our research and development and other expenses; and
• our operations and legal risks.
Discussions containing these forward-looking statements may be found throughout this report including in theitems entitled “Business” (Item 1), “Risk Factors” (Item 1A), and “Management’s Discussion and Analysis ofFinancial Condition and Results of Operations” (Item 7), as well as any amendments thereto reflected insubsequent filings with the SEC. These statements are based on current management expectations and are subjectto substantial risks and uncertainties which could cause actual results to differ materially from the resultsexpressed in, or implied by, these forward-looking statements. When used herein or in such statements, the words“anticipate”, “believe”, “estimate”, “expect”, “may”, “will”, “should” or the negative thereof and similarexpressions as they relate to Entegris or its management are intended to identify such forward-lookingstatements. We undertake no obligation to publicly release any revisions to the forward-looking statements orreflect events or circumstances after the date of this Annual Report on Form 10-K except as required by law.
Item 7a. Quantitative and Qualitative Disclosures about Market Risk.The information required by this item can be found under the subcaption “Quantitative and Qualitative
Disclosure About Market Risks” of “Management’s Discussion and Analysis of Financial Condition and Resultsof Operations” in Item 7.
Item 8. Financial Statements and Supplementary Data.The information called for by this item is set forth in the Consolidated Financial Statements and Schedule
covered by the Report of Independent Registered Public Accounting Firm at the end of this report.
Item 9. Changes in and Disagreements With Accountants on Accounting and Financial Disclosure.This item is not applicable.
Item 9A. Controls and Procedures.(a) EVALUATION OF DISCLOSURE CONTROLS AND PROCEDURESManagement evaluated the effectiveness of our disclosure controls and procedures (as defined in Rules13a-15(e) and 15d-15(e) under the Securities Exchange Act of 1934, as amended, or the Exchange Act), as ofDecember 31, 2006, the end of the fiscal period covered by this report on Form 10-K. The Securities andExchange Commission, or SEC, rules define the term “disclosure controls and procedures” to mean a company’scontrols and other procedures that are designed to ensure that information required to be disclosed in the reportsit files or submits under the Exchange Act is recorded, processed, summarized and reported within the timeperiod specified in the SEC’s rules and forms. Disclosure controls and procedures include, without limitation,controls and procedures designed to ensure that information required to be disclosed by a company in its reportsfiled under the Exchange Act is accumulated and communicated to the company’s management, including itsprincipal executive and principal financial officers, or persons performing similar functions, as appropriate toallow timely decisions regarding required disclosure.
Based on the evaluation of the effectiveness of our disclosure controls and procedures by our management team withthe participation of the Chief Executive Officer and the Chief Financial Officer, our Chief Executive Officer and ourChief Financial Officer have concluded that, as of the end of the period covered by this report, our disclosure controlsand procedures were not effective as of such date because of the existence of a material weakness in our internalcontrol over financial reporting related to our accounting for income taxes as described below.
50

(b) MANAGEMENT’S REPORT ON INTERNAL CONTROL OVER FINANCIAL REPORTING
Management of the Company is responsible for establishing and maintaining adequate internal control overfinancial reporting (as defined in Rules 13a-15(f) and 15d-15(f) of the Exchange Act). Internal control overfinancial reporting is designed to provide reasonable assurance that records are maintained, in reasonable detail,that assets are safeguarded and transactions are properly recorded and executed in accordance withmanagement’s authorization.
Management conducted an evaluation of the effectiveness of the Company’s internal control over financial reportingbased on the framework in Internal Control—Integrated Framework issued by the Committee of SponsoringOrganizations of the Treadway Commission (“COSO”). Based on this evaluation, management concluded that theCompany’s internal control over financial reporting was not effective due to the material weakness related to ouraccounting for income taxes as described below. A material weakness in internal control over financial reporting is asignificant deficiency, or combination of significant deficiencies, that results in more than a remote likelihood that amaterial misstatement of the annual or interim financial statements will not be prevented or detected.
Management identified the following material weakness in our internal control over financial reporting as ofDecember 31, 2006:
Our policies and procedures did not provide for effective oversight and review of our accounting for income taxes.Specifically, our policies and procedures did not include adequate management review of various income taxcalculations, reconciliations and related supporting documentation to ensure that our accounting for income taxes,including accounting for income taxes associated with acquisitions made by the Company, was in accordance withgenerally accepted accounting principles. This control deficiency resulted in errors in the Company’s interim andannual consolidated financial statements and more than a remote likelihood that a material misstatement in theCompany’s annual or interim consolidated financial statements would not be prevented or detected.
Management’s assessment of the effectiveness of our internal control over financial reporting as of December 31,2006, has been audited by KPMG LLP, an independent registered public accounting firm. Their report appearson page F-3 of this Annual Report on Form 10-K.
(c) CHANGES IN INTERNAL CONTROL OVER FINANCIAL REPORTING
There was no change in the Company’s internal control over financial reporting during the most recentlycompleted fiscal quarter that has materially affected, or is reasonably likely to materially affect, internal controlsover financial reporting.
(d) MANAGEMENT’S REMEDIATION PLANS
The Company plans to conduct significant remediation efforts throughout 2007 with the goal to remediate thismaterial weakness prior to December 31, 2007. Although we are still discussing and finalizing the specifics ofthese plans, they currently include the following:
• Hiring additional tax personnel and providing additional training for select tax personnel;
• Redesigning and implementing new review and approval procedures and processes associated with allincome tax provision workpapers and the consolidated income tax reconciliation schedules;
• Increasing the oversight by our accounting department of income tax reconciliations.
(e) INHERENT LIMITATIONS ON THE EFFECTIVENESS OF INTERNAL CONTROL
Because of its inherent limitations, internal control over financial reporting can provide only reasonableassurance and may not prevent or detect misstatements. Further, because of changes in conditions, theeffectiveness of internal control over financial reporting may vary over time.
Item 9B. Other Information.
None.
51

PART III
Item 10. Directors, Executive Officers and Corporate Governance.
The information called for by this item with respect to registrant’s directors, including information relating to theindependence of certain directors, identification of the audit committee and the audit committee financial expertand with respect to corporate governance is set forth under the caption “Election of Directors” and “CorporateGovernance”, respectively in the Company’s definitive Proxy Statement for the Entegris, Inc. Annual Meeting ofStockholders to be held on May 9, 2007, and to be filed with the Securities and Exchange Commission on orabout March 30, 2007, which information is hereby incorporated herein by reference.
The information called for by this item with respect to registrant’s compliance with Section 16(a) of theSecurities Exchange Act of 1934, as amended, is set forth under the caption “Section 16(a) Beneficial OwnershipReporting Compliance” in the Company’s definitive Proxy Statement for the Entegris, Inc. Annual Meeting ofStockholders to be held on May 9, 2007, and to be filed with the Securities and Exchange Commission on orabout March 30, 2007, which information is hereby incorporated herein by reference.
Information called for by this item with respect to registrant’s executive officers is set forth under “ExecutiveOfficers “ in Item 1 of this report.
The Company has adopted a code of ethics, the Entegris, Inc. Code of Business Ethics, that applies to allemployees of the registrant including the registrant’s Chief Executive Officer, Chief Financial Officer andCorporate Controller. In addition, the Company has adopted the Entegris, Inc. Code of Ethics for FinancialManagement. A copy of the Entegris, Inc. Code of Business Ethics is posted on our website athttp://www.Entegris.com, under “Investor Relations—Governance”. The Entegris, Inc. Code of Business Ethicsand the Entegris, Inc. Code of Ethics for Financial Management are each is available in print to any stockholderthat requests a copy. A copy of the Entegris, Inc. Code of Business Ethics and the Entegris, Inc. Code of Ethicsfor Financial Management are each may be obtained by contacting Peter W. Walcott, the Company’s Senior VicePresident & General Counsel at the Company’s headquarters. The Company intends to comply with therequirements of Item 10 of Form 8-K with respect to any waiver of the provisions of the Entegris, Inc. Code ofBusiness Ethics and the Entegris, Inc. Code of Ethics for Financial Management are each applicable to theregistrant’s Chief Executive Officer, Chief Financial Officer and Corporate Controller by posting notice of anysuch waiver at the same location on our website.
Item 11. Executive Compensation.
The information called for by this item is set forth under the caption “COMPENSATION OF EXECUTIVE OFFICERS”,“CORPORATE GOVERNANCE” and “REPORT OF THE MANAGEMENT DEVELOPMENT & COMPENSATION
COMMITTEE”, respectively, in the Company’s definitive Proxy Statement for the Entegris, Inc. Annual Meetingof Stockholders to be held on May 9, 2007, and to be filed with the Securities and Exchange Commission on orabout March 30, 2007, which information is hereby incorporated herein by reference.
52

Item 12. Security Ownership of Certain Beneficial Owners and Management and Related StockholderMatters.
The following information is provided as of December 31, 2006, with respect to our compensation plans underwhich equity securities are authorized for issuance. The only equity securities currently authorized for issuanceunder our compensation plans are common stock for awards or options to acquire our common stock.
Plan category
Number of securitiesto be issued upon
exercise ofoutstanding options,warrants and rights
(a)
Weighted-averageexercise price of
outstanding options(b)
Number of securities remainingavailable for future issuanceunder equity compensationplans (excluding securitiesreflected in column (a))(1)
(c)
Equity compensation plans approved bysecurity holders . . . . . . . . . . . . . . . . . . . . . 12,425,300 $8.18 7,420,778(2)
Equity compensation plans not approved bysecurity holders . . . . . . . . . . . . . . . . . . . . . 380,382 $8.69 685,831(3)
Total . . . . . . . . . . . . . . . . . . . . . . . . . . . 12,805,682 $8.19 8,106,609(2)(3)
(1) Includes shares of Entegris common stock available for award or to support option grants under the 2001Equity Incentive Plan and the 2003 Employment Inducement and Acquisition Stock Option Plan as well asunder the 1999 Long Term Incentive and Stock Option Plan and Outside Directors’ Option Plan, each offirst two enumerated plans contains an “evergreen” provision that annually increases the number of sharesavailable for award or to support option grants by 1% and 0.25%, respectively, of the number of shares ofcommon stock outstanding on the date of the Annual Meeting of Stockholders.
(2) This figure has been reduced by 2,433,783 outstanding restricted shares of common stock and outstandingperformance shares as of December 31, 2006 (using actual results for 2006 to determine performance sharesoutstanding).
(3) This figure has been reduced by 41,184 outstanding restricted shares of common stock as of December 31,2006.
The securities issued and available for issue pursuant to equity compensation plans not approved by securityholders listed in the table above refers to the Entegris, Inc. 2003 Employment Inducement and Acquisition StockOption Plan which was adopted by the Board of Directors of Mykrolis and assumed by the Company by action ofits Board of Directors effective August 10, 2005. This stock option plan provides for the grant of stock optionscovering an aggregate of 486,500 shares of the Common stock, $0.01 par value, of the Company to newly hired(or rehired) employees and to employees of companies acquired by Entegris. The plan has a term of ten years andprovides that all stock options granted under the plan carry an exercise price of fair market value on the date ofgrant. This plan also contains an “evergreen” provision that annually increases the number of shares available foraward or to support option grants by 0.25% of the number of shares of common stock outstanding on the date ofthe Annual Meeting of Stockholders during the term of the plan.
The information called for by Item 403 of Regulation S-K is set forth under the caption “OWNERSHIP OF
ENTEGRIS COMMON STOCK” in the Company’s definitive Proxy Statement for the Entegris, Inc. Annual Meetingof Stockholders to be held on May 9, 2007, and to be filed with the Securities and Exchange Commission on orabout March 30, 2007, which information is hereby incorporated herein by reference.
Item 13. Certain Relationships and Related Transactions, and Director Independence.
The information called for by this item with respect to certain transactions and relationships between theregistrant and directors, executive officers and five percent stockholders is set forth under the caption “ELECTION
OF DIRECTORS-NOMINEES FOR ELECTION” in the Company’s definitive Proxy Statement for the Entegris, Inc.Annual Meeting of Stockholders to be held on May 9, 2007, and to be filed with the Securities and ExchangeCommission on or about March 30, 2007, which information is hereby incorporated herein by reference.
53

Item 14. Principal Accountant Fees and Services.
The information called for by this item with respect to the fees paid to and the services performed by registrant’sprincipal accountant is set forth under the caption “ACCOUNTANTS” in the Company’s definitive Proxy Statementfor the Entegris, Inc. Annual Meeting of Stockholders to be held on May 9, 2007, and to be filed with theSecurities and Exchange Commission on or about March 30, 2007, which information is hereby incorporatedherein by reference.
54
PART IV
Item 15. Exhibits, Financial Statement Schedules, and Reports on Form 8-K.
(a) The following documents are filed as a part of this report:
1. Financial Statements. The Consolidated Financial Statements listed under Item 8 of this report and inthe Index to Consolidated Financial Statements on page F-1 of this report that is incorporated byreference.
2. Exhibits.
A. The following exhibits are incorporated by reference:
Reg. S-KItem 601(b)Reference Document Incorporated Referenced Document on file with the Commission
(2) . Agreement and Plan of Merger, dated as ofMarch 21, 2005, by and among Entegris, Inc.,Mykrolis Corporation and Eagle DE, Inc.
Included as Annex A in the joint proxystatement/prospectus included in S-4Registration . Statement of Entegris, Inc. andEagle DE, Inc. (No. 333-124719)
(2) . Agreement and Plan of Merger, dated as ofMarch 21, 2005, by and between Entegris, Inc.,and Eagle DE, Inc.
Included as Annex B in the joint proxystatement/prospectus included in S-4Registration . Statement of Entegris, Inc. andEagle DE, Inc. (No. 333-124719)
(2) . Form of Master Separation and DistributionAgreement between Millipore Corporation andMykrolis Corporation
Exhibit 2.1 to Mykrolis Corporation Form S-1Registration Statement (No. 333-57182)
(2) . Form of General Assignment and AssumptionAgreement between Millipore Corporation andMykrolis Corporation
Exhibit 2.2 to Mykrolis Corporation Form S-1Registration Statement (No. 333-57182)
(3) . Amended and Restated Certificate ofIncorporation of Entegris, Inc.
Included as Annex C-2 in the joint proxystatement/prospectus included in S-4Registration Statement of Entegris, Inc. andEagle DE, Inc. (No. 333-124719)
(3) . By-laws of Entegris, Inc. Included as Annex D in the joint proxystatement/prospectus included in S-4Registration Statement of Entegris, Inc. andEagle DE, Inc. (No. 333-124719)
(4) . Form of certificate representing shares ofCommon Stock, $.01 par value per share
Exhibit 4.1 to Form S-4 Registration Statementof Entegris, Inc. and Eagle DE, Inc.(No. 333-124719)
(4) . Rights Agreement dated July 26, 2005, betweenEntegris and Wells Fargo Bank, N.A as rightsagent
Exhibit 4.1 to Entegris, Inc. (EntegrisMinnesota) Current Report on Form 8-K filedwith the Securities and Exchange Commissionon July 29, 2005
(10) Entegris, Inc. 1999 Long-Term Incentive andStock Option Plan*
Entegris, Inc. Registration Statement on FormS-1 (No. 333-33668)
* A “management contract or compensatory plan”
55

Reg. S-KItem 601(b)Reference Document Incorporated Referenced Document on file with the Commission
(10) Entegris, Inc. Outside Directors’ Stock OptionPlan*
Entegris, Inc. Registration Statement on FormS-1 (No. 333-33668)
(10) Entegris, Inc. 2000 Employee Stock PurchasePlan
Entegris, Inc. Registration Statement on FormS-1 (No. 333-33668)
(10) Form of 2001 Equity Incentive Plan* Exhibit 10.1 to Mykrolis Corporation Form S-1Registration Statement (No. 333-57182)
(10) 2003 Employment Inducement and AcquisitionStock Option Plan*
Exhibit 10.6 to Mykrolis Corporation Form10-Q Quarterly Report for the period endedSeptember 27, 2003
(10) Supplemental Executive Retirement Plan forKey Salaried Employees*
Exhibit 10.28 to Mykrolis Corporation Form10-K Annual Report for the year endedDecember 31, 2002
(10) 2002 Deferred Compensation Plan for SeniorManagement*
Exhibit 10.29 to Mykrolis Corporation Form10-K Annual Report for the year endedDecember 31, 2002
(10) Letter Agreement with Thomas O. Pyle* Exhibit 10.1.2 to Mykrolis Corporation Form10-Q quarterly report for the period ended June30, 2002
(10) Lease Agreement, dated April 1, 2002 BetweenNortel Networks HPOCS Inc. And MykrolisCorporation, relating to Executive office, R&Dand manufacturing facility located at 129Concord Road Billerica, MA
Exhibit 10.1.3 to Mykrolis CorporationQuarterly Report on Form 10-Q, for the periodended March 31, 2002
(10) Master Patent License Agreement Exhibit 10.8 to Mykrolis Corporation Form S-1Registration Statement (No. 333-57182)
(10) Master Patent Grantback License Agreement Exhibit 10.9 to Mykrolis Corporation Form S-1Registration Statement (No. 333-57182)
(10) Master Trademark License Agreement Exhibit 10.11 to Mykrolis Corporation FormS-1 Registration Statement (No. 333-57182)
(10) Master Invention Disclosure Assignment Exhibit 10.12 to Mykrolis Corporation FormS-1 Registration Statement (No. 333-57182)
(10) Master Trade Secret and Know-HowAgreement
Exhibit 10.13 to Mykrolis Corporation FormS-1 Registration Statement (No. 333-57182)
(10) Tax Sharing Agreement Exhibit 10.14 to Mykrolis Corporation FormS-1 Registration Statement (No. 333-57182)
(10) Amended and Restated Membrane Manufactureand Supply Agreement
Exhibit 10.1 to Entegris, Inc. Form 10-Q reportfor the period ended December 31, 2005
(10) Research Agreement Exhibit 10.19 to Mykrolis Corporation FormS-1 Registration Statement (No. 333-57182)
56
* A “management contract or compensatory plan”

Reg. S-KItem 601(b)Reference Document Incorporated Referenced Document on file with the Commission
(10) Restricted Stock Award Agreement, dated as ofNovember 21, 2004, between MykrolisCorporation and Gideon Argov*
Exhibit 10.32 to Mykrolis Corporation Form10-K Annual Report for the year endedDecember 31, 2004
(10) Form of Restricted Stock Award Agreement,dated as of December 9, 2004, between theCompany and each of its executive officers*
Exhibit 10.34 to Mykrolis Corporation Form10-K Annual Report for the year endedDecember 31, 2004
(10) Agreement and Plan of Merger by and amongMykrolis Corporation, Stingray MergerCorporation, Extraction Systems, Inc. and theRepresentative of the Holders of all of theCapital Stock of Extraction Systems, Inc. datedas of March 3, 2005
Exhibit 10.35 to Mykrolis Corporation Form10-K Annual Report for the year endedDecember 31, 2004
(10) Letter Agreement, dated as of March 21, 2005,by and between Mykrolis Corporation andJean-Marc Pandraud*
Exhibit 10.6 to Mykrolis Corporation’sQuarterly Report on Form 10-Q for the quarterended April 2, 2005
(10) Letter Agreement, dated as of March 21, 2005,by and between Mykrolis Corporation and PeterW. Walcott*
Exhibit 10.8 to Mykrolis Corporation’sQuarterly Report on Form 10-Q for the quarterended April 2, 2005
(10) Amended and Restated EmploymentAgreement, dated as of May 4, 2005, by andbetween Mykrolis Corporation and GideonArgov*
Exhibit 10.13 to Mykrolis Corporation’sQuarterly Report on Form 10-Q for the quarterended April 2, 2005
(10) Form of Integration-Planning Bonus Letter andAttachments, dated as of May 12, 2005*
Exhibit 10.1 to Entegris, Inc.’s Current Reporton Form 8-K filed with the Securities andExchange Commission on May 18, 2005
(10) Form of Integration-Execution Bonus Letter* Exhibit 10.1 to Entegris, Inc.’s Current Reporton Form 8-K filed with the Securities andExchange Commission on August 31, 2005
(10) STAT-PRO(R) 3000 and STAT-PRO(R) 3000EPurchase and Supply Agreement betweenFluoroware, Inc. and Miller Waste Mills, d/b/aRTP Company, dated April 6, 1998
Entegris, Inc. Registration Statement on FormS-1 (No. 333-33668)
(10) PFA Purchase and Supply Agreement by andbetween E.I. Du Pont De Nemours andCompany and Fluoroware, Inc., dated January7, 1999, which was made effective retroactivelyto November 1, 1998, and supplemented by theAssignment and Limited Amendment by andbetween the same parties and Entegris, Inc.,dated as of September 24, 1999
Entegris, Inc. Registration Statement on FormS-1 (No. 333-33668)
57
* A “management contract or compensatory plan”

Reg. S-KItem 601(b)Reference Document Incorporated Referenced Document on file with the Commission
(10) Credit Agreement dated as of November 30,1999 among Entegris, Inc. and Norwest BankMinnesota, N.A. and Wells Fargo Bank, NA(formerly Norwest Bank Minnesota, N.A.), asamended
Exhibits 10.3, 10.4, 10.5 and 10.6 to Entegris,Inc. Quarterly Report on Form 10-Q for theperiod ended Report on Form 10-Q for theperiod ended February 28, 2004; Exhibit 10.3to Entegris, Inc. Quarterly Report on Form10-Q for the period ended May 25, 2005;Exhibits10.5 and 10.6 to Form 10-Q quarterlyreport for the period ended February 26, 2005;Exhibit 10.1 to Entegris, Inc. Quarterly Reporton Form 10-Q for the period ended November26, 2005, Exhibit 10.1 to Entegris, Inc.Quarterly Report on Form 10-Q for the periodended July 1, 2006
(10) Form of Indemnification Agreement betweenEntegris, Inc. and each of its executive officersand Directors
Exhibit 10.30 to Entegris, Inc. Annual Reporton form 10- K for the period ended August 27,2005
(10) Form of Executive Change of ControlTermination Agreement between Entegris, Inc.and each of its executive officers*
Exhibit 10.31 to Entegris, Inc. Annual Reporton Form 10-K for the period ended August 27,2005
(10) Employment Separation Agreement andRelease between Entegris, Inc. and Stan Geyer(assumed by the Company)*
Exhibit 10.32 to Entegris, Inc. Annual Reporton Form 10-K for the period ended August 27,2005
(10) Employment Separation Agreement andRelease between Entegris, Inc. and James E.Dauwalter (assumed by the Company)*
Exhibit 10.33 to Entegris, Inc. Annual Reporton Form 10-K for the period ended August 27,2005
(10) Employment Agreement and Release betweenEntegris, Inc. and Michael W. Wright, effectiveAugust 6, 2005*
Exhibit 10.34 to Entegris, Inc. Annual Reporton Form 10-K for the period ended August 27,2005
(10) Entegris, Inc. 401 (k) Savings and ProfitSharing Plan (2005 Restatement)*
Exhibit 10.35 to Entegris, Inc. Annual Reporton Form 10-K for the period ended August 27,2005
(10) Letter Agreement, dated as of August 10, 2005,by and between Entegris, Inc. and BertrandLoy*
Exhibit 10.36 to Entegris, Inc. Annual Reporton Form 10-K for the period ended August 27,2005
(10) Letter Agreement, dated as of August 10, 2005,by and between Entegris, Inc. and GregGraves*
Exhibit 10.37 to Entegris, Inc. Annual Reporton Form 10-K for the period ended August 27,2005
(10) Letter Agreement, dated as of August 10, 2005,by and between Entegris, Inc. and John D.Villas*
Exhibit 10.38 to Entegris, Inc. Annual Reporton Form 10-K for the period ended August 27,2005
(10) Letter Agreement, dated as of August 10, 2005,by and between Entegris, Inc. and JohnGoodman*
Exhibit 10.39 to Entegris, Inc. Annual Reporton Form 10-K for the period ended August 27,2005
(10) Form of Entegris, Inc. Restricted Stock AwardAgreement*
Exhibit 10.2 to Entegris, Inc. Quarterly Reporton Form 10-Q for the period ended November27, 2005
58
* A “management contract or compensatory plan”
Reg. S-KItem 601(b)Reference Document Incorporated Referenced Document on file with the Commission
(10) Employment Offer Agreement with John J.Murphy*
Exhibit 10.2 to Entegris, Inc. Quarterly Reporton Form 10-Q for the period ended December31, 2005
(10) Entegris, Inc.—Form of 2006 Equity IncentiveAward Agreement
Exhibit 10.1 to Entegris, Inc. Quarterly Reporton Form 10-Q for the period ended April 1,2006,
(10) Accelerated Stock Buyback Agreement withGoldman, Sachs & Co., dated as of August 30,2006 and related Supplemental Confirmation
Exhibit 10.1 to Entegris, Inc. Quarterly Reporton Form 10-Q for the period ended September30, 2006
(10) Collared Accelerated Stock BuybackAgreement with Goldman, Sachs & Co., datedas of August 30, 2006, and relatedSupplemental Confirmation
Exhibit 10.2 to Entegris, Inc. Quarterly Reporton Form 10-Q for the period ended September30, 2006
B. The Company hereby files as exhibits to this Annual Report on Form 10-K the following documents:
Reg. S-KItem 601(b)Reference Documents Filed Herewith
(10.1) Separation Letter Agreement with John Villas, dated December 20, 2006, as amended*
(10.2) Consulting Letter Agreement with James Dauwalter*
(21) Subsidiaries of Entegris, Inc.
(23.1) Consent of Independent Registered Public Accounting Firm
(24) Power of Attorney by the Directors of Entegris, Inc.
(31.1) Certification required by Rule 13a-14(a) in accordance with Section 302 of the Sarbanes-Oxley Actof 2002.
(31.2) Certification required by Rule 13a-14(a) in accordance with Section 302 of the Sarbanes-Oxley Actof 2002.
(32.1) Certification required by Rule 13a-14(b) and 18 U.S.C. Section 1350, as adopted pursuant to Section906 of the Sarbanes-Oxley Act of 2002.
(32.2) Certification required by Rule 13a-14(b) and 18 U.S.C. Section 1350, as adopted pursuant to Section906 of the Sarbanes-Oxley Act of 2002.
59
* A “management contract or compensatory plan”

SIGNATURES
Pursuant to the requirements of Section 13 or 15(d) of the Securities Exchange Act of 1934, the Registranthas duly caused this report to be signed on its behalf by the undersigned thereunto duly authorized.
ENTEGRIS, INC.
Dated: March 16, 2007 By /s/ GIDEON ARGOV
Gideon Argov
President & Chief Executive Officer
Pursuant to the requirements of the Securities Exchange Act of 1934, this report has been signed below bythe following persons on behalf of the Registrant and in the capacities and on the dates indicated.
SIGNATURE TITLE DATE
/s/ GIDEON ARGOV
Gideon Argov
President, Chief Executive Officerand Director
March 16, 2007
/s/ JOHN D. VILLAS
John D. Villas
Senior Vice President, Treasurer,Chief Financial Officer and ChiefAccounting Officer
March 16, 2007
JAMES E. DAUWALTER*James E. Dauwalter
Chairman of the Board, Director March 16, 2007
MICHAEL A. BRADLEY*Michael A. Bradley
Director March 16, 2007
MICHAEL P.C. CARNS*Michael P.C. Carns
Director March 16, 2007
DANIEL W. CHRISTMAN*Daniel W. Christman
Director March 16, 2007
GARY F. KLINGL*Gary F. Klingl
Director March 16, 2007
PAUL L.H. OLSON*Paul L.H. Olson
Director March 16, 2007
ROGER D. MCDANIEL*Roger D. McDaniel
Director March 16, 2007
THOMAS O. PYLE*Thomas O. Pyle
Director March 16, 2007
BRIAN SULLIVAN*Brian F. Sullivan
Director March 16, 2007
*By /s/ JOHN D. VILLAS
JOHN D. VILLAS, ATTORNEY-IN-FACT
60

ENTEGRIS, INC.INDEX TO FINANCIAL STATEMENTS
Reports of Independent Registered Public Accounting Firm . . . . . . . . . . . . . . . . . . . . . . . . . . . . . . . . . . . . . F-2
Consolidated Balance Sheets at December 31, 2006 and December 31, 2005 . . . . . . . . . . . . . . . . . . . . . . . . F-5
Consolidated Statements of Operations for the year ended December 31, 2006, the four months endedDecember 31, 2005 and the years ended August 27, 2005 and August 28, 2004 . . . . . . . . . . . . . . . . . . . . F-6
Consolidated Statements of Shareholders’ Equity and Comprehensive Income (Loss) for the year endedDecember 31, 2006, the four months ended December 31, 2005 and the years ended August 27, 2005and August 28, 2004 . . . . . . . . . . . . . . . . . . . . . . . . . . . . . . . . . . . . . . . . . . . . . . . . . . . . . . . . . . . . . . . . . . F-7
Consolidated Statements of Cash Flows for the year ended December 31, 2006, four months endedDecember 31, 2005 and the years ended August 27, 2005 and August 28, 2004 . . . . . . . . . . . . . . . . . . . . F-9
Notes to Consolidated Financial Statements . . . . . . . . . . . . . . . . . . . . . . . . . . . . . . . . . . . . . . . . . . . . . . . . . . F-10
F-1

REPORT OF INDEPENDENT REGISTERED PUBLIC ACCOUNTING FIRM
The Board of Directors and Shareholders Entegris, Inc.:
We have audited the accompanying consolidated balance sheets of Entegris, Inc. and subsidiaries as ofDecember 31, 2006 and 2005, and the related consolidated statements of operations, shareholders’ equity andcomprehensive income (loss), and cash flows for the year ended December 31, 2006, the four-month periodended December 31, 2005, and the years ended August 27, 2005 and August 28, 2004. These consolidatedfinancial statements are the responsibility of the Company’s management. Our responsibility is to express anopinion on these consolidated financial statements based on our audits.
We conducted our audits in accordance with the standards of the Public Company Accounting Oversight Board(United States). Those standards require that we plan and perform the audit to obtain reasonable assurance aboutwhether the financial statements are free of material misstatement. An audit includes examining, on a test basis,evidence supporting the amounts and disclosures in the financial statements. An audit also includes assessing theaccounting principles used and significant estimates made by management, as well as evaluating the overallfinancial statement presentation. We believe that our audits provide a reasonable basis for our opinion.
In our opinion, the consolidated financial statements referred to above present fairly, in all material respects, thefinancial position of Entegris, Inc. and subsidiaries as of December 31, 2006 and December 31, 2005, and theresults of their operations and their cash flows for the year ended December 31, 2006, the four-month periodended December 31, 2005 and for the years ended August 27, 2005 and August 28, 2004, in conformity withU.S. generally accepted accounting principles.
We also have audited, in accordance with the standards of the Public Company Accounting Oversight Board(United States), the effectiveness of Entegris, Inc.’s internal control over financial reporting as of December 31,2006, based on criteria established in Internal Control—Integrated Framework issued by the Committee ofSponsoring Organizations of the Treadway Commission (COSO), and our report dated March 16, 2007,expressed an unqualified opinion on management’s assessment of, and an adverse opinion on the effectiveoperation of, internal control over financial reporting.
/s/ KPMG LLP
Minneapolis, MinnesotaMarch 16, 2007
F-2

REPORT OF INDEPENDENT REGISTERED PUBLIC ACCOUNTING FIRM
The Board of Directors and Shareholders Entegris, Inc.:
We have audited management’s assessment, included in the accompanying Management’s Report On InternalControl Over Financial Reporting (Item 9A(b)), that Entegris, Inc. did not maintain effective internal controlover financial reporting as of December 31, 2006 because of the effect of the material weakness identified inmanagement’s assessment, based on criteria established in Internal Control—Integrated Framework issued bythe Committee of Sponsoring Organizations of the Treadway Commission (COSO). Entegris, Inc.’s managementis responsible for maintaining effective internal control over financial reporting and for its assessment of theeffectiveness of internal control over financial reporting. Our responsibility is to express an opinion onmanagement’s assessment and an opinion on the effectiveness of the Company’s internal control over financialreporting based on our audit.
We conducted our audit in accordance with the standards of the Public Company Accounting Oversight Board(United States). Those standards require that we plan and perform the audit to obtain reasonable assurance aboutwhether effective internal control over financial reporting was maintained in all material respects. Our auditincluded obtaining an understanding of internal control over financial reporting, evaluating management’sassessment, testing and evaluating the design and operating effectiveness of internal control, and performing suchother procedures as we considered necessary in the circumstances. We believe that our audit provides areasonable basis for our opinion.
A company’s internal control over financial reporting is a process designed to provide reasonable assuranceregarding the reliability of financial reporting and the preparation of financial statements for external purposes inaccordance with generally accepted accounting principles. A company’s internal control over financial reportingincludes those policies and procedures that (1) pertain to the maintenance of records that, in reasonable detail,accurately and fairly reflect the transactions and dispositions of the assets of the company; (2) provide reasonableassurance that transactions are recorded as necessary to permit preparation of financial statements in accordancewith generally accepted accounting principles, and that receipts and expenditures of the company are being madeonly in accordance with authorizations of management and directors of the company; and (3) provide reasonableassurance regarding prevention or timely detection of unauthorized acquisition, use, or disposition of thecompany’s assets that could have a material effect on the financial statements.
Because of its inherent limitations, internal control over financial reporting may not prevent or detectmisstatements. Also, projections of any evaluation of effectiveness to future periods are subject to the risk thatcontrols may become inadequate because of changes in conditions, or that the degree of compliance with thepolicies or procedures may deteriorate.
A material weakness is a control deficiency, or combination of control deficiencies, that result in more than aremote likelihood that a material weakness of the annual or interim financial statements will be prevented ordetected. The following material weakness has been identified and included in management’s assessment as ofDecember 31, 2006: The Company’s policies and procedures did not provide for effective oversight and reviewof the accounting for income taxes. Specifically, the Company’s policies and procedures did not include adequatemanagement review of various income tax calculations, reconciliations and related supporting documentation toensure that the Company’s accounting for income taxes, including accounting for income taxes associated withacquisitions made by the Company, was in accordance with generally accepted accounting principles. Thiscontrol deficiency resulted in errors in the Company’s interim and annual consolidated financial statements andmore than a remote likelihood that a material misstatement in the Company’s annual or interim consolidatedfinancial statements would not be prevented or detected. We also have audited, in accordance with the standardsof the Public Company Accounting Oversight Board (United States), the consolidated balance sheets of Entegris,Inc. as of December 31, 2006 and 2005, and the related consolidated statements of operations, shareholders’equity and comprehensive income (loss), and cash flows for the year ended December 31, 2006, the four-month
F-3

period ended December 31, 2005 and the years ended August 27, 2005 and August 28, 2004. This materialweakness was considered in determining the nature, timing, and extent of audit tests applied in our audit of the2006 consolidated financial statements, and this report does not affect our report dated March 16, 2007, whichexpressed an unqualified opinion on those consolidated financial statements.
In our opinion, management’s assessment that Entegris, Inc. did not maintain effective internal control overfinancial reporting as of December 31, 2006, is fairly stated, in all material respects, based on criteria establishedin Internal Control—Integrated Framework issued by the Committee of Sponsoring Organizations of theTreadway Commission (COSO). Also, in our opinion, because of the effect of the material weakness describedabove on the achievement of the objectives of the control criteria, Entegris, Inc. has not maintained effectiveinternal control over financial reporting as of December 31, 2006, based on criteria established in InternalControl—Integrated Framework issued by the Committee of Sponsoring Organizations of the TreadwayCommission (COSO).
/s/ KPMG LLP
Minneapolis, MinnesotaMarch 16, 2007
F-4

ENTEGRIS, INC. AND SUBSIDIARIESCONSOLIDATED BALANCE SHEETS
(In thousands, except share data) December 31, 2006 December 31, 2005
ASSETSCurrent assets:
Cash and cash equivalents . . . . . . . . . . . . . . . . . . . . . . . . . . . . . . . . . . . . $ 154,806 $ 142,838Short-term investments . . . . . . . . . . . . . . . . . . . . . . . . . . . . . . . . . . . . . . 120,168 131,565Trade accounts and notes receivable, net . . . . . . . . . . . . . . . . . . . . . . . . 128,960 110,146Inventories . . . . . . . . . . . . . . . . . . . . . . . . . . . . . . . . . . . . . . . . . . . . . . . . 94,697 69,535Deferred tax assets . . . . . . . . . . . . . . . . . . . . . . . . . . . . . . . . . . . . . . . . . . 45,149 33,585Assets of discontinued operations and other assets held for sale . . . . . . 2,243 14,655Other current assets . . . . . . . . . . . . . . . . . . . . . . . . . . . . . . . . . . . . . . . . . 8,534 10,635
Total current assets . . . . . . . . . . . . . . . . . . . . . . . . . . . . . . . . . . . . 554,557 512,959
Property, plant and equipment, net . . . . . . . . . . . . . . . . . . . . . . . . . . . . . . . . . 120,254 120,323
Other assets:Investments . . . . . . . . . . . . . . . . . . . . . . . . . . . . . . . . . . . . . . . . . . . . . . . 7,731 6,338Goodwill . . . . . . . . . . . . . . . . . . . . . . . . . . . . . . . . . . . . . . . . . . . . . . . . . 394,531 404,300Other intangible assets, net . . . . . . . . . . . . . . . . . . . . . . . . . . . . . . . . . . . 71,374 89,244Deferred tax assets . . . . . . . . . . . . . . . . . . . . . . . . . . . . . . . . . . . . . . . . . . 5,157 3,663Other . . . . . . . . . . . . . . . . . . . . . . . . . . . . . . . . . . . . . . . . . . . . . . . . . . . . 4,014 5,963
Total assets . . . . . . . . . . . . . . . . . . . . . . . . . . . . . . . . . . . . . . . . . . . $1,157,618 $1,142,790
LIABILITIES AND SHAREHOLDERS’ EQUITY
Current liabilities:Current maturities of long-term debt . . . . . . . . . . . . . . . . . . . . . . . . . . . . $ 401 $ 797Short-term borrowings . . . . . . . . . . . . . . . . . . . . . . . . . . . . . . . . . . . . . . . — 2,290Accounts payable . . . . . . . . . . . . . . . . . . . . . . . . . . . . . . . . . . . . . . . . . . . 25,202 33,585Accrued liabilities . . . . . . . . . . . . . . . . . . . . . . . . . . . . . . . . . . . . . . . . . . 57,049 58,570Income taxes payable . . . . . . . . . . . . . . . . . . . . . . . . . . . . . . . . . . . . . . . 22,177 15,775
Total current liabilities . . . . . . . . . . . . . . . . . . . . . . . . . . . . . . . . . 104,829 111,017
Long-term debt, less current maturities . . . . . . . . . . . . . . . . . . . . . . . . . . . . . . 2,995 3,383Pension benefit obligation and other liabilities . . . . . . . . . . . . . . . . . . . . . . . . 18,177 15,015Deferred tax liabilities . . . . . . . . . . . . . . . . . . . . . . . . . . . . . . . . . . . . . . . . . . . 15,637 556
Commitments and contingent liabilities
Shareholders’ equity:Common stock, par value $.01; 200,000,000 shares authorized; issued
and outstanding shares: 132,770,676 and 136,043,921 . . . . . . . . . . . . 1,328 1,360Additional paid-in capital . . . . . . . . . . . . . . . . . . . . . . . . . . . . . . . . . . . . 793,058 809,012Prepaid forward contract for share repurchase . . . . . . . . . . . . . . . . . . . . (5,000) —Retained earnings . . . . . . . . . . . . . . . . . . . . . . . . . . . . . . . . . . . . . . . . . . 228,936 206,936Accumulated other comprehensive loss . . . . . . . . . . . . . . . . . . . . . . . . . (2,342) (4,489)
Total shareholders’ equity . . . . . . . . . . . . . . . . . . . . . . . . . . . . . . 1,015,980 1,012,819
Total liabilities and shareholders’ equity . . . . . . . . . . . . . . . . . . $1,157,618 $1,142,790
See the accompanying notes to consolidated financial statements.
F-5

ENTEGRIS, INC. AND SUBSIDIARIESCONSOLIDATED STATEMENTS OF OPERATIONS
(In thousands, except per share data)
Year endedDecember 31,
2006
Four monthsended
December 31,2005
Year endedAugust 27,
2005
Year endedAugust 28,
2004
Sales to non-affiliates . . . . . . . . . . . . . . . . . . . . . . . . . . . . . . . $678,706 $202,296 $343,342 $304,947Sales to affiliates . . . . . . . . . . . . . . . . . . . . . . . . . . . . . . . . . . — — 14,691 32,207
Net sales . . . . . . . . . . . . . . . . . . . . . . . . . . . . . . . . . . . . . 678,706 202,296 358,033 337,154Cost of sales . . . . . . . . . . . . . . . . . . . . . . . . . . . . . . . . . . . . . . 372,557 132,332 218,443 186,895
Gross profit . . . . . . . . . . . . . . . . . . . . . . . . . . . . . . . . . . 306,149 69,964 139,590 150,259Selling, general and administrative expenses . . . . . . . . . . . . . 189,772 77,788 111,647 93,335Engineering, research and development expenses . . . . . . . . . 38,830 13,914 18,482 18,813
Operating profit (loss) . . . . . . . . . . . . . . . . . . . . . . . . . 77,547 (21,738) 9,461 38,111Interest income, net . . . . . . . . . . . . . . . . . . . . . . . . . . . . . . . . (9,205) (2,440) (2,538) (283)Other (income) expense, net . . . . . . . . . . . . . . . . . . . . . . . . . . (1,658) 62 (2,115) (1,066)
Income (loss) before income taxes and equity in(earnings) loss of affiliates . . . . . . . . . . . . . . . . . . . . 88,410 (19,360) 14,114 39,460
Income tax expense (benefit) . . . . . . . . . . . . . . . . . . . . . . . . . 26,505 (9,009) 1,081 12,464Equity in net (earnings) loss of affiliates . . . . . . . . . . . . . . . . (531) (70) 247 13
Income (loss) from continuing operations . . . . . . . . . 62,436 (10,281) 12,786 26,983
Income (loss) from operations of discontinued businesses,net of taxes . . . . . . . . . . . . . . . . . . . . . . . . . . . . . . . . . . . . . 1,030 (1,375) (3,393) (2,213)
Impairment loss on assets of discontinued businesses, net oftaxes . . . . . . . . . . . . . . . . . . . . . . . . . . . . . . . . . . . . . . . . . . — (6,668) — —
Income (loss) from discontinued operations, net oftaxes . . . . . . . . . . . . . . . . . . . . . . . . . . . . . . . . . . . . . . 1,030 (8,043) (3,393) (2,213)
Net income (loss) . . . . . . . . . . . . . . . . . . . . . . . . . . . . . . $ 63,466 $ (18,324) $ 9,393 $ 24,770
Basic earnings (loss) per common share:Continuing operations . . . . . . . . . . . . . . . . . . . . . . . . . . $ 0.46 $ (0.08) $ 0.17 $ 0.37Discontinued operations . . . . . . . . . . . . . . . . . . . . . . . . . 0.01 (0.06) (0.04) (0.03)
Net income (loss) . . . . . . . . . . . . . . . . . . . . . . . . . . . . . . $ 0.47 $ (0.14) $ 0.12 $ 0.34
Diluted earnings (loss) per common share:Continuing operations . . . . . . . . . . . . . . . . . . . . . . . . . . $ 0.45 $ (0.08) $ 0.16 $ 0.35Discontinued operations . . . . . . . . . . . . . . . . . . . . . . . . . 0.01 (0.06) (0.04) (0.03)
Net income (loss) . . . . . . . . . . . . . . . . . . . . . . . . . . . . . . $ 0.46 $ (0.14) $ 0.12 $ 0.32
Weighted shares outstandingBasic . . . . . . . . . . . . . . . . . . . . . . . . . . . . . . . . . . . . . . . . 135,116 135,437 77,137 72,957Diluted . . . . . . . . . . . . . . . . . . . . . . . . . . . . . . . . . . . . . . 138,492 135,437 79,328 76,220
See the accompanying notes to consolidated financial statements.
F-6

ENTEGRIS, INC. AND SUBSIDIARIESCONSOLIDATED STATEMENTS OF SHAREHOLDERS’ EQUITY AND COMPREHENSIVE INCOME (LOSS)
(In thousands)
Commonshares
outstandingCommon
stock
Additionalpaid-incapital
Deferredcompensation
expense
PrepaidForwardContractfor Share
RepurchaseRetainedearnings
Accumulatedother
comprehensiveincome (loss) Total
Comprehensiveincome (loss)
Balance at August 30, 2003 . . . . . . . . . . . . . . . . . . . . . . . . . . . . . 72,512 $ 725 $142,540 $ — — $192,207 $ 2,193 $ 337,665Shares issued under employee stock plans . . . . . . . . . . . . . . . 812 9 5,055 — — (14) — 5,050Shares issued in connection with prior year acquisition . . . . . 49 — 437 — — — — 437Deferred compensation related to restricted stock awards . . . 7 — 2,791 (2,791) — — — —Compensation earned in connection with restricted stock
awards . . . . . . . . . . . . . . . . . . . . . . . . . . . . . . . . . . . . . . . . . — — — 1,205 — — — 1,205Tax benefit associated with employee stock plans . . . . . . . . . — — 2,046 — — — — 2,046Foreign currency translation . . . . . . . . . . . . . . . . . . . . . . . . . . — — — — — — 1,207 1,207 $ 1,207Net unrealized gain on marketable securities . . . . . . . . . . . . . — — — — — — 397 397 397Reclassification adjustment for gain on sales of equity
investments . . . . . . . . . . . . . . . . . . . . . . . . . . . . . . . . . . . . . — — — — — — (592) (592) (592)Net income . . . . . . . . . . . . . . . . . . . . . . . . . . . . . . . . . . . . . . . — — — — — 24,770 — 24,770 24,770
Total comprehensive income . . . . . . . . . . . . . . . . . . . . . . . . $ 25,782
Balance at August 28, 2004 . . . . . . . . . . . . . . . . . . . . . . . . . . . . . 73,380 734 152,869 (1,586) — 216,963 3,205 372,185Shares issued under employee stock plans . . . . . . . . . . . . . . . 774 8 4,327 — — — — 4,335Shares issued in connection with prior year acquisition . . . . . 37 — 437 — — — — 437Shares issued in connection with Mykrolis acquisition . . . . . 60,785 608 603,162 — — — — 603,770Value of options assumed in connection with Mykrolis
acquisition . . . . . . . . . . . . . . . . . . . . . . . . . . . . . . . . . . . . . . — — 33,407 — — — — 33,407Deferred compensation recorded in connection with
Mykrolis acquisition . . . . . . . . . . . . . . . . . . . . . . . . . . . . . . — — — (4,142) — — — (4,142)Deferred compensation related to restricted stock awards . . . 547 5 21,638 (21,643) — — — —Compensation earned in connection with restricted stock
awards . . . . . . . . . . . . . . . . . . . . . . . . . . . . . . . . . . . . . . . . . — — — 5,465 — — — 5,465Repurchase and retirement of shares . . . . . . . . . . . . . . . . . . . (224) (2) (732) — — (1,096) — (1,830)Tax benefit associated with employee stock plans . . . . . . . . . — — 821 — — — — 821Foreign currency translation . . . . . . . . . . . . . . . . . . . . . . . . . . — — — — — — 1,086 1,086 $ 1,086Net unrealized gain on marketable securities . . . . . . . . . . . . . — — — — — — 71 71 71Reclassification adjustment for gain on sale of equity
investments . . . . . . . . . . . . . . . . . . . . . . . . . . . . . . . . . . . . . — — — — — — (1,584) (1,584) (1,584)Net income . . . . . . . . . . . . . . . . . . . . . . . . . . . . . . . . . . . . . . . — — — — — 9,393 — 9,393 9,393
Total comprehensive income . . . . . . . . . . . . . . . . . . . . . . . . $ 8,966
Balance at August 27, 2005 . . . . . . . . . . . . . . . . . . . . . . . . . . . . . 135,299 1,353 815,929 (21,906) — 225,260 2,778 1,023,414Reclassification upon adoption of SFAS No. 123 (R) . . . . . . — — (21,906) 21,906 — — — —Shares issued under employee stock option plans . . . . . . . . . 745 7 3,832 — — — — 3,839Stock-based compensation expense . . . . . . . . . . . . . . . . . . . . — — 11,053 — — — — 11,053Tax benefit associated with stock plans . . . . . . . . . . . . . . . . . — — 104 — — — — 104Foreign currency translation . . . . . . . . . . . . . . . . . . . . . . . . . . — — — — — — (7,225) (7,225) $ (7,225)Net change in unrealized loss on marketable securities, net of
tax . . . . . . . . . . . . . . . . . . . . . . . . . . . . . . . . . . . . . . . . . . . . — — — — — — (42) (42) (42)Net loss . . . . . . . . . . . . . . . . . . . . . . . . . . . . . . . . . . . . . . . . . . — — — — — (18,324) — (18,324) (18,324)
Total comprehensive income . . . . . . . . . . . . . . . . . . . . . . . . . . . . $(25,591)
F-7

ENTEGRIS, INC. AND SUBSIDIARIESCONSOLIDATED STATEMENTS OF SHAREHOLDERS’ EQUITY AND COMPREHENSIVE INCOME (LOSS)—(Continued)
(In thousands)
Commonshares
outstandingCommon
stock
Additionalpaid-incapital
Deferredcompensation
expense
PrepaidForwardContractfor Share
RepurchaseRetainedearnings
Accumulatedother
comprehensiveincome (loss) Total
Comprehensiveincome (loss)
Balance at December 31, 2005 . . . . . . . . . . . . . . . . . . . . . . . . . . . 136,044 1,360 809,012 — — 206,936 (4,489) 1,012,819Shares issued under employee stock plans . . . . . . . . . . . . . . . 5,607 57 19,962 — — — — 20,019Stock-based compensation expense . . . . . . . . . . . . . . . . . . . . — 14,776 — — — — 14,776Repurchase in process, and repurchase and retirement of
common stock . . . . . . . . . . . . . . . . . . . . . . . . . . . . . . . . . . . (8,880) (89) (53,445) — (5,000) (41,466) — (100,000)Tax benefit associated with stock plans . . . . . . . . . . . . . . . . . — — 2,753 — — — — 2,753Foreign currency translation . . . . . . . . . . . . . . . . . . . . . . . . . . — — — — — — 2,171 2,171 $ 2,171Net change in unrealized gain on . . . . . . . . . . . . . . . . . . . . . .marketable securities, net of tax . . . . . . . . . . . . . . . . . . . . . . . — — — — — 204 204 204Minimum pension liability adjustment to initially apply
SFAS No. 158 . . . . . . . . . . . . . . . . . . . . . . . . . . . . . . . . . . . — — — — — — (228) (228) —Net income . . . . . . . . . . . . . . . . . . . . . . . . . . . . . . . . . . . . . . . — — — — — 63,466 — 63,466 63,466
Total comprehensive income . . . . . . . . . . . . . . . . . . . . . . . . . . . . . — $65,841
Balance at December 31, 2006 . . . . . . . . . . . . . . . . . . . . . . . . . . . 132,771 $1,328 $793,058 $— $(5,000) $228,936 $(2,342) $1,015,980
The accumulated balances for each component of accumulated other comprehensive income (loss) are as follows:
(In thousands)
Foreigncurrency
translation
Netunrealizedgain (loss)
onmarketablesecurities
Minimumpensionliability
adjustment
Totalaccumulated
othercomprehensiveincome (loss)
Balance at August 30, 2003 . . . . . . . . . . . . . . . . . . . . . . . . . . . . . . . . . . . . . . . . . . . . . . . . . . . . . . . . . . . . . . . . . . . . . . . . . . . . . . . . . $ 512 $ 1,681 $ — $ 2,193Foreign currency translation . . . . . . . . . . . . . . . . . . . . . . . . . . . . . . . . . . . . . . . . . . . . . . . . . . . . . . . . . . . . . . . . . . . . . . . . . . . . . 1,207 — — 1,207Change in unrealized gain on marketable securities, net of tax of $243 . . . . . . . . . . . . . . . . . . . . . . . . . . . . . . . . . . . . . . . . . . . . — 397 — 397Reclassification adjustment for gain on sale of equity investments, net of tax of $408 . . . . . . . . . . . . . . . . . . . . . . . . . . . . . . . . — (592) — (592)
Balance at August 28, 2004 . . . . . . . . . . . . . . . . . . . . . . . . . . . . . . . . . . . . . . . . . . . . . . . . . . . . . . . . . . . . . . . . . . . . . . . . . . . . . . . . . 1,719 1,486 — 3,205Foreign currency translation . . . . . . . . . . . . . . . . . . . . . . . . . . . . . . . . . . . . . . . . . . . . . . . . . . . . . . . . . . . . . . . . . . . . . . . . . . . . . 1,086 — 1,086Change in unrealized gain on marketable securities, net of tax of $43 . . . . . . . . . . . . . . . . . . . . . . . . . . . . . . . . . . . . . . . . . . . . . — 71 — 71Reclassification adjustment for gain on sale of equity investments, net of tax of $1,142 . . . . . . . . . . . . . . . . . . . . . . . . . . . . . . . — (1,584) — (1,584)
Balance at August 27, 2005 . . . . . . . . . . . . . . . . . . . . . . . . . . . . . . . . . . . . . . . . . . . . . . . . . . . . . . . . . . . . . . . . . . . . . . . . . . . . . . . . . 2,805 (27) — 2,778Foreign currency translation . . . . . . . . . . . . . . . . . . . . . . . . . . . . . . . . . . . . . . . . . . . . . . . . . . . . . . . . . . . . . . . . . . . . . . . . . . . . . (7,225) — — (7,225)Change in unrealized loss on marketable securities, net of tax of $26 . . . . . . . . . . . . . . . . . . . . . . . . . . . . . . . . . . . . . . . . . . . . . (42) — (42)
Balance at December 31, 2005 . . . . . . . . . . . . . . . . . . . . . . . . . . . . . . . . . . . . . . . . . . . . . . . . . . . . . . . . . . . . . . . . . . . . . . . . . . . . . . (4,420) (69) — (4,489)Foreign currency translation . . . . . . . . . . . . . . . . . . . . . . . . . . . . . . . . . . . . . . . . . . . . . . . . . . . . . . . . . . . . . . . . . . . . . . . . . . . . . 2,171 — — 2,171Change in unrealized gain on marketable securities, net of tax of $125 . . . . . . . . . . . . . . . . . . . . . . . . . . . . . . . . . . . . . . . . . . . . — 204 — 204Minimum pension liability adjustment, net of tax of $113 . . . . . . . . . . . . . . . . . . . . . . . . . . . . . . . . . . . . . . . . . . . . . . . . . . . . . . — (228) (228)
Balance at December 31, 2006 . . . . . . . . . . . . . . . . . . . . . . . . . . . . . . . . . . . . . . . . . . . . . . . . . . . . . . . . . . . . . . . . . . . . . . . . . . . . . . $(2,249) $ 135 $(228) $(2,342)
See the accompanying notes to consolidated financial statements.
F-8

ENTEGRIS, INC. AND SUBSIDIARIESCONSOLIDATED STATEMENTS OF CASH FLOWS
(In thousands)
Year endedDecember 31,
2006
Four monthsended
December 31,2005
Yearended
August 27,2005
Year endedAugust 28,
2004
Operating activities:Net income (loss) . . . . . . . . . . . . . . . . . . . . . . . . . . . . . . . . . . . . . . . . . . . . . $ 63,466 $ (18,324) $ 9,393 $ 24,770Adjustments to reconcile net income (loss) to net cash provided by
operating activities:(Income) loss from discontinued operations . . . . . . . . . . . . . . . . . . . . . (1,030) 8,043 3,393 2,213Depreciation and amortization . . . . . . . . . . . . . . . . . . . . . . . . . . . . . . . 43,661 14,049 24,475 24,566Stock-based compensation expense . . . . . . . . . . . . . . . . . . . . . . . . . . . 14,776 11,053 5,465 1,205Impairment of property and equipment . . . . . . . . . . . . . . . . . . . . . . . . . 1,505 3,034 3,321 1,345Provision for doubtful accounts . . . . . . . . . . . . . . . . . . . . . . . . . . . . . . (508) (609) 212 46Provision for deferred income taxes . . . . . . . . . . . . . . . . . . . . . . . . . . . 11,155 (11,699) (5,047) 2,439Charge for fair value mark-up of acquired inventory sold . . . . . . . . . . — 17,837 5,946 —Tax benefit from employee stock plans . . . . . . . . . . . . . . . . . . . . . . . . — — 821 2,046Excess tax benefit from employee stock plans . . . . . . . . . . . . . . . . . . . (3,031) (104) — —Equity in net (earnings) loss of affiliates . . . . . . . . . . . . . . . . . . . . . . . (531) (70) 247 13Gain on sale of property and equipment . . . . . . . . . . . . . . . . . . . . . . . . (903) (103) (901) (859)Gain on sale of equity investments . . . . . . . . . . . . . . . . . . . . . . . . . . . . — (2,914) (1,126)Changes in operating assets and liabilities, excluding effects of
acquisitions:Trade accounts receivable and notes receivable . . . . . . . . . . . . . . . . (16,395) 8,529 (752) (20,280)Trade accounts receivable due from affiliates . . . . . . . . . . . . . . . . . — — 4,790 (588)Inventories . . . . . . . . . . . . . . . . . . . . . . . . . . . . . . . . . . . . . . . . . . . . . (23,205) 1,912 1,572 (5,755)Accounts payable and accrued liabilities . . . . . . . . . . . . . . . . . . . . . (10,775) (4,750) 4,085 13,958Other current assets . . . . . . . . . . . . . . . . . . . . . . . . . . . . . . . . . . . . . . 2,128 (2,201) (51) 98Income taxes payable and refundable income taxes . . . . . . . . . . . . . 9,439 (3,402) (3,985) 6,501Other . . . . . . . . . . . . . . . . . . . . . . . . . . . . . . . . . . . . . . . . . . . . . . . . . 6,117 195 702 (415)
Net cash provided by operating activities . . . . . . . . . . . . . . . . . 95,869 23,390 50,772 50,177
Investing activities:Acquisition of property and equipment . . . . . . . . . . . . . . . . . . . . . . . . . . . . . (29,975) (10,311) (19,559) (19,963)Acquisition of businesses, net of cash acquired . . . . . . . . . . . . . . . . . . . . . . — — (10,157) (5,133)Purchase of intangible assets . . . . . . . . . . . . . . . . . . . . . . . . . . . . . . . . . . . . . (1,008) (732) (727) (639)Proceeds from sales of property and equipment . . . . . . . . . . . . . . . . . . . . . . 3,866 113 2,191 2,713Proceeds from sale of equity investments . . . . . . . . . . . . . . . . . . . . . . . . . . . — — 5,020 2,151Purchases of short-term investments . . . . . . . . . . . . . . . . . . . . . . . . . . . . . . . (170,205) (14,265) (108,766) (98,510)Proceeds from sale or maturities of short-term investments . . . . . . . . . . . . . 181,412 12,079 93,235 32,180Cash and cash equivalents acquired through acquisition of Mykrolis . . . . . — — 97,498 —Other . . . . . . . . . . . . . . . . . . . . . . . . . . . . . . . . . . . . . . . . . . . . . . . . . . . . . . . (575) — (15) (26)
Net cash (used in) provided by investing activities . . . . . . . . . (16,485) (13,116) 58,720 (87,227)
Financing activities:Principal payments on short-term borrowings and long-term debt . . . . . . . . (3,087) (22,853) (21,568) (19,453)Proceeds from short-term borrowings and long-term debt . . . . . . . . . . . . . . — 3,478 22,129 16,238Repurchase in process, and repurchase and retirement of common stock . . (100,000) — (1,830) —Excess tax benefit from employee stock plans . . . . . . . . . . . . . . . . . . . . . . . 3,031 104 — —Issuance of common stock . . . . . . . . . . . . . . . . . . . . . . . . . . . . . . . . . . . . . . 20,019 3,839 4,335 5,050
Net cash (used in) provided by financing activities . . . . . . . . . (80,037) (15,432) 3,066 1,835
Discontinued operations:Net cash provided by (used in) operating activities . . . . . . . . . . . . . . . . . . . 1,030 (181) (3,960) (1,915)Net cash provided by (used in) investing activities . . . . . . . . . . . . . . . . . . . 13,063 1,863 (1,199) (1,422)
Net cash provided by (used in) discontinued operations . . . . . 14,093 1,682 (5,159) (3,337)
Effect of exchange rate changes on cash and cash equivalents . . . . . . . . . . (1,472) (3,724) 426 379
Increase (decrease) in cash and cash equivalents . . . . . . . . . . . 11,968 (7,200) 107,825 (38,173)Cash and cash equivalents at beginning of period . . . . . . . . . . . . . . . . . . 142,838 150,038 42,213 80,386
Cash and cash equivalents at end of period . . . . . . . . . . . . . . . . . . . . . . . $ 154,806 $142,838 $ 150,038 $ 42,213
Supplemental Cash Flow Information
Non-cash transactions: . . . . . . . . . . . . . . . . . . . . . . . . . . . . . . . . . . . . . . . . .Acquisition of Mykrolis, net of transaction costs . . . . . . . . . . . . . . . . . . . — — $ 637,609 —
Schedule of interest and income taxes paid:Interest expense . . . . . . . . . . . . . . . . . . . . . . . . . . . . . . . . . . . . . . . . . . . . . $ 463 $ 367 $ 840 $ 1,213Income taxes, net of refunds received . . . . . . . . . . . . . . . . . . . . . . . . . . . . 2,502 683 9,482 1,138
See accompanying notes to consolidated financial statements.
F-9
ENTEGRIS, INC.NOTES TO CONSOLIDATED FINANCIAL STATEMENTS
(1) SUMMARY OF SIGNIFICANT ACCOUNTING POLICIES
Nature of Operations and Principles of Consolidation Entegris is a worldwide developer, manufacturer andsupplier of materials integrity management solutions to the microelectronics industry in general and to thesemiconductor and data storage markets in particular. The consolidated financial statements include the accountsof the Company and its majority-owned subsidiaries. Intercompany profits, transactions and balances have beeneliminated in consolidation.
The Company was incorporated in Delaware in June 2005 under the name Eagle DE, Inc. (Eagle DE) as a whollyowned subsidiary of Entegris, Inc., a Minnesota corporation (Entegris Minnesota). Effective August 6, 2005,Entegris Minnesota and Mykrolis Corporation, a Delaware corporation, completed a strategic merger of equalstransaction, pursuant to which they were each merged into the Company to carry on the combined businesses.Pursuant to the merger the Company’s name was changed to Entegris, Inc. The stock-for-stock transaction wasaccounted for under the purchase method of accounting as an acquisition of Mykrolis by the Company.
Fiscal Year On December 13, 2005, the Company’s Board of Directors approved a change in fiscal year endfrom a 52-week or 53-week fiscal year period ending on the last Saturday of August to a fiscal year endingDecember 31. The Company’s new fiscal quarters consist of 13 week periods that end on Saturday. TheCompany’s fiscal quarters in 2006 ended on April 1, 2006, July 1, 2006, September 30, 2006 and December 31,2006. As a result, the financial periods presented and discussed are as follows: (i) the year ended December 31,2006 represents the twelve months ended December 31, 2006; (ii) the four-month transition period represents thefour months ended December 31, 2005; (iii) the year ended August 27, 2005 represents the twelve months endedAugust 27, 2005; and (iv) the year ended August 28, 2004 represents the twelve months ended August 28, 2004.
Basis of Presentation Certain amounts reported in previous years have been reclassified to conform to thecurrent year’s presentation. These classifications had no effect on the amounts, total assets, net income,shareholders’ equity or cash flow from operations of the Company.
Cash Flow Statement Revisions In accordance with Statement of Financial Accounting Standard (“SFAS”)No. 95, “Statement of Cash Flows,” the net cash flows from operating and investing activities reported in theConsolidated Statements of Cash Flows have been revised to separately disclose the net cash flows attributable tothe operating and investing activities of discontinued operations. There were no cash flows attributable tofinancing activities of discontinued operations. The Company’s Consolidated Statements of Cash Flow for priorfiscal years previously reported the combined cash flows attributable to operating and investing activities ofdiscontinued operations as a single amount.
Use of Estimates The preparation of consolidated financial statements in conformity with accounting principlesgenerally accepted in the United States requires management to make estimates and assumptions that affect thereported amounts of assets and liabilities, particularly receivables, inventories, accrued expenses and incometaxes, and disclosure of contingent assets and liabilities at the date of the consolidated financial statements andthe reported amounts of revenues and expenses during the reporting period. Actual results could differ from thoseestimates.
Stock-based Compensation In December 2004, the Financial Accounting Standards Board (“FASB”) issuedStatement of Financial Accounting Standard (“SFAS”) No. 123R, Share-Based Payment. SFAS No. 123R is arevision of FASB Statement No. 123, “Accounting for Stock-Based Compensation,” and supersedes AccountingPrinciples Board (“APB”) Opinion No. 25, “Accounting for Stock Issued to Employees,” and amends SFASNo. 95, “Statement of Cash Flows,” and its related implementation guidance. SFAS No. 123R focuses primarilyon accounting for transactions in which an entity obtains employee services through share-based paymenttransactions. SFAS No. 123R requires a public entity to measure the cost of employee services received in
F-10

exchange for the award of equity instruments based on the fair value of the award at the date of grant. The cost isto be recognized over the period during which an employee is required to provide services in exchange for theaward.
SFAS No. 123R also requires the benefit of tax deductions in excess of recognized compensation expense to bereported as a financing cash flow, rather than as an operating cash flow as prescribed under previous accountingrules. This requirement reduces net operating cash flows and increases net financing cash flows in periodssubsequent to adoption. Total cash flows remain unchanged from those reported under previous accounting rules.Effective August 28, 2005, the Company adopted the provisions of SFAS No. 123R using the modifiedprospective method. Results of operations for prior annual periods have not been restated to reflect recognition ofstock-based compensation expense. Upon adoption of SFAS No. 123R, the Company applied an estimatedforfeiture rate to unvested awards. Previously, the Company recorded forfeitures as incurred.
Prior to the adoption of SFAS No. 123R, the Company followed the intrinsic value method in accordance withAPB 25 to account for its employee stock options and employee share purchase plan. Accordingly, nocompensation expense was recognized for share purchase rights granted in connection with the issuance of stockoptions under the Company’s employee stock option plan or employee stock purchase plan; however,compensation expense was recognized in connection with the issuance of restricted stock awards. The adoptionof SFAS No. 123R primarily resulted in a change in the Company’s method of recognizing stock-basedcompensation and estimating forfeitures for unvested awards. See Note 17 to the Consolidated FinancialStatements for additional information on stock-based compensation.
Cash, Cash Equivalents and Short-term Investments Cash and cash equivalents include cash on hand andhighly liquid debt securities with original maturities of three months or less, which are valued at cost. Debtsecurities with original maturities greater than three months and remaining maturities of less than one year areclassified and accounted for as available for sale and are recorded at fair value, and are classified as short-terminvestments.
Inventories Inventories are stated at the lower of cost or market. Cost is determined by the first-in, first-out(FIFO) method.
Property, Plant, and Equipment Property, plant and equipment are carried at cost and are depreciatedprincipally on the straight-line method over the estimated useful lives of the assets. When assets are retired ordisposed of, the cost and related accumulated depreciation are removed from the accounts, and gains or losses arerecognized in the same period. Maintenance and repairs are expensed as incurred; significant additions andimprovements are capitalized. Property, plant and equipment are reviewed for impairment whenever events orchanges in circumstances indicate that the carrying amount of an asset or group of asset(s) may not berecoverable based on estimated future undiscounted cash flows. The amount of impairment, if any, is measuredas the difference between the net book value and the estimated fair value of the asset(s).
Investments The Company’s nonmarketable investments are accounted for under either the cost or equitymethod of accounting, as appropriate. All equity investments are periodically reviewed to determine if declines,if any, in fair value below cost basis are other-than-temporary. Significant and sustained decreases in quotedmarket prices and a series of historical and projected operating losses by investees are considered in the review.If the decline in fair value is determined to be other-than-temporary, an impairment loss is recorded and theinvestment written down to a new cost basis.
Fair Value of Financial Instruments The carrying value of cash equivalents, short-term investments, accountsreceivable, accounts payable and short-term debt approximates fair value due to the short maturity of thoseinstruments. The fair value of long-term debt was estimated using discounted cash flows based on market interestrates for similar instruments and approximated its carrying value at December 31, 2006.
Goodwill and Other Intangible Assets Goodwill is the excess of the purchase price over the fair value of netassets of acquired businesses. The Company does not amortize goodwill, but tests for impairment at least
F-11

annually. Other amortizable intangible assets include, among other items, patents, unpatented and otherdeveloped technology and customer-based intangibles, and are amortized using the straight-line method overtheir respective estimated useful lives of 3 to 10 years. The Company reviews intangible assets for impairment ifchanges in circumstances or the occurrence of events suggest the remaining value is not recoverable.
Derivative Financial Instruments SFAS No. 133, Accounting for Derivative Instruments and HedgingActivities, requires the Company to record derivatives as assets or liabilities on the balance sheet and to measuresuch instruments at fair value. Changes in fair value of derivatives are recorded each period in current results ofoperations or other comprehensive income, depending on whether the derivative is designated as part of a hedgetransaction.
The Company periodically enters into forward foreign currency contracts to reduce exposures relating to ratechanges in certain foreign currencies. Certain exposures to credit losses related to counterparty nonperformanceexist. However, the Company does not anticipate nonperformance by the counterparties since they are large,well-established financial institutions. None of these derivatives is accounted for as a hedge transaction under theprovisions of SFAS No. 133. Accordingly, changes in the fair value of forward foreign currency contracts arerecorded as a component of net income. The fair values of the Company’s derivative financial instruments arebased on prices quoted by financial institutions for these instruments. The Company was a party to forwardforeign currency contracts with notional amounts of $58.3 million and $12.8 million at December 31, 2006 andDecember 31, 2005, respectively.
Foreign Currency Translation Assets and liabilities of foreign subsidiaries are translated from foreigncurrencies into U.S. dollars at period-end exchange rates. Income statement amounts are translated at theweighted average exchange rates for the year. Gains and losses resulting from foreign currency transactions areincluded in other income, net in the consolidated statements of operations.
Revenue Recognition/Concentration of Risk Revenue and the related cost of sales are generally recognizedupon shipment of the products. Revenue for product sales is recognized upon delivery, when title and risk of losshave been transferred to the customer; collectibility is reasonably assured, and pricing is fixed or determinable.For certain customized precision cleaning equipment sales with installation and customer acceptance provisions,which constituted less than 1% of sales, revenue is recognized upon fulfillment of such provisions.
The Company provides for estimated returns and warranty obligations when the revenue is recorded. TheCompany sells its products throughout the world primarily to companies in the microelectronics industry. TheCompany performs continuing credit evaluations of its customers and generally does not require collateral.Letters of credit may be required from its customers in certain circumstances. The Company maintains anallowance for doubtful accounts which management believes is adequate to cover losses on trade receivables.
Certain materials included in the Company’s products are obtained from a single source or a limited group ofsuppliers. Although the Company seeks to reduce dependence on those sole and limited source suppliers, thepartial or complete loss of these sources could have at least a temporary adverse effect on the Company’s resultsof operations. Furthermore, a significant increase in the price of one or more of these components couldadversely affect the Company’s results of operations.
Income Taxes Deferred income taxes are provided in amounts sufficient to give effect to temporary differencesbetween financial and tax reporting. The Company accounts for tax credits as reductions of income tax expensein the year in which such credits are allowable for tax purposes. The Company utilizes the asset and liabilitymethod for computing its deferred income taxes. Under the asset and liability method, deferred tax assets andliabilities are based on the temporary difference between the financial statement and tax basis of assets andliabilities and the enacted tax rates expected to apply to taxable income in the years in which these temporarydifferences are expected to be recovered or settled. The effect on deferred tax assets and liabilities of a change intax rates is recognized in income in the period that includes the enactment date.
F-12

The Company intends to continue to reinvest its undistributed international earnings in its internationaloperations; therefore, no U.S. tax expense has been recorded to cover the repatriation of such undistributedearnings.
Comprehensive Income (Loss) Comprehensive income (loss) represents the change in shareholders’ equityresulting from other than shareholder investments and distributions. The Company’s foreign currency translationadjustments, unrealized gains and losses on marketable securities and minimum pension liability adjustments areincluded in accumulated other comprehensive income (loss). Comprehensive income (loss) and the componentsof accumulated other comprehensive income (loss) are presented in the accompanying consolidated statements ofshareholders’ equity and comprehensive income (loss).
Recent Accounting Pronouncements In July 2006, the FASB issued FASB Interpretation No. 48, Accountingfor Uncertainty in Income Taxes, an interpretation of FASB Statement No. 109 (FIN No. 48). FIN No. 48 iseffective for the Company as of January 1, 2007. FIN No. 48 defines the threshold for recognizing the benefits oftax positions in the financial statements as “more-likely-than-not” to be sustained upon examination. Theinterpretation also provides guidance on the de-recognition, measurement and classification of income taxuncertainties, along with any related interest and penalties. FIN No. 48 also requires expanded disclosure at theend of each annual reporting period including a tabular reconciliation of unrecognized tax benefits. In accordancewith FIN No. 48, the Company will report the difference between the net amount of assets and liabilitiesrecognized in the statement of financial position prior to and after the application of FIN No. 48 as a cumulativeeffect adjustment to the January 1, 2007 balance of retained earnings. The adoption of FIN No. 48 is currentlynot expected to have a material effect on the Company’s consolidated financial statements.
In September 2006, the FASB issued SFAS No. 157, Fair Value Measurements (SFAS No. 157). This statementprovides a single definition of fair value, a framework for measuring fair value and expanded disclosuresconcerning fair value. Previously, different definitions of fair value were contained in various accountingpronouncements creating inconsistencies in measurement and disclosures. SFAS No. 157 applies under thosepreviously issued pronouncements that prescribe fair value as the relevant measure of value, except SFASNo. 123(R) and related interpretations and pronouncements that require or permit measurement similar to fairvalue, but are not intended to measure fair value. SFAS No. 157 is effective for financial statements issued forfiscal years beginning after November 15, 2007, and interim periods within those fiscal years. The Company hasnot yet determined the impact on its consolidated financial statements, if any, of adopting the provisions of SFASNo. 157.
In September 2006, the FASB issued SFAS No. 158, Employers’ Accounting for Defined Benefit Pension andOther Postretirement Plans—an amendment of FASB Statements No. 87, 88, 106 and 132(R) (SFAS No. 158).This statement requires balance sheet recognition of the overfunded or underfunded status of pension andpostretirement benefit plans. Under SFAS No. 158, actuarial gains and losses, prior service costs or credits, andany remaining transition assets or obligations that have not been recognized under previous accounting standardsmust be recognized in accumulated other comprehensive income (loss), net of tax effects, until they areamortized as a component of net periodic benefit cost. In addition, the measurement date (the date at which planassets and the benefit obligation are measured) is required to be the Company’s fiscal year end. The Companyadopted the recognition provisions of SFAS No. 158 effective December 31, 2006. See Note 18 to theconsolidated financial statements. The adoption of SFAS No. 158 did not have a material impact on theCompany’s consolidated results of operations.
In September 2006, the Securities and Exchange Commission (SEC) issued Staff Accounting Bulletin (SAB)No. 108, Considering the Effects of Prior Year Misstatements when Quantifying Misstatements in Current YearFinancial Statements. SAB No. 108 provides interpretive guidance on how the effects of the carryover orreversal of prior year misstatements should be considered in quantifying a current year misstatement. The SECstaff believes that registrants should quantify errors using both a balance sheet and an income statement approachand evaluate whether either approach results in quantifying a misstatement that, when all relevant quantitative
F-13

and qualitative factors are considered, is material. SAB No. 108 is effective as of the end of fiscal years endingafter November 15, 2006. The adoption of SAB No. 108 did not have a material impact on the Company’sconsolidated financial statements.
(2) ACQUISITIONS AND DIVESTITURES
Acquisition of Mykrolis Corporation
On August 6, 2005, Entegris merged with Mykrolis Corporation (Mykrolis) in a transaction accounted for as anacquisition for a purchase price of approximately $645.0 million, which included Entegris common stock andvested share awards, as well as transaction costs.
Mykrolis was a worldwide developer, manufacturer and supplier of liquid and gas delivery systems, componentsand consumables used to precisely measure, deliver, control and purify the process liquids, gases and chemicalsthat are used in the semiconductor manufacturing process. Its products were also used to manufacture a range ofother products, such as flat panel displays, high purity chemicals, photoresists, solar cells, gas lasers, optical andmagnetic storage devices and fiber optic cables. Mykrolis sold its products worldwide through a direct sales forceand through distributors in selected regions. The acquisition was made to expand the Company’s global network,expand its product offering base and enhance the leverage of its manufacturing and administrative functions.
The fair value of Entegris equity securities was derived using an average market price per share of Entegriscommon stock of $9.94, which was based on Entegris’ average stock price for the period two days beforethrough two days after the terms of the acquisition were agreed to and announced on March 21, 2005, net ofregistration costs associated with the issued securities. Under the terms of the merger agreement, eachoutstanding share of Mykrolis common stock was exchanged for 1.39 shares of Entegris common stock in atax-free transaction. Accordingly, no amount of goodwill is expected to be deductible for tax purposes.
The acquisition was accounted for as a purchase business combination. Under the purchase method ofaccounting, the assets acquired and liabilities assumed from Mykrolis are recorded at the date of acquisition, attheir respective fair values. The consolidated financial statements and reported results of operations of Entegrisissued after completion of the acquisition reflect these values. The Company’s consolidated financial statementsinclude the net assets and results of operations from August 6, 2005, the date of acquisition.
The following table summarizes the components of the purchase price:
(In thousands, except per share data) Conversion Calculation Fair Value
Common stockMykrolis common stock outstanding as of August 6, 2005 . . . . . . . 43,730Exchange ratio . . . . . . . . . . . . . . . . . . . . . . . . . . . . . . . . . . . . . . . . . 1.39
Entegris common stock issued . . . . . . . . . . . . . . . . . . . . . . . . . . . . . 60,785Value of Entegris’ common stock . . . . . . . . . . . . . . . . . . . . . . . . . . $ 9.94 $604,202
Stock optionsValue of Entegris stock options issued in exchange for Mykrolis
stock options as of August 6, 2005(1) . . . . . . . . . . . . . . . . . . . . . . 33,407Other transaction costs . . . . . . . . . . . . . . . . . . . . . . . . . . . . . . . . . 7,389
Total estimated purchase price . . . . . . . . . . . . . . . . . . . . . . . . . . . . . $644,998
(1) Estimated fair value of 8,790 Entegris stock options (in thousands) issued as of August 6, 2005 in exchangefor 6,323 Mykrolis outstanding stock options (in thousands), calculated using the Black-Scholes optionpricing model, modified for dividends, with model assumptions estimated as of March 21, 2005 and anEntegris stock price of $9.94.
F-14

Allocation of Purchase Price
The above purchase price has been allocated based on the fair values of assets acquired and liabilities assumed.The final valuation of net assets was completed in 2006.
(In thousands)
Book value of net assets acquired . . . . . . . . . . . . . . . . . . . . . . . . . . . . . . . . . . . . . $283,137Less existing goodwill and other intangible assets . . . . . . . . . . . . . . . . . . . . . . . . 51,134
Book value of tangible net assets acquired . . . . . . . . . . . . . . . . . . . . . . . . . . . . . . 232,003
Remaining allocation:Increase inventories to fair value(a) . . . . . . . . . . . . . . . . . . . . . . . . . . . . . . . . 23,783Decrease property, plant and equipment to fair value(b) . . . . . . . . . . . . . . . . . (10,273)Record identifiable intangible assets(c) . . . . . . . . . . . . . . . . . . . . . . . . . . . . . . 75,800Increase benefit plan liabilities to fair value(d) . . . . . . . . . . . . . . . . . . . . . . . . (1,059)Decrease net assets to be sold to fair value(b)(e) . . . . . . . . . . . . . . . . . . . . . . . (22,756)Increase other net assets to fair value . . . . . . . . . . . . . . . . . . . . . . . . . . . . . . . 1,938Adjustments of tax-related assets and liabilities(f) . . . . . . . . . . . . . . . . . . . . . 18,385Goodwill(g) . . . . . . . . . . . . . . . . . . . . . . . . . . . . . . . . . . . . . . . . . . . . . . . . . . . 327,177
Purchase price . . . . . . . . . . . . . . . . . . . . . . . . . . . . . . . . . . . . . . . . . . . . . . . . . . . . $644,998
Since the Company’s initial allocation of the purchase price in August 2005, the significant revisions to theCompany’s estimates related primarily to net assets to be sold ($5.9 million decrease) and tax adjustments ($9.7million increase).
The following table summarizes the allocation of the Mykrolis purchase price to the fair values of the assetsacquired and liabilities assumed (In thousands):
Cash, cash equivalents and short-term investments . . . . . . . . . . . . . . . . . . . . . . . . $120,525Accounts receivable, inventories and other current assets . . . . . . . . . . . . . . . . . . . 125,325Property, plant and equipment . . . . . . . . . . . . . . . . . . . . . . . . . . . . . . . . . . . . . . . . 31,247Other intangible assets . . . . . . . . . . . . . . . . . . . . . . . . . . . . . . . . . . . . . . . . . . . . . . 75,800Goodwill . . . . . . . . . . . . . . . . . . . . . . . . . . . . . . . . . . . . . . . . . . . . . . . . . . . . . . . . . 327,177Other assets . . . . . . . . . . . . . . . . . . . . . . . . . . . . . . . . . . . . . . . . . . . . . . . . . . . . . . 48,647
Total assets acquired . . . . . . . . . . . . . . . . . . . . . . . . . . . . . . . . . . . . . . . . . . . 728,721
Current liabilities . . . . . . . . . . . . . . . . . . . . . . . . . . . . . . . . . . . . . . . . . . . . . . . . . . (74,578)Other liabilities . . . . . . . . . . . . . . . . . . . . . . . . . . . . . . . . . . . . . . . . . . . . . . . . . . . . (13,287)
Total liabilities assumed . . . . . . . . . . . . . . . . . . . . . . . . . . . . . . . . . . . . . . . . . (87,865)
Deferred compensation—Unvested options and restricted stock awards . . . . . . . 4,142
Net assets acquired . . . . . . . . . . . . . . . . . . . . . . . . . . . . . . . . . . . . . . . . . . . . . . . . . $644,998
(a) The fair value of acquired inventories, developed in consultation with independent valuationspecialists, was determined as follows:
• Finished goods—the estimated selling price less the cost of disposal and reasonable profit forthe selling effort.
• Work in process—the estimated selling price of finished goods less the cost to complete, costof disposal and reasonable profit on the selling and remaining manufacturing efforts.
• Raw materials—estimated current replacement cost, which equaled Mykrolis’ historical cost.
F-15
The increase in inventories to record the fair values of finished goods and work in process were as follows:
(In thousands)
Finished goods . . . . . . . . . . . . . . . . . . . . . . . . . . . . . . . . . . . . . . . . . . . . . . . . . . . . . . . . . . . . . $17,401Work in process . . . . . . . . . . . . . . . . . . . . . . . . . . . . . . . . . . . . . . . . . . . . . . . . . . . . . . . . . . . . 6,382
Total . . . . . . . . . . . . . . . . . . . . . . . . . . . . . . . . . . . . . . . . . . . . . . . . . . . . . . . . . . . . . . . . . . . . . $23,783
(b) The fair value of acquired property, plant and equipment, developed in consultation with independentvaluation specialists, was valued at its value-in-use, unless there was a known plan to dispose of anasset. Assets to be disposed of were valued at prevailing market rates, less costs to sell.
(c) The Company worked with independent valuation specialists to determine the fair value of identifiableintangible assets, which were as follows:
(In thousands of dollars) Fair valueUseful life in
years
Weightedaverage life in
years
Developed technology . . . . . . . . . . . . . . . . . . . . . . . . . . . . . . $38,500 3–6 4.6Trademarks and trade names . . . . . . . . . . . . . . . . . . . . . . . . . 9,000 3–8 4.9Customer relationships and other . . . . . . . . . . . . . . . . . . . . . . 28,300 9 9.0
Total . . . . . . . . . . . . . . . . . . . . . . . . . . . . . . . . . . . . . . . . . . . . $75,800
The total weighted average life of identifiable intangible assets acquired from Mykrolis that are subject toamortization is 6.25 years.
Developed technology represents the technical processes, intellectual property, and institutionalunderstanding that were acquired from Mykrolis with respect to products, compounds and/or processes forwhich development had been completed.
The fair value of identifiable intangible assets was determined using the “income approach” on aproject-by-project basis. This method starts with a forecast of expected future net cash flows. These net cashflow projections do not anticipate any revenue or cost synergies. These cash flows are then adjusted topresent value by applying an appropriate discount rate that reflects the risk factors associated with the cashflow streams, some of which are more certain than others.
The valuations were based on the information that was available as of the acquisition date and theexpectations and assumptions that have been deemed reasonable by the Company’s management. Noassurance can be given, however, that the underlying assumptions or events associated with such assets willoccur as projected. For these reasons, among others, the actual results may vary from the projected results.
(d) The increase to fair value for acquired benefit plans was $1.1 million for pension benefit obligations. Thefair value of the pension obligations, determined in consultation with independent actuarial specialists,includes assumptions relating to economic factors such as interest rates of high quality fixed incomeinvestments, demographic factors such as salary growth projections and other data, such as expectedemployee terminations. The underlying assets of the plans were measured using market rates as of theacquisition date.
(e) The decrease for net assets to be sold is based on fair value less cost to sell at disposal. On September 12,2005 the Company announced that it would divest the gas delivery (GD) product line included in theMykrolis acquisition. The assessment and formulation of a plan to exit the GD business began in the periodleading up to the date of consummation. This divestiture was completed in February 2006. The GD productline includes mass flow controllers, pressure controllers and vacuum gauges that are used by customers inmanufacturing operations to measure and control process gas flow rates and to control and monitor pressureand vacuum levels during the manufacturing process. As part of the purchase accounting allocation forMykrolis, the $13.1 million fair value of the assets of the GD business was classified as an asset held forsale.
F-16
(f) Gives effect to the estimated tax effects of the acquisition.(g) In accordance with the requirements of SFAS No. 142, Goodwill and Other Intangible Assets (SFAS
No.142), the goodwill associated with the merger will not be amortized. None of the goodwill is deductiblefor tax purposes. The goodwill recorded in connection with the acquisition is expected to be realizedthrough the benefits of cost-saving synergies associated with the leveraging of the Company’smanufacturing and administrative functions as well as the enhancement of sales and marketing through thecompany’s expanded global network and product offerings.
Pro Forma Results
The following unaudited pro forma financial information presents the combined results of operations of theCompany as if the acquisition of Mykrolis had occurred as of the beginning of the years presented. The unauditedpro forma financial information is not necessarily indicative of what the Company’s consolidated results ofoperations actually would have been had the acquisition occurred at the beginning of each year. In addition, theunaudited pro forma financial information does not attempt to project the future results of operations of thecombined company.
(In thousands of dollars, except per share data) (Unaudited)
Year endedAugust 27,
2005
Year endedAugust 28,
2004
Net sales . . . . . . . . . . . . . . . . . . . . . . . . . . . . . . . . . . . . . . . . . . . . . . . . . . . . . . $612,892 $536,221Income from continuing operations . . . . . . . . . . . . . . . . . . . . . . . . . . . . . . . . . 42,200 43,691Net income . . . . . . . . . . . . . . . . . . . . . . . . . . . . . . . . . . . . . . . . . . . . . . . . . . . . 29,171 34,499Per share amounts:
Income from continuing operations per common share-basic . . . . . . . . . 0.31 0.34Net income per common share—basic . . . . . . . . . . . . . . . . . . . . . . . . . . 0.22 0.27
Income from continuing operations per common share-diluted . . . . . . . 0.30 0.32Net income per common share—diluted . . . . . . . . . . . . . . . . . . . . . . . . . 0.21 0.26
The unaudited pro forma financial information above gives effect to the following:
a. The elimination of transactions between Entegris and Mykrolis, which upon completion of the mergerwould be considered intercompany. This reflects the elimination of inter-company sales and associatedintercompany profit.
b. Incremental amortization and depreciation expense of approximately $6.6 million and $7.3 million in2005 and 2004, respectively, related to the estimated fair value of identifiable intangible assets andproperty, plant and equipment from the purchase price allocation. Identifiable intangible assets arebeing amortized over their estimated useful lives over a range of 3 to 9 years and property, plant andequipment is being depreciated over the estimated useful lives of the underlying assets.
c. The pro forma data includes the results of operations for Entegris, Inc. for the twelve months endedAugust 27, 2005 and August 28, 2004 for 2005 and 2004, respectively, while the results of operationsfor Mykrolis are included for the twelve-month period ended July 2, 2005 and July 3, 2004,respectively.
d. The above pro forma results have been reclassified to segregate the operating results of discontinuedoperations.
The unaudited pro forma financial information above for the year ended August 28, 2004 excludes the purchaseaccounting impact of the incremental charge of $23.8 million reported in cost of sales for the sale of acquiredinventory that was written up to fair value.
F-17

Prior year acquisition
In May 2004, the Company completed the acquisition of a precision parts cleaning business located inMontpellier, France in a cash transaction for total consideration of $4.5 million, of which $0.9 million was paidin 2005. The transaction was made to expand the geographic reach of Entegris’ materials integrity managementservices. Identifiable intangible assets and goodwill of approximately $0.8 million and $1.2 million, respectively,were recorded in connection with the transaction. The fiscal 2004 transaction was accounted for by the purchasemethod. Accordingly, the Company’s consolidated financial statements include the net assets and results ofoperations from the date of the acquisition.
Divestitures and Discontinued Operations
On September 12, 2005, the Company announced that it would divest its gas delivery, life science and tape andreel product lines. The gas delivery products included mass flow controllers, pressure controllers and vacuumgauges that are used by customers in manufacturing operations to measure and control process gas flow rates andto control and monitor pressure and vacuum levels during the semiconductor manufacturing process. The lifesciences products included stainless steel clean in place systems for life sciences applications. Tape and reelproducts included the Stream™ product line, which is a packaging system designed to protect and transportmicroelectronic components, while enabling the high-speed automated placement of the components onto printedcircuit boards used for electronics.
The assets and liabilities of the life sciences product line and the assets of the tape and reel product line were soldin December 2005 for net proceeds of $0.8 million and $1.0 million, respectively. The Company closed the saleof the gas delivery assets in February 2006. After adjustments for severance, sublease payments and other closingcosts, the net proceeds of the sale totaled $13.1 million. As part of the purchase accounting allocation of theacquisition of Mykrolis, the fair value of the assets of the gas delivery product line were classified as assets heldfor sale as of the date of the August 6, 2005 acquisition. Accordingly, the Company adjusted its purchase priceallocation related to the assets of the gas delivery product line and did not recognize a gain or loss from the sale.
The consolidated financial statements have been reclassified to segregate as discontinued operations the assetsand liabilities, and operating results of, the product lines divested for all periods presented. The summary ofoperating results from discontinued operations is as follows:
(In thousands)
Year endedDecember 31,
2006
Four monthsended
December 31,2005
Year endedAugust 27,
2005
Year endedAugust28, 2004
Net sales . . . . . . . . . . . . . . . . . . . . . . . . . . . . . . . . . . . . . . . . . $3,403 $15,473 $ 9,066 $ 9,610
Loss from discontinued operations, before income taxes . . . $ (760) $ (9,599) $(5,446) $(3,543)Income tax benefit . . . . . . . . . . . . . . . . . . . . . . . . . . . . . . . . . 1,790 1,556 2,053 1,330
Income (loss) from discontinued operations, net of taxes . . . $1,030 $ (8,043) $(3,393) $(2,213)
No interest expense was allocated to the operating results of discontinued operations. The after-tax earnings ofdiscontinued operations in the year ended December 31, 2006 included a tax benefit of $1.6 million associatedwith a decrease in the company’s deferred tax asset valuation allowance resulting from the resolution of a matterwith respect to the characterization of certain gains and losses.
Assets of discontinued operations and other assets held for sale shown in the Consolidated Balance Sheet as ofDecember 31, 2005 include the net assets of the gas delivery business carried at $13.6 million, and a buildingunrelated to the above product lines held for sale carried at $1.1 million. This building was sold in the secondquarter of 2006 for net proceeds of $1.8 million, resulting in a pre-tax gain of $0.7 million which was recorded asa reduction of cost of sales. At December 31, 2006, that account included a building located in Germany held forsale carried at $2.2 million.
F-18
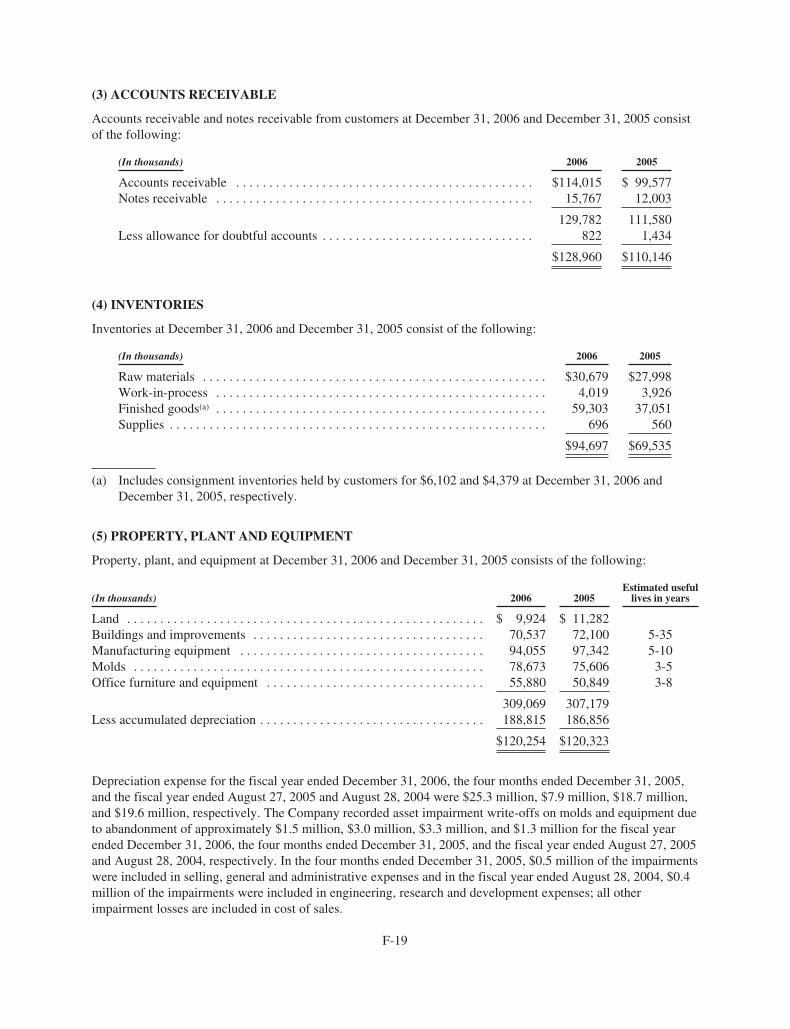
(3) ACCOUNTS RECEIVABLE
Accounts receivable and notes receivable from customers at December 31, 2006 and December 31, 2005 consistof the following:
(In thousands) 2006 2005
Accounts receivable . . . . . . . . . . . . . . . . . . . . . . . . . . . . . . . . . . . . . . . . . . . . . $114,015 $ 99,577Notes receivable . . . . . . . . . . . . . . . . . . . . . . . . . . . . . . . . . . . . . . . . . . . . . . . . 15,767 12,003
129,782 111,580Less allowance for doubtful accounts . . . . . . . . . . . . . . . . . . . . . . . . . . . . . . . . 822 1,434
$128,960 $110,146
(4) INVENTORIES
Inventories at December 31, 2006 and December 31, 2005 consist of the following:
(In thousands) 2006 2005
Raw materials . . . . . . . . . . . . . . . . . . . . . . . . . . . . . . . . . . . . . . . . . . . . . . . . . . . . $30,679 $27,998Work-in-process . . . . . . . . . . . . . . . . . . . . . . . . . . . . . . . . . . . . . . . . . . . . . . . . . . 4,019 3,926Finished goods(a) . . . . . . . . . . . . . . . . . . . . . . . . . . . . . . . . . . . . . . . . . . . . . . . . . . 59,303 37,051Supplies . . . . . . . . . . . . . . . . . . . . . . . . . . . . . . . . . . . . . . . . . . . . . . . . . . . . . . . . . 696 560
$94,697 $69,535
(a) Includes consignment inventories held by customers for $6,102 and $4,379 at December 31, 2006 andDecember 31, 2005, respectively.
(5) PROPERTY, PLANT AND EQUIPMENT
Property, plant, and equipment at December 31, 2006 and December 31, 2005 consists of the following:
(In thousands) 2006 2005Estimated useful
lives in years
Land . . . . . . . . . . . . . . . . . . . . . . . . . . . . . . . . . . . . . . . . . . . . . . . . . . . . . . $ 9,924 $ 11,282Buildings and improvements . . . . . . . . . . . . . . . . . . . . . . . . . . . . . . . . . . . 70,537 72,100 5-35Manufacturing equipment . . . . . . . . . . . . . . . . . . . . . . . . . . . . . . . . . . . . . 94,055 97,342 5-10Molds . . . . . . . . . . . . . . . . . . . . . . . . . . . . . . . . . . . . . . . . . . . . . . . . . . . . . 78,673 75,606 3-5Office furniture and equipment . . . . . . . . . . . . . . . . . . . . . . . . . . . . . . . . . 55,880 50,849 3-8
309,069 307,179Less accumulated depreciation . . . . . . . . . . . . . . . . . . . . . . . . . . . . . . . . . . 188,815 186,856
$120,254 $120,323
Depreciation expense for the fiscal year ended December 31, 2006, the four months ended December 31, 2005,and the fiscal year ended August 27, 2005 and August 28, 2004 were $25.3 million, $7.9 million, $18.7 million,and $19.6 million, respectively. The Company recorded asset impairment write-offs on molds and equipment dueto abandonment of approximately $1.5 million, $3.0 million, $3.3 million, and $1.3 million for the fiscal yearended December 31, 2006, the four months ended December 31, 2005, and the fiscal year ended August 27, 2005and August 28, 2004, respectively. In the four months ended December 31, 2005, $0.5 million of the impairmentswere included in selling, general and administrative expenses and in the fiscal year ended August 28, 2004, $0.4million of the impairments were included in engineering, research and development expenses; all otherimpairment losses are included in cost of sales.
F-19

(6) INVESTMENTS
Equity Investments
During 2004, the Company recorded other income of $1.1 million on the sale of an aggregate 0.5 million sharesof common stock of Nortem N.V. (formerly Metron Technology N.V.), a publicly traded security for totalproceeds of $5.0 million.
On August 16, 2004, Nortem announced that it had entered into an agreement with Applied Materials, Inc.(Applied), pursuant to which Applied would acquire the business assets of Nortem. On December 14, 2004,Nortem completed its sale to Applied of the outstanding shares of Nortem’s worldwide operating subsidiariesand substantially all of the other assets held at the Nortem level. Immediately following the closing, Nortementered into liquidation.
Subsequently, Nortem paid two liquidation distributions to shareholders of record in the amount of $4.77 perNortem share for each of the remaining 1.1 million shares owned by the Company. Accordingly, based on theCompany’s carrying value of $2.00 per share and the $5.0 million cash distribution, the Company recorded apre-tax gain of approximately $2.9 million that was reflected as other income in the year ended August 27, 2005.
In addition, as a result of the liquidation activities of Nortem, Nortem ceased to be an affiliate of the Company asof February 2005. Accordingly, the Company no longer classifies its trade receivable due from Nortemseparately in its consolidated balance sheet, nor have sales after that date been categorized as sales to affiliates.Sales to Nortem under previous distribution agreements classified as sales to affiliates were $14.7 million and$32.2 million in the years ended August 27, 2005 and August 28, 2004, respectively.
At December 31, 2006, the Company held equity investments totaling $7.7 million in certain privately heldcompanies accounted for under either the cost or equity method of accounting, as appropriate.
Short-term Investments
Short-term investments at December 31, 2006 and December 31, 2005 consist of the following:
(In thousands) 2006 2005
Municipal bonds . . . . . . . . . . . . . . . . . . . . . . . . . . . . . . . . . . . . . . . . . . . . . . . . $ — $ 24,110Variable rate demand notes . . . . . . . . . . . . . . . . . . . . . . . . . . . . . . . . . . . . . . . . 16,825 24,025Auction rate securities . . . . . . . . . . . . . . . . . . . . . . . . . . . . . . . . . . . . . . . . . . . . 78,550 70,200U.S government agencies . . . . . . . . . . . . . . . . . . . . . . . . . . . . . . . . . . . . . . . . . — 2,026Corporate debt securities . . . . . . . . . . . . . . . . . . . . . . . . . . . . . . . . . . . . . . . . . . 24,793 11,204
$120,168 $131,565
The amortized cost, gross unrealized losses and the fair value of the Company’s short-term investments are asfollows:
(In thousands) 2006 2005
Amortized cost . . . . . . . . . . . . . . . . . . . . . . . . . . . . . . . . . . . . . . . . . . . . . . . . . $120,170 $131,696Gross unrealized losses . . . . . . . . . . . . . . . . . . . . . . . . . . . . . . . . . . . . . . . . . . . (2) (131)
Fair value . . . . . . . . . . . . . . . . . . . . . . . . . . . . . . . . . . . . . . . . . . . . . . . . . . . . . . $120,168 $131,565
F-20

The contractual maturities of the Company’s short-term investments are as follows:
(In thousands) 2006 2005
Within one year . . . . . . . . . . . . . . . . . . . . . . . . . . . . . . . . . . . . . . . . . . . . . . . . . $120,168 $130,028Over one to two years . . . . . . . . . . . . . . . . . . . . . . . . . . . . . . . . . . . . . . . . . . . . — 1,537
Fair value . . . . . . . . . . . . . . . . . . . . . . . . . . . . . . . . . . . . . . . . . . . . . . . . . . . . . . $120,168 $131,565
Realized gains and losses were not material for the fiscal year ended December 31, 2006, the four months endedDecember 31, 2005, and the fiscal years ended August 27, 2005 and August 28, 2004.
(7) INTANGIBLE ASSETS
The changes in the carrying amount of goodwill for the years ended December 31, 2006 and for the four monthsended December 31, 2005 are as follows:
(In thousands) 2006 2005
Beginning of period . . . . . . . . . . . . . . . . . . . . . . . . . . . . . . . . . . . . . . . . . . . . . . $404,300 $400,882Adjustments to Mykrolis purchase price allocation . . . . . . . . . . . . . . . . . . . . . (9,499) 3,485Other, including foreign currency remeasurement adjustment . . . . . . . . . . . . . (270) (67)
End of year . . . . . . . . . . . . . . . . . . . . . . . . . . . . . . . . . . . . . . . . . . . . . . . . . . . . $394,531 $404,300
As of December 31, 2006, goodwill amounted to approximately $394.5 million, about $9.8 million less than thebalance at December 31, 2005. The decrease mainly reflected adjustments to the purchase price allocation of theMykrolis acquisition completed in August 2005. The Mykrolis purchase price had been preliminarily allocatedbased on estimates of the fair values of assets acquired and liabilities assumed as of August 6, 2005. The finalvaluation of net assets was completed in 2006.
Other intangible assets, excluding goodwill, at December 31, 2006 and December 31, 2005 were as follows:
(In thousands)
2006Gross carrying
amountAccumulatedamortization
Net carryingvalue
Weightedaverage life in
years
Patents . . . . . . . . . . . . . . . . . . . . . . . . . . . . . . . . . . . . . . . $ 17,978 $11,325 $ 6,653 9.0Unpatented technology . . . . . . . . . . . . . . . . . . . . . . . . . . . 9,844 5,460 4,384 10.0Developed technology . . . . . . . . . . . . . . . . . . . . . . . . . . . 38,500 12,020 26,480 4.6Trademarks and trade names . . . . . . . . . . . . . . . . . . . . . . 9,000 3,212 5,788 4.9Customer relationships . . . . . . . . . . . . . . . . . . . . . . . . . . . 28,000 4,303 23,697 9.1Employment and noncompete agreements . . . . . . . . . . . 5,818 4,863 955 5.8Other . . . . . . . . . . . . . . . . . . . . . . . . . . . . . . . . . . . . . . . . . 7,033 3,616 3,417 7.4
$116,173 $44,799 $71,374 7.1
(In thousands)
2005Gross carrying
amountAccumulatedamortization
Net carryingvalue
Weightedaverage life in
years
Patents . . . . . . . . . . . . . . . . . . . . . . . . . . . . . . . . . . . . . . . $ 17,969 $ 9,321 $ 8,648 9.0Unpatented technology . . . . . . . . . . . . . . . . . . . . . . . . . . . 9,844 4,477 5,367 10.0Developed technology . . . . . . . . . . . . . . . . . . . . . . . . . . . 38,500 3,409 35,091 4.6Trademarks and trade names . . . . . . . . . . . . . . . . . . . . . . 9,000 911 8,089 4.9Customer relationships . . . . . . . . . . . . . . . . . . . . . . . . . . . 28,000 1,220 26,780 9.1Employment and noncompete agreements . . . . . . . . . . . 5,818 4,214 1,604 5.8Other . . . . . . . . . . . . . . . . . . . . . . . . . . . . . . . . . . . . . . . . . 6,667 3,002 3,665 8.0
$115,798 $26,554 $89,244 7.1
F-21

Amortization expense was $18.3 million, $6.2 million, $5.8 million, and $5.0 million in the fiscal year endedDecember 31, 2006, the four months ended December 31, 2005, and the fiscal years ended August 27, 2005 andAugust 28, 2004, respectively.
Estimated amortization expense for the fiscal years 2007 to 2011, and thereafter, is $18.4 million, $16.5 million,$13.9 million, $8.5 million, $5.0 million, and $9.1 million, respectively.
(8) ACCRUED LIABILITIES
Accrued liabilities at December 31, 2006 and December 31, 2005 consist of the following:
(In thousands) 2006 2005
Payroll and related benefits . . . . . . . . . . . . . . . . . . . . . . . . . . . . . . . . . . . . . . . . . . $34,063 $35,740Employee benefits . . . . . . . . . . . . . . . . . . . . . . . . . . . . . . . . . . . . . . . . . . . . . . . . . 6,150 6,756Taxes, other than income taxes . . . . . . . . . . . . . . . . . . . . . . . . . . . . . . . . . . . . . . . 1,005 2,455Royalties . . . . . . . . . . . . . . . . . . . . . . . . . . . . . . . . . . . . . . . . . . . . . . . . . . . . . . . . 582 1,587Deferred revenue and related . . . . . . . . . . . . . . . . . . . . . . . . . . . . . . . . . . . . . . . . 955 1,940Warranty and related . . . . . . . . . . . . . . . . . . . . . . . . . . . . . . . . . . . . . . . . . . . . . . . 1,957 2,111Other . . . . . . . . . . . . . . . . . . . . . . . . . . . . . . . . . . . . . . . . . . . . . . . . . . . . . . . . . . . 12,337 7,981
$57,049 $58,570
(9) WARRANTY
The Company accrues for warranty costs based on historical trends and the expected material and labor costs toprovide warranty services. The majority of products sold are generally covered by a warranty for periods rangingfrom 90 days to one year. The following table summarizes the activity related to the product warranty liabilityduring the fiscal year ended December 31, 2006, the four months ended December 31, 2005, and the fiscal yearsended August 27, 2005 and August 28, 2004:
Year endedDecember 31,
2006
Four monthsended
December 31,2005
Year endedAugust 27,
2005
Year endedAugust 28,
2004
Beginning of period . . . . . . . . . . . . . . . . . . . . . . . . . . . . . . . . $ 2,111 $ 2,343 $ 2,034 $2,065Accrual for warranties issued during the period . . . . . . . . . . 2,153 981 2,171 867Adjustment of previously recorded accruals . . . . . . . . . . . . . (212) — (730) —Assumption of liability in connection with acquisition . . . . . — — 694 —Settlements during the period . . . . . . . . . . . . . . . . . . . . . . . . . (2,095) (1,213) (1,826) (898)
End of period . . . . . . . . . . . . . . . . . . . . . . . . . . . . . . . . . . . . . $ 1,957 $ 2,111 $ 2,343 $2,034
(10) LONG-TERM DEBT
Long-term debt at December 31, 2006 and December 31, 2005 consists of the following:
(In thousands) 2006 2005
Stock redemption notes payable with interest of 8% through December 2010 . . . . $1,609 $2,032Commercial loans secured by property and equipment . . . . . . . . . . . . . . . . . . . . . . — 328Small Business Administration loans with interest ranging from 5.5% to 7.35%
and various maturities through October 2020 . . . . . . . . . . . . . . . . . . . . . . . . . . . . 1,787 1,820
Total . . . . . . . . . . . . . . . . . . . . . . . . . . . . . . . . . . . . . . . . . . . . . . . . . . . . . . . . . 3,396 4,180Less current maturities . . . . . . . . . . . . . . . . . . . . . . . . . . . . . . . . . . . . . . . . . . . 401 797
$2,995 $3,383
F-22
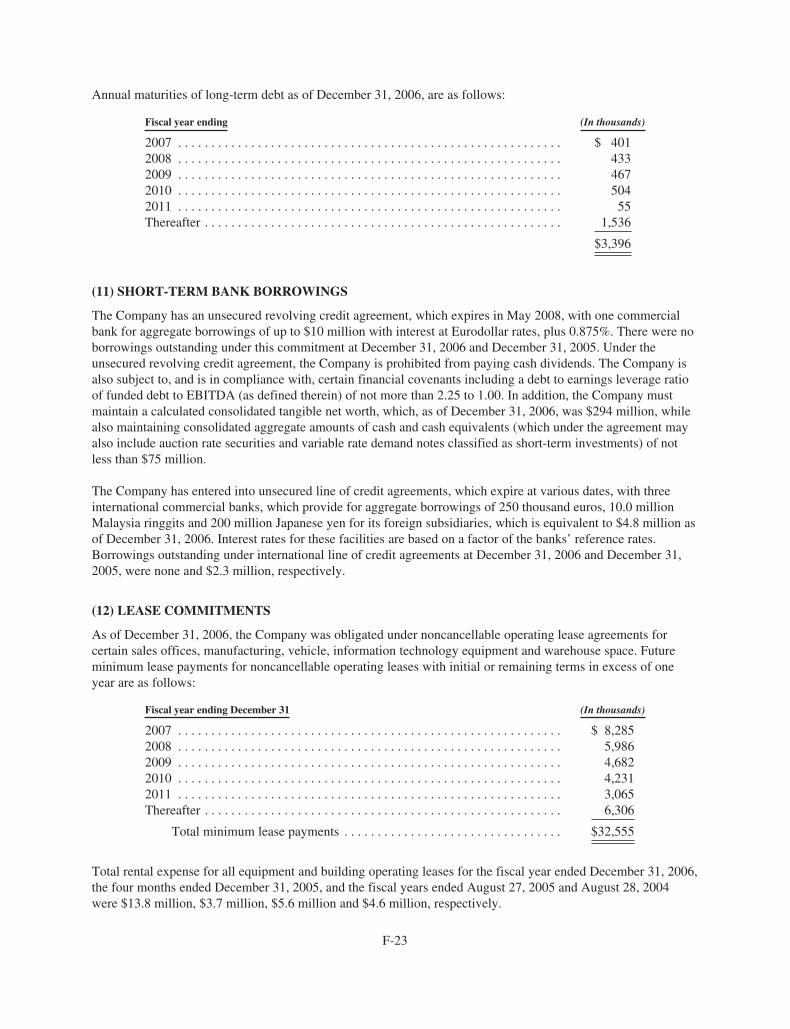
Annual maturities of long-term debt as of December 31, 2006, are as follows:
Fiscal year ending (In thousands)
2007 . . . . . . . . . . . . . . . . . . . . . . . . . . . . . . . . . . . . . . . . . . . . . . . . . . . . . . . . . . $ 4012008 . . . . . . . . . . . . . . . . . . . . . . . . . . . . . . . . . . . . . . . . . . . . . . . . . . . . . . . . . . 4332009 . . . . . . . . . . . . . . . . . . . . . . . . . . . . . . . . . . . . . . . . . . . . . . . . . . . . . . . . . . 4672010 . . . . . . . . . . . . . . . . . . . . . . . . . . . . . . . . . . . . . . . . . . . . . . . . . . . . . . . . . . 5042011 . . . . . . . . . . . . . . . . . . . . . . . . . . . . . . . . . . . . . . . . . . . . . . . . . . . . . . . . . . 55Thereafter . . . . . . . . . . . . . . . . . . . . . . . . . . . . . . . . . . . . . . . . . . . . . . . . . . . . . . 1,536
$3,396
(11) SHORT-TERM BANK BORROWINGS
The Company has an unsecured revolving credit agreement, which expires in May 2008, with one commercialbank for aggregate borrowings of up to $10 million with interest at Eurodollar rates, plus 0.875%. There were noborrowings outstanding under this commitment at December 31, 2006 and December 31, 2005. Under theunsecured revolving credit agreement, the Company is prohibited from paying cash dividends. The Company isalso subject to, and is in compliance with, certain financial covenants including a debt to earnings leverage ratioof funded debt to EBITDA (as defined therein) of not more than 2.25 to 1.00. In addition, the Company mustmaintain a calculated consolidated tangible net worth, which, as of December 31, 2006, was $294 million, whilealso maintaining consolidated aggregate amounts of cash and cash equivalents (which under the agreement mayalso include auction rate securities and variable rate demand notes classified as short-term investments) of notless than $75 million.
The Company has entered into unsecured line of credit agreements, which expire at various dates, with threeinternational commercial banks, which provide for aggregate borrowings of 250 thousand euros, 10.0 millionMalaysia ringgits and 200 million Japanese yen for its foreign subsidiaries, which is equivalent to $4.8 million asof December 31, 2006. Interest rates for these facilities are based on a factor of the banks’ reference rates.Borrowings outstanding under international line of credit agreements at December 31, 2006 and December 31,2005, were none and $2.3 million, respectively.
(12) LEASE COMMITMENTS
As of December 31, 2006, the Company was obligated under noncancellable operating lease agreements forcertain sales offices, manufacturing, vehicle, information technology equipment and warehouse space. Futureminimum lease payments for noncancellable operating leases with initial or remaining terms in excess of oneyear are as follows:
Fiscal year ending December 31 (In thousands)
2007 . . . . . . . . . . . . . . . . . . . . . . . . . . . . . . . . . . . . . . . . . . . . . . . . . . . . . . . . . . $ 8,2852008 . . . . . . . . . . . . . . . . . . . . . . . . . . . . . . . . . . . . . . . . . . . . . . . . . . . . . . . . . . 5,9862009 . . . . . . . . . . . . . . . . . . . . . . . . . . . . . . . . . . . . . . . . . . . . . . . . . . . . . . . . . . 4,6822010 . . . . . . . . . . . . . . . . . . . . . . . . . . . . . . . . . . . . . . . . . . . . . . . . . . . . . . . . . . 4,2312011 . . . . . . . . . . . . . . . . . . . . . . . . . . . . . . . . . . . . . . . . . . . . . . . . . . . . . . . . . . 3,065Thereafter . . . . . . . . . . . . . . . . . . . . . . . . . . . . . . . . . . . . . . . . . . . . . . . . . . . . . . 6,306
Total minimum lease payments . . . . . . . . . . . . . . . . . . . . . . . . . . . . . . . . . $32,555
Total rental expense for all equipment and building operating leases for the fiscal year ended December 31, 2006,the four months ended December 31, 2005, and the fiscal years ended August 27, 2005 and August 28, 2004were $13.8 million, $3.7 million, $5.6 million and $4.6 million, respectively.
F-23

(13) RESTRUCTURING COSTS
On November 29, 2005, the Company announced that during 2006 it would close its manufacturing plant locatedin Bad Rappenau, Germany and relocate the production of products made in that facility to other existingmanufacturing plants located in the United States and Asia. In addition, the Company is moving its BadRappenau administrative center to Dresden, Germany. In connection with these actions, the Company expectsestimated charges of $7.4 million for employee severance and retention costs (generally over the employees’required remaining term of service) and asset impairment and accelerated depreciation.
Severance and retention costs, mainly classified as selling, general and administrative expense, totaled $4.4million and $0.6 for the year ended December 31, 2006 and four months ended December 31, 2005, respectively.Other costs of $1.2 million and $1.1 million, related to fixed asset write-offs and accelerated depreciationclassified in cost of sales, were also recorded in for the year ended December 31, 2006 and four months endedDecember 31, 2005, respectively.
In addition, the Company’s facility in Bad Rappenau became available for sale during the third quarter of 2006and is classified in other assets held for sale as of December 31, 2006 at a carrying value of $2.2 million.
For the year ended December 31, 2006 and four months ended December 31, 2005, the accrued liabilities,provisions and payments associated with the employee severance and retention costs of the Bad Rappenaurestructuring activity were as follows:
(In thousands)
Yearended
December 31,2006
Four monthsended
December 31, 2005
Accrued liabilities at beginning of period . . . . . . . . . . . . . . . . . . $ 568 $—Provision . . . . . . . . . . . . . . . . . . . . . . . . . . . . . . . . . . . . . . . . . . . . 4,368 576Payments . . . . . . . . . . . . . . . . . . . . . . . . . . . . . . . . . . . . . . . . . . . (4,295) (8)
Accrued liabilities at end of period . . . . . . . . . . . . . . . . . . . . . . . $ 641 $568
(14) INTEREST INCOME, NET
Interest income, net consists of the following:
(In thousands)
Year endedDecember 31,
2006
Four monthsended
December 31,2005
Year endedAugust 27,
2005
Year endedAugust 28,
2004
Interest income . . . . . . . . . . . . . . . . . . . . . . . . . . . . . . . . . . . . $9,668 $2,753 $3,404 $ 1,454Interest expense . . . . . . . . . . . . . . . . . . . . . . . . . . . . . . . . . . . (463) (313) (866) (1,171)
Interest income, net . . . . . . . . . . . . . . . . . . . . . . . . . . . . $9,205 $2,440 $2,538 $ 283
(15) OTHER (INCOME) EXPENSE, NET
Other (income) expense, net consists of the following:
(In thousands)
Year endedDecember 31,
2006
Four monthsended
December 31,2005
Year endedAugust 27,
2005
Year endedAugust 28,
2004
(Gain) loss on foreign currency remeasurement . . . . . . . . . . $ (794) $(401) $ 884 $ 179Gain on sale of equity investments . . . . . . . . . . . . . . . . . . . . . — — (2,914) (1,126)Other, net . . . . . . . . . . . . . . . . . . . . . . . . . . . . . . . . . . . . . . . . (864) 463 (85) (119)
Other (income) expense, net . . . . . . . . . . . . . . . . . . . . . . $(1,658) $ 62 $(2,115) $(1,066)
F-24
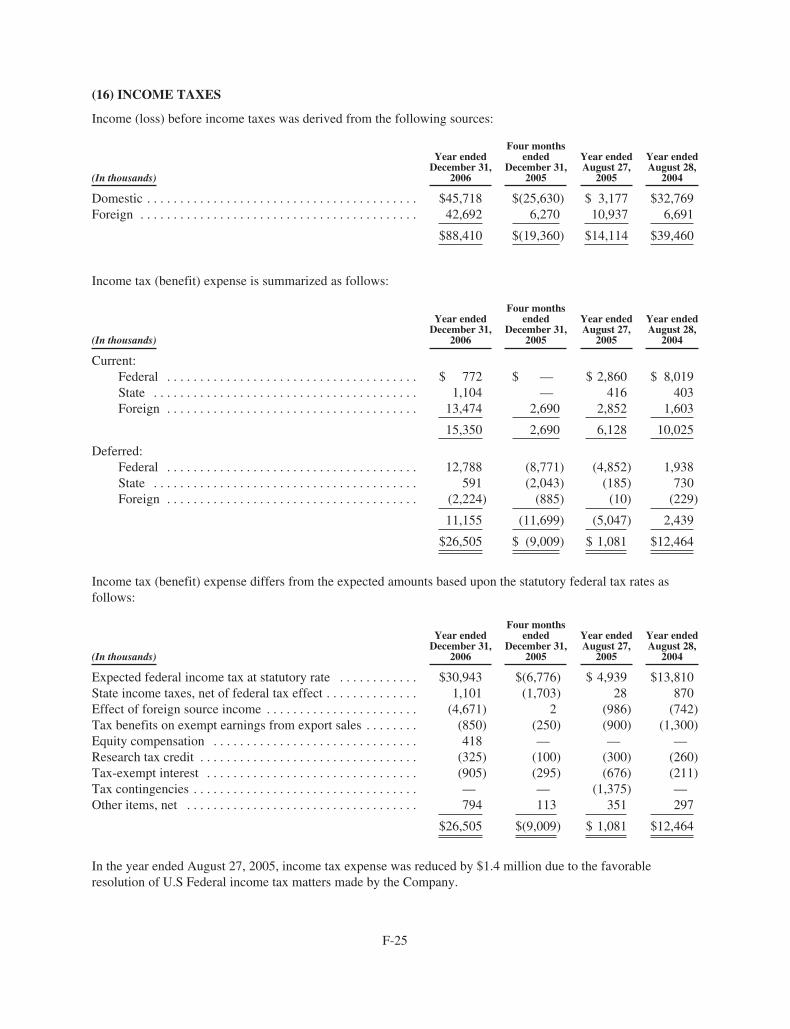
(16) INCOME TAXES
Income (loss) before income taxes was derived from the following sources:
(In thousands)
Year endedDecember 31,
2006
Four monthsended
December 31,2005
Year endedAugust 27,
2005
Year endedAugust 28,
2004
Domestic . . . . . . . . . . . . . . . . . . . . . . . . . . . . . . . . . . . . . . . . . $45,718 $(25,630) $ 3,177 $32,769Foreign . . . . . . . . . . . . . . . . . . . . . . . . . . . . . . . . . . . . . . . . . . 42,692 6,270 10,937 6,691
$88,410 $(19,360) $14,114 $39,460
Income tax (benefit) expense is summarized as follows:
(In thousands)
Year endedDecember 31,
2006
Four monthsended
December 31,2005
Year endedAugust 27,
2005
Year endedAugust 28,
2004
Current:Federal . . . . . . . . . . . . . . . . . . . . . . . . . . . . . . . . . . . . . . $ 772 $ — $ 2,860 $ 8,019State . . . . . . . . . . . . . . . . . . . . . . . . . . . . . . . . . . . . . . . . 1,104 — 416 403Foreign . . . . . . . . . . . . . . . . . . . . . . . . . . . . . . . . . . . . . . 13,474 2,690 2,852 1,603
15,350 2,690 6,128 10,025
Deferred:Federal . . . . . . . . . . . . . . . . . . . . . . . . . . . . . . . . . . . . . . 12,788 (8,771) (4,852) 1,938State . . . . . . . . . . . . . . . . . . . . . . . . . . . . . . . . . . . . . . . . 591 (2,043) (185) 730Foreign . . . . . . . . . . . . . . . . . . . . . . . . . . . . . . . . . . . . . . (2,224) (885) (10) (229)
11,155 (11,699) (5,047) 2,439
$26,505 $ (9,009) $ 1,081 $12,464
Income tax (benefit) expense differs from the expected amounts based upon the statutory federal tax rates asfollows:
(In thousands)
Year endedDecember 31,
2006
Four monthsended
December 31,2005
Year endedAugust 27,
2005
Year endedAugust 28,
2004
Expected federal income tax at statutory rate . . . . . . . . . . . . $30,943 $(6,776) $ 4,939 $13,810State income taxes, net of federal tax effect . . . . . . . . . . . . . . 1,101 (1,703) 28 870Effect of foreign source income . . . . . . . . . . . . . . . . . . . . . . . (4,671) 2 (986) (742)Tax benefits on exempt earnings from export sales . . . . . . . . (850) (250) (900) (1,300)Equity compensation . . . . . . . . . . . . . . . . . . . . . . . . . . . . . . . 418 — — —Research tax credit . . . . . . . . . . . . . . . . . . . . . . . . . . . . . . . . . (325) (100) (300) (260)Tax-exempt interest . . . . . . . . . . . . . . . . . . . . . . . . . . . . . . . . (905) (295) (676) (211)Tax contingencies . . . . . . . . . . . . . . . . . . . . . . . . . . . . . . . . . . — — (1,375) —Other items, net . . . . . . . . . . . . . . . . . . . . . . . . . . . . . . . . . . . 794 113 351 297
$26,505 $(9,009) $ 1,081 $12,464
In the year ended August 27, 2005, income tax expense was reduced by $1.4 million due to the favorableresolution of U.S Federal income tax matters made by the Company.
F-25

As a result of commitments made by the Company related to investment in tangible property and equipment(approximately $43 million by December 31, 2008), the establishment of a research and development center in2006 and certain employment commitments through 2010, income from certain manufacturing activities inMalaysia is exempt from tax for years up through 2015. The income tax benefits attributable to the tax status ofthese subsidiaries are estimated to be $2.4 million (2 cents per diluted share), $0.4 million (zero cents per dilutedshare), $1.0 million (1 cent per diluted share), and $0.7 million (1 cent per diluted share) for the year endedDecember 31, 2006, four months ended December 31, 2005 and years ended August 27, 2005 and August 28,2004, respectively.
$2.8 million, $0.1 million, $0.8 million and $2.0 million was added to additional paid-in capital in accordancewith FAS No. 123R or APB No. 25 reflecting tax differences relating to employee stock option and restrictedstock award transactions for the year ended December 31, 2006, four months ended December 31, 2005 andyears ended August 27, 2005 and August 28, 2004, respectively.
The tax effects of temporary differences that give rise to significant portions of the deferred tax assets anddeferred tax liabilities at December 31, 2006 and December 31, 2005 are as follows:
(In thousands) 2006 2005
Deferred tax assets attributable to:Accounts receivable . . . . . . . . . . . . . . . . . . . . . . . . . . . . . . . . . . . . . . . . . . . . . . . . . . . . . $ 873 $ 851Inventory . . . . . . . . . . . . . . . . . . . . . . . . . . . . . . . . . . . . . . . . . . . . . . . . . . . . . . . . . . . . . . 5,351 6,895Intercompany profit . . . . . . . . . . . . . . . . . . . . . . . . . . . . . . . . . . . . . . . . . . . . . . . . . . . . . . 9,505 3,760Accruals not currently deductible for tax purposes . . . . . . . . . . . . . . . . . . . . . . . . . . . . . . 10,443 11,922Net operating loss carryforwards . . . . . . . . . . . . . . . . . . . . . . . . . . . . . . . . . . . . . . . . . . . 16,526 23,163Tax credit carryforwards . . . . . . . . . . . . . . . . . . . . . . . . . . . . . . . . . . . . . . . . . . . . . . . . . . 6,038 3,304Accelerated depreciation . . . . . . . . . . . . . . . . . . . . . . . . . . . . . . . . . . . . . . . . . . . . . . . . . . — 842Equity compensation . . . . . . . . . . . . . . . . . . . . . . . . . . . . . . . . . . . . . . . . . . . . . . . . . . . . . 6,876 2,265Capital loss carryforward . . . . . . . . . . . . . . . . . . . . . . . . . . . . . . . . . . . . . . . . . . . . . . . . . 711 2,162Purchase accounting items . . . . . . . . . . . . . . . . . . . . . . . . . . . . . . . . . . . . . . . . . . . . . . . . 3,676 11,308Other, net . . . . . . . . . . . . . . . . . . . . . . . . . . . . . . . . . . . . . . . . . . . . . . . . . . . . . . . . . . . . . . 1,231 211
Gross deferred tax assets . . . . . . . . . . . . . . . . . . . . . . . . . . . . . . . . . . . . . . . . . . . . . . 61,230 66,683Valuation allowance . . . . . . . . . . . . . . . . . . . . . . . . . . . . . . . . . . . . . . . . . . . . . . . . . . . . . (711) (2,162)
Total deferred tax assets . . . . . . . . . . . . . . . . . . . . . . . . . . . . . . . . . . . . . . . . . . . . . . 60,519 64,521
Deferred tax liabilities attributable to:Purchased intangible assets . . . . . . . . . . . . . . . . . . . . . . . . . . . . . . . . . . . . . . . . . . . . . . . . 25,625 27,487Other net . . . . . . . . . . . . . . . . . . . . . . . . . . . . . . . . . . . . . . . . . . . . . . . . . . . . . . . . . . . . . . 225 342
Total deferred tax liabilities . . . . . . . . . . . . . . . . . . . . . . . . . . . . . . . . . . . . . . . . . . . 25,850 27,829
Net deferred tax assets . . . . . . . . . . . . . . . . . . . . . . . . . . . . . . . . . . . . . . . . . . . . . . . . $34,669 $36,692
At December 31, 2006, there were approximately $157.4 million of accumulated undistributed earnings ofsubsidiaries outside the United States that are considered to be reinvested indefinitely. No U.S. tax has beenprovided on such earnings. If they were remitted to the Company, applicable U.S. federal and foreignwithholding taxes would be partially offset by available foreign tax credits.
At December 31, 2006, the Company had federal net operating loss carryforwards of approximately $37.6million which begin to expire in 2020, state operating loss carryforwards of approximately $ 2.8 million, whichbegin to expire in 2009, foreign tax credit carryforwards of approximately $2.8 million which begin to expire in2010, alternative minimum tax credit carryforwards of approximately $0.9 million and research tax creditcarryforwards of approximately $ 2.3 million which begin to expire in 2009.
F-26

The Company established a valuation allowance of $2.2 million during the four months ended December 31,2005 with respect to capital loss carryovers, of which $1.5 million reversed in 2006. Realization of the remainingdeferred tax assets is dependent on generating sufficient future taxable income and on the future reversal oftaxable temporary differences. Although realization is not assured, based on projected earnings, the Companybelieves it is more likely than not that the benefit of these deferred assets will be realized.
(17) SHAREHOLDERS’ EQUITY
Share Repurchase Program
On August 21, 2006, the Company’s Board of Directors authorized a share repurchase program of up to $150million over the succeeding 12 to 18 months. In connection with the share repurchase program the Companyentered into an Accelerated Share Repurchase Agreement (ASRA) and a Collared Accelerated Share RepurchaseAgreement (CASRA) with Goldman, Sachs & Co. (GS) on August 30, 2006. Under the ASRA, which waseffective as of August 30, 2006, the Company acquired 4.7 million shares of common stock on September 5,2006 from GS for $50.0 million, which was paid on September 5, 2006. The transaction was accounted for as ashare retirement with common stock, paid-in capital and retained earnings reduced by $47 thousand, $28.2million, and $21.7 million, respectively.
Under the CASRA, the Company paid $50.0 million for a prepaid forward contract, which was effectiveAugust 30, 2006, to repurchase the Company’s common stock. The Company received deliveries of commonstock of 3.0 million shares and 1.2 million shares on September 5, 2006 and October 6, 2006, respectively. Thetransaction was accounted for as a share retirement with common stock, paid-in capital and retained earningsreduced by $42 thousand, $25.2 million, and $19.8 million, respectively. $5.0 million of the $50.0 millionpayment is reflected as a prepaid forward contract for share repurchase in shareholders’ equity, which will becredited as the Company receives additional shares under the CASRA.
Under both the ASRA and the CASRA, GS may repurchase an equivalent number of shares in the open marketthrough September 4, 2007. At that date, the Company’s price under the ASRA will be adjusted up or downbased on the volume-weighted average price of the stock during this period. Such adjustment may be settled incash or stock at the Company’s discretion. The Company may receive additional shares pursuant to the CASRA,depending on movements in the market price of the Company’s common stock. The Company financed theASRA and CASRA with its available cash equivalents and short-term investments.
Share-based Compensation Expense
Effective August 28, 2005, the Company adopted Statement of Financial Accounting Standards No. 123 (revised2004), Share-Based Payment, (SFAS 123(R)) which requires the measurement and recognition of compensationexpense for all share-based payment awards made to employees and directors including employee stock optionsand employee stock purchases related to the Employee Stock Purchase Plan (employee stock purchases) to bebased on estimated fair values. SFAS 123(R) supersedes the Company’s previous accounting under AccountingPrinciples Board Opinion No. 25, Accounting for Stock Issued to Employees (APB 25). In March 2005, theSecurities and Exchange Commission issued Staff Accounting Bulletin No. 107 (SAB 107) relating to SFAS123(R). The Company has applied the provisions of SAB 107 in its adoption of SFAS 123(R).
The Company adopted SFAS 123(R) using the modified prospective transition method, which requires theapplication of the accounting standard as of August 28, 2005. In accordance with the modified prospectivetransition method, the Company’s Consolidated Financial Statements for prior periods were not restated toreflect, and did not include, the impact of SFAS 123(R). Share-based compensation expense recorded underSFAS 123(R) for the year ended December 31, 2006 and four months ended December 31, 2005 was $14.8million and $11.1 million, respectively. Share-based compensation expense of $5.5 million and $1.2 million,respectively, for the years ended August 27, 2005 and August 28, 2004 was mainly related to restricted stockgrants that the Company had been recognizing under previous accounting standards.
F-27
SFAS 123(R) requires companies to estimate the fair value of share-based payment awards on the date of grantusing an option-pricing model. The value of the portion of the award that is ultimately expected to vest isrecognized as expense over the requisite service periods in the Company’s Consolidated Statement of Operations.Prior to the adoption of SFAS 123(R), the Company accounted for share-based awards to employees anddirectors using the intrinsic value method in accordance with APB 25 as allowed under Statement of FinancialAccounting Standards No. 123, Accounting for Stock-Based Compensation (SFAS 123). Under the intrinsic valuemethod, no share-based compensation expense had been recognized in the Company’s Consolidated Statement ofOperations, other than as related to restricted stock grants, because the exercise price of the Company’s stockoptions granted to employees and directors equaled the fair market value of the underlying stock at the date ofgrant.
Share-based compensation expense recognized for periods after the adoption of SFAS 123(R) is based on thevalue of the portion of share-based payment awards that is ultimately expected to vest during the period. Share-based compensation expense recognized in the Company’s Consolidated Statement of Operations for the yearended December 31, 2006 and four months ended December 31, 2005 includes compensation expense for share-based payment awards granted prior to, but not yet vested as of August 27, 2005 based on the grant date fairvalue estimated in accordance with the pro forma provisions of SFAS 123.
Share-based payment awards in the form of restricted stock awards for 1.1 million shares were granted toemployees during the year ended December 31, 2006, with no shares granted during the four months endedDecember 31, 2005. Share-based payment awards in the form of stock awards subject to performance conditionsfor up to 0.9 million shares were also granted to certain employees during the year ended December 31, 2006,with no performance shares granted during the four months ended December 31, 2005. Compensation expense isbased on the grant date fair value estimated in accordance with the provisions of SFAS 123(R).
In conjunction with the adoption of SFAS 123(R), the Company changed its method of attributing the value ofshare-based compensation to expense from the accelerated multiple-option approach to the straight-line singleoption method. Compensation expense for all share-based payment awards granted on or prior to August 27,2005 will continue to be recognized using the accelerated multiple-option approach, while compensation expensefor all share-based payment awards granted subsequent to August 27, 2005 will be recognized using the straight-line single-option method. Because share-based compensation expense recognized in the Consolidated Statementof Operations for the year ended December 31, 2006 and four months ended December 31, 2005 is based onawards ultimately expected to vest, it has been reduced for estimated forfeitures. SFAS 123(R) requiresforfeitures to be estimated at the time of grant and revised, if necessary, in subsequent periods if actual forfeituresdiffer from those estimates. In the Company’s pro forma information required under SFAS 123 for the periodsthrough August 27, 2005, the Company accounted for forfeitures as they occurred.
There were stock option awards of 1.1 million shares and 1.0 million shares, respectively, in the years endedAugust 27, 2005 and August 28, 2004. Restricted stock awards of 1.9 million and 0.2 million shares were madeto employees in the years ended August 27, 2005 and August 28, 2004. Prior to August 28, 2005, the Companyused the Black-Scholes option-pricing model (Black-Scholes model) for the Company’s pro forma informationrequired under SFAS 123. The Company’s determination of fair value of share-based payment awards on thedate of grant using an option-pricing model is affected by the Company’s stock price as well as assumptionsregarding a number of highly complex and subjective variables. These variables include, but are not limited tothe Company’s expected stock price volatility over the term of the awards, and actual and projected employeestock option exercise behaviors and forfeitures.
On November 10, 2005, the Financial Accounting Standards Board (FASB) issued FASB Staff Position No. FAS123(R)- 3, Transition Election Related to Accounting for Tax Effects of Share-Based Payment Awards (FSP123(R)-3). An entity could take up to one year from the effective date of FSP 123(R)-3 to evaluate its availabletransition alternatives and make its one-time election. The Company adopted the alternative transition methodprovided in the FASB Staff Position for calculating the tax effects of share-based compensation pursuant toSFAS 123(R). The alternative transition method includes simplified methods to establish the beginning balance
F-28
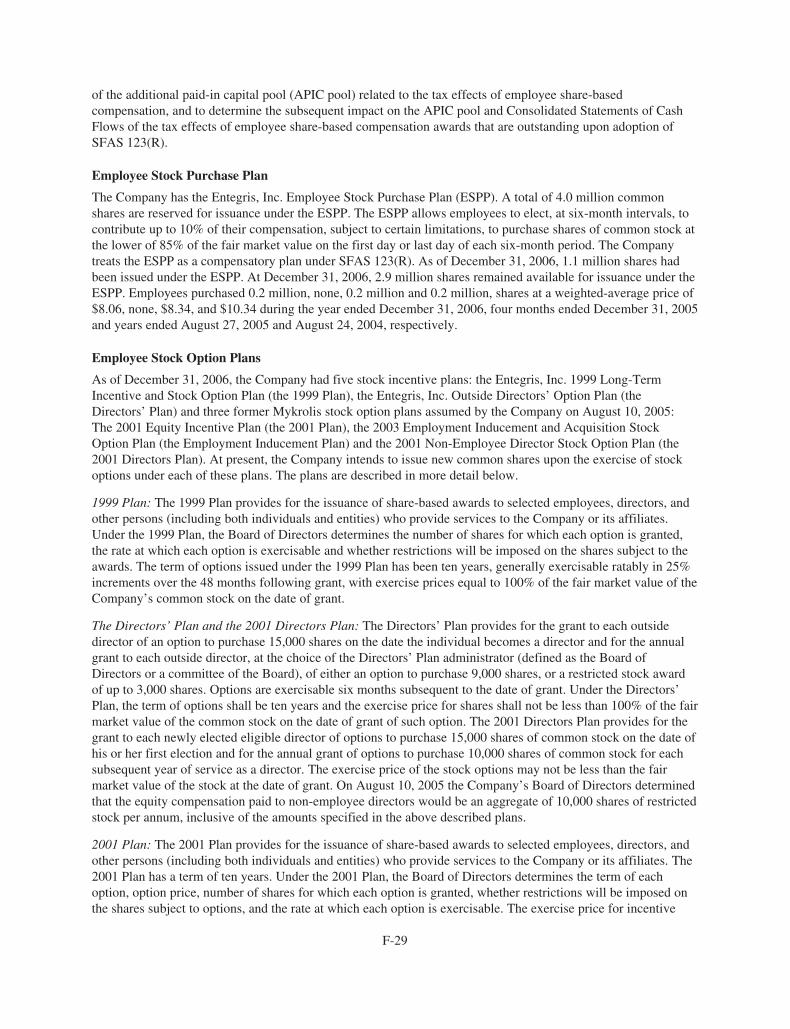
of the additional paid-in capital pool (APIC pool) related to the tax effects of employee share-basedcompensation, and to determine the subsequent impact on the APIC pool and Consolidated Statements of CashFlows of the tax effects of employee share-based compensation awards that are outstanding upon adoption ofSFAS 123(R).
Employee Stock Purchase Plan
The Company has the Entegris, Inc. Employee Stock Purchase Plan (ESPP). A total of 4.0 million commonshares are reserved for issuance under the ESPP. The ESPP allows employees to elect, at six-month intervals, tocontribute up to 10% of their compensation, subject to certain limitations, to purchase shares of common stock atthe lower of 85% of the fair market value on the first day or last day of each six-month period. The Companytreats the ESPP as a compensatory plan under SFAS 123(R). As of December 31, 2006, 1.1 million shares hadbeen issued under the ESPP. At December 31, 2006, 2.9 million shares remained available for issuance under theESPP. Employees purchased 0.2 million, none, 0.2 million and 0.2 million, shares at a weighted-average price of$8.06, none, $8.34, and $10.34 during the year ended December 31, 2006, four months ended December 31, 2005and years ended August 27, 2005 and August 24, 2004, respectively.
Employee Stock Option Plans
As of December 31, 2006, the Company had five stock incentive plans: the Entegris, Inc. 1999 Long-TermIncentive and Stock Option Plan (the 1999 Plan), the Entegris, Inc. Outside Directors’ Option Plan (theDirectors’ Plan) and three former Mykrolis stock option plans assumed by the Company on August 10, 2005:The 2001 Equity Incentive Plan (the 2001 Plan), the 2003 Employment Inducement and Acquisition StockOption Plan (the Employment Inducement Plan) and the 2001 Non-Employee Director Stock Option Plan (the2001 Directors Plan). At present, the Company intends to issue new common shares upon the exercise of stockoptions under each of these plans. The plans are described in more detail below.
1999 Plan: The 1999 Plan provides for the issuance of share-based awards to selected employees, directors, andother persons (including both individuals and entities) who provide services to the Company or its affiliates.Under the 1999 Plan, the Board of Directors determines the number of shares for which each option is granted,the rate at which each option is exercisable and whether restrictions will be imposed on the shares subject to theawards. The term of options issued under the 1999 Plan has been ten years, generally exercisable ratably in 25%increments over the 48 months following grant, with exercise prices equal to 100% of the fair market value of theCompany’s common stock on the date of grant.
The Directors’ Plan and the 2001 Directors Plan: The Directors’ Plan provides for the grant to each outsidedirector of an option to purchase 15,000 shares on the date the individual becomes a director and for the annualgrant to each outside director, at the choice of the Directors’ Plan administrator (defined as the Board ofDirectors or a committee of the Board), of either an option to purchase 9,000 shares, or a restricted stock awardof up to 3,000 shares. Options are exercisable six months subsequent to the date of grant. Under the Directors’Plan, the term of options shall be ten years and the exercise price for shares shall not be less than 100% of the fairmarket value of the common stock on the date of grant of such option. The 2001 Directors Plan provides for thegrant to each newly elected eligible director of options to purchase 15,000 shares of common stock on the date ofhis or her first election and for the annual grant of options to purchase 10,000 shares of common stock for eachsubsequent year of service as a director. The exercise price of the stock options may not be less than the fairmarket value of the stock at the date of grant. On August 10, 2005 the Company’s Board of Directors determinedthat the equity compensation paid to non-employee directors would be an aggregate of 10,000 shares of restrictedstock per annum, inclusive of the amounts specified in the above described plans.
2001 Plan: The 2001 Plan provides for the issuance of share-based awards to selected employees, directors, andother persons (including both individuals and entities) who provide services to the Company or its affiliates. The2001 Plan has a term of ten years. Under the 2001 Plan, the Board of Directors determines the term of eachoption, option price, number of shares for which each option is granted, whether restrictions will be imposed onthe shares subject to options, and the rate at which each option is exercisable. The exercise price for incentive
F-29

stock options may not be less than the fair market value per share of the underlying common stock on the dategranted (110% of fair market value in the case of holders of more than 10% of the voting stock of the Company).The 2001 Plan contains an “evergreen” provision, which increases the number of shares in the pool of optionsavailable for grant annually by 1% of the number of shares of common stock outstanding on the date of theAnnual Meeting of Stockholders or such lesser amount determined by the Board of Directors. Under NASDAQrules new grants and awards under the 2001 Plan may only be made to employees and directors of the Companywho were employees or directors of Mykrolis prior to the merger or who were hired by the Company subsequentto the merger.
Employment Inducement Plan: The Employment Inducement Plan is a non-shareholder approved plan thatprovides for the issuance of stock options and other share-based awards to newly-hired employees and toemployees of companies acquired by the Company. The Employment Inducement Plan has a term of ten years.Options granted under the Employment Inducement Plan have a maximum term of ten years and an exerciseprice equal to the fair market value of the Company’s common stock on the date of grant. The Board of Directorsdetermines other terms of option grants including, number of shares, restrictions and the vesting period. Thenumber of reserved shares under the Employment Inducement Plan automatically increases annually by 0.25% ofthe number of shares of common stock outstanding on the date of the Annual Meeting of Stockholders unlessotherwise determined by the Board of Directors.
Millipore Plan
In addition to the Company’s plans, certain employees of the Company who were employees of Mykrolis weregranted stock options under a predecessor’s share-based compensation plan. The Millipore 1999 Stock IncentivePlan (the Millipore Plan) provided for the issuance of stock options and restricted stock to key employees asincentive compensation. The exercise price of a stock option was equal to the fair market value of Millipore’scommon stock on the date the option was granted and its term was generally ten years and vested over four years.Options granted to the Company’s employees under the Millipore Plan in the past were converted into options toacquire Mykrolis common stock pursuant to the spin-off of Mykrolis by Millipore, and then were converted intooptions to acquire the Company’s common stock pursuant to the merger with Mykrolis.
General Option Information
Option activity for the 1999 Plan and the Directors’ Plan for the year ended December 31, 2006, four monthsended December 31, 2005 and years ended August 27, 2005 and August 28, 2004 are summarized as follows:
Year endedDecember 31, 2006
Four months endedDecember 31, 2005
Year endedAugust 27, 2005
Year endedAugust 28, 2004
(Shares in thousands)Number of
shares
Weightedaverageexercise
priceNumber of
shares
Weightedaverageexercise
priceNumber of
shares
Weightedaverageexercise
priceNumber of
shares
Weightedaverageexercise
price
Options outstanding,beginning ofperiod . . . . . . . . . . . . 8,501 $ 7.35 8,826 $ 7.30 8,268 $7.05 8,080 $ 6.28
Granted . . . . . . . . — — — — 1,125 8.39 1,012 12.32Exercised . . . . . . . (1,925) 5.56 (231) 4.23 (415) 4.49 (657) 5.27Canceled . . . . . . . (193) 11.35 (94) 10.43 (152) 9.23 (167) 8.77
Options outstanding,end of period . . . . . . 6,383 $ 7.76 8,501 $ 7.35 8,826 $7.30 8,268 $ 7.05
Options exercisable,end of period . . . . . . 6,379 $ 7.76 7,109 $ 7.33 7,109 $7.29 5,058 $ 6.00
Shares available forfuture, grant, end ofperiod . . . . . . . . . . . . 5,708 6,169 3,970 3,125
F-30

Options outstanding for the 1999 Plan and the Directors’ Plan at December 31, 2006 are summarized as follows:
(Shares in thousands) Options outstanding Options exercisable
Range of exercise pricesNumber
outstanding
Weightedaverage
remaining lifein years
Weighted-averageexercise
priceNumber
exercisable
Weightedaverageexercise
price
$3.15 . . . . . . . . . . . . . . . . . . . . . . . . . . . . . . . . . . . . . 1,137 1.0 years $ 3.15 1,137 $ 3.15$4.22 . . . . . . . . . . . . . . . . . . . . . . . . . . . . . . . . . . . . . 124 2.6 years 4.22 124 4.22$5.90 . . . . . . . . . . . . . . . . . . . . . . . . . . . . . . . . . . . . . 942 5.7 years 5.90 942 5.90$6.25 to $7.50 . . . . . . . . . . . . . . . . . . . . . . . . . . . . . . 122 4.3 years 7.48 122 7.48$7.53 to $8.25 . . . . . . . . . . . . . . . . . . . . . . . . . . . . . . 1,032 4.6 years 8.02 1,032 8.02$8.36 to $10.00 . . . . . . . . . . . . . . . . . . . . . . . . . . . . . 1,723 5.8 years 8.77 1,719 8.77$10.19 to $12.00 . . . . . . . . . . . . . . . . . . . . . . . . . . . . 1,053 5.0 years 11.60 1,053 11.60$12.01 to $15.38 . . . . . . . . . . . . . . . . . . . . . . . . . . . . 250 6.5 years 13.57 250 13.57
6,383 6,379
The weighted average remaining contractual term for options outstanding and exercisable for the 1999 Plan andthe Directors’ Plan at December 31, 2006 was 4.5 years and 4.5 years, respectively.
Option activity for the 2001 Plan, the Employment Inducement Plan, the 2001 Directors Plan and the Milliporeplan for the year ended December 31, 2006, four months ended December 31, 2005 and year ended August 27,2005 are summarized as follows:
Year endedDecember 31, 2006
Four months endedDecember 31, 2005
Year endedAugust 27, 2005
(Shares in thousands)Numberof shares
Weightedaverageexercise
priceNumberof shares
Weightedaverageexercise
priceNumberof shares
WeightedAverageExercise
Price
Options outstanding, beginning of period . . . . . . . . 7,998 $ 8.53 8,599 $ 8.38 — —Options assumed in Mykrolis acquisition . . . . — — — — 8,790 $ 8.33Options exercised . . . . . . . . . . . . . . . . . . . . . . (1,102) 7.09 (508) 5.64 (177) 5.37Options expired . . . . . . . . . . . . . . . . . . . . . . . . (474) 10.74 (93) 10.39 (14) 10.74
Options outstanding, end of period . . . . . . . . . . . . . 6,422 $ 8.62 7,998 $ 8.53 8,599 $ 8.38
Options exercisable . . . . . . . . . . . . . . . . . . . . . . . . . 6,080 $ 8.63 7,553 $ 8.61 7,638
Shares available for future grant . . . . . . . . . . . . . . . 2,399 1,031 938
2001 Plan, Employment Inducement Plan, 2001 Directors Plan and Millipore Plan
Options outstanding for the 2001 Plan, Employment Inducement Plan, 2001 Directors Plan and Millipore Plan atDecember 31, 2006 are summarized as follows:
(Shares in thousands) Options outstanding Options exercisable
Range of exercise pricesNumber
outstanding
Weightedaverage
remaining lifein years
Weightedaverageexercise
priceNumber
exercisable
Weighted-averageexercise
price
$3.83-$4.89 . . . . . . . . . . . . . . . . . . . . . . . . . . . . . . . . 821 2.8 $ 4.72 821 $ 4.72$5.01-$8.09 . . . . . . . . . . . . . . . . . . . . . . . . . . . . . . . . 1,182 2.7 6.16 1,182 6.16$8.35-$9.94 . . . . . . . . . . . . . . . . . . . . . . . . . . . . . . . . 1,662 3.2 8.45 1,320 8.46$10.09-$10.91 . . . . . . . . . . . . . . . . . . . . . . . . . . . . . . 1,494 2.0 10.77 1,494 10.77$11.12-$11.76 . . . . . . . . . . . . . . . . . . . . . . . . . . . . . . 1,263 4.0 11.13 1,263 11.13
6,422 2.9 $ 8.62 6,080 $ 8.63
F-31
The weighted average remaining contractual term for options outstanding and exercisable for the 2000 Plan, theEmployment Inducement Plan, the 2001 Directors’ Plan and the Millipore Plan at December 31, 2006 was 2.9years and 2.6 years, respectively.
For all plans, the total pretax intrinsic value of stock options exercised during the year ended December 31, 2006and four months ended December 31, 2005 was $14.2 million and $4.0 million, respectively. The aggregateintrinsic value in the preceding tables represent the total pretax intrinsic value, based on the Company’s closingstock price of $10.82 at December 31, 2006, which theoretically could have been received by the option holdershad all option holders exercised their options as of that date was $35.6 million and $34.4 million, respectively foroptions outstanding and options exercisable. The total number of in-the-money options exercisable as ofDecember 31, 2006 was 10.2 million.
During the year ended December 31, 2006 and year ended August 27, 2005, certain existing stock option grantswere modified in connection with the execution of various severance and separation agreements. Under theagreements, the terms of unvested and vested stock option grants were modified with no future service requiredby the affected individuals. Accordingly, under the measurement principles of SFAS No. 123(R ) and APBNo. 25, incremental share-based compensation expense of $0.4 million and $1.0 million, respectively, wasrecognized for the value of the modified stock option grants at the date of the agreements’ execution.
During the year ended December 31, 2006, four months ended December 31, 2005 and years ended August 27,2005 and August 28, 2004, the Company received cash from the exercise of stock options totaling $18.5 million,$3.8 million, $3.4 million and $2.8 million, respectively. During the year ended December 31, 2006, four monthsended December 31, 2005 and years ended August 27, 2005 and August 28, 2004, the Company received cash of$1.5 million, none, $1.5 million and $1.6 million, respectively, in employee contributions to the Entegris, Inc.Employee Stock Purchase Plan. There was no excess tax benefit recorded for the tax deductions related to stockoptions and restricted stock awards during the year ended December 31, 2006 or the four months endedDecember 31, 2006.
Restricted Stock Awards
Restricted stock awards are awards of common stock that are subject to restrictions on transfer and to a risk offorfeiture if the awardee leaves the Company’s employ prior to the lapse of the restrictions. The value of suchstock is determined using the market price on the grant date. Compensation expense is recorded over theapplicable restricted stock vesting periods. In conjunction with the adoption of SFAS 123(R), the Companychanged its method of attributing the value of share-based compensation to expense from the acceleratedmultiple-option approach to the straight-line single option method. Accordingly, compensation expense forrestricted stock awards granted on or prior to August 27, 2005 are recorded using the accelerated multiple-optionapproach, while compensation expense for restricted stock awards granted subsequent to August 27, 2005 arerecognized using the straight-line single-option method. A summary of the Company’s restricted stock activityfor the year ended December 31, 2006, four months ended December 31, 2005 and years ended August 27, 2005and August 28, 2004 is presented in the following table:
(Shares in thousands)Year ended
December 31, 2006Four months endedDecember 31, 2005
Year endedAugust 27, 2005
Year endedAugust 28, 2004
Numberof
shares
Weightedaveragegrant
date fairvalue
Numberof
shares
Weightedaveragegrant
date fairvalue
Numberof
shares
Weightedaveragegrant
date fairvalue
Numberof
shares
Weightedaveragegrant
date fairvalue
Unvested, beginning ofperiod . . . . . . . . . . . . . . . . . . . 1,526 $11.03 2,374 $11.05 236 $12.29 8 $ 9.36
Granted . . . . . . . . . . . . . . . . . . . 1,131 10.46 — — 1,900 10.84 234 12.35Unvested shares assumed in
acquisition . . . . . . . . . . . . . . . — — — — 365 11.32 — —Vested . . . . . . . . . . . . . . . . . . . . (631) 11.04 (843) 11.09 (103) 11.18 (3) 9.36Forfeited . . . . . . . . . . . . . . . . . . (76) 10.69 (5) 10.28 (24) 9.23 (3) 11.96
Unvested, end of period . . . . . . 1,950 $10.71 1,526 $11.03 2,374 $11.05 236 $12.29
F-32

The weighted average remaining contractual term for unvested restricted shares at December 31, 2006 andDecember 31, 2005 was 2.5 years and 3.1 years, respectively.
As of December 31, 2006 total compensation cost related to nonvested stock options and restricted stock awardsnot yet recognized was $12.2 million that is expected to be recognized over the next 14.6 months on a weighted-average basis. These figures exclude restricted stock awards for which performance criteria have yet to bedetermined and, accordingly, grant dates for those awards have not been established.
During the year ended December 31, 2006, Entegris, Inc. awarded performance stock to be issued upon theachievement of performance conditions (Performance Shares) under the Company’s stock incentive plans tocertain officers and other key employees. Up to 0.9 million shares, 25% of which are available each of the nextfour years, will become vested if, and to the extent that, financial performance criteria for fiscal years 2006through 2009 are achieved. The number of performance shares earned in a given year may vary based on thelevel of achievement of financial performance objectives for that year. If the Company’s performance for a yearfails to achieve the specified performance threshold, then the performance shares allocated to that year areforfeited. Each annual tranche will have its own service period beginning at the date (the grant date) at which theBoard of Directors establishes the annual performance targets for the applicable year. Once earned, PerformanceShares are fully vested with no restrictions. Compensation expense to be recorded in connection with thePerformance Shares will be based on the grant date fair value of the Company’s common stock. Awards ofPerformance Shares are expensed over the service period based on an evaluation of the probability of achievingthe performance objectives.
Certain unvested restricted shares of Mykrolis common stock issued in connection with restricted stock awardsmade prior to the merger with the Company were exchanged for unvested restricted shares of the Company’scommon stock, with the number of shares adjusted for the exchange ratio of 1.39. Accordingly, 0.3 millionrestricted Mykrolis shares were exchanged for 0.4 million restricted shares of the Company’s common stock. Theintrinsic value of $2.5 million associated with the unvested restricted stock was recorded as deferredcompensation as part of the purchase price allocation for the Mykrolis acquisition. This balance is being chargedto earnings over the remaining vesting periods that extend to 2009.
Valuation and Expense Information under SFAS 123(R)
The following table summarizes share-based compensation expense related to employee stock options, restrictedstock awards and grants under the employee stock purchase plan under SFAS 123(R) for the year endedDecember 31, 2006 and four months ended December 31, 2005 that was allocated as follows:
(In thousands)Year ended
December 31, 2006Four months endedDecember 31, 2005
Cost of sales . . . . . . . . . . . . . . . . . . . . . . . . . . . . . . . . . . . . . . . . $ 3,000 $ 882Engineering, research and development . . . . . . . . . . . . . . . . . . . 230 95Selling, general and administrative . . . . . . . . . . . . . . . . . . . . . . 11,546 10,076
Share-based compensation expense . . . . . . . . . . . . . . . . . . . . . . 14,776 11,053Tax benefit . . . . . . . . . . . . . . . . . . . . . . . . . . . . . . . . . . . . . . . . . 5,556 4,156
Share-based compensation expense, net of tax . . . . . . . . . . . . . . $ 9,220 $ 6,897
No stock option grants have been made to employees since the adoption of SFAS123(R). Prior to the adoption ofSFAS 123(R), the value of each employee stock option was estimated on the date of grant using the Black-Scholes model for the purpose of the pro forma financial information in accordance with SFAS 123.
F-33

Pro Forma Information Under SFAS 123 for Periods Prior to Adoption of SFAS123
The following table illustrates the effect on net income and earnings per common share for the year endedAugust 27, 2005 and August 28, 2004 if the Company had applied the fair value recognition provisions of SFAS123, Accounting for Stock-Based Compensation, to share-based employee compensation.
(In thousands, except share data)Year ended
August 27, 2005Year ended
August 28, 2004
Net income . . . . . . . . . . . . . . . . . . . . . . . . . . . . . . . . . . . . . . . . . . . . . . $ 9,393 $24,770Add: Stock-based compensation included in net income, net of
tax of $2,077 and $458, respectively . . . . . . . . . . . . . . . . . . . . 3,388 747Deduct: Total stock-based compensation expense determined under
fair value based method for all awards, net of tax benefits of$6,727 and $4,513 respectively . . . . . . . . . . . . . . . . . . . . . . . . . . . . (11,159) (7,364)
Pro forma net income . . . . . . . . . . . . . . . . . . . . . . . . . . . . . . . . . . . . . . $ 1,622 $18,153
Earnings per share:Basic as reported . . . . . . . . . . . . . . . . . . . . . . . . . . . . . . . . . . . . . . . . . $ 0.12 $ 0.34Diluted as reported . . . . . . . . . . . . . . . . . . . . . . . . . . . . . . . . . . . . . . . . 0.12 0.32
Basic pro forma . . . . . . . . . . . . . . . . . . . . . . . . . . . . . . . . . . . . . . . . . . 0.02 0.25Diluted pro forma . . . . . . . . . . . . . . . . . . . . . . . . . . . . . . . . . . . . . . . . 0.02 0.24
During September 2004, the Compensation and Stock Option Committee (the Committee) of the Company’sBoard of Directors reviewed the Company’s stock-based compensation plans in light of evolving compensationpractices and the anticipated issuance by the Financial Accounting Standards Board (FASB) of its revision ofFASB Statement No. 123, Accounting for Stock-Based Compensation (SFAS No. 123R)(subsequently issued inDecember 2004) which upon adoption requires all share-based payments to employees, including grants ofemployee stock options, to be recognized in the Company’s consolidated statement of operations based on theirfair values. After consideration of various alternatives, the Committee approved the accelerated and full vestingof all unvested outstanding employee stock options with exercise prices above $9.21 issued prior to October 1,`2004. The effect of the vesting acceleration was the recognition of incremental additional stock-based employeecompensation of approximately $4.8 million in the first quarter of the year ended August 28, 2005 in theCompany’s pro forma disclosure above. This previously deferred stock-based employee compensation expenseamount would otherwise in part have been recognized in the Company’s consolidated statements of operations infuture periods after the adoption of SFAS No. 123R on August 28, 2005.
The fair value of options granted and the option component of the employee purchase plan shares were estimatedat the date of grant using the Black-Scholes option pricing model and the following assumptions:
Option plansYear ended
August 27, 2005Year ended
August 28, 2004
Expected dividend yield . . . . . . . . . . . . . . . . . . . . . . . . . . . . . . . . . . . . . . . . . . . . . 0% 0%Expected stock price volatility . . . . . . . . . . . . . . . . . . . . . . . . . . . . . . . . . . . . . . . . 75% 75%Risk-free interest rate . . . . . . . . . . . . . . . . . . . . . . . . . . . . . . . . . . . . . . . . . . . . . . . . 3.5% 4.0%Expected life . . . . . . . . . . . . . . . . . . . . . . . . . . . . . . . . . . . . . . . . . . . . . . . . . . . . . . 6.0 years 8.0 years
Employee stock purchase planYear ended
August 27, 2005Year ended
August 28, 2004
Expected dividend yield . . . . . . . . . . . . . . . . . . . . . . . . . . . . . . . . . . . . . . . . . . . . . 0% 0%Expected stock price volatility . . . . . . . . . . . . . . . . . . . . . . . . . . . . . . . . . . . . . . . . 75% 76%Risk-free interest rate . . . . . . . . . . . . . . . . . . . . . . . . . . . . . . . . . . . . . . . . . . . . . . . . 2.0% 2.9%Expected life . . . . . . . . . . . . . . . . . . . . . . . . . . . . . . . . . . . . . . . . . . . . . . . . . . . . . . 0.5 years 0.5 years
F-34
The expected stock price volatility was based on computations of historical volatility of the Company’s commonstock.
The weighted average fair value of options granted during years ended August 27, 2005 and August 28, 2004with exercise prices equal to the market price at the date of grant was $5.69, and $9.30 per share, respectively.
Shareholder Rights Plan On July 27, 2005, the Company’s Board of Directors adopted a shareholder rights plan(the “Rights Plan”) pursuant to which Entegris declared a dividend on August 8, 2005 to its shareholders ofrecord on that date of one preferred share purchase right (a “Right”) for each share of Entegris common stockowned on August 8, 2005. Each Right entitles the holder to purchase one-hundredth of a share of a series ofpreferred stock at an exercise price of $50, subject to adjustment as provided in the Rights Plan. The Rights Planis designed to protect Entegris’ shareholders from attempts by others to acquire Entegris on terms or by usingtactics that could deny all shareholders the opportunity to realize the full value of their investment. The Rightsare attached to the shares of the Company’s common stock until certain triggering events specified in the RightsAgreement occur, including, unless approved by the Company’s board of directors, an acquisition by a person orgroup of specified levels of beneficial ownership of Entegris common stock or a tender offer for Entegriscommon stock. Upon the occurrence of any of these triggering events, the Rights authorize the holders topurchase shares of the Company’s common stock at the then-current exercise price having a value equal to twicethe exercise price. The Rights are redeemable by the Company for $0.01 and will expire on August 8, 2015. Oneof the events which will trigger the Rights is the acquisition, or commencement of a tender offer, by a person (anAcquiring Person, as defined in the shareholder rights plan), other than Entegris or any of its subsidiaries oremployee benefit plans, of 15% or more of the outstanding shares of the Company’s common stock. AnAcquiring Person may not exercise a Right.
(18) BENEFIT PLANS
401(k) Plan The Company maintains the Entegris, Inc. 401(k) Savings and Profit Sharing Plan (the 401(k) Plan)that qualifies as a deferred salary arrangement under Section 401(k) of the Internal Revenue Code. Under thePlan, eligible employees may defer a portion of their pretax wages, up to the Internal Revenue Service annualcontribution limit. Entegris matches 100% of employees’ contributions on the first 3% of eligible wages and 50%of employees’ contributions on the next 2% of eligible wages, or a maximum match of 4% of the employee’seligible wages. In addition to the matching contribution, the Company’s board of directors may, at its discretion,declare a profit sharing contribution as a percentage of eligible wages based on the company’s worldwideoperating results. The employer profit sharing and matching contribution expense under the Plans was $5.8million, $0.7 million, $4.6 million and $3.9 million in the fiscal year ended December 31, 2006, the four monthsended December 31, 2005, and the fiscal years ended August 27, 2005 and August 28, 2004, respectively.
Supplemental Savings and Retirement Plan The Company has Supplemental Savings and Retirement Plan (the“Supplemental Plan”) that was assumed in the Mykrolis acquisition. Under the Supplemental Plan, certain seniorexecutives are allowed certain salary deferral benefits that would otherwise be lost by reason of restrictionsimposed by the Internal Revenue Code limiting the amount of compensation which may be deferred undertax-qualified plans. A liability of $3.2 million and $2.6 million at December 31, 2006 and December 31, 2005,respectively, related to these rights is included in the consolidated balance sheets under the caption “Otherliabilities”. The Company recorded expense of $0.5 million and $0.3 million in the year ended December 31,2006 and the four months ended December 31, 2005, respectively. The Company recorded no expense inconnection with the Supplemental Plan in the years ended August 27, 2005 and August 28, 2004.
Defined Benefit Plans. The Company assumed the obligations under defined benefit pension plans in its mergerwith Myrkolis on August 6, 2005. The employees of the Company’s subsidiaries in Japan and Taiwan arecovered in defined benefit pension plans. The Company uses a December 31 measurement date for its pensionplans.
F-35

Effective December 31, 2006, the Company adopted SFAS No. 158, Employers’ Accounting for Defined BenefitPension and Other Postretirement Plans. Under SFAS No. 158, the Company is required to recognize theoverfunded or underfunded status of its defined benefit pension plans as an asset or liability in its consolidatedbalance sheets and to recognize changes in that funded status in the year in which the changes occur throughcomprehensive income. SFAS No. 158 also requires the measurement of the funded status of a plan as of the dateof its year-end consolidated balance sheet. The Company’s existing policy was to measure the funded status of itplans as of the balance sheet date; accordingly, the new measurement date requirements of SFAS No. 158 willhave no impact.
The tables below set forth the Company’s estimated funded status as of December 31, 2006 and December 31,2005:
(In thousands) 2006 2005
Change in benefit obligation:Benefit obligation at beginning of period . . . . . . . . . . . . . . . . . . . . . . . . . . . . . . $ 14,084 $ 14,570Service cost . . . . . . . . . . . . . . . . . . . . . . . . . . . . . . . . . . . . . . . . . . . . . . . . . . . . . 1,248 471Interest cost . . . . . . . . . . . . . . . . . . . . . . . . . . . . . . . . . . . . . . . . . . . . . . . . . . . . . 264 88Actuarial (gains) losses . . . . . . . . . . . . . . . . . . . . . . . . . . . . . . . . . . . . . . . . . . . . (1,230) 9Acquisitions . . . . . . . . . . . . . . . . . . . . . . . . . . . . . . . . . . . . . . . . . . . . . . . . . . . . — 294Benefits paid . . . . . . . . . . . . . . . . . . . . . . . . . . . . . . . . . . . . . . . . . . . . . . . . . . . . (425) (419)Foreign exchange impact . . . . . . . . . . . . . . . . . . . . . . . . . . . . . . . . . . . . . . . . . . (117) (929)
Benefit obligation at end of period . . . . . . . . . . . . . . . . . . . . . . . . . . . . . . . . . . . 13,824 14,084
Change in plan assets:Fair value of plan assets at beginning of period . . . . . . . . . . . . . . . . . . . . . . . . . 3,321 3,438Return on plan assets . . . . . . . . . . . . . . . . . . . . . . . . . . . . . . . . . . . . . . . . . . . . . 148 (186)Employer contributions . . . . . . . . . . . . . . . . . . . . . . . . . . . . . . . . . . . . . . . . . . . 440 361Benefits paid . . . . . . . . . . . . . . . . . . . . . . . . . . . . . . . . . . . . . . . . . . . . . . . . . . . . (44) (138)Acquisitions . . . . . . . . . . . . . . . . . . . . . . . . . . . . . . . . . . . . . . . . . . . . . . . . . . . . — 64Foreign exchange impact . . . . . . . . . . . . . . . . . . . . . . . . . . . . . . . . . . . . . . . . . . (43) (218)
Fair value of plan assets at end of period . . . . . . . . . . . . . . . . . . . . . . . . . . . . . . 3,822 3,321
Funded status:Plan assets in excess of/(less than) benefit obligation . . . . . . . . . . . . . . . . . . . . (10,002) (10,763)Unrecognized prior service cost . . . . . . . . . . . . . . . . . . . . . . . . . . . . . . . . . . . . . — 227Unrecognized net actuarial loss . . . . . . . . . . . . . . . . . . . . . . . . . . . . . . . . . . . . . — 130
Net amount recognized . . . . . . . . . . . . . . . . . . . . . . . . . . . . . . . . . . . . . . . . . . . . $(10,002) $(10,406)
Amounts recognized in the consolidated balance sheet consist of:Noncurrent liability . . . . . . . . . . . . . . . . . . . . . . . . . . . . . . . . . . . . . . . . . . . . . . $(10,002) $(10,406)Accumulated other comprehensive . . . . . . . . . . . . . . . . . . . . . . . . . . . . . . . . . . 228 —
Amounts recognized in accumulated other comprehensive income consist of:
Net actuarial loss . . . . . . . . . . . . . . . . . . . . . . . . . . . . . . . . . . . . . . . . . . . . . . . . . . . . . . $175Prior service cost . . . . . . . . . . . . . . . . . . . . . . . . . . . . . . . . . . . . . . . . . . . . . . . . . . . . . . 166
Net amount recognized . . . . . . . . . . . . . . . . . . . . . . . . . . . . . . . . . . . . . . . . . . . . . . . . . $341
F-36

The following table summarizes the incremental effect of recognizing the funded status of the Company’s plansin accordance with SFAS No. 158 on individual line items in the consolidated balance sheet at December 31,2006:
(In thousands)Before applicationof SFAS No. 158 Adjustments
After applicationof SFAS No. 158
Pension benefit obligations and other liabilities . . . . . . . . . . . . . . $(17,836) $(341) $(18,177)Current deferred tax assets . . . . . . . . . . . . . . . . . . . . . . . . . . . . . . 45,036 113 45,149Accumulated other comprehensive loss . . . . . . . . . . . . . . . . . . . . 2,114 228 2,342
Information for pension plans with an accumulated benefit obligation in excess of plan assets as of December 31,2006 and December 31, 2005:
(In thousands) 2006 2005
Projected benefit obligation . . . . . . . . . . . . . . . . . . . . . . . . . . . . . . . . . . . . . . . . . $13,824 $14,084Accumulated benefit obligation . . . . . . . . . . . . . . . . . . . . . . . . . . . . . . . . . . . . . . 12,288 12,369Fair value of plan assets . . . . . . . . . . . . . . . . . . . . . . . . . . . . . . . . . . . . . . . . . . . . 3,822 3,321
The components of the net periodic benefit cost for the year ended December 31, 2006, four months endedDecember 31, 2006 and year ended August 27, 2005 are as follows:
(In thousands)
Year endedDecember 31,
2006
Four monthsended
December 31,2005
Year endedAugust 27,
2005
Pension benefits:Service cost . . . . . . . . . . . . . . . . . . . . . . . . . . . . . . . . . . . . . . . . . . . . $1,248 $ 471 $ 63Interest cost . . . . . . . . . . . . . . . . . . . . . . . . . . . . . . . . . . . . . . . . . . . . 264 88 16Expected return on plan assets . . . . . . . . . . . . . . . . . . . . . . . . . . . . . . (33) (194) (1)Amortization of prior service cost . . . . . . . . . . . . . . . . . . . . . . . . . . . 10 4 —Recognized actuarial net loss . . . . . . . . . . . . . . . . . . . . . . . . . . . . . . . 75 1 —
Net periodic pension benefit cost . . . . . . . . . . . . . . . . . . . . . . . . . . . . . . . . $1,564 $ 370 $ 78
The estimated amount that will be amortized from accumulated other comprehensive income into net periodicbenefit cost in 2007 is as follows:
(In thousands)
Net actuarial loss . . . . . . . . . . . . . . . . . . . . . . . . . . . . . . . . . . . . . . . . . . . . . . . . . . . . . . . $ 6Prior service cost . . . . . . . . . . . . . . . . . . . . . . . . . . . . . . . . . . . . . . . . . . . . . . . . . . . . . . . 10
$16
Assumptions used in determining the benefit obligation and net periodic benefit cost for the Company’s pensionplans are presented in the following table as weighted-averages:
Year endedDecember 31,
2006
Four monthsended
December 31,2005
Year endedAugust 27,
2005
Benefit obligations:Discount rate . . . . . . . . . . . . . . . . . . . . . . . . . . . . . . . . . . . . . . . . . . . 2.06% 1.79% 1.79%Rate of compensation increase . . . . . . . . . . . . . . . . . . . . . . . . . . . . . . 2.26% 2.14% 2.14%
Net periodic benefit cost:Discount rate . . . . . . . . . . . . . . . . . . . . . . . . . . . . . . . . . . . . . . . . . . . 1.84% 2.15% 2.15%Rate of compensation increase . . . . . . . . . . . . . . . . . . . . . . . . . . . . . . 2.26% 2.53% 2.53%Expected return on plan assets . . . . . . . . . . . . . . . . . . . . . . . . . . . . . . 0.90% 1.48% 1.48%
The discount rate used by the Company is based on rates of long-term government bonds.
F-37

Plan Assets
At December 31, 2006, the majority of the Company’s pension plan assets are invested in a Japanese insurancecompany’s guaranteed-return fixed income securities. There is interest rate risk associated with the valuation ofthese investments. The long-term rate of return on Japanese pension plan assets was developed through ananalysis of historical returns and the fund’s current guaranteed return rate. Estimates of future returns are basedon a continuation of the existing guaranteed rate of return. The remaining portion of the Company’s plan assetsare deposited in Central Trust of China in the form of cash, where Central Trust of China is the assigned fundingvehicle for the statutory retirement benefit.
Cash Flows
The Company expects to contribute $0.4 million to its defined benefit pension plans during fiscal 2007. Thefollowing benefit payments, which reflect expected future service, as appropriate, are expected to be paid:
(In thousands)
2007 . . . . . . . . . . . . . . . . . . . . . . . . . . . . . . . . . . . . . . . . . . . . . . . . . . . . . . . . . . . . . . $ 9062008 . . . . . . . . . . . . . . . . . . . . . . . . . . . . . . . . . . . . . . . . . . . . . . . . . . . . . . . . . . . . . . 6252009 . . . . . . . . . . . . . . . . . . . . . . . . . . . . . . . . . . . . . . . . . . . . . . . . . . . . . . . . . . . . . . 6182010 . . . . . . . . . . . . . . . . . . . . . . . . . . . . . . . . . . . . . . . . . . . . . . . . . . . . . . . . . . . . . . 2092011 . . . . . . . . . . . . . . . . . . . . . . . . . . . . . . . . . . . . . . . . . . . . . . . . . . . . . . . . . . . . . . 403Years 2012-2016 . . . . . . . . . . . . . . . . . . . . . . . . . . . . . . . . . . . . . . . . . . . . . . . . . . . . 2,606
(19) EARNINGS PER SHARE (EPS)
Basic EPS is computed by dividing net income by the weighted average number of shares of common stockoutstanding during each period. The following table presents a reconciliation of the share amounts used in thecomputation of basic and diluted earnings per share:
(In thousands)
Year endedDecember 31,
2006
Four monthsended
December 31,2005
Year endedAugust 27,
2005
Year endedAugust 28,
2004
Basic earnings per share—Weighted common sharesoutstanding . . . . . . . . . . . . . . . . . . . . . . . . . . . . . . . . . . . . . 135,116 135,437 77,137 72,957
Weighted common shares assumed upon exercise ofoptions . . . . . . . . . . . . . . . . . . . . . . . . . . . . . . . . . . . . . . . . 2,377 — 1,844 3,225
Weighted common shares assumed upon vesting ofrestricted common stock . . . . . . . . . . . . . . . . . . . . . . . . . . . 999 — 347 38
Diluted earnings per share—Weighted common sharesoutstanding . . . . . . . . . . . . . . . . . . . . . . . . . . . . . . . . . . . . . 138,492 135,437 79,328 76,220
Approximately 4.5 million, 2.9 million, and 0.8 million of the Company’s stock options were excluded from thecalculation of diluted earnings per share in the fiscal year ended December 31, 2006 and the fiscal years endedAugust 27, 2005 and August 28, 2004, respectively, because the exercise prices of the stock options were greaterthan the average price of the Company’s common stock, and therefore their inclusion would have beenantidilutive. The effect of the inclusion of stock options and unvested restricted common stock for the four-month period ended December 31, 2005 would have been anti-dilutive.
F-38

(20) SEGMENT INFORMATION
Entegris operates in one segment for the design, development, manufacture, marketing and sale of materialintegrity management products and services predominantly within the semiconductor industry. All products aresold on a worldwide basis. In accordance with SFAS No. 131, Disclosures About Segments of an Enterprise andRelated Information, the Company’s chief operating decision-maker has been identified as the President andChief Executive Officer, who reviews operating results to make decisions about allocating resources andassessing performance for the entire company. Since Entegris operates in one reportable segment, all financialinformation required by SFAS 131 can be found in the consolidated financial statements.
The following table summarizes total net sales by markets served:
(In thousands)
Year endedDecember 31,
2006
Four monthsended
December 31,2005
Year endedAugust 27,
2005
Year endedAugust 28,
2004
Net sales:Semiconductor . . . . . . . . . . . . . . . . . . . . . . . . . . . . . . . . $530,952 $155,147 $267,832 $260,237Data storage . . . . . . . . . . . . . . . . . . . . . . . . . . . . . . . . . . 44,546 13,540 42,517 32,158Other . . . . . . . . . . . . . . . . . . . . . . . . . . . . . . . . . . . . . . . . 103,208 33,609 47,684 44,759
$678,706 $202,296 $358,033 $337,154
The following tables summarize total net sales, based upon the country to which sales to external customers weremade, and property, plant and equipment attributed to significant countries:
(In thousands)
Year endedDecember 31,
2006
Four monthsended
December 31,2005
Year endedAugust 27,
2005
Year endedAugust 28,
2004
Net sales:United States . . . . . . . . . . . . . . . . . . . . . . . . . . . . . . . . . . $195,890 $ 61,857 $125,848 $120,478Japan . . . . . . . . . . . . . . . . . . . . . . . . . . . . . . . . . . . . . . . . 153,329 44,312 56,203 55,020Germany . . . . . . . . . . . . . . . . . . . . . . . . . . . . . . . . . . . . . 25,628 7,848 16,876 22,312Taiwan . . . . . . . . . . . . . . . . . . . . . . . . . . . . . . . . . . . . . . 82,638 26,945 36,627 34,543Singapore . . . . . . . . . . . . . . . . . . . . . . . . . . . . . . . . . . . . 30,794 9,605 26,442 26,952Korea . . . . . . . . . . . . . . . . . . . . . . . . . . . . . . . . . . . . . . . 56,117 15,372 25,328 19,888Malaysia . . . . . . . . . . . . . . . . . . . . . . . . . . . . . . . . . . . . . 25,088 6,545 13,848 10,877Other . . . . . . . . . . . . . . . . . . . . . . . . . . . . . . . . . . . . . . . . 109,222 29,812 56,861 47,084
$678,706 $202,296 $358,033 $337,154
(In thousands)December 31,
2006December 31,
2005August 27,
2005August 28,
2004
Property, plant and equipment:United States . . . . . . . . . . . . . . . . . . . . . . . . . . . . . . . . . . . $ 68,730 $ 73,325 $ 74,330 $61,966Japan . . . . . . . . . . . . . . . . . . . . . . . . . . . . . . . . . . . . . . . . . 21,114 19,740 20,499 11,781Germany . . . . . . . . . . . . . . . . . . . . . . . . . . . . . . . . . . . . . . 290 3,953 6,090 5,806Malaysia . . . . . . . . . . . . . . . . . . . . . . . . . . . . . . . . . . . . . . 22,874 16,168 15,890 13,146Other . . . . . . . . . . . . . . . . . . . . . . . . . . . . . . . . . . . . . . . . . 7,246 7,137 6,798 3,108
$120,254 $120,323 $123,607 $95,807
In the fiscal year ended December 31, 2006, the four months ended December 31, 2005, and the fiscal yearsended August 27, 2005 and August 28, 2004, no single nonaffiliated customer accounted for 10% or more of netsales. In the fiscal year ended December 31, 2006, the four months ended December 31, 2005, and the fiscalyears ended August 27, 2005 and August 28, 2004, net sales to the Company’s top ten customers accounted forapproximately 28%, 32%, 37%, and 36%, respectively, of the Company’s net sales.
F-39

(21) COMMITMENTS AND CONTINGENT LIABILITIES
The following discussion provides information regarding certain litigation to which the Company was a partythat were pending as of December 31, 2006.
As previously disclosed, on March 3, 2003 the Company’s predecessor, Mykrolis Corporation, filed a lawsuitagainst Pall Corporation in the United States District Court for the District of Massachusetts alleginginfringement of two of the Company’s U.S. patents by certain fluid separation systems and related assembliesused in photolithography applications manufactured and sold by the defendant. The Company’s lawsuit alsosought a preliminary injunction preventing the defendant from the manufacture, use, sale, offer for sale orimportation into the U.S. of any infringing product. On April 30, 2004, the Court issued a preliminary injunctionagainst Pall Corporation and ordered Pall to immediately stop making, using, selling, or offering to sell withinthe U.S., or importing into the U.S., its PhotoKleen EZD-2 Filter Assembly products or “any colorable imitation”of those products. On January 18, 2005, the Court issued an order holding Pall Corporation in contempt of courtfor the violation of the preliminary injunction and ordering Pall to disgorge all profits earned from the sale of itsPhotoKleen EZD-2 Filter Assembly products and colorable imitations thereof from the date the preliminaryinjunction was issued through January 12, 2005. In addition, Pall was also ordered to reimburse Mykrolis forcertain of its attorney’s fees associated with the contempt and related proceedings. The Court’s order alsodissolved the preliminary injunction, effective January 12, 2005, based on certain prior art cited by Pall which italleged raised questions as to the validity of the patents in suit. On February 17, 2005, the Company filed noticeof appeal to the U.S. Circuit Court of Appeals for the Federal Circuit appealing the portion of the Court’s orderthat dissolved the preliminary injunction and Pall filed a notice of appeal to that court with respect to the findingof contempt and the award of attorneys’ fees; these cross appeals are pending.
On April 6, 2006 the Company filed a lawsuit against Pall Corporation in the United States District Court for theDistrict of Massachusetts alleging infringement of the Company’s newly issued U.S. patent No. 7,021,667 bycertain filter assembly products used in photolithography applications that are manufactured and sold by thedefendant. The Company’s lawsuit also seeks a preliminary injunction preventing the defendant from themanufacture, use, sale, offer for sale or importation into the U.S. of the infringing products. On October 23, 2006the Company’s motion for preliminary injunction was argued before the court; a decision on this motion ispending.
On August 23, 2006 the Company filed a lawsuit against Pall Corporation in the United States District Court forthe District of Massachusetts alleging infringement of the Company’s newly issued U.S. patent No. 7,037,4247by certain fluid separation modules and related separation apparatus, including the product known as the EZD-3Filter assembly, used in photolithography applications that are manufactured and sold by the defendant. It isbelieved that the EZD-3 Filter assembly was introduced into the market by the defendant in response to theaction brought by the Company in March of 2003 as described above. This case is currently in the preliminarystages.
As previously disclosed, on December 16, 2005 Pall Corporation filed suit against the Company in U.S. DistrictCourt for the Eastern District of New York alleging patent infringement. Specifically, the suit allegesinfringement of two of plaintiff’s patents by certain of the Company’s filtration products. Both products and theirpredecessor products have been on the market for a number of years and one is covered by patents held by theCompany. The Company intends to vigorously defend this suit and believes that it will ultimately prevail. Thiscase is currently in the discovery stage.
In addition, from time to time, the Company is a party to various legal proceedings arising in the ordinary courseof our business. The Company does not believe that these proceedings individually or in the aggregate will havea material adverse effect on our financial condition, results of operations or cash flows.
F-40

(22) QUARTERLY INFORMATION-UNAUDITED
On December 13, 2005, the Company’s Board approved a change in fiscal year end from a 52-week or 53-weekfiscal year period ending on the last Saturday of August to December 31, effective as of December 31, 2005.Accordingly, the financial periods presented are defined as follows: (i) the year ended December 31, 2006;(ii) four months ended December 31, 2005; and the (iii) year ended August 27, 2005. Condensed consolidatedquarterly and interim information is as follows:
Fiscal quarter ended Four monthsended
December 31,2005(In thousands, except per share data)
April 1,2006
July 1,2006
September 30,2006
December 31,2006
Net sales . . . . . . . . . . . . . . . . . . . . . . . . . . . . . . $157,662 $180,701 $171,262 $169,081 $202,296Gross profit . . . . . . . . . . . . . . . . . . . . . . . . . . . . 72,959 87,107 76,262 69,821 69,964Net income (loss) from continuing
operations . . . . . . . . . . . . . . . . . . . . . . . . . . .Net income (loss) from discontinued
operations . . . . . . . . . . . . . . . . . . . . . . . . . . .9,7731,580
18,445(252)
17,923(102)
16,295(196)
(10,281)(8,043)
Net income (loss) . . . . . . . . . . . . . . . . . . . . . . . 11,353 18,193 17,821 16,099 (18,324)Basic earnings (loss) per shareContinuing operations . . . . . . . . . . . . . . . . . . . 0.07 0.13 0.13 0.12 (0.08)
Discontinued operations . . . . . . . . . . . . . . 0.01 — — — (0.06)Net income (loss) . . . . . . . . . . . . . . . . . . . 0.08 0.13 0.13 0.12 (0.14)
Diluted earnings (loss) per shareContinuing operations . . . . . . . . . . . . . . . 0.07 0.13 0.13 0.12 (0.08)Discontinued operations . . . . . . . . . . . . . . 0.01 — — — (0.06)Net income (loss) . . . . . . . . . . . . . . . . . . . 0.08 0.13 0.13 0.12 (0.14)
Fiscal quarter ended
(In thousands, except per share data)November 27,
2004February 26,
2005May 28,
2005August 27,
2005
Net sales . . . . . . . . . . . . . . . . . . . . . . . . . . . . . . . . . . . . . . . . . . . $89,102 $83,589 $84,948 $100,394Gross profit . . . . . . . . . . . . . . . . . . . . . . . . . . . . . . . . . . . . . . . . . 37,159 34,685 35,095 32,651Net income (loss) from continuing operations . . . . . . . . . . . . . .Net (loss) from discontinued operations . . . . . . . . . . . . . . . . . .
6,558(819)
5,190(715)
7,845(736)
(6,807)(1,123)
Net income (loss) . . . . . . . . . . . . . . . . . . . . . . . . . . . . . . . . . . . . 5,739 4,475 7,109 (7,930)Basic earnings (loss) per share
Continuing operations . . . . . . . . . . . . . . . . . . . . . . . . . . . . 0.09 0.07 0.11 (0.08)Discontinued operations . . . . . . . . . . . . . . . . . . . . . . . . . . . (0.01) (0.01) (0.01) (0.01)Net income (loss) . . . . . . . . . . . . . . . . . . . . . . . . . . . . . . . . (0.08) 0.06 0.10 (0.09)
Diluted earnings (loss) per shareContinuing operations . . . . . . . . . . . . . . . . . . . . . . . . . . . . 0.09 0.07 0 .10 (0.08)Discontinued operations . . . . . . . . . . . . . . . . . . . . . . . . . . . (0.01) (0.01) (0.01) (0.01)Net income (loss) . . . . . . . . . . . . . . . . . . . . . . . . . . . . . . . . 0.08 0.06 0.09 (0.09)
F-41

OFFICERS
Gideon Argov President and Chief Executive Officer
John B. Goodman Senior Vice President, Chief Technology
and Innovation Officer
Gregory B. Graves Senior Vice President and Chief
Financial Officer
Bertrand Loy Executive Vice President and Chief
Administrative Officer
John J. Murphy Senior Vice President, Human Resources
Jean-Marc Pandraud Executive Vice President and Chief
Operating Officer
Peter W. Walcott Senior Vice President and
General Counsel
BOARD OF DIRECTORS
Gideon Argov President and Chief Executive Officer,
Entegris, Inc.
Michael A. Bradley President and Chief Executive Officer,
Teradyne, Inc.
Michael P. C. Carns Independent Business Consultant;
Chairman of the Management
Development and Compensation
Committee
Daniel W. Christman Lieutenant General (retired); Senior
Vice President International Affairs,
U.S. Chamber of Commerce
James E. Dauwalter Former Chief Executive Officer,
Entegris, Inc.; Chairman of the Board
Gary F. Klingl President, Green Giant Worldwide,
a division of The Pillsbury Company
(retired)
Roger D. McDaniel Chief Executive Officer, MEMC (retired);
Chairman of the Audit and Finance
Committee
Paul L. H. Olson, Ed.D. Executive Vice President, Bethel
University; Chairman of the Governance
and Nominating Committee
Thomas O. Pyle Chairman, PolyMedica Corporation
Brian F. Sullivan President and Chief Executive Officer,
SterilMed, Inc.
CORPORATE WEB SITE
www.entegris.com
STOCK LISTING
Entegris’ common stock is traded on the NASDAQ Stock
Market® under the symbol ENTG.
ANNUAL MEETING
The Annual Meeting of Shareholders will be held:
May 9, 2007 – 10:00 a.m. (Eastern Time)
Entegris, Inc.
129 Concord Road, Building 2
Billerica, MA 01821
Tel. 978-436-6500
REGISTRAR AND TRANSFER AGENT
Registered shareholders should direct questions regarding
stock certificates, name or address changes, notification of
lost certificates or stock transfers to:
Wells Fargo Bank Minnesota, N.A.
Shareowner Services
Post Office Box 64854
161 North Concord Exchange Street
South St. Paul, MN 55075-1139 USA
Tel. 800-468-9716
Fax 651-450-4033
Beneficial shareholders should direct questions regarding all
administrative matters to your stockbroker.
INVESTOR INFORMATION
Copies of the Company’s Annual Report, Proxy Statement, Forms
10-K and 10-Q reports filed with the Securities and Exchange
Commission can be obtained through one of the following:
Internet: www.entegris.com
Mail: Entegris, Inc.
Investor Relations
3500 Lyman Boulevard
Chaska, MN 55318 USA
E-mail: [email protected]
Tel. 952-556-8080
Fax 952-556-8644
FORWARD-LOOKING STATEMENTSCertain information contained in this document includes forward-lookingstatements within the meaning of the Private Securities Litigation ReformAct of 1995. These forward-looking statements are based on current man-agement expectations that involve substantial risks and uncertainties whichcould cause actual results to differ materially from the results expressed in,or implied by, these forward-looking statements. Statements which aremodified by words such as ‘‘anticipate,’’ ‘‘believe,’’ ‘‘estimate,’’ ‘‘expect,’’“forecast,” ‘‘may,’’ ‘‘will,’’ ‘‘should’’ or the negative thereof and similar expres-sions as they relate to Entegris or our management are intended to identifysuch forward-looking statements. These statements are not guarantees offuture performance and involve risks, uncertainties and assumptions whichare difficult to predict. The risks which could cause actual results to differfrom those discussed herein include, without limit: (i) the risks describedunder the headings ”Risks Relating to our Business and Industry,”“Manufacturing Risks,” “International Risks” and ”Risks Related to SecuritiesMarkets and Ownership of Our Securities” in Item 1A, Risk Factors in theEntegris, Inc. Annual Report on Form 10–K for the fiscal year endedDecember 31, 2006; (ii) the risk of a disruption in our supply chain so thatwe will be unable to meet our customers’ demand for product during peri-ods of industry expansion; (iii) other matters and important factors disclosedpreviously and from time to time in the filings of Entegris with the U.S.Securities and Exchange Commission. The forward-looking statements madein this document relate only to events as of the date on which the state-ments are made. Except as required under the federal securities laws and therules and regulations of the Securities and Exchange Commission, we do nothave any intention or obligation to update publicly any forward-lookingstatements contained herein.
Entegris®, the symbol of the linked rings, the Entegris logotype, Mykrolis® andLiquidLens™ are trademarks of Entegris, Inc.The NASDAQ Stock Market® is a registered trademark of the Nasdaq StockMarket, Inc.
57543_IFC-IBC.qxp 3/23/07 4:19 PM Page 2

The materials integrity management company
ENTEGRIS, INC. Corporate Headquarters 3500 Lyman Boulevard Chaska, Minnesota 55318 USA Tel. 952-556-3131 Fax 952-556-1880 www.entegris.com
©2007 Entegris, Inc. Printed in USA 9000-5136RRD-0307
57543_BC-FC.qxp 3/23/07 4:24 PM Page 1