enrolments and education spending in public schools … · to accurately understand education...
TRANSCRIPT
fraserinstitute.org FRASER RESEARCH BULLETIN 1
by Jason Clemens, Deani Neven Van Pelt, and Joel Emes
�� To accurately understand education spend-ing, enrolment changes must be included.
�� For Canada as a whole, the increase in per-student spending in public schools after ac-counting for the effects of price changes was 30.8% between 2003-04 and 2012-13; from $9,231 to $12,070.
�� Saskatchewan saw the largest increase in per-student spending in public schools af-ter adjusting for price changes. It experienced a 43.8% increase from $9,929 in 2003-04 to $14,282 in 2012-13. Neighbouring Manitoba re-corded the smallest increase (14.9%).
�� In aggregate, Canada increased education spending in public schools by $13.8 billion from
2003-04 to 2012-13 more than was necessary to account for enrolment and price changes. If per student spending in public schools had re-mained constant over this period, the aggregate amount of education spending in public schools in 2012-13 would have been 22.8% lower.
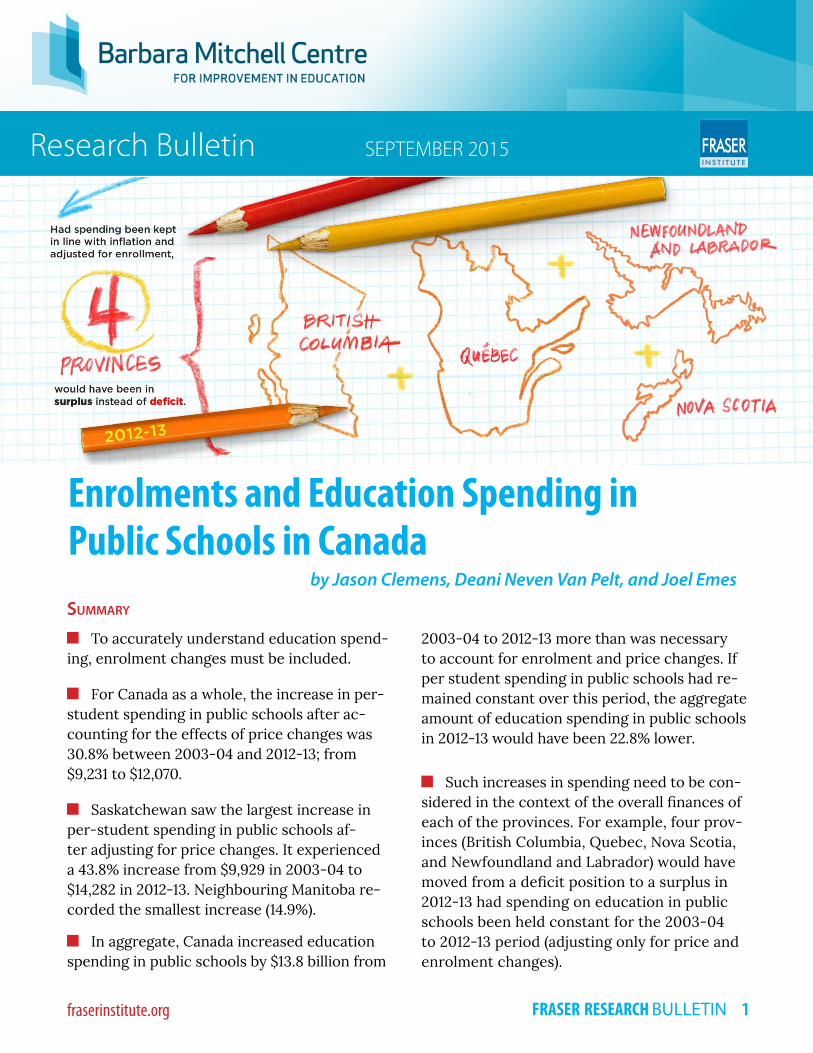
�� Such increases in spending need to be con-sidered in the context of the overall finances of each of the provinces. For example, four prov-inces (British Columbia, Quebec, Nova Scotia, and Newfoundland and Labrador) would have moved from a deficit position to a surplus in 2012-13 had spending on education in public schools been held constant for the 2003-04 to 2012-13 period (adjusting only for price and enrolment changes).
Summary
Enrolments and Education Spending in Public Schools in Canada
Research Bulletin SEPTEMBER 2015 FRASERINST I TUTE
Enrolments and Education Spending in Public Schools in Canada
fraserinstitute.org FRASER RESEARCH BULLETIN 2
Introduction
This bulletin is another instalment in an ex-tended series aimed at providing basic informa-tion about education spending in Canada. It fo-cuses on the change in per-student education spending in public schools over the last decade (2003-04 to 2012-13). The study has two prin-cipal goals. First, it provides basic current and historical data on per-student spending in pub-lic schools. Second, it provides some context for understanding the changes observed in the education spending data.
The paper is divided into six short, focused sections. The first shows the increase in to-tal spending on education in public schools by province over the last decade (2003-04 to 2012-13). The second gives enrolment numbers for each of the provinces for public schools over the same period. The next section calculates per-student spending in public schools over time, which combines the data from the first two sections. The fourth section then adjusts the data from section three to account for price changes (e.g., inflation). The fifth section pres-ents two contexts within which to consider the increases calculated in the previous sections to help readers understand the totality and mag-nitude of the education spending increases. The essay ends with a brief conclusion.
I. Total spending on education in public schoolsBefore discussing the specific education spend-ing measurements, it is worthwhile to recon-sider the state of total spending. This essay and the companion pieces in the series focus on spending on education in public schools rath-er than on alternative measures of either to-tal spending on education or total government spending on education, which may include in-
dependent school spending, depending on the province.
It is important to recognize that there are sev-eral important aspects to spending on edu-cation in public schools. First, this measure is limited to spending on education in pub-lic schools, which is distinct from spending on public education. This distinction therefore ex-cludes, for example, government spending on independent schools in Quebec and the four western provinces.1
Second, the data currently available from Sta-tistics Canada includes a few small categories of revenue and spending that could be con-sidered non-governmental, but which are ex-tremely difficult to remove. Specifically, this essay includes the data from “Fees & Other Pri-vate Sources,” which includes rentals and leas-es, investment revenues, capital fund-sourced revenues, other fees, trust account reve-nues, inter-school transfers, and adjustments. Thankfully these items represent comparatively little revenue and spending relative to the en-tire envelope of spending on education in pub-lic schools. However, it is important to recog-nize that the measure relied on for this paper may not be exclusive of a small amount of pri-vate spending on education in public schools.
In addition, the dataset used includes several categories of spending on education in public schools that are often ignored or purposefully excluded. Specifically, it includes spending on capital—particularly new school construction and renovations to existing schools—as well as contributions to school employee pension plans. The inclusion of these spending catego-ries is particularly important given their rela-
1 For more information on the state of funding of both public and independent schools in Canada see Clemens, Palacios, Loyer, and Fathers (2014).
Enrolments and Education Spending in Public Schools in Canada
fraserinstitute.org FRASER RESEARCH BULLETIN 3
tive growth in recent years.2 The “spending on public schools” dataset is based on Statistics Canada’s “public elementary and secondary ed-ucation expenditures” less “direct government expenditures on public education by the De-partment of National Defence,” “federal school expenditures,” and “special education expendi-tures on public education” (2014).
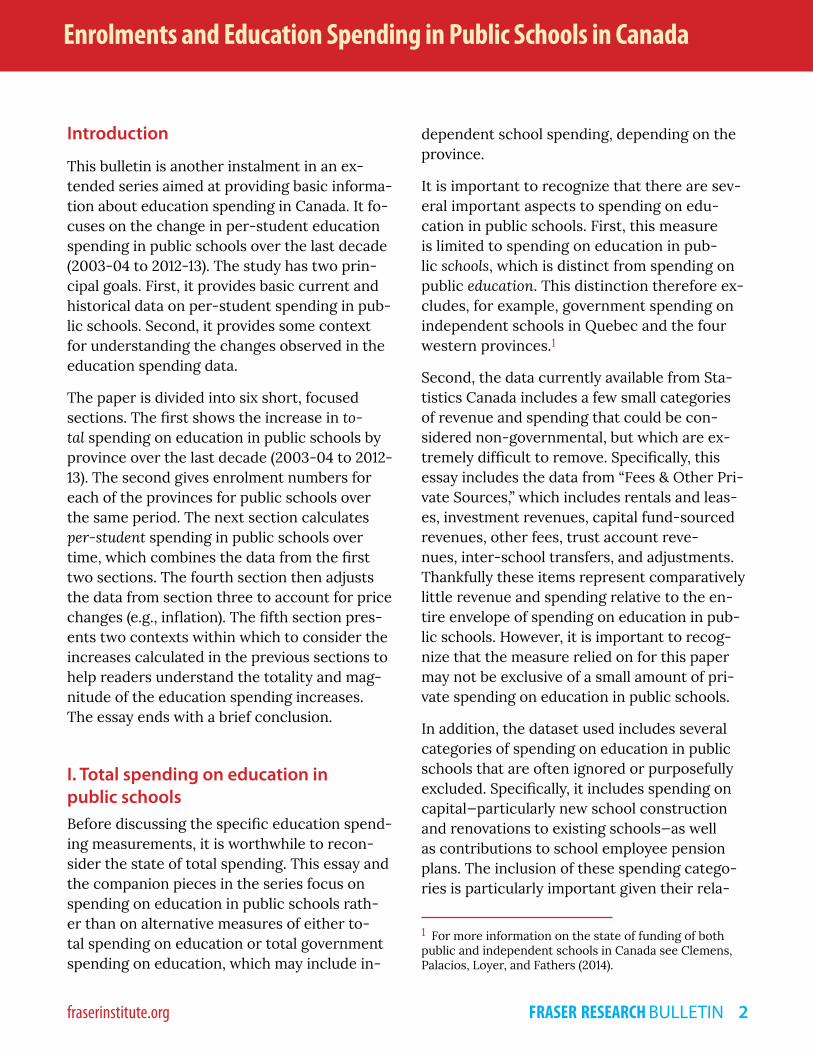
Table 1 includes data for spending on education in public schools in 2003-04 and 2012-13; figure 1 presents this data graphically. Spending on education in public schools in 2012-13 amount-ed to $60.7 billion, an increase of $19.1 billion, or 45.9%, from 2003-04 when spending on educa-tion in public schools was $41.6 billion.
Provincially, the largest increase in spending on education in public schools (71.8%) occurred in Alberta. Neighbouring British Columba record-
2 A forthcoming analysis of education spending by Van Pelt et al. will examine this specific issue in more detail.
Figure 1: Spending on Public Schools
Source: Statistics Canada (2015c).
Table 1: Spending on Public Schools
2003-04 ($ mil-lions)
2012-13 ($ mil-lions)
Nominal change, ($ mil-lions)
Percentage change
Canada 41,609 60,700 19,091 45.9%
NL 653 868 215 32.9%
PE 173 243 70 40.1%
NS 1,177 1,495 318 27.0%
NB 964 1,368 404 41.9%
QC 8,768 12,253 3,486 39.8%
ON 16,650 24,982 8,332 50.0%
MB 1,771 2,322 551 31.1%
SK 1,478 2,432 954 64.5%
AB 4,579 7,867 3,288 71.8%
BC 5,081 6,425 1,344 26.5%
Source: Statistics Canada (2015c).
0
5,000
10,000
15,000
20,000
25,000
30,000
NL PE NS NB QC ON MB SK AB BC
Mill
ions
of D
olla
rs, N
omin
al 2003-04
2012-13
Enrolments and Education Spending in Public Schools in Canada
fraserinstitute.org FRASER RESEARCH BULLETIN 4
ed the smallest increase (26.5%). Half the prov-inces had increases in excess of 40.0% (table 1).
II. Enrolment in public schoolsAs a previous essay in this series explained (Van Pelt and Emes, 2015), total spending on edu-cation in public schools misses a critical com-ponent: enrolment. Any analysis of education spending that ignores enrolment risks materi-ally misrepresenting the reality of that spend-ing. An increase in education spending that is less than the percentage increase in enrolment results in a per-student decrease in spending on education. Conversely, a reduction in edu-cation spending that is less than a percentage reduction in enrolment results in a per-student increase in spending. It is, therefore, critical to account for changes in enrolment when analyz-ing education spending.
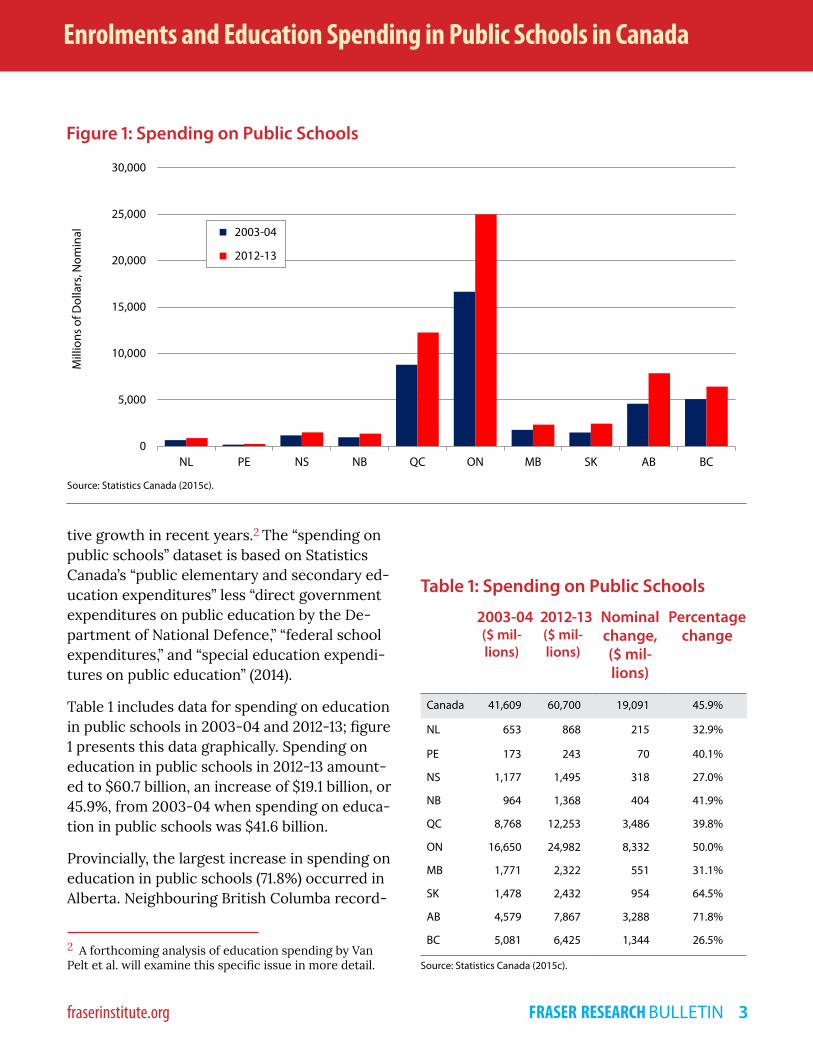
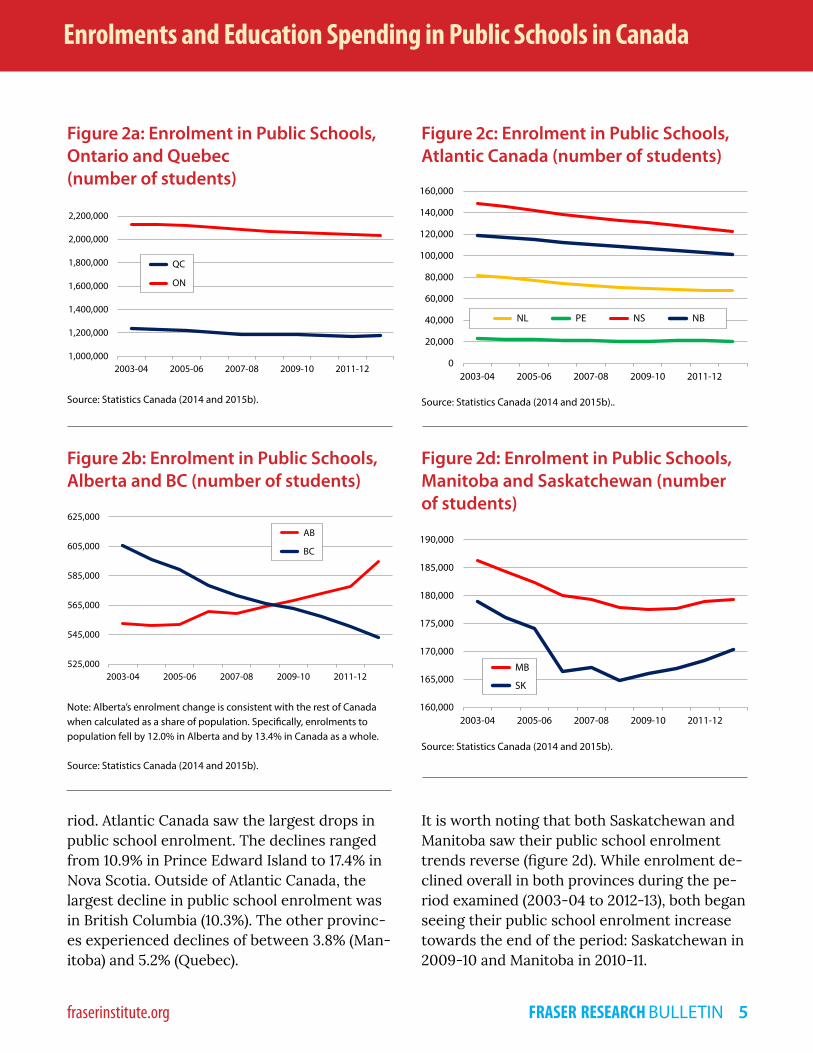
Table 2 contains enrolment data for Canada as a whole and for the individual provinces be-tween 2003-04 and 2012-13. Figures 2a to 2d illustrate the provincial enrolment by region over the same period.
Total enrolment in public schools in Canada de-clined by 4.9% between 2003-04 and 2012-13, from almost 5.3 million to a little over 5.0 mil-lion students. As figures 2a to 2d illustrate, Al-berta was the only province to experience an increase in public school enrolment over the entire period (7.6%).3
The other nine provinces all experienced a de-cline in public school enrolment over the pe-
3 It’s important to note, however, that Alberta’s enrolment change is consistent with the rest of Canada when calcu-lated as a share of population. Specifically, enrolment-to-population fell by 12.0% in Alberta and by 13.4% in Canada as a whole.
Table 2: Enrolment in Public Schools, 2003-04 to 2012-13 (number of students)2003-
042004-
052005-
062006-
072007-
082008-
092009-
102010-
112011-
122012-
13Percent-
age change, 2003-04
to 2012-13
Canada 5,286,949 5,253,442 5,212,533 5,163,824 5,115,188 5,086,549 5,074,669 5,051,760 5,030,315 5,029,009 -4.9%
NL 81,510 79,485 76,806 74,343 72,111 70,641 69,663 68,655 67,827 67,476 -17.2%
PE 22,905 22,395 21,948 21,366 20,811 20,325 19,953 21,162 20,829 20,406 -10.9%
NS 148,514 145,396 142,304 138,661 135,303 133,134 130,550 128,131 125,540 122,643 -17.4%
NB 118,869 117,144 114,819 112,014 110,286 108,405 106,392 104,421 102,579 101,079 -15.0%
QC 1,241,143 1,233,100 1,216,293 1,204,622 1,188,903 1,187,612 1,189,876 1,179,970 1,172,185 1,176,811 -5.2%
ON 2,129,742 2,123,904 2,118,546 2,103,465 2,087,586 2,070,735 2,061,390 2,051,865 2,043,117 2,031,195 -4.6%
MB 186,288 184,353 182,373 180,042 179,322 177,960 177,501 177,678 178,920 179,292 -3.8%
SK 178,932 176,069 174,206 166,498 167,181 164,763 166,003 167,043 168,354 170,318 -4.8%
AB 552,594 550,983 551,739 560,562 559,119 564,051 567,978 573,198 577,758 594,444 7.6%
BC 605,545 596,172 589,388 578,626 571,267 565,875 562,743 557,102 550,748 542,879 -10.3%
Source: Statistics Canada (2014 and 2015b).
Enrolments and Education Spending in Public Schools in Canada
fraserinstitute.org FRASER RESEARCH BULLETIN 5
riod. Atlantic Canada saw the largest drops in public school enrolment. The declines ranged from 10.9% in Prince Edward Island to 17.4% in Nova Scotia. Outside of Atlantic Canada, the largest decline in public school enrolment was in British Columbia (10.3%). The other provinc-es experienced declines of between 3.8% (Man-itoba) and 5.2% (Quebec).
Figure 2b: Enrolment in Public Schools, Alberta and BC (number of students)
Note: Alberta’s enrolment change is consistent with the rest of Canada when calculated as a share of population. Specifically, enrolments to population fell by 12.0% in Alberta and by 13.4% in Canada as a whole.
Source: Statistics Canada (2014 and 2015b).
Figure 2a: Enrolment in Public Schools, Ontario and Quebec (number of students)
Source: Statistics Canada (2014 and 2015b).
Figure 2d: Enrolment in Public Schools, Manitoba and Saskatchewan (number of students)
Source: Statistics Canada (2014 and 2015b).
Figure 2c: Enrolment in Public Schools, Atlantic Canada (number of students)
Source: Statistics Canada (2014 and 2015b)..
It is worth noting that both Saskatchewan and Manitoba saw their public school enrolment trends reverse (figure 2d). While enrolment de-clined overall in both provinces during the pe-riod examined (2003-04 to 2012-13), both began seeing their public school enrolment increase towards the end of the period: Saskatchewan in 2009-10 and Manitoba in 2010-11.
1,000,000
1,200,000
1,400,000
1,600,000
1,800,000
2,000,000
2,200,000
2003-04 2005-06 2007-08 2009-10 2011-12
QC
ON
525,000
545,000
565,000
585,000
605,000
625,000
2003-04 2005-06 2007-08 2009-10 2011-12
AB
BC
0
20,000
40,000
60,000
80,000
100,000
120,000
140,000
160,000
2003-04 2005-06 2007-08 2009-10 2011-12
NL PE NS NB
160,000
165,000
170,000
175,000
180,000
185,000
190,000
2003-04 2005-06 2007-08 2009-10 2011-12
MB
SK
Enrolments and Education Spending in Public Schools in Canada
fraserinstitute.org FRASER RESEARCH BULLETIN 6
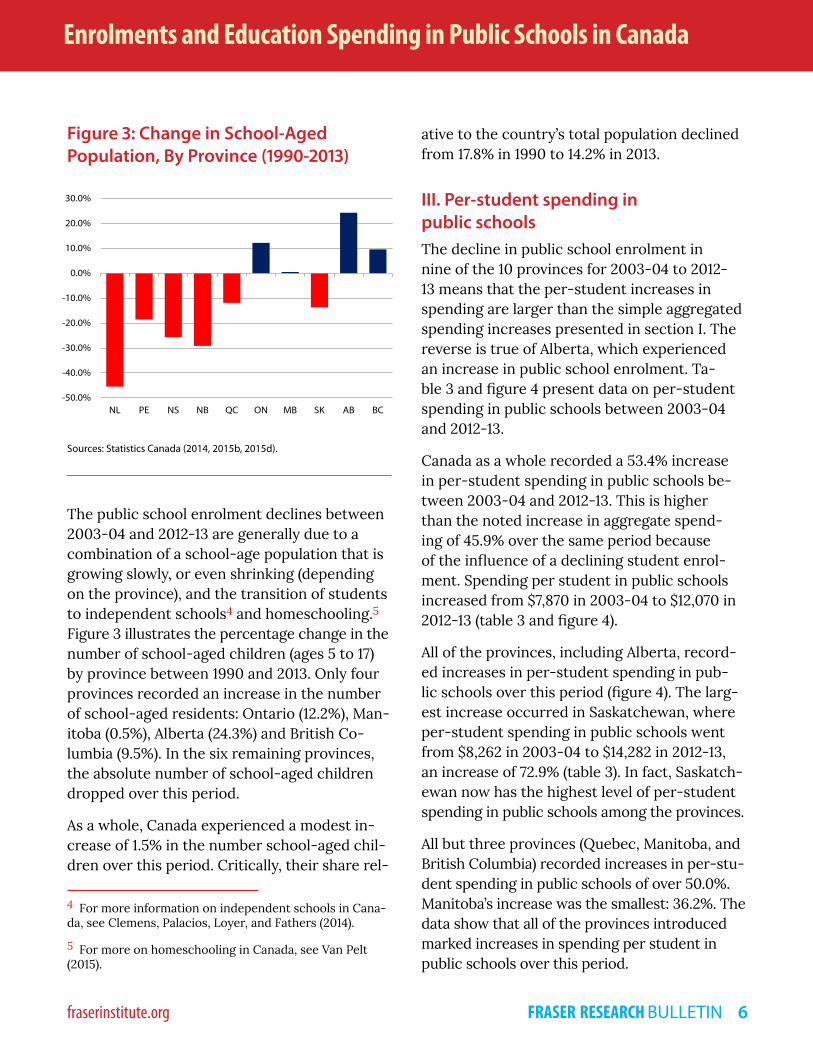
The public school enrolment declines between 2003-04 and 2012-13 are generally due to a combination of a school-age population that is growing slowly, or even shrinking (depending on the province), and the transition of students to independent schools4 and homeschooling.5 Figure 3 illustrates the percentage change in the number of school-aged children (ages 5 to 17) by province between 1990 and 2013. Only four provinces recorded an increase in the number of school-aged residents: Ontario (12.2%), Man-itoba (0.5%), Alberta (24.3%) and British Co-lumbia (9.5%). In the six remaining provinces, the absolute number of school-aged children dropped over this period.
As a whole, Canada experienced a modest in-crease of 1.5% in the number school-aged chil-dren over this period. Critically, their share rel-
4 For more information on independent schools in Cana-da, see Clemens, Palacios, Loyer, and Fathers (2014).
5 For more on homeschooling in Canada, see Van Pelt (2015).
ative to the country’s total population declined from 17.8% in 1990 to 14.2% in 2013.
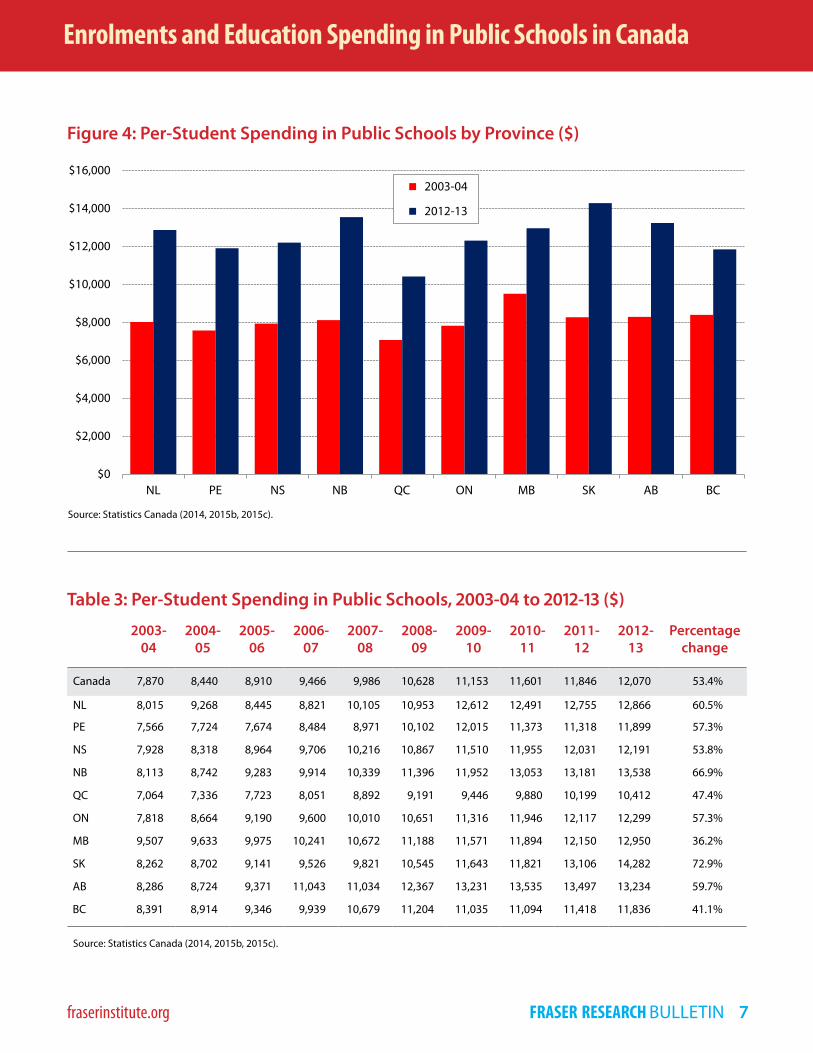
III. Per-student spending in public schoolsThe decline in public school enrolment in nine of the 10 provinces for 2003-04 to 2012-13 means that the per-student increases in spending are larger than the simple aggregated spending increases presented in section I. The reverse is true of Alberta, which experienced an increase in public school enrolment. Ta-ble 3 and figure 4 present data on per-student spending in public schools between 2003-04 and 2012-13.
Canada as a whole recorded a 53.4% increase in per-student spending in public schools be-tween 2003-04 and 2012-13. This is higher than the noted increase in aggregate spend-ing of 45.9% over the same period because of the influence of a declining student enrol-ment. Spending per student in public schools increased from $7,870 in 2003-04 to $12,070 in 2012-13 (table 3 and figure 4).
All of the provinces, including Alberta, record-ed increases in per-student spending in pub-lic schools over this period (figure 4). The larg-est increase occurred in Saskatchewan, where per-student spending in public schools went from $8,262 in 2003-04 to $14,282 in 2012-13, an increase of 72.9% (table 3). In fact, Saskatch-ewan now has the highest level of per-student spending in public schools among the provinces.
All but three provinces (Quebec, Manitoba, and British Columbia) recorded increases in per-stu-dent spending in public schools of over 50.0%. Manitoba’s increase was the smallest: 36.2%. The data show that all of the provinces introduced marked increases in spending per student in public schools over this period.
Figure 3: Change in School-Aged Population, By Province (1990-2013)
Sources: Statistics Canada (2014, 2015b, 2015d).
-50.0%
-40.0%
-30.0%
-20.0%
-10.0%
0.0%
10.0%
20.0%
30.0%
NL PE NS NB QC ON MB SK AB BC
Enrolments and Education Spending in Public Schools in Canada
fraserinstitute.org FRASER RESEARCH BULLETIN 7
Figure 4: Per-Student Spending in Public Schools by Province ($)
Source: Statistics Canada (2014, 2015b, 2015c).
Table 3: Per-Student Spending in Public Schools, 2003-04 to 2012-13 ($)
2003- 04
2004- 05
2005- 06
2006- 07
2007- 08
2008- 09
2009- 10
2010- 11
2011- 12
2012-13
Percentage change
Canada 7,870 8,440 8,910 9,466 9,986 10,628 11,153 11,601 11,846 12,070 53.4%
NL 8,015 9,268 8,445 8,821 10,105 10,953 12,612 12,491 12,755 12,866 60.5%
PE 7,566 7,724 7,674 8,484 8,971 10,102 12,015 11,373 11,318 11,899 57.3%
NS 7,928 8,318 8,964 9,706 10,216 10,867 11,510 11,955 12,031 12,191 53.8%
NB 8,113 8,742 9,283 9,914 10,339 11,396 11,952 13,053 13,181 13,538 66.9%
QC 7,064 7,336 7,723 8,051 8,892 9,191 9,446 9,880 10,199 10,412 47.4%
ON 7,818 8,664 9,190 9,600 10,010 10,651 11,316 11,946 12,117 12,299 57.3%
MB 9,507 9,633 9,975 10,241 10,672 11,188 11,571 11,894 12,150 12,950 36.2%
SK 8,262 8,702 9,141 9,526 9,821 10,545 11,643 11,821 13,106 14,282 72.9%
AB 8,286 8,724 9,371 11,043 11,034 12,367 13,231 13,535 13,497 13,234 59.7%
BC 8,391 8,914 9,346 9,939 10,679 11,204 11,035 11,094 11,418 11,836 41.1%
Source: Statistics Canada (2014, 2015b, 2015c).
$0
$2,000
$4,000
$6,000
$8,000
$10,000
$12,000
$14,000
$16,000
NL PE NS NB QC ON MB SK AB BC
2003-04
2012-13
Enrolments and Education Spending in Public Schools in Canada
fraserinstitute.org FRASER RESEARCH BULLETIN 8
IV. Accounting for price changesLeft out from the analysis thus far is one im-portant factor: the influence of changing pric-es. Price changes refers to changes in prices that affect the real or effective value of mon-ey. Simply put, governments could be spend-ing more in nominal dollars on education over time, but if these increases are less than in-flation, the real or effective level of spending could be decreasing. The reason for this seem-ingly counter-intuitive result is that inflation erodes the value of money by making the goods and services purchased more expensive. This section recalculates the increases in per stu-dent spending in public schools adjusting for inflation over the period in each of the provinc-es. Table 4 and figure 5 present the recalculated numbers.
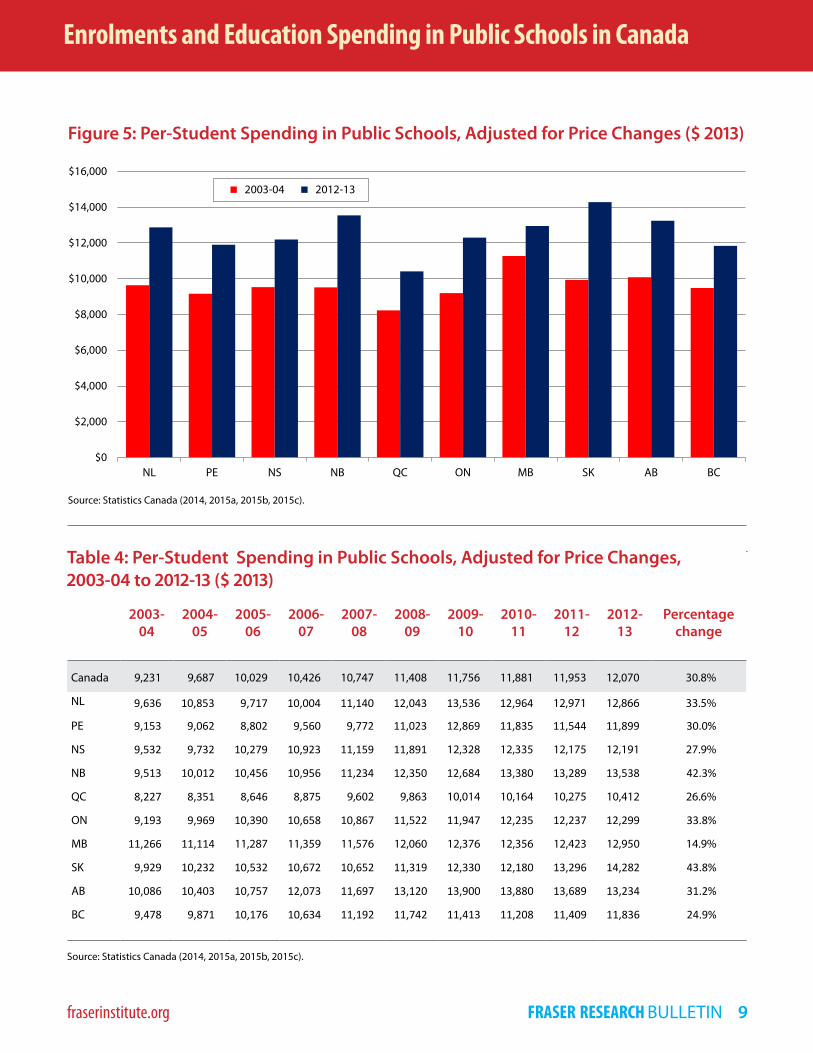
For Canada as a whole, once changes in pric-es are accounted for, per-student spending in public schools increased 30.8% between 2003-04 and 2012-13 (dropping from a 53.4% increase when inflation is not factored in, as in table 3). In dollar terms, the inflation-adjusted increase rises from $9,231 to $12,070 (in 2013 dollars).
The largest inflation-adjusted increase in per-student spending in public schools was in Sas-katchewan, which experienced a 43.8% in-crease from $9,929 in 2003-04 to $14,282 in 2012-13 (figure 5). The smallest inflation-ad-justed increase was recorded in neighbouring Manitoba (14.9%).
The percentage increases in per-student spending in public schools in table 4 are all less than the increases calculated in table 3, which did not include the effect of inflation on spend-ing. Despite that, all 10 provinces did record increases in inflation-adjusted per-student spending in public schools over this period.
V: The spending increases in contextThe range of inflation-adjusted increases in per-student spending in public schools (from 14.9% to 43.8%) appears fairly large (table 4). However, there is no context within which to gauge the actual size of the increases. This sec-tion gives two contexts to provide some under-standing of the magnitude of the increases in per-student spending in public schools.
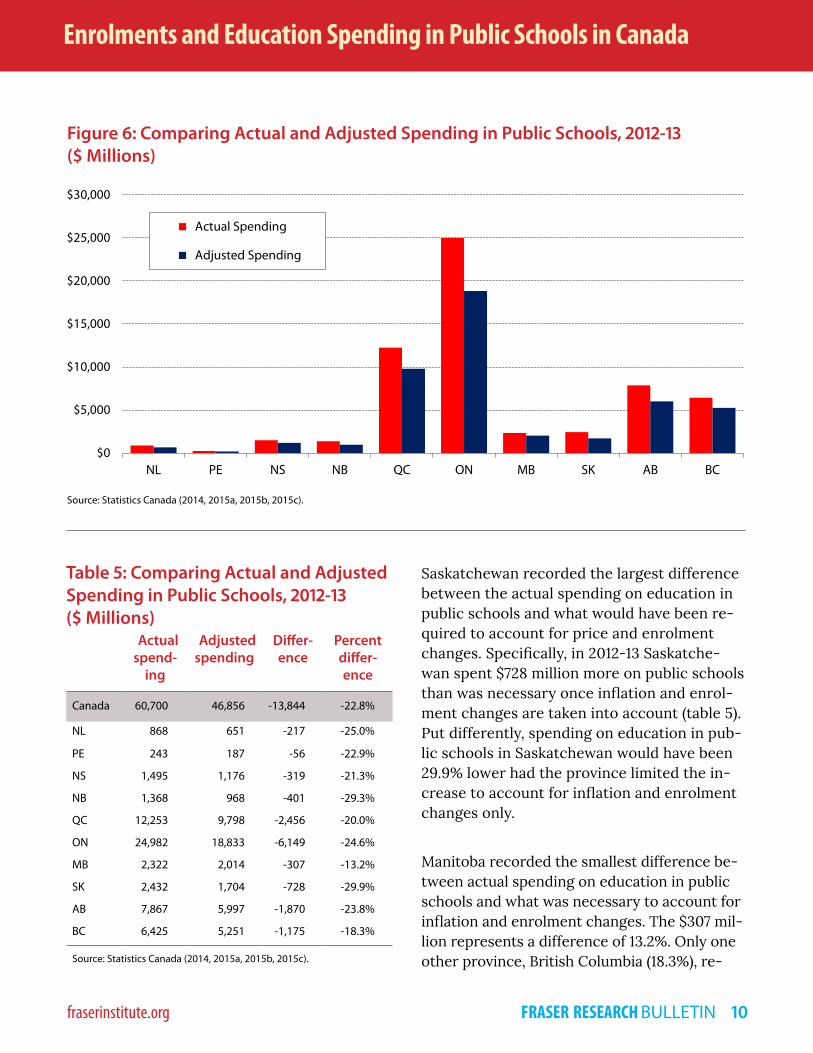
Comparing actual and constant per-student spendingThe first context is counterfactual. It calculates total education spending for 2012-13 based on the per-student level observed in 2003-04 ad-justed for changes in enrolment and inflation. In other words, it compares the actual aggre-gate spending of all provinces in 2012-13 on pub-lic schools with what the spending would have been, in total, if the per-student spending levels (in public schools) remained constant (adjusted for inflation) based on their 2003-04 values. Ta-ble 5 contains the calculations for both the actu-al and the adjusted spending, and shows the dif-ference between the two. Figure 6 illustrates the two sets of per-student spending levels in public schools by province. Note that the data present-ed is in aggregate rather than on a per-student basis since the calculations take into account changes in enrolment.
In aggregate, Canada increased education spending in public schools by $13.8 billion more between 2003-04 and 2012-13 than was neces-sary to account for enrolment and price chang-es (table 5). If per-student spending in public schools had remained constant over this peri-od, the aggregate amount of education spend-ing in public schools in 2012-13 would have been 22.8% lower.
Enrolments and Education Spending in Public Schools in Canada
fraserinstitute.org FRASER RESEARCH BULLETIN 9
Figure 5: Per-Student Spending in Public Schools, Adjusted for Price Changes ($ 2013)
Source: Statistics Canada (2014, 2015a, 2015b, 2015c).
Table 4: Per-Student Spending in Public Schools, Adjusted for Price Changes, 2003-04 to 2012-13 ($ 2013)
2003- 04
2004- 05
2005- 06
2006- 07
2007- 08
2008- 09
2009- 10
2010- 11
2011- 12
2012- 13
Percentage change
Canada 9,231 9,687 10,029 10,426 10,747 11,408 11,756 11,881 11,953 12,070 30.8%
NL 9,636 10,853 9,717 10,004 11,140 12,043 13,536 12,964 12,971 12,866 33.5%
PE 9,153 9,062 8,802 9,560 9,772 11,023 12,869 11,835 11,544 11,899 30.0%
NS 9,532 9,732 10,279 10,923 11,159 11,891 12,328 12,335 12,175 12,191 27.9%
NB 9,513 10,012 10,456 10,956 11,234 12,350 12,684 13,380 13,289 13,538 42.3%
QC 8,227 8,351 8,646 8,875 9,602 9,863 10,014 10,164 10,275 10,412 26.6%
ON 9,193 9,969 10,390 10,658 10,867 11,522 11,947 12,235 12,237 12,299 33.8%
MB 11,266 11,114 11,287 11,359 11,576 12,060 12,376 12,356 12,423 12,950 14.9%
SK 9,929 10,232 10,532 10,672 10,652 11,319 12,330 12,180 13,296 14,282 43.8%
AB 10,086 10,403 10,757 12,073 11,697 13,120 13,900 13,880 13,689 13,234 31.2%
BC 9,478 9,871 10,176 10,634 11,192 11,742 11,413 11,208 11,409 11,836 24.9%
Source: Statistics Canada (2014, 2015a, 2015b, 2015c).
$0
$2,000
$4,000
$6,000
$8,000
$10,000
$12,000
$14,000
$16,000
NL PE NS NB QC ON MB SK AB BC
2003-04 2012-13
Enrolments and Education Spending in Public Schools in Canada
fraserinstitute.org FRASER RESEARCH BULLETIN 10
Saskatchewan recorded the largest difference between the actual spending on education in public schools and what would have been re-quired to account for price and enrolment changes. Specifically, in 2012-13 Saskatche-wan spent $728 million more on public schools than was necessary once inflation and enrol-ment changes are taken into account (table 5). Put differently, spending on education in pub-lic schools in Saskatchewan would have been 29.9% lower had the province limited the in-crease to account for inflation and enrolment changes only.
Manitoba recorded the smallest difference be-tween actual spending on education in public schools and what was necessary to account for inflation and enrolment changes. The $307 mil-lion represents a difference of 13.2%. Only one other province, British Columbia (18.3%), re-
Figure 6: Comparing Actual and Adjusted Spending in Public Schools, 2012-13 ($ Millions)
Source: Statistics Canada (2014, 2015a, 2015b, 2015c).
Table 5: Comparing Actual and Adjusted Spending in Public Schools, 2012-13 ($ Millions)
Actual spend-
ing
Adjusted spending
Differ-ence
Percent differ-ence
Canada 60,700 46,856 -13,844 -22.8%
NL 868 651 -217 -25.0%
PE 243 187 -56 -22.9%
NS 1,495 1,176 -319 -21.3%
NB 1,368 968 -401 -29.3%
QC 12,253 9,798 -2,456 -20.0%
ON 24,982 18,833 -6,149 -24.6%
MB 2,322 2,014 -307 -13.2%
SK 2,432 1,704 -728 -29.9%
AB 7,867 5,997 -1,870 -23.8%
BC 6,425 5,251 -1,175 -18.3%
Source: Statistics Canada (2014, 2015a, 2015b, 2015c).
$0
$5,000
$10,000
$15,000
$20,000
$25,000
$30,000
NL PE NS NB QC ON MB SK AB BC
Actual Spending
Adjusted Spending
Enrolments and Education Spending in Public Schools in Canada
fraserinstitute.org FRASER RESEARCH BULLETIN 11
corded a spending difference less than 20.0% (table 5).
The differences between the actual spending on education in public schools in 2012-13 ver-sus what would have been the case had the jurisdictions shown greater restraint empha-sizes the large increases in education spend-ing in public schools implemented over the last decade.
Fiscal balance and additional education spendingAn alternative method by which put the mag-nitude of the increase in education spend-ing on education in public schools in context is to compare it to the province’s fiscal bal-ance (surplus or deficit). This is not to say that a province’s particular fiscal balance is solely the function of changes to education spend-ing. Rather, this comparison is a reminder that every spending choice has consequences with-in the fiscal framework of a province’s bud-get. Like any economic actor, provincial gov-ernments must make choices about how and where to spend the resources available to them. The marked increases in education spend-ing in public schools noted throughout this study mean that governments must limit other spending, raise more revenues, borrow more money, or implement some combination of the three in order to meet the added demands on their resources.
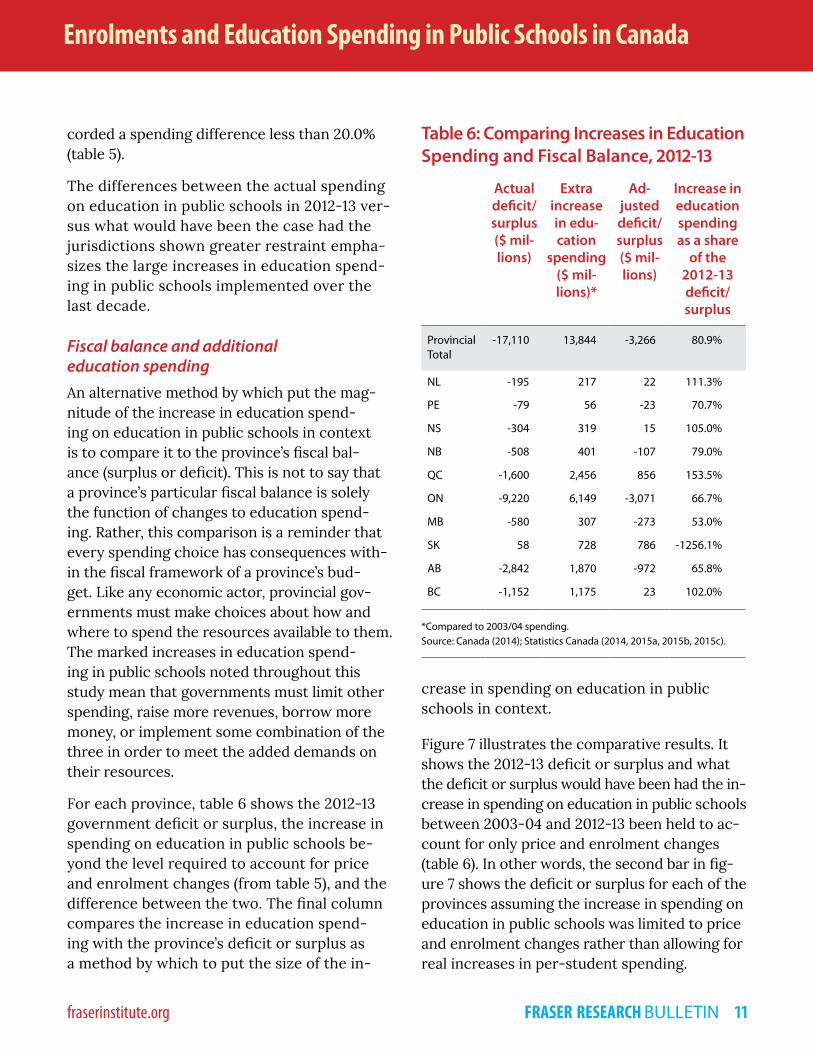
For each province, table 6 shows the 2012-13 government deficit or surplus, the increase in spending on education in public schools be-yond the level required to account for price and enrolment changes (from table 5), and the difference between the two. The final column compares the increase in education spend-ing with the province’s deficit or surplus as a method by which to put the size of the in-
crease in spending on education in public schools in context.
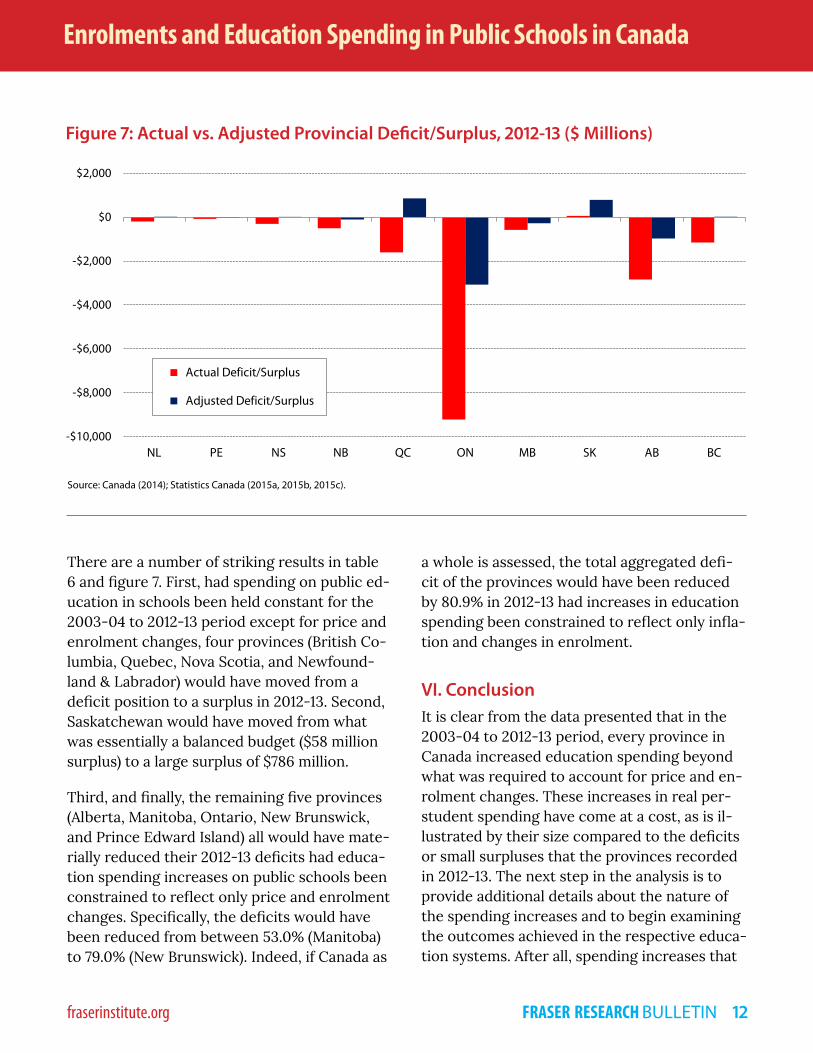
Figure 7 illustrates the comparative results. It shows the 2012-13 deficit or surplus and what the deficit or surplus would have been had the in-crease in spending on education in public schools between 2003-04 and 2012-13 been held to ac-count for only price and enrolment changes (table 6). In other words, the second bar in fig-ure 7 shows the deficit or surplus for each of the provinces assuming the increase in spending on education in public schools was limited to price and enrolment changes rather than allowing for real increases in per-student spending.
Table 6: Comparing Increases in Education Spending and Fiscal Balance, 2012-13
Actual deficit/surplus ($ mil-lions)
Extra increase in edu-cation
spending ($ mil-lions)*
Ad-justed deficit/surplus ($ mil-lions)
Increase in education spending as a share
of the 2012-13 deficit/ surplus
Provincial Total
-17,110 13,844 -3,266 80.9%
NL -195 217 22 111.3%
PE -79 56 -23 70.7%
NS -304 319 15 105.0%
NB -508 401 -107 79.0%
QC -1,600 2,456 856 153.5%
ON -9,220 6,149 -3,071 66.7%
MB -580 307 -273 53.0%
SK 58 728 786 -1256.1%
AB -2,842 1,870 -972 65.8%
BC -1,152 1,175 23 102.0%
*Compared to 2003/04 spending. Source: Canada (2014); Statistics Canada (2014, 2015a, 2015b, 2015c).
Enrolments and Education Spending in Public Schools in Canada
fraserinstitute.org FRASER RESEARCH BULLETIN 12
There are a number of striking results in table 6 and figure 7. First, had spending on public ed-ucation in schools been held constant for the 2003-04 to 2012-13 period except for price and enrolment changes, four provinces (British Co-lumbia, Quebec, Nova Scotia, and Newfound-land & Labrador) would have moved from a deficit position to a surplus in 2012-13. Second, Saskatchewan would have moved from what was essentially a balanced budget ($58 million surplus) to a large surplus of $786 million.
Third, and finally, the remaining five provinces (Alberta, Manitoba, Ontario, New Brunswick, and Prince Edward Island) all would have mate-rially reduced their 2012-13 deficits had educa-tion spending increases on public schools been constrained to reflect only price and enrolment changes. Specifically, the deficits would have been reduced from between 53.0% (Manitoba) to 79.0% (New Brunswick). Indeed, if Canada as
a whole is assessed, the total aggregated defi-cit of the provinces would have been reduced by 80.9% in 2012-13 had increases in education spending been constrained to reflect only infla-tion and changes in enrolment.
VI. ConclusionIt is clear from the data presented that in the 2003-04 to 2012-13 period, every province in Canada increased education spending beyond what was required to account for price and en-rolment changes. These increases in real per-student spending have come at a cost, as is il-lustrated by their size compared to the deficits or small surpluses that the provinces recorded in 2012-13. The next step in the analysis is to provide additional details about the nature of the spending increases and to begin examining the outcomes achieved in the respective educa-tion systems. After all, spending increases that
Figure 7: Actual vs. Adjusted Provincial Deficit/Surplus, 2012-13 ($ Millions)
Source: Canada (2014); Statistics Canada (2015a, 2015b, 2015c).
-$10,000
-$8,000
-$6,000
-$4,000
-$2,000
$0
$2,000
NL PE NS NB QC ON MB SK AB BC
Actual Deficit/Surplus
Adjusted Deficit/Surplus
Enrolments and Education Spending in Public Schools in Canada
fraserinstitute.org FRASER RESEARCH BULLETIN 13
secure better outcomes are a wholly different proposition than simply spending more money for the same results.
References
Canada, Department of Finance (2014). Fiscal Refer-ence Tables. Government of Canada.
Clemens, Jason, Milagros Palacios, Jane Loyer, and Frazier Fathers (2014). Measuring Choice and Competition in Canadian Education. The Fraser Institute. <http://www.fraserinstitute.org/up-loadedFiles/fraser-ca/Content/research-news/research/publications/measuring-choice-and-competition-in-canadian-education.pdf>, as of July 28, 2015.
Statistics Canada (2014). Headcount enrolments in public elementary and secondary schools, Can-ada, provinces and territories, 2008/2009 to 2012/2013. The Daily. Statistics Canada <http://www.statcan.gc.ca/daily-quotidien/141121/t141121b001-eng.htm>, as of July 28, 2015.
Statistics Canada (2015a). Table 326-0021: Consumer Price Index (CPI), 2011 Basket, Annual (2002=100). Statistics Canada. <http://www5.statcan.gc.ca/cansim/a26?lang=eng&retrLang=eng&id=3260021&pa Ser=&pattern=&stByVal=1&p1=1&p2=-1&tabMode=dataTable&csid=>, as of August 5, 2015.
Statistics Canada (2015b). Table 477-0025: Enrol-ments in Regular Programs for Youth in Pub-lic Elementary and Secondary Schools, by Grade and Sex, Canada, Provinces and Territories. Sta-tistics Canada. <http://www5.statcan.gc.ca/cansim/a26?lang=eng&retrLang=eng&id=4770025&pa Ser=&pattern=&stByVal=1&p1=1&p2=-1&tabMode=dataTable&csid=>, as of August 5, 2015.
Statistics Canada (2015c). Table 478-0014: Public and Private Elementary and Secondary Education Ex-penditures. Statistics Canada. <http://www5.stat-can.gc.ca/cansim/a26?lang=eng&retrLang=eng&id=4780014&pa Ser=&pattern=&stByVal=1&p1=1&p2=-1&tabMode=dataTable&csid=>, as of August 5, 2015.
Statistics Canada (2015d). Table 051-0001 - Estimates of population, by age group and sex for July 1, Can-ada, provinces and territories, annual (persons un-less otherwise noted). Web table. Statistics Canada.
Van Pelt, Deani Neven, and Joel Emes (2015). Educa-tion Spending In Canada: What’s Actually Happen-ing? The Fraser Institute. https://www.fraserin-stitute.org/uploadedFiles/fraser-ca/Content/research-news/research/publications/educa-tion-spending-in-canada-whats-actually-happen-ing.pdf >, as of July 28, 2015.
Van Pelt, Deani Neven (2015). Home Schooling in Canada: The Current Picture, 2015 Edition. The Fraser Institute. <http://www.fraserinstitute.org/uploadedFiles/fraser-ca/Content/research-news/research/publications/home-school-ing-2015.pdf>, as of July 28, 2015.
AcknowledgmentsThe authors wish to thank the W. Garfield Weston Foundation for its generous sup-port for the Barbara Mitchell Centre for Im-provement in Education. They also thank the anonymous reviewers for their com-ments, suggestions, and insights. Any re-maining errors or oversights are the sole responsibility of the authors. As the re-searchers have worked independently, the views and conclusions expressed in this pa-per do not necessarily reflect those of the Board of Directors of the Fraser Institute, the staff, or supporters.
Enrolments and Education Spending in Public Schools in Canada
fraserinstitute.org FRASER RESEARCH BULLETIN 14
Copyright © 2015 by the Fraser Institute. All rights re-served. Without written permission, only brief passag-es may be quoted in critical articles and reviews.
ISSN 2291-8620
Media queries: call 604.714.4582 or e-mail: [email protected]
Support the Institute: call 1.800.665.3558, ext. 586 or e-mail: [email protected]
Visit our website: www.fraserinstitute.org
Jason Clemens is the Executive Vice President of the Fraser Institute. He has an Honors Bachelors Degree of Commerce and a Master’s Degree in Business Administration from the University of Windsor as well as a Post Baccalaureate Degree in Eco-nomics from Simon Fraser Univer-sity. He has published over 70 major studies on a wide range of topics, including taxation and entrepre-neurship. He has published over 300 shorter articles in US, Canadian, and international newspapers.
Joel Emes is a former senior advi-sor to British Columbia’s provincial government. He previously served a senior research economist at the Fraser Institute, where he initiated and led several flagship projects in the areas of tax freedom and gov-ernment performance, spending, debt, and unfunded liabilities. Joel holds a B.A. and an M.A. in econom-ics from Simon Fraser University.
Deani Neven Van Pelt is the Direc-tor of the Barbara Mitchell Centre for Improvement in Education at the Fraser Institute. Her education in-cludes a Bachelor of Commerce from McMaster, a Bachelor of Education from the University of Toronto, and a Masters and Ph.D. in Educa-tion from the University of Western Ontario. Her dissertations, publica-tions, and research interests are in education philosophy and policy. Re-cent co-authored publications with the Fraser Institute include Educa-tion Spending in Canada: What’s Actually Happening?, Financial Savings: Restructuring Education in Ontario Using the British Co-lumbia Model, and Home Schooling in Canada: The Current Picture - 2015 Edition.