public spending on education, health care and
TRANSCRIPT

In this paper the role of public spending on the education and health sectors is examined with regard to promoting the gross domestic product (GDP) of 12 countries in Asia and the Pacific over the last three decades. In six of those countries, namely Bangladesh, Kiribati, Malaysia, Maldives, the Philippines and the Republic of Korea, Johansen cointegration tests confirmed the existence of cointegrating relations. In the remainingcountries, namely Fiji, Nepal, Singapore, Sri Lanka, Tonga and Vanuatu, cointegrating relations were absent. The causal impact of education and health-care spending on GDP was further examined in the study.Education spending was found to have raised GDP in Bangladesh, Fiji, Kiribati, Maldives, Nepal, Singapore, Sri Lanka, Tonga and Vanuatu. On the other hand, health-care spending contributed to GDP growth in Bangladesh, Nepal, the Philippines, Singapore and Sri Lanka. In the Philippines spending on education had a negative impact on GDP, while in Kiribati, Maldives and Vanuatu, the impact of health-care spending on GDP was found to be negative. In the case of Malaysia and the Republic of Korea, neither education spending nor health-care spending exhibited an appreciable impact on GDP. It was also found that the gestation lag of education spending was longer than that of health-care spending.
JEL Classification: I25, I15.
Key words: Education spending, endogenous growth theory, health-care spending, gross domestic product.
PUBLIC SPENDING ON EDUCATION, HEALTH CAREAND ECONOMIC GROWTH IN SELECTED COUNTRIES
OF ASIA AND THE PACIFIC
Biswajit Maitra and C.K. Mukhopadhyay*
* Biswajit Maitra, Assistant Professor of Economics, Surya Sen College, West Bengal, India (e-mail: [email protected]); and C.K. Mukhopadhyay, Professor (retired), Department of Economics, University of North Bengal, West Bengal, India (e-mail: [email protected]). Authors are grateful to anonymous referees for their valuable comments and suggestions.
2/1
lanruoJ tnempoleveD cificaP-aisA Vol. 19, No. 2, December 2012
19

I. INTRODUCTION
Human capital, along with physical capital, plays an indispensable role in economic development. Human capital formation entails spending on education, health and training. Lucas (1988) held the view that public spending on education promoted human capital, which in turn might contribute to economic growth. Romer (1990) highlighted the role of spending on research and development in economic growth. More speci�cally, in respect of the endogenous growth theory, spending on education and health is viewed as promoting human capital, which would lead to endogenous technical progress and thus accelerated economic growth. In accordance with this theoretical proposition, policymakers very often advocate increased spending on the education and health sectors, particularly at the early stage of development. Some empirical studies support the view that ef�cient and suf�cient spending on the education and health sectors fosters human capital formation and promotes economic growth (Schultz, 1961; Swaroop, 1996; Lee and Barro, 1997; Psacharopoulos and Patrinos, 2004; Gupta, Clements and Inchauste, 2004). However, the ef�cacy of such spending in Asian and Paci�c countries remains scantly researched and documented. In the present paper, an attempt is made to �ll this gap through an examination of the role of public spending on education and health-care services in promoting economic growth in the context of 12 countries in the Asia-Paci�c region by using comparatively recent datasets covering the period 1981-2011. The choice of the countries in this study was constrained by the availability of a continuous time series dataset of the variables concerned.1 Details of the location and overall economic status of these countries along with the corresponding study period are presented below.
lanruoJ tnempoleveD cificaP-aisA Vol. 19, No. 2, December 2012
2/2
1 Long economic time series datasets for some high-income developed countries in the region, such as Australia and New Zealand, were not collected; as result, these countries were not included in the study.
20

Table 1. Sample countries and study period
Most of the countries in the Asia-Paci�c region are lagging behind thedeveloped world with regard to human development. Acute diversity in this region is found in terms of topography, culture, politics and the state of human development.In order to exploit the opportunities offered by globalization and to attain balanced regional development, the countries concerned are expected to progress in unison.In this context, the development of human resources is of the utmost importance. Nevertheless, some countries in the region have failed to give these aspects due importance in their economic development strategies. During the last three decades, most countries in Asia and the Paci�c have elevated themselves from being overpopulated, low-income countries to become growing economies facing many challenges. Over the years, ESCAP, the Asian Development Bank (ADB) and the World Bank have shown keen interest in the economic and social development of the region. Several development projects have been implemented in which inclusive and good-quality education and adequate health services have emerged as strategic elements. Data re�ecting achievements in the education and health sectors of the selected countries over last three decades are contained in table A.1 in the annex.
lanruoJ tnempoleveD cificaP-aisA Vol. 19, No. 2, December 2012
2/3
21
Source: Asian Development Bank (ADB), Key Indicators for Asia and the Pacific (August 1999 to August 2012). Available from www.adb.org/key-indicators/2011/main (accessed
17 August 2012).
Notes: a Documented in World Bank country table. Available from http://data.worldbank.org/(accessed August 2012).
b Figures for education and health-care spending for 2001 and 2002 are missing in the ADB dataset. These figures were generated by applying interpolation techniques.
Country
Republic of Korea
Singapore
Malaysia
Philippines
Maldives
Sri Lanka
Bangladesh
Nepal
Tonga
Fiji
Kiribati
Vanuatu
Subregion
East Asia
East Asia
East Asia
East Asia
South Asia
South Asia
South Asia
South Asia
Paci�c
Paci�c
Paci�c
Paci�c
Period of study
1981-2011
1981-2010
1981-2011
1981-2011
1982-2011
1981-2010
1981-2011
1981-2011
1983-2005b
1981-2010
1988-2010
1983-2007
Income levela
High income
High income
Upper middle income
Lower middle income
Upper middle income
Lower middle income
Low income
Low income
Lower middle income
Lower middle income
Lower middle income
Lower middle income
Budgetary allocations for the education and health sectors in the selected countries are documented in table A.2 in the annex, which shows that such spending in almost all the selected countries has been rising over time. Among these countries, allocations to the education sector as a percentage of GDP are highest in Maldives followed by Malaysia and the Republic of Korea. Health-care spending as a percentage of GDP is highest in the Philippines followed by Maldives and the Republic of Korea. Factors affecting the variations in the allocations to the education and health sectors may depend on the �scal scenario and on whether the Government employs welfare or compulsion which are, by and large, some practical constraints of a political economy.2
II. THEORETICAL ISSUES AND REVIEW OF SELECTEDEMPIRICAL STUDIES
Theoretical issues
There is a difference of opinion among economists on the causal relationship between public sector spending and the steady growth of an economy. The Keynesian school of thought postulates that public expenditure contributes positively to income growth in the short run through the multiplier process. Public expenditure can be used as an exogenous �scal policy instrument to in�uence economic growth. On the other hand, Wagner (1883) postulated that, when the per capita income of a country increased, the Government would raise public spending. This is popularly known as Wagner’s law, under which GDP growth causes a rise in public spending and in such a case an unidirectional causality runs from GDP growth to public expenditure.Empirical �ndings in this regard, however, are inconclusive in the countries concerned. According to Barro (1991), investment expenditure, especially in State-ownedproduction, contributes positively to economic growth. On the other hand, government consumption spending has growth-retarding effects, but the problems relate to the categorization of expenditures under two broad forms of consumption and investment headings in empirical investigations.
Public expenditures are often categorized into productive and unproductive expenditures. This categorization implies that productive expenditures have a direct positive effect on economic growth while unproductive expenditures have an indirect effect or no effect. Again, with productive (and development) expenditure, there may be some components, such as spending on economic overheads, which involve a very long gestation period. Quantitative analysis may even fail to capture returns on such expenditure in the short run.
lanruoJ tnempoleveD cificaP-aisA Vol. 19, No. 2, December 2012
2/4
2 See Persson and Tabellini (2000) for details.
22

Spending on education and health is generally regarded as productive spending with a comprehensive role in the economy. Returns from such spending are often accounted for in terms of appreciable progress in education and health constraints. Progress in education constraints generates private and social returns, where private returns include empowerment and higher individual earnings (Mincer, 1974). Over the last three decades, a plethora of empirical studies have established that individual earnings are associated with more schooling (Psacharopoulos and Patrinos, 2004; Hanushek and Wössmann, 2007). Social returns, on the other hand, may result in the renovation of society harnessing human resources. Educational attainment promotes awareness, and truly educated citizens help build a peaceful nation. Besides, education helps improve the health awareness of people and enhance social and political participation (Hill and King, 1991; Currie and Moretti, 2003).
Access to available health services increases life expectancy, reduces infant mortality and improves upon many other health parameters. Healthiness reduces casualty due to illness and increases the competence of the workforce, which indirectly contributes to economic growth. These bene�cial effects of health are well documented by Howitt (2005) and developed into a theoretical model based on the Schumpeterian growth theory where six different channels are identi�ed through which improvement in the health status of a country may affect its long-run growth.
Indirect returns from human capital, or spillover effect, may remain uncaptured by quantitative parameters cited in economic growth. However, such indirect spillover effects are very important for developing countries since investment in human capital also has self-sustaining intragenerational returns. Human capital, such as academic attainment and knowledge of the current generation, is transmitted automatically to the future generation of a society, and in this way human capital investments have self-sustaining returns in the longer term as well.
The implications of education in economic development have been investigated since the early 1960s by the so-called Human Capital School, which originated at the University of Chicago (Schultz, 1961; Becker, 1964), where expenditure on education was regarded as an investment. Spending on education and health has also been justi�ed in endogenous growth theory (Lucas, 1988; Romer, 1990). In the endogenous growth model, technological progress, which increases productivity and accelerates the pace of growth, can be determined within the model through the formation of human capital. Spending on education and health helps promote ef�ciency, knowledge and inventions, all of which contribute to the economic growth of a country. Lucas (1988) states
2/5
lanruoJ tnempoleveD cificaP-aisA Vol. 19, No. 2, December 2012
y = AKα (uh)1-α (ha )γ (1)
23
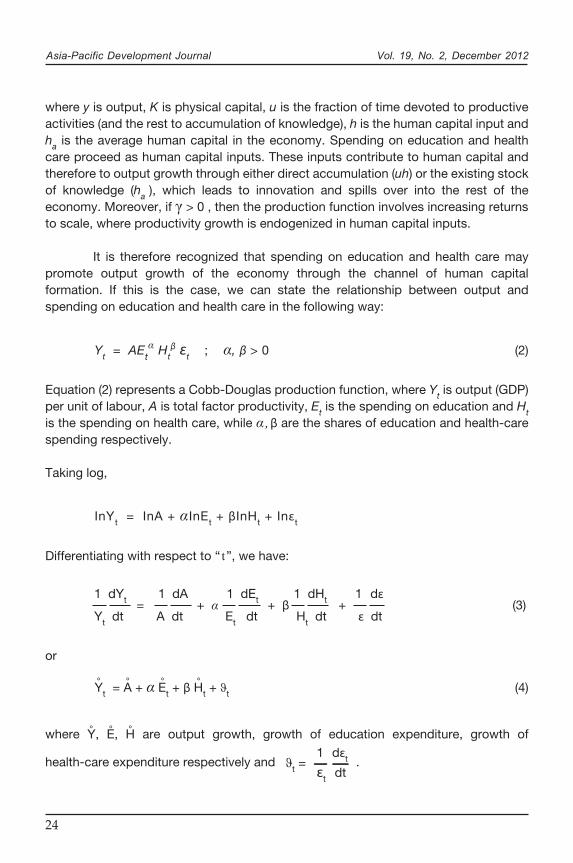
where y is output, K is physical capital, u is the fraction of time devoted to productive activities (and the rest to accumulation of knowledge), h is the human capital input and ha is the average human capital in the economy. Spending on education and health care proceed as human capital inputs. These inputs contribute to human capital and therefore to output growth through either direct accumulation (uh) or the existing stock of knowledge (ha ), which leads to innovation and spills over into the rest of the economy. Moreover, if γ > 0 , then the production function involves increasing returnsto scale, where productivity growth is endogenized in human capital inputs.
It is therefore recognized that spending on education and health care may promote output growth of the economy through the channel of human capitalformation. If this is the case, we can state the relationship between output and spending on education and health care in the following way:
Equation (2) represents a Cobb-Douglas production function, where Yt is output (GDP) per unit of labour, A is total factor productivity, Et is the spending on education and Ht is the spending on health care, while α,β are the shares of education and health-care spending respectively.
Taking log,
Differentiating with respect to “ t”, we have:
or
where Y, E, H are output growth, growth of education expenditure, growth of
health-care expenditure respectively and .
lanruoJ tnempoleveD cificaP-aisA Vol. 19, No. 2, December 2012
2/6
Yt = AEtα Ht
β εt ; α, β > 0 (2)
Yt = A + α Et + β Ht + ϑt (4)
InYt = InA + αInEt + βInHt + Inεt
1 dYt 1 dA 1 dEt 1 dHt 1 dε
Yt dt A dt Et dt Ht dt ε dt = + α + β + (3)
1 dεt
εt dtϑt =
˚
˚ ˚ ˚
˚ ˚ ˚
24
Equation (4) asserts that output growth depends on the growth of education expenditure and growth of health-care expenditure. However, the relationship between output growth and education and health-care expenditure is usually not instantaneous. Accordingly, the estimable form of equation (4) may be:
where, Et-i , Ht-i (i = 1, 2,.., k) are lagged series of Et and Ht respectively.
Review of selected empirical studies
A plethora of empirical studies have enquired into the relationship between education expenditure and economic growth across countries. Musila and Belassi (2004) explored the relationship between government education expenditure (per worker) and economic growth for the period 1965-1999. They found that education expenditure per worker had a positive and signi�cant impact on economic growth in both the long run and short run. Al-Yousif (2008) examined the causal relationship between education expenditure (as a proxy for human capital) and economic growth in the six economies of the Gulf Cooperation Council over the period 1977-2004. Results based on the Granger causality test, within a vector error-correction mechanism, are mixed and varyied across the countries. Permani (2009) reviewed the literature on the link between education and economic growth in East Asia and found that education assumes an important role in economic growth, although it is not a singularly important one. Permani (2009) was of the view that the observed two-way causal link between education and economic growth appeared to be ambiguous. Li and Liang (2010) examined the sources of economic growth through the estimation of an augmented Mankiw-Romer-Weil model, which considers human capital in the forms of both health and education for a group of East Asian countries. Empirical results, based on panel data analysis for the period 1961-2007 and subsample estimation for the period following the 1997 Asian �nancial crisis, exhibit the impact of the stock of health and education on economic growth, that is, that such growth is statistically signi�cant while the impact of health on economic growth is stronger than that of education. Some other empirical studies examine the role of education and health-care spending in terms of progress in education and health constraints (Kim and Moody, 1992; Gupta, Verhoeven and Tiongson, 2002; Farahani, Subramanian and Canning, 2010).
An extensive body of empirical research has been compiled over the last three decades on the role of education and health-care spending in the promotion of economic growth. Wilson (1995) enquired into the relationship between medical care
lanruoJ tnempoleveD cificaP-aisA Vol. 19, No. 2, December 2012
2/7
Yt = A + αi Et-i + βi Ht-i + ϑt (5)˚ ˚ ˚ ˚
˚ ˚ ˚ ˚
25

expenditure and GDP growth in countries belonging to the Organization for Economic Cooperation and Development (OECD) and reported a bidirectional relationship between these variables. Devlin and Hansen (2001) examined Granger causality between aggregate health-care spending and GDP in 20 OECD countries. In some countries health-care expenditure was found to Granger cause GDP, while for the others Granger causality from GDP to health-care expenditure was noted. Bhatt and Jain (2004) studied the long-run relationship between private health-care expenditure and GDP in India through cointegration tests, but found no cointegrating relationship. Kiymaz, Akbulut and Demir (2006) examined the long-run relationship among the per capita private, public and total health-care expenditures vis-à-vis per capita GDP and the population growth of Turkey. They observed cointegrating relationships among health-care expenditure and GDP and population growth. The evidence of causality running from per capita GDP to health-care expenditures was also cited. Wang (2011) explored the causality between health-care expenditure and economic growth for 31 countries through the estimation of panel regression and quantile regression equations over the period 1986-2007. Panel regression analysis testi�ed that expenditure growth positively contributed to economic growth, while economic growth retarded the growth of health expenditure. On the other hand, quantile regression analysis showed that the in�uence of expenditure growth on economic growth varied with the level of economic growth.
III. VARIABLES, DATASET, STATIONARITY AND COINTEGRATION
The present empirical study involves GDP (measure of economic growth), public spending on education and health care based on a dataset of the 12 countries in Asia and the Paci�c mentioned previously. Log-level series (expressed in real terms) of GDP and public spending on education and health care are denoted by Yt , Et and Ht respectively. Corresponding �rst difference series (growth series) have been denoted by ∆Yt , ∆Et and ∆Ht respectively.
Stationarity and order of integrability of the dataset have been tested through the Augmented Dickey-Fuller (ADF) (Dickey and Fuller, 1981) unit-root tests. Table 2 presents the results of such tests on selected series at level and upon �rst differencing. ADF tests accepted the null hypothesis of unit-root (even at the 1 per cent level) in all three series at the log levels in the countries. However, these ADF tests rejected the unit-root of the series upon �rst differencing. ADF tests therefore testify that the selected series of the countries under study are I(1) by nature.
The existence of long-run relationships among the I(1) series requires study of cointegration. This is done in view of the fact that an equilibrium relationship among
lanruoJ tnempoleveD cificaP-aisA
1
Vol. 19, No. 2, December 2012
2/8
26
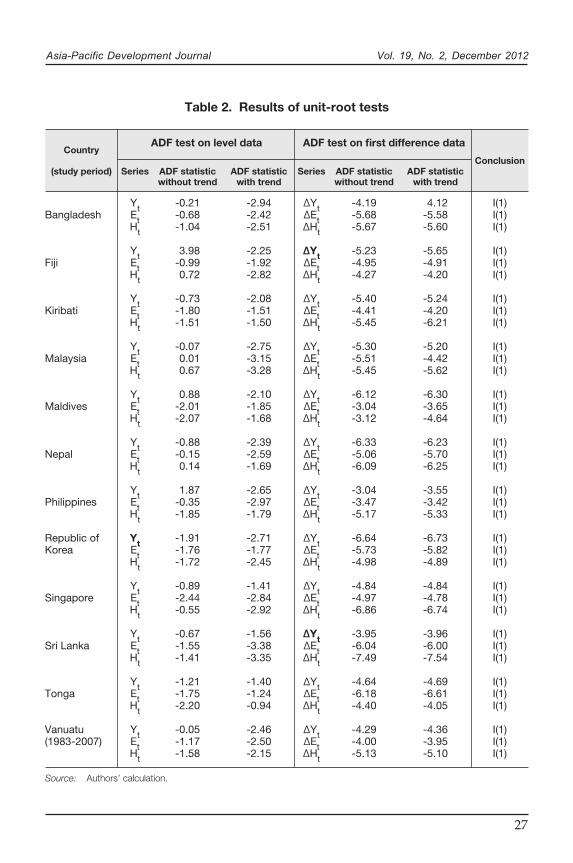
Table 2. Results of unit-root tests
lanruoJ tnempoleveD cificaP-aisA Vol. 19, No. 2, December 2012
2/9
Source: Authors’ calculation.
Country
(study period)
Bangladesh
Fiji
Kiribati
Malaysia
Maldives
Nepal
Philippines
Republic of Korea
Singapore
Sri Lanka
Tonga
Vanuatu (1983-2007)
Series
YtEtHt
YtEtHt
YtEtHt
YtEtHt
YtEtHt
YtEtHt
YtEtHt
YtEtHt
YtEtHt
YtEtHt
YtEtHt
YtEtHt
Series
∆Yt∆Et∆Ht
∆Yt∆Et∆Ht
∆Yt∆Et∆Ht
∆Yt∆Et∆Ht
∆Yt∆Et∆Ht
∆Yt∆Et∆Ht
∆Yt∆Et∆Ht
∆Yt∆Et∆Ht
∆Yt∆Et∆Ht
∆Yt∆Et∆Ht
∆Yt∆Et∆Ht
∆Yt∆Et∆Ht
ADF statisticwithout trend
-0.21-0.68-1.04
3.98-0.990.72
-0.73-1.80-1.51
-0.070.010.67
0.88-2.01-2.07
-0.88-0.150.14
1.87-0.35-1.85
-1.91-1.76-1.72
-0.89 -2.44-0.55
-0.67-1.55-1.41
-1.21-1.75-2.20
-0.05-1.17-1.58
ADF statisticwith trend
-2.94-2.42-2.51
-2.25-1.92-2.82
-2.08-1.51-1.50
-2.75-3.15-3.28
-2.10-1.85-1.68
-2.39-2.59-1.69
-2.65-2.97-1.79
-2.71-1.77-2.45
-1.41-2.84-2.92
-1.56-3.38-3.35
-1.40-1.24-0.94
-2.46-2.50-2.15
ADF statisticwithout trend
-4.19-5.68-5.67
-5.23-4.95-4.27
-5.40-4.41-5.45
-5.30-5.51-5.45
-6.12-3.04-3.12
-6.33-5.06-6.09
-3.04-3.47-5.17
-6.64-5.73-4.98
-4.84-4.97 -6.86
-3.95-6.04-7.49
-4.64-6.18-4.40
-4.29-4.00-5.13
ADF statisticwith trend
4.12-5.58-5.60
-5.65-4.91-4.20
-5.24-4.20-6.21
-5.20-4.42-5.62
-6.30-3.65-4.64
-6.23-5.70-6.25
-3.55-3.42-5.33
-6.73-5.82-4.89
-4.84 -4.78-6.74
-3.96-6.00-7.54
-4.69-6.61-4.05
-4.36-3.95-5.10
Conclusion
I(1)I(1)I(1)
I(1)I(1)I(1)
I(1)I(1)I(1)
I(1)I(1)I(1)
I(1)I(1)I(1)
I(1)I(1)I(1)
I(1)I(1)I(1)
I(1)I(1)I(1)
I(1)I(1)I(1)
I(1)I(1)I(1)
I(1)I(1)I(1)
I(1)I(1)I(1)
ADF test on first difference dataADF test on level data
27
lanruoJ tnempoleveD cificaP-aisA
1
Vol. 19, No. 2, December 2012
GDP, education and health-care spending requires that their stochastic trends be linked. Linkage among the stochastic trends would indicate that the variables are cointegrated. The cointegration study involves multivariate cointegration tests of Johansen (1991; 1995).
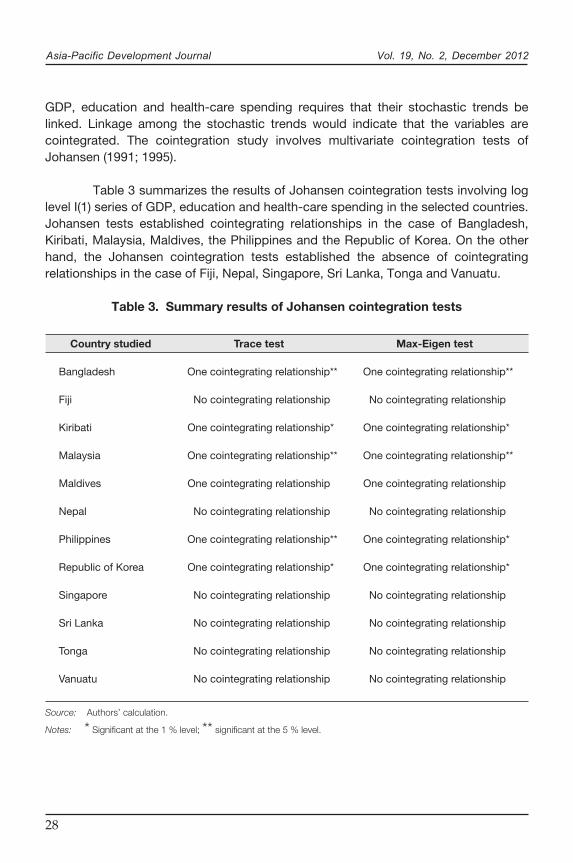
Table 3 summarizes the results of Johansen cointegration tests involving log level I(1) series of GDP, education and health-care spending in the selected countries. Johansen tests established cointegrating relationships in the case of Bangladesh, Kiribati, Malaysia, Maldives, the Philippines and the Republic of Korea. On the other hand, the Johansen cointegration tests established the absence of cointegrating relationships in the case of Fiji, Nepal, Singapore, Sri Lanka, Tonga and Vanuatu.
Table 3. Summary results of Johansen cointegration tests
2/10
Country studied
Bangladesh
Fiji
Kiribati
Malaysia
Maldives
Nepal
Philippines
Republic of Korea
Singapore
Sri Lanka
Tonga
Vanuatu
Trace test
One cointegrating relationship**
No cointegrating relationship
One cointegrating relationship*
One cointegrating relationship**
One cointegrating relationship
No cointegrating relationship
One cointegrating relationship**
One cointegrating relationship*
No cointegrating relationship
No cointegrating relationship
No cointegrating relationship
No cointegrating relationship
Max-Eigen test
One cointegrating relationship**
No cointegrating relationship
One cointegrating relationship*
One cointegrating relationship**
One cointegrating relationship
No cointegrating relationship
One cointegrating relationship*
One cointegrating relationship*
No cointegrating relationship
No cointegrating relationship
No cointegrating relationship
No cointegrating relationship
Source: Authors’ calculation.
Notes: * Significant at the 1 % level; ** significant at the 5 % level.
28

IV. IMPACT OF EDUCATION AND HEALTH-CARESPENDING ON GDP
Methodological issues
The cointegrating relationship among GDP, education and health-care spending was con�rmed in the economies of Bangladesh, Kiribati, Malaysia, Maldives, the Philippines and the Republic of Korea. Thus the impact of education and health-care spending on GDP (based on the normalized cointegrating equation) was studied through the estimation of an appropriate vector error correction (VEC) model. For this purpose, the following VEC model was used:3
where ‘∆’ is the �rst difference operator; (EC)t-1 is the error correction term lagged one period; and ρ1, ρ2, ρ3 are the short-run coef�cients of the error correction term (speed of adjustment parameters). The speed of adjustment parameter is very important in the analysis of error correction mechanism. A higher value of the parameter indicates higher speed of adjustment of the model from short-run disequilibrium to long-run equilibrium.
Rejection of cointegrating relationships among GDP, education and health-care spending in Fiji, Nepal, Singapore, Sri Lanka, Tonga and Vanuatu does not discard the possibility of having any causal relationship among the series. Such possibilities were investigated through the estimation of the unrestricted vector autoregression (VAR) model presented through equations (9), (10) and (11).4 According to the requirement of the VAR model, �rst differenced stationary series (growth series) of the variables concerned are used.
lanruoJ tnempoleveD cificaP-aisA
1
Vol. 19, No. 2, December 2012
2/11
3 However, the results of estimated equation (1) are needed in line with the objective of this study.4 Results of estimated equation (4) in countries are reported according to the objective of this study.
∆Yt = η1 + ρ1 (EC)t-1 + ψ1i ∑ ∆Yt-i + γ1i ∑ ∆Et-i + θ1l ∑ ∆Ht-l + ωt (6)i=1
n
i=1
n
l=1
n
∆Et = η2 + ρ2 (EC)t-1 + ψ2i ∑ ∆Et-i + γ2i ∑ ∆Yt-i + θ2l ∑ ∆Ht-l + ϑt (7)i=1
n
i=1
n
l=1
n
∆Ht = η3 + ρ3 (EC)t-1 + ψ3i ∑ ∆Ht-i + γ3i ∑ ∆Yt-i + θ3l ∑ ∆Et-l + zt (8)i=1
n
i=1
n
l=1
n
29
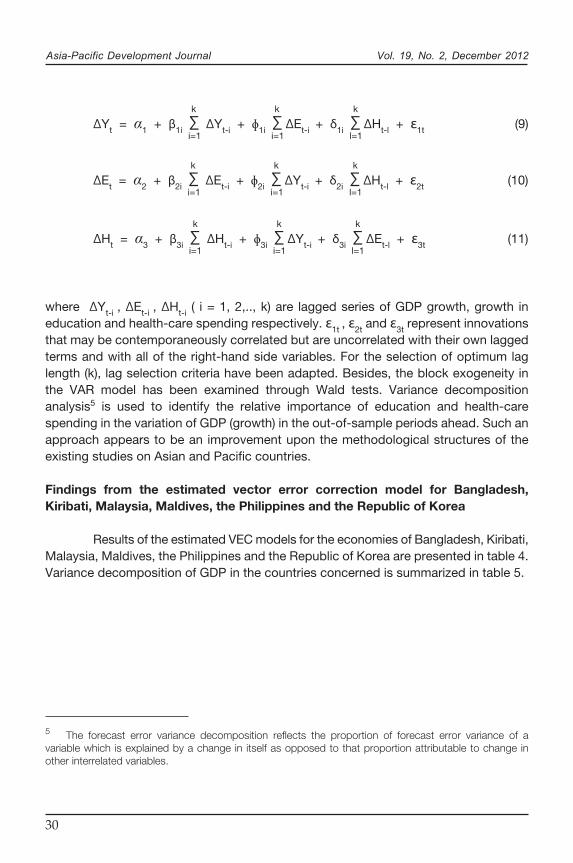
where ∆Yt-i , ∆Et-i , ∆Ht-i ( i = 1, 2,.., k) are lagged series of GDP growth, growth in education and health-care spending respectively. ε1t , ε2t and ε3t represent innovations that may be contemporaneously correlated but are uncorrelated with their own lagged terms and with all of the right-hand side variables. For the selection of optimum lag length (k), lag selection criteria have been adapted. Besides, the block exogeneity in the VAR model has been examined through Wald tests. Variance decomposition analysis5 is used to identify the relative importance of education and health-care spending in the variation of GDP (growth) in the out-of-sample periods ahead. Such an approach appears to be an improvement upon the methodological structures of the existing studies on Asian and Paci�c countries.
Findings from the estimated vector error correction model for Bangladesh, Kiribati, Malaysia, Maldives, the Philippines and the Republic of Korea
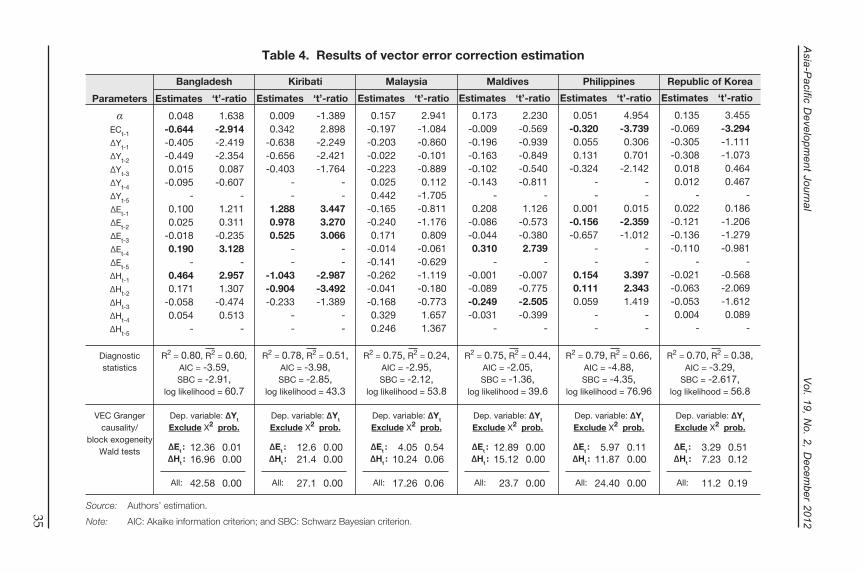
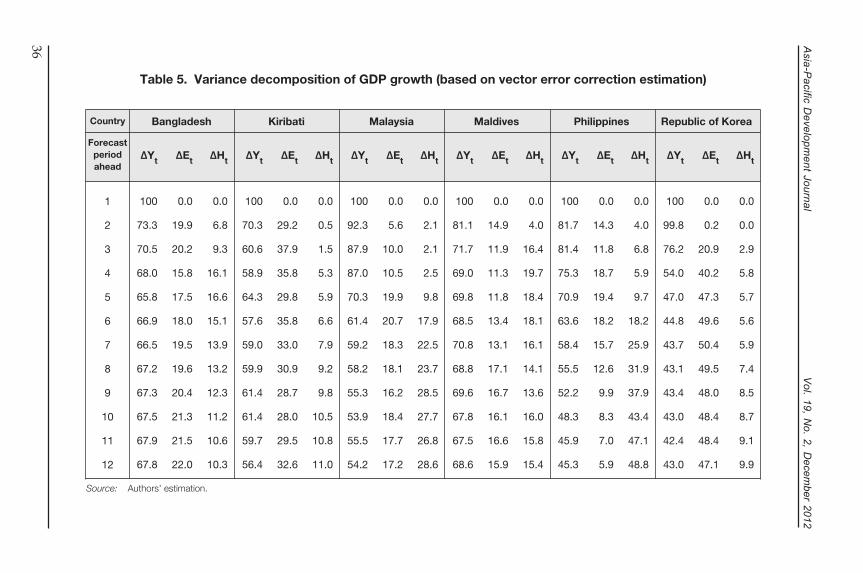
Results of the estimated VEC models for the economies of Bangladesh, Kiribati, Malaysia, Maldives, the Philippines and the Republic of Korea are presented in table 4. Variance decomposition of GDP in the countries concerned is summarized in table 5.
lanruoJ tnempoleveD cificaP-aisA
1
Vol. 19, No. 2, December 2012
2/12
5 The forecast error variance decomposition reflects the proportion of forecast error variance of a variable which is explained by a change in itself as opposed to that proportion attributable to change in other interrelated variables.
∆Yt = α1 + β1i ∑ ∆Yt-i + ɸ1i ∑ ∆Et-i + δ1i ∑ ∆Ht-l + ε1t (9)i=1
k
i=1
k
l=1
k
∆Et = α2 + β2i ∑ ∆Et-i + ɸ2i ∑ ∆Yt-i + δ2i ∑ ∆Ht-l + ε2t (10)i=1
k
i=1
k
l=1
k
∆Ht = α3 + β3i ∑ ∆Ht-i + ɸ3i ∑ ∆Yt-i + δ3i ∑ ∆Et-l + ε3t (11)i=1
k
i=1
k
l=1
k
30

Bangladesh
Bangladesh is one of the least developed South Asian countries. Over the last three decades the country has been performing slowly. The GDP per capita (based on purchasing power parity at constant 2005 international dollars) of Bangladesh registered an increase from $676.80 in 1980 to $1,568.40 in 2011. Between 1980 and 2011, the expectation of life at birth rose by an additional 13.7 years. The infant mortality rate sharply declined to 38 per 1,000 live births in 2011 from 130 in 1980. Progress has also been noticed in family planning. The country’s Human Development Index (HDI) score increased from 0.259 in 1980 to 0.500 in 2011.
Our study shows that in Bangladesh the short-run dynamics among GDP, education and health-care spending over the period 1981-2011 is signi�cant. These short-run dynamics move towards the long-run equilibrium state, correcting 64 per cent of the disequilibrium errors of the past periods. It was also found that both education and health-care spending have been contributing to GDP where the gestation lag of education spending is four years and that of health-care spending is one year.
A signi�cant role of education and health-care spending in GDP of Bangladesh was also revealed by the Wald test, where the calculated chi-square statistic accepts the null hypothesis of Granger causality against the alternative hypothesis of block exogeneity of GDP in our estimated VEC model. In the event of continuation of such a relationship in the future, the variance decomposition analysis indicates that both education and health-care spending may make a signi�cant contribution to the composition of the country’s GDP pro�le in years to come.
Kiribati
The estimated VEC model for the economy of the Paci�c island country Kiribati testi�es that one-year lagged education spending in the past three periods has led to a rise in GDP, while health-care spending in the past two periods seems to have retarded the country’s GDP growth.6 The Wald test results con�rmed the endogeneity of the variables. Decomposition of forecast error variances for GDP demonstrates that, in the event of the current economic structure remaining unchanged, education spending would account for at most 38 per cent of GDP, and health spending would account for at most 11 per cent in the years to come.
lanruoJ tnempoleveD cificaP-aisA
1
Vol. 19, No. 2, December 2012
2/13
6 The lag-structure in the VEC model could not be extended for in-depth study because of the paucity of the degrees of freedom.
31
Malaysia
The estimated VEC model in the case of Malaysia reveals that the speed of adjustment coef�cient is negative but statistically insigni�cant even at the 10 per cent level. Therefore, disequilibrium errors fail to affect GDP in Malaysia. In this estimation, the lagged coef�cients of education and health-care spending are also found to be insigni�cant even at the 10 per cent level. GDP in Malaysia appears to be exogenous in this system.
Wald tests, on the other hand, revealed that health-care spending Granger causes GDP at the 10 per cent level. Therefore, the Wald test rejects the possibility of block exogeneity of GDP (at the 10 per cent level). The variance decomposition analysis suggests that if no endogenous and/or exogenous structural change occurs then health-care spending may be able to account for 28 per cent of the variance of GDP in the periods ahead.
Maldives
Maldives is the smallest country in Asia in terms of land area and population. Over the last two decades the economy of Maldives improved, from being one of the poorest countries in the world to becoming an upper middle income country, although its economic base remains limited to only two sectors, �sheries and tourism. Over this period the economy also recorded signi�cant progress in human development.In terms of literacy rate, infant mortality rate and life expectancy, the country is considerably ahead of many other neighbouring countries. Maldives also achieved phenomenal success in terms of the Millennium Development Goals. Currently only 1 per cent of its population is living under the poverty line; starvation is virtually non-existent; HIV rates have fallen; and malaria has been eradicated. The HDI score of Maldives in 2011 was 0.661.
The cointegrating �ndings of the study suggest that in Maldives education spending has a positive impact on GDP. Speci�cally, estimated four-year lagged education spending is found to be positive and signi�cant at the 5 per cent level, indicating that budgetary allocations for the education sector lead to a rise in GDP for Maldives, with the gestation lag being four years. On the other hand, the impact of health-care spending on GDP is found to be negative. Other lags are found to be statistically insigni�cant even at the 10 per cent level.
These �ndings have been supplemented by the Wald test, where the Wald test statistic (x2 statistic) accepts Granger causality (in the model with GDP acting as the dependent variable) and rejects the possibility of block exogeneity of GDP even at the
lanruoJ tnempoleveD cificaP-aisA
1
Vol. 19, No. 2, December 2012
2/14
32

1 per cent level. Estimated decomposed forecast error variance of GDP indicates that, in the presence of such relationships in the future, both education and health-care spending may contribute equally to the composition of the GDP pro�le and account for a signi�cant part of the variance in GDP.
However, the matter of concern is the negative impact of health-care spending on GDP. Such a negative impact may be due to some practical constraints of the health-care sector, such as inherent geographical location (and scattered population), lack of professionally and technically skilled health personnel (human resource constraint), vulnerability to climatic changes and environmental health problems, and emerging and re-emerging diseases. Several steps have been taken by the country to address these problems. Compared with other South Asian countries, allocations in the health-care sector are the highest in Maldives. Owing to human resource constraints, the country is compelled to hire experts from abroad, which is a huge �nancial burden on the health sector. Scattered locations pose increasing costs on health-care delivery. These problems hinder the ef�ciency of health-care services in Maldives and may be the possible disguised factors accounting for the negative contribution of health-care spending in GDP. However, an in-depth study is required to identify the speci�c reasons.
Philippines
The emerging economy of the Philippines is rapidly transiting to industrialization. The literacy rate of the country was recorded as 95 per cent in 2008. Life expectancy at birth increased from 48 years in 1980 to more than 68 years in 2010. The Human Development Report 2011 revealed that the country’s HDI score was 0.644.
The estimated VEC model for the economy of the Philippines shows that the speed of the adjustment parameter is negative and statistically signi�cant at the 1 per cent level. It indicates that the short-run dynamics that GDP maintains with education and health-care spending are signi�cant. In each period, 32 per cent of the disequilibrium error has been corrected and the system converges to the long-run equilibrium state. The estimate of two-period lagged education spending is found to be negative and signi�cant at the 10 per cent level. It implies that two-period lagged education spending has some growth-retarding effect. Estimates of one- and two-period lagged health-care spending are found to be positive and statistically signi�cant even at the 5 per cent and 1 per cent levels respectively. These imply that spending on the health-care sector in the Philippines contributes to GDP growth with a time lag of one to two years. Findings of the Wald test in this regard is that health-care spending Granger causes GDP but education spending fails to Granger cause GDP. Findings of variance decomposition analysis further testify to the signi�cant role of health-care
lanruoJ tnempoleveD cificaP-aisA
1
Vol. 19, No. 2, December 2012
2/15
33

spending in GDP compared with education spending in the composition of the GDP pro�le in forthcoming periods where health-care spending may account for more than 48 per cent variance of GDP in the 12-year forecast periods ahead.
Republic of Korea
Estimated VEC models for the Republic of Korea reveal that the error correction term, or the speed of adjustment parameter (ECt-1 ), is negative and statistically signi�cant at the 1 per cent level. That term implies that the short-run dynamics that GDP maintained with education and health-care spending in the Republic of Korea are signi�cant. The (absolute) value of the speed of adjustment parameter ( |EC|t-1 ) is 0.069, indicating that only 6.9 per cent of disequilibrium errors of previous periods have been corrected for the present period. Estimated coef�cients of lagged education and health-care spending are statistically insigni�cant even at the 10 per cent level. This implies that lagged spending in education and health care fails to affect GDP; therefore, GDP seems to be exogenous in this model. The Wald test further con�rms the exogeneity of GDP in this model.
However, forecast error variance decomposition of GDP (presented in table 4) based on the estimated VEC model indicates that in the Republic of Korea education spending accounts a signi�cant percentage of forecast error variance of GDP in the out-of-sample forecast horizon. Speci�cally, education spending accounts for about 21 per cent of forecast error variance of GDP at the three-period-ahead horizon, which further increased by 49.6 per cent at most in the six-period-ahead forecast horizon. Health-care spending in this regard accounts for at most 9.9 per cent of the forecast error variance of GDP at the 12-year forecast horizon.
Apart from these documented facts and �gures, the �ndings of statistically insigni�cant impacts from education and health-care spending on GDP are quite surprising. It seems a possibility that GDP growth might be predominantly due to some other factors, such as technological improvement, ef�cient production process, allocation of resources and administrative innovations. In such cases, the impacts of education and health-care spending on GDP appeared to be less spectacular, which is re�ected in the insigni�cant coef�cient of the variables at different lags in the estimated VEC models.
lanruoJ tnempoleveD cificaP-aisA
1
Vol. 19, No. 2, December 2012
2/16
34
lanr
uoJ t
nemp
olev
eD
cific
aP-
ais
A
1
Vol. 19, N
o. 2, Decem
ber 2012
2/17
Table 4. Results of vector error correction estimation
Parameters
αECt-1
∆Yt-1
∆Yt-2
∆Yt-3
∆Yt-4
∆Yt-5
∆Et-1
∆Et-2
∆Et-3
∆Et-4
∆Et-5
∆Ht-1
∆Ht-2
∆Ht-3
∆Ht-4
∆Ht-5
Estimates
0.048-0.644-0.405-0.4490.015
-0.095-
0.1000.025
-0.0180.190
-0.4640.171
-0.0580.054
-
‘t’-ratio
1.638-2.914-2.419-2.3540.087
-0.607-
1.2110.311
-0.2353.128
-2.9571.307
-0.4740.513
-
Estimates
0.0090.342
-0.638-0.656-0.403
--
1.2880.9780.525
--
-1.043-0.904-0.233
--
‘t’-ratio
-1.3892.898
-2.249-2.421-1.764
--
3.4473.2703.066
--
-2.987-3.492-1.389
--
Estimates
0.157-0.197-0.203-0.022-0.2230.0250.442
-0.165-0.2400.171
-0.014-0.141-0.262-0.041-0.1680.3290.246
‘t’-ratio
2.941-1.084-0.860-0.101-0.8890.112
-1.705-0.811-1.1760.809
-0.061-0.629-1.119-0.180-0.7731.6571.367
Estimates
0.173-0.009-0.196-0.163-0.102-0.143
-0.208
-0.086-0.0440.310
--0.001-0.089-0.249-0.031
-
‘t’-ratio
2.230-0.569-0.939-0.849-0.540-0.811
-1.126
-0.573-0.3802.739
--0.007-0.775-2.505-0.399
-
Estimates
0.051-0.3200.0550.131
-0.324--
0.001-0.156-0.657
--
0.1540.1110.059
--
‘t’-ratio
4.954-3.7390.3060.701
-2.142--
0.015-2.359-1.012
--
3.3972.3431.419
--
Estimates
0.135-0.069-0.305-0.3080.0180.012
-0.022
-0.121-0.136-0.110
--0.021-0.063-0.0530.004
-
‘t’-ratio
3.455-3.294-1.111-1.0730.4640.467
-0.186
-1.206-1.279-0.981
--0.568-2.069-1.6120.089
-
Bangladesh Kiribati Malaysia Maldives Philippines Republic of Korea
Source: Authors’ estimation.
Note: AIC: Akaike information criterion; and SBC: Schwarz Bayesian criterion.
Diagnostic statistics
VEC Granger causality/
block exogeneity Wald tests
R2 = 0.80, R2 = 0.60,AIC = -3.59,SBC = -2.91,
log likelihood = 60.7
Dep. variable: ∆Yt
Exclude X2 prob.
12.3616.96
42.58
∆Et :∆Ht :
All:
0.010.00
0.00
R2 = 0.78, R2 = 0.51,AIC = -3.98,SBC = -2.85,
log likelihood = 43.3
Dep. variable: ∆Yt
Exclude X2 prob.
12.621.4
27.1
∆Et :∆Ht :
All:
0.000.00
0.00
R2 = 0.75, R2 = 0.24,AIC = -2.95,SBC = -2.12,
log likelihood = 53.8
Dep. variable: ∆Yt
Exclude X2 prob.
4.0510.24
17.26
∆Et :∆Ht :
All:
0.540.06
0.06
R2 = 0.75, R2 = 0.44,AIC = -2.05,SBC = -1.36,
log likelihood = 39.6
Dep. variable: ∆Yt
Exclude X2 prob.
12.8915.12
23.7
∆Et :∆Ht :
All:
0.000.00
0.00
R2 = 0.79, R2 = 0.66,AIC = -4.88,SBC = -4.35,
log likelihood = 76.96
Dep. variable: ∆Yt
Exclude X2 prob.
5.9711.87
24.40
∆Et :∆Ht :
All:
0.110.00
0.00
R2 = 0.70, R2 = 0.38,AIC = -3.29,
SBC = -2.617,log likelihood = 56.8
Dep. variable: ∆Yt
Exclude X2 prob.
3.297.23
11.2
∆Et :∆Ht :
All:
0.510.12
0.19
35
lanr
uoJ t
nemp
olev
eD
cific
aP-
ais
A
1
Vol. 19, N
o. 2, Decem
ber 2012
2/19
Table 5. Variance decomposition of GDP growth (based on vector error correction estimation)
Source: Authors’ estimation.
Forecast period ahead
1
2
3
4
5
6
7
8
9
10
11
12
∆Yt
100
73.3
70.5
68.0
65.8
66.9
66.5
67.2
67.3
67.5
67.9
67.8
∆Et
0.0
19.9
20.2
15.8
17.5
18.0
19.5
19.6
20.4
21.3
21.5
22.0
∆Ht
0.0
6.8
9.3
16.1
16.6
15.1
13.9
13.2
12.3
11.2
10.6
10.3
∆Yt
100
70.3
60.6
58.9
64.3
57.6
59.0
59.9
61.4
61.4
59.7
56.4
∆Et
0.0
29.2
37.9
35.8
29.8
35.8
33.0
30.9
28.7
28.0
29.5
32.6
∆Ht
0.0
0.5
1.5
5.3
5.9
6.6
7.9
9.2
9.8
10.5
10.8
11.0
∆Yt
100
92.3
87.9
87.0
70.3
61.4
59.2
58.2
55.3
53.9
55.5
54.2
∆Et
0.0
5.6
10.0
10.5
19.9
20.7
18.3
18.1
16.2
18.4
17.7
17.2
∆Ht
0.0
2.1
2.1
2.5
9.8
17.9
22.5
23.7
28.5
27.7
26.8
28.6
∆Yt
100
81.1
71.7
69.0
69.8
68.5
70.8
68.8
69.6
67.8
67.5
68.6
∆Et
0.0
14.9
11.9
11.3
11.8
13.4
13.1
17.1
16.7
16.1
16.6
15.9
∆Ht
0.0
4.0
16.4
19.7
18.4
18.1
16.1
14.1
13.6
16.0
15.8
15.4
∆Yt
100
81.7
81.4
75.3
70.9
63.6
58.4
55.5
52.2
48.3
45.9
45.3
∆Et
0.0
14.3
11.8
18.7
19.4
18.2
15.7
12.6
9.9
8.3
7.0
5.9
∆Ht
0.0
4.0
6.8
5.9
9.7
18.2
25.9
31.9
37.9
43.4
47.1
48.8
∆Yt
100
99.8
76.2
54.0
47.0
44.8
43.7
43.1
43.4
43.0
42.4
43.0
∆Et
0.0
0.2
20.9
40.2
47.3
49.6
50.4
49.5
48.0
48.4
48.4
47.1
∆Ht
0.0
0.0
2.9
5.8
5.7
5.6
5.9
7.4
8.5
8.7
9.1
9.9
Country Bangladesh Kiribati Malaysia Maldives Philippines Republic of Korea
36

Findings from the estimated VAR model for Fiji, Nepal, Singapore, Sri Lanka, Tonga and Vanuatu
Results of the estimated VAR models for the economies of Fiji, Nepal, Singapore, Sri Lanka, Tonga and Vanuatu are presented in table 6. Based on the estimated VAR models, the corresponding forecast error variance decomposition of GDP growth is presented in table 7.
Fiji
Findings from the analysis in the case of Fiji are similar to those for Tonga. In the estimated VAR model for Fiji the coef�cient of �ve years of lagged GDP is positive (0.58) and signi�cant at the 10 per cent level, indicating that education spending has some growth effect on GDP. However, the role of health-care spending on GDP growth was found to be statistically insigni�cant. The Wald test rejects the possibility of causal effect of both education and health-care spending on GDP growth. However, from the variance decomposition table the indication is that education spending may contribute to the country’s GDP growth in the future.
Nepal
In Nepal both education and health-care spending exhibit a contributing role for GDP growth. At the initial period spending on education has a growth-retarding effect. However, such spending contributes positively to GDP with time lags of four years. Health-care spending, on the other hand, contributed to GDP growth at a time lag of one year.
Therefore, �ndings concerning the role of education and health-care spending on GDP in Nepal are similar to those in the case of Sri Lanka. However, Nepal is far behind Sri Lanka in respect of progress in human development as well as progress in other aspects of the economy.
Nepal is among the least developed countries and has been performing slowly in terms of economic and social development. In Nepal, the adult literacy rate has increased from 20.57 per cent in 1981 to 59.14 per cent in 2008. The expectation of life at birth has risen from 48.15 years in 1990 to 68.39 years in 2010. The infant mortality rate has declined from 132.6 per 1,000 in 1980 to 41.4 in 2010. The HDI score has risen from 0.242 in 1980 to 0.458 in 2011.
lanruoJ tnempoleveD cificaP-aisA
1
Vol. 19, No. 2, December 2012
2/20
37

Singapore
In Singapore estimates of four-year lagged education spending and one-year lagged health-care spending were found to be positive and signi�cant at the 5 per cent level. Values of these estimates are 0.256 and 0.226 respectively. Estimates of all other lags are insigni�cant (even at the 10 per cent level). Statistically signi�cant estimates of (lagged) education spending and health-care spending in the presence of lagged GDP in the VAR equation indicate that both education and health-care spending Granger cause GDP growth in Singapore over the period of the study. These �ndings have been con�rmed further through the Wald test. Variance decomposition analysis found that in the future health-care spending may play a more signi�cant role than education spending in the composition of the GDP growth pro�le of Singapore.
The signi�cant role in education and health-care spending in the GDP growth of Singapore may be viewed as a success for domestic policy. In this regard, Osman-Gani (2004) presented an account of macro-level strategies of human capital formation and their success. Particularly since the country’s independence, the economy of Singapore rapidly has been transformed from being a low-income economy to a high-income developed economy. In terms of almost all economic and social parameters, the progress of the country is very impressive. Based on 2011 data, the literacy rate in Singapore is 96.1 per cent, expectation of life at birth is 82 years, labour force participation rate (percentage of economically active persons to the population aged 15 years and older) is 66.1,7 and number of doctors per 10,000 population is 18. The country’s HDI score was 0.889 in 2011 and it rose to the 26th position in the HDI rankings. One of the most important reasons behind the phenomenal success of Singapore is the strong base of human capital which the country has generated through consistent and strategic national policy of spending in the education and health sectors for the development of the country.
Sri Lanka
Although 20 years of internal strife has affected Sri Lanka immensely,the country recorded a much better performance in human development relative to other countries in the South Asian subregion. Sri Lankan policymakers recognize education and health as priority sectors and followed a consistent policy in that regard. This has resulted in the country’s phenomenal achievements in education and health. According to the Human Development Report 2011, the country’s HDI score of 0.691 (rank 97th ) places Sri Lanka on the list of medium HDI countries.
lanruoJ tnempoleveD cificaP-aisA
1
Vol. 19, No. 2, December 2012
2/21
7 Available from www.singstat.gov.sg/stats/keyind.html#keyind.
38

Human development performance in Sri Lanka is re�ected in our empirical �ndings. Speci�cally, the estimated VAR model for the economy of Sri Lanka showed that at the initial period (lag 2) education spending has a growth-retarding negative impact. However, with the passage of time, such spending contributes to GDP growth, particularly at the �ve- and six-year lag periods. On the other hand, estimates of health-care spending at lag 1 and lag 5 have signi�cant positive impacts on GDP growth. In short, in the economy of Sri Lanka spending on health care contributes to GDP growth with both shorter and longer horizons of time. Findings of the estimated VAR model are quite consistent with the �ndings of Wald tests reported in the lower panel of table 6. The variance decomposition table indicates that in the future education spending may play a more signi�cant role than health-care spending in promoting the GDP growth of the country.
Tonga
The economy of Tonga relies on remittances from Tongans living abroad as well as on foreign aid. The country has no strategic and mineral resources and therefore is based on primary activities, such as agriculture and �shing. Assistance from the World Bank, aid from Australia and New Zealand as well as from China and Japan help develop the education sector of the country. The Paci�c Regional Initiative for the Implementation and Delivery of Basic Education, or “PRIDE”, also helps promote the quality of education in the country. The HDI score of the country increased to 0.704 in 2011.
In Tonga, education spending helps raise GDP growth. More speci�cally, the coef�cient of three years of lagged education spending in Tonga is 0.56 (i.e. positive) and is signi�cant at the 5 per cent level. Spending on education in Tonga therefore helps raise GDP growth with a gestation lag of three years. However, the impact of health-care spending on GDP growth was found to be statistically insigni�cant. This result has further been con�rmed through the Wald test. Variance decomposition analysis indicates that in Tonga education spending may be helpful in constituting a GDP growth pro�le in the future.
Vanuatu
The economy of the mountainous country of Vanuatu largely depends on agriculture and tourism. Economic reforms and a stable Government have helped the country progress in terms of human development. For instance, life expectancy is currently more than 70 years. The adult literacy rate is above 82 per cent. The net enrolment rate at the primary level is 100 per cent. Infant mortality sharply declined from 49.9 per 1,000 in 1980 to 11.4 in 2010.
lanruoJ tnempoleveD cificaP-aisA
1
Vol. 19, No. 2, December 2012
2/22
39

In the economy of Vanuatu two-period lagged education spending helped raise GDP growth, while one-period lagged health-care spending retarded GDP growth. In the future, education spending may play a major role in determining the GDP growth pro�le of the country.
One noticeable feature of the �ndings of the estimated VEC and VAR models in the countries concerned is that the gestation lags of education spending in promoting GDP are longer than those of health-care spending in this regard. This may be due to the fact that, at the very early stage of growth, spending on education works as consumption spending, which may not contribute directly to GDP and may depress GDP (as is found in the case of Sri Lanka). However, with the passage of time such spending was channeled through the process of teaching, learning, research and training to the formation of a skilled labour force, which we call human capital. This human capital participates in productive activities and leads to (endogenous) technical progress, contributing positively to economic growth. In such cases, the time lag of four years or more is quite sensible. Health-care spending, on the other hand, contributes to GDP with a gestation lag of one year. Health-care spending exploits the generation of improved health-care services, which reduce illness and casualties, and provide a healthy labour force. The healthy labour force participates in and contributes positively to GDP in such cases where the gestation lag may be short or long.
lanruoJ tnempoleveD cificaP-aisA
1
Vol. 19, No. 2, December 2012
2/23
40

lanr
uoJ t
nemp
olev
eD
cific
aP-
ais
A
1
Vol. 19, N
o. 2, Decem
ber 2012
2/24
Table 6. Results of vector autoregression estimation
Parameters
α∆Yt-1∆Yt-2∆Yt-3∆Yt-4∆Yt-5∆Yt-6∆Et-1∆Et-2∆Et-3∆Et-4∆Et-5∆Et-6∆Ht-1∆Ht-2∆Ht-3∆Ht-4∆Ht-5∆Ht-6
Estimates
0.0580.441
-0.373-0.405-0.327-0.3311.1160.2170.0910.1510.2310.2910.583
-0.5030.0890.079
-0.2730.0003-0.675
‘t’-ratio
1.6371.337
-1.011-1.126-0.778-0.9442.4550.5960.2200.3890.7440.9842.192
-1.4610.2610.195
-0.8030.0007
-1.6305
Estimates
0.026-0.0130.179
-0.0570.305
--
-0.1580.0020.0780.103
--
-0.0430.063
-0.011-0.033
--
‘t’-ratio
1.291-0.0530.906
-0.3451.796
--
-3.3410.0411.6032.661
--
-1.9502.813
-0.512-1.611
--
Estimates
0.0490.416
-0.1820.144
-0.290-0.642
--0.078-0.0160.0730.256
-0.044-
0.2260.1970.1570.1730.063
-
‘t’-ratio
1.4751.117
-0.4620.462
-0.738-1.619
--0.651-0.1500.7172.521
-0.399-
2.7381.9551.9371.9631.017
-
Estimates
0.014-0.1170.5770.3630.088
-0.268-0.8420.081
-0.447-0.1540.0590.1670.3250.1890.4590.0360.0710.173
-0.120
‘t’-ratio
0.7964-0.5612.1032.2960.742
-1.352-3.5511.015
-3.336-2.2221.2472.4263.6041.5253.6670.6191.8254.337
-2.387
Estimates
0.0090.563
-0.2050.203
---
-0.008-0.0590.563
---
0.273-0.241-0.155
---
‘t’-ratio
-0.3251.700
-0.7110.716
---
-0.054-0.3772.581
---
1.443-1.296-0.729
---
Estimates
-0.0031.058
-0.1600.201
-0.035--
0.1050.290
-0.2090.127
--
-0.296-0.171-0.1240.174
--
‘t’-ratio
-0.1853.087
-0.8881.169
-0.177--
0.9173.016
-1.5231.185
--
-2.416-1.797-0.9731.329
--
Fiji Nepal Singapore Sri Lanka Tonga Vanuatu
Source: Authors’ estimation.
Note: AIC: Akaike information criterion; and SBC: Schwarz Bayesian criterion.
Diagnostic statistics
VAR Granger causality/
block exogeneity Wald tests
R2 = 0.85, R2 = 0.17,AIC = -2.34,
SBC = -1.402,log likelihood = 45.9
Dep. variable: ∆Yt
Exclude X2 prob.
5.7876.798
11.6
∆Et :∆Ht :
All:
0.440.33
0.47
R2 = 0.65, R2 = 0.33,AIC = -5.59,SBC = -4.96,
log likelihood = 85.68
Dep. variable: ∆Yt
Exclude X2 prob.
17.9412.36
21.97
∆Et :∆Ht :
All:
0.000.00
0.00
R2 = 0.73, R2 = 0.22,AIC = -3.437,SBC = -2.65,
log likelihood = 57.2
Dep. variable: ∆Yt
Exclude X2 prob.
13.1512.11
0.00
∆Et :∆Ht :
All:
0.020.03
0.00
R2 = 0.92, R2 = 0.64,AIC = -6.02,SBC = -5.08,
log likelihood = 91.2
Dep. variable: ∆Yt
Exclude X2 prob.
51.723.5
58.03
∆Et :∆Ht :
All:
0.000.00
0.00
R2 = 0.59, R2 = 0.28,AIC = -3.252,SBC = -2.762,
log likelihood = 37.6
Dep. variable: ∆Yt
Exclude X2 prob.
7.1253.07
9.98
∆Et :∆Ht :
All:
0.060.38
0.12
R2 = 0.91, R2 = 0.76,AIC = -4.36,SBC = -3.72,
log likelihood = 56.6
Dep. variable: ∆Yt
Exclude X2 prob.
15.117.8
50.2
∆Et :∆Ht :
All:
0.000.00
0.00
41

lanr
uoJ t
nemp
olev
eD
cific
aP-
ais
A
1
Vol. 19, N
o. 2, Decem
ber 2012
2/26
Table 7. Variance decomposition of GDP growth (based on vector autoregression estimation)
Source: Authors’ estimation.
Forecast period ahead
1
2
3
4
5
6
7
8
9
10
11
12
∆Yt
100
71.7
71.8
63.8
63.2
70.0
75.7
73.4
73.4
73.5
73.5
73.2
∆Et
0.0
19.7
19.3
20.7
20.9
22.2
15.1
16.3
15.5
14.9
14.0
14.1
∆Ht
0.0
8.6
8.8
15.5
15.9
16.8
9.2
10.3
11.1
11.6
11.5
12.7
∆Yt
100
79.9
59.9
55.2
50.4
50.0
46.5
46.2
46.4
46.2
46.0
46.0
∆Et
0.0
0.3
8.9
16.9
15.8
16.7
20.5
20.4
20.8
20.9
21.3
21.3
∆Ht
0.0
19.8
31.2
27.9
33.8
33.3
33.0
33.4
32.8
32.8
32.7
32.7
∆Yt
100
50.2
48.2
47.9
40.6
40.7
39.0
39.4
39.8
41.8
39.6
40.1
∆Et
0.0
1.7
4.7
5.4
18.6
18.3
17.5
17.5
15.2
14.8
14.3
14.5
∆Ht
0.0
48.1
47.1
46.6
40.7
41.0
43.5
43.1
44.9
43.3
46.1
45.4
∆Yt
100
73.1
58.0
55.9
57.6
53.7
55.2
50.3
50.8
53.9
54.5
54.2
∆Et
0.0
21.3
35.5
36.6
33.7
35.7
33.5
39.7
39.3
34.5
34.1
34.5
∆Ht
0.0
5.6
6.5
8.5
8.7
10.6
11.2
10.0
9.9
11.6
11.4
11.3
∆Yt
100
77.5
74.0
54.5
51.5
59.6
60.5
60.2
57.8
57.7
59.3
59.3
∆Et
0.0
18.0
20.6
39.9
40.7
33.2
32.3
32.6
35.1
35.1
33.5
33.3
∆Ht
0.0
4.5
5.5
5.6
7.8
7.2
7.2
7.2
7.1
7.1
7.2
7.4
∆Yt
100
62.4
57.3
46.2
34.8
35.7
32.1
32.7
32.3
32.3
31.8
32
∆Et
0.0
28.7
30.1
36.0
52.3
45.3
45.9
45.7
46.8
47.1
47.9
47.7
∆Ht
0.0
8.9
12.6
17.8
12.9
19.0
22.0
21.6
20.9
20.6
20.3
20.3
Country Fiji Nepal Singapore Sri Lanka Tonga Vanuatu
42
V. CONCLUDING REMARKS AND POLICY IMPLICATIONS
This study examines the ef�cacy of public spending in education and health care in promoting GDP in the Asia-Paci�c region over the period 1981-2011. For this purpose, the study involved the use of a battery of time series data-analysing techniques, such as unit-root tests (ADF tests), cointegration, estimation of error correction models, unrestricted vector autoregressive models and variance decomposition analysis.
ADF tests con�rmed that each of the three time series (GDP, public spending on education and health care) is non-stationary at their log level and stationary upon �rst differencing in the countries concerned. Johansen (1991; 1995) multivariate cointegration tests involving I(1) series of GDP, public spending on education and health care testify to the existence of a cointegrating relationship in the case of Bangladesh, Kiribati, Malaysia, Maldives, the Philippines and the Republic of Korea. However, in the case of Fiji, Nepal, Singapore, Sri Lanka, Tonga and Vanuatu a cointegrating relationship among GDP, education and health-care spending is absent.
Study with the error correction models enquires into the underlying causal effect of education and health-care spending in promoting GDP in Bangladesh, Kiribati, Malaysia, Maldives, the Philippines and the Republic of Korea. On the other hand, the causal impact of the rate of change of education and health-care spending on the GDP growth of Fiji, Nepal, Singapore, Sri Lanka, Tonga and Vanuatu has been studied through the estimation of appropriate unrestricted VAR models.
The impact of education and health-care spending on GDP is not uniform. In the case of 9 of the 12 countries, education spending has been found to exert a positive impact on GDP. These countries are Bangladesh, Fiji, Kiribati, Maldives, Nepal, Singapore, Sri Lanka, Tonga and Vanuatu. In Bangladesh, Nepal, the Philippines, Singapore and Sri Lanka the impact of health-care spending on GDP was found to be positive and signi�cant. In the Philippines education spending has a negative impact on GDP, while in Kiribati, Maldives and Vanuatu the impact of health-care spending on GDP was found to be negative.
The study shows that the impact of education and health-sector spending on GDP growth is not an instantaneous process. A gestation lag exists before these forms of spending exert appreciable impacts on economic growth. As a matter of fact, spending on education and health care initially leads to the development of human capital, which ultimately manifests itself in the form of economic growth. Accordingly, the economic authority of any country cannot expect an immediate upsurge in
lanruoJ tnempoleveD cificaP-aisA
1
Vol. 19, No. 2, December 2012
2/27
43

economic growth following spending on education and health. Development of human capital is a time-consuming process which accounts for the gestation lags. These gestation lags vary across countries depending upon the state of the socioeconomic and administrative structure in the countries concerned.
It is therefore imperative for the economic authority to be persistent in allocation of resources for the development of the education and health sectors. Utilization of allocated resources in the education and health sectors may depend largely on good governance and ef�cient institutions, and skilled manpower of the country. In order to reap all the bene�ts of such spending, the authority should ensure a supportive and ef�cient socioeconomic structure for ef�cient utilization of resources. Particularly, in the case of low-income countries it may be a dif�cult task to utilize such resources in the face of some practical constraints, such as inappropriate planning, faltering monitoring and skilled manpower, widespread corruption and administrative bottlenecks. In such a situation, inclusion of some potential variables, such as good governance and democracy, may provide insights about the ef�cacy of such spending on economic growth. However, as this study has not included such variables, another study may be undertaken in this direction.
lanruoJ tnempoleveD cificaP-aisA
1
Vol. 19, No. 2, December 2012
2/28
44

REFERENCES
Al-Yousif, Yousif Khalifa (2008). Education expenditure and economic growth: some empirical evidence from the GCC countries. Journal of Developing Areas, vol. 42, No. 1, pp. 69-80.
Barro, R.J. (1991). Economic growth in a cross section of countries. Quarterly Journal of Economics, vol. 106, No. 2, pp. 407-444.
Becker, G. (1964). Human Capital. Chicago: University of Chicago Press.
Bhatt, R., and N. Jain (2004). Time series analysis of private healthcare expenditures and GDP: cointegration results with structural break. Working Paper, No. 2004-05-08. Ahmedabad, India: Indian Institute of Management.
Currie, Janet, and E. Moretti (2003). Mother’s education and the intergenerational transmission of human capital: evidence from college openings. Quarterly Journal of Economics, vol. 118, No. 4, pp. 1495-1532.
Devlin, N., and P. Hansen (2001). Health care spending and economic output: Granger causality. Applied Economics Letters, vol. 8, No. 8, pp. 561-564.
Dickey, D.A., and W.A. Fuller (1981). Likelihood ratio statistics for autoregressive time series with a unit root. Econometrica, vol. 49, No. 4, pp. 1057-1072.
Farahani M., S.V. Subramanian, and D. Canning (2010). Effects of state-level public spending on health on the mortality probability in India. Health Economics, vol. 19, No. 11, pp. 1361-1376.
Gupta, S., B. Clements, and G. Inchauste, eds. (2004). Helping Countries Develop: The Role of Fiscal Policy. Washington, D.C.: International Monetary Fund.
Gupta, S., M. Verhoeven, and E. Tiongson (2002). The effectiveness of government spending on education and health care in developing and transition economies. European Journal of Political Economy, vol. 18, No. 4, pp. 717-737.
Hanushek, Eric A., and Ludger Wössmann (2007). The role of education quality in economic growth. Policy Research Working Paper, No. 4122. Washington, D.C.: World Bank.
Hill, M.A., and E.M. King (1991). Women’s education in developing countries: an overview. In Women’s Education in Developing Countries: Barriers, Benefits and Policy, E.M. King, and M.A. Hills, eds. Washington, D.C.: World Bank.
Howitt, P. (2005). Health, human capital and economic growth: a Schumpeterian perspective. In Health and Economic Growth: Findings and Policy Implications, G. Lopez-Casasnovas, B. Rivera, and L. Currais, eds. Cambridge, MA: MIT Press.
Johansen, S. (1991). Estimation and hypothesis testing of cointegration vectors in Gaussian vector autoregressive models. Econometrica, vol. 59, No. 6, pp. 1551-1580.
________ (1995). Likelihood-Based Inference in Cointegrated Vector Autoregressive Models. Oxford: Oxford University Press.
Kim, Kwangkee, and Phillip M. Moody (1992). More resources better health? A cross-national perspective. Social Science and Medicine, vol. 34, No. 8, pp. 837-842.
Kiymaz, H., Y. Akbulut, and A. Demir (2006). Tests of stationarity and cointegration of health care expenditure and gross domestic product: an application to Turkey. European Journal of Health Economics, vol. 7, No. 4, pp. 285-289.
Lee, J.W., and R. Barro (1997). Schooling quality in a cross section of countries. Working Paper, No. 6198. Cambridge, MA: National Bureau of Economic Research.
lanruoJ tnempoleveD cificaP-aisA
1
Vol. 19, No. 2, December 2012
2/29
45
Li, Hongyi, and H. Liang (2010). Health, education, and economic growth in East Asia. Journal of Chinese Economic and Foreign Trade Studies, vol. 3, No. 2, pp. 110-131.
Lucas, R.E. (1988). On the mechanics of economic development. Journal of Monetary Economics, vol. 22, No. 1, pp. 3-42.
Mincer, Jacob (1974). Schooling, Experience, and Earnings. New York: Columbia University Press. Available from www.nber.org/books/minc74-1.
Musila, J.W., and W. Belassi (2004). The impact of education expenditures on economic growth in Uganda: evidence from time series data. Journal of Developing Areas, vol. 38, No. 1, pp. 123-133.
Osman-Gani, A.M. (2004). Human capital development in Singapore: an analysis of national policy perspectives. Advances in Developing Human Resources, vol. 6, No. 3, pp. 276-287.
Permani, R. (2009). The role of education in economic growth in East Asia: a survey. Asian-Pacific Economic Literature, vol. 23, No. 1, pp. 1-20.
Persson, Torsten, and Guido Tabellini (2000). Political Economics: Explaining Economic Policy. Cambridge and London: MIT Press.
Psacharopoulos, G., and H.A. Patrinos (2002). Returns to investment in education – a further update. Policy Research Working Paper, No. 2881. Washington, D.C.: World Bank.
________ (2004). Returns to investment in education: a further update. Education Economics, vol. 12, No. 2, pp. 111-134.
Romer, P.M. (1990). Endogenous technical change. Journal of Political Economy, vol. 98, No. 5, pp. S71-S102.
Schultz, T.W. (1961). Investment in human capital. American Economic Review, vol. 51, No. 1,pp. 1-17.
Swaroop, V. (1996). The public sector in the Caribbean: issues and reform options. Policy Research Working Paper, No. 1609. Washington, D.C.: World Bank. Available from http://elibrary. worldbank.org/content/workingpaper/10.1596/1813-9450-1609.
Wagner, A. (1883). Three extracts on public �nance. In Classics in the Theory of Public Finance, R.A. Musgrave, and A.T. Peacock, eds. (1958). London: Palgrave Macmillan and International Economic Association.
Wang, Kuan-Min (2011). Health care and economic growth: quantile panel-type analysis. Economic Modelling, vol. 28, No. 4, pp. 1536-1549.
Wilson, Mark R. (1995). Medical care expenditure and GDP growth in OECD nations. Social Science and Medicine, vol. 14, pp. 25-32.
lanruoJ tnempoleveD cificaP-aisA
1
Vol. 19, No. 2, December 2012
2/30
46

lanr
uoJ t
nemp
olev
eD
cific
aP-
ais
A
1
Vol. 19, N
o. 2, Decem
ber 2012
2/31 Source: World Bank data table. Available from http://data.worldbank.org/ (accessed 26 August 2012).
ANNEXTable A.1. Selected development parameters in selected Asia-Pacific countries, 1980-2011
Country(income level)
Bangladesh
(low income)
Fiji
(lower middle income)
Kiribati
(lower middle income)
Malaysia
(upper middle income)
Maldives
(upper middle income)
Nepal
(low income)
Philippines
(lower middle income)
Republic of Korea
(high income)
Singapore
(high income)
Sri Lanka
(lower middle income)
Tonga
(lower middle income)
Vanuatu
(lower middle income)
GDP per capita(based on PPP
in constant 2005 United States
dollars)
676.81 (1980)
1 568.4 (2011)
3 434.4 (1980)
4 198.6 (2011)
2 077.75 (1980)
2 063.38 (2011)
4 866.9 (1980)
13 672.1 (2011)
3 230.3 (1995)
7 833.9 (2011)
566.5 (1980)
1 101.9 (2011)
2 826.9 (1980)
3 630.9 (2011)
5 543.57 (1980)
27 541.3 (2011)
15 115.9 (1980)
53 591.1 (2011)
1 553.05 (1980)
4 928.99 (2011)
2 597.9 (1981)
4 091.9 (2011)
2 765.8 (1980)
4 061.9 (2011)
Adult literacy rate
29.22 (1981)
55.90 (2010)
..
..
..
..
69.51 (1980)
92.45 (2009)
92.23 (1985)
98.38 (2006)
20.57 (1981)
59.14 (2008)
83.89 (1980)
95.01 (2008)
100 (2011)
82.91 (1980)
94.71 (2009)
86.7 (1981)
90.5 (2008)
98.9 (1996)
99.01 (2001)
52.87 (1974)
82.03 (2009)
Primaryschool
enrolment (% net)
97 (2001)
88 (2009)
97 (2001)
97 (2009)
95.41 (1979)
97.06 (2002)
95 (2001)
95 (2009)
97 (2001)
97 (2009)
..
..
89 (2001)
88 (2009)
99 (2001)
100 (2009)
..
..
94.15 (1980)
94.38 (2010)
95 (2001)
97 (2009)
86.2 (1982)
100 (2009)
Infant mortality rate
130 (1980)
38 (2011)
31.2 (1980)
14.9 (2010)
82.4 (1980)
37.7 (2011)
25.9 (1980)
5.4 (2010)
113.5 (1980)
13.6 (2010)
132.6 (1980)
41.4 (2010)
51.4 (1980)
23.2 (2010)
15.3 (1980)
4.1 (2011)
11.5 (1980)
2.1 (2010)
36.8 (1980)
14.2 (2010)
26.2 (1980)
13.2 (2011)
49.9 (1980)
11.4 (2010)
Immunization DPT
children ages 12-23 months
(%)
1 (1981)
95 (2010)
68 (1980)
99 (2010)
43 (1983)
99 (2011)
67 (1980)
94 (2010)
1 (1981)
96 (2010)
8 (1980)
82 (2010)
47 (1980)
87 (2010)
61 (1981)
94 (2010)
84 (1980)
97 (2010)
46 (1980)
99 (2010)
40 (1980)
99 (2010)
22 (1980)
68 (2010)
Immunization measles
children ages 12-23 months
(%)
1 (1982)
94 (2010)
32 (1980)
94 (2010)
24 (1983)
90 (2011)
11 (1983)
96 (2010)
39 (1981)
97 (2010)
2 (1981)
86 (2010)
9 (1982)
88 (2010)
4 (1980)
98 (2010)
47 (1980)
95 (2010)
20 (1985)
99 (2010)
91 (1981)
99 (2010)
20 (1982)
52 (2010)
Hospital bedsper 1 000
population
0.126 (1980)
0.300 (2004)
2.813 (1980)
2.100 (2009)
5.09 (1980)
1.4 (2010)
2.278 (1981)
1.8 (2010)
0.763 (1990)
1.381 (2007)
0.175 (1980)
5.00 (2006)
1.708 (1980)
0.500 (2009)
1.700 (1980)
10.3 (2009)
3.956 (1980)
3.1 (2008)
2.94 (1980)
3.1 (2004)
3.449 (1980)
2.6 (2010)
6.17 (1981)
1.7 (2009)
Life expectancyat birth
55.2 (1980)
68.9 (2010)
63.01 (1980)
69.22 (2010)
51.9 (1982)
64.92 (2012)
67.4 (1980)
74.02 (2010)
52.6 (1980)
76.5 (2010)
48.15 (1980)
68.39 (2010)
63.16 (1980)
68.48 (2010)
65.8 (1980)
80.76 (2010)
71.9 (1980)
81.64 (2010)
68.2 (1980)
74.7 (2010)
67.55 (1980)
72.15 (2010)
58.5 (1980)
70.8 (2010)
HDI score
0.26 (1980)
0.500 (2011)
0.624 (1990)
0.688 (2011)
..
0.624 (2011)
0.631 (1990)
0.761 (2011)
0.57 (2000)
0.661 (2011)
0.340 (1990)
0.458 (2011)
0.571 (1990)
0.644 (2011)
0.742 (1990)
0.897 (2011)
0.801 (2000)
0.866 (2011)
0.53 (1980)
0.691 (2011)
0.649 (1990)
0.704 (2011)
..
0.617 (2011)
47

lanr
uoJ t
nemp
olev
eD
cific
aP-
ais
A
1
Vol. 19, N
o. 2, Decem
ber 2012
2/32
Source: World Bank data table. Available from http://data.worldbank.org/ (accessed 26 August 2012).
Table A.2. Spending on education and health in selected Asia-Pacific countries
Country
Bangladesh
Fiji
Kiribati
Malaysia
Maldives
Nepal
Philippines
Republic of Korea
Singapore
Sri Lanka
Tonga
Vanuatu
Public spending on education as
percentage of total public expenditure
6.151 (1980)14.109 (2009)
11.34 (1981)14.723 (2009)
..
..
14.67 (1980)18.93 (2009)
7.199 (1986)16.026 (2010)
8.335 (1980)20.216 (2010)
9.127 (1980)15.048 (2009)
12.635 (1998)15.77 (2008)
8.178 (1980)10.33 (2010)
7.667 (1980)8.075 (2009)
13.49 (2003)
17.39 (1998)23.7 (2009)
Public spending on education as
percentage of GDP
0.943 (1980)2.233 (2009)
5.046 (1980)4.480 (2009)
3.13 (1974)11.60 (2002)
5.72 (1980)5.78 (2009)
2.345 (1986)8.711 (2010)
1.569 (1980)4.718 (2010)
1.719 (1980)2.652 (2009)
3.543 (1980)5.04 (2009)
2.637 (1980)3.262 (2010)
2.704 (1980)2.056 (2009)
10.34 (1984)3.91 (2004)
7.64 (1998)5.17 (2009)
Public spending on health care as
percentage of GDP
1.275 (1995)1.063 (2009)
2.252 (1995)2.513 (2009)
8.97 (1995)9.26 (2010)
1.43 (1995)2.151 (2009)
3.347 (1995)5.192 (2009)
1.310 (1995)2.055 (2009)
6.268 (1995)7.552 (2010)
1.424 (1995)4.087 (2010)
1.527 (1995)1.607 (2009)
1.631 (1995)1.789 (2010)
3.38 (1995)4.13 (2010)
2.19 (1995)4.75 (2010)
Public spending on health care as
percentage of total public expenditure
8.835 (1995)7.364 (2010)
8.011 (1995)9.399 (2010)
14.86 (1995)12.08 (2010)
5.323 (1995)9.207 (2010)
9.199 (1995)8.577 (2010)
7.895 (1995)7.919 (2010)
1.363 (1995)1.332 (2009)
7.102 (1995)12.356 (2010)
9.431 (1995)8.01 (2010)
5.490 (1995)5.767 (2010)
9.69 (1995)12.93 (2010)
7.97 (1995)18.19 (2010)
Private spending on health care as
percentage of GDP
2.248 (1995)2.289 (2009)
0.852 (1995)0.901 (2010)
0.46 (1995)1.99 (2010)
1.595 (1995)2.65 (2009)
5.135 (1995)2.813 (2009)
3.639 (1995)3.759 (2009)
2.085 (1995)2.489 (2009)
2.506 (1995)2.844 (2010)
1.484 (1995)2.300 (2009)
1.865 (1995)2.169 (2009)
1.66 (1995)0.93 (2010)
0.76 (1995)0.49 (2010)
..
48