enhancing decision-making, cost-efficiency, and profitability with predictive...
TRANSCRIPT

By Dr. Rado Kotorov
A White Paper
Enhancing Decision-Making, Cost-Efficiency, and Profitability With Predictive Analytics

Executive Summary
Why Predictive Analytics?
Predictive Analytics for Operational Users
Integrating Predictive Modeling Into BI Environments
More Cost-Effective Predictive Modeling
Conclusion
Table of Contents
1
2
6
11
3
9

Dr. Rado Kotorov, technical director of Strategic Product Management for Information Builders, is responsible for emerging reporting, analytic, and visualization technologies. He is driving the adoption of RIA, AJAX, search, and other Web 2.0 and mobile technologies to make BI and enterprise analytics more accessible, intuitive, and collaborative. Active Reports, Magnify, and InfoAssist are just a few of the applications created through his efforts.
Prior to joining Information Builders he was chief financial officer with responsibilities in IMS and IT at DeBacker Management LLC. He was also BI director at CMI Marketing, where he managed the implementation of BI and financial reporting solutions, data warehouses, and custom applications.
Dr. Kotorov has developed analytic models and applications for the pharmaceutical, retail, CPG, financial, and automotive industries. He has a Ph.D. in decision and game theory, and economics from Bowling Green State University. He has also published on business processes, emerging technologies, CRM, KM, innovation, and entrepreneurship.
Rado Kotorov

Information Builders1
Executive Summary
Today’s managers must always look at the past, present, and future. They need reports on past performance to improve operational efficiency. They need to make informed forecasts about the future to optimize resource allocation and consumption. And, they need data about current conditions to react to problems and changing conditions before they have a negative impact on the business.
Historically, various different systems and tools were employed to aid managers in making important business decisions. As a result, they were challenged to gain a single, consistent perspective on past, present, and anticipated operational performance. This is changing quickly, as business intelligence (BI) platforms such as Information Builders WebFOCUS, are providing a unified decision-support environment where managers can retrieve and analyze data about past, present, and future activities.
In this paper, we will discuss the incorporation of predictive modeling capabilities into the WebFOCUS BI platform, and highlight how this advanced functionality can dramatically improve decision-making, thus reducing risk and costs while increasing revenue and profits. By empowering business users at all levels with easy and intuitive scoring applications, companies can enable them to make more informed decisions about the future, instead of relying on guesswork and intuition.
Operational Management Challenge: Managing Across All Time Frames

Predictive Analytics2
Renowned business management guru Peter Drucker once said that what cannot be measured cannot be managed. In light of this theory, reporting, scorecarding, key performance indicators (KPIs), and other strategies emerged as management tools, helping to ensure that performance is consistent, and does not deviate from operational and profitability objectives. Perhaps the greatest benefit of those tools is that they give managers the ability to monitor processes after they have been executed, and react accordingly by fixing them when things go wrong.
In addition to what happened yesterday or last week, managers are anxious to know what will happen tomorrow. For example, what will be the demand for a product or service? What revenue can be expected and from what channels (direct sales, partners, etc.)? Which customers are likely to buy a product?
If accurate expectations can be formed about the future, managers can proactively structure workflows and allocate resources to maximize productivity and profits. The more precise the expectations, the greater the profits that can be realized – more efficiently and with fewer resources.
With the addition of predictive analytics to the WebFOCUS enterprise BI platform, managers can leverage advanced technologies to form more precise expectations about the future, and ultimately, to improve decision-making. Without predictive modeling, managers would simply be guessing what will happen based on past experience and the relatively few indicators that they may take into account.
Modern information systems collect tremendous volumes of data. A customer profile can include more than 200 descriptive variables, such as income, age group, gender, occupation, and education level. A crime incident may also have many attributes – weather conditions, location indicators, and victim characteristics. How can it be decided which factors matter and which ones don’t? And how does one determine the relative importance of each factor. For example, how much more important is income than education when performing credit application approvals?
With the aid of predictive modeling technology, managers can do what the human mind alone cannot. They can assess which factors are relevant or assign weights to those factors. Predictive analytics eliminates guesswork, helping managers make better decisions.
Why Predictive Analytics?

Information Builders3
While many types of users can benefit from the ability to make more accurate predictions about the future, it is operational users who will achieve the greatest advantages. For example, a marketer must decide which prospects to target when mailing campaigns and catalogues. The typical response rate on a direct mail campaign is two percent, according to industry studies. And, some catalogues are quite expensive – costing $50 or more to produce. Making just two sales for every 100 catalogues mailed can make this approach to marketing and customer acquisition rather cost-prohibitive.
However, if a marketer can use predictive analytics to precisely target three customers, of which two will respond, the result would be a 97 percent reduction in customer acquisition costs. So the question is, how can the benefits of predictive modeling be achieved without having to turn every operational user into a statistician?
Most often this type of work is the domain of a few experts, including mathematicians and statisticians. Related projects are one-offs and the results are distributed as research papers or files that contain the scored records. It is a slow, time consuming, and resource-intensive process. It is also not systematic, with projects and data files being shuffled between different people. Given the esoteric nature of predictive modeling, it is not surprising that the word “statistics” is one that scares managers.
Before distributing predictive modeling applications to end users, the complexity must first be eliminated. Traditional processes must be simplified and replaced with a more system-oriented approach. This can be achieved by giving operational users scoring applications, which allow them to generate predictions by selecting a few parameters from an intuitive Web form.
Predictive Analytics for Operational Users
A Web-based scoring application for operational users that does not require any knowledge of statistics.

Predictive Analytics4
Imagine the case of a marketing manager who just acquired a new mailing list. The list must now be narrowed down to a more targeted sub-list to minimize costs. Instead of creating a model and analyzing formulas, the marketing manager can simply select a model from a drop-down list and pass the data through it to generate scores for each person on the list (see image on previous page).
Similarly, a police officer can select specific parameters, such as weather conditions or area events, to generate a prediction about where crimes are most likely to occur (see screenshot of map on next page).
For every operational situation that contains risk, and for which anticipatory decision-making is required, scoring applications can offer tremendous benefits:
Marketing operations –■■ Target and segment lists for campaigns, improve response rates, identify cross-sell and up-sell opportunities
Customer relationship management (CRM) –■■ Model and score customer loyalty, life-time value, churn, and acquisition rates; assess RFM (recency, frequency, and monetary value)
Finance –■■ Perform credit risk analyses, including behavioral scoring, risk assessment, cross selling, and loan application scoring
Collections –■■ Optimize receivables by targeting similar payers
Fraud detection –■■ Uncover patterns of illegal, fraudulent, or abusive behavior
Healthcare –■■ Monitor patient health records to determine which people are most likely to develop chronic conditions
Insurance –■■ Detect claim fraud, forecast claim activity, and determine claim severity
Law enforcement –■■ Enhance resource allocation and dispatch management through timely and accurate crime forecasting
Manufacturing –■■ Identify machinery or interrelations between equipment and tools that can yield higher outputs and/or lower costs
Demand forecasting –■■ Accurately estimate customer demand and required product volumes
In these scenarios, and many others, the benefits for the operational decision-maker come in the form of improved risk assessment and more precise expectations about the future.
The accuracy of decision-making is based on three variables: the quantity of detailed historical data available, the means to correctly assess the importance of each factor within that historical data, and the acquisition of technologies to automate the process of data collection, forecasting, and risk assessment.
Let’s take a look at each one of these variables individually:
Access to Historical Data –■■ Incorporating large amounts of historical data into the assessment process to increase the precision and accuracy of the decision. For example, the more information available about past purchases, the better a marketer can determine whether or not a person is likely to buy a specific product. An electronics retail outlet may sell approximately 15,000 items. A loyalty card can capture all transactions, and that data can then be used to

Information Builders5
model which consumers are more likely to buy computers, home theater equipment, handheld devices, and other offerings. In other words, that past data allows for the detection of behavioral patterns so they can be used to make better judgments about the needs and wants of customers and prospects in the future.
Data Modeling and Scoring –■■ Using mathematical algorithms to properly assign weights to each factor that impacts a particular outcome. The more variables that affect an outcome, the more difficult it is to decide whether those factors are equally important, or if some are more important than others. For example, if demand is overestimated, an electronics retailer will have excess inventory. If it is underestimated, sales opportunities will be missed. Imagine a retailer with 200 or more stores. Location, store layout, traffic, neighborhood demographics, and many other variables will have an affect on sales. Assessing the level of importance of each variable will allow for better demand forecasting for each store, and ultimately, enhanced inventory management.
Automation –■■ Processing large amounts of data and assessing the relative importance of each variable is not an easy task. It takes time and requires special skills. Operational users don’t have the time, the know-how, or the functional responsibility to analyze data in such a manner. They need to make decisions quickly to do their jobs. That is where automation comes into play. State-of-the-art software solutions, like WebFOCUS RStat, can do in seconds what it takes analysts days to complete. We can deliver applications where, in self-service mode, decision-makers can run models and scoring applications to make estimations and predictions about the future and use those forecasts to enhance planning and decision-making. If a police officer has to decide where to allocate patrols cars on Friday, she doesn’t have to perform sophisticated analysis of five years of crime data with more than 100 variables. That would be a daunting endeavor, since the data set would be too large and too complex to even place into an Excel spreadsheet. Instead, she can simply select a few parameters from a Web form, and the probabilities of crimes occurring within each dispatch zone will be dynamically estimated for her.
Predictive analytics used within a law enforcement application.
Predictive Analytics6
Operational users are scared of statistics, yet IT managers are scared of the cost and deployment of predictive modeling applications. This is why most enterprises end up with both a BI suite and statistical or data mining solution. Different user groups often manage these separate tools, resulting in a fragmented process and increased administration requirements since multiple applications must be maintained. Without a consistent, unified approach, as is promoted in business intelligence competency centers (BICCs), end users will be forced to go to one place for one type of information and somewhere else for other types of decisions.
Integrating predictive modeling capabilities into the BI suite resolves these issues and provides a single environment where people with diverse skills can collaborate to develop applications for operational users. This will ultimately lead to simplified implementations and reduced maintenance costs, while facilitating reusability of resources. To illustrate these points, let’s examine the process of creating a scoring application and see how it can be done within integrated environments like WebFOCUS RStat.
The creation of a predictive scoring application can be accomplished in three distinct stages: (1) data preparation, (2) model creation, and (3) end user application development. Approximately 80 percent of the time and effort will be spent in the data preparation stage. During this stage, access to the data source or to multiple data sources must be established, and the queries that will extract the data into a single flat file for analysis must be created. Additionally, data must be profiled and cleansed. For example, if missing values are detected, they must be replaced, or if outliers are uncovered, they must be removed. Often, some of the data variables will need to be transformed. For example, income or sales numbers may need to be converted into natural log values to improve the fit and predictive power of the model.
The data preparation process is typically performed by multiple individuals – data modelers and statisticians. The data modeler will create the query, while the statistician profiles and cleanses the data. This work is often done using multiple software packages. Therefore, the data set is being created by one user, then handed over to another user, resulting in the proliferation of inconsistent data sets for modeling purposes, similar to the way inconsistent Excel reports proliferate in BI environments.
Contrast this approach to the typical workflow in a fully integrated environment. A modeler prepares the data access processes and creates the metadata, ensuring that anyone can run standard queries against the needed sources. The modeler can also build the query. Since, in a fully integrated environment, a query can be used for both reporting and modeling purposes, a statistician or an analyst can also use the query for execution directly within the modeling engine (WebFOCUS RStat). When a query is executed for modeling, a simple but powerful user interface is invoked, so that the modeler can quickly and easily specify and create the model.
Who can create models? Is a statistician required? It is hard to give a definitive answer to this question. However, both the technology of statistics and the education applied to it, have changed, especially with the increasing use of Six Sigma in today’s enterprises. Technical details and math formulas are no longer taught; it is the understanding and application of statistical
Integrating Predictive Modeling Into BI Environments

Information Builders7
techniques that are highlighted during training. Stated simply, one does not need to have insight into the math behind linear regression to build regression models. That’s why most management and business schools offer courses that cover business statistics.
Modeling tools have also evolved to provide simple user interfaces for the selection and configuration of models. Most importantly, they include intuitive methods for evaluating the accuracy of different models. As a result, a business analyst can create several models, compare their accuracy, and select the one that performs best for deployment. Of course there are always complicated cases that require advanced data transformation and data segmentation. In such scenarios, input from an expert statistician will be needed, but business analysts will have the tools to recognize when situations that require additional assistance arise.
Once a model is built, a simple and intuitive Web application must be developed and deployed to operational users. The benefit of having a single, unified BI suite is that the modeler can hand off the model as a compiled function to a BI developer, who can then use the same tool to build the forms that will allow users to select the data and the models from drop-down boxes. Those selections will then be passed through the functions and results will be returned as fully formatted reports or displayed as charts or maps.
Data preparation for predictive modeling in Developer Studio and variable selection in RStat.

Predictive Analytics8
An additional benefit of integrating predictive modeling into a BI suite is that users will then be able to run analyses against the output of a statistical process. For example, a marketer can run a direct mail list through a scoring application to determine the best targets. The result is a report with all targets and the predicted probabilities of each, ranging from 0 (not a likely buyer) to 100 (likely buyer). The marketer can then use BI to further segment prospects by probability range; for example, 100 to 90 or 89 to 90. This will enable them to gain precise knowledge, so they can plan accordingly for optimal campaign results.
Model building and evaluation.
Information Builders9
Because they are built upon highly specialized technologies, statistical software and modeling tools have historically had a reputation for being quite expensive, making them affordable and accessible to a select few. This is no longer the case. The rising popularity of open source software has created alternatives to commercial packages in every field, and statistics and modeling are no exception.
In the statistical modeling and predictive analytics market, the open source R engine has emerged as a robust, scalable, and reliable alternative to many of the commercial equivalents.
According to Statistics in a Nutshell1, “..if you are serious about statistics as a career, you need to become familiar with R because it is the most powerful and flexible language available, and may become the lingua franca of statistical programming in the near future.“
Daryl Pregibon, a research scientist at Google, a company that uses R software widely, agrees. He states that, “R is really important to the point that it’s hard to overvalue it. It allows statisticians to do very intricate and complicated analyses without knowing the blood and guts of computing systems.”
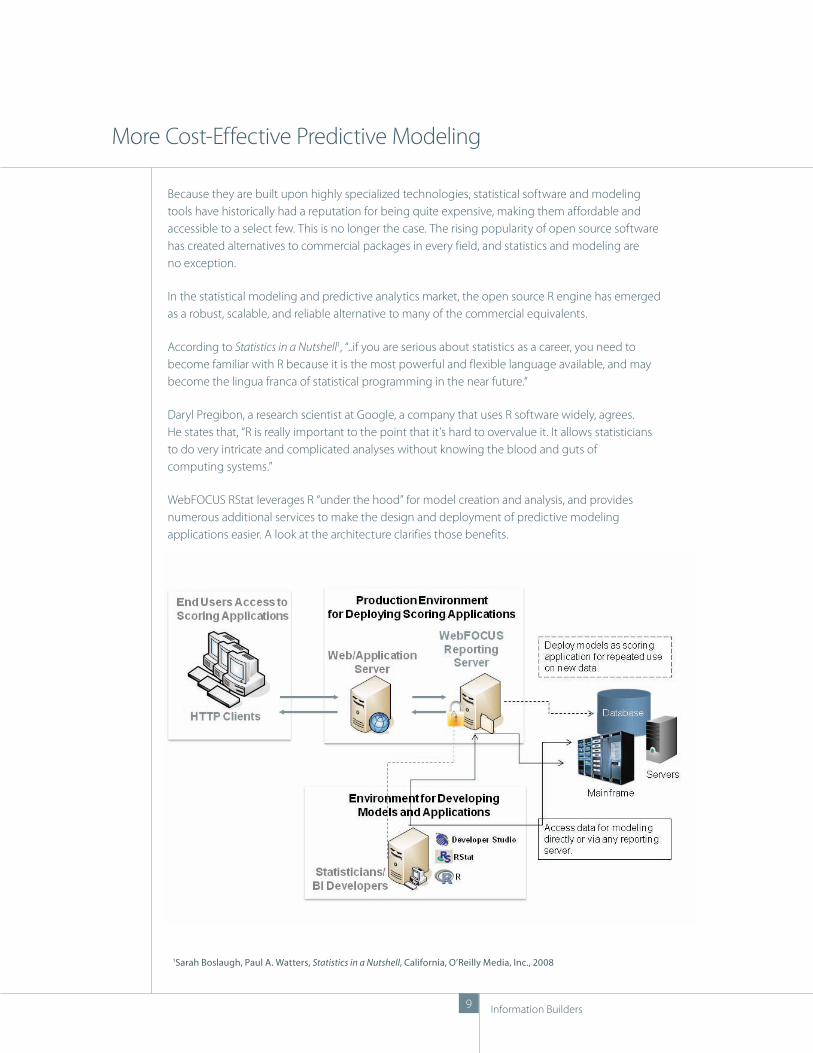
WebFOCUS RStat leverages R “under the hood” for model creation and analysis, and provides numerous additional services to make the design and deployment of predictive modeling applications easier. A look at the architecture clarifies those benefits.
More Cost-Effective Predictive Modeling
1Sarah Boslaugh, Paul A. Watters, Statistics in a Nutshell, California, O’Reilly Media, Inc., 2008

Predictive Analytics10
R is just a core engine, so users must have certain programming skills in order to access data, load data into R memory, create the model, script the scoring routines, etc. Creation of each model is a non-standard process that requires a full programming effort. By integrating R with WebFOCUS, users can leverage all the data access and metadata management capabilities of standard BI tools, then use a specially designed user interface to specify the model parameters for R. This eliminates the need for manual scripting. Furthermore, once a model is created, it is compiled as a regular WebFOCUS function. So, the scoring application can be implemented on any platform, and be deployed more efficiently, from an architectural point of view, because R is not required for scoring. The scoring is done on the reporting server, eliminating the need for extra software and minimizing processing at run time. This, in turn, dramatically reduces configuration and maintenance costs.
The integration of R and WebFOCUS offers fully optimized utilization of human resources as well as hardware and software assets.

Information Builders11
As increasing pressure is put on managers to make better decisions and more accurate estimates, it becomes increasingly important to provide a unified decision support system that will allow them to review, in detail, past and current performance, as well as predict future conditions and activities. As a result, the demand for the integration of advanced modeling and forecasting techniques into applications will rise sharply to meet those needs.
WebFOCUS RStat tightly integrates modeling capabilities into the core BI suite and leverages cutting-edge open source technologies to help IT professionals standardize the way they develop, manage, and maintain such applications, leveraging tools that are familiar to BI developers.
Conclusion

Worldwide Offices
Corporate Headquarters Two Penn Plaza, New York, NY 10121-2898 (212) 736-4433 Fax (212) 967-6406 DN7506254.0809 informationbuilders.com [email protected] Headquarters 150 York St., Suite 1000, Toronto, ON M5H 3S5 (416) 364-2760 Fax (416) 364-6552For International Inquiries +1(212) 736-4433
Copyright © 2009 by Information Builders. All rights reserved. [83] All products and product names mentioned in this publication are trademarks or registered trademarks of their respective companies.
Printed in the U.S.A. on recycled paper
North AmericaUnited States
■■ Atlanta,* GA (770) 395-9913■■ Baltimore, MD Professional Services:
(703) 247-5565
Boston,*■■ MA (781) 224-7660
Channels,■■ (800) 969-4636
Charlotte,■■ NC Professional Services:
(704) 494-2680
Chicago,*■■ IL (630) 971-6700
Cincinnati,*■■ OH (513) 891-2338
Dallas,*■■ TX (972) 490-1300
Denver,*■■ CO (303) 770-4440
Detroit,*■■ MI (248) 641-8820
Federal Systems,*■■ DC (703) 276-9006
Hartford,■■ CT (860) 249-7229
Houston,*■■ TX (713) 952-4800
Los Angeles,*■■ CA (310) 615-0735
Minneapolis,*■■ MN (651) 602-9100
New Jersey*■■ Sales: (973) 593-0022
New York,*■■ NY Sales: (212) 736-7928
Professional Services: (212) 736-4433, ext. 4443
Orlando,*■■ FL (407) 804-8000
Philadelphia,*■■ PA Sales: (610) 940-0790
Phoenix,■■ AZ (480) 346-1095
Pittsburgh,■■ PA Sales: (412) 494-9699
St. Louis,*■■ MO (636) 519-1411
San Jose,*■■ CA (408) 453-7600
Seattle,■■ WA (206) 624-9055
Washington,*■■ DC Sales: (703) 276-9006
Professional Services: (703) 247-5565
CanadaInformation Builders (Canada) Inc.
Montreal*■■ (514) 421-1555
Ottawa■■ (613) 233-0865
Toronto*■■ (416) 364-2760
Vancouver■■ (604) 688-2499
MexicoInformation Builders Mexico
Mexico City■■ 52-55-5062-0660
AustraliaInformation Builders Pty. Ltd.
Melbourne*■■ 61-3-9631-7900
Sydney*■■ 61-2-8223-0600
EuropeBelgium*■■ Information Builders Belgium
Brussels 32-2-7430240
France*■■ Information Builders France S.A.
Paris 33-14-507-6600
Germany■■ Information Builders (Deutschland)
Eschborn* 49-6196-77576-0
Netherlands*■■ Information Builders
(Netherlands) B.V.
Amsterdam 31-20-4563333
Portugal■■ Information Builders Portugal
Lisbon 351-217-217-400
Spain■■ Information Builders Iberica S.A.
Barcelona 34-93-344-32-70
Bilbao 34-94-452-50-15
Madrid* 34-91-710-22-75
Switzerland■■ Information Builders Switzerland AG
Dietlikon 41-44-839-49-49
United Kingdom*■■ Information Builders (UK) Ltd.
London 44-845-658-8484
RepresentativesAustria■■ Raiffeisen Informatik Consulting GmbH
Vienna 43-12-1136-3870
Brazil■■ InfoBuild Brazil Ltda.
São Paulo 55-11-3285-1050
China■■
InfoBuild China, Inc.
Shanghai 86-21-5080-5432
Beijing Xinrong Software Technology Co., Ltd.
Beijing 86-10-5873-2031
Denmark■■ InfoBuild AB
Kista, SE 46-735-23-34-97
Egypt■■ Al-Hisn Al-Waqi (AHAW)
Riyadh, SA 996-1-4412664
Ethiopia■■ MKTY IT Services Plc
Addis Ababa 251-11-5501933
Finland■■ InfoBuild Oy
Vantaa 358-207-580-840
Greece■■ Applied Science
Athens 30-210-699-8225
Guatemala■■ IDS de Centroamerica
Guatemala City 502-2412-4212
Gulf States■■ Al-Hisn Al-Waqi (AHAW) ■ Bahrain ■ Kuwait ■ Oman ■ Qatar ■ United Arab Emirates ■ Yemen
Riyadh, SA 996-1-4412664
India*■■ InfoBuild India
Chennai 91-44-42177082
Israel■■ SRL Group Ltd.
Tel Aviv 972-3-7662030
Italy■■ NessPRO Italy S.p.A.
Genoa 39-010-64201-224
Milan 39-02-2515181
Turin 39-011-5513-211
Japan■■ K.K. Ashisuto
Osaka 81-6-6373-7113
Tokyo 81-3-5276-5863
Jordan■■ Al-Hisn Al-Waqi (AHAW)
Riyadh, SA 996-1-4412664
Malaysia■■ Elite Software Technology Sdn Bhd
Kuala Lumpur 60-3-21165682
Norway■■ InfoBuild Norway
Oslo 47-48-20-40-30
Philippines■■ Beacon Frontline Solutions, Inc.
Makati City 63-2-750-1972
Poland/Central and Eastern Europe■■ InfoBuild SP.J.
Warsaw 48-22-657-00-14
Russian Federation■■ FOBOS Plus Co., Ltd.
Moscow 7-495-124-0810
Saudi Arabia■■ Al-Hisn Al-Waqi (AHAW)
Riyadh 996-1-4412664
Singapore■■
Automatic Identification Technology Ltd.
Singapore 65-6286-2922
South Africa■■
InfoBuild South Africa (Pty.) Ltd.
Gauteng 27-83-4600800
Fujitsu Services (Pty.) Ltd.
Johannesburg 27-11-2335911
South Korea■■
Unitech Infocom Co. Ltd.
Seoul 82-2-2026-3100
UVANSYS
Seoul 82-2-832-0705
Sweden■■ InfoBuild AB
Kista 46-735-23-34-97
Taiwan■■ Galaxy Software Services
Taipei 886-2-2586-7890
Thailand■■ Datapro Computer Systems Co. Ltd.
Bangkok 662-679-1927, ext. 200
Venezuela■■ InfoServices Consulting
Caracas 58-212-763-1653
Toll-Free NumberSales, ISV, VAR, and SI Partner Information■■
(800) 969-4636
* Training facilities are located at these branches.