engineering physics physics... · engineering physics ... to determine the thickness of a wire and...
TRANSCRIPT

ENGINEERING PHYSICS
LAB MANUAL
Year : 2016 - 2017
Subject Code : AHS105
Regulations : R16
Class : I B.Tech II Semester
Branch : AE / ME / CE
Prepared by
Dr. A Jayanth Kumar Dr. Rizwana Ms. Y Sowmya Professor Professor Assistant Professor
Freshman Engineering
INSTITUTE OF AERONAUTICAL ENGINEERING (AUTONOMOUS)
Dundigal – 500 043, Hyderabad

INSTITUTE OF AERONAUTICAL ENGINEERING (AUTONOMOUS)
Dundigal, Hyderabad - 500 043
CCeerrttiiffiiccaattee
This is to certify that it is a bonafied record of practical work done by
Sri/Kum. _____________________________________ bearing
the Roll No. ______________________ of ____________ class
_______________________________________ branch in the
Engineering Physics laboratory during the academic year
___________________ under our supervision.
Head of the Department Lecture In-Charge
External Examiner Internal Examiner

ENGINEERING PHYSICS LAB SYLLABUS
S. No. List of Experiments Page
No.
Date
Remarks
I Measurement of thickness of a wire and radius of a disc 1
II Determination of rigidity modulus of material of string - Torsional
pendulum. 4
III Magnetic field along the axis of current carrying coil - Stewart and
Gee’s method 6
IV Determining frequency of longitudinal waves 9
V Calculating frequency of transverse waves 11
VI Wavelength of laser source – difraction grating 13
VII Adjustments and minimum deviation in spectrometer 15
VIII Dispersive power of material of prism 17
IX Newton's rings - Radius of curvature of plano-convex lens 20
X Evaluation of numerical aperture of given fibre 23
XI V-I characteristics of LED 25
XII Study of L-I characteristics of laser diode 27

ENGINEERING PHYSICS LABORATORY
OBJECTIVE:
The objective of this lab is to teach students, the importance of physics through involvement in experiments. This
lab helps to have knowledge of the world due to constant interplay between observations and hypothesis, experiment
and theory in physics. Students will gain knowledge in various areas of physics so as to have real time applications
in all engineering streams.
OUTCOMES:
After completing this course the student must demonstrate the knowledge and ability to:
1. Understand the world around us.
2. Understand the concept of error and its analysis.
3. Develop experimental skills
4. Design new experiments in Engineering.
5. Compare the theory and correlate with experiment.
6. Identify the appropriate application of particular experiment.
7. Understand and apply fundamental electronic circuits.
8. Analyze the experimental result.
9. Understand the applications of physics experiments in day to day life.
10. Examine ideas about the real world.

INSTITUTE OF AERONAUTICAL ENGINEERING Dundigal, Hyderabad - 500 043
PROGRAM OUTCOMES
PO1 Engineering knowledge: Apply the knowledge of mathematics, science, engineering fundamentals, and an
engineering specialization to the solution of complex engineering problems.
PO2
Problem analysis: Identify, formulate, review research literature, and analyze complex engineering
problems reaching substantiated conclusions using first principles of mathematics, natural sciences, and
engineering sciences.
PO3
Design/development of solutions: Design solutions for complex engineering problems and design system
components or processes that meet the specified needs with appropriate consideration for the public health
and safety, and the cultural, societal, and environmental considerations.
PO4
Conduct investigations of complex problems: Use research-based knowledge and research methods,
including design of experiments, analysis and interpretation of data, and synthesis of the information to
provide valid conclusions.
PO5
Modern tool usage: Create, select, and apply appropriate techniques, resources, and modern engineering
and IT tools including prediction and modeling to complex engineering activities with an understanding of
the limitations.
PO6
The engineer and society: Apply reasoning informed by the contextual knowledge to assess societal,
health, safety, legal and cultural issues and the consequent responsibilities relevant to the professional
engineering practice.
PO7
Environment and sustainability: Understand the impact of the professional engineering solutions in
societal and environmental contexts, and demonstrate the knowledge of, and need for sustainable
development.
PO8 Ethics: Apply ethical principles and commit to professional ethics and responsibilities and norms of the
engineering practice.
PO9 Individual and team work: Function effectively as an individual, and as a member or leader in diverse
teams, and in multidisciplinary settings.
PO10
Communication: Communicate effectively on complex engineering activities with the engineering
community and with society at large, such as, being able to comprehend and write effective reports and
design documentation, make effective presentations, and give and receive clear instructions.
PO11
Project management and finance: Demonstrate knowledge and understanding of the engineering and
management principles and apply these to one’s own work, as a member and leader in a team, to manage
projects and in multidisciplinary environments.
PO12 Life-long learning: Recognize the need for, and have the preparation and ability to engage in independent
and life-long learning in the broadest context of technological change.

PROGRAM SPECIFIC OUTCOMES
AERONAUTICAL ENGINEERING
PSO1 Professional skills: Able to utilize the knowledge of aeronautical/aerospace engineering in innovative,
dynamic and challenging environment for design and development of new products.
PSO2
Problem solving skills: imparted through simulation language skills and general purpose CAE packages to
solve practical, design and analysis problems of components to complete the challenge of airworthiness for
flight vehicles.
PSO3 Practical implementation and testing skills: Providing different types of in house and training and industry
practice to fabricate and test and develop the products with more innovative technologies.
PSO4 Successful career and entrepreneurship: To prepare the students with broad aerospace knowledge to
design and develop systems and subsystems of aerospace and allied systems and become technocrats.
CIVIL ENGINEERING
PSO1 Graduates will have an ability to describe, analyze and solve problems using mathematics and systematic
problem-solving techniques.
PSO2
Graduates will have an ability to design a system, component or process to meet desired needs within
realistic constraints such as economic, environmental, social, political, ethical, health and safety
manufacturability and sustainability.
PSO3 Graduates will have a board education necessary to understand the impact of engineering solutions in a
global, economic and societal context.
PSO4 To provide graduates many post graduate educational and research opportunities at top universities and
research laboratories for its best engineering minds.
PSO5 Graduates will have an ability to function on multi disciplinary teams.
MECHANICAL ENGINEERING
PSO1
To produce engineering professional capable of analyzing and synthesizing mechanical systems including
allied engineering streams.
PSO2
An ability to adopt and integrate current technologies in the design and manufacturing domain to enhance the
employability.
PSO3 To build the nation, by imparting technological inputs and managerial skills to become technocrats.

ATTAINMENT OF PROGRAM OUTCOMES & PROGRAM SPECIFIC OUTCOMES
Expt.
No. Program Outcomes Attained
Program Specific Outcomes Attained
AERO CIVIL MECH
1 PO1, PO2, PO4, PO5, PO6, PO9, PO11, PO12 PSO1, PSO2, PSO3 PSO1, PSO2, PSO3, PSO5 PSO1, PSO2, PSO3
2 PO1, PO2, PO4, PO5, PO6, PO9, PO11, PO12 PSO1, PSO2, PSO3 PSO1, PSO2, PSO3, PSO5 PSO1, PSO2, PSO3
3 PO1, PO4, PO9, PO11, PO12 PSO1, PSO2, PSO3 PSO1, PSO2, PSO3, PSO5 PSO1, PSO2, PSO3
4 PO1, PO2, PO4, PO9, PO11, PO12 PSO1, PSO2, PSO3 PSO1, PSO2, PSO3, PSO5 PSO1, PSO2, PSO3
5 PO1, PO2, PO4, PO9, PO11, PO12 PSO1, PSO2, PSO3 PSO1, PSO2, PSO3, PSO5 PSO1, PSO2, PSO3
6 PO1, PO3, PO4, PO5, PO9, PO11, PO12 PSO1, PSO2, PSO3 PSO1, PSO2, PSO3, PSO5 PSO1, PSO2, PSO3
7 PO1, PO4, PO9, PO11, PO12 PSO1, PSO2, PSO3 PSO1, PSO2, PSO3, PSO5 PSO1, PSO2, PSO3
8 PO1, PO4, PO9, PO11, PO12 PSO1, PSO2, PSO3 PSO1, PSO2, PSO3, PSO5 PSO1, PSO2, PSO3
9 PO1, PO2, PO4, PO5, PO9, PO11, PO12 PSO1, PSO2, PSO3 PSO1, PSO2, PSO3, PSO5 PSO1, PSO2, PSO3
10 PO1, PO3, PO4, PO5, PO9, PO11, PO12 PSO1, PSO2, PSO3 PSO1, PSO2, PSO3, PSO5 PSO1, PSO2, PSO3
11 PO1, PO3, PO4, PO5, PO9, PO11, PO12 PSO1, PSO2, PSO3 PSO1, PSO2, PSO3, PSO5 PSO1, PSO2, PSO3
12 PO1, PO3, PO4, PO5, PO9, PO11, PO12 PSO1, PSO2, PSO3 PSO1, PSO2, PSO3, PSO5 PSO1, PSO2, PSO3

1
EXPERIMENT - I
MEASUREMENT OF THICKNESS OF A WIRE AND RADIUS OF A DISC
Aim:
To determine the thickness of a wire and radius of a disc using screw gauge and vernier calipers respectively.
Apparatus: A circular brass disc, steel wire, screw guage, and vernier calipers.
Figures:
Vernier calipers:
Procedure:
Vernier calipers:
First insert the circular disc in between the jaws of vernier calipers. The reading on a vernier caliper is a
combination of the value shown on the main scale and the value indicated on the sliding vernier scale. When taking
a measurement, first read the value on the main scale. The value on the main scale is the number immediately to the
left of the 0 marker of the vernier scale. When reading the vernier scale, identify the coincidence division of vernier
scale with the main scale division. To get total reading, multiply vernier coincidence division (VCD) with least
count (LC) of vernier and add this value to the main scale reading using the formula
Actual diameter = Main scale reading + (Least count × Vernier coicidence devision ).
Repeat the experiment at different positions of disc and then take average.
Observations:
To determine the radius of the disc:
Least count of the Vernier calipers = 𝑂𝑛𝑒 𝑚𝑎𝑖𝑛 𝑠𝑐𝑎𝑙𝑒 𝑑𝑖𝑣𝑖𝑠𝑖𝑜𝑛
𝑁𝑜.𝑜𝑓 𝑉𝑒𝑟𝑛𝑖𝑒𝑟 𝑠𝑐𝑎𝑙𝑒 𝑑𝑖𝑣𝑖𝑠𝑖𝑜𝑛𝑠 = 1 0.1 0.01
10
mmmm cm
S. No Main scale
reading
(a)
Vernier
coincidence
division
(VCD)
Vernier Reading
( b = LC × VCD )
Total Reading
(a+b) cm
Diameter D
Average diameter, D = cm
Radius of the disc R = (D / 2) = cm

2
Screw gauge:
Bring the fixed shaft (anvil) 'A' and movable shaft (screw) 'B' in contact with each other and find the error
as shown in the figure. Note down the correction with opposite sign. Move the screw away from the anvil and place
the wire in between both the shafts and move the screw towards the anvil A, using the ratchet head H. Stop when the
ratchet slips without moving the screw. Note the number of divisions on the pitch scale that is visible and uncovered
by the edge of the barrel. This reading is called the pitch scale reading(PSR). Note the number of the division of the
circular scale lying over the reference line. This gives Head scale reading (HSR). Error correction added to HSR
gives Corrected HSR (CHSR).
Final diameter of the wire given by the formula
Diameter of wire = PSR + (LC × CHSR).
Repeat the experiment at different positions of wire and then take average.
Observations:
To determine the radius of the wire:
Least count of the Screw Gauge = pitch of the screw
𝑁𝑜.𝑜𝑓𝐻𝑒𝑎𝑑𝑠𝑐𝑎𝑙𝑒 𝑑𝑖𝑣𝑖𝑠𝑖𝑜𝑛𝑠
10.01
100
mmmm
Screw Gauge Error =
Correction =
S. No
PSR
(a)
HSR
CHSR
Fraction
(b = LC × CHSR)
Total reading
Diameter of wire
(a+b) (mm)

3
Calculations:
Result:
The diameter of given wire, d = ________________cm.
The radius of a given wire = ________________cm.
Viva questions:
1. Define least count.
2. What is the value of least count of vernier calipers?
3. What is the value of least count of screw gauge?
4. Explain positive and negative zero error in screw guage.
5. What is positive correction in screw gauge?
6. Explain difference in usage of vernier calipers and screw gauge.

4
EXPERIMENT - II
DETERMINATION OF RIGIDITY MODULUS OF MATERIAL OF STRING - TORSIONAL
PENDULUM
Aim:
To determine the modulus of rigidity (η) of the material of the given wire using a Torsional pendulum.
Apparatus:
A circular brass disc provided with a chuck and nut at its centre, steel wire, a rigid clamp, stop watch, meter scale.
Principle:
Rigidity Modulus: η = 𝟒𝝅𝑴𝑹𝟐
𝒂𝟒 (𝒍
𝑻𝟐) dyne/cm2
M - Mass of the disc.
R - Radius of the disc.
a - Radius of the wire.
l - Length of the pendulum.
T - Time period.
Description:
The Torsional pendulum consist of a uniform circular metal disc of about 8 to 10cm diameter with 1 or 2cm
thickness, suspended by a wire at the centre of the disc as shown in figure. The lower end is gripped into another
chuck, which is fixed to a wall bracket.
Procedure:
The circular metal disc is suspended as shown in above figure. The length of the wire l between the chucks is
adjusted to 100cm. when the disc is in equilibrium position; a small mark is made on the curved edge of the disc.
This marking will help to note the number of oscillations made by slowly turning the disc through a small angle.
Care is to be taken to see that there is no lateral movement of the disc.
When the disc is oscillating the time taken for 20 oscillations is noted with the help of a stopwatch and recorded in
the observations table in trail 1. The procedure is repeated for the same length of the wire and again the time taken
for 20 oscillations is noted and noted as trail2 in the observation table. From trail 1 & 2 the mean time for 20
oscillations is obtained. The time period (T), i.e., the time taken for one oscillation is calculated.

5
The experiment is repeated by decreasing the length of the wire in steps of 10cm and the results are tabulated in the
table.
By using the Vernier calipers the radius of the disc (R) is calculated, the radius of the wire (a) is calculated by means
of screw gauge and the mass of the disc (M) is found by means of rough balance and these values are substituted in
the formula. The mean value of (l //T2) is calculated from the observations and hence η is determined.
A graph is drawn with ‘l’ on X-axis and T2 on Y-axis. It is a straight line graph and the value of (l/T2) is calculated
and the rigidity modulus of the material of the wire η is calculated.
Precautions:
1. The wire should not have any bending.
2. The chuck nuts should be tight because the wire becomes loose and the oscillations may not be perfect.
3. The time period between the oscillations must be uniform.
4. Galvanometer is an example of making use of the Torsional oscillations.
Observations:
Mass of the disc (M) =
Radius of the disc (R) =
Radius if the wire (a) =
Time Period of the Pendulum:
S. No
Length of the wire
‘l’ (cm)
Time taken for 20
oscillations
Time for one
Oscillation
(Timeperiod)
T=𝒕
𝟐𝟎
T2
𝒍
𝑻𝟐
Trail 1 Trail 2 Average(t)
Average l / T2 =
Result:
The rigidity modulus of the material of the given wire is _______________dyne/cm.
Viva questions:
1. What is Rigidity modulus?
2. What is unit of rigidity modulus?
3. Define stress.
4. What is unit of stress?
5. Define strain.
6. What is unit of strain?
7. State Hook's law.
8. Define time period.
9. What are factors that influence time period?

6
EXPERIMENT - III
MAGNETIC FIELD ALONG THE AXIS OF CURRENT CARRYING COIL – STEWART
AND GEE’S METHOD
Aim:
To determine the field of induction at several points on the axis of a circular coil carrying current using Stewart and
Gee’s type of tangent galvanometer.
Apparatus:
Stewart and Gee’s galvanometer, battery eliminator, ammeter, commutator, rheostat, plug keys, connecting wires.
Principle:
When a current of i-amperes exists through a circular coil of n-turns, each of radius a, the magnetic induction B at
any point(P) on the axis of the coil is given by
B = 𝛍₀𝐧𝐢𝐚𝟐
𝟐(𝐱𝟐+𝐚𝟐)𝟑/𝟐 ____________(1)
Where B is the magnetic induction on the axial line of the coil
B = 4π × 10-7 H/m (permeability of free space)
n is number of turns in the coil
i is the current through the coil
a is the radius of the coil (in cm)
x is the distance from the centre of the coil to the centre of the magnet (in cm)
When the coil is placed in the magnetic meridian, the direction of the magnetic field will be perpendicular to the
magnetic meridian; i.e., perpendicular to the direction f the horizontal component of the earth’s field; say Be
When the deflection magnetometer is placed at any point on the axis of the coil such that the centre of the magnetic
needle lies exactly on the axis of the coil, then the needle is acted upon by two fields B and Be, which are at right
angles to one another. Therefore, the needle deflects obeying the tangent law,
B = Be Tan Ɵ ______________(2)
B e the horizontal component of the earth’s field is taken from standard tables. The intensity of the field at
any point calculated from equation (2) and verified using equation (1).
Figure:

7
Procedure :
With the help of the deflection magnetometer and a chalk, a long line of about one meter is drawn on the working
table, to represent the magnetic meridian. Another line perpendicular to this line is also drawn. The Stewart and
Gee’s galvanometer is set with its coil in the magnetic meridian, as shown in the figure. The external circuit is
connected , keeping the ammeter, rheostat away from the deflection magnetometer. This precaution is very much
required because, the magnetic field produced by the current passing through the rheostat and the permanent
magnetic field due to the magnet inside the ammeter affect the magnetometer reading, if they are close to it.
The magnetometer is set at the centre of the coil and rotated to make the aluminum pointer read (0, 0) in the
magnetometer. The key, K, is closed and the rheostat is adjusted so as the deflection in the magnetometer is about
60o. The current in the commutator is reversed and the deflection in the magnetometer is observed. The deflection in
the magnetometer before and after reversal of current should not differ much. In case of sufficient difference say
above 2o or 3o , necessary adjustments are to be made.
The deflections before and after reversal of current are noted when d = 0. The readings are noted in Table 1. The
magnetometer is moved towards East along the axis of the coil in steps of 5 cm at a time. At each position, the key is
closed and the deflections before and after reversal of current is noted. The mean deflection be denoted as TanӨE.
The magnetometer is further moved towards east in steps of 5cm each time and the deflections before and after
reversal of current are noted, until the deflection falls to 30o.
The experiment is repeated by shifting the magnetometer towards west from the centre of the coil in steps of 5cm,
each time and deflections are noted before and after reversal of current. The mean deflection is denoted as TanӨW.
It will be found that for each distance (X) the values in the last two columns are found to be equal verifying equation
(1) and (2).
A graph is drawn between X on x-axis and the corresponding TanӨE and TanӨW along y-axis. The shape of the
curve is shown in the figure. The points A and B marked on the curve lie at distance equal to half the radius of the
coil (a/2) on either side of the coil.
Graph:
A B tan θw tan θE
(West) X (East) X
Precautions:
1. The ammeter, voltmeter should keep away from the deflection magnetometer because these meters will affect
the deflection in magnetometer.
2. The current passing through rheostat will produce magnetic field and magnetic field produced by
the permanent magnet inside the ammeter will affect the deflection reading.

8
Calculations:
Result :
The theoretical and calculated values are approximately same
Viva questions:
1. Define magnetic field induction.
2. Write units of magnetic field induction.
3. What is the principle behind the experiment?
S.No
Distance of
deflection
magnetometer
from centre of
the coil(X) in
meters
Deflection in the magnetometer East side Deflection in the magnetometer West side
θ=
𝜽𝒆
+𝜽
𝒘
𝟐
Ta
n θ
B=
Be
tan
θ
B=
𝝁₀
𝒏 𝒊
𝒂𝟐
𝟐(𝒙
𝟐+
𝒂𝟐
)𝟑𝟐⁄
Err
or
%
θ1
θ2
θ3
θ4
Mea
n 𝜽
e
Ta
n 𝜽
e
θ1
θ2
θ3
θ4
Mea
n 𝜽
w
Ta
n 𝜽
w
4. Define the tangent law.

9
EXPERIMENT - IV
DETERMINING FREQUENCY OF LONGITUDINAL WAVES
Aim:
To determine the frequency of a tuning fork in longitudinal mode using Melde’s arrangement.
Apparatus:
Melde’s arrangement, rheostat, plug keys, connecting wires, meter scale, thread, weight box, power supply.
Principle:
Frequency of tuning fork n = 1
𝑙√
𝑇
𝑚 Hz
m - Mass per unit length (or) linear density.
T - Tension= (M+m) × g.
l – Length of a single loop.
Procedure:
In longitudinal mode, the tuning fork is parallel to the vibrating thread. Set the Melde’s experiment in the
longitudinal mode of vibrations and note the observations in observation table for different lengths. Calculate the
frequency of the tuning fork by using the formula.
Observations:
Mass of the thread (w) = _____ gm, Length of the thread (y) = ______cm,
Mass of the pan (p) = ______ gm, Linear density (m) = ______ gm/cm .
S .No
Load
applied in
the
pan(M)gm
Tension
T=(M+p)g
No.
of
loops
(x)
Length
of the x
loops
(d)
Length of
the each
loop
l = 𝒅
𝒙
√𝑻 √𝑻
𝒍
nl = 𝟏
𝒍√
𝑻
𝒎
Average of n =

10
Precautions:
1. The thread should be uniform and inextensible.
2. Well defined loops should be obtained by adjusting the tension with milligram weights.
3. Frictions in the pulley should be least possible.
Calculations:
Result:
Frequency of the tuning fork in longitudinal mode ____________Hz.
Viva questions:
1. What is frequency?
2. What are standing waves?
3. Explain the difference between longitudinal and transverse waves.
4. What is Resonance?
11
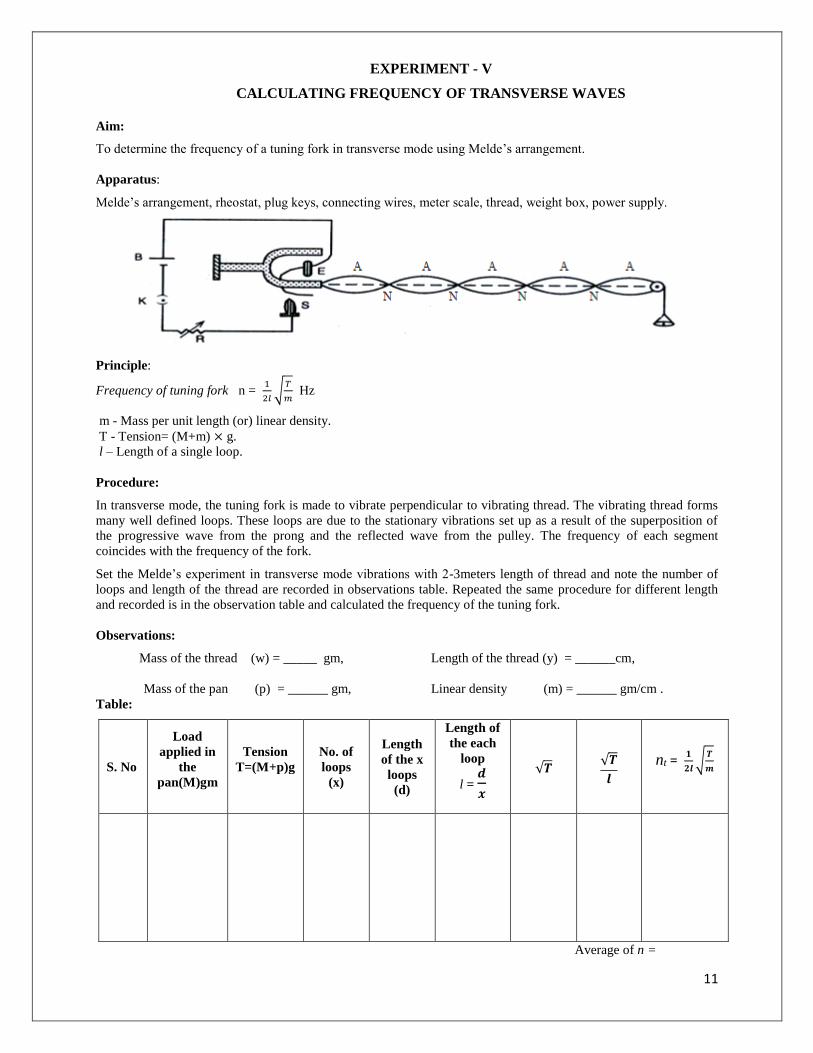
EXPERIMENT - V
CALCULATING FREQUENCY OF TRANSVERSE WAVES
Aim:
To determine the frequency of a tuning fork in transverse mode using Melde’s arrangement.
Apparatus:
Melde’s arrangement, rheostat, plug keys, connecting wires, meter scale, thread, weight box, power supply.
Principle:
Frequency of tuning fork n = 1
2𝑙√
𝑇
𝑚 Hz
m - Mass per unit length (or) linear density.
T - Tension= (M+m) × g.
l – Length of a single loop.
Procedure:
In transverse mode, the tuning fork is made to vibrate perpendicular to vibrating thread. The vibrating thread forms
many well defined loops. These loops are due to the stationary vibrations set up as a result of the superposition of
the progressive wave from the prong and the reflected wave from the pulley. The frequency of each segment
coincides with the frequency of the fork.
Set the Melde’s experiment in transverse mode vibrations with 2-3meters length of thread and note the number of
loops and length of the thread are recorded in observations table. Repeated the same procedure for different length
and recorded is in the observation table and calculated the frequency of the tuning fork.
Observations:
Mass of the thread (w) = _____ gm, Length of the thread (y) = ______cm,
Mass of the pan (p) = ______ gm, Linear density (m) = ______ gm/cm .
Table:
S. No
Load
applied in
the
pan(M)gm
Tension
T=(M+p)g
No. of
loops
(x)
Length
of the x
loops
(d)
Length of
the each
loop
l = 𝒅
𝒙
√𝑻 √𝑻
𝒍
nt = 𝟏
𝟐𝒍√
𝑻
𝒎
Average of n =

12
Precautions:
1. The thread should be uniform and inextensible.
2. Well defined loops should be obtained by adjusting the tension with milligram weights.
3. Frictions in the pulley should be least possible.
Calculations:
Result:
Frequency of the tuning fork in Transverse mode ____________Hz.
Viva questions:
1. Define nodes and anti-nodes.
2. Define resonance condition.
3. Explain the importance of Melde’s experiment.
4. Give some important application of Melde’s experiment.

13
EXPERIMENT - VI
WAVELENGTH OF LASER SOURCE – DIFRACTION GRATING
Aim:
To determine the wavelength of a given source of laser using a plane transmission grating.
Apparatus:
Plane diffraction grating, laser source, a scale and prism table.
Theory:
An arrangement consisting of large number of parallel slits of the same width and separated by equal opaque
space is known as the “diffraction grating” . A grating is constructed by rubbing equidistant parallel lines ‘N’ ruled
on the grating per inch are written over it.
2.54
.
Sin
n N
Where
λ is the wavelength of light.
N Lines per inch on the plane diffraction grating
n is the order of diffraction light.
Procedure:
A plane diffraction grating consists of parallel sides glass plates with equidistant fine parallel lines drown very
closely upon it by means of a diamond point. The number of lines drawn per inch is written on the diffraction
grating by the manufacturers like 15000 LPI or 25000 LPI. The laser system used in this experiment is
semiconductor laser.
Place the grating in front of the laser beam such that light incident normally on the grating. When a semiconductor
laser light incidents on the grating, the difraction pattern is produced on the other side of the it. This diffraction
pattern can be observed by arranging a screen at certain distance from the gratting. The diffraction pattern consists
of central maxima and secondary maxima. The secondary maxima in the diffraction pattern observed is on either
side of cetral maxima due to first order, second order and so on.
Now measure the distance between the grating and the screen and tabulate it as 'D' and the distance between central
maxima to first order on left side of central maxima as 'd1' and then central maxima and first order on right side of
central maxima as 'd2' and it is tabulated. Similarly, note down the raedings for second order on both sides of
central maxima.
Diagram:
14
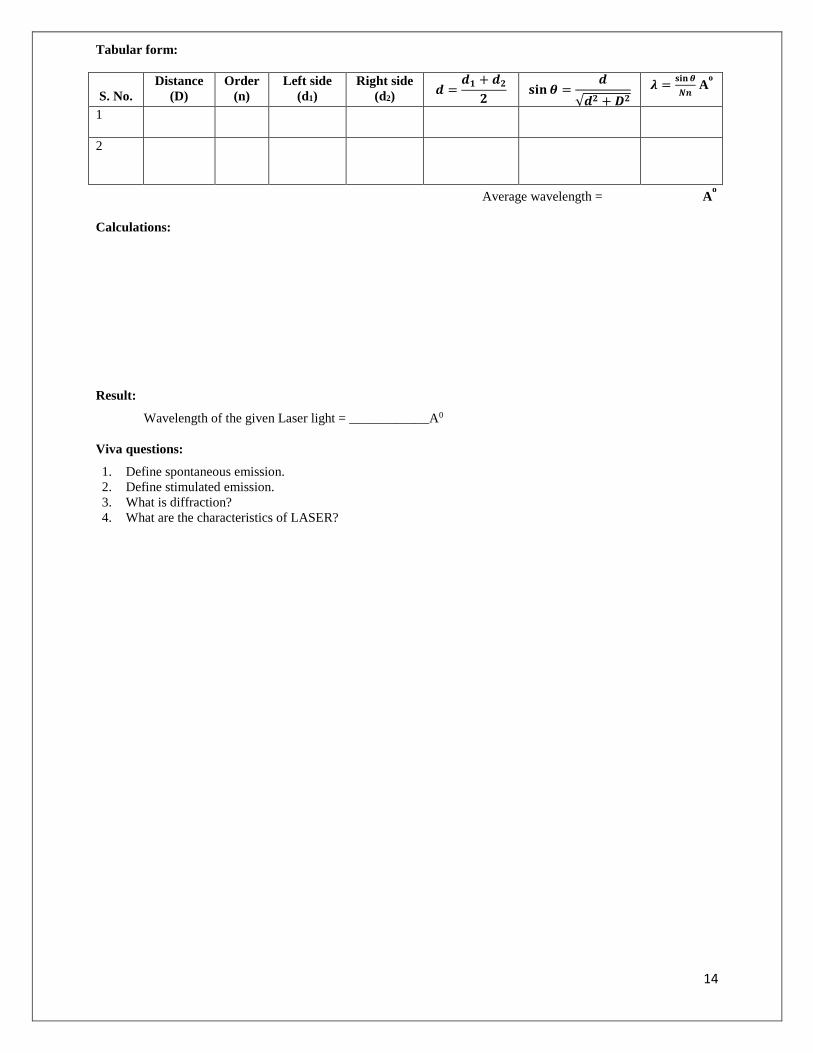
Tabular form:
S. No.
Distance
(D)
Order
(n)
Left side
(d1)
Right side
(d2) 𝒅 =
𝒅𝟏 + 𝒅𝟐
𝟐 𝐬𝐢𝐧 𝜽 =
𝒅
√𝒅𝟐 + 𝑫𝟐 𝝀 =
𝐬𝐢𝐧 𝜽
𝑵𝒏 A
o
1
2
Average wavelength = Ao
Calculations:
Result:
Wavelength of the given Laser light = ____________A0
Viva questions:
1. Define spontaneous emission.
2. Define stimulated emission.
3. What is diffraction?
4. What are the characteristics of LASER?

15
EXPERIMENT - VII
ADJUSTMENTS AND MINIMUM DEVIATION IN SPECTROMETER
Aim:
To study about spectrometer and its parts and to adjust spectrometer in minimum deviation position.
Apparatus:
Spectrometer, prism, mercury vapor lamp, table lamp, reading lens.
Introduction:
A spectrometer is an optical instrument used to measure the properties of light over visible region of electromagnetic
spectrum. It is also used for the study the spectra, produced by prism & grating for the measurement of the
dispersive powers, wavelengths of the spectral lines, the refractive indices of transparent solids and liquids etc.
The spectrometer includes, following parts;
Collimator:
It consists of a horizontal tube of variable length with an adjustment slit (S) at one end and a convex lenses at the
other. The collimator is rigidly fixed to the main part of the instrument. If a source of light, like an arc lamp or
sodium lamp is placed closed to slit S, a parallel beam of light will emerge from the other side of collimator. The
collimator is fitted with 6 mm long slit of adjustable width. The slit width width has to be adjusted as a thin line. The
distance between convex lens and the slit can be varied and adjusted equal to the focal length of the convex lens of
collimator using the rock and pinion screw provided on collimator.
Telescope:
It is an astronomical telescope fitted with a Ramsden’s eye-piece (consists of two Plano-convex lenses) and cross-
wires. When a parallel beam of light coming out of the prism falls on the objective, the spectrum is produced can be
viewed through the eye-piece. To make the image clear without blurring, the distance between objective and eye-
piece can be adjusted properly by adjusting the rock and pinion screw provided on telescope. The cross-wire can be
made to coincide with any spectral line and corrosponding on circular scale of the spectrometer can be noted.
Spectrometer
Rotating Bases:
The telescope and the spectrometer table are mounted on, independently rotating bases. The vernier scale provide
measurement of the relative position of these bases to within 1 minute of arc. The rotation of each base is controlled
with a lock-screw and a fine adjustment knob. With the tight lock-screw, the fine adjust knob can be used for more
precise positioning.
Spectrometer table:
The spectrometer table is fixed to its rotating base with a thumb-screw , so the table height is adjustable. Three
leveling screws on the underside of the table used to adjust the optical alignment of the instrument. The table must

16
be leveled with respect to the optical axes of the collimator and the telescope, if the diffracting element is to retain
it's alignment for all positions of the telescope. Thumb-screws are used to attach the prism clamp and the grating
mount to the table, and reference lines are etched in the table for easy alignment.
Circular scale:
The circular scale has 0o to 360
o, with each degree divided in to half degree again. There are two windows povided
to observe the reading. The circular scale is also provided with a vernier 30 divisions on it
Procedure:
1. Adjustment of spectrometer: The following essential adjustments are to be made step by step in a spectrometer experiment :
Alignment : In the first step, you must see the alignment of the axis of the telescope with hat of collimator , so
that they must intersect with the principal vertical axis of the telescope.
Adjustment of telescope and collimator for parallel light : The telescope is firstly directed towards a ‘bright
object’ like lamp globe or the sky. The eye-piece is adjusted so that the cross wire became as sharp as possible,
when some one see through it. This fixes position of eye-piece relative to the cross wires. The telescope is turned
towards the collimator, with it’s Slit illuminated with a monochromatic source of light. The collimator slit is then
adjusted, until a direct image of the slit falls on the ‘cross wires’. Now the instrument is then adjusted, so that
parallel rays passes from the collimator to the telescope.
Leveling the prism table : Place the spirit level at the center of the prism table , parallel to the line joining two
of the leveling screws of the prism-table. Bring the air bubble of the spirit level, at the centre by turning these
two screws in the opposite directions. Place the spirit level perpendicular to the line joining the two screws and
get the bubble at the centre by adjusting the third screw, whichmakes the top of the prism table horizontal.
Adjusting cross wires and focusing image : First of all, rotate the telescope towards any illuminated
background. On looking through the eye-piece, you will found the cross wires appear blurred. Now move the
eye-piece inwards the and outwards until the cross wires appears to be distinct. Now place the telescope in line to
the collimator and look into the eye- piece, without any accumulation in the eye. (The image of the slit may
appeared blurred) Make the image very sharp by turning the focusing knob of the telescope and also of the
collimator. If the image does not appear vertical, then make it vertical by turning the slit in it’s own plane. Adjust
the width of the slit to get an image of the desired intensity.
2. Measurement of angle of minimum deviations : Place the prism so that its centre should coincides with the centre of the prism-table and the light falls on, one of
the polished faces and emerged out of the other polished faces after refraction. In this position the spectrum of
light can be obtained.
Since the spectrum is seen through the telescope and telescope is adjusted for minimum deviation position for a
particular color (or wavelength) in the way give here- Set up telescope of a particular color and rotate the prism-
table in one direction, the telescope should moved in such a way that to keep the spectral line in view. By doing
this, a position will come spectral line recede in opposite direction although the rotation of the table is continue
in the same direction. Now the particular position, where the spectral line begins to recede in opposite direction
is the minimum deviation position for that color. Note the reading of the two verniers. Remove the prism-table
and bring the telescope in,the line of collimator .Now see the slit directly through the telescope and coincide the
image of slit with vertical cross-wire. Again, note the reading of the two verniers.
The difference between the minimum deviation position, and the direct position gives rise to the angle of
minimum deviation for that color.
Repeat the same procedure to obtain the angles of minimum deviation for other colors.
Result:
The least count of spectrometer is ________________.
The basic adjustments of the spectrometer are made and minimum deviation positon in spectrometer is
identified.
Viva questions:
1. What do you understand by minimum deviation?
2. What is the least count of spectrometer?
3. Which eye piece is used in the telescope of spectrometer?
4. Does the angle of minimum deviation vary with the colour of light?
5. What is the function of collimator?

17
EXPERIMENT - VIII
DISPERSIVE POWER OF A MATERIAL OF PRISM
Aim:
To determine the dispersive power of the material of the given prism.
Apparatus:
Spectrometer, prism, mercury vapor lamp, reading lens.
Principle:
The Refractive Index of the material of the prism is given by
μ= 𝐬𝐢𝐧 (
𝑨+𝑫
𝟐)
𝐬𝐢𝐧 (𝑨
𝟐)
For Red color
𝝁𝑹= 𝐬𝐢𝐧 (
𝑨+𝑫𝑹𝟐
)
𝐬𝐢𝐧 (𝑨
𝟐)
For Blue color
𝝁𝑩= 𝐬𝐢𝐧 (
𝑨+𝑫𝑩𝟐
)
𝐬𝐢𝐧 (𝑨
𝟐)
Where 𝐷𝑅 and 𝐷𝐵 are angle of minimum deviations of red and blue colors.
Dispersive power of the prism is
𝝎 =𝝁𝑩−𝝁𝑹
𝝁−𝟏
Where μ = average refractive index of blue and red colors.
i.e; μ = 𝝁𝑩+𝝁𝑹
𝟐
Description:
Spectrometer setup:
• Check the prism table horizontally aligned or not with the help of spirit level.
• Position the instrument so that the telescope can be pointed at some distant object and adjust the eyepiece
of the telescope, until the cross wires are in focus and focus on the distant object. When you have
apparently got the image of the cross wires located at this distance comfortable for the eyes. Do not disturb
the spectrometer adjustment.
• Position the instrument on laboratory optical bench ensure that we can see through the telescope when it is
at least 600 to either side of the principal axis of the collimator.
• Position a discharge lamp close to the slit at the end of collimator and make sure the slit is narrow, sharp
and bright. Adjust the collimator only until the slit image is in focus.
• Rotate the telescope so that it focus the collimator and observe the slit image and adjust the slit width its
image is just wider than the cross wire.
• Determine the least count of the Vernier.

18
First the basic adjustments of the spectrometer are made:
Measurement of minimum angle of deviation Dmin:
• Rotate the prism table and telescope until light will pass symmetrically through the prism.
• Locate the position of spectrum in the field of telescope.
• Looking at the spectrum rotate the prism table until the position of minimum deviation (Dmin) is achieved.
Minimum deviation is obtained by slowly moving the prism table to one direction, the spectrum also moves
in the same direction. But at a certain point the spectrum reverses (Dmin) its direction is called minimum
deviation.
• Fix the table in the stationary position, so that the spectrum will not deviate from its minimum deviation
position, and use the slow motion screw fitted to the telescope to set the cross wires accurately on the
centre of required color and the reading = A.
• Take direct ray reading by making telescope in line with the collimator and record as B.
The readings (A-B) will give the angle of minimum deviation.
Observation:
Least count of the Vernier of the spectrometer =
Angle of the prism (A) =
Direct ray reading : Vernier 1, V1 =
Vernier 2, V2 =
S.
No
Colour
of the
line
Reading corresponding
to minimum deviation
position
Angle of minimum deviation = (direct reading) -(Reading of
the minimum deviation position)
Vernier 1
V1'
Vernier 2
V2'
Vernier 1
V1' ~ V1
Vernier 2
V2' ~ V2
Average
D
Refractive
index
Dispersive
power
ω
1
Blue DB= μB=
μ=
2
Red DR= μB=

19
Precautions:
1. Don’t touch polished surface of the prism with hands to avoid finger prints.
2. Use reading lens with light while taking the readings in Vernier scale.
3. The mercury light should be placed inside a wooden box.
Calculations:
Result:
Dispersive power of the material of the given prism ω = ______________.
Viva questions:
1. What is Dispersion?
2. Define dispersive power.
3. Define Refractive Index of a material.
4. On what factors, the dispersive power depends?
5. How refractive index vary with wavelengths?

20
EXPERIMENT - IX
NEWTON'S RINGS - RADIUS OF CURVATURE OF PLANO-CONVEX LENS
Aim:
To determine radius of curvature of plano convex lens using sodium light by forming Newton’s rings.
Apparatus:
Travelling microscope, sodium vapour lamp, plane convex lens, plano convex lens, a thin glass plate and a
magnifying glass.
Principle:
λ - Wave length of sodium light
R - Radius of curvature of the of Plano convex lens.
Dm - Diameter of the mth ring.
Dn- Diameter of the nth ring.
Description:
A black paper is laid on the base of the travelling microscope over which the thick glass plate is placed. Over this
thick glass plate, a plano convex lens is placed. A parallel beam of light from the sodium lamp is made to fall on the
glass plate which is inclined at 450 with the horizontal, as shown in the figure 1. The beam of light is reflected on to
the setup made by means of a glass plate. As a result of interference between the light reflected from the lower
surface of the lens and the top surface of the thick glass plate. Concentric rings, called Newton’s rings, with alternate
bright and dark rings, having a central black spot are seen through the microscope shown in figure2. The microscope
is focused properly so that the rings are in sharp focus. The rings so formed are not to be disturbed till the
experiment is completed.
Procedure:
The point of intersection of the cross wires in the microscope is brought to the centre of the ring system. The wire is
set tangential to any one ring, and starting from the centre of the ring system, the microscope is moved on to one
side; say left, across the field of view counting the number of rings. Now the cross wires are set at 30 th ring and the
reading on the microscope scale is noted, using a magnifying glass. Similarly, the readings with the cross wires set
on 25th, 20th, 15th, 10th dark rings are noted. The microscope is moved in the same direction and the readings
corresponding to 10th, 15th, 20th, 25th, 30th dark rings on the right side are noted. The readings are tabulated in the
observation table.
A graph is drawn with the number of rings on X-axis and the square of diameter of the rings on Y-axis. The nature
of the graph is a straight line as shown in figure3. From the graph, the values of and Dn2 corresponding to m and n
values are noted. The slope of the graph is calculated from the formula, using these values the wave length of
sodium light is calculated.
Experimental set-up:

21
Graph:
Observations:
S.no
Ring
number
(n)
Microscope reading
D2
On the
left side
(a)
On the
right side
(b)
Diameter of the
ring
D = (a - b)
Slope of the straight line
2 2
2 1
2 1
D D
n n
Radius of curvature, 4
SlopeR
λ = Wavelength of sodium light = 5890 Ao.

22
Precautions:
1. Wipe the lens and the glass plates with cloth before starting the experiment.
2. The centre of the rings must be dark.
3. Use reading lens with light while observing the readings.
4. Before starting the experiment make sure that the movement of microscope in both sides of the rings.
Calculations:
Result:
The radius of curvature of plano convex lens is _______________cm.
Viva questions:
1. What is Interference?
2. How Newton’s rings are formed?
3. What is the least count of travelling microscope?
4. Why the central spot is dark?
5. Define radius of curvature of lens.
23
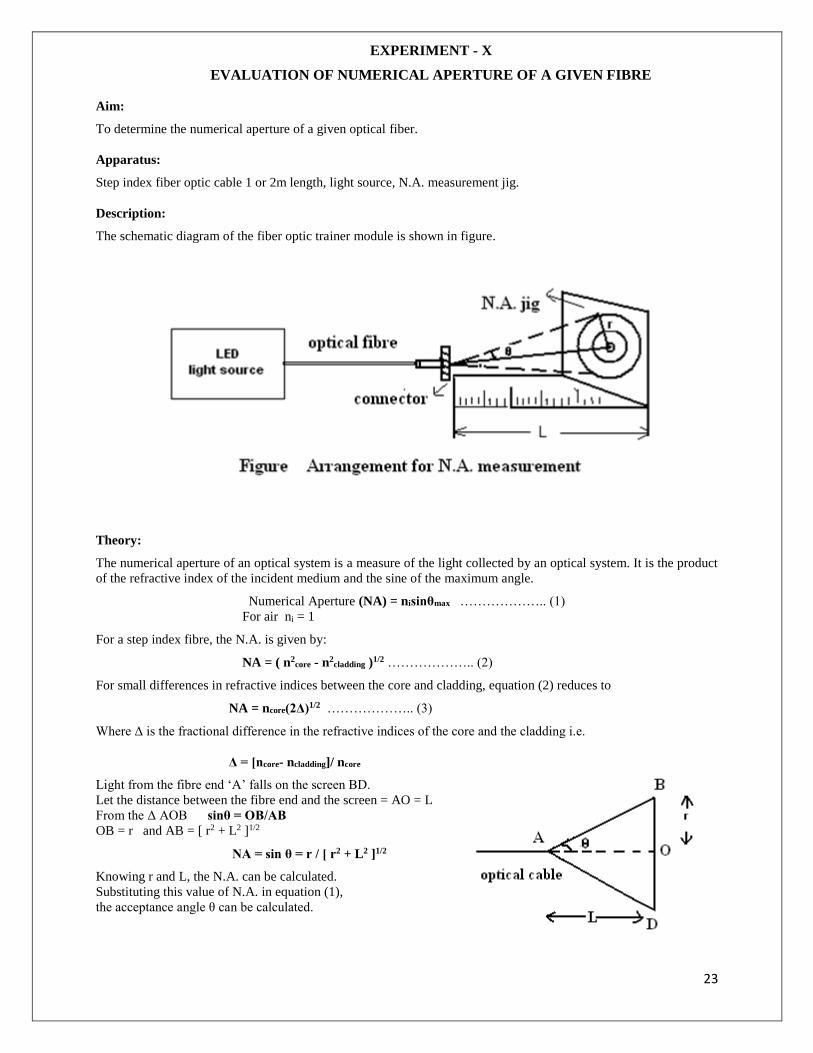
EXPERIMENT - X
EVALUATION OF NUMERICAL APERTURE OF A GIVEN FIBRE
Aim:
To determine the numerical aperture of a given optical fiber.
Apparatus:
Step index fiber optic cable 1 or 2m length, light source, N.A. measurement jig.
Description:
The schematic diagram of the fiber optic trainer module is shown in figure.
Theory:
The numerical aperture of an optical system is a measure of the light collected by an optical system. It is the product
of the refractive index of the incident medium and the sine of the maximum angle.
Numerical Aperture (NA) = nisinθmax ……………….. (1)
For air ni = 1
For a step index fibre, the N.A. is given by:
NA = ( n2core - n2
cladding )1/2 ……………….. (2)
For small differences in refractive indices between the core and cladding, equation (2) reduces to
NA = ncore(2Δ)1/2 ……………….. (3)
Where Δ is the fractional difference in the refractive indices of the core and the cladding i.e.
Δ = [ncore- ncladding]/ ncore
Light from the fibre end ‘A’ falls on the screen BD.
Let the distance between the fibre end and the screen = AO = L
From the Δ AOB sinθ = OB/AB
OB = r and AB = [ r2 + L2 ]1/2
NA = sin θ = r / [ r2 + L2 ]1/2
Knowing r and L, the N.A. can be calculated.
Substituting this value of N.A. in equation (1),
the acceptance angle θ can be calculated.

24
Procedure:
1. LED is made to glow by applying about 1.5 V DC power supply.
2. Light is allowed to propagate through an optical fiber cable whose NA is to be determined.
3. The output is screened on a concentric circles of known diameter is placed at a distance of 1, 2, 3, 4 and 5 cm
and corresponding radius of the concentric circles is noted.
4. The experiment is repeated for different lights.
Observations:
S.No. L (mm) r (mm) N.A. = r / [ r2 + L2 ]1/2 θ (degrees)
Applications:
1. Optical fibers may be used for accurate sensing of physical parameters and fields like pressure, temperature and
liquid level.
2. For military applications like fiber optic hydrophones for submarine and underwater sea application and
gyroscopes for applications in ships, missiles and air craft’s.
Calculations:
Result:
The NA of the optical fiber is …………………….
The Acceptance angle θ is ……………………..

25
EXPERIMENT - XI
V-I CHARACTERISTICS OF LED
Aim:
To study the V-I characteristics of light emitting diode and find the Threshold voltage and forward resistance of
LED.
Apparatus:
Light emitting diode, 0-5V variable Supply, 0-10v Voltmeter, 0-50mA DC Ammeter.
Theory:
In a PN junction charge carrier recombination takes place when the electrons cross from the N-layer to the P-layer.
The electrons are in the conduction band on the P-side while holes are in the valence band on the N-side. The
conduction band has a higher energy level compared to the valence band and so when the electrons recombine with
a hole the difference in energy is given out in the form of heat or light. In case of silicon or germanium, the energy
dissipation is in the form of heat, whereas in case of gallium-arsenide and gallium phosphide, it is in the form of
light. This light is in the visible region. Germanium and silicon, which have Eg about 1ev cannot be used in the
manufacture of LED. Hence Gallium arsenide, Gallium phosphide which emits light in the visible region are used to
manufacture LED.
Procedure for V-I Characteristics:
1. Connect the Light emitting diode as shown in figure.
2. Slowly increase forward bias voltage in steps of 0.1 volt.
3. Note the current passing through the LED.
4. Do not exceed 30mA current.
5. Plot a graph of light emitting diode
6. Voltage vs light emitting diode current.
Circuit diagram:
Model graph:

26
Observations:
Calculations:
Result :
V-I characteristics of given LED are studied.
Calculated Threshold Voltage Vth = ________V.
Forward Resistance Rf = _______Ω.
Viva questions:
1. What is forward biased diode?
2. What are p-type and n-type semiconductors?
3. Define threshold voltage.
4. What is depletion layer?
S. No. Voltage (Volts) Current (mA)
S. No. Voltage (Volts) Current (mA)
27
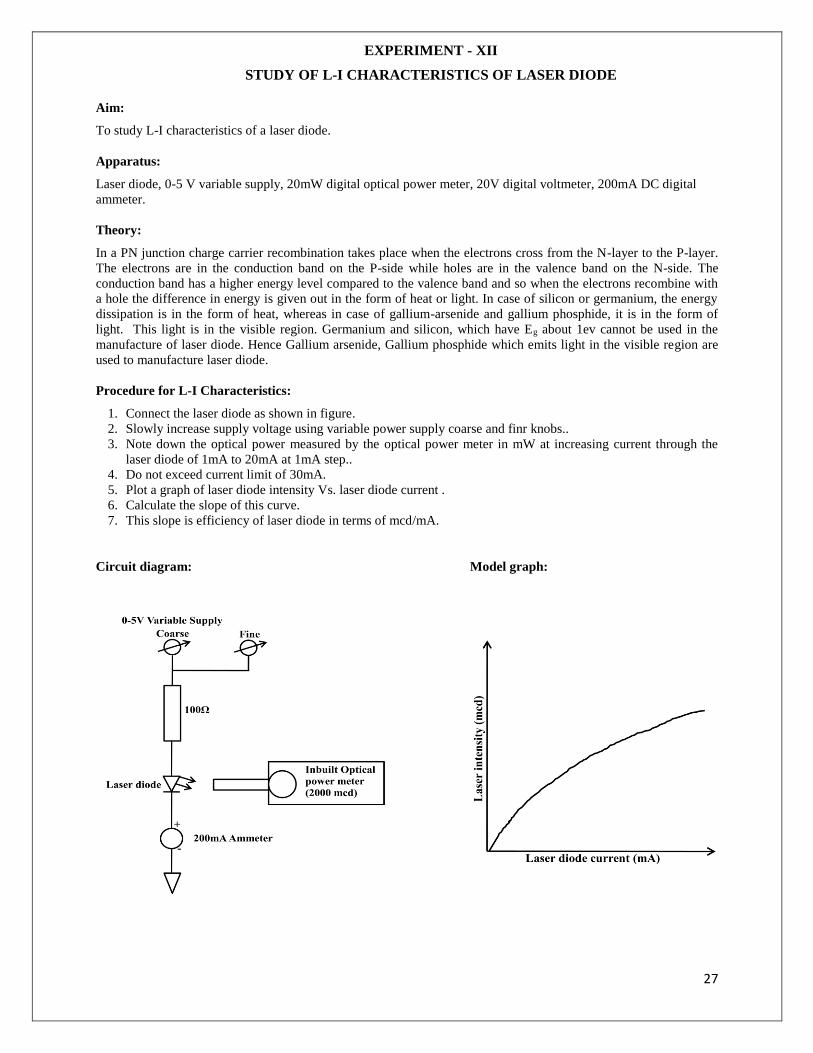
EXPERIMENT - XII
STUDY OF L-I CHARACTERISTICS OF LASER DIODE
Aim:
To study L-I characteristics of a laser diode.
Apparatus:
Laser diode, 0-5 V variable supply, 20mW digital optical power meter, 20V digital voltmeter, 200mA DC digital
ammeter.
Theory:
In a PN junction charge carrier recombination takes place when the electrons cross from the N-layer to the P-layer.
The electrons are in the conduction band on the P-side while holes are in the valence band on the N-side. The
conduction band has a higher energy level compared to the valence band and so when the electrons recombine with
a hole the difference in energy is given out in the form of heat or light. In case of silicon or germanium, the energy
dissipation is in the form of heat, whereas in case of gallium-arsenide and gallium phosphide, it is in the form of
light. This light is in the visible region. Germanium and silicon, which have Eg about 1ev cannot be used in the
manufacture of laser diode. Hence Gallium arsenide, Gallium phosphide which emits light in the visible region are
used to manufacture laser diode.
Procedure for L-I Characteristics:
1. Connect the laser diode as shown in figure.
2. Slowly increase supply voltage using variable power supply coarse and finr knobs..
3. Note down the optical power measured by the optical power meter in mW at increasing current through the
laser diode of 1mA to 20mA at 1mA step..
4. Do not exceed current limit of 30mA.
5. Plot a graph of laser diode intensity Vs. laser diode current .
6. Calculate the slope of this curve.
7. This slope is efficiency of laser diode in terms of mcd/mA.
Circuit diagram: Model graph:

28
Observations:
Calculations:
Result :
L-I characteristics of given Laser diode are studied.
Viva questions:
1. What is Laser, explain?
2. What is the difference between laser light and ordinary light?
3. Explain basic principle involved in the laser.
4. What are the applications of laser?
S. No. Current (mA) Intensity (mcd)