engineering failure analysis - auburn university
TRANSCRIPT

Engineering Failure Analysis 16 (2009) 944–963
Contents lists available at ScienceDirect
Engineering Failure Analysis
journal homepage: www.elsevier .com/locate /engfai lanal
Reliability and life study of hydraulic solenoid valve.Part 2: Experimental study
S.V. Angadi a, R.L. Jackson a,*, Song-yul Choe a, G.T. Flowers a, J.C. Suhling a,Young-Kwon Chang b, Jung-Keol Ham b, Jae-il Bae c
a Department of Mechanical Engineering and NSF Center for Advanced Vehicle Electronics (CAVE), Auburn University, Auburn, AL 36849, USAb Korea Testing Laboratory, Seoul, South Koreac Kefico Corporation Gyeonggi-Do, Korea
a r t i c l e i n f o a b s t r a c t
Article history:Received 3 July 2008Accepted 2 August 2008Available online 15 August 2008
Keywords:Automotive failuresFailure mechanismLife assessmentThermal expansionValve failures
1350-6307/$ - see front matter � 2008 Elsevier Ltddoi:10.1016/j.engfailanal.2008.08.012
* Corresponding author. Tel.: +1 334 844 3340; faE-mail address: [email protected]
This work studies the reliability of a solenoid valve (SV) used in automobile transmissionsthrough a joint theoretical and experimental approach. The goal of this work is to useaccelerated tests to characterize SV failure and correlate the results to new comprehensivefinite element models (Part 1).
A custom test apparatus has been designed and built to simultaneously monitor andactuate up to four SVs. The test apparatus is capable of applying a controlled duty cycle,current and actuation frequency. The SVs are also placed in a thermal chamber so thatthe ambient temperature can be controlled precisely. The apparatus measures in real-timethe temperature, current, and voltage of each SV. A series of tests have been conducted toproduce repeated failures of the SV. The failure of the SV appears to be caused by overheat-ing and failure of the insulation used in the solenoid coil. The current tests are run at a100 �C ambient temperature, 16.8 V of average peak voltage, 50% duty cycle, and 60 Hzactuation frequency. Upon failure, the solenoid electrical resistance drops to a significantlylower value due to shorting of the solenoid coil. This drop in resistance causes a measur-able and noticeable increase in the average current. The insulation also melts and exitsthe SV. Hence, increasing ambient temperature and current is believed to cause a decreasein SV reliability.
� 2008 Elsevier Ltd. All rights reserved.
1. Introduction
A solenoid valve (SV), an electromechanical device, controls the gas or liquid flow by changing position of valve when anelectric current is passed through a solenoid coil. It is well known that solenoid valves find use in wide range of industriessuch as automobile industry, aerospace industry, nuclear power plant industry, and agricultural industry. In nuclear engi-neering applications, the valves are often situated in extreme conditions [1].
Based on an extensive literature search, the most common failures seen in solenoid valves are due to either overpoweringand eventual overheating of the valves, or wearing out of the valve components.
In the automotive field, the solenoid valves are used as actuators and to control fluid pressure. The types of solenoidvalves that are used are ‘idle speed control valves, shift control valves of automatic transmissions and torque converterlocked-up control valves’ [2]. Hydraulic circuits are controlled by solenoid valves through drain opening and closing forhigh pressure hydraulic fluid. A few examples of automotive applications include the automatic power transmission, the
. All rights reserved.
x: +1 334 844 3307.(R.L. Jackson).

S.V. Angadi et al. / Engineering Failure Analysis 16 (2009) 944–963 945
automobile brake system, the boom control in an agricultural vehicle, and the hydraulic pump swash plate position control[3]. Solenoid valves are found in the hydraulic compact unit (HCU) of hydraulic power brake (HPB) systems and anti-lockbrakes (ABS) [4–8]. An automatic transmission is often controlled by the transmission control module (TCM) which employssolenoid valves to control the transmission fluid flow to clutches [9–14].
Solenoid valves are also used in a wide variety of other commercial, domestic and military applications which requirecontrolled motion. Some of these additional applications are: Commercial laundry equipment and facilities, commercialdishwashers, car and truck wash facilities, irrigation systems, humidification, water treatment, poultry incubators/wateringequipment, and industrial maintenance, repair, and operation [15].
SV operation can generate large amounts of heat as a result of high duty cycles and electrical resistance (that is, highapplied currents) thereby causing it to fail due to thermal effects and the accompanying wear of its parts. In the Part 2 paper,the multi-physics finite element solenoid valve model predictions obtained in the Part 1 paper are used to obtain a testingmethod and the model predictions are verified experimentally through testing a series of hydraulic solenoid valves, used inautomobile transmissions.
Based on an extensive literature search, it appears that the published literature on solenoid valves’ modeling and exper-iments is surprisingly scarce. However, the existing literature does provide guidance as to common problems seen in sole-noid valves and the environmental and operating parameters which influence them. This information can then be used todesign an experiment which can be used to map the failure and reliability of the solenoid valve researched in this study.
Probably, the most extensive work on solenoid valve reliability is provided by Mercer [16]. Mercer [16] provides a verythorough table which lists and maps the different parameters which influence solenoid valve performance and failure. Sev-eral critical factors that affect the reliability or failure of a ‘two-way, direct acting, normally closed, packless solenoid valve’[16] are structural collapse related to material strength, fluid flow rate, component misalignment, broken spring related tofatigue strength, stroke, component misalignment, coil burnout related to mains voltage and frequency, stroke, spring force,frequency of operation, fluid temperature, aging of insulation, etc. [16]. Failure of solenoid valves can also occur graduallydue to wear, leakage, noise, loss of speed as well as pressure rating.
Solenoid valves are known to exist commercially now for about 70 years and only with a higher expenditure and invest-ment in characterizing solenoid performance can enhanced reliability be achieved. One of the major problems associatedwith the reliability of SVs is over-design whose effect can be just as strong as under-design of a solenoid valve. The functionof a core spring in a solenoid valve is to shut the SV with respect to the pressure of the fluid. However, when a solenoid isover-designed, a highly powerful solenoid is required to overpower a spring that is designed to be too stiff. This requires theuse of a larger coil which will generate larger amounts of heat via Joule heating, thereby decreasing the insulation’s expectedworking life [16].
Baker [17] also provides some practical advice on installing and using solenoids effectively. He points out that a very com-mon problem is solenoid burnout and it is usually the result of a valve being used for conditions it was not designed for.Providing too little or too much voltage to a solenoid valve can both result in overheating of the solenoid valve. In addition,heat can be generated due to higher cycling rates and duty cycles. Sometimes a blocked or stuck armature can overheat sincepower is continuously applied in attempt to free it.
Slightly more recently, Rustagi and Heilman [1] also gave suggestions on how to achieve longer and more reliable sole-noid valve operation, especially for application in nuclear energy facilities. In this critical application, reliability becomesmuch more important. In addition, it can be very difficult to replace or repair solenoid valves due to their location in con-taminated areas. Similar to the other works, Rustagi and Heliman state that overheating of the coil can be a cause of failure.Therefore, in long-term continuous cycles the voltage is often reduced to prevent excess heat generation. In addition, sealfailure and rupture were also seen as a potential problem.
As previously discussed, solenoid valves may fail for a number of different reasons such as manufacturing defects, impro-per design, and improper selection for application. The specific mode of failure depends greatly on the original cause and theoperating conditions. The following is a collected list of the various failures seen in solenoid valves:
1. ‘Sticking’ problem as a result of residual magnetism [16].2. Structural collapse, coil burnout and broken spring [16,17].3. Solenoid’s coil efficiency and thus the flux density and torque output are lowered owing to heat buildup due to appli-
cation of constant voltage to the solenoid [15].4. The valve fails to open when the solenoid is energized due to low voltage at solenoid [17], solenoid failure, worn rings,
and pressure drop [15].5. The valve fails to close when the solenoid is de-energized due to bending of piston ring, foreign matter lodged on body
seat and preventing plunger from seating, plunger tip is severely worn [15].6. High duty cycles will cause the solenoid to use more power which will lead to temperature rise [15,17].7. Due to the SV being run for longer periods at high temperature, there is thermal expansion and accompanying thermal
deformations [17].8. Wear and friction of SV components cause degradation of performance and finally failure [18]. Friction can also cause
more power to be used (high temperature) [15].9. Elevated temperatures and wear can also cause the seals to leak [15].
10. Effect of varying (that is, increasing) duty cycle and frequency on SV operation.

946 S.V. Angadi et al. / Engineering Failure Analysis 16 (2009) 944–963
11. If the SV is operated at a higher than rated current, the Joule heating can cause the operating temperature to increase,which then can cause other problems in the SV.
12. Thermal cycling effects can age the materials of the SV [16].
This work focuses mostly on the thermo-mechanical failure mechanisms of the solenoid valve. It should also be noticedthat in many cases these various failure mechanisms do not occur independently. Several mechanisms may be initiated orprogressed due to the occurrence of another mechanism. For instance, the Joule heating could cause the solenoid tempera-ture to rise significantly. The seals in the solenoid could then degrade due to the elevated temperatures, then causing thesolenoid to leak and perhaps fail.
2. Experimental methodology
In order to monitor and evaluate solenoid valve failure, a solenoid valve experimental test rig or apparatus was designedand fabricated. The apparatus is capable of testing four SVs simultaneously. The solenoid valves are also placed in a thermalchamber to control the ambient temperature. The solenoids are powered and actuated in a controlled manner while the cur-rent, voltage and temperature are being measured. Both before and after the test on each solenoid valve the electrical resis-tance is measured directly using a multimeter. The goal of the apparatus is to be able to apply sufficient loadings on the SV tocause failure similar to that seen in application. When the SVs do fail, a significant change in the measured temperature andelectrical resistance is expected. An accelerated testing procedure will be used to create tests which cause SV failure in areasonable amount of time. The chosen tests are also based on the results of the multi-physics finite element model ofthe solenoid valve that is discussed in Part 1 of this work.
The tested solenoid valve is a normally open, three-way valve. The operating conditions are given in Table 1. To acceleratethe tests and reduce the time to failure, these operating conditions may be slightly exceeded to induce solenoid failure. Inapplication, the solenoid valve may also fail due to the designed operating parameters being exceeded.
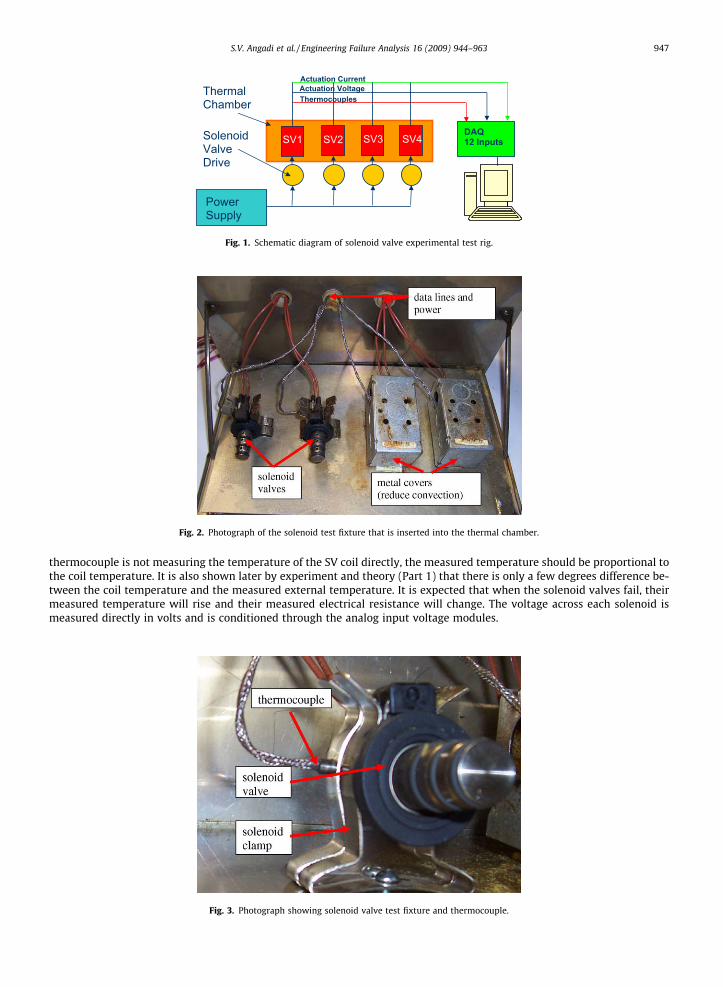
A schematic diagram of the experimental test rig fabricated for the current project is shown in Fig. 1. It depicts the basicwiring connections among the various instruments used in this work for testing of the solenoid valves and to record theresulting test data. The instruments used are two power supply systems, an SC5 solenoid controller board, current trans-formers (CT), thermocouples, a National Instruments SC2345 signal conditioning block with modules and a National Instru-ments data acquisition (DAQ) board. Three types of modules, namely, an analog voltage input module (0–42 V range, 10 kHzdata acquisition rate), an analog voltage input module (0–5 V range, 10 kHz data acquisition rate) and a thermocouple inputmodule are used in the SC2345 signal conditioning block to condition the raw signals. The LabViewTM (LV) graphical program-ming software is used extensively to gather voltage, current, and temperature data of the solenoid valves that are beingtested.
The solenoid valves are placed in a Delta Design 9039 thermal chamber. After preliminary testing, it was found that thethermal chamber was actually too effective at controlling the temperature of the solenoid valve. When the solenoid valveswere inside the chamber, the measured increases in temperature from the ambient temperature were actually less thanwhen the solenoid valves were outside the chamber. This is because the thermal chamber has a fan which circulates theair so that the temperature is uniform throughout the chamber. This unfortunately also causes forced convection whichtends to hold the solenoid valve at the same temperature as the chamber. In contrast, when the solenoid valve is outsidethe chamber, the air is mostly still and the much less effective mechanism of free convection is dominant. In addition, freeconvection was used during modeling of the solenoid valve to consider the heat dissipation from the solenoid valve (see Part1 paper). To reduce the effect of the forced convection, metal boxes were placed over the valves in the chamber (see Fig. 2).This practice was very successful at increasing the rise in temperature in the solenoid valves due to Joule heating. This in turnallowed for more control over failure of the solenoid valve.
An SC5 solenoid controller board is used to control the solenoids simultaneously at a specified peak current, sustainedcurrent, voltage, actuation rate and duty cycle. A duty cycle is defined as the ratio of ‘on’ time (that is, the time for whichthe solenoid valve is under actuation) to the total period of actuation. The higher this ratio, the more load the solenoid valveis under. By increasing the duty cycle, the solenoid valve can be stressed and caused to fail.
Two power supply systems are used to supply a voltage of 20 V to an SC5 solenoid controller board to actuate the five SVsand 5 V for current transformers (CTs). The CT for each SV measures the current that is passing though each SV.
E type thermocouples are used to measure the operating temperature of the SVs during their cycling process. As shown inFigs. 3 and 4, the thermocouples are placed to come into contact with the side of the SV’s metal casing. Although the
Table 1Tested solenoid valve rated operating parameters
Parameter Value
Operating current 1.8 A(Cycling) Frequency 61.2 HzCoil resistance 3.4 XOperating voltage 12 VOperating temperature �30 to 130�C
SV1 DAQ 12 Inputs SV2 SV3 SV4
Power Supply
Thermocouples Actuation Voltage Actuation Current
Solenoid Valve Drive
Thermal Chamber
Fig. 1. Schematic diagram of solenoid valve experimental test rig.
Fig. 2. Photograph of the solenoid test fixture that is inserted into the thermal chamber.
S.V. Angadi et al. / Engineering Failure Analysis 16 (2009) 944–963 947
thermocouple is not measuring the temperature of the SV coil directly, the measured temperature should be proportional tothe coil temperature. It is also shown later by experiment and theory (Part 1) that there is only a few degrees difference be-tween the coil temperature and the measured external temperature. It is expected that when the solenoid valves fail, theirmeasured temperature will rise and their measured electrical resistance will change. The voltage across each solenoid ismeasured directly in volts and is conditioned through the analog input voltage modules.
Fig. 3. Photograph showing solenoid valve test fixture and thermocouple.

Solenoid Valve
Thermocouple
Adjustable Clamp
Metal Base Board
Fig. 4. A schematic of the solenoid valve test fixture and thermocouple mount.
948 S.V. Angadi et al. / Engineering Failure Analysis 16 (2009) 944–963
The output of the current transformers (CT) is a voltage which is proportional to the current powering the SV. The inputvoltage signal from current transformer (CT) is also first conditioned through another analog voltage input module (5 V,10 kHz). It is then converted to current (for each SV). This type of module is chosen specifically based on CT specifications.For each of the SV in operation, an independent CT is used. To measure the electrical resistance of each solenoid valve, a mul-timeter is used. For a completely or a partially solenoid failed valve, the resistance is measured when its temperature reducesto room temperature. Similarly, for a solenoid valve that is run for a specified test duration of 24 h but has not undergonefailure, its resistance is measured when it cools down to room temperature.
It was also found that when the solenoid valves do fail, the wires in the coils short and cause the resistance to drop. Thiscauses the current to increase significantly since the power source is held at constant voltage. This actually caused failures ofthe control board channels. To alleviate this problem Type BAF-3 fuses (Fast acting 3 Amp rating) were inserted in the powerlines to the solenoid valves. Therefore, if the current applied to solenoid valve increased past 3 A, the fuse would blow andcut-off the power. This practice also reduced the risk of fire due to a failed solenoid valve. It was observed that the fuses blewmultiple times when a solenoid valve failed.
Thus, through experimental testing of the SVs, we obtain the resistance of the SV, the applied current flowing through theSV, the applied voltage across the SV and the temperature of SV. These data are then used to characterize and analyze sole-noid valve failure. The results of the theoretical model from the Part 1 paper will also be correlated to the results of exper-imental measurements.
3. Experimental results
A total of 22 solenoid valves are tested for a maximum period of 24 h at a temperature of 100 �C in a thermal chamber,16.8 V of average peak voltage, 50% duty cycle (DC) and 60 Hz of cycling frequency. Originally the tests were run at a 80 �Cambient temperature but failure was not occurring at a sufficient rate so the ambient temperature was increased to 100 �C.This implies that the solenoid valves are scheduled to run for 5,184,000 (approximately five million) cycles in 24 h with nofailure.
A sample of the voltage and current waveforms (providing the applied voltage and current for all the solenoid valves)generated during testing of the solenoid valves are displayed in Figs. 5 and 6. From Fig. 5, it can be noticed that the appliedaverage peak voltage during the tests is 16.8 V. In addition, the waveforms are not perfect square waves, but that is similar towhat the solenoid valves would bear in an actual application.
The recorded actuation current is also shown in Fig. 6. The actuation current lags the actuation voltage. Once the voltageis actuated, the current increases at a reduced rate to the expected current which is equal to the voltage divided by the resis-tance. This is due to electrical inductance in the solenoid valve and power lines.
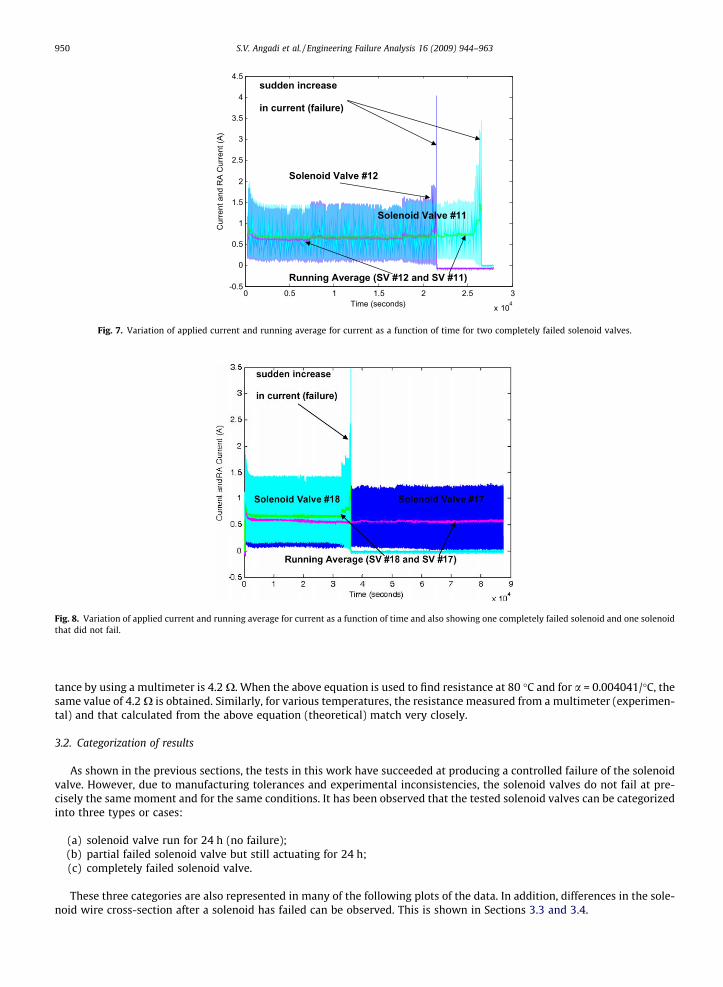
Although a total of 22 solenoid valves are tested, Figs. 7–10 show the current, the calculated running average of thecurrent, and the measured temperature as a function of time for 4 of the solenoid valves. Figs. 7 and 9 show peak currentand maximum temperature values at which complete failure has occurred for 2 valves, whereas Figs. 8 and 10 show thecurrent, running average and temperature data for a completely failed valve and for a valve where no failure has oc-curred. It is clearly evident that solenoid failure is marked by a sudden increase in temperature and current. Once failureoccurs the solenoid valve ceases to actuate and the protective fuse blows causing the applied current and voltage to re-duce to zero. These clear failure points are used to extract the time to failure for each solenoid valve. A detailed set of theextracted results and observations on all solenoid valves tested in this work is included in the following sections (seeTable 2).

0
5
10
15
20
25
179.98 180 180.02 180.04 180.06 180.08 180.1 180.12
Time (seconds)
Ap
plie
d v
olt
age
(V)
Fig. 5. Variation of actuation voltage with time for a solenoid valve in operation.
Fig. 6. Variation of actuation current with time for a solenoid valve in operation.
S.V. Angadi et al. / Engineering Failure Analysis 16 (2009) 944–963 949
3.1. Direct solenoid coil temperature measurement
As discussed in Section 2, the temperature is measured during a test using thermocouples that are pressed against theoutside of the metal casing of the solenoid valve near the coil. Based on the finite element results discussed in Part 1 paper,it is believed that these external temperatures are very close to the coil temperature. To confirm this the solenoid coil can beused as a thermistor to measure temperature. As the temperature increases, the coil wire will expand and lengthen, thuscausing a measurable increase in the electrical resistance. However, this measurement cannot be made easily while the sole-noid valve is in operation. In this work the resistance of the solenoid valve was measured before and immediately following atest. These resistances were then used to confirm the coil temperature. The dependence of resistance on temperature is givenby the following equation [19]:
R ¼ Rrefð1þ aðDTÞÞ ð1Þ
where R is resistance (X) at a given temperature (T) (�C); Rref, resistance (X) at reference temperature, Tref (�C) (generally20 �C), that is, 3.4 X; a, temperature coefficient of resistance for a given material (for copper, the material used as conductorin solenoid coil, the value of a is 0.004041/�C); and DN is the difference between T and Tref.
A plot of resistance versus the temperature is thus shown in Fig. 11. The trend confirms that the method is very effectiveat measuring the coil temperature and that the coil temperature is nearly the same as the external temperature of the ther-mocouple. It is seen that in this work for a particular value of temperature (for example, 80 �C) the measured value of resis-
0 0.5 1 1.5 2 2.5 3
x 104
-0.5
0
0.5
1
1.5
2
2.5
3
3.5
4
4.5
Time (seconds)
Cur
rent
and
RA
Cur
rent
(A)
sudden increase
in current (failure)
Solenoid Valve #12
Solenoid Valve #11
Running Average (SV #12 and SV #11)
Fig. 7. Variation of applied current and running average for current as a function of time for two completely failed solenoid valves.
Fig. 8. Variation of applied current and running average for current as a function of time and also showing one completely failed solenoid and one solenoidthat did not fail.
950 S.V. Angadi et al. / Engineering Failure Analysis 16 (2009) 944–963
tance by using a multimeter is 4.2 X. When the above equation is used to find resistance at 80 �C and for a = 0.004041/�C, thesame value of 4.2 X is obtained. Similarly, for various temperatures, the resistance measured from a multimeter (experimen-tal) and that calculated from the above equation (theoretical) match very closely.
3.2. Categorization of results
As shown in the previous sections, the tests in this work have succeeded at producing a controlled failure of the solenoidvalve. However, due to manufacturing tolerances and experimental inconsistencies, the solenoid valves do not fail at pre-cisely the same moment and for the same conditions. It has been observed that the tested solenoid valves can be categorizedinto three types or cases:
(a) solenoid valve run for 24 h (no failure);(b) partial failed solenoid valve but still actuating for 24 h;(c) completely failed solenoid valve.
These three categories are also represented in many of the following plots of the data. In addition, differences in the sole-noid wire cross-section after a solenoid has failed can be observed. This is shown in Sections 3.3 and 3.4.

0 0.5 1 1.5 2 2.5 3
x 104
0
50
100
150
200
250
300
Time (seconds)
Tem
pera
ture
(de
g C
)
SV 11
SV 12
sudden increase in temperature
marks solenoid failure
Fig. 9. Variation of temperature with time for two completely failed solenoid valves.
0 1 2 3 4 5 6 7 8 9
x 104
0
50
100
150
200
250
Time (seconds)
Tem
pera
ture
(de
g C
)
SV 17
SV 17SV 18
SV 18
solenoid valve #17 (no failure)
failure marked by
sudden temperature increase (SV #18)
Fig. 10. Variation of temperature with time for one completely failed solenoid and one solenoid that did not fail.
S.V. Angadi et al. / Engineering Failure Analysis 16 (2009) 944–963 951
3.3. Analysis of results
The cumulative density function (CDF) is used extensively to test or study the reliability of components and thereby pre-dict life of components. Fig. 12 shows the calculated experimental CDF and the cycles to failure for the solenoid valves. In thisplot only the data for the solenoid valves that have either partially or completely failed have been considered. Fig. 12 signifiesthat the chances of failure of SVs increases as the cycles to failure increase.
The calculated CDF appears to show that the failure rate does not follow a Weibull distribution. Rather, the failure rateappears to level off as the number of cycles is increased. A logarithmic function is fit to the CDF data that might be usedto make rough approximations for solenoid reliability. The current analysis actually finds that the failure of the tested sole-noid valve is correlated better with the maximum temperature. This confirms the theory that the failure mechanism is athermo-mechanical one that occurs when the temperature and stress are large enough to cause the insulation to fail andthe coil wires to short.
The tests on all the tested SVs (a total of 22 SVs) are conducted for 24 h. However, SV 15, 23, 29 were prematurely stoppedbefore the full 24 h. This might be because other solenoid valves in the same test (SV 16, 24, 30) failed quickly (in the range of6–10 h) and so unexpectedly the power supply became switched off. Nineteen solenoid valves are either run for full 24 hwith no failure or run until they exhibit either partial or complete failure.
From the solenoid tests, four key outputs are extracted for all valves (see Table 2). These key outputs are the maximumtemperature reached during tests, the number of cycles run, the D Resistance (the change in resistance) and the peak currentobserved at failure or at the end of a 24 h test. The key parameters are taken into account in analyzing the performance of
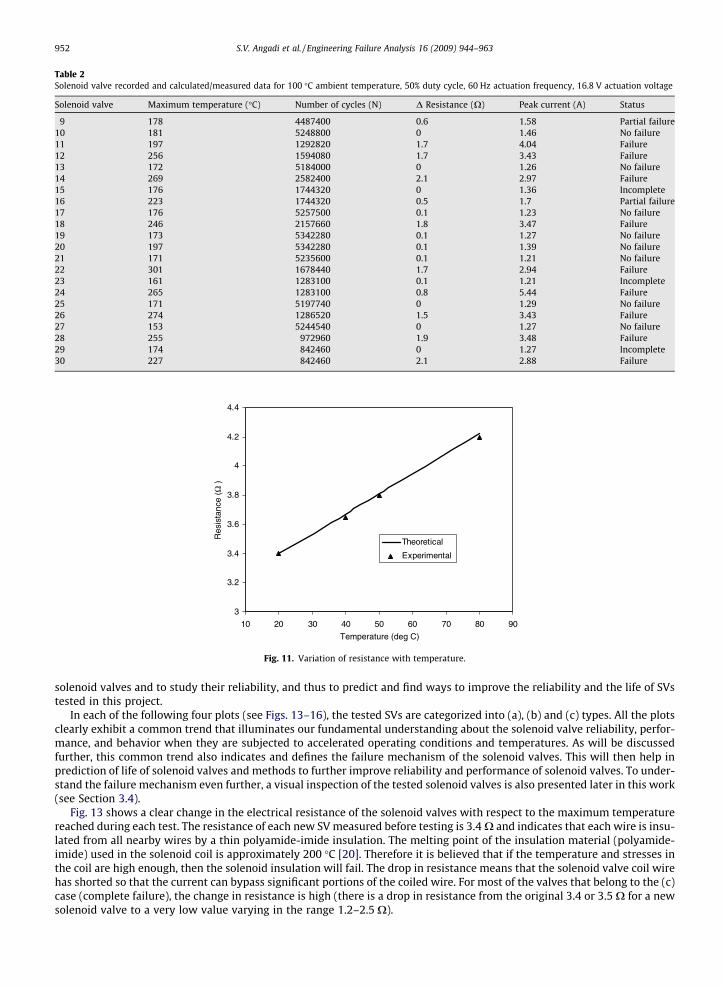
Table 2Solenoid valve recorded and calculated/measured data for 100 �C ambient temperature, 50% duty cycle, 60 Hz actuation frequency, 16.8 V actuation voltage
Solenoid valve Maximum temperature (�C) Number of cycles (N) D Resistance (X) Peak current (A) Status
9 178 4487400 0.6 1.58 Partial failure10 181 5248800 0 1.46 No failure11 197 1292820 1.7 4.04 Failure12 256 1594080 1.7 3.43 Failure13 172 5184000 0 1.26 No failure14 269 2582400 2.1 2.97 Failure15 176 1744320 0 1.36 Incomplete16 223 1744320 0.5 1.7 Partial failure17 176 5257500 0.1 1.23 No failure18 246 2157660 1.8 3.47 Failure19 173 5342280 0.1 1.27 No failure20 197 5342280 0.1 1.39 No failure21 171 5235600 0.1 1.21 No failure22 301 1678440 1.7 2.94 Failure23 161 1283100 0.1 1.21 Incomplete24 265 1283100 0.8 5.44 Failure25 171 5197740 0 1.29 No failure26 274 1286520 1.5 3.43 Failure27 153 5244540 0 1.27 No failure28 255 972960 1.9 3.48 Failure29 174 842460 0 1.27 Incomplete30 227 842460 2.1 2.88 Failure
3
3.2
3.4
3.6
3.8
4
4.2
4.4
10 20 30 40 50 60 70 80 90
Temperature (deg C)
Res
ista
nce
(Ω)
Theoretical
Experimental
Fig. 11. Variation of resistance with temperature.
952 S.V. Angadi et al. / Engineering Failure Analysis 16 (2009) 944–963
solenoid valves and to study their reliability, and thus to predict and find ways to improve the reliability and the life of SVstested in this project.
In each of the following four plots (see Figs. 13–16), the tested SVs are categorized into (a), (b) and (c) types. All the plotsclearly exhibit a common trend that illuminates our fundamental understanding about the solenoid valve reliability, perfor-mance, and behavior when they are subjected to accelerated operating conditions and temperatures. As will be discussedfurther, this common trend also indicates and defines the failure mechanism of the solenoid valves. This will then help inprediction of life of solenoid valves and methods to further improve reliability and performance of solenoid valves. To under-stand the failure mechanism even further, a visual inspection of the tested solenoid valves is also presented later in this work(see Section 3.4).
Fig. 13 shows a clear change in the electrical resistance of the solenoid valves with respect to the maximum temperaturereached during each test. The resistance of each new SV measured before testing is 3.4 X and indicates that each wire is insu-lated from all nearby wires by a thin polyamide-imide insulation. The melting point of the insulation material (polyamide-imide) used in the solenoid coil is approximately 200 �C [20]. Therefore it is believed that if the temperature and stresses inthe coil are high enough, then the solenoid insulation will fail. The drop in resistance means that the solenoid valve coil wirehas shorted so that the current can bypass significant portions of the coiled wire. For most of the valves that belong to the (c)case (complete failure), the change in resistance is high (there is a drop in resistance from the original 3.4 or 3.5 X for a newsolenoid valve to a very low value varying in the range 1.2–2.5 X).
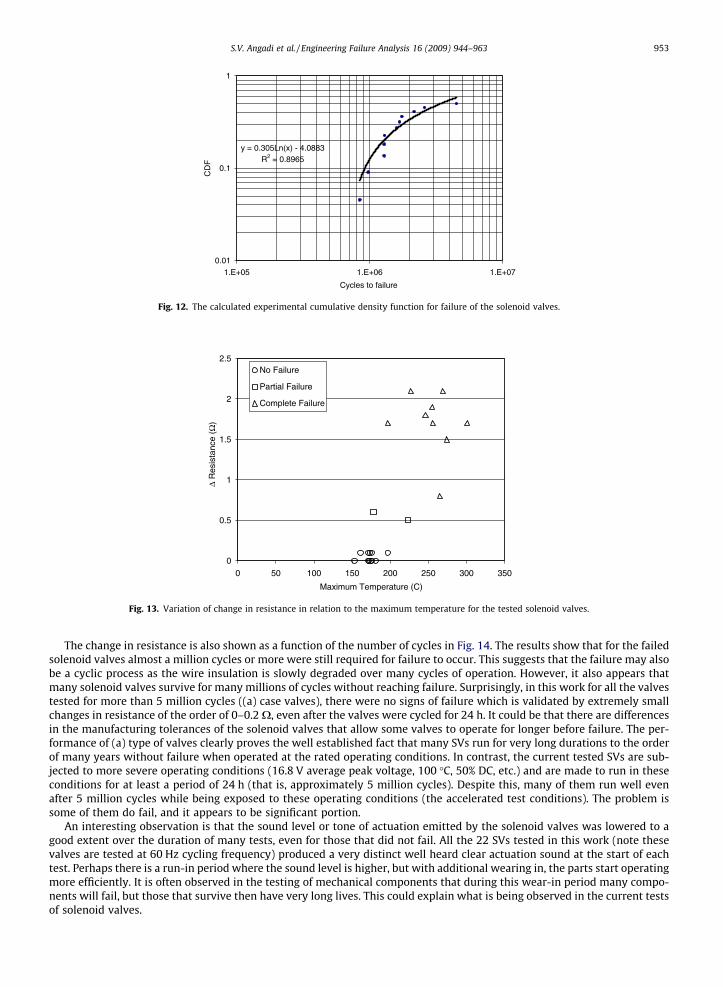
y = 0.305Ln(x) - 4.0883R2 = 0.8965
0.01
0.1
1
1.E+05 1.E+06 1.E+07
Cycles to failure
CD
F
Fig. 12. The calculated experimental cumulative density function for failure of the solenoid valves.
0
0.5
1
1.5
2
2.5
0 50 100 150 200 250 300 350
Maximum Temperature (C)
Δ R
esis
tanc
e (Ω
)
No Failure
Partial Failure
Complete Failure
Fig. 13. Variation of change in resistance in relation to the maximum temperature for the tested solenoid valves.
S.V. Angadi et al. / Engineering Failure Analysis 16 (2009) 944–963 953
The change in resistance is also shown as a function of the number of cycles in Fig. 14. The results show that for the failedsolenoid valves almost a million cycles or more were still required for failure to occur. This suggests that the failure may alsobe a cyclic process as the wire insulation is slowly degraded over many cycles of operation. However, it also appears thatmany solenoid valves survive for many millions of cycles without reaching failure. Surprisingly, in this work for all the valvestested for more than 5 million cycles ((a) case valves), there were no signs of failure which is validated by extremely smallchanges in resistance of the order of 0–0.2 X, even after the valves were cycled for 24 h. It could be that there are differencesin the manufacturing tolerances of the solenoid valves that allow some valves to operate for longer before failure. The per-formance of (a) type of valves clearly proves the well established fact that many SVs run for very long durations to the orderof many years without failure when operated at the rated operating conditions. In contrast, the current tested SVs are sub-jected to more severe operating conditions (16.8 V average peak voltage, 100 �C, 50% DC, etc.) and are made to run in theseconditions for at least a period of 24 h (that is, approximately 5 million cycles). Despite this, many of them run well evenafter 5 million cycles while being exposed to these operating conditions (the accelerated test conditions). The problem issome of them do fail, and it appears to be significant portion.
An interesting observation is that the sound level or tone of actuation emitted by the solenoid valves was lowered to agood extent over the duration of many tests, even for those that did not fail. All the 22 SVs tested in this work (note thesevalves are tested at 60 Hz cycling frequency) produced a very distinct well heard clear actuation sound at the start of eachtest. Perhaps there is a run-in period where the sound level is higher, but with additional wearing in, the parts start operatingmore efficiently. It is often observed in the testing of mechanical components that during this wear-in period many compo-nents will fail, but those that survive then have very long lives. This could explain what is being observed in the current testsof solenoid valves.
0
0.5
1
1.5
2
2.5
0.E+00 1.E+06 2.E+06 3.E+06 4.E+06 5.E+06 6.E+06
Number of Cycles
Δ R
esis
tanc
e (Ω
)
No failure
Partial failure
Complete failure
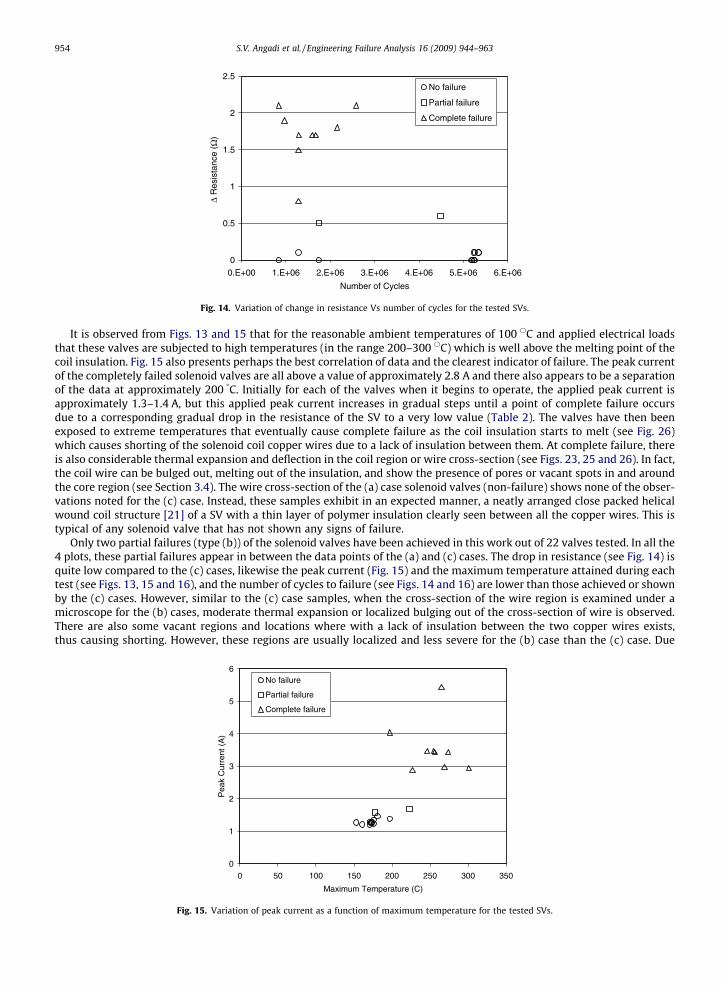
Fig. 14. Variation of change in resistance Vs number of cycles for the tested SVs.
954 S.V. Angadi et al. / Engineering Failure Analysis 16 (2009) 944–963
It is observed from Figs. 13 and 15 that for the reasonable ambient temperatures of 100 sC and applied electrical loadsthat these valves are subjected to high temperatures (in the range 200–300 sC) which is well above the melting point of thecoil insulation. Fig. 15 also presents perhaps the best correlation of data and the clearest indicator of failure. The peak currentof the completely failed solenoid valves are all above a value of approximately 2.8 A and there also appears to be a separationof the data at approximately 200 �C. Initially for each of the valves when it begins to operate, the applied peak current isapproximately 1.3–1.4 A, but this applied peak current increases in gradual steps until a point of complete failure occursdue to a corresponding gradual drop in the resistance of the SV to a very low value (Table 2). The valves have then beenexposed to extreme temperatures that eventually cause complete failure as the coil insulation starts to melt (see Fig. 26)which causes shorting of the solenoid coil copper wires due to a lack of insulation between them. At complete failure, thereis also considerable thermal expansion and deflection in the coil region or wire cross-section (see Figs. 23, 25 and 26). In fact,the coil wire can be bulged out, melting out of the insulation, and show the presence of pores or vacant spots in and aroundthe core region (see Section 3.4). The wire cross-section of the (a) case solenoid valves (non-failure) shows none of the obser-vations noted for the (c) case. Instead, these samples exhibit in an expected manner, a neatly arranged close packed helicalwound coil structure [21] of a SV with a thin layer of polymer insulation clearly seen between all the copper wires. This istypical of any solenoid valve that has not shown any signs of failure.
Only two partial failures (type (b)) of the solenoid valves have been achieved in this work out of 22 valves tested. In all the4 plots, these partial failures appear in between the data points of the (a) and (c) cases. The drop in resistance (see Fig. 14) isquite low compared to the (c) cases, likewise the peak current (Fig. 15) and the maximum temperature attained during eachtest (see Figs. 13, 15 and 16), and the number of cycles to failure (see Figs. 14 and 16) are lower than those achieved or shownby the (c) cases. However, similar to the (c) case samples, when the cross-section of the wire region is examined under amicroscope for the (b) cases, moderate thermal expansion or localized bulging out of the cross-section of wire is observed.There are also some vacant regions and locations where with a lack of insulation between the two copper wires exists,thus causing shorting. However, these regions are usually localized and less severe for the (b) case than the (c) case. Due
0
1
2
3
4
5
6
0 50 100 150 200 250 300 350
Maximum Temperature (C)
Pea
k C
urre
nt (
A)
No failure
Partial failure
Complete failure
Fig. 15. Variation of peak current as a function of maximum temperature for the tested SVs.

0.E+00
1.E+06
2.E+06
3.E+06
4.E+06
5.E+06
6.E+06
0 50 100 150 200 250 300 350
Maximum Temperature (C)
Num
ber
ofcy
cles
No failure
Partial failure
Complete failure
Fig. 16. Variation of number of cycles as a function of the maximum temperature for the tested solenoid valves.
Fig. 17. A macroscale photograph of a SV belonging to (a) case (the solenoid valve was run for 24 h without failure).
Fig. 18. A macroscale photograph of a solenoid valve belonging to (b) case (partially failed but still run for 24 h).
S.V. Angadi et al. / Engineering Failure Analysis 16 (2009) 944–963 955

Fig. 19. Macroscale photograph of a solenoid valve belonging to the (c) case (completely failed).
Fig. 20. Macroscale photograph of a solenoid valve belonging to the (c) case (completely failed).
956 S.V. Angadi et al. / Engineering Failure Analysis 16 (2009) 944–963
to shorting only, the resistance has dropped from the original values of 3.4–3.5–2.9 X in both the two partially failed sole-noid valves. There is also disorder of the wire arrangement in both the partially (intermediate disorder) and the completely(excessive disorder) failed solenoid valves which is not present in the (a) case. Therefore, these valves are classified as partialfailures due to a low change in resistance, still successful solenoid actuation, and limited melting of insulation.
Fig. 16 shows the variation of the number of test cycles as a function of the maximum temperature reached during eachtest for all SVs. From this it shows that the higher maximum temperatures reached by the solenoid valve might be due tohigh peak currents. Then these high peak currents are in turn probably a result of the large drop in resistance of the solenoidvalve from 3.4 to 3.5 X to the range of 1.2–2.5 X. Since these lower resistances are caused by high temperatures, there doesseem to be a viscous cycle that the solenoid valve may enter once the threshold of failure is reached. Alternatively, the sole-noid valves subjected to moderately high temperatures in the range 150–185 �C run extremely well for at least 5 millioncycles (that is, approx. 24 h) with no signs of failure, therefore these tests belong to the (a) category.
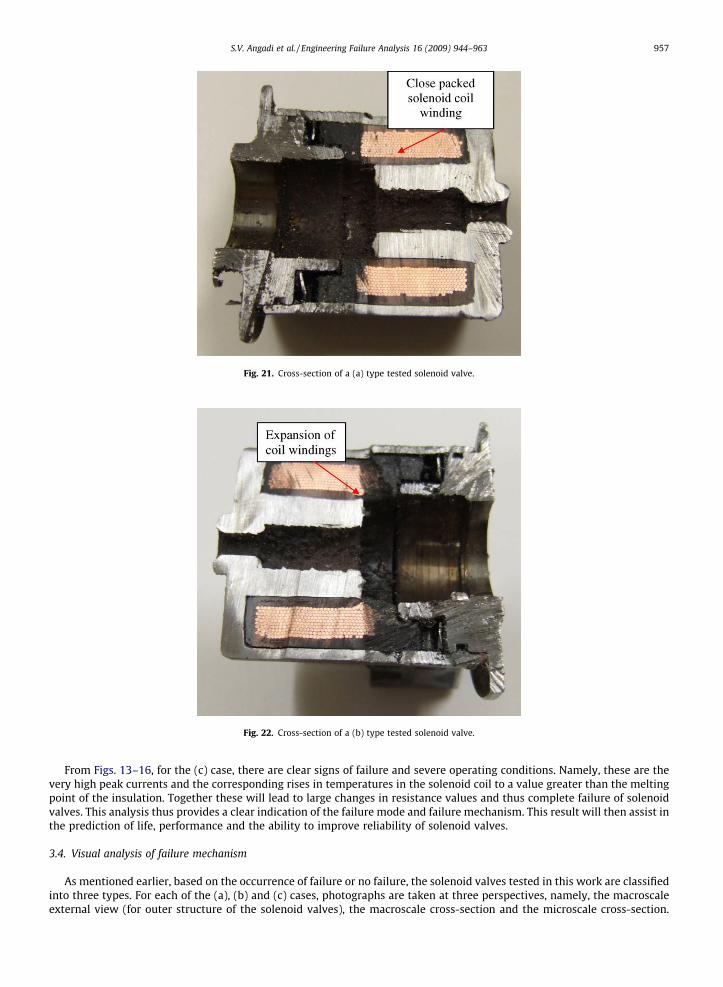
Fig. 21. Cross-section of a (a) type tested solenoid valve.
Fig. 22. Cross-section of a (b) type tested solenoid valve.
S.V. Angadi et al. / Engineering Failure Analysis 16 (2009) 944–963 957
From Figs. 13–16, for the (c) case, there are clear signs of failure and severe operating conditions. Namely, these are thevery high peak currents and the corresponding rises in temperatures in the solenoid coil to a value greater than the meltingpoint of the insulation. Together these will lead to large changes in resistance values and thus complete failure of solenoidvalves. This analysis thus provides a clear indication of the failure mode and failure mechanism. This result will then assist inthe prediction of life, performance and the ability to improve reliability of solenoid valves.
3.4. Visual analysis of failure mechanism
As mentioned earlier, based on the occurrence of failure or no failure, the solenoid valves tested in this work are classifiedinto three types. For each of the (a), (b) and (c) cases, photographs are taken at three perspectives, namely, the macroscaleexternal view (for outer structure of the solenoid valves), the macroscale cross-section and the microscale cross-section.

958 S.V. Angadi et al. / Engineering Failure Analysis 16 (2009) 944–963
The macroscale level view of the external solenoid valve and cross-section was photographed simply using a digital camera.The microscale level photographs of the cross-section were taken using a digital camera mounted on a microscope. Thecross-sections of the solenoid valves were obtained by cutting open several of the tested solenoid valves. The solenoid valveswere cut using a band saw and hand saw. The surfaces of the cross-section were then ground smooth.
The following photographs (Figs. 17–27) of the (a), (b) and (c) cases, show very clearly the variation of damage to the coil,insulation material between the copper wires and the plastic material that surrounds the coil structure (see Fig. 19) due tothe high applied currents and thus high temperatures. It can be observed that the maximum or most intense damage is pres-ent for the (c) case and relatively no damage imparted to the coil of the (a) case solenoid valves.
For the (a) and (b) cases (see Figs. 17 and 18), where both are run for 24 h and about 5 million cycles, the outer structuralappearances of the valves are similar. The presence of a brownish color is observed over most of the outer region of thevalves since the outer casing of the valves is made of iron (due to iron oxidation and exposure to extreme temperaturesin the range 150–200 �C) unlike the silver color of the valves seen prior to testing.. In addition, some bluish discolorationof the surfaces can also be seen due to the high temperatures that are encountered. In contrast, for the (c) case valves(see Figs. 19 and 20), along with the discoloration in the outer structure, plastic material is seen oozing or coming out ofvalve due to exposure to very high temperatures in the range of 200–250 �C. The color of the type (c) failed solenoid valveis also a deeper blue than the other samples, indicating the occurrence of higher temperatures. Again, the existence ofextreme temperatures in the valves is due to the applied current and the build up of Joule heat in addition to the heat inthe ambient air of the thermal chamber.
Figs. 21–23 show the macroscale photographs of the cross-sections of tested solenoid valves (including (a) non-failure (b)partial failure and (c) complete failure). One can observe that the organization of the coil wire array continues to degradefrom the type (a) non-failure solenoid valves to the type (c) complete failure valves. For the intermediate type (b) samplesit appears that any obstructions in the coil hexagonal packing structure is located and limited to the corners of the coil. How-ever, the type (c) solenoid valve samples show a very unorganized coil with wires that have even completely separated fromthe bulk coil into the black plastic casing material. This same black casing material was seen in the earlier photographs exit-ing the solenoid valve in a melted form. For complete failure the melted plastic may have also helped cause failure bymechanically obstructing the actuation of the valve plunger in the center axis of the solenoid valve. Some of the coil wiresappear to not only have left the coil structure but are approaching the steel casing or core of the solenoid valve. This couldcause further shorting of the solenoid, and perhaps even leak electrical current into any components surrounding the sole-noid valve in application.
Figs. 24–27 display the microscale photographs of the tested solenoid valve cross-sections for various levels of severity.Although all samples showed some signs of stress in the coil, the partially failed (type (b)) and completely failed (type (c))solenoid valve cross-sections showed many more shorts between the coil wires and disorganization of the coil structure thanthe tested but not failed samples (type (a)).
At first, considering type (c), there are a few number of vacant spots or separation between many of the copper coilwires (Figs. 26 and 27) (probably due to the melting of insulation material due to very high temperatures in the range of
Fig. 23. Cross-section of (c) type solenoid valve.
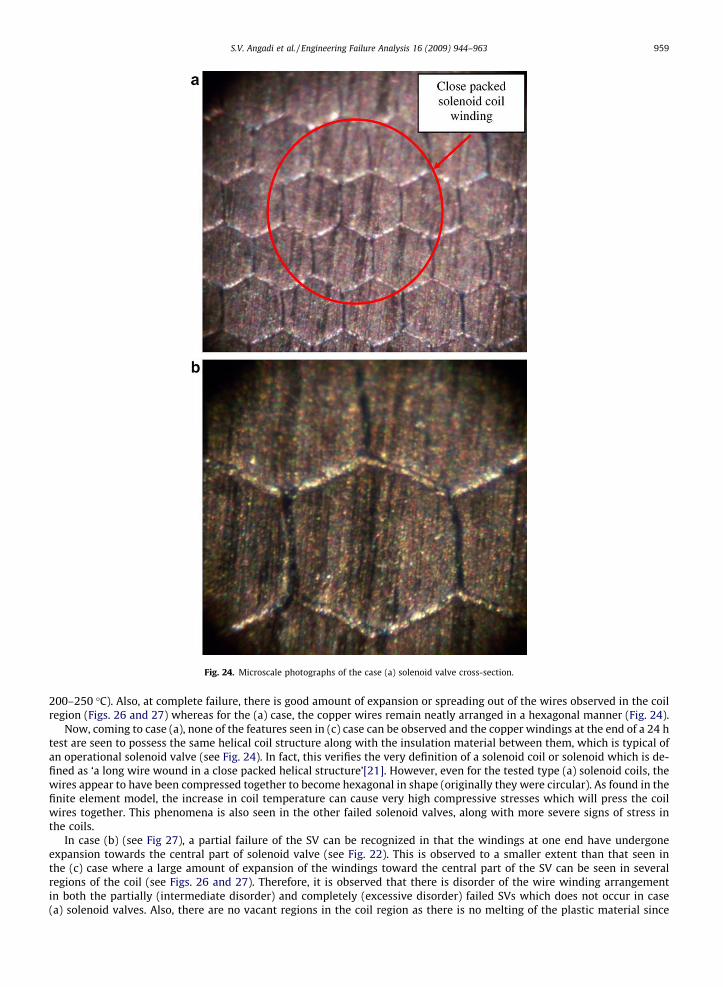
Fig. 24. Microscale photographs of the case (a) solenoid valve cross-section.
S.V. Angadi et al. / Engineering Failure Analysis 16 (2009) 944–963 959
200–250 �C). Also, at complete failure, there is good amount of expansion or spreading out of the wires observed in the coilregion (Figs. 26 and 27) whereas for the (a) case, the copper wires remain neatly arranged in a hexagonal manner (Fig. 24).
Now, coming to case (a), none of the features seen in (c) case can be observed and the copper windings at the end of a 24 htest are seen to possess the same helical coil structure along with the insulation material between them, which is typical ofan operational solenoid valve (see Fig. 24). In fact, this verifies the very definition of a solenoid coil or solenoid which is de-fined as ‘a long wire wound in a close packed helical structure’[21]. However, even for the tested type (a) solenoid coils, thewires appear to have been compressed together to become hexagonal in shape (originally they were circular). As found in thefinite element model, the increase in coil temperature can cause very high compressive stresses which will press the coilwires together. This phenomena is also seen in the other failed solenoid valves, along with more severe signs of stress inthe coils.
In case (b) (see Fig 27), a partial failure of the SV can be recognized in that the windings at one end have undergoneexpansion towards the central part of solenoid valve (see Fig. 22). This is observed to a smaller extent than that seen inthe (c) case where a large amount of expansion of the windings toward the central part of the SV can be seen in severalregions of the coil (see Figs. 26 and 27). Therefore, it is observed that there is disorder of the wire winding arrangementin both the partially (intermediate disorder) and completely (excessive disorder) failed SVs which does not occur in case(a) solenoid valves. Also, there are no vacant regions in the coil region as there is no melting of the plastic material since

Fig. 25. Microscale photographs of a type (b) solenoid valve.
960 S.V. Angadi et al. / Engineering Failure Analysis 16 (2009) 944–963
the maximum temperature values recorded in the (b) cases is less than those in (c) cases. However, a lack of insulation be-tween the copper windings that causes shorting between them is noticed. It appears that, due to shorting only, the resistancehas dropped from the original value of about 3.4 X to about 2.9 X in both of the two partially failed solenoid valves. Thus,due to a low change in resistance and no melting of plastic material, these valves are classified as partial failures.
4. Conclusions
An experimental rig to test the solenoid valves has been fabricated and solenoid valves are tested at a constant current,duty cycle and actuation frequency for a fixed duration to characterize their reliability. The solenoid valves are also placed

Fig. 26. Microscale photographs of type (c) solenoid valve cross-sections (part 1).
S.V. Angadi et al. / Engineering Failure Analysis 16 (2009) 944–963 961
inside a thermal chamber that is held at a constant elevated temperature that is similar to what is seen in the automotivetransmission application. The influence of temperature on solenoid valve reliability and life is then observed to be veryimportant. Additionally, during testing of a solenoid valve, valuable information such as real-time applied voltage, currentflow and resistance and frequency of solenoid valve cycling has been obtained.
For 100 �C ambient temperature, 50% duty cycle, 16.8 V of applied voltage, and 60 Hz actuation frequency, failure of thesolenoid valve was repeatedly caused for many test samples. It appeared that samples that reached a temperature of 200 �Cfailed completely due to melting and degradation of the insulation between the coil wires (as predicted by the finite elementmodel, see Part 1 of this work). Once the wires begin to short, the overall electrical resistance of the solenoid valve decreases.Since a constant voltage was applied to the tested solenoid valves, the applied current will then increase. They may increasethe temperature further and result in very high temperatures in the solenoid valve (up to 300 �C). The temperatures are sohigh that the metal casing and core discolors to blue and plastic within the solenoid valve melts and exits the casing. Themelting plastic can also inhibit motion of the plunger. This is the observed dominant failure mechanism in this work. Micro-scale photographs of the coil cross-section also revealed that the wire structure of a failed solenoid valve was much lessorganized than the tight hexagonal structure of a functioning solenoid valve. In addition, at the microscale, the shorts be-tween the coil wires can be seen where the insulation has been squeezed out from between the wires.
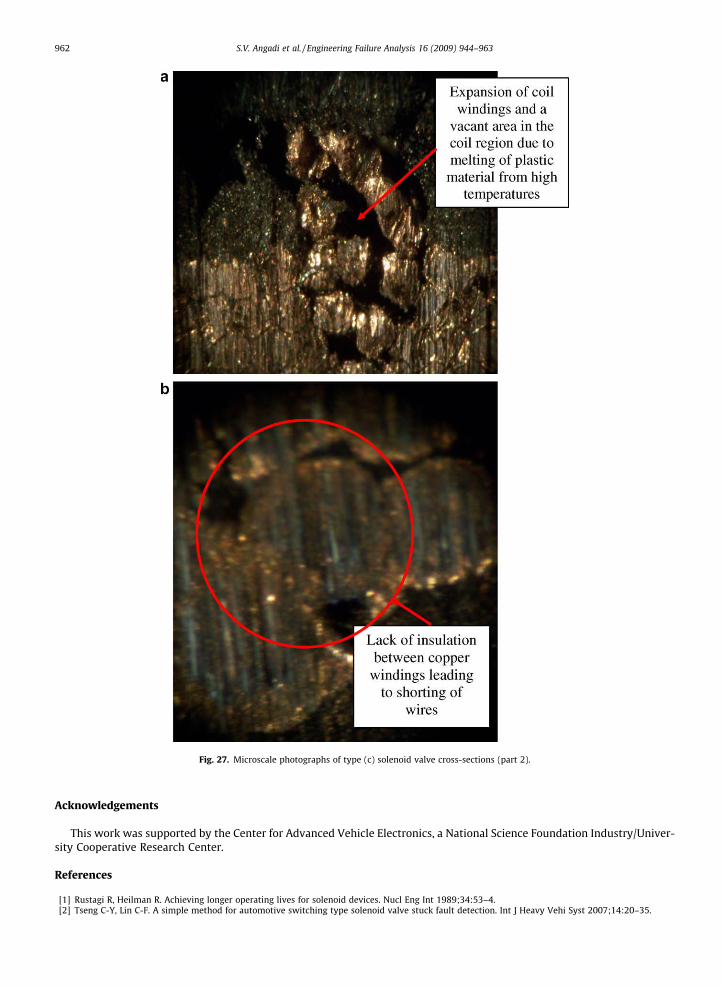
Fig. 27. Microscale photographs of type (c) solenoid valve cross-sections (part 2).
962 S.V. Angadi et al. / Engineering Failure Analysis 16 (2009) 944–963
Acknowledgements
This work was supported by the Center for Advanced Vehicle Electronics, a National Science Foundation Industry/Univer-sity Cooperative Research Center.
References
[1] Rustagi R, Heilman R. Achieving longer operating lives for solenoid devices. Nucl Eng Int 1989;34:53–4.[2] Tseng C-Y, Lin C-F. A simple method for automotive switching type solenoid valve stuck fault detection. Int J Heavy Vehi Syst 2007;14:20–35.

S.V. Angadi et al. / Engineering Failure Analysis 16 (2009) 944–963 963
[3] Jeong H-S, Kim H-E. Experimental based analysis of the pressure control characteristics of an oil hydraulic three-way on/off solenoid valve controlledby PWM signal. Jf Dyn Syst, Meas Control, Trans ASME 2002;124:196–205.
[4] Choi S, Cho D-W. Control of wheel slip ratio using sliding mode controller with pulse width modulation. Vehicle Syst Dyn 1999;32:267–84.[5] Hurtig J. K, Yurkuvich S, Passino KM, Littlejohn D. Torque regulation with the general motors ABS VI electric brake system. In: Presented at Proceedings
of the American Control Conference. Baltimore, MD, USA; 1994.[6] Leiber H, Czinczel A. Antiskid System For Passenger Cars With A Digital Electronic Control Unit. SAE Preprints; 1979.[7] Naito T, Takeuchi H, Kuromitsu H, Okamoto K. Development of four solenoid ABS. presented at Current and Future Developments in ABS/TCS and Brake
Technology. Detroit, MI, USA; 1996.[8] Rezeka SF. Modeling and sensitivity analysis of an ABS hydraulic modulator. In: Presented at Proceedings of the American control conference,
Baltimore (MD, USA); 1994.[9] Goodbar JE. Testerman md. Design and development of a four speed powershift transmission with electronic clutch pressure modulation. In: Presented
at SAE technical paper series; 1986.[10] Kasuga S, Otsubo H, Matsuo H, Yamashita T. Development of an electronically controlled four wheel drive system for FR vehicle with AT. JSAE Rev
1994;15:315–21.[11] Kolchinsky AE. Electrohydraulic control of transmissions. Diesel Prog Engines Drives 1993;59.[12] Taniguchi H, Ando Y. Analysis of a new automatic transmission control system for LEXUS LS400. SAE Special Publications; 1991. p. 57–61.[13] Wilcox D. Will the Allison blender suit European tastes? Transport Eng 2004:20–2.[14] Zimmermann F, Oetting H, Heidemeyer P, Haack R. Automatic dry friction clutch for passenger cars and light duty trucks. In: Presented at SAE technical
paper series, Detroit, MI, Engl; 1986.[15] Sclater N, Chironis NP. Mechanisms and mechanical devices sourcebook. 4th ed. New York: McGraw Hill; 2007.[16] Mercer JR. Reliability of solenoid valves. In: Presented at safety and failure of components; 1969.[17] Baker H. Valve operating conditions are the key: reducing solenoid burnouts. Automation 1973;20:68–9.[18] Tseng C-Y, Lin C-F. Characterisation of solenoid valve failure for electronic diesel fuel injection system of commercial trucks. Int J Heavy Vehicle Syst
2006;13:180–93.[19] Figliola RS, Beasley DS. Theory and design for mechanical measurements. 3rd ed. New York: Wiley; 2000.[20] Mark JE. Polymer data handbook. New York: Oxford University Press; 1999.[21] Halliday D, Resnick R, Krane KS. Physics, 4th ed., vol. 2. New York: Wiley; 1992.