energybox: a trace-driven tool for data transmission
TRANSCRIPT
EnergyBox: A Trace-driven Tool for DataTransmission Energy Consumption Studies
Ekhiotz Jon Vergara and Simin Nadjm-Tehrani
Dept. of Computer and Information Science,Linkoping University, Sweden
ekhiotz.vergara, [email protected]
Abstract. Although evolving mobile technologies bring millions of userscloser to the vision of information anywhere-anytime, device battery de-pletions hamper the quality of experience to a great extent. We arguethat the design of energy-efficient solutions starts by energy-awarenessand propose EnergyBox, a tool that provides accurate and repeatable en-ergy consumption studies for 3G and WiFi transmissions at the user end.We recognize that the energy consumption of data transmission is highlydependable on the traffic pattern, and provide the means for trace-basediterative packet-driven simulation to derive the operation states of wire-less interfaces. The strength of EnergyBox is that it allows to modularlyset the 3G network parameters specified at operator level, the adaptivepower save mode mechanism for a WiFi device, and the different powerlevels of the operation states for different handheld devices. EnergyBoxenables efficient energy consumption studies using real data, which com-plements the device-dependent laborious physical power measurements.Using real application transmission traces, we have validated EnergyBoxshowing an accuracy range of 94-99% for 3G and 93-99% for WiFi com-pared to the real measured energy consumption by a 3G modem and asmartphone with WiFi.
Keywords: transmission energy, trace-based simulation, energy con-sumption studies, 3G, 802.11, UMTS, WLAN
1 Introduction
Wireless interfaces account for a great energy cost on mobile devices [7, 13],but unfortunately, there seems to be some misconceptions about how energyconsumption is influenced by data transmissions. While some studies employonly bulk data transfer to measure energy consumption [4], they do not measurethe impact of the applications’ real data pattern on energy consumption. Thedata transmission pattern depends on the real application operation (influencedby application developers) and the user-device interaction [6,14], and drasticallyinfluences the energy per bit [3, 17].
In this paper we argue that reducing the energy consumption of wirelesstransmissions begins by being aware of the energy consumption characteristicsof different technologies. Since physical energy measurement studies are laborious
and time-consuming, solutions are usually tested with little variation of factorssuch as network settings, hardware dependence, and synthetic data traces.
There are different approaches available to perform energy studies. Whilethe professional testing equipment [1] or the physical power measurement equip-ment [19–21] provide high accuracy, they limit the studies to a fixed environ-ment and incur high cost. Smart battery interfaces providing current values areavailable in some devices, and the software using them (e.g., CurrentWidget forAndroid or Nokia Energy Profiler) measures the aggregated current draw fromall the device components. The error of the instant battery interface readingis usually high [5]. These and vendor specific development platforms [2] enableonly device-dependent studies of aggregated consumption. We believe that amodular approach to carry out flexible and efficient energy studies isolating thetransmission energy to complement physical energy measurements is essential.
Data traffic
!"#$%&'()*
Dat
a (b
ytes
)
Time (seconds)
Dev
ice
Sta
tes
Time (seconds)
Configuration parameters
Device power levels Energy consumption
EnergyBox
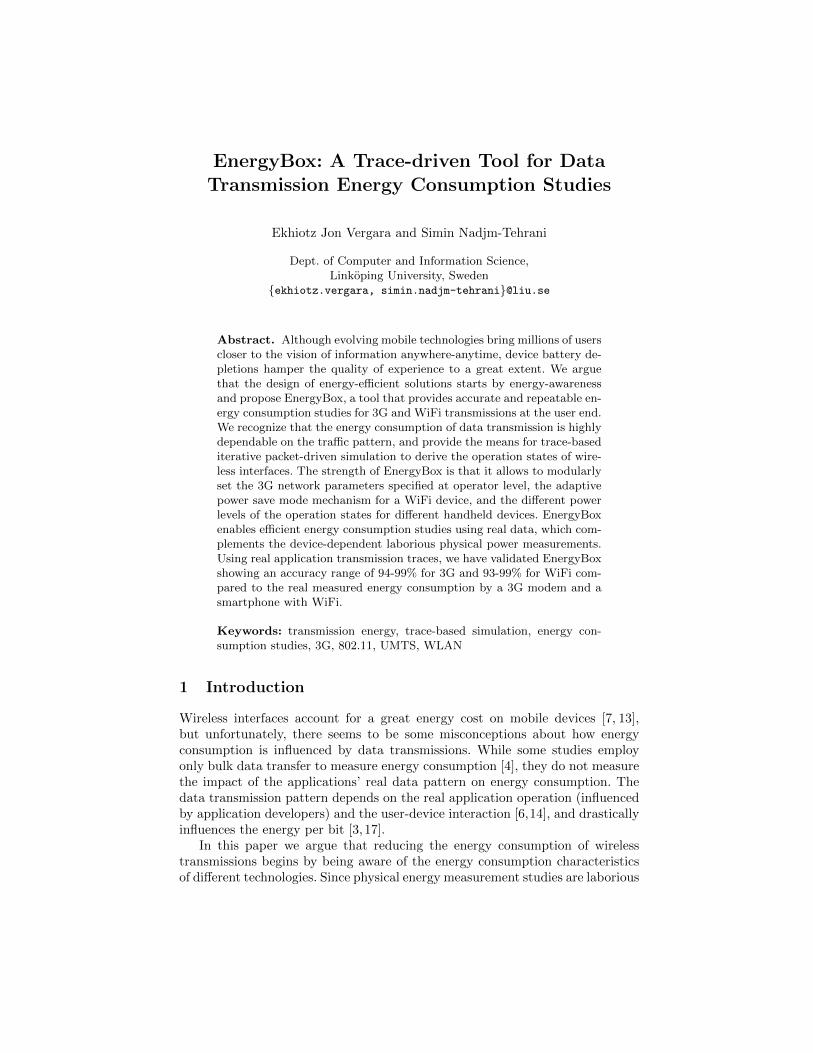
Fig. 1: Overview of EnergyBox function.
Our work proposes the design of EnergyBox: a tool that enables accuratestudies of data transmission energy consumption at the user end, using realtraffic traces as input. We focus our efforts on the most widespread wirelesstechnologies (3G and WiFi) and capture application data transmission energyfootprint at the user device. EnergyBox captures the underlying states of oper-ation of the wireless interfaces. The hardware dependence is overcome by usingparametrised device specific power levels. For a given data trace, EnergyBox au-tomatically outputs the operation states over time, so that when combined withdevice specific power levels it enables the computation of energy consumption.The general idea of our EnergyBox is shown in Fig. 1.
The data traces can be directly captured on different devices or syntheti-cally created in order to study the impact of different transmission mechanismsunder different configurations for these wireless technologies. EnergyBox assistsresearchers and application developers to immediately estimate energy consump-tion of data transmissions for a diverse range of test cases. The scenario is setup using different data traces, device power levels and network settings.
The tool accepts the statically configured parameters at the radio layer suchas inactivity timers, the data buffer thresholds and a low activity mechanismused by the operator for state transition decisions in 3G communication. ForWiFi, it incorporates the adaptive power save mode commonly used as the powersaving mechanism in the latest generation devices. We validate our EnergyBoxagainst physical measurements and show an accuracy range of 94-99% for 3G
and 93-99% for WiFi compared to physically measured energy consumption. TheEnergyBox has already been used in a research environment to facilitate energyconsumption studies complementing physical measurements [22,23].
The rest of the paper is organised as follows: section 2 provides the energyconsumption background for 3G and WiFi. The design of EnergyBox is presentedin section 3 and this is evaluated against physical measurements in section 4.Section 5 presents the related works and section 6 covers concluding remarksand future work.
2 Background
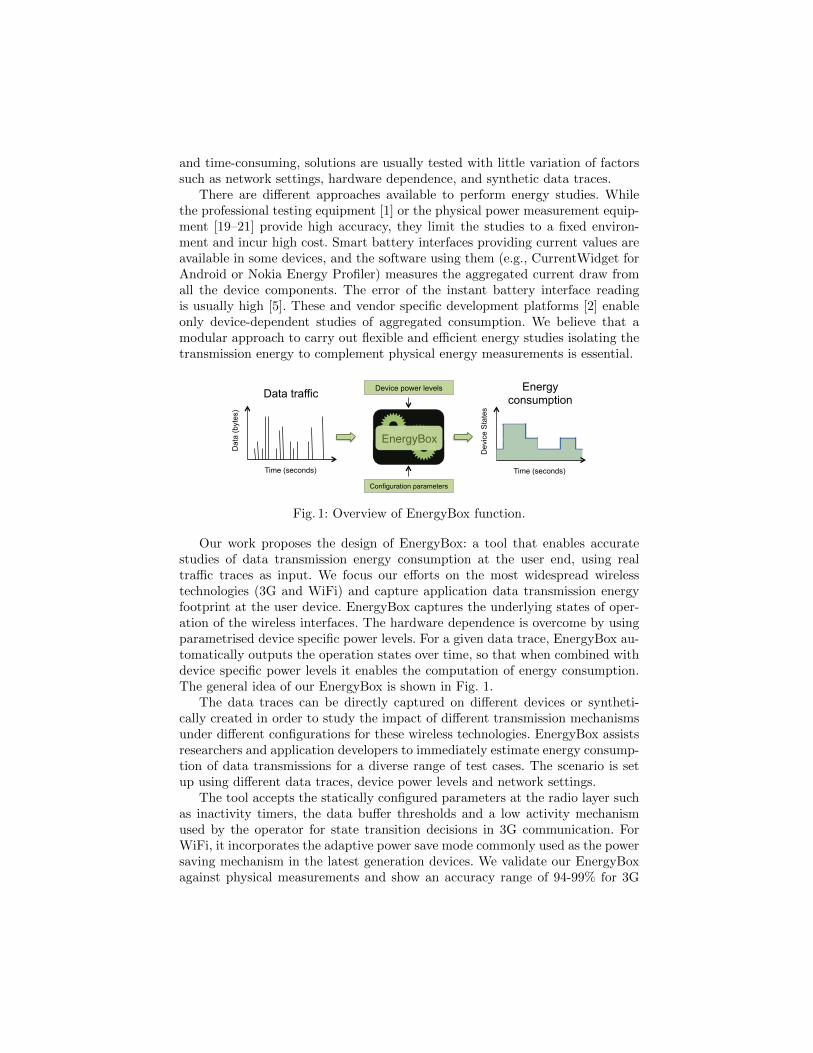
We provide a background for communication energy footprint through illustra-tive measurements that show the main factors affecting the data transmissionenergy of 3G and WiFi at the device end. Fig. 2 shows an overview of ourmeasurement setup, which is also used for validation purposes in section 4.
Development kit
NI myDAQ
Measurement computerF3307 Mobile Broadband Module
R1
R2
C
V+
USB
USB
SIM card
Test smartphone
0
+
-
Battery connectors
4V
24VR3
R4
Test computer
Amplifier
AI0
AI1
Fig. 2: Measurement setup for 3G and WiFi.
The 3G measurements were performed on a power-efficient mobile broadbandmodule provided by Ericsson AB (KRY 901214/01, marked as Development Kitin 2). Since this exposes interfaces to measure the power consumption of the 3Gmodem easily isolating it from the rest of system (e.g., CPU or screen), we employthis platform instead of the 3G module in a smartphone. We measure the voltagedrop over a shunt resistor (R1=0.1Ω) and use a low-pass filter (approximately16 Hz) to avoid any anti-aliasing effects [21].
The WiFi measurements were performed removing the battery of the smart-phone under test, and adding a low-side sensing circuit (R4 = 0.1Ω) with anisolating amplifier (maximum transmission error of 0.4%). We isolate the trans-mission energy from the rest of the system as in earlier works [19]. The powerconsumption is sampled at 1 kHz in both cases.
2.1 Energy consumption of 3G
The energy consumption of the user equipment (UE) in 3G is mostly influencedby the radio resource management performed at the network operator side by theRadio Network Controller (RNC). The RNC uses the Radio Resource Control(RRC) and the Radio Link Control (RLC) protocols. According to the RRC, theUE implements a state machine where the states imply different performance(response time and data rate) and power consumption. The UE states are Ded-icated Channel (DCH), Forward Access Channel (FACH), and Paging Channel(PCH), sorted from highest to lowest power drain. The transitions between statesare controlled using inactivity timers and RLC data buffer thresholds.
0 1 2 3 4 5 6 7 8 9 10 11 12 13 14 15 16 17 180
0.2
0.4
0.6
0.8
1
1.2
1.4
1.6
1.8
2
Time (seconds)
Pow
er (W
att)
State transition!
Uplink threshold(bytes)!
Downlink threshold (bytes)!
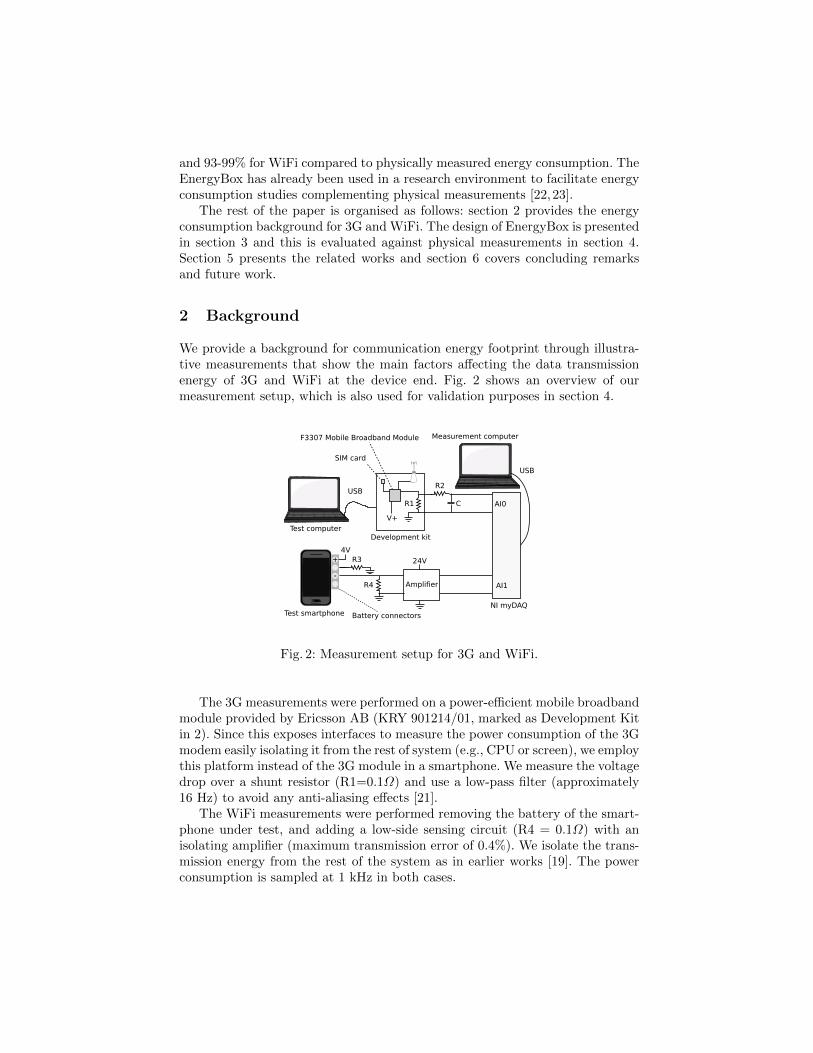
PCH-DCH! 850 - 1000! 515!FACH-DCH! 294! 515!PCH-FACH! Always triggered!
PCH! DCH! FACH! PCH!
Fig. 3: Example power profile for 3G and RLC buffer thresholds.
Fig. 3 shows the power consumption levels of the states experienced at onelocation using the operator TeliaSonera in Sweden when sending a packet burst.In PCH, the UE can be paged with the lowest energy drain but no data can besent. Some signalling is required to establish a connection and move from PCHto DCH before sending any data (1-2s in Fig. 3).
The UE reports to the RNC the observed traffic volume, that controls statetransitions to higher performance states via the RLC protocol. The RNC em-ploys fixed thresholds over the RLC buffer data occupancy and triggers thetransitions when the thresholds are exceeded. The table in Fig. 3 shows themeasured threshold values for the different state transitions.
Inactivity timers are used to move the UE to lower performance states. TheUE moves to FACH after T1 with small or no data transmission (7s in Fig. 3).T2 controls the transitions from FACH to PCH. Inactivity timers create energyoverheads known as energy tails due to the UE remaining in high consumingstate while not transmitting anything [4, 21].
To reduce these energy overheads, the Fast dormancy mechanism allows theUE to signal the RNC the desire to switch to the lowest power state by sendinga Signalling Connection Release Indication before the inactivity timeout. Somenetworks implement a low activity mechanism in DCH to release the transportchannel and move to FACH when there is low traffic [9]. Thus, we see that the
energy tails and the above mechanisms make the energy consumption dependenton the traffic pattern and operator settings in a complex way.
2.2 Energy consumption of WiFi
The transmission energy consumption for WiFi is mostly influenced at the driverlevel in the WiFi station (the client handset). The station is in the ConstantlyAwake Mode (CAM) when it has the power-saving features disabled experiencingthe best performance.
0 1 20
0.2
0.4
0.6
Time (seconds)
Pow
er (W
atts
)
0 10 20 30 40 50 60 70 800
0.2
0.4
0.6
Inter packet interval (ms)
Pow
er (W
atts
)
1400 bytes500 bytes1 byte
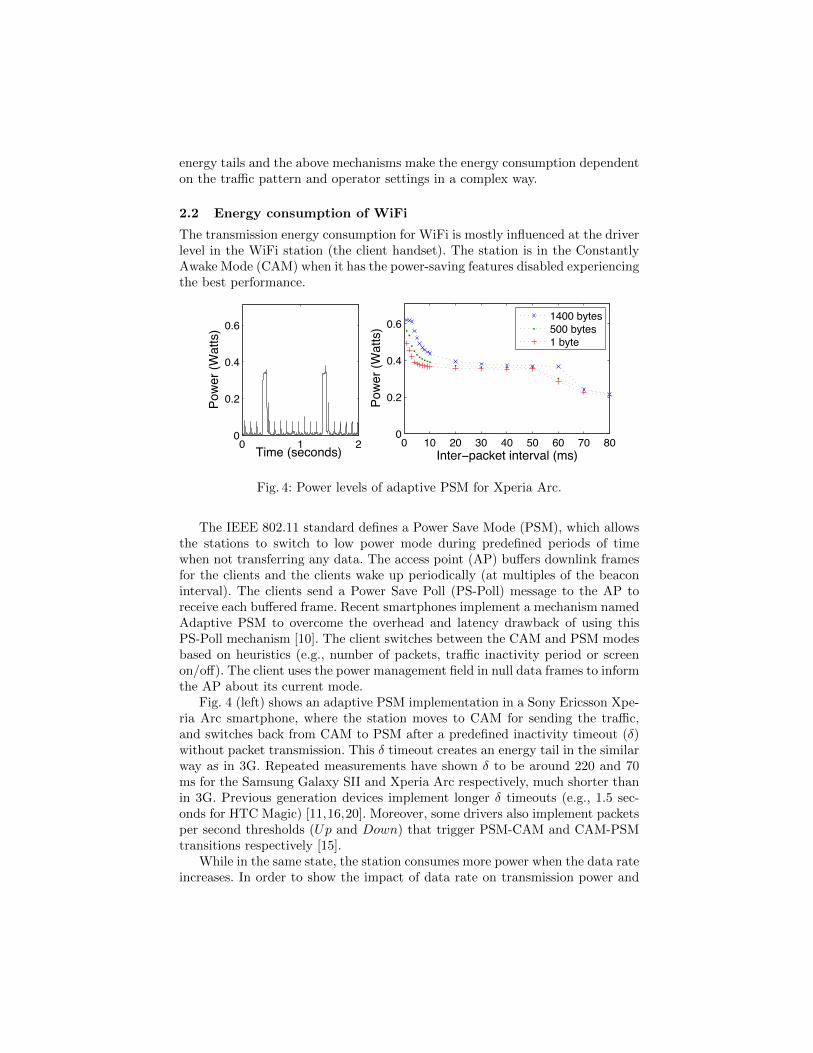
Fig. 4: Power levels of adaptive PSM for Xperia Arc.
The IEEE 802.11 standard defines a Power Save Mode (PSM), which allowsthe stations to switch to low power mode during predefined periods of timewhen not transferring any data. The access point (AP) buffers downlink framesfor the clients and the clients wake up periodically (at multiples of the beaconinterval). The clients send a Power Save Poll (PS-Poll) message to the AP toreceive each buffered frame. Recent smartphones implement a mechanism namedAdaptive PSM to overcome the overhead and latency drawback of using thisPS-Poll mechanism [10]. The client switches between the CAM and PSM modesbased on heuristics (e.g., number of packets, traffic inactivity period or screenon/off). The client uses the power management field in null data frames to informthe AP about its current mode.
Fig. 4 (left) shows an adaptive PSM implementation in a Sony Ericsson Xpe-ria Arc smartphone, where the station moves to CAM for sending the traffic,and switches back from CAM to PSM after a predefined inactivity timeout (δ)without packet transmission. This δ timeout creates an energy tail in the similarway as in 3G. Repeated measurements have shown δ to be around 220 and 70ms for the Samsung Galaxy SII and Xperia Arc respectively, much shorter thanin 3G. Previous generation devices implement longer δ timeouts (e.g., 1.5 sec-onds for HTC Magic) [11,16,20]. Moreover, some drivers also implement packetsper second thresholds (Up and Down) that trigger PSM-CAM and CAM-PSMtransitions respectively [15].
While in the same state, the station consumes more power when the data rateincreases. In order to show the impact of data rate on transmission power and
δ, we create an uplink data stream varying inter-packet interval and packet sizeusing the Xperia Arc. Fig. 4 (right) shows that for higher data rate (i.e., shortinter-packet interval), the average power level increases substantially. When theinter-packet interval is increased to 70 ms, the station switches back to PSMsince the inter-packet interval is greater than δ. This drops the average powerlevel. To sum up, adaptive PSM leads to a high impact by the data pattern onthe energy consumption of a WiFi station.
3 EnergyBox
EnergyBox captures the influence of the data transmission pattern on trans-mission energy consumption by performing trace-based iterative packet-drivensimulation. The usage of real data traces means that the corresponding energy isrealistic, and reflects the impact of the data pattern on real throughput and de-lay in the network. EnergyBox also accepts using synthetic data traces as input,creating repeatable tests for a given purpose. Given a packet trace and configu-ration parameters, the EnergyBox outputs the device states S(t) over time. Thetotal energy consumption is calculated by associating these states with powerlevels and integrating them over time. Device-specific power level values canbe obtained through measurement platforms as the one described in section 2or in the literature [4, 16, 19, 21, 24]. These operation power levels abstract thehardware dependency allowing to quantify an application footprint on a givendevice. EnergyBox simulates the 3G network parameters specified at operatorlevel and the adaptive PSM mechanism specified at the handset driver for WiFi.The design of the EnergyBox is rooted in measurements and a careful literaturestudy. By providing our code to the research and development community weoffer a simple to configure but still powerful approach to perform accurate datatransmission energy measurement studies.
3.1 3G model
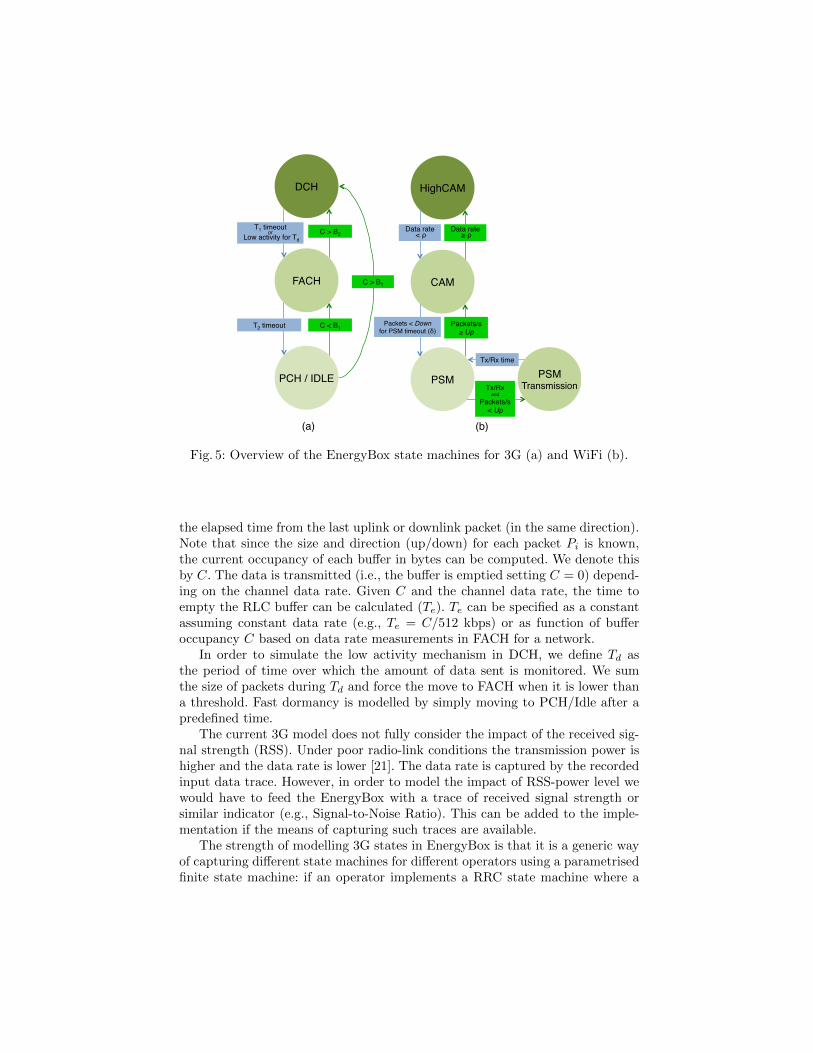
The RRC state transitions are captured by a parametrised finite state machinethat simulate the inactivity timers, the RLC buffers and a low activity mecha-nism in a packet-driven manner. Fig. 5(a) shows the states and the state tran-sitions we use in our 3G model.
For each packet Pi in the trace and its timestamp t(Pi), we calculate ∆i =t(Pi) − t(Pi−1) as the elapsed time between the two packets. ∆i is used tosimulate the inactivity timers T1 and T2: if ∆i > T1 or ∆i > T2, we triggerthe corresponding state transition. In order to account for the signalling timebetween states, every state transition has pre-defined a parametrised transitionduration. This can be obtained from a simple power measurement (e.g., the delayobserved in Fig. 3) or measuring the round-trip time for the different transitions.
There are four RLC buffer thresholds for PCH-FACH and FACH-DCH tran-sitions (see section 2): two uplink (Bu
1 and Bu2 ) and two downlink (Bd
1 and Bd2 ).
The simulation of the RLC buffers is done as follows: we define ∆ui and ∆d
i as
CAM!
PSM!
Packets < Down!for PSM timeout (δ)!
HighCAM!
Packets/s!≥ Up!
PSM!Transmission!
Data rate! < ρ!
Data rate! ≥ ρ!
Tx/Rx!and
Packets/s!< Up!
Tx/Rx time!
(a)! (b)!
DCH!
FACH!
PCH / IDLE!
T1 timeout!or!
Low activity for Td!
T2 timeout!
C > B2!
C > B1!
C < B1!
Fig. 5: Overview of the EnergyBox state machines for 3G (a) and WiFi (b).
the elapsed time from the last uplink or downlink packet (in the same direction).Note that since the size and direction (up/down) for each packet Pi is known,the current occupancy of each buffer in bytes can be computed. We denote thisby C. The data is transmitted (i.e., the buffer is emptied setting C = 0) depend-ing on the channel data rate. Given C and the channel data rate, the time toempty the RLC buffer can be calculated (Te). Te can be specified as a constantassuming constant data rate (e.g., Te = C/512 kbps) or as function of bufferoccupancy C based on data rate measurements in FACH for a network.
In order to simulate the low activity mechanism in DCH, we define Td asthe period of time over which the amount of data sent is monitored. We sumthe size of packets during Td and force the move to FACH when it is lower thana threshold. Fast dormancy is modelled by simply moving to PCH/Idle after apredefined time.
The current 3G model does not fully consider the impact of the received sig-nal strength (RSS). Under poor radio-link conditions the transmission power ishigher and the data rate is lower [21]. The data rate is captured by the recordedinput data trace. However, in order to model the impact of RSS-power level wewould have to feed the EnergyBox with a trace of received signal strength orsimilar indicator (e.g., Signal-to-Noise Ratio). This can be added to the imple-mentation if the means of capturing such traces are available.
The strength of modelling 3G states in EnergyBox is that it is a generic wayof capturing different state machines for different operators using a parametrisedfinite state machine: if an operator implements a RRC state machine where a
single packet triggers a state transition from Idle/PCH to DCH, we only haveto set the Bu
1 threshold to 0 bytes.
3.2 WiFi model
The EnergyBox WiFi captures the adaptive PSM mechanisms based on theinactivity timer and the number of packets per second. Handsets switch betweentwo states (PSM and CAM) using adaptive PSM, but in order to model the highdata rate behaviour of a handset, we define the state machine shown in Fig. 5(b).
The station only wakes up for beacons in the PSM state. PSM Transmissionstate represents the sending or reception of packets in the PSM mode, wherethe station switches to a high power only during the transmission interval. TheTx/Rx time is defined as reconfigurable parameter, which is obtained by sendingfew packets and observing the power profile (similar to Fig. 4(left)).
In PSM, the transition to CAM is triggered whenever the number of packetsper second count is higher than the Up threshold. When the number of packetsper second is less than Down for a predefined timeout time (δ), the stationswitches back to PSM.
We have observed that the power drain of the station increases with thethroughput as it was illustrated in section 2. This behaviour is captured bycomputing the throughput over a short time window and comparing it to a ρthreshold. Once the time window has been set, the ρ threshold can be decidedby sending a train of packets with different inter-packet interval (similar to Fig.4(right)) and measuring the power drain. When the threshold is exceeded, thestation switches to HighCAM, a state with a higher power level than CAM.
4 Evaluation
This section describes the evaluation of the EnergyBox accuracy against physi-cal energy measurements using the setup described in section 2. We define twometrics to quantify the accuracy of the EnergyBox: energy accuracy and time ac-curacy, which are described together with the methodology. The general method-ology is similar for both WiFi and 3G and follows the following steps: (1) A set ofapplications are used to create different traffic patterns. We simultaneously col-lect packet traces and measure the power trace Pd(t) of the device while creatingtraffic from one application at a time. This is done using the toolset describedin Fig. 2. The power trace Pd(t) represents the ground truth. (2) From the mea-sured power trace, we compute the expected device states Sd(t) using powerlevel thresholds. These thresholds are obtained earlier using measurements on agiven handset. (3) The EnergyBox is fed with the packet traces and outputs theinferred states Si(t). (4) We compare the EnergyBox inferred states Si(t) againstthe device states Sd(t) and compute the difference over time. T represents thetotal duration of a trace and f(x, y) simply returns 1 if x = y, and 0 otherwise.Time accuracy represents the percentage of time that the inferred states andthe measured states overlap (i.e. the higher the measure the better the accuracyover a time interval). It is defined as follows:
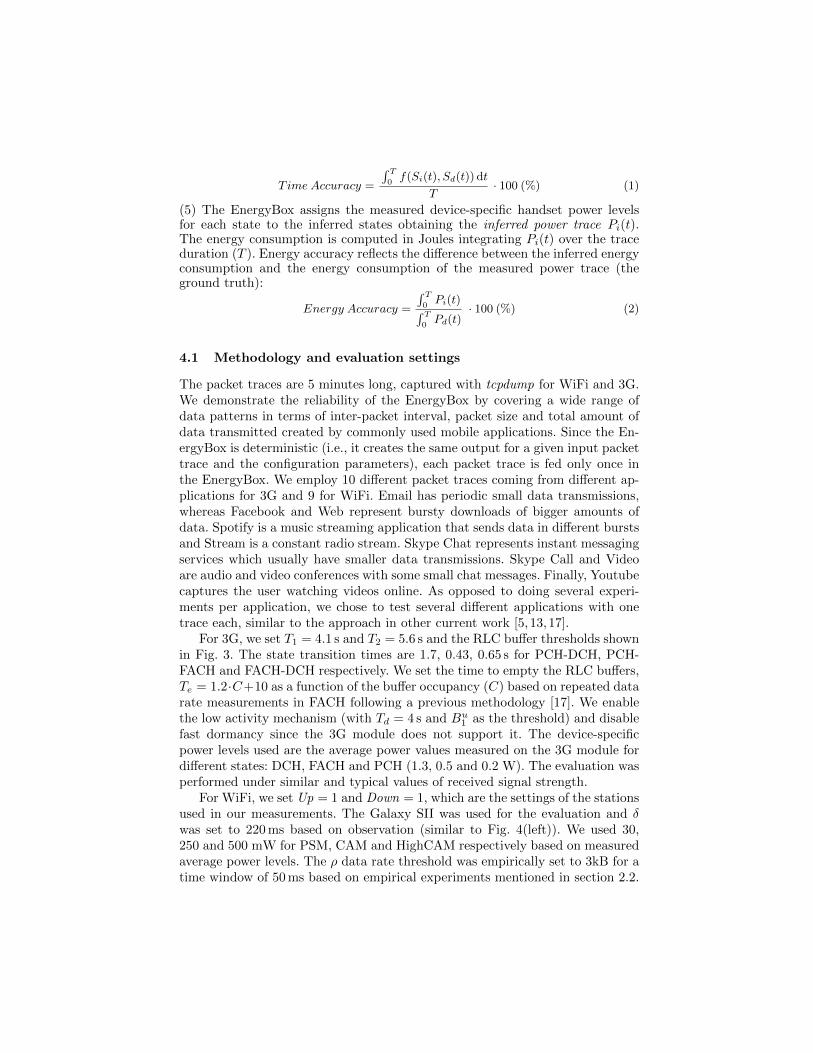
T ime Accuracy =
∫ T
0f(Si(t), Sd(t)) dt
T· 100 (%) (1)
(5) The EnergyBox assigns the measured device-specific handset power levelsfor each state to the inferred states obtaining the inferred power trace Pi(t).The energy consumption is computed in Joules integrating Pi(t) over the traceduration (T ). Energy accuracy reflects the difference between the inferred energyconsumption and the energy consumption of the measured power trace (theground truth):
Energy Accuracy =
∫ T
0Pi(t)∫ T
0Pd(t)
· 100 (%) (2)
4.1 Methodology and evaluation settings
The packet traces are 5 minutes long, captured with tcpdump for WiFi and 3G.We demonstrate the reliability of the EnergyBox by covering a wide range ofdata patterns in terms of inter-packet interval, packet size and total amount ofdata transmitted created by commonly used mobile applications. Since the En-ergyBox is deterministic (i.e., it creates the same output for a given input packettrace and the configuration parameters), each packet trace is fed only once inthe EnergyBox. We employ 10 different packet traces coming from different ap-plications for 3G and 9 for WiFi. Email has periodic small data transmissions,whereas Facebook and Web represent bursty downloads of bigger amounts ofdata. Spotify is a music streaming application that sends data in different burstsand Stream is a constant radio stream. Skype Chat represents instant messagingservices which usually have smaller data transmissions. Skype Call and Videoare audio and video conferences with some small chat messages. Finally, Youtubecaptures the user watching videos online. As opposed to doing several experi-ments per application, we chose to test several different applications with onetrace each, similar to the approach in other current work [5, 13,17].
For 3G, we set T1 = 4.1 s and T2 = 5.6 s and the RLC buffer thresholds shownin Fig. 3. The state transition times are 1.7, 0.43, 0.65 s for PCH-DCH, PCH-FACH and FACH-DCH respectively. We set the time to empty the RLC buffers,Te = 1.2·C+10 as a function of the buffer occupancy (C) based on repeated datarate measurements in FACH following a previous methodology [17]. We enablethe low activity mechanism (with Td = 4 s and Bu
1 as the threshold) and disablefast dormancy since the 3G module does not support it. The device-specificpower levels used are the average power values measured on the 3G module fordifferent states: DCH, FACH and PCH (1.3, 0.5 and 0.2 W). The evaluation wasperformed under similar and typical values of received signal strength.
For WiFi, we set Up = 1 and Down = 1, which are the settings of the stationsused in our measurements. The Galaxy SII was used for the evaluation and δwas set to 220 ms based on observation (similar to Fig. 4(left)). We used 30,250 and 500 mW for PSM, CAM and HighCAM respectively based on measuredaverage power levels. The ρ data rate threshold was empirically set to 3kB for atime window of 50 ms based on empirical experiments mentioned in section 2.2.
Since adaptive PSM in the Galaxy SII differentiates only two states (PSM andCAM), we perform the time accuracy evaluation of the EnergyBox WiFi usingthe two basic states of our WiFi state machine.
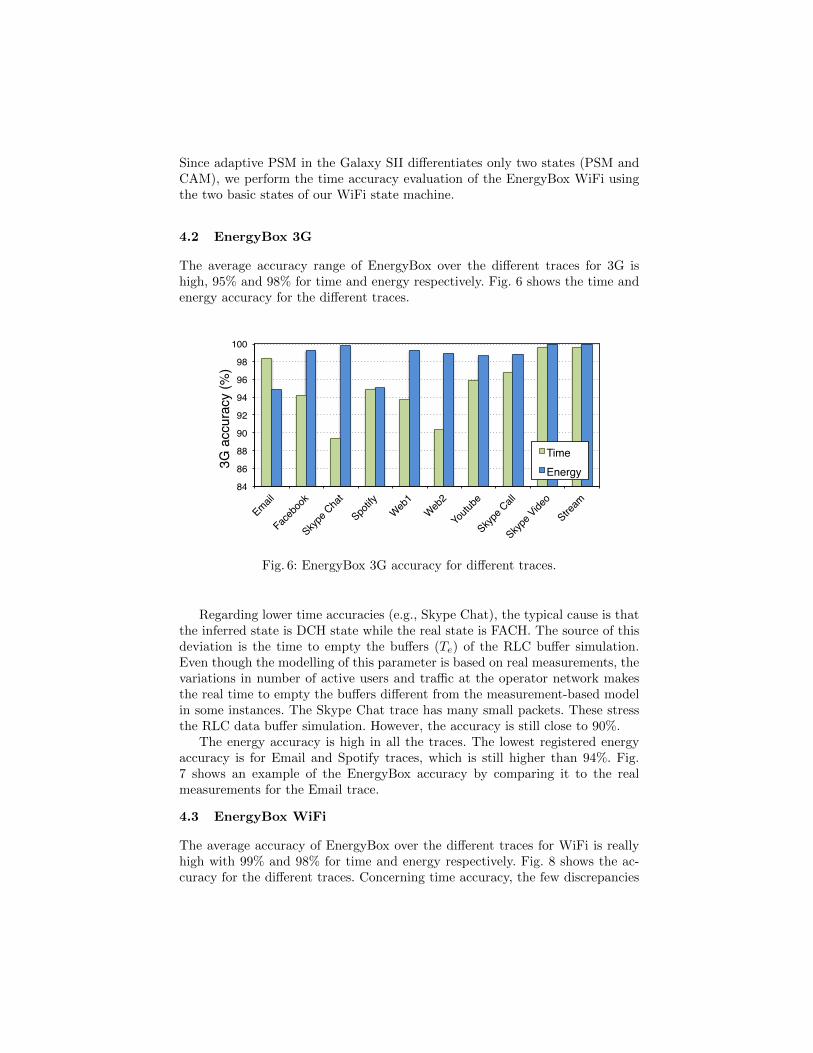
4.2 EnergyBox 3G
The average accuracy range of EnergyBox over the different traces for 3G ishigh, 95% and 98% for time and energy respectively. Fig. 6 shows the time andenergy accuracy for the different traces.
84!
86!
88!
90!
92!
94!
96!
98!
100!
Email!
Faceb
ook!
Skype C
hat!
Spotify!
Web1!
Web2!
Youtu
be!
Skype C
all!
Skype V
ideo!
Stream!
3G a
ccur
acy
(%)!
Time !Energy!
Fig. 6: EnergyBox 3G accuracy for different traces.
Regarding lower time accuracies (e.g., Skype Chat), the typical cause is thatthe inferred state is DCH state while the real state is FACH. The source of thisdeviation is the time to empty the buffers (Te) of the RLC buffer simulation.Even though the modelling of this parameter is based on real measurements, thevariations in number of active users and traffic at the operator network makesthe real time to empty the buffers different from the measurement-based modelin some instances. The Skype Chat trace has many small packets. These stressthe RLC data buffer simulation. However, the accuracy is still close to 90%.
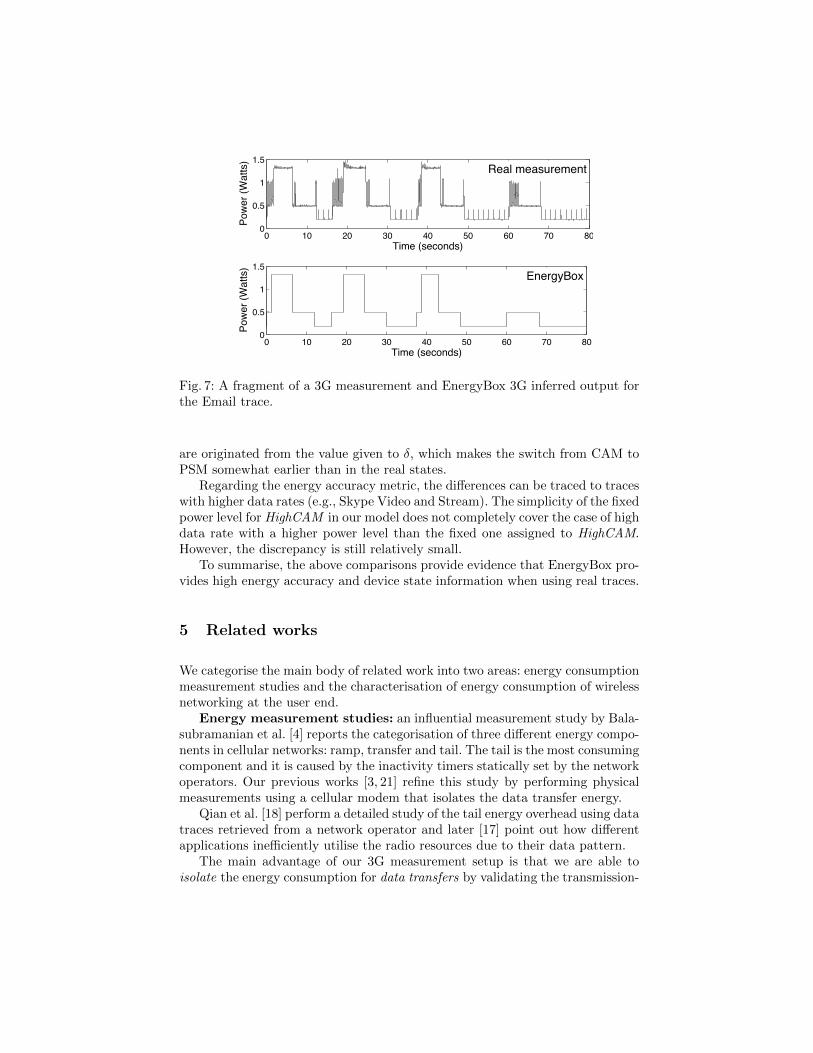
The energy accuracy is high in all the traces. The lowest registered energyaccuracy is for Email and Spotify traces, which is still higher than 94%. Fig.7 shows an example of the EnergyBox accuracy by comparing it to the realmeasurements for the Email trace.
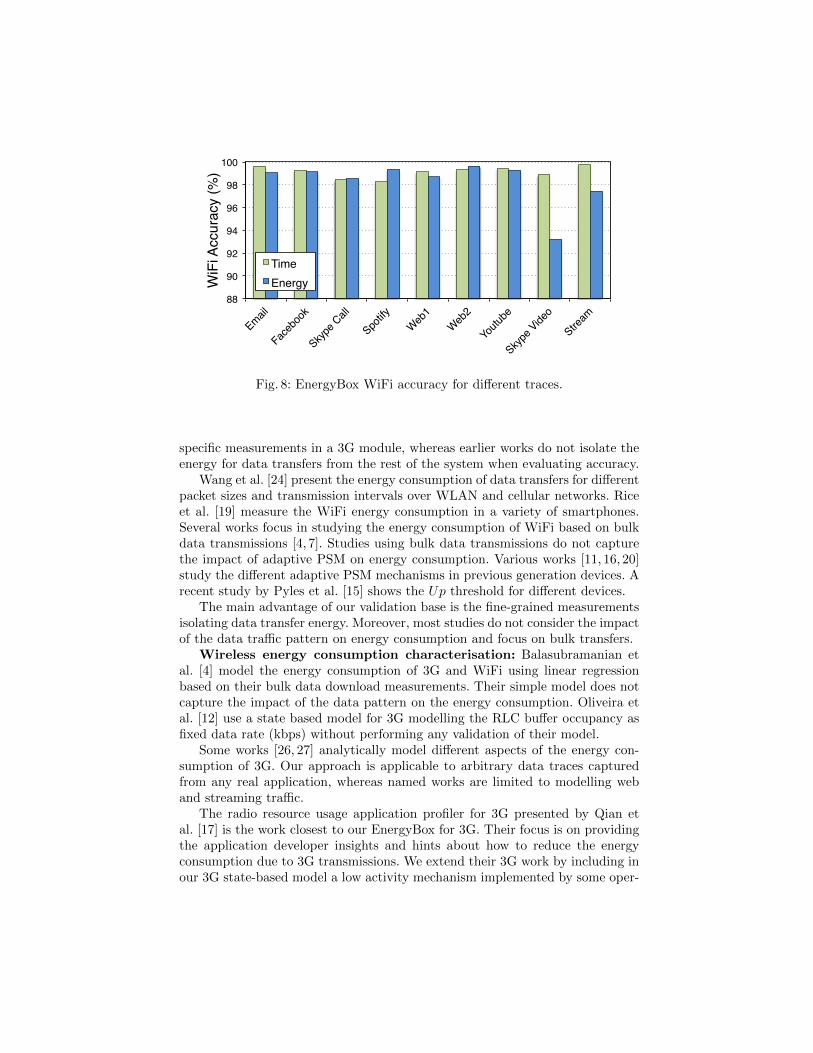
4.3 EnergyBox WiFi
The average accuracy of EnergyBox over the different traces for WiFi is reallyhigh with 99% and 98% for time and energy respectively. Fig. 8 shows the ac-curacy for the different traces. Concerning time accuracy, the few discrepancies
0 10 20 30 40 50 60 70 800
0.5
1
1.5
Time (seconds)Po
wer
(Wat
ts)
Real measurement
0 10 20 30 40 50 60 70 800
0.5
1
1.5
Time (seconds)
Pow
er (W
atts
)
EnergyBox
Fig. 7: A fragment of a 3G measurement and EnergyBox 3G inferred output forthe Email trace.
are originated from the value given to δ, which makes the switch from CAM toPSM somewhat earlier than in the real states.
Regarding the energy accuracy metric, the differences can be traced to traceswith higher data rates (e.g., Skype Video and Stream). The simplicity of the fixedpower level for HighCAM in our model does not completely cover the case of highdata rate with a higher power level than the fixed one assigned to HighCAM.However, the discrepancy is still relatively small.
To summarise, the above comparisons provide evidence that EnergyBox pro-vides high energy accuracy and device state information when using real traces.
5 Related works
We categorise the main body of related work into two areas: energy consumptionmeasurement studies and the characterisation of energy consumption of wirelessnetworking at the user end.
Energy measurement studies: an influential measurement study by Bala-subramanian et al. [4] reports the categorisation of three different energy compo-nents in cellular networks: ramp, transfer and tail. The tail is the most consumingcomponent and it is caused by the inactivity timers statically set by the networkoperators. Our previous works [3, 21] refine this study by performing physicalmeasurements using a cellular modem that isolates the data transfer energy.
Qian et al. [18] perform a detailed study of the tail energy overhead using datatraces retrieved from a network operator and later [17] point out how differentapplications inefficiently utilise the radio resources due to their data pattern.
The main advantage of our 3G measurement setup is that we are able toisolate the energy consumption for data transfers by validating the transmission-
88!
90!
92!
94!
96!
98!
100!
Email!
Faceb
ook!
Skype C
all!
Spotify!
Web1!
Web2!
Youtu
be!
Skype V
ideo!
Stream!
WiF
i Acc
urac
y (%
)!
Time !Energy!
Fig. 8: EnergyBox WiFi accuracy for different traces.
specific measurements in a 3G module, whereas earlier works do not isolate theenergy for data transfers from the rest of the system when evaluating accuracy.
Wang et al. [24] present the energy consumption of data transfers for differentpacket sizes and transmission intervals over WLAN and cellular networks. Riceet al. [19] measure the WiFi energy consumption in a variety of smartphones.Several works focus in studying the energy consumption of WiFi based on bulkdata transmissions [4, 7]. Studies using bulk data transmissions do not capturethe impact of adaptive PSM on energy consumption. Various works [11, 16, 20]study the different adaptive PSM mechanisms in previous generation devices. Arecent study by Pyles et al. [15] shows the Up threshold for different devices.
The main advantage of our validation base is the fine-grained measurementsisolating data transfer energy. Moreover, most studies do not consider the impactof the data traffic pattern on energy consumption and focus on bulk transfers.
Wireless energy consumption characterisation: Balasubramanian etal. [4] model the energy consumption of 3G and WiFi using linear regressionbased on their bulk data download measurements. Their simple model does notcapture the impact of the data pattern on the energy consumption. Oliveira etal. [12] use a state based model for 3G modelling the RLC buffer occupancy asfixed data rate (kbps) without performing any validation of their model.
Some works [26, 27] analytically model different aspects of the energy con-sumption of 3G. Our approach is applicable to arbitrary data traces capturedfrom any real application, whereas named works are limited to modelling weband streaming traffic.
The radio resource usage application profiler for 3G presented by Qian etal. [17] is the work closest to our EnergyBox for 3G. Their focus is on providingthe application developer insights and hints about how to reduce the energyconsumption due to 3G transmissions. We extend their 3G work by including inour 3G state-based model a low activity mechanism implemented by some oper-
ators, thereby improving the accuracy of the model. Moreover, our EnergyBoxcaptures different RRC state machines within a single parametrised one.
The work by Harjula et al. [8] creates a device-specific power profile for dif-ferent messaging intervals based on device measurements on a Nokia 95 for asingle operator. Their model uses indicators such as average packet size andsignalling frequency that need to be extracted from the data transmissions. In-stead, EnergyBox directly works on data traces and derives the RRC states ofdifferent networks simulating the RLC buffer thresholds and state transitions.Our approach is more general and simplifies energy consumption studies.
Xiao et al. [25] present a detailed power level model for the 802.11g inter-face. The modelled data pattern based on traffic burstiness was only validatedby simulating TCP download and upload traffic based on the amount of datatransferred. In comparison, our adaptive PSM model is validated against a set ofrepresentative application traces. Dong et al. [5] propose to automatically self-generate a system energy model within a device (including WiFi and 3G) usingthe smart battery interface.
A recent study by Pathak et al. [13] present a system-call-based power mod-elling for smartphones, including device dependent 3G and WiFi models. Tracingsystem calls typically requires modifications to the operating system (e.g., rootaccess), whereas we adopt a generic approach based on packet captures, whichare generally available1.
6 Conclusion and future work
Designing energy efficient solutions for wireless networks starts by energy aware-ness. To reduce energy waste, there is a need to provide visibility and understand-ing of the energy consumption that impacts battery lifetime at the user end aswell as elsewhere in the network. Our contribution makes the energy footprint ofthe network interface explicit, and presents a tool that provides accurate energyconsumption values given packet traces as input. We focus the EnergyBox on themost widespread wireless interfaces (3G and WiFi) and capture the parametersinfluencing the energy consumption most.
The design of EnergyBox is rooted in our physical energy measurements aswell as a careful literature study. We build on the fact that the handset energyconsumption in 3G is essentially driven by the inactivity timers and the RLCdata buffer thresholds that control RRC state transitions at the network oper-ator end. The energy consumption in WiFi is mostly influenced by the handsetdependent adaptive PSM mechanism implemented at driver level in the handset.We capture these aspects within parametrised state machines in the EnergyBoxand evaluate its accuracy against physical measurements. Our evaluation showsthat the EnergyBox provides accurate energy consumption estimates.
Including the impact of the signal strength into EnergyBox and extending ittowards other wireless interfaces such as the fourth generation cellular network
1 Android phones provide traffic statistics that can be captured every millisecond andpacket level capture is available without root permission from Android 4.0 on.
(LTE) and Bluetooth would be interesting directions for future work. In itscurrent state, however, the EnergyBox is found to be a valuable instrument instudying the energy consumption in different networking scenarios in our currentresearch. It has substantially aided efficient energy-related studies by emulatingdifferent parameter setups and replacing energy measurements.
Acknowledgment
This work was supported by the Swedish national graduate school in computer science(CUGS). The authors wish to thank the support of Ericsson AB, and in particular B-OHertz, Par Emanuelsson and Claes Alstromer for providing the 3G developer kit andfacilitating the measurement gathering phase.
References
1. T&M solution. Rohde & Schwarz.,http://www.rohde-schwarz.com/en/applications/optimize-the-quality-of-experience-of-mobile-devices-application-card 56279-35727.html
2. Trepn Profiler. Qualcomm,https://developer.qualcomm.com/mobile-development/development-devices/trepn-profiler
3. Asplund, M., Thomasson, A., Vergara, E.J., Nadjm-Tehrani, S.: Software-RelatedEnergy Footprint of a Wireless Broadband Module. In: Proceedings of the 9thACM International Symposium on Mobility Management and Wireless Access.MobiWac ’11, ACM (2011)
4. Balasubramanian, N., Balasubramanian, A., Venkataramani, A.: Energy Consump-tion in Mobile Phones: A Measurement Study and Implications for Network Ap-plications. In: Proceedings of ACM Internet Measurement Conference IMC (2009)
5. Dong, M., Zhong, L.: Self-Constructive High-Rate System Energy Modeling forBattery-powered Mobile Systems. pp. 335–348. MobiSys ’11, ACM (2011)
6. Falaki, H., Mahajan, R., Kandula, S., Lymberopoulos, D., Govindan, R., Estrin, D.:Diversity in Smartphone Usage. In: Proceedings of the 8th International Conferenceon Mobile Systems, Applications, and Services. pp. 179–194. MobiSys ’10, ACM(2010)
7. Friedman, R., Kogan, A., Krivolapov, Y.: On Power and Throughput Tradeoffs ofWiFi and Bluetooth in Smartphones. In: Proceedings of IEEE INFOCOM, 2011.pp. 900 –908 (2011)
8. Harjula, E., Kassinen, O., Ylianttila, M.: Energy Consumption Model for MobileDevices in 3G and WLAN Networks. In: IEEE Consumer Communications andNetworking Conference (CCNC), 2012. pp. 532 –537 (2012)
9. Holma, H., Toskala, A.: WCDMA for UMTS: HSPA Evolution and LTE. WileyOnline Library: Books, John Wiley & Sons (2010)
10. Krashinsky, R., Balakrishnan, H.: Minimizing Energy for Wireless Web Access withBounded Slowdown. In: Proceedings of the 8th Annual International Conferenceon Mobile Computing and Networking. pp. 119–130. MobiCom ’02, ACM (2002)
11. Manweiler, J., Roy Choudhury, R.: Avoiding the Rush Hours: WiFi Energy Man-agement via Traffic Isolation. IEEE Transactions on Mobile Computing, 11(5), 739–752 (2012)
12. Oliveira, T., Ursini, E., Timoteo, V.: Simulation Inspired Model for EnergyConsumption in 3G Always-On Mobiles. In: IEEE 2nd National Conference onTelecommunications (CONATEL), 2011. pp. 1 –7 (2011)
13. Pathak, A., Hu, Y.C., Zhang, M.: Where is the energy spent inside my app?: FineGrained Energy Accounting on Smartphones with Eprof. In: Proceedings of the7th ACM European Conference on Computer Systems. pp. 29–42. EuroSys ’12(2012)
14. Paul, U., Subramanian, A., Buddhikot, M., Das, S.: Understanding Traffic Dy-namics in Cellular Data Networks. In: INFOCOM, 2011 Proceedings IEEE. pp.882–890 (2011)
15. Pyles, A.J., Qi, X., Zhou, G., Keally, M., Liu, X.: SAPSM: Smart Adaptive 802.11PSM for Smartphones. In: Proceedings of the 14th International Conference onUbiquitous Computing. UbiComp ’12, ACM (2012)
16. Pyles, A.J., Ren, Z., Zhou, G., Liu, X.: SiFi: Exploiting VoIP Silence for WiFi En-ergy Savings in Smart Phones. In: Proceedings of the 13th International Conferenceon Ubiquitous Computing. pp. 325–334. UbiComp ’11, ACM (2011)
17. Qian, F., Wang, Z., Gerber, A., Mao, Z., Sen, S., Spatscheck, O.: Profiling ResourceUsage for Mobile Applications: A Cross-Layer Approach. pp. 321–334. MobiSys ’11,ACM (2011)
18. Qian, F., Wang, Z., Gerber, A., Mao, Z.M., Sen, S., Spatscheck, O.: CharacterizingRadio Resource Allocation for 3G Networks. In: Proceedings of the 10th AnnualConference on Internet Measurement. pp. 137–150. IMC ’10, ACM (2010)
19. Rice, A., Hay, S.: Measuring Mobile Phone Energy Consumption for 802.11 Wire-less Networking. Pervasive and Mobile Computing 6. pp. 593–606 Elsevier (2010)
20. Rozner, E., Navda, V., Ramjee, R., Rayanchu, S.: NAPman: Network-AssistedPower Management for WiFi Devices. pp. 91–106. MobiSys ’10, ACM (2010)
21. Vergara, E.J., Nadjm-Tehrani, S.: Energy-Aware Cross-Layer Burst Buffering forWireless Communication. In: Proceedings of the 3rd International Conference onFuture Energy Systems: Where Energy, Computing and Communication Meet.e-Energy ’12, ACM (2012)
22. Vergara, E.J., Prihodko, M., Nadjm-Tehrani, S.: Mobile Location Sharing: An En-ergy Consumption Study (poster). In: Proceedings of the 4rd International Confer-ence on Future Energy Systems: Where Energy, Computing and CommunicationMeet. e-Energy ’13, ACM (2013)
23. Vergara, E.J., Sanjuan, J., Nadjm-Tehrani, S.: Kernel Level Energy-Efficient 3GBackground Traffic Shaper for Android Smartphones. In: Proceedings of the9th International Wireless Communications and Mobile Computing Conference(IWCMC), IEEE (2013)
24. Wang, L., Manner, J.: Energy Consumption Analysis of WLAN, 2G and 3G In-terfaces. In: Proceedings of the 2010 IEEE/ACM Int’l Conference on Green Com-puting and Communications & Int’l Conference on Cyber, Physical and SocialComputing. pp. 300–307. GREENCOM-CPSCOM ’10, IEEE (2010)
25. Xiao, Y., Savolainen, P., Karppanen, A., Siekkinen, M., Yla-Jaaski, A.: PracticalPower Modeling of Data Transmission over 802.11g for Wireless Applications. In:Proceedings of the 1st International Conference on Energy-Efficient Computingand Networking. pp. 75–84. e-Energy ’10, ACM (2010)
26. Yang, S.R., Yan, S.Y., Hung, H.N.: Modeling UMTS Power Saving with BurstyPacket Data Traffic. IEEE Transactions on Mobile Computing, 6(12),(2007)
27. Yeh, J.H., Chen, J.C., Lee, C.C.: Comparative Analysis of Energy-Saving Tech-niques in 3GPP and 3GPP2 Systems. IEEE Transactions on Vehicular Technology,58(1), 432–448 (2009)