energy: thinking ahead - sma solar · energy: thinking ahead. sma at a glance sma group jan. –...
TRANSCRIPT

SMA SOLAR TECHNOLOGY AG
H A L F -Y E A R LY F I N A N C I A L R E P O R TJ A N UA RY TO J U N E 2 015
ENERGY:THINKING AHEAD

SMA AT A GLANCE
SMA Group Jan. – June
(Q1– Q2) 2015Jan. – June
(Q1– Q2) 2014 Change Year 2014Sales in € million 429.3 341.2 26 % 805.4International share in % 87.2 73.4 76.0Inverter output sold MW 3,153 1,990 58 % 5,051Capital expenditure in € million 32.4 32.9 –2 % 75.5Depreciation and amortization in € million 36.2 45.4 –20 % 106.5EBITDA in € million 21.3 –17.0 n. m.1 –58.4EBITDA margin in % 5.0 –5.0 n. m.1 –7.3Consolidated net result in € million –21.4 –44.9 n. m.1 –179.3Earnings per share2 € –0.62 –1.29 0.67 –5.16Employees3 4,564 5,024 –9 % 5,037in Germany 3,177 3,569 –11 % 3,515abroad 1,387 1,455 –5 % 1,522
SMA Group 06/30/2015 12/31/14 ChangeTotal assets in € million 1,133.7 1,180.3 –4 %Equity in € million 534.7 552.0 –3 %Equity ratio in % 47.2 46.8 Net working capital4 in € million 235.1 251.0 –6 %Net working capital ratio5 in % 26.3 31.2 Net cash6 in € million 211.0 225.4 –6 %
1 Not meaningful2 Converted to 34,700,000 shares3 Average during the period; without temporary employees4 Inventories and trade receivables minus trade payables5 Relating to the last twelve months (LTM)6 Cash holdings + time deposits + asset management + cash on hand pledged as collatoral – loan liabilities (excluding derivatives)
SMA Solar TecDAX DAX
150
125
100
75
50
JAN FEB MAR APR MAY JUN
SMA SHARE PERFORMANCE IN THE FIRST HALF OF 2015 in %

2 The Share
7 Interim Management Report January to June 2015 8 Basic Information About the Group 14 Economic Report 22 Supplementary Report 23 Risk and Opportunities Report 24 Forecast Report
31 Interim Consolidated Financial Statements January to June 2015 38 Condensed Notes as of June 30, 2015 60 Responsibility Statement 61 Auditor’s Report 62 Other Information 62 Registered Trademarks 62 Disclaimer 63 Financial Calendar
Contents

2 SMA Solar Technology AG Half-Yearly Financial Report January to June 2015
Stock Markets Grow Considerably – Euro Falls Due to GreeceIn the first months of 2015, the capital markets initially developed positively. A major topic at the beginning of the year was the start of government bond buying by the European Central Bank (ECB), which thus reiterated its course of expansionary monetary policy. Until at least September 2016, the ECB intends to pump €60 billion a month into the financial markets by buying government bonds to stimulate the economy in the single currency area and to counter potential deflation. In the first months, the DAX climbed from one new high to the next. How-ever, stock values were hit in June by the rekindling of the Greek crisis and concerns about Greece’s place in the euro zone. The euro lost around 8.2% from the start of the year to the end of the second quarter and was ultimately listed at EUR/USD 1.1141.
The most important German stock market barometer gained 26.73% at its peak in the first half of 2015. The DAX exceeded 12,000 points in mid-March and reached a new record high on March 16, 2015, at 12,219.05 points. On the same day, the index ceased trading at the highest ever closing level of 12,167.72 points. Due to the wor-ries about Greece, the DAX could not hold onto its interim gains. At the end of the second quarter, it was listed at 10,944.97 points, up 12.09% on the beginning of the year.
The TecDAX, the stock market barometer for technology stocks, made similarly significant gains in the first half of the year. The index started the stock market year at 1,370.92 points (opening price) and counted 1,642.21 points on June 30, 2015 – an increase of 18.82%. The TecDAX reached its record high to date on the basis of closing prices on May 22, 2015, at 1,743.08 points.
The Share

3To Our Shareholders The ShareInterim Management ReportInterim Consolidated Financial StatementsOther Information
SMA Solar TecDAX DAX
150
125
100
75
50
SMA SHARE PERFORMANCE IN THE FIRST HALF OF 2015 in %
JAN FEB MAR APR MAY JUN
SMA Share Climbs Rapidly Following Announcement of Siemens PartnershipThe SMA share started the 2015 stock market year at €15.32 (opening price on January 2, 2015, Xetra trading platform) but fell in value considerably during January. Shortly before the publication of the forecast for the 2015 fiscal year, the share marked its lowest price since it was first listed at €10.28 (intraday value) on January 29, 2015.
The price recovered following the 7th Capital Markets Day. During the event on January 30, 2015, SMA’s Chief Executive Officer Pierre-Pascal Urbon announced details of the Company’s transformation for the first time, including the planned savings on fixed costs of more than €160 million and the global reduction of up to 1,600 full-time positions. In addition, SMA’s management presented the corporate strategy, SMA’s unique selling propositions and major product innovations to the investors, analysts and members of the press.
On May 13, 2015, SMA presented the results of the first quarter. The sales and earnings forecast announced on March 26, 2015, by the Managing Board at the press conference on financial statements was achieved. The SMA share was therefore one of the day’s winners in the TecDAX and gained in value over the following weeks to up to €19.12 (closing price on June 5, 2015, Xetra trading platform). However, the highest daily gain was achieved on June 10, 2015. This was due to the announcement of the partnership between SMA and Siemens in the segment of large-scale PV power plants during Intersolar Europe in Munich. At its peak, the share climbed by 24.46% to €22.16, reaching its highest value in nearly nine months. At the end of June, the share was listed at €20.05, up 31.39% since the beginning of the year. The SMA share was mid-table among the most actively traded shares in the TecDAX in the first half of 2015 (18th place). The average trading volume was 187,239 shares.

4 SMA Solar Technology AG Half-Yearly Financial Report January to June 2015
Analysts Maintain Focus on SMA Share As a worldwide leading specialist in PV system technology, SMA operates in a volatile market. Due to structural change, listed European solar stocks posted significant losses with regard to their market capitalization in recent years. In Germany, for example, SMA is the only remaining solar company in the TecDax. Many investment banks adjusted their European research activities for the solar sector accordingly. SMA is one of the few companies in the sector that a comparatively large number of banks and securities firms are still regularly reporting on. At the end of the reporting period, a total of nine institutions were covering the Company.
RESEARCH - COVERAGE
Institution Name Citi Jason Channell Deutsche Bank Alexander Karnick HSBC Trinkaus & Burkhardt Christian Rath Independent Research Sven Diermeier Landesbank Baden-Württemberg Erkan Aycicek Main First Andreas Thielen MATELAN Research Peter Wirtz Natureo Finance Ingo Queiser Warburg Research Arash Roshan Zamir
Stable Shareholder StructureThe shareholder structure remained unchanged in the reporting period. 25.05% of the shares are in free float and 25.20% are bundled in a pooling agreement. The founders of SMA Solar Technology AG, their foundations and families hold 29.75% of the shares. With a shareholding of 20%, Danfoss A/S is an important anchor investor for SMA.
Press Conference on Financial Statements: Information on Company TransformationAt the press conference on financial statements in Frankfurt/Main on March 26, 2015, CEO and CFO Pierre-Pascal Urbon announced the business figures for 2014. Sales and operating earnings before restructuring expenses were slightly above or in line with the published forecast.
The Managing Board also confirmed the sales and earnings forecast for 2015 as a whole, first published on Janu-ary 30, 2015. On this date, the forecast predicted sales of €730 million to €770 million and operating earnings (EBIT) of €-30 million to €-60 million.

5To Our Shareholders The ShareInterim Management ReportInterim Consolidated Financial StatementsOther Information
4.00
3.00
2.00
1.00
02011 2012 2013 2014
pay out ratio of consolidated earnings dividend
27 % 28 %1.30
0.600.00 0 % 0.00 0 %
In addition, the Managing Board informed the press, investors and analysts that the transformation of the Com-pany was going according to plan and that the unfortunate but necessary staff reduction of approximately 1,600 full-time positions was expected to be implemented without any involuntary layoffs. The fast pace at which the transformation of SMA is being implemented was welcomed by many analysts. After the press conference, Pierre-Pascal Urbon answered questions from the financial and business press and analysts. He also visited institu-tional investors at the Frankfurt financial center.
Annual General Meeting: Discharge of Managing Board and Supervisory Board Approved by Large MajorityThe SMA Annual General Meeting was held at the Kongress Palais in Kassel on May 21, 2015. The shareholders granted discharge to the Managing Board and Supervisory Board for the 2014 fiscal year almost unanimously. The remaining agenda items also received the majority approval of the shareholders’ meeting. The representatives of the German Society for the Protection of Securities Holders (Deutsche Schutzgemeinschaft für Wertpapiere, DSW) and the Association for the Protection of Private Shareholders (Schutzgemeinschaft der Kleinaktionäre, SdK) expressed their support for the strategy put forward by the Managing Board and the measures for the Company’s transformation. Around 300 shareholders attended the Annual General Meeting. Voter representation was 83%. The Annual General Meeting again followed the Managing and Supervisory Boards’ proposal not to distribute a dividend for the 2014 fiscal year. The Company makes all information and documents available on its website at www.SMA.de/AnnualGeneralMeeting.
See website www.SMA.de/Annual-
GeneralMeeting
DIVIDEND in €
20.00 % Danfoss A/S
25.05 % Free Float*25.20 % Pool SMA Solar Technology AG
29.75 %, Shares under control of the SMA founders, their trusts and families
* Free Float calculated according to guidelines for stock indices of Deutsche Börse
SHAREHOLDER STRUCTURE in %

6 SMA Solar Technology AG Half-Yearly Financial Report January to June 2015
Amended Communication with Analysts and InvestorsIn terms of capital market communication, SMA concentrates on the main financial centers in Europe. By the end of July 2015, the SMA Managing Board had visited institutional investors in London, Edinburgh, Zurich and Frankfurt and provided information about the current market and competitive situation, the Company’s unique selling propo-sitions, the progress of the Company’s transformation, and its financial development. The roadshow presentations are available to all investors on the investor relations website www.IR.SMA.de. In order to process European in-vestors’ queries more efficiently, SMA will in the future provide a contact form on the website and process queries exclusively via this form. SMA can no longer offer direct communication with investors from North America, Asia/Pacific and the Middle East because of reduced staffing resources. However, these investors can obtain com-prehensive information about SMA via the Investor Relations website or the abovementioned research analysts.
SMA invites investors, analysts and members of the press to Capital Markets Day at the beginning of every year. This event is held at the headquarters in Niestetal, near Kassel, Germany. On Capital Markets Day, SMA’s man-agement presents the corporate strategy, financial key figures and strategically important innovations, among other content. In addition, attendees of Capital Markets Day usually have the opportunity to visit SMA’s production plant at its headquarters in Niestetal. The last Capital Markets Day on January 30, 2015, proved very popular with the 35 investors, analysts and members of the press in attendance.
See website www.IR.SMA.de

8 Basic Information About the Group 8 Business Activity and Organization 10 Research and Development 12 Employees
14 Economic Report 14 General Economic Conditions and Economic Conditions in the Sector 16 Impact of General Conditions on Business Development 16 Results of Operations 20 Financial Position 21 Net Assets 21 Capital Expenditure
22 Supplementary Report
23 Risk and Opportunities Report 23 Risk and Opportunities Management
24 Forecast Report 24 The General Economic Situation: The Global Economy Is Growing, Albeit at a Slower Pace 24 Future General Economic Conditions in the Photovoltaics Sector 26 Overall Statement From the Managing Board on the Expected Development of SMA Group
Interim Management Report January to June 2015

8 SMA Solar Technology AG Half-Yearly Financial Report January to June 2015
Basic Information About the GroupBusiness Activity and OrganizationSMA Solar Technology AG (SMA) and its subsidiaries (SMA Group) develop, produce and distribute PV inverters, transformers, choke coils, monitoring and energy management systems for PV systems and power electronic components for railway technology. Another area of business is providing services such as operation and mainte-nance service for photovoltaic power plants (O&M business), in addition to others. Since the beginning of 2015, SMA Group has operated under a new functional organization.
Legal Structure of the GroupAs the parent company of SMA Group, SMA headquartered in Niestetal near Kassel, Germany, provides all of the functions required for its operative business. With the exception of Jiangsu Zeversolar New Energy Co., Ltd., the parent company holds, either directly or indirectly, 100% of the shares of all the operating companies that belong to the SMA Group. As of June 30, 2015, SMA has a 99.25% majority shareholding in Jiangsu Zeversolar New Energy Co., Ltd. The half-yearly financial report includes information regarding the parent company and, directly or indirectly, all 37 Group companies (Q2 2014: 36), including 8 domestic companies and 29 companies based abroad.
New Organizational StructureIn accordance with market requirements, SMA regularly reviews its organizational structure in order to make it as efficient as possible. Given the considerable decline in sales in recent years, SMA adjusted its organizational structure at the beginning of 2015. Since January 1, 2015, SMA Group has operated under a new functional organization. In the new organization, the Residential, Commercial, Utility and Service business units take overall responsibility and manage Development, Sales and Operations. Railway Technology, Zeversolar as well as Off-Grid and Storage business have been combined under Other Business. This compact organization allows for faster decisions and a leaner management structure.
ORGANIZATIONAL STRUCTURE
SMA Group
ResidentialBusiness Unit
CommercialBusiness Unit
UtilityBusiness Unit
ServiceBusiness Unit
Other Business

9To Our ShareholdersInterim Management Report Basic Information About the GroupInterim Consolidated Financial StatementsOther Information
Management and ControlAs required by the German Stock Corporation Act (AktG), the executive bodies consist of the Annual General Meeting, the Managing Board and the Supervisory Board. The Managing Board manages the Company; the Supervisory Board appoints, supervises and advises the Managing Board. The Annual General Meeting elects the shareholder representatives to the Supervisory Board and grants or refuses discharge to the Managing Board and the Supervisory Board.
Downsizing of the Managing BoardThe Supervisory Board of SMA Solar Technology AG reduced the number of Managing Board members as part of the Company’s transformation. Lydia Sommer left the Managing Board at the end of February 2015. Since March 1, 2015, the SMA Managing Board has comprised the following members: SMA Chief Executive Officer Pierre-Pascal Urbon is responsible for Strategy and, in addition, as Chief Financial Officer (CFO) for Finance, Legal and Compliance as well as for Operations. Roland Grebe, formerly Board Member for Technical Innovation, is in charge of Human Resources and IT. In addition, he is the new Labor Director at SMA Solar Technology AG. Dr.-Ing. Jürgen Reinert has taken on overall responsibility for Technology. Martin Kinne presides over Sales and Service.
Changes to the Supervisory BoardThe SMA Supervisory Board, which represents shareholders and employees equally, consists of Roland Bent, Peter Drews, Dr. Erik Ehrentraut (Chairman), Kim Fausing (Deputy Chairman), Dr. Winfried Hoffmann and Reiner Wettlaufer. The shareholder representatives were confirmed in office at the Annual General Meeting on May 21, 2015. Since the scheduled election on May 27, 2015, the employees have been represented by Oliver Dietzel, Johannes Häde, Heike Haigis, Yvonne Siebert, Dr. Matthias Victor and Hans-Dieter Werner.

10 SMA Solar Technology AG Half-Yearly Financial Report January to June 2015
Research and DevelopmentAs the global market leader in photovoltaics, SMA has set trends in the global photovoltaics industry for many years and our development capabilities have received numerous accolades. Technological development is the key to achieving both a global energy transition and necessary cost cuts. SMA is increasingly focusing on close collaboration with partners. Pooling core competencies with specialists from other fields makes it possible to develop ideally harmonized solutions.
Cooperative Development ApproachOur development concepts enable us to anticipate future system technology requirements. Customers used to be concerned primarily with energy yield, service life and design flexibility. In the future, however, price, minimal energy costs and system integration as well as connectivity will be the most important factors in making a purchasing decision. As the technology leader in photovoltaic system technology, it is our aim to cut costs through develop-ments while simultaneously designing complete system solutions. By standardizing the core inverter, we can increase the proportion of identical components across the entire portfolio. Customization in line with different markets and customer needs will be implemented through the connection area and software.
Collaboration is becoming ever more important for the development of comprehensive solutions: Be it strategic collaboration with specialists from other industries such as Danfoss and Siemens or participation in various expert committees, associations and research projects – SMA has a broad international network.
New Solutions for Greater Customer BenefitIn the first half of 2015, SMA successfully launched the first products of its new inverter generation in the smaller rooftop system market segment (Residential). The completely redeveloped Sunny Boy 1.5/2.5 has met with an extremely positive response from customers since it was launched in mid-April 2015. Among other features, the product, with outputs of 1.5 kW and 2.5 kW, enables high self-consumption, is extremely versatile and can be easily integrated into the home grid via plug and play in a matter of minutes. Its innovative design, broader input voltage range and novel communication concept offer advantages in installation and commissioning. Furthermore, its direct communication with the SMA Energy Meter not only enables the 70% curtailment required in Germany but also makes complete curtailment and increased self-consumption possible. This functionality is necessary to stabilize transmission lines when renewable energy makes up a large proportion of electricity production. With the newly integrated user interface, customers can monitor PV system data on any smartphone or tablet. Weighing only 9 kg, the device can also be mounted with just two screw fittings and does not require an additional wall mounting bracket.

11To Our ShareholdersInterim Management Report Basic Information About the GroupInterim Consolidated Financial StatementsOther Information
In the field of intelligent energy management with the SMA Smart Home, SMA announced its collaboration with the Dutch home automation specialist Plugwise in the reporting period. With this partnership, we are increasing the potential international applications of the SMA Smart Home. The system from Plugwise enables complete household energy monitoring with compatible and internationally deployable radio-controlled sockets and measure-ment modules. All major electrical appliances can thus be integrated into the energy management and monitoring (heating, air conditioning and lights).
In the medium-sized inverter segment (Commercial), SMA had the new Sunny Tripower 60-US certified for the U.S. market as planned in March 2015. In the U.S. market, in particular, which is currently registering strong growth in this application segment, SMA estimated that it gained additional market shares with its Sunny Tripower products. The 60 kW product that has now been launched is an attractive solution that will further consolidate SMA’s position as market leader in the U.S. commercial and utility segment and support the trend toward the decentralized construction of ground-based PV systems.
At Intersolar Europe in Munich, SMA presented additional innovations from the commercial segment: The Sunny Tripower 20000TL/25000TL inverters with new grid management functions were presented alongside the SMA system solution with the Sunny Tripower 60 inverter. The Sunny Portal Professional Package for professional moni-toring of commercial PV farms also improves operating processes and reduces costs. As the central communica-tion unit for monitoring, data recording and control of small commercial PV systems with up to 25 inverters, SMA now offers the new SMA Cluster Controller in addition to the previous standard solution for large-scale PV power plants.
In order to increase market share in Japan over the course of 2015, SMA has further augmented its product port-folio. For example, the new Sunny Tripower with an output of 25 kW was launched onto the market. The device is based on the current, global Sunny Tripower platform and primarily offers considerable advantages over the products of local competitors in terms of efficiency, cost, flexibility of application, and grid integration.
In June, SMA announced its partnership with Siemens’ energy management division in the PV power plant seg-ment (Utility). As partners, we offer customers in international competition coordinated system solutions and services from a single source – from the DC side to grid connection. The first result of the cooperation is an innovative container solution that unites a 2.5 megawatt central inverter from SMA and a medium-voltage transformer and medium-voltage switchgear from Siemens in a turnkey, standard container. SMA presented the Medium Voltage Power Station 2200SC/2500SC for the first time at Intersolar Europe in Munich, where it was a crowd drawer. The system solution for DC voltages from 1,000/1,500 volt can be used worldwide in large-scale and the larg-est-scale PV power plants currently being installed, can be erected outdoors in all ambient conditions and reduces transport, installation and operating costs by virtue of its power density and compactness, which are unique on the market.

12 SMA Solar Technology AG Half-Yearly Financial Report January to June 2015
In addition, SMA launched a new central inverter in the first quarter of 2015. The Sunny Central 1000CP XT rounded off the Company’s globally successful CP central inverter family with an additional power class. Photo voltaics projects requiring tenders for 1-MW blocks are particularly benefiting from the new device. As a component of the SMA Medium Voltage Power Station, the Sunny Central 1000CP XT devices deliver an output of 2 MW in the turnkey container station, which can be used globally. This enables solar power plant developers to face the high price pressure and tight schedules required under tendering procedures.
In the Other Business segment, customers are increasingly focusing on the integration of battery storage systems, be it here in Germany for small residential PV systems to increase self-consumption or in off-grid regions where the integration of photovoltaics into existing diesel power supplies on an industrial scale saves costs in the long term (PV/diesel hybrid systems). Here, in January 2015, SMA launched new battery inverters from the Sunny Island brand for small PV systems, which allow a markedly flexible and cost-effective solution both for grid-connected systems and for standalone off-grid systems. SMA is collaborating with all leading international battery manufac-turers. We are thus making it possible for our customers to utilize the best, most modern and most efficient battery technology on the market. In addition, we are working closely with German and American car manufacturers. In order to continue promoting the grid and market integration of photovoltaics, CHP plants and decentralized stor-age, SMA has also been working with the energy and IT company LichtBlick since June 2015. The aim of the collaboration is to intelligently integrate single- and multi-family homes into the electricity markets with energy management.
EmployeesSocially Responsible Staff Reduction in a Short Time Frame In the scope of the company’s transformation, SMA is planning to reduce 1,600 full-time positions worldwide. SMA has largely completed the most extensive round of personnel adjustments in the history of the company without involuntary layoffs in the reporting period. Only very few companies in Germany have reduced their workforce by such a high percentage in a socially responsible manner and in such a short period of time. This was possible at SMA with a process characterized by openness, fairness and cooperativeness.
Since the end of the severance program in March, extensive restructuring has been underway to reallocate responsibilities and teams. We are paying particular attention to individual employees’ wishes in order to maintain SMA employees’ high levels of motivation and attachment to the company. In order to make the transfer process successful, the Management and Works Council are cooperating closely and very constructively.

13To Our ShareholdersInterim Management Report Basic Information About the GroupInterim Consolidated Financial StatementsOther Information
Considerable Headcount ReductionIn comparison to the same period in 2014, the number of employees as of the reporting date declined consider-ably. In Germany, the number of employees fell by 19.0%, or 662 people, to 2,823 employees (June 30, 2014: 3,485 employees, figures exclude temporary employees). The number of employees abroad also declined. The number fell by 222 to a total of 1,311 employees (June 30, 2014: 1,533 employees, figures exclude temporary employees).
EMPLOYEES
Reporting date 06/30/2015 06/30/2014 06/30/2013 06/30/2012 06/30/2011
Employees (excl. temporary employees) 4,134 5,018 5,694 5,685 4,815of which domestic 2,823 3,485 4,297 4,719 4,315of which abroad 1,311 1,533 1,397 966 500Temporary employees 597 713 740 1,297 1,453
Total employees (incl. temporary employees) 4,731 5,731 6,434 6,982 6,268
At the end of the reporting period, SMA Group had a total of 4,134 employees (June 30, 2014: 5,018 employees, figures exclude temporary employees). This equates to a decrease of 17.6% compared with the previous year.
SMA still uses temporary employees to absorb order fluctuations. Their hourly rate of pay is in line with that of SMA employees. As of the reporting date (June 30, 2015), the company employed a total of 597 temporary employees worldwide. This figure fell in the current reporting period as it did in the comparable period of the previous year. As of the reporting date, 116 fewer temporary employees were employed worldwide than in the previous year (June 30, 2014: 713 temporary employees).

14 SMA Solar Technology AG Half-Yearly Financial Report January to June 2015
Economic Report
General Economic Conditions and Economic Conditions in the SectorGeneral Economic ConditionsIn the first half of 2015, the global economy remained in calm waters. But midway through the year, the image seemed to turn somewhat gloomier. While the European economy currently faces the crucial test of whether Greece will remain in the euro, the weal and woe of the global economy depends primarily on further develop-ments in China.
Distinct warning signals had already emanated from China at the end of the first quarter. Foreign trade fell unex-pectedly in the world’s largest trading nation. Exports fell by about 15% year on year in March, whereas experts had forecasted an increase by more than 10%. Chinese imports also dropped sharply. Foreign trade suffered a total decline of nearly 7% in the first half of the year compared to the same period of 2014.
However, the figures for June offered a glimmer of hope for the Chinese economy: Exports increased by 2.1% and therefore more sharply than analysts had expected. Imports declined again with a drop of 6.7%, however, experts had expected an even bigger slump.
The economy in the U.S. remains on a stable course for growth. According to a survey by the U.S. Federal Reserve, the economy continued expanding in June. Most importantly, it showed that car sales and lending increased. The Purchasing Managers’ Index compiled by Markit for the U.S. manufacturing industry and service sector also rose to 54.1 in June. So it is far above the 50 mark that divides growth and contraction.
Economic Conditions in the SectorThe global photovoltaics industry developed more positively than originally expected. For the first half of 2015, SMA expects newly installed PV power of approximately 25 GW (H1 2014: approx. 18 GW). SMA estimates global sales of PV inverter technology to be around €2.3 billion.
Accounting for roughly 21% of global sales, the significance of the European photovoltaic markets declined year on year (H1 2014: 23%). The Chinese market gained in significance due to the considerably higher volume of new installations compared with the same period of the previous year and contributed around 12% of sales (H1 2014: approx. 6%). American photovoltaic markets also developed positively, making up 20% of global sales (H1 2014: approx. 18%). The Asia-Pacific photovoltaic markets (excluding China) accounted for 44% of the global market, thereby losing market shares (H1 2014: approx. 50%).
15To Our ShareholdersInterim Management Report Economic ReportInterim Consolidated Financial StatementsOther Information
GREAT BRITAIN IS THE MOST IMPORTANT MARKET IN EUROPEDespite a weaker second quarter, Great Britain remains one of the most important photovoltaic markets in Europe. After the subsidy cut for systems of over 5 MW as of April 1, 2015, the government began focusing on large roof-based systems (more than 250 kW) with the incentive programs still in effect.
In the first half of the year, Germany reported stable monthly installations, but at a lower level than in the same period of the previous year. In the German market, an average of only 100 MW of PV power has been connected to the utility grid every month since the amendment of the Renewable Energy Sources Act (EEG) came into force in August 2014. If this trend continues over the remainder of the year, the Ministry of Economics’ expansion target of 2.5 GW will be missed by a considerable margin.
Development in other European countries is mixed. While new installations in France, Benelux and Eastern European markets were close to the level of the prior-year period, Italy, Spain and Greece posted some sharp declines. This was partly due to legislative changes to subsidies in previous years.
GROWTH IN THE NON-EUROPEAN MARKETSFor the U.S. market, SMA assumed growth of roughly 3.5 GW for the first half of 2015. According to our estimates, about half of new installations were large-scale solar projects. In the U.S., demand for solar power systems is being assisted, in particular, by tax incentive programs. In addition, portfolio standards are having an impact on the investing activities of electric utility companies. Portfolio standards ensure that electric utility companies include a certain share of renewable energy in their energy generation portfolios.
The PV market in Japan expanded. In the first half of 2015, PV systems with an output totaling more than 5 GW were connected to the grid. The high number of new installations in the first half of the year is attributable, in particular, to installations being brought forward by a subsidy cut that was implemented in two stages in April and July.
The market in China posted strong growth year on year in the first half of 2015. With 7.7 GW of newly installed power, growth was more than twice as high as in the first half of 2014. This development can be attributed mainly to project delays. A number of projects from the fourth quarter of 2014 were completed behind schedule, which meant that they were not connected to the grid until the first quarter of 2015.
Energy requirements and thus demand for photovoltaics are growing in newly industrialized and developing countries. In many countries, PV is already an economically attractive alternative to other methods of generating energy. Key growth regions include South America, Southeast Asia and the Middle East. In many countries located in what is known as the Earth’s Sunbelt, high diesel prices, transportation and storage costs act as an incentive for expanded use of photovoltaics. In these sunny regions, photovoltaics is already the more financially appealing alternative to other methods of power generation. With good solar irradiation, a PV/diesel system will pay for itself within a few years.

16 SMA Solar Technology AG Half-Yearly Financial Report January to June 2015
Impact of General Conditions on Business DevelopmentGlobally speaking, demand for solar power systems is still largely dependent on incentive programs. This makes photovoltaic markets volatile and difficult to forecast. According to SMA Managing Board estimates, pricing pressure persisted in the PV inverter sector in the first half of 2015.
Results of OperationsSales and EarningsSMA GENERATES GOOD FIRST HALF YEARSMA Group continued its good business development in the first quarter by selling PV inverters with a total output of 3,153 MW in the first half of 2015. This 58.4% rise on the same period of the previous year (Q1–Q2 2014: 1,990 MW) was greater than the increase in sales because of a trend toward more powerful inverters. In the first half of 2015, SMA generated growth of 25.8% with sales of €429.3 million (Q1–Q2 2014: €341.2 million) and was thus in line with the forecast published for the first half of the year (forecast: €400 million to €450 million).
In recent years, SMA has consistently invested in establishing global infrastructure to compensate for market fluctuations. At the end of the first half of 2015, the proportion of foreign sales was 87.2% (Q1–Q2 2014: 73.4%). Compared to the first half of 2014, gross sales in the Americas region grew considerably by approximately 77% to €179.9 million (Q1–Q2 2014: €101.9 million), due, in particular, to project business. Besides North America, the most important foreign markets in the first half of the year also included Great Britain, Japan and Australia. As a result of increased sales volumes, fixed cost reduction and positive exchange rate effects, EBITDA improved considerably to €21.3 million (EBITDA margin: 5.0%; Q1–Q2 2014: €–17.0 million, –5.0%).
EBIT also improved in comparison to the previous year, but as expected was negative at €–14.9 million (EBIT margin: –3.5%) (Q1–Q2 2014: €–62.4 million, EBIT margin: –18.3%). The EBIT generated put SMA at the upper end of the earnings forecast for the first half of 2015 (forecast: €–15 million to €–25 million). Consolidated earnings amounted to €–21.4 million (Q1–Q2 2014: €–44.9 million). Earnings per share amounted to €–0.62 (Q1–Q2 2014: €–1.29).

17To Our ShareholdersInterim Management Report Economic ReportInterim Consolidated Financial StatementsOther Information
Sales and Earnings per SegmentDECLINING BUSINESS IN EUROPE NEGATIVELY AFFECTS RESIDENTIAL BUSINESS UNIT The Residential business unit serves the attractive long-term market of small PV systems for private applications. In particular, the portfolio comprises single-phase string inverters with the brand name Sunny Boy; three-phase inverters in the lower output range up to 12 kW with the brand name Sunny Tripower; energy management solutions; stor-age systems such as the Sunny Boy Smart Energy; and communication products and accessories. With this port-folio of products and services, SMA offers a suitable technical solution for private PV systems in all major photo-voltaic markets.
In the first half of 2015, external sales of the Residential business unit fell by 6.2% to €113.8 million (Q1–Q2 2014: €121.3 million). Its share of SMA Group’s total sales was 26.5% (Q1–Q2 2014: 35.6%). The decline in sales in Europe, Japan and Australia was partially offset by increases in sales in North America. Besides North America, the most important foreign markets included Australia and Great Britain. In the first half of 2015, the major sales drivers were the Sunny Boy 3800 to 6000TL inverters.
Despite the decline in sales, the Residential business unit’s EBIT improved due to productivity increases and the launch of new products by 60.1% year on year, but remained negative as expected at €–10.5 million (Q1–Q2 2014: €–26.3 million). In relation to internal and external sales, the EBIT margin was –9.2% (Q1–Q2 2014: –21.7%).
COMMERCIAL BUSINESS UNIT INCREASES SALESThe Commercial business unit serves the growing market of medium-sized PV systems for commercial applications. The portfolio comprises, for example, three-phase inverters from the Sunny Tripower brand with outputs of more than 12 kW as well as communication products and other accessories. SMA offers complete solutions as well as individual inverters for commercial PV systems in all major photovoltaic markets.
In the first half of 2015, external sales in the Commercial business unit improved by 19.7% year on year to €86.1 million (Q1–Q2 2014: €71.9 million). Its share of SMA Group’s total sales was 20.1% (Q1–Q2 2014: 21.1%). Sales in the first half of 2015 were affected by a realignment of the product portfolio and the sale of older inverter models in the first quarter of 2015. The sharp sales decline in Germany due to the reform of the Renewable Energy Sources Act (EEG) in mid-2014 was more than offset by sales increases in the most important foreign markets of the U.S., Japan and Great Britain. In the first half of 2015, the major sales drivers were the Sunny Tripower series inverters.
EBIT was influenced by a one-time item and was €–21.9 million in the first half of 2015 (Q1–Q2 2014: €–17.1 mil-lion). Without the one-time item, the Commercial business unit would have achieved a substantial earnings improve-ment year on year. In relation to internal and external sales, the EBIT margin was –25.4% (Q1–Q2 2014: –23.8%).

18 SMA Solar Technology AG Half-Yearly Financial Report January to June 2015
UTILIT Y BUSINESS UNIT IS THE KEY GROWTH DRIVER IN THE FIRST HALF OF 2015The Utility business unit serves the growing market for large-scale PV power plants with outputs ranging from 500 kW to the megawatt range with central inverters from the Sunny Central brand. In addition to medium- and high-voltage technology, the product and service portfolio also comprises grid service and monitoring functions as well as accessories.
In the first half of 2015, the business unit’s external sales increased by 79.1% year on year to €175.7 million (Q1–Q2 2014: €98.1 million). This gratifying development is primarily attributable to the implementation of projects in North America and Great Britain. The Utility business unit’s share of SMA Group’s total sales increased to 40.9% (Q1–Q2 2014: 28.8%). It is thus the strongest-selling business unit in the Group. The most important foreign markets were North America, Great Britain, Japan and India. The most successful products included the Sunny Central Compact Power series of inverters.
In the first half of 2015, EBIT was €15.0 million and thus much higher than in the previous year (Q1–Q2 2014: €–3.9 million). The main reasons for this were higher sales in absolute terms and the reduction in fixed costs. In relation to internal and external sales, the EBIT margin was 8.5% (Q1–Q2 2014: –4.0%).
SERVICE BUSINESS UNIT INCREASES SALES AND EARNINGSSMA has its own service companies in all important photovoltaic markets. With an installed capacity of more than 35 GW worldwide, SMA leverages economies of scale to manage its service business profitably. Services offered include commissioning, warranty extensions, service and maintenance contracts, operational management, remote system monitoring and spare parts business.
In the first half of 2015, external Service sales increased to €22.5 million (Q1–Q2 2014: €16.4 million), primarily because of higher demand in North America. Its share of SMA Group’s total sales was 5.2% (Q1–Q2 2014: 4.8%). Notable sales drivers were operational management (O&M Business), maintenance and service contracts subject to change and chargeable commissioning. In the first half of 2015, EBIT was €4.0 million (Q1–Q2 2014: €–1.3 million). In relation to internal and external sales, the EBIT margin was 7.2% (Q1–Q2 2014: –2.1%).
OTHER BUSINESS STILL GENERATING LOSSESThe Other Business segment comprises Railway Technology and Zeversolar as well as Off-Grid and Storage business.
In the first half of 2015, external sales totaled €31.2 million (Q1–Q2 2014: €33.5 million). Its share of SMA Group’s total sales was 7.3% (Q1–Q2 2014: 9.7%). EBIT was €–10.0 million (Q1–Q2 2014: €–13.3 million). In relation to internal and external sales, the EBIT margin was –32.1% (Q1–Q2 2014: –39.7%).

19To Our ShareholdersInterim Management Report Economic ReportInterim Consolidated Financial StatementsOther Information
Development of Significant Income Statement ItemsGROSS MARGIN STABILIZESThe cost of sales increased by 21.2% to €355.4 million (Q1–Q2 2014: €293.2 million) and thus at a lower rate than sales. The cost of sales was positively affected by specific material cost reductions and the introduction of new products with cheaper specific costs of sales. As a result, the gross margin increased to 17.2% (Q1–Q2 2014: 14.1%) despite the one-time item in the Commercial business unit.
Personnel expenses included in cost of sales fell by 6.1% from €68.5 million in the same period of the previous year to €64.3 million. The first savings from personnel adjustments were partially offset by collectively agreed upon wage increase and exchange rate effects.
Depreciation and amortization included in cost of sales decreased by 24.6% to €30.9 million (Q1–Q2 2014: €41.0 million). In the first half of 2015, this included scheduled depreciation on capitalized development costs of €7.6 million (Q1–Q2 2014: €7.6 million).
The €19.6 million rise in other expenses primarily resulted from the addition of sales-based provisions for warranty obligations in comparison with the comparative period and higher risk provisioning.
Selling expenses fell slightly year on year due to savings in material costs in the wake of current cost reduction measures, amounting to €28.8 million in the first half of 2015 (Q1–Q2 2014: €31.4 million). The cost of sales ratio was 6.7% in the reporting period (Q1–Q2 2014: 9.2%), due, in particular, to the increase in sales.
In the first half of 2015, research and development expenses not including capitalized development projects decreased to €36.1 million as planned (Q1–Q2 2014: €42.1 million). In the first half of 2015, the research and development cost ratio amounted to 8.4% (Q1–Q2 2014: 12.3%). Total research and development expenses in-cluding capitalized development projects amounted to €55.4 million (Q1–Q2 2014: €58.2 million). Development projects were capitalized in the amount of €19.3 million (Q1–Q2 2014: €16.1 million). The significantly higher number of capitalizations was mainly due to the completion of the new Sunny Central with an output of 2.5 MW.
Administrative expenses in the first half of 2015 totaled €30.8 million (Q1–Q2 2014: €39.2 million). The substantial decrease in administrative expenses of 21.4% is mainly attributable to the staff reduction this and last year. In relation to the considerably higher sales, the ratio of administrative expenses declined to 7.2% as of the first half of 2015 (Q1–Q2 2014: 11.5%).
The balance of other operating income and expenses amounted to €6.9 million in the first half of 2015 (Q1–Q2 2014: €2.3 million). This includes effects from foreign currency valuation, expenses for assets measured at fair value through profit or loss and reversal of provisions.

20 SMA Solar Technology AG Half-Yearly Financial Report January to June 2015
Financial PositionGross cash flow was primarily influenced by severance payments in the wake of the staff reduction. In the first half of the year, it nonetheless improved to €–5.1 million (Q1–Q2 2014: €–41.7 million).
Despite strong sales in the first half of 2015, trade receivables declined by €23.4 million to €136.2 million (Decem-ber 31, 2014: €159.6 million). Trade payables amounted to €94.3 million (December 31, 2014: €111.8 million). Inventories amounted to €193.2 million (December 31, 2014: €203.2 million).
Due especially to lower trade receivables, net working capital declined by 6.3% to €235.1 million (December 31, 2014: €251.0 million). The net working capital ratio in relation to sales over the past twelve months fell to 26.3% (December 31, 2014: 31.2%) and is thus at the upper end of the range of 23% to 26% targeted by management for the end of the year. Net cash flow from operating activities in the first half of 2015 amounted to €12.1 million (Q1–Q2 2014: €–33.1 million).
Net cash flow from investing activities changed in the reporting period to a total of €–34.2 million (Q1–Q2 2014: €18.5 million). This includes net investments for fixed assets and intangible assets amounting to €32.1 million (Q1–Q2 2014: €32.1 million). At €19.3 million (Q1–Q2 2014: €16.1 million), a significant portion of the investments went to capitalized development projects, especially for the introduction of a new product family of central inverters. The balance of proceeds and payments for the investment amounted to €–2.0 million (Q1–Q2 2014: €49 million).
Cash and cash equivalents amounting to €166.0 million (December 31, 2014: €184.0 million) include cash in hand, bank balances and short-term deposits with an original term to maturity of less than three months. With time deposits that have a term to maturity of more than three months, fixed-interest-bearing securities, liquid assets pledged as collateral, and after deducting interest-bearing financial liabilities, this resulted in adjusted net cash of €211.0 million (December 31, 2014: €225.4 million). Despite the outflow of funds in connection with the restructur-ing, SMA protected its high liquidity reserve in the first half of 2015 and is therefore able to implement the strategy using its own resources.

21To Our ShareholdersInterim Management Report Economic ReportInterim Consolidated Financial StatementsOther Information
Net AssetsSMA Has a Solid Equity Ratio of 47.2%As of June 30, 2015, the balance sheet decreased slightly to €1,133.7 million compared to the end of 2014 (Decem-ber 31, 2014: €1,180.3 million).
At €496.9 million, non-current assets remained on a par with the end of 2014 (December 31, 2014: €488.2 million).
As of June 30, 2015, net working capital amounted to €235.1 million (December 31, 2014: €251.0 million). The net working capital ratio in relation to sales over the past 12 months was at 26.3%. Despite higher sales, trade receivables declined by 14.7% compared to December 31, 2014, to €136.2 million at the end of the first half of 2015 (December 31, 2014: €159.6 million). Despite the higher international share, days sales outstanding were reduced to 60.4 days (December 31, 2014: 64.3 days). Inventory fell by 4.9% to €193.2 million (December 31, 2014: €203.2 million). Considering a positive business performance in the second half of 2015, a further reduction is expected. Trade payables declined by a considerable €17.5 million to €94.3 million (December 31, 2014: €111.8 million). The share of trade credit in total assets decreased to 8.3% (December 31, 2014: 9.5%).
The Group’s equity capital base remains strong at €534.7 million as of June 30, 2015 (December 31, 2014: €552.0 million). With an equity ratio of 47.2%, SMA has a comfortable equity capital base and therefore a very solid balance sheet structure.
Capital ExpenditureInvestments Affected by Capitalization of Development ProjectsSMA will significantly reduce and adapt investment to changes in the market. For the 2015 fiscal year, the SMA Group is planning investments in fixed assets of up to €20 million (2014: €29.5 million). Investments in intangible assets primarily relate to the capitalization of development projects and are expected to amount to between €25 million and €30 million (2014: €46 million).
In the first half of the 2015 fiscal year, investments in fixed assets and intangible assets totaled €32.4 million (Q1–Q2 2014: €32.9 million). €12.1 million thereof was invested in fixed assets, primarily for machinery and equipment (Q1–Q2 2014: €14.6 million). The investments were mostly made in connection with the launch of new products. Investments in intangible assets of €20.3 million (Q1–Q2 2014: €18.3 million) were primarily for capitalized de-velopment projects. The higher share of capitalization compared to the previous year is mainly attributable to the new Sunny Central with an output of 2.5 MW.

22 SMA Solar Technology AG Half-Yearly Financial Report January to June 2015
Significant Events After the End of the Reporting PeriodOn July 9, 2015, the Managing Board of SMA Solar Technology AG raised its sales and earnings forecast via an ad hoc statement. For further details, please refer to the forecast report starting on page 24.
Supplementary Report
23To Our ShareholdersInterim Management Report Supplementary Report | Risk and Opportunities ReportInterim Consolidated Financial StatementsOther Information
Risk and Opportunities ManagementThe 2014 Annual Report details risk and opportunity management, individual risks with a potentially significant negative impact on our business, results of operations, financial position and net assets and information on the Company’s reputation. Our key opportunities are also outlined. Using our Risk Management System, we assess the overall risk situation to be manageable. The statements made in the 2014 Annual Report generally continue to apply. In the first six months of the 2015 fiscal year, we did not identify any additional significant risks or opportu-nities besides those presented in the section on business activity and organization and in the additional information on the results of operations, financial position and net assets.
There are currently no discernible risks that, either alone or combined with other risks, could seriously jeopardize the livelihood of the Company or significantly impair business performance. For more information, please refer to the forward-looking statements in the forecast report.
Risk and Opportunities Report

24 SMA Solar Technology AG Half-Yearly Financial Report January to June 2015
The General Economic Situation: The Global Economy Is Growing, Albeit at a Slower PaceAccording to the International Monetary Fund (IMF), the global economy is growing a little less strongly than was expected at the start of the year. In its update to the World Economic Outlook of July 9, 2015, the IMF forecasts global growth of 3.3% for 2015. This is 0.2 percentage points lower than presumed in the April forecast.
This is primarily due to the worsening situation in the U.S., for which the IMF now expects growth of 2.5% after 3.1% in April. However, the IMF describes the slowdown in the U.S. as “temporary.” The world’s largest national economy is still facing an upturn in consumption and investment. The IMF however repeated its recommendation to the U.S. Federal Reserve to wait until the first half of 2016 to increase interest rates.
For China and the eurozone, the IMF did not change its forecast for the current year, but it did highlight both eco-nomic areas as potential sources of risk. The background to this is the collapse of the Chinese stock markets in July. This could weaken the economy in the People’s Republic – and thus inhibit worldwide growth. For China, the IMF still expects an increase of 6.8% this year. For the eurozone, the IMF continues to see the crisis in Greece as a risk. The country is still wrestling over an agreement with its European creditors and its place in the eurozone. The eurozone is expected to grow by 1.5% this year. For Germany, too, the Fund is sticking to its previous forecast of 1.6%.
At just over 4%, newly industrialized countries are likely to grow twice as strongly as industrialized countries (2.1%).
Future General Economic Conditions in the Photovoltaics SectorBy 2050, Solar Energy Could be the Main Source of Electric CurrentIn their study dated June 2015, experts from the International Energy Agency (IEA) declared that economic growth had unhitched itself from dangerous CO2 emissions thanks to high investment in the expansion of renewable ener-gies. However, CO2 emissions are still too high and are endangering the climate. The IEA experts therefore expect increased investment in photovoltaics, in particular. By 2050, solar energy could be the main source of electric current – far ahead of fossil fuels, wind energy and nuclear power. Photovoltaic systems and solar thermal power plants could be generating 27% of electricity worldwide by this point. According to an IEA’s scenario, renewable energies will contribute a total of between 65% and 80% to the electricity supply by 2050.
Forecast Report

25To Our ShareholdersInterim Management Report Forecast ReportInterim Consolidated Financial StatementsOther Information
In further publications, IEA experts anticipate this development to be driven by certain trends, which include re-gionalization of the electricity supply. More and more households, cities and companies want to become less dependent on energy imports and rising fuel costs. This will lead to a rise in demand for energy storage solutions in the residential, commercial and industrial sectors. In addition, energy will be increasingly distributed via smart grids in order to manage electricity demand, avoid consumption peaks and take the strain off utility grids. eMobility is expected to become an important pillar of these new energy supply structures a few years from now. Integra-tion of electric vehicles may also help increase self-consumption of renewable energies and offset fluctuations in the utility grid.
Global Photovoltaic Market Develops PositivelyPhotovoltaics has proven to be increasingly competitive in recent years. In a growing number of regions around the world, solar power is now more cost-efficient than conventional energy. In the long term, this is paving the way for the sector to grow, even without subsidization. For 2015, the SMA Managing Board anticipates newly installed power of 48 GW globally (previously 45 GW). This equates to growth of more than 15% compared with 2014. According to SMA Managing Board estimates, the worldwide volume of investment for PV inverters will increase by approximately 7% to €4.4 billion (previously €4.2 billion) (2014: €4.1 billion) in consideration of continued high pricing pressure in all market segments and regions.
Mixed Development in EuropeAccording to estimates by the SMA Managing Board, demand for PV systems will pick up slightly in European countries, the Middle East and Africa (EMEA). Positive growth stimuli are emanating from Great Britain, in particu-lar, and Turkey. Installation in the French, Benelux and Eastern European markets is expected to remain on a par with the previous year. However, Germany, Italy, Spain and Greece are declining. Overall, the SMA Managing Board anticipates newly installed power of approximately 10 GW in the EMEA region. This equates to growth of about 10% compared with the previous year. According to SMA estimates, the volume of investment in PV invert-ers will be €1.0 billion (2014: €0.9 billion). In Europe, demand is dominated by the utility and commercial market segments. Small PV systems (residential) are not expected to regain their level of importance in the European market until storage solutions become more widespread.
Positive Development in North and South America and AsiaThe SMA Managing Board still foresees strong growth stimuli from the North American markets. In contrast, the South American photovoltaic markets are still at the beginning of their development, but promise strong growth potential in the medium term. According to SMA estimates, newly installed power in the Americas region will grow by 25% overall to 10 GW in 2015, equating to a volume of investment in PV inverters of €1.1 billion (2014: €0.9 billion). In the Americas region, large-scale PV power plants (utility) account for the majority of demand. The SMA Managing Board expects attractive growth rates in the commercial and residential market segments.

26 SMA Solar Technology AG Half-Yearly Financial Report January to June 2015
The most important markets in Asia include Japan and China, with positive momentum emanating particularly from the markets in India, Thailand, the Philippines and Australia. For 2015, the SMA Managing Board anticipates newly installed power of 28 GW in the Asian region (2014: 25 GW). Due to the very low price level in China and the expected decline in demand in the high-price market Japan, the volume of investment in PV inverters in Asia will stay at €2.3 billion (2014: 2.3 billion). Demand will also be dominated by large-scale PV projects in the Asia-Pacific region in 2015. Medium-sized and small PV systems will increase in significance in the medium term.
Attractive Business Opportunities for PV/Diesel Hybrid Systems and Energy ManagementThere are worthwhile business opportunities for PV/diesel hybrid systems in many countries in South America, the Middle East, Asia-Pacific and Africa. In these regions, energy needs are growing in line with increasing prosperity. Scalable electricity supply solutions are in demand, especially in areas without a grid connection. Intelligent system technology allows photovoltaics to be integrated well into already existing diesel-powered grids. However, business with photovoltaic/diesel hybrid systems is developing slower than in subsidized photovoltaic markets because of technical complexity and limited financing options. However, the medium-term prospects are markedly good and continue to improve due to the high level of dependence on fuel imports in the target regions.
The SMA Managing Board also envisages worthwhile business opportunities for manufacturers of innovative sys-tem technologies that temporarily store solar power and provide energy management for private households and commercial enterprises. Demand for solutions to increase self-consumption of solar power is likely to rise in the European markets and Japan, in particular. Positive growth stimuli are also emanating from eMobility. Interconnec-tion with photovoltaic systems is giving rise to new business models and greater customer benefit.
Overall Statement From the Managing Board on the Expected Development of SMA GroupThe following statements on the future development of SMA Group are based on the estimates drawn up by the SMA Managing Board and the expectations concerning the progression of global photovoltaic markets set out above. Since January 1, 2015, SMA Group has operated under its new functional organization. In this new orga-nization, the Residential, Commercial, Utility and Service business units take overall responsibility and manage Development, Sales and Operations. Railway Technology and Zeversolar as well as the Off-Grid and Storage business are combined under Other Business. The forecast report is based on the new reporting structure.

27To Our ShareholdersInterim Management Report Forecast ReportInterim Consolidated Financial StatementsOther Information
Sales Growth for the First Time Since 2010
SMA’s sales and earnings situation depends on market share, price dynamics and global market growth. For the first time since 2010, the SMA Managing Board is again expecting sales growth. On July 9, 2015, the Managing Board raised the sales forecast for the current fiscal year to between €800 million and €850 million (previously: €730 million to €770 million). Around 80% of the forecasted sales have already been accounted for in the sales of the first six months of 2015 and the order backlog for this fiscal year. At the upper end of the sales forecast of €850 million, the Managing Board anticipates a moderate decrease in prices and growth in volume. In this scenario, the fall in demand expected in Germany will be offset by foreign markets, in particular, the U.S. and Japan. At the lower end of the sales forecast of €800 million, the Managing Board foresees a lower decline in volume and an accelerated decrease in prices. The SMA Managing Board anticipates that more than 80% of sales will be attributable to international business.
Taking into consideration the Company’s improved business performance and timely implementation of its transfor-mation, the SMA Managing Board anticipates a break-even in terms of operating result (EBIT) in the best-case scenario in 2015. In the worst-case scenario, SMA will generate an operating loss of €25 million in 2015. In 2015, SMA will generate positive free cash flow and protect its high net liquidity.
Return to Profitability by Reducing Fixed CostsSMA significantly raised its break-even point during the years it experienced significant growth. However, the measures taken to reduce fixed costs over the past few years are not sufficient to lead SMA to profitability from a sales level of less than €700 million. The Managing Board therefore resolved back in 2014 to further reduce per-sonnel and material costs worldwide. To that end, on January 30, 2015, the SMA Managing Board presented the plans for transformation of the Group. These plans call for SMA to focus on strategically important development projects, adjust its real net output ratio, consolidate its global infrastructure and systematically leverage the syner-gies from its partnership with Danfoss. SMA will also reduce the number of service providers used. Unfortunately, a staff reduction of 1,600 full-time positions worldwide, primarily at its headquarters in Kassel/Niestetal, was unavoidable. The SMA Managing Board is planning to save fixed costs totaling more than €160 million. Adjust-ments to Zeversolar’s marketing strategy, process optimization and lowering of production costs thanks to more cost-effective components and new technologies are bringing about additional cost reductions. All measures have been defined by specific tasks. The measures were implemented on schedule within the first six months of the fiscal year. Implementation and change management will continue to be closely monitored by a project management office.

28 SMA Solar Technology AG Half-Yearly Financial Report January to June 2015
Given that the savings from the transformation project will take effect from mid-2015 at the earliest, the SMA Managing Board expects to break even in the current fiscal year only in the best-case scenario. The Managing Board cannot rule out an operating loss of up to €25 million. Considering depreciation and amortization of approximately €70 million, operating earnings before interest, taxes, depreciation and amortization (EBITDA) will be positive as early as 2015. Due to the sharp decline in investment and the improvement of net working capital, the SMA Managing Board expects positive free cash flow.
Development in the SegmentsAccording to Managing Board estimates, the Residential business unit will generate sales of between €230 million to €240 million, accounting for more than 25% of SMA Group consolidated sales (2014: €249.2 million; 30.9% of Group sales). In particular, the portfolio of the Residential business unit comprises single-phase string inverters with the brand name Sunny Boy; three-phase inverters in the lower output range up to 12 kW with the brand name Sunny Tripower; energy management solutions, storage systems such as the Sunny Boy Smart Energy; and communication products and accessories. The Sunny Boy inverters with an output of 3 kW to 5 kW will account for a large share of the Residential business unit’s sales. Europe, North America, Australia and Japan will remain the most important sales regions. Despite the decline in sales, the Residential business unit will break even in the best-case scenario thanks to the measures related to the Company’s transformation and cost-optimized products. The SMA Managing Board cannot rule out a small operating loss.
The portfolio of the Commercial business unit comprises, for example, three-phase inverters from the Sunny Tripower brand with outputs of more than 12 kW as well as communication products and other accessories. For the Com-mercial business unit, the SMA Managing Board forecasts sales of between €190 million and €200 million in 2015 (2014: €159.3 million; 19.8% of Group sales). This business unit is therefore expected to account for more than 20% of Group sales. The Sunny Tripower with an output of more than 25 kW is expected to be a major sales driver. The primary sales markets include the U.S., Japan, Europe, Australia and India. The Commercial business unit is expected to post a negative operating result due to a one-time item posted in the first half of the year and the per-sisting high pricing pressure.
With anticipated sales of between €300 million and €320 million, the Utility business unit is expected to account for more than 35% of Group sales (2014: €281.7 million; 35% of Group sales). In addition to medium- and high- voltage technology, the product and service portfolio of the Utility business unit also comprises grid service and monitoring functions as well as accessories. Sales in 2015 will be determined largely by the Sunny Central CP product family. The new generation of central inverters and the partnership with Siemens have not made a signifi-cant contribution to sales thus far in 2015. North America is by far the most important sales market, followed by Great Britain, Japan, India and Chile. Due to sales growth and through cost-optimized products, the Utility business unit is expected to post a positive result.

29To Our ShareholdersInterim Management Report Forecast ReportInterim Consolidated Financial StatementsOther Information
In 2015, our service business will continue to benefit from the high number of commissioned projects in the Utility and Commercial business units. We also expect to conclude further long-term service and maintenance contracts. Following the business success in this segment in 2014, SMA is working to acquire additional contracts for com-plete systems in Europe and North America. Overall, the SMA Managing Board expects its service business to achieve sales of more than €50 million in 2015. Due to sales growth, the Service business unit is expected to post a positive result.
For Other Business comprising Railway Technology and Zeversolar as well as Off-Grid and Storage business, the SMA Managing Board expects sales to drop to between €30 million and €40 million. Given the considerable decline in sales, these business areas are expected to generate a loss.
Decrease in Net Working CapitalLast year, the SMA Managing Board introduced extensive measures with the aim of enhancing throughput speeds and eliminating interim storage by means of a systematic “pull principle” in production. The outsourcing of added- value steps and vendor-managed inventory concepts are further reducing inventory. In the current fiscal year, the Managing Board expects net working capital to decrease to between 23% and 26% of sales (December 2014: 31.2%).
Reduced Capital ExpenditureInvestments in fixed assets are expected to fall considerably to between €15 million and €20 million in fiscal year 2015 (2014: €29.5 million). Major investments in fixed assets include test equipment for new inverter generations. In addition, investments in buildings are necessary to consolidate all locations worldwide more effectively. However, there are no plans to sell any land or buildings on a larger scale. Investments in intangible assets primarily relate to the capitalization of development projects and are expected to amount to between €25 million and €30 million (2014: €46 million).
Clear Focus on Sustainable Profitability TargetSMA will not change its strategy and, as a specialist, will continue to offer complete solutions for all attractive photovoltaic markets, all module types and all power classes. SMA again extended its technological lead in the current fiscal year and according to a recent study by IHS is the clear leader in the global market. With our inno-vations, we have proven that higher switching frequencies, higher voltages and other topologies have the potential to significantly reduce production costs. For example, in Australia and Great Britain, we are successfully serving the low-price segment with technologically simple products from our secondary brand Zeversolar. In addition to product business, SMA is expanding its service operations. In a matter of months, customers in Europe and North America assigned management and maintenance of their PV power plants with an output of 1 MW over to us. We are systematically tapping into the promising business of PV/diesel hybrid applications and off-grid applications with specialized teams. Thanks to continuous process improvement, our global purchasing and logistics structures and the systematic leveraging of synergies with Danfoss, we have laid the foundations for increasing our competi-tiveness.

30 SMA Solar Technology AG Half-Yearly Financial Report January to June 2015
The various strategic measures will again lead to sales growth this year. In order to generate profits again as quickly as possible, the SMA Managing Board has comprehensively transformed the Company within the last few months. The target is to reduce fixed costs by more than €160 million by the end of 2015. This time of change was not easy for SMA, as the measures were connected with a substantial staff reduction. By adjusting the structure of our organization and processes, SMA will find its way back to small and medium-sized enterprise structures and sustainable profitability. For the current fiscal year, the SMA Managing Board is already forecasting a break-even EBIT in the best-case scenario, but cannot rule out a loss of up to €25 million.
We are confronting the structural change in our industry head on and have a clear view of our strengths. We will build on these strengths and design product solutions that provide for decentralized energy supplies on the basis of renewable energy. This phase in the Company’s history is certainly not easy – but SMA is characterized not least by an extraordinary corporate culture and motivated employees, who all make a decisive contribution to SMA’s long-term success, even in challenging times.
Niestetal, July 31, 2015
SMA Solar Technology AG The Managing Board

50 Condensed Notes to the Balance Sheet SMA Group
50 13. Goodwill and Other Intangible Assets 50 14. Fixed Assets 51 15. Inventories 51 16. Other Financial Assets 51 17. Shareholders’ Equity 52 18. Provisions 52 19. Financial Liabilities 53 20. Other Financial Liabilities 53 21. Other Liabilities 54 22. Financial Instruments
56 Notes to the Statement of Cash Flows SMA Group
56 23. Net Cash Flow From Operating Activities 57 24. Net Cash Flow From Investing Activities 57 25. Net Cash Flow From Financing Activities 57 26. Cash and Cash Equivalents
58 Other Disclosures 58 27. Events After the Balance Sheet Date 58 28. Related Party Disclosures
60 Responsibility Statement 61 Auditor’s Report
32 Income Statement SMA Group 33 Statement of Comprehensive Income
SMA Group 34 Balance Sheet SMA Group 35 Statement of Cash Flows SMA Group 36 Statement of Changes in Equity SMA Group
38 Condensed Notes as of June 30, 2015
38 Basic Information 38 1. Basics 39 2. Scope of Consolidation and
Consolidation Principles 40 3. Accounting and Valuation Policies 41 4. Segment Reporting
45 Condensed Notes to the Income Statement SMA Group
45 5. Cost of Sales 46 6. Selling Expenses 46 7. Research and Development Expenses 47 8. General Administrative Expenses 47 9. Other Operating Income/
Other Operating Expenses 48 10. Employee and
Temporary Employee Benefits 49 11. Financial Result 49 12. Earnings per Share
Interim Consolidated Financial Statements January to June 2015

32 SMA Solar Technology AG Half-Yearly Financial Report January to June 2015
Income Statement SMA Group
in €’000 NoteApril – June (Q2) 2015
April – June (Q2) 2014
Jan. – June (Q1– Q2) 2015
Jan. – June (Q1– Q2) 2014
Sales 4 203,008 164,870 429,273 341,218Cost of sales 5 167,490 147,444 355,408 293,154Gross profit 35,518 17,426 73,865 48,064Selling expenses 6 14,006 17,393 28,767 31,430Research and development expenses 7 16,723 20,654 36,073 42,141General administrative expenses 8 14,930 20,504 30,808 39,164Other operating income 9 10,202 4,694 28,832 10,782Other operating expenses 9 9,535 3,541 21,918 8,518Operating profit (EBIT) –9,474 –39,972 –14,869 –62,407Financial income 400 921 878 1,794Financial expenses 1,167 947 2,137 2,410Financial result 11 –767 –26 –1,259 –616Profit before income taxes –10,241 –39,998 –16,128 –63,023Income taxes 3,225 –11,791 5,280 –18,095Consolidated net result –13,466 –28,207 –21,408 –44,928
of which attributable to non-controlling interests –7 –42 –26 –88
of which attributable to shareholders of SMA AG –13,459 –28,165 –21,382 –44,840
Earnings per share, basic (in €) 12 –0.39 –0.81 –0.62 –1.29Earnings per share, diluted (in €) 12 –0.39 –0.81 –0.62 –1.29
Number of ordinary shares (in thousands) 34,700 34,700 34,700 34,700

33To Our ShareholdersInterim Management ReportInterim Consolidated Financial Statements Income Statement | Statement of Comprehensive IncomeOther Information
Statement of Comprehensive Income SMA Group
in €’000 April – June
(Q2) 2015April – June
(Q2) 2014Jan. – June
(Q1– Q2) 2015Jan. – June
(Q1– Q2) 2014Consolidated net result –13,466 –28,207 –21,408 –44,928Changes in fair values of available-for-sale assets 0 37 0 29Income taxes 0 –11 0 –8
Changes recognized outside profit or loss1 (available-for-sale financial assets) 0 26 0 21
Unrealized gains (+) / losses (–) from currency translation of foreign subsidiaries –2,451 –2,078 4,150 480
Changes recognized outside profit or loss1 (currency translation differences) –2,451 –2,078 4,150 480Overall comprehensive result –15,917 –30,259 –17,258 –44,427of which attributable to non-controlling interests 0 –41 –26 –91of which attributable to shareholders of SMA AG –15,917 –30,218 –17,232 –44,336
1 All items of other comprehensive income may be reclassified to profit or loss.

34 SMA Solar Technology AG Half-Yearly Financial Report January to June 2015
Balance Sheet SMA Group
in €’000 Note 06/30/2015 12/31/2014Non-current assets Goodwill 13 798 798Other intangible assets 13 97,598 89,016Fixed assets 14 312,909 323,332Other financial investments 5 5Other financial assets 16 2,766 2,622Deferred taxes 82,767 72,497
496,843 488,270Current assets Inventories 15 193,204 203,168Trade receivables 136,154 159,617Other financial assets 16 111,845 108,393Claims for income tax refunds 4,706 12,576Other receivables 24,884 24,256Cash and cash equivalents 26 166,041 183,988
636,834 691,998Total assets 1,133,677 1,180,268
Shareholders’ equity Share capital 34,700 34,700Capital reserves 119,200 119,200Retained earnings 380,843 398,075SMA Solar Technology AG shareholders’ equity 534,743 551,975Equity attributable to non-controlling interests –39 –13
17 534,704 551,962Non-current liabilities Provisions 18 88,025 87,119Financial liabilities 19 42,701 42,840Other financial liabilities 20 1,558 2,996Other liabilities 21 135,437 126,929Deferred taxes 27,774 24,343
295,495 284,227Current liabilities Provisions 18 97,655 126,059Financial liabilities 19 26,757 26,515Trade payables 94,275 111,773Other financial liabilities 20 13,145 10,869Income tax liabilities 11,263 14,583Other liabilities 21 60,383 54,280
303,478 344,079Total equity and liabilities 1,133,677 1,180,268

35To Our ShareholdersInterim Management ReportInterim Consolidated Financial Statements Balance Sheet | Statement of Cash FlowsOther Information
Statement of Cash Flows SMA Group
in €’000 NoteJan. – June
(Q1– Q2) 2015Jan. – June
(Q1– Q2) 2014Consolidated net result –21,408 –44,928Income taxes 5,280 –18,095Financial result 1,259 616Depreciation and amortization 36,165 45,429Change in provisions –27,498 –32,848Losses from the disposal of assets 197 2,287Other non-cash expenses/revenue 10,131 1,575Interest received 186 825Interest paid –1,811 –1,570Income tax paid –7,569 5,009Gross cash flow –5,068 –41,700
Increase in inventories –171 –39,287Decrease in trade receivables 23,831 8,062Increase/decrease in trade payables –17,498 19,360Change in other net assets/other non-cash transactions 10,990 20,471Net cash flow from operating activities 23 12,084 –33,094
Payments for investments in fixed assets –12,115 –14,627Proceeds from the disposal of fixed assets 310 822Payments for investments in intangible assets –20,308 –18,254
Payments for the acquisition of companies net of cash/proceeds from the acquisition of business units 0 1,500Proceeds from the disposal of securities and other financial assets 67,585 114,016Payments for the acquisition of securities and other financial assets –69,616 –65,000Net cash flow from investing activities 24 –34,144 18,457
Changes in non-controlling interests –26 0Proceeds of financial liabilities 3,556 3,429Redemption of financial liabilities –1,193 –10,541Net cash flow from financing activities 25 2,337 –7,112
Net decrease in cash and cash equivalents –19,723 –21,749Net increase due to exchange rate effects 1,776 721Cash and cash equivalents as of January 1 183,988 192,366Cash and cash equivalents as of June 30 26 166,041 171,338

36 SMA Solar Technology AG Half-Yearly Financial Report January to June 2015
Statement of Changes in Equity SMA Group
Equity attributable to the shareholders of the parent company
in €’000 Share
capitalCapital
reserves Market valuation
of securities
Difference from currency
translationOther
retained earnings Total
Equity attributable to non-controlling
interests
Consolidated shareholders’
equityShareholders’ equity as of January 1, 2014 34,700 119,200 –56 –2,679 573,098 724,263 163 724,426Consolidated net result 0 0 0 0 –44,840 –44,840 –88 –44,928Other comprehensive income after tax 0 0 21 483 0 504 –3 501Overall result –44,427Shareholders’ equity as of June 30, 2014 34,700 119,200 –35 –2,196 528,258 679,927 72 679,999
Shareholders’ equity as of January 1, 2015 34,700 119,200 0 2,658 395,417 551,975 –13 551,962Consolidated net result 0 0 0 0 –21,382 –21,382 –26 –21,408Other comprehensive income after tax 0 0 0 4,150 0 4,150 0 4,150Overall result –17,258Shareholders’ equity as of June 30, 2015 34,700 119,200 0 6,808 374,035 534,743 –39 534,704

37To Our ShareholdersInterim Management ReportInterim Consolidated Financial Statements Statement of Changes in EquityOther Information
Statement of Changes in Equity SMA Group
Equity attributable to the shareholders of the parent company
in €’000 Share
capitalCapital
reserves Market valuation
of securities
Difference from currency
translationOther
retained earnings Total
Equity attributable to non-controlling
interests
Consolidated shareholders’
equityShareholders’ equity as of January 1, 2014 34,700 119,200 –56 –2,679 573,098 724,263 163 724,426Consolidated net result 0 0 0 0 –44,840 –44,840 –88 –44,928Other comprehensive income after tax 0 0 21 483 0 504 –3 501Overall result –44,427Shareholders’ equity as of June 30, 2014 34,700 119,200 –35 –2,196 528,258 679,927 72 679,999
Shareholders’ equity as of January 1, 2015 34,700 119,200 0 2,658 395,417 551,975 –13 551,962Consolidated net result 0 0 0 0 –21,382 –21,382 –26 –21,408Other comprehensive income after tax 0 0 0 4,150 0 4,150 0 4,150Overall result –17,258Shareholders’ equity as of June 30, 2015 34,700 119,200 0 6,808 374,035 534,743 –39 534,704

38 SMA Solar Technology AG Half-Yearly Financial Report January to June 2015
Condensed Notes as of June 30, 2015Basic Information1. BasicsThe Condensed Interim Consolidated Financial Statements for SMA Solar Technology AG as of June 30, 2015, were prepared – as were the Consolidated Financial Statements as of December 31, 2014 – in compliance with the International Financial Reporting Standards (IFRS) as adopted by the EU as well as in compliance with the regulations of Section 315a of the German Commercial Code (HGB). In fiscal year 2015, the Interim Financial Statements for SMA Solar Technology AG are therefore prepared in accordance with IAS 34 Interim Financial Reporting. Pursuant to the regulations of IAS 34, a condensed scope of reporting in comparison with the Consolidated Financial Statements as of December 31, 2014, was chosen. The Condensed Financial Statements do not include all information and disclosures required for consolidated financial statements and should therefore be read in conjunction with the Consolidated Financial Statements as of December 31, 2014.
The Condensed Interim Consolidated Financial Statements were prepared in euros. Unless indicated otherwise, all amounts stated were rounded to full thousands of euros (€’000) or millions of euros (€ million) in order to improve clarity.
The Consolidated Financial Statements are prepared on the basis of the amortized acquisition cost principle. Exceptions to this are provisions, deferred taxes, leases and derivative financial instruments.
The income statement is classified according to the cost of sales method.
The Managing Board of SMA Solar Technology AG authorized the Interim Consolidated Financial Statements on July 31, 2015, for submission to the Supervisory Board.
The registered office of the Company is Sonnenallee 1, 34266 Niestetal, Germany. Shares of SMA Solar Technology AG are traded publicly. They are listed in the Prime Standard of the Frankfurt Stock Exchange. Since September 22, 2008, the Company’s shares have been listed in the technology index TecDAX.
SMA Group develops, manufactures and distributes PV inverters, transformers, chokes, monitoring and energy management systems for PV systems and powerelectronic components for railway technology. Another area of business is providing operation and maintenance service for photovoltaic power plants (O&M business), in addition to other services.
More detailed information on segments is provided in Section 4.

39To Our ShareholdersInterim Management ReportInterim Consolidated Financial Statements Basic InformationOther Information
2. Scope of Consolidation and Consolidation PrinciplesThe scope of consolidation as of December 31, 2014, was expanded compared with December 31, 2013, to include the newly founded companies SMA Sunbelt Energy GmbH (Niestetal, Germany) and SMA Railway Technology (Guangzhou) Co., Ltd. (Guangzhou, China). Shanghai ZOF New Energy Co., Ltd., (Shanghai, China) was liquidated on February 25, 2014, and therefore left the scope of consolidation. The Group’s shares in Jiangsu Zeversolar New Energy Co., Ltd., increased to 99.25% (December 31, 2013: 98.81%) through the conversion of a loan into equity. There were no other changes in shareholdings year on year.
All companies within the scope of consolidation were fully consolidated. Those companies entitled to investments in the list of shareholdings are not consolidated due to their subordinate importance. Non-controlling interests in equity of the consolidated companies are shown separately in equity.
The company SMA Service International GmbH was renamed Zeversolar New Energy GmbH.
The Interim Consolidated Financial Statements are based on the Financial Statements of SMA Solar Technology AG and the subsidiary companies included in the scope of consolidation, which were prepared using uniform ac-counting policies throughout the Group.
Further details can be found in the Notes to the Consolidated Financial Statements as of December 31, 2014.
The scope of consolidation as of June 30, 2015, did not change in comparison with December 31, 2014.

40 SMA Solar Technology AG Half-Yearly Financial Report January to June 2015
3. Accounting and Valuation PoliciesThere were no changes in the accounting and valuation policies in these Interim Consolidated Financial State-ments as of June 30, 2015, in comparison with the Consolidated Financial Statements of SMA Solar Technology AG as of December 31, 2014.
In comparison with December 31, 2014, the following new accounting standards mandatory from fiscal year 2015 were to be observed in the preparation of the Interim Consolidated Financial Statements.
Standard/interpretation
Date of compulsory
application1Endorsement (until
June 30, 2015)2
Amendment IAS 19 Employee Benefits 02/01/2015 yesNew IFRIC 21 Levies 06/17/2014 yes
New Annual Improvement Cycle 2011 – 2013 01/01/2015 yes
1 Application to the first reporting period of a fiscal year beginning on or after that date. 2 Adoption of IFRS standards or interpretations by the EU Commission.
The first-time use of new IFRS to be applied has no essential effects on the representation of the Interim Consolidated Financial Statements of SMA Group.
The Group has not yet applied the new standards, interpretations or changes to the standards published that were not yet mandatory in 2015. The standards that are to be applied in the future can be found in the 2014 Annual Report, Chapter 3, Newly Published Accounting Regulations from the IASB.

41To Our ShareholdersInterim Management ReportInterim Consolidated Financial Statements Basic InformationOther Information
4. Segment ReportingAt the beginning of fiscal year 2015, SMA Group reorganized its photovoltaics operations and adjusted the Group structure accordingly. Since January 1, 2015, SMA Group has operated under its new functional organization. In this organization, the Residential, Commercial, Utility and Service business units take on overall responsibility and manage Development, Sales and Operations. They are presented as separate segments. Railway Technology, Zeversolar and Off-Grid and Storage business are combined under Other Business. The former segments have been absorbed into the new segment structure as follows. The former Medium Power Solutions (MPS) segment was split between the new Residential and Commercial business units. Inverters with an output range of up to 12 kW are assigned to the Residential business unit. The Commercial business unit is responsible for output ranges over 12 kW. The new Utility business unit primarily comprises the old PPS segment. The Service segment continues to offer services in Germany and abroad, including, in particular, the assumption of warranty and maintenance services and operational management.
In association with this, the management of the Group and internal reporting have also changed.
In accordance with the regulations of IFRS 8 “Operating Segments,” this organizational repositioning led to a change in the segment reporting for all comparative periods. The number of reportable segments is unchanged. On the basis of the information reported to the Group’s chief operating decision makers for resource allocation and business performance, the above business units, the Service segment and the composite segment “Other Busi-ness” are identified as reportable segments under IFRS 8.
The business units report directly to the Managing Board. In accordance with market requirements, SMA regularly reviews its organizational structure to make it as efficient as possible.
Sales in the business units Residential, Commercial und Utility are subject to fluctuations, because of discontinuous incentive programs.

42 SMA Solar Technology AG Half-Yearly Financial Report January to June 2015
The segment information in accordance with IFRS 8 for the second quarter of 2015 and 2014 is as follows:
FINANCIAL RATIOS BY SEGMENTS AND REGIONS
Segments Residential Commercial Utilityin € million Q2 2015 Q2 2014 Q2 2015 Q2 2014 Q2 2015 Q2 2014External sales 65.6 61.3 46.9 32.7 62.1 45.4Internal sales 0.0 0.0 0.0 0.0 0.7 0.0Total sales 65.6 61.3 46.9 32.7 62.8 45.4Depreciation and amortization 2.6 2.5 1.8 2.0 0.1 0.1Operating profit (EBIT) –3.8 –16.6 –10.3 –8.5 2.6 –3.0
Sales by regions EMEA 29.7 28.5 24.8 22.0 2.9 11.1Americas 25.6 18.3 11.3 6.4 50.8 25.8APAC 12.8 17.1 12.0 8.5 8.4 8.8Sales deductions –2.5 –2.6 –1.2 –4.2 0.0 –0.3External sales 65.6 61.3 46.9 32.7 62.1 45.4
FINANCIAL RATIOS BY SEGMENTS AND REGIONS
Segments Service Other Business ReconciliationContinuing
operationsin € million Q2 2015 Q2 2014 Q2 2015 Q2 2014 Q2 2015 Q2 2014 Q2 2015 Q2 2014External sales 11.5 8.1 16.9 17.4 0.0 0.0 203.0 164.9Internal sales 16.7 24.3 0.0 0.0 –17.4 –24.3 0.0 0.0Total sales 28.2 32.4 16.9 17.4 –17.4 –24.3 203.0 164.9Depreciation and amortization 0.3 0.3 0.9 0.6 11.7 20.0 17.4 25.5Operating profit (EBIT) 2.5 –1.3 –4.1 –7.4 3.6 –3.2 –9.5 –40.0
Sales by regions EMEA 5.7 6.8 8.2 8.4 0.0 0.0 71.3 76.8Americas 4.3 0.6 4.6 3.0 0.0 0.0 96.6 54.1APAC 1.5 0.9 5.0 6.0 0.0 0.0 39.7 41.3Sales deductions 0.0 –0.2 –0.9 0.0 0.0 0.0 –4.6 –7.3External sales 11.5 8.1 16.9 17.4 0.0 0.0 203.0 164.9

43To Our ShareholdersInterim Management ReportInterim Consolidated Financial Statements Basic InformationOther Information
The segment information in accordance with IFRS 8 for the first half of 2015 and 2014 is as follows:
FINANCIAL RATIOS BY SEGMENTS AND REGIONS
Segments Residential Commercial Utility
in € million Q1– Q2
2015 Q1– Q2
2014 Q1– Q2
2015 Q1– Q2
2014 Q1– Q2
2015 Q1– Q2
2014External sales 113.8 121.3 86.1 71.9 175.7 98.1Internal sales 0.0 0.0 0.0 0.0 0.7 0.0Total sales 113.8 121.3 86.1 71.9 176.4 98.1Depreciation and amortization 4.8 4.5 4.9 5.1 0.3 0.3Operating profit (EBIT) –10.5 –26.3 –21.9 –17.1 15.0 –3.9
Sales by regions EMEA 47.9 59.2 48.6 50.6 48.5 33.2Americas 49.9 34.1 17.2 11.3 98.7 50.0APAC 20.3 30.9 22.1 14.9 28.9 15.6Sales deductions –4.3 –2.9 –1.8 –4.9 –0.4 –0.7External sales 113.8 121.3 86.1 71.9 175.7 98.1
FINANCIAL RATIOS BY SEGMENTS AND REGIONS
Segments Service Other Business ReconciliationContinuing
operations
in € million Q1– Q2
2015 Q1– Q2
2014 Q1– Q2
2015 Q1– Q2
2014 Q1– Q2
2015 Q1– Q2
2014 Q1– Q2
2015 Q1– Q2
2014External sales 22.5 16.4 31.2 33.5 0.0 0.0 429.3 341.2Internal sales 33.1 46.4 0.0 0.0 –33.8 –46.4 0.0 0.0Total sales 55.6 62.8 31.2 33.5 –33.8 –46.4 429.3 341.2Depreciation and amortization 0.7 0.6 1.9 1.3 23.6 33.6 36.2 45.4Operating profit (EBIT) 4.0 –1.3 –10.0 –13.3 8.5 –0.5 –14.9 –62.4
Sales by regions EMEA 13.5 12.6 15.5 20.1 0.0 0.0 174.0 175.7Americas 6.4 1.4 7.7 5.1 0.0 0.0 179.9 101.9APAC 2.7 2.6 9.9 9.4 0.0 0.0 83.9 73.4Sales deductions –0.1 –0.2 –1.9 –1.1 0.0 0.0 –8.5 –9.8External sales 22.5 16.4 31.2 33.5 0.0 0.0 429.3 341.2
Germany accounted for €55.9 million in sales to third parties in the reporting period (Q1–Q2 2014: €93.4 million).

44 SMA Solar Technology AG Half-Yearly Financial Report January to June 2015
The reconciliation of total segment earnings (EBIT) in accordance with IFRS 8 with earnings before income taxes is as follows:
in € million Q2 2015 Q2 2014 Q1– Q2 2015 Q1– Q2 2014Total segment earnings (EBIT) –13.1 –36.8 –23.4 –61.9Eliminations 3.6 –3.2 8.5 –0.5Consolidated EBIT –9.5 –40.0 –14.9 –62.4Financial result –0.7 0.0 –1.2 –0.5Earnings before income taxes –10.2 –40.0 –16.1 –62.9
Circumstances are shown in the reconciliation which by definition are not part of the segments. In addition, unallo-cated parts of the Group head office, including cash and cash equivalents and owned buildings, are included, the expenses of which are assigned to the segments. Business relations between the segments are eliminated in the reconciliation. Currency hedging is controlled centrally for the Group and is therefore not contained in the individ-ual segments, but rather in the eliminations.
Segment assets as of June 30, 2015, did not change significantly in comparison with the reporting date of the last Annual Consolidated Financial Statements (December 31, 2014).

45To Our ShareholdersInterim Management ReportInterim Consolidated Financial Statements Basic Information | Condensed Notes to the Income StatementOther Information
Condensed Notes to the Income Statement SMA Group5. Cost of Sales
in €’000 Q1– Q2 2015 Q1– Q2 2014Material expenses 239,736 182,815Personnel expenses 64,319 68,493Depreciation and amortization 30,942 41,039Other 20,411 807
355,408 293,154
Cost of sales includes, as direct costs, product-related material expenses as well as all other expenses for the areas of Production, Purchasing, Service, Facility Management and IT.
Material expenses increased by 31.1%, at a greater rate than sales due to lower average selling prices, to €239.7 million (Q1–Q2 2014: €182.8 million). The average material costs per watt fell to 7.6 cents per watt (Q1–Q2 2014: 9.2 cents per watt) due to the introduction of new products and the shift in the product mix toward central inverters.
Personnel expenses fell by 6.1% from €68.5 million in the first half of the previous year to €64.3 million. The first savings from personnel adjustments were partially offset by collectively agreed upon wage increases and exchange rate effects.
Depreciation and amortization decreased by 24.6% to €30.9 million (Q1–Q2 2014: €41.0 million). In the first half of 2015, this included scheduled depreciation and amortization on development projects of €7.6 million (Q1–Q2 2014: €7.6 million).
The €19.6 million rise in other expenses primarily resulted from the addition to provisions for warranty obligations in comparison with the same period of the previous year, which are, amongst others, due to the increased sales volume.

46 SMA Solar Technology AG Half-Yearly Financial Report January to June 2015
6. Selling Expenses
in €’000 Q1– Q2 2015 Q1– Q2 2014Material expenses 514 345Personnel expenses 17,830 16,810Depreciation and amortization 267 506Other 10,156 13,769
28,767 31,430
Selling expenses include expenditure for global sales activities, internal sales and the marketing department. The decline in selling expenses compared to the first half of 2014 to €28.8 million (Q1–Q2 2014: €31.4 million) resulted mainly from savings in the wake of current cost reduction measures.
7. Research and Development Expenses
in €’000 Q1– Q2 2015 Q1– Q2 2014Material expenses 3,448 2,584Personnel expenses 30,748 33,656Depreciation and amortization 4,170 3,216Other 17,054 18,822
55,420 58,278Capitalized development projects –19,347 –16,137
36,073 42,141
Research and development expenses include all costs that can be attributed to the areas of product develop-ment, development-related testing and product management. The increase in material expenses and capitalized development projects is a result of the completion of the new Sunny Central inverter with an output of 2.5 MW.

47To Our ShareholdersInterim Management ReportInterim Consolidated Financial Statements Condensed Notes to the Income Statement Other Information
8. General Administrative Expenses
in €’000 Q1– Q2 2015 Q1– Q2 2014Material expenses 73 93Personnel expenses 15,823 22,538Depreciation and amortization 765 669Other 14,147 15,864
30,808 39,164
Administrative expenses include expenses for the Managing Board and for Finance, Legal and Compliance, Human Resources, Quality Management and Corporate Communications. The sharp decline in personnel costs is largely the result of the personnel adjustments made this year and last year.
9. Other Operating Income/Other Operating ExpensesOther operating income specifically includes income from foreign currency valuation as well as non-operative income, such as from assets measured at fair value through profit or loss, and reversal of revisions.
Other operating expenses specifically include expenses from foreign currency valuation, impairment losses on receivables, and expenses from the disposal of non-current assets and from assets measured at fair value through profit or loss.

48 SMA Solar Technology AG Half-Yearly Financial Report January to June 2015
10. Employee and Temporary Employee Benefits
in €’000 Q1– Q2 2015 Q1– Q2 2014Wages and salaries 105,644 112,325Expenses for temporary employees 6,428 9,589Social security contribution and welfare payments 17,523 19,577
129,595 141,491
The average number of employees in the Group amounted to:
Q1– Q2 2015 Q1– Q2 2014Research and Development 1,000 1,032Production and Service 2,521 2,674Sales and Administration 849 1,077
4,370 4,783Apprentices and interns 194 241Temporary employees 425 695
4,989 5,719
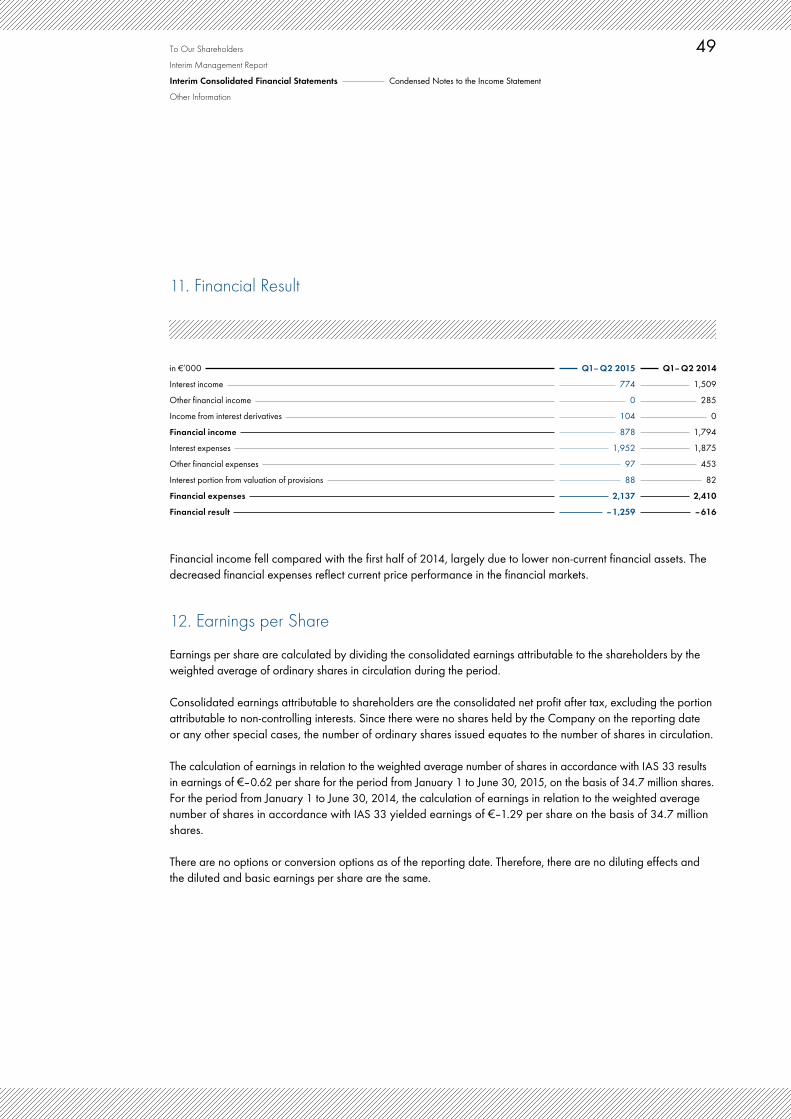
49To Our ShareholdersInterim Management ReportInterim Consolidated Financial Statements Condensed Notes to the Income Statement Other Information
11. Financial Result
in €’000 Q1– Q2 2015 Q1– Q2 2014Interest income 774 1,509Other financial income 0 285Income from interest derivatives 104 0Financial income 878 1,794Interest expenses 1,952 1,875Other financial expenses 97 453Interest portion from valuation of provisions 88 82Financial expenses 2,137 2,410Financial result –1,259 –616
Financial income fell compared with the first half of 2014, largely due to lower non-current financial assets. The decreased financial expenses reflect current price performance in the financial markets.
12. Earnings per Share Earnings per share are calculated by dividing the consolidated earnings attributable to the shareholders by the weighted average of ordinary shares in circulation during the period.
Consolidated earnings attributable to shareholders are the consolidated net profit after tax, excluding the portion attributable to non-controlling interests. Since there were no shares held by the Company on the reporting date or any other special cases, the number of ordinary shares issued equates to the number of shares in circulation.
The calculation of earnings in relation to the weighted average number of shares in accordance with IAS 33 results in earnings of €–0.62 per share for the period from January 1 to June 30, 2015, on the basis of 34.7 million shares. For the period from January 1 to June 30, 2014, the calculation of earnings in relation to the weighted average number of shares in accordance with IAS 33 yielded earnings of €–1.29 per share on the basis of 34.7 million shares.
There are no options or conversion options as of the reporting date. Therefore, there are no diluting effects and the diluted and basic earnings per share are the same.

50 SMA Solar Technology AG Half-Yearly Financial Report January to June 2015
Condensed Notes to the Balance Sheet SMA Group13. Goodwill and Other Intangible Assets
in €’000 06/30/2015 12/31/2014Goodwill 798 798Software 10,395 12,729Licenses 5,773 6,043Development projects 23,264 24,892Intangible assets in progress 58,166 45,352
98,396 89,814
The goodwill results from dtw Sp. z o.o. and the asset deals with Danfoss Power Electronics A/S and Phoenix Solar AG.
The additions to intangible assets in progress reflect intense development activities undertaken to ensure SMA Group’s position as a technology leader.
14. Fixed Assets
in €’000 06/30/2015 12/31/2014Land and buildings incl. buildings on third party property 211,852 218,063Technical equipment and machinery 42,713 43,399Other equipment, plant and office equipment 49,748 56,993Prepayments 8,596 4,877
312,909 323,332
The additions to prepayments for the period from January 1 to June 30, 2015, include investments for the extension or conversion of buildings in the amount of €3.2 million, of which €2.8 million was spent on buildings in the U.S.
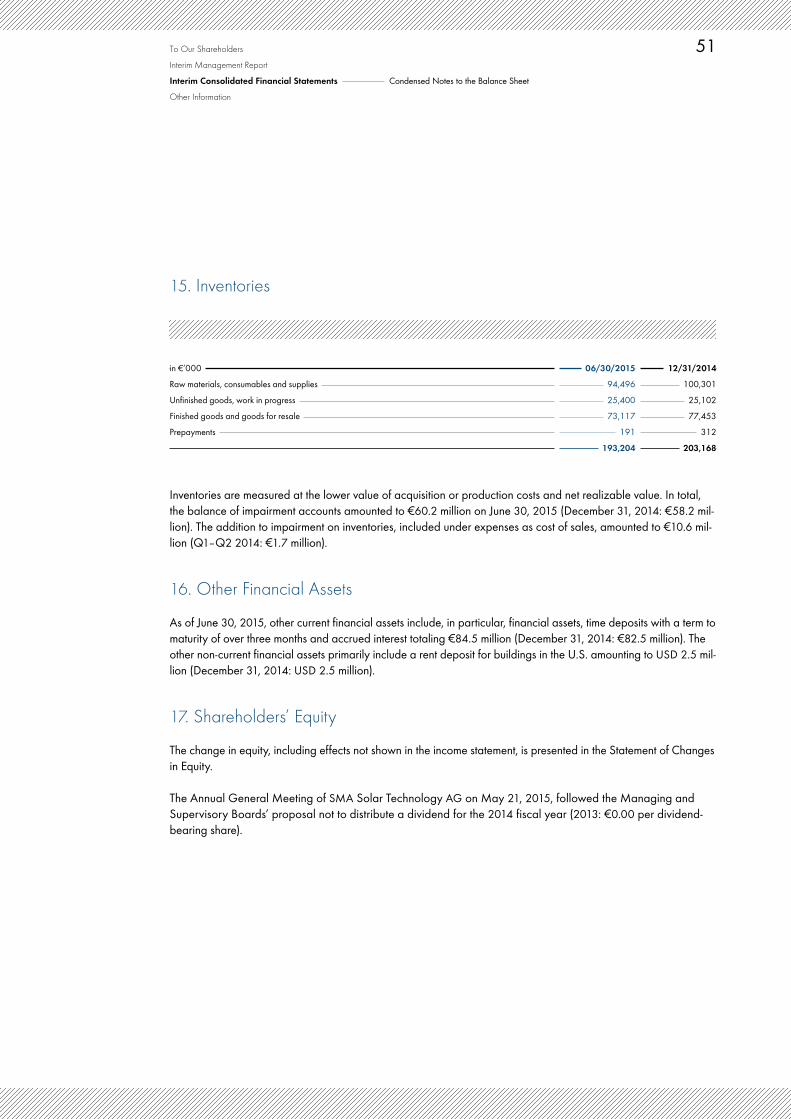
51To Our ShareholdersInterim Management ReportInterim Consolidated Financial Statements Condensed Notes to the Balance Sheet Other Information
15. Inventories
in €’000 06/30/2015 12/31/2014Raw materials, consumables and supplies 94,496 100,301Unfinished goods, work in progress 25,400 25,102Finished goods and goods for resale 73,117 77,453Prepayments 191 312
193,204 203,168
Inventories are measured at the lower value of acquisition or production costs and net realizable value. In total, the balance of impairment accounts amounted to €60.2 million on June 30, 2015 (December 31, 2014: €58.2 mil-lion). The addition to impairment on inventories, included under expenses as cost of sales, amounted to €10.6 mil-lion (Q1–Q2 2014: €1.7 million).
16. Other Financial AssetsAs of June 30, 2015, other current financial assets include, in particular, financial assets, time deposits with a term to maturity of over three months and accrued interest totaling €84.5 million (December 31, 2014: €82.5 million). The other non-current financial assets primarily include a rent deposit for buildings in the U.S. amounting to USD 2.5 mil-lion (December 31, 2014: USD 2.5 million).
17. Shareholders’ EquityThe change in equity, including effects not shown in the income statement, is presented in the Statement of Changes in Equity.
The Annual General Meeting of SMA Solar Technology AG on May 21, 2015, followed the Managing and Super visory Boards’ proposal not to distribute a dividend for the 2014 fiscal year (2013: €0.00 per dividend- bearing share).

52 SMA Solar Technology AG Half-Yearly Financial Report January to June 2015
18. ProvisionsProvisions account for all discernible risks and contingent liabilities on the balance sheet date and break down as follows:
in €’000 06/30/2015 12/31/2014Warranties 141,895 139,817Personnel 19,442 53,848Other 24,343 19,513
185,680 213,178
Warranty provisions consist of general warranty obligations (periods of between five and ten years) for the various product areas within the Group. In addition, provisions are set aside for individual cases that are expected to be used in the following year.
Personnel provisions mainly include obligations for planned restructuring measures. A significant portion of them affected cash in the reporting period. Reversals of provisions in an amount of €7.3 million were carried out. For the remaining portion, the provision for the layoffs is expected to affect cash in 2015 and was thus not discounted. Also included are obligations for long-service anniversaries, death benefits and partial retirement benefits.
Other provisions include restoration obligations, purchase commitments and obligations for service-related benefits.
SMA expects that these provisions will, in general, affect cash within the next 12 months to 20 years (long-term service contracts).
19. Financial Liabilities
in €’000 06/30/2015 12/31/2014Liabilities towards credit institutions 64,943 62,592Derivative financial liabilities 4,515 6,763
69,458 69,355
Liabilities to credit institutions mainly include the financial liabilities included in SMA’s consolidated financial state-ments as a result of the first-time consolidation of the subgroup Jiangsu Zeversolar New Energy Co., Ltd. in March 2013. In addition, liabilities to credit institutions were incurred for financing of SMA Immo properties and a PV system for SMA AG. They have an average time to maturity of 10 years.

53To Our ShareholdersInterim Management ReportInterim Consolidated Financial Statements Condensed Notes to the Balance Sheet Other Information
The increase in loan liabilities results from Zeversolar borrowings being valued higher as of the reporting date due to currency effects.
Derivative financial liabilities mainly consist of a written put option on Jiangsu Zeversolar New Energy Co., Ltd., shares. Interest derivatives, currency futures and options are also recognized, as in the previous year.
20. Other Financial Liabilities
in €’000 06/30/2015 12/31/2014Sales department liabilities 7,414 5,237Other 7,289 8,628
14,703 13,865
Sales department liabilities primarily consist of liabilities to customers from advance payments received and bonus agreements.
21. Other Liabilities
in €’000 06/30/2015 12/31/2014Accrual item for extended warranties 137,183 129,715Liabilities in the Human Resources department 21,723 23,669Liabilities from prepayments received 26,862 21,106Liabilities due to tax authorities 8,289 3,606Liabilities from subsidies received 555 986Other 1,208 2,127
195,820 181,209
The accrual item for extended warranties includes liabilities from chargeable extended warranties granted for products of the Residential and Commercial business units. Liabilities in the Human Resources department contain obligations towards employees regarding positive vacation and flextime balances as well as variable salary components and contributions to the workers’ compensation association and to social insurance systems. The main items included in the liabilities towards tax authorities are tax liabilities from payroll accounting and sales tax lia-bilities. The liabilities from subsidies received relate to taxable government grants from funds of the common-task program “Improvement of the Regional Economic Structure” (EU GA), granted as investment subsidies. The total amount of retransfer of government grants is stated under other operating income.

54 SMA Solar Technology AG Half-Yearly Financial Report January to June 2015
22. Financial InstrumentsAs of June 30, 2015, there were three currency futures, which are intended to hedge against the currency risks associated with anticipated future sales with customers. The derivatives were still classified as held for trading. They are not part of a hedging relationship as defined by IAS 39. For the interest risks arising for SMA Immo due to financial liabilities, interest derivatives were concluded for a part of these financial liabilities. The derivatives are classified as held for trading. They are not part of a hedging relationship as defined by IAS 39.
06/30/2015 12/31/2014
in €’000
Assessment category
according to IAS 39
Market value
Book value
Market value
Book value
Assets Cash and cash equivalents LaR 166,041 166,041 183,988 183,988Trade receivables LaR 136,154 136,154 159,617 159,617Other financial investments AfS 5 5 5 5Other financial assets 114,611 114,611 111,015 111,015of which institutional mutual funds FAHfT 48,940 48,940 47,480 47,480of which other (time deposits) LaR 65,671 65,671 63,310 63,310
of which derivatives that do not qualify for hedge accounting FAHfT 0 0 225 225
Liabilities Trade payables FLAC 94,275 94,275 111,773 111,773Financial liabilities 69,458 69,458 69,355 69,355of which liabilities towards credit institutions FLAC 64,943 64,943 62,592 62,592
of which derivatives that do not qualify for hedge accounting FLHfT 4,515 4,515 6,763 6,763Other financial liabilities FLAC 14,703 14,703 13,865 13,865
of which grouped by categories according to IAS 39: Loans and Receivables LaR 367,866 367,866 406,915 406,915Financial Liabilities Measured at Amortized Cost FLAC 173,921 173,921 188,230 188,230Financial Assets Held for Trading FAHfT 48,940 48,940 47,705 47,705Financial Liabilities Held for Trading FLHfT 4,515 4,515 6,763 6,763Available for Sale Financial Assets AfS 5 5 5 5

55To Our ShareholdersInterim Management ReportInterim Consolidated Financial Statements Condensed Notes to the Balance Sheet Other Information
Cash and cash equivalents, trade receivables and time deposits mainly have short terms to maturity. Accordingly, their book values on the reporting date are almost identical to their fair value.
The fair values of other non-current assets correspond to the present values of the payments related to the assets while taking into account current interest parameters, which reflect market- and partner-related changes to condi-tions and expectations.
Other financial investments relate to investments not included in the scope of consolidation. However, since no active market exists for these investments and a reliable measurement of their fair value was not possible, measure-ment on the relevant reporting dates was effected at amortized cost of acquisition.
Trade payables and other current financial liabilities normally have short terms to maturity. The recognized values are almost identical to the fair values.
Fair values of other non-current financial liabilities are determined by referring to the present values of the pay-ments associated with the debts. For discounting, term-related commercially available interest rates were used (level 2).
Derivative financial instruments are used to hedge against currency risks arising from operative business. These include currency futures and options. In principle, these instruments are only used for hedging purposes. As is the case with all financial instruments, they are recognized at fair value upon initial recognition. The fair values are also relevant for subsequent measurements. The fair value of traded derivative financial instruments is identical to the market value. This value may be positive or negative. The measurement of forward transactions is based on forward contract rates. Options are measured in line with the Black-Scholes and Heath-Jarrow-Morton option pricing models. The parameters that were used in the valuation models are in line with market data.
The put option in the amount of the present value of the redemption amount of shares granted in connection with the acquisition of Zeversolar shares is posted under derivative financial liabilities without a hedge relationship. As of the reporting date, the put option is valued at €3.7 million (December 31, 2014: €3.7 million).
The present value of the redemption amount was determined using a discounted cash flow methodology (level 3 of the fair value hierarchy), taking into account the adjusted contractual regulation of the put option. This regula-tion stipulates that the redemption amount lies within a contractually agreed upon corridor of between RMB 27.4 million (June 30, 2015: €4.0 million) and RMB 41.1 million (June 30, 2015: €6.0 million). Within this corridor, the redemption amount varies mainly depending on EBIT as a non-observable input factor. This is derived from Zeversolar’s internal planning. The market value as of June 30, 2015 was €3.8 million (June 30, 2014: €3.6 mil-lion). A sensitivity analysis shows that a 10% increase in the Zeversolar EBIT, taking into account the corridor, would not result in a substantial change in the present value of the redemption price, and that a 10% reduction in its EBIT also would, as in the past year, not have any effects with regard to the range. An increase in the interest rate of 100 basis points would result in an increase in the present value of the redemption amount of €0.1 million (June 30, 2014: €0.2 million). A reduction in the interest rate of 100 basis points would result in a decrease in the present value of the redemption amount of €0.1 million (June 30, 2014: €0.0 million).

56 SMA Solar Technology AG Half-Yearly Financial Report January to June 2015
The following table shows the allocation of our financial assets and liabilities measured at fair values in the balance sheet using the three levels of the fair value hierarchy:
06/30/2015 Level 1 Level 3 Level 3 Totalin €’000 Financial assets, measured at fair value Institutional mutual funds 48,940 – – 48,940Derivative financial instruments – 0 – 0Financial liabilities, measured at fair value Derivative financial instruments – 757 3,758 4,515
12/31/2014 Level 1 Level 3 Level 3 Totalin €’000 Financial assets, measured at fair value Institutional mutual funds 47,480 – – 47,480Derivative financial instruments – 225 – 225Financial liabilities, measured at fair value Derivative financial instruments – 3,015 3,748 6,763
Notes to the Statement of Cash Flows SMA GroupThe liquid funds shown in the Statement of Cash Flows correspond to the balance sheet item “Cash and cash equivalents.”
23. Net Cash Flow From Operating ActivitiesThe gross cash flow of €–5.1 million (Q1–Q2 2014: €–41.7 million) reflects the operating income prior to commitment of funds. It improved primarily because of the improvement of consolidated earnings before taxes by €36.6 million year on year.
Net cash flow from operating activities in the first half of 2015 amounted to €12.1 million (Q1–Q2 2014: €–33.1 million).
57To Our ShareholdersInterim Management ReportInterim Consolidated Financial Statements Condensed Notes to the Balance Sheet | Notes to the Statement of Cash FlowsOther Information
The change in net working capital is chiefly due to a €23.8 million decrease in trade receivables that affects the Statement of Cash Flows (June 30, 2014: €8.1 million). Inventory declined, due partially to necessary devalua-tions, and amounted to €193.2 million (December 31, 2014: €203.2 million). Because of the strong sales in the first half of 2015, inventories both of finished goods and of raw materials, consumables and supplies decreased on the basis of the positive order situation at present. The change to inventories relevant to the Statement of Cash Flows amounts to €–0.2 million (June 30, 2015: €–0.2 million). Furthermore, a €17.5 million decline in trade pay-ables relevant to the Statement of Cash Flows occurred (June 30, 2014: €19.4 million increase).
24. Net Cash Flow From Investing ActivitiesIn the first half of 2015, net cash flow from investing activities amounted to €–34.2 million compared with the pre-vious year’s figure of €18.5 million. The outflow of funds for investments in fixed assets and intangible assets amounted to €32.4 million and was virtually unchanged year on year. A significant portion of the investments went to capitalized development projects for the introduction of a new product family of central inverters.
Pursuant to IAS 7.16, monetary investments with a term to maturity of more than three months are allocated to the net cash flow from investing activities.
25. Net Cash Flow From Financing ActivitiesIn the reporting period, net cash flow from financing activities consisted of Immo loan repayments and repayments as well as borrowings of loan liabilities of Jiangsu Zeversolar New Energy Co., Ltd.
26. Cash and Cash EquivalentsCash and cash equivalents amounting to €166.0 million (June 30, 2014: €171.3 million) include cash on hand, bank balances and short-term deposits with an original term to maturity of less than three months.

58 SMA Solar Technology AG Half-Yearly Financial Report January to June 2015
Other Disclosures27. Events After the Balance Sheet DateThere were no significant events on or after the balance sheet date other than those presented in or recognizable from the statements in the Notes to the Consolidated Financial Statements.
28. Related Party DisclosuresSMA adjusted its organizational structure at the beginning of 2015 and has operated under a functional organiza-tion. In the new organization, the Residential, Commercial, Utility and Service business units take on overall re-sponsibility and manage Development, Sales and Operations. Railway Technology, Zeversolar as well as Off-Grid and Storage are combined under Other Business. There is no longer a decision-making level corresponding to the Executive Vice Presidents below the Managing Board. Thus, this step in the decision-making process has been eliminated to streamline the entire process.
As part of the Company’s transformation, the number of Managing Board members was reduced. Lydia Sommer therefore left the Managing Board at the end of February 2015. Since March 1, 2015, the SMA Managing Board has comprised the following members: SMA Chief Executive Officer Pierre-Pascal Urbon is responsible for Strategy and, in addition, as Chief Financial Officer (CFO) for Finance, Legal and Compliance as well as for Operations. Roland Grebe, formerly Board Member for Technical Innovation, is in charge of Human Resources and IT. In addi-tion, he is the new Labor Director at SMA Solar Technology AG. Dr.-Ing. Jürgen Reinert has taken on overall re-sponsibility for Technology. Martin Kinne has been responsible for Sales and Service since January 2015.
Sadly, Company founder and long-standing Supervisory Board Chairman Dr.-Ing. h. c. Günther Cramer died on January 6, 2015, after a long and serious illness. The vacant position on the SMA Supervisory Board was filled by Roland Bent, member of the Executive Board of Phoenix Contact GmbH & Co. KG.
The election of employee representatives to the Supervisory Board was held in May 2015. The newly elected employee representatives are Yvonne Siebert, Hans-Dieter Werner and Dr. Matthias Victor.

59To Our ShareholdersInterim Management ReportInterim Consolidated Financial Statements Other DisclosuresOther Information
Danfoss A/S has a 20% stake in SMA. There is a strategic partnership between SMA and Danfoss in order to collaborate in the areas of Purchasing, Sales and R&D. SMA also performs services on behalf of Danfoss. All agreements were concluded under fair market conditions. Business relations between SMA and Danfoss in the fiscal year are presented in the table below. There are no material collaterals or guarantees.
in €’000 Q1– Q2 2015 Q1– Q2 20141
Goods acquired from Danfoss 6,804 0Services acquired from Danfoss 5,420 0Services sold to Danfoss 1,526 0Outstanding receivables as of the reporting date 494 0Outstanding liabilities as of the reporting date 3,651 0
1 The partnership with Danfoss was agreed upon in May 2014, so significant transactions had not yet been concluded with Danfoss as of June 30, 2014.
In the reporting period, there were no other significant transactions with other related parties.
Niestetal, July 31, 2015
SMA Solar Technology AG The Managing Board
Roland Grebe Martin Kinne Dr.-Ing. Jürgen Reinert Pierre-Pascal Urbon

60 SMA Solar Technology AG Half-Yearly Financial Report January to June 2015
Responsibility Statement
We assure to the best of our knowledge that, in accordance with the applicable accounting standards for interim financial reporting, the Consolidated Interim Financial Statements give a fair view of the net assets, financial position and results of operations of the Group and that the Consolidated Interim Management Report gives a fair view of the course of business including the results of operations and the Group’s position and describes the fundamental opportunities and risks associated with the expected development of the Group for the remaining months of the fiscal year.
Niestetal, July 31, 2015
SMA Solar Technology AG The Managing Board
Roland Grebe Martin Kinne Dr.-Ing. Jürgen Reinert Pierre-Pascal Urbon

61To Our ShareholdersInterim Management ReportInterim Consolidated Financial Statements Responsibility Statement | Auditor’s ReportOther Information
Auditor’s Report(Translation – the German text is authoritative)
To SMA Solar Technology AG, Niestetal
We have reviewed the Condensed Interim Consolidated Financial Statements – comprising the Condensed Income Statement, the Condensed Statement of Comprehensive Income, Condensed Balance Sheet, Condensed State-ment of Changes in Equity, Condensed Statement of Cash Flows and Selected Explanatory Notes – together with the Interim Group Management Report of SMA Solar Technology AG, Niestetal, for the period from January 1, 2015, to June 30, 2015, which are components of the Half-Yearly Financial Report pursuant to Section 37w (2) of the German Securities Trading Act (WpHG). The preparation of the Condensed Interim Consolidated Financial Statements in accordance with the International Financial Reporting Standards (IFRS) applicable to interim financial reporting as adopted by the EU and of the Interim Group Management Report in accordance with the provisions of the German Securities Trading Act applicable to interim group management reports is the responsibility of the Company’s Managing Board. Our responsibility is to issue a review report on the Condensed Interim Consolidated Financial Statements and on the Interim Group Management Report based on our review.
We conducted our review of the Condensed Interim Consolidated Financial Statements and of the Interim Group Management Report in accordance with German generally accepted standards for the review of financial state-ments promulgated by the Institute of Public Auditors in Germany (Institut der Wirtschaftsprüfer). Those standards require that we plan and perform the review so that we can preclude through critical evaluation, with moderate assurance, that the Condensed Interim Consolidated Financial Statements have not been prepared, in all material respects, in accordance with the IFRS applicable to interim financial reporting as adopted by the EU or that the Interim Group Management Report has not been prepared, in all material respects, in accordance with the provi-sions of the German Securities Trading Act applicable to interim group management reports. A review is limited primarily to inquiries of company personnel and analytical assessments and therefore does not provide the assur-ance attainable in a financial statements audit. Since, in accordance with our engagement, we have not performed a financial statement audit, we cannot express an audit opinion.
Based on our review, no matters have come to our attention that cause us to presume that the Condensed Interim Consolidated Financial Statements of SMA Solar Technology AG, Niestetal, have not been prepared, in all mate-rial respects, in accordance with the IFRS applicable to interim financial reporting as adopted by the EU or that the Interim Group Management Report has not been prepared, in all material respects, in accordance with the provisions of the German Securities Trading Act applicable to interim group management reports.
Hanover, July 31, 2015
Deloitte & Touche GmbH Wirtschaftsprüfungsgesellschaft
Scharpenberg Meier Wirtschaftsprüfer Wirtschaftsprüfer (German Public Auditor) (German Public Auditor)

62 SMA Solar Technology AG Half-Yearly Financial Report January to June 2015
REGISTERED TRADEMARKSCompany logos, SMA, SMA Solar Technology, SMA Railway Technology, SMA Solar Academy, Sunny, Sunny Central, Sunny Boy, Sunny Tripower, Sunny Island, Sunny Portal, Sunny Places, Energy that changes are registered trademarks of SMA Solar Technology AG in many countries.
Zeversolar is a registered trademark of Jiangsu Zeversolar New Energy Co., Ltd.
DISCLAIMERThe Annual Report, in particular the forecast report included in the management report, includes various forecasts and expectations as well as statements relating to the future development of SMA Group and SMA Solar Technology AG. These statements are based on assumptions and estimates and may entail known and unknown risks and uncertainties. Actual development and results as well as the financial and asset situation may therefore differ substantially from the expectations and assumptions made. This may be due to market fluctuations, the development of world market prices for commodities, of financial markets and exchange rates, amendments to national and international legislation and provisions or fundamental changes in the economic and political environment. SMA does not intend to and does not undertake an obligation to update or revise any forward- looking statements to adapt them to events or developments after the publication of this Annual Report.

63To Our ShareholdersInterim Management ReportInterim Consolidated Financial StatementsOther Information Registered Trademarks | Disclaimer | Financial Calendar
FINANCIAL CALENDAR
11/12/2015 Publication of Quarterly Financial Report: January to September 2015 Analyst Conference Call: 9:00 a.m. (CET)
30/03/2016 Publication of the SMA Group 2015 Annual Report and 2015 Individual Financial Statement SMA Solar Technology AG Analyst Conference Call: 09:00 a.m. (CET)
12/05/2016 Publication of Quarterly Financial Report: January to March 2016 Analyst Conference Call: 09:00 a.m. (CET)
31/05/2016 2016 Annual General Meeting 11/08/2016 Publication of Half-Yearly Financial Report: January to June 2016
Analyst Conference Call: 09:00 a.m. (CET) 10/11/2016 Publication of Quarterly Financial Report: January to September 2016
Analyst Conference Call: 09:00 a.m. (CET)
© 2015, SMA Solar Technology AGSMA on the social web: www.SMA.de/Media-Newsroom | Facebook | Twitter | YouTube | SMA Corporate Blog
Publication Information
Published bySMA Solar Technology AG
TextSMA Solar Technology AG
Concept and design (financial report)3st kommunikation, Mainz
Typesetting (financial report)Knecht GmbH, Ockenheim
PhotosStefan Daub
Contact
SMA Solar Technology AGSonnenallee 134266 NiestetalGermanyPhone: +49 561 9522-0Fax: +49 561 9522-100e-mail: [email protected] www.SMA.de
Investor Relationswww.IR.SMA.de/contactFax: +49 561 9522-2223

SMA Solar Technology AGSonnenallee 134266 NiestetalGermanyPhone: +49 561 9522-0Fax: +49 561 9522-100e-mail: [email protected]