energy storage technologies – a way to cope with the ... · energy storage technologies – a way...
TRANSCRIPT

Gelsenkirchen 30-10-06 page 1 Wuppertal Institute
First International Renewable Energy Conference (IRES I)
Energy storage technologies –a way to cope with the intermittend supply of
Renewable Energies
Dipl.-Ing. Vanessa Grimm
October 30 and 31, 2006 Science Park Gelsenkirchen

Gelsenkirchen 30-10-06 page 2 Wuppertal Institute
Agenda
• Introduction and background
• Model for the economic best operation of balancing options
- Technologies
- Supply costs of generation/balancing options
- Results: · Operation plan for peak load sector
· Costs of peak load and balancing power
• Summary and conclusion

Gelsenkirchen 30-10-06 page 3 Wuppertal Institute
Introduction and background
Electricity generation today (Germany): 11% RES [VDEW]2020: at least 20% [coalition agreement Nov. 2005]2050: 50% [long-term scenario UBA]
⇒ mitigation of the intermittend supply (PV, wind)
Thermal power plants designed for rated power,decreasing efficiency with part load. No frequent start-up
Influencing the demand side ⇒ demand side management
Uhrzeit [h] Uhrzeit [h]
Leis
tung
[kW
]

Gelsenkirchen 30-10-06 page 4 Wuppertal Institute
Developement of the RES electricity generation in TWhscenario „Wahrscheinliche Entwicklung“ (DLR, WI, ZSW 2005)
1990 1992 1994 1996 1998 2000 2002 2004 2006 2008 2010 2012 2014 2016 2018 20200
20
40
60
80
100
120
140
160
Wasser WindOnshore
WindOffshore
Biomasse,biog. AbfŠlle Fotovoltaik Geothermie Europ.
Verbund
oeko/projekt2020/str20var; 7.6.05
18
39
86
151
2000 2005 2010 2015 20200
40
80
120
160
REF nach Energiereport IV (2005)
AUSBAU (Bandbreite)
REF Band width in 2020:139 bis 177 TWh/a53,2 bis 66,7 GWel (without biological waste)
intermittend:60% of RES resp15 % of total generation
Gelsenkirchen 30-10-06 page 5 Wuppertal Institute
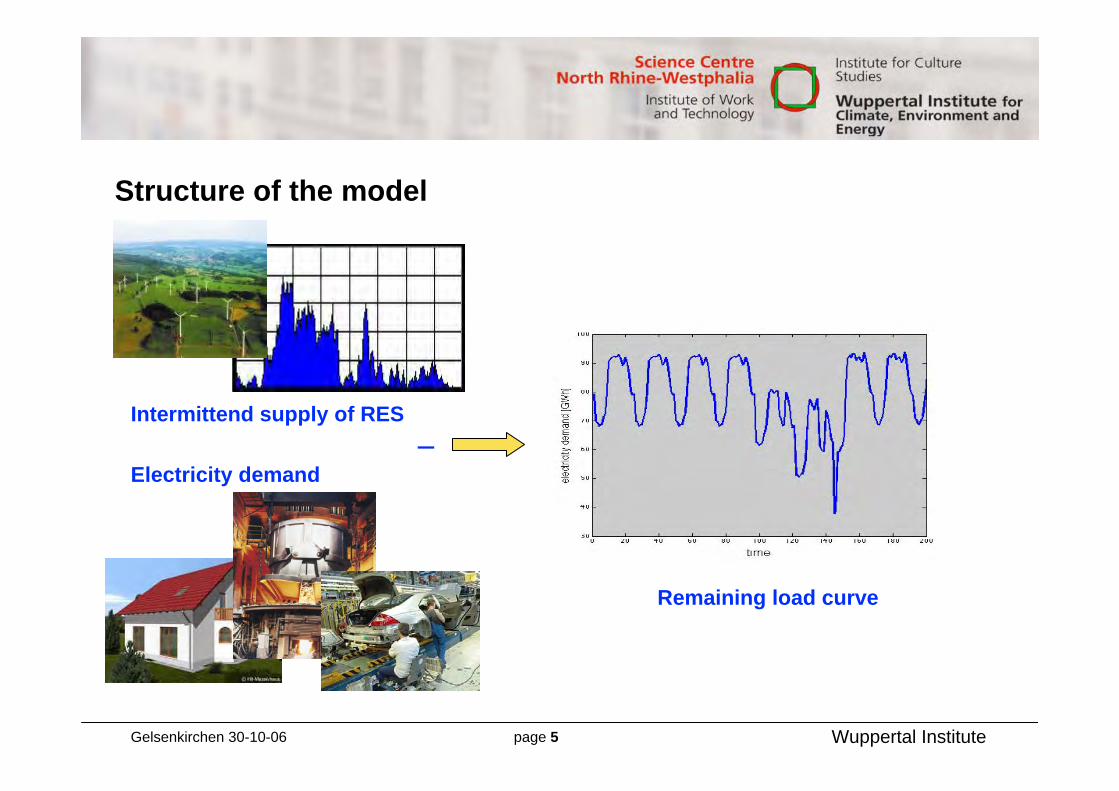
Structure of the model
Remaining load curve
Electricity demand
Intermittend supply of RES_

Gelsenkirchen 30-10-06 page 6 Wuppertal Institute
Intermittend supply of RES (year 2020)fluktuierende regenerative Einspeisung Deutschland Winter 2020
0
5
10
15
20
25
30
35
40
Leis
tung in G
W
Wind
PV
Mo. Di. Mi. Do. Fr. Sa. So.
fluktuierende regenerative Einspeisung Deutschland Sommer 2020
0
5
10
15
20
25
30
35
Leis
tung in G
W
Wind
PV
Mo. Di. Mi. Do. Fr. Sa. So.
Deviation of wind energy forecast: day ahead: 5,7 % PnennIntraday (4h ahead): 3,6 % Pnenn

Gelsenkirchen 30-10-06 page 7 Wuppertal Institute
Max. power gradient of wind energy [GW/h] per dayto identify 4 typical load days for the model
/ h
> 5.7 GW/h
< 1.5 GW/h 3 - 5.7 GW/h
1.5 - 3 GW/h

Gelsenkirchen 30-10-06 page 8 Wuppertal Institute
Demand for balancing options differentiated into different time zones (response time/duration)
< 30 sec → Primärregelung
30 sec - 15 min → Sekundärregelung
15 min - few hours → Minutenreserve
> few hours → Tertiärregelung, Kaltreserve
15 min - few hours → Minutenreserve

Gelsenkirchen 30-10-06 page 9 Wuppertal Institute
Generation/balancing options considered for the model
sort of energy
mechanical/static
electric-chemical
chemical
electrical
mechanical/dynamic
- SMES
- Supercap
- pumped hydro
- CAES
- hydrogen
- flywheel
- (flow)battery
fossil - Hard coal power plant
- Combined cycle plant
- Gas turbine
demand related - Demand side management 2000 MW
6 á 600 MW
10 á 300 MW
13 á 150 MW
Number of units
10 á 50 MW
4 á 1060 MW
6 á 290 MW
15 á 1.2 MW

Gelsenkirchen 30-10-06 page 10 Wuppertal Institute
Mathematical optimization model for the economic bestoperation of balancing technologies (EmSAr-Modell)
• Programming with Matlab/Simulink©
• Linear optimization with technical restrictions (start-up time/costs of thermal power plants, rated power, minimum power, part load efficiency, State of charge)
• Time horizon: 2020+2030, electricity demand Germany
• sample rate: 1 hour
Marginal note:
• 1-point-model/no division into different supply areas, no import/export of electricity
• Feed-in tarif for RES (EEG) until 2020

Gelsenkirchen 30-10-06 page 11 Wuppertal Institute
Remaining load curve (electricity demand – feed-in of RES)
focussing on peak load of the remainig demand→ define demand sector <600h/year

Gelsenkirchen 30-10-06 page 12 Wuppertal Institute
Parameter for calculating the supply costs
hard coal
combined cycle
gas turbine
lead acid battery
flow-battery
pumped hydro
CAES (adiabat)
power related [€/kW] 800 500 300 -
capacity related [€/kWh] 0 0 0 1000 290 15 60discount rate [%] 10 10 10 10 10 10 10lifetime [a] 15 15 15 5 15 25 20
variable [ct/kWh] 0,1 0,07 0,05 0,01 0 0,0032 0,003
fixed [ct/kW a] 2.287 1.356 1.000 1,55 15 3,8 1,42fuel cost [ct/kWh Hu] 0,57 1,6 1,6 - - - -
fuel input per start [ct/kW] 3,53 5,60 1,76 - - - -
wear cost per start [ct/kW] 0,48 1,00 1,00 - - - -warm start coefficient [%] 50 50 - - - - -
hot start coefficient [%] 30 30 - - - - -
rated power [MW] 600 300 150 1,2 50 1.060 290operating hours [h/a] 2.000 515 1.760 153 1.244 3.999 1.395discharge duration [h] - - - 2 8 8 2lower limit SOC [%] - - - 50 80 - -efficiency [-] 0,40 0,55 0,38 0,8 0,7 0,8 0,70
capital
co
stO
&M
-cost
star
t-up
cost
tech
nic
al
dat
a

Gelsenkirchen 30-10-06 page 13 Wuppertal Institute
Calculated supply cost of generation/balancing technologies(without detailed investment plan for new power plants/storage systems)
[Source: own calculation]
sort of technology without includingcapital costs capital costs
Hard coal power plant 4,68 9,93
Combined cycle 8,91 21,68
Gas turbine 7,59 9,83
Lead-acid battery >100 >100
Flowbattery 5,79 40,01
Pumped hydro 4,17 4,50
CAES 4,69 5,70
Demand side management 7,00 14,00
supply costs [ct/kWhel]

Gelsenkirchen 30-10-06 page 14 Wuppertal Institute
Results: operation plan for typical load days
Optimization input parameter: O&M-costs, neglecting capital costs

Gelsenkirchen 30-10-06 page 15 Wuppertal Institute
Operational hours

Gelsenkirchen 30-10-06 page 16 Wuppertal Institute
Balancing power∆ (wind prognosis – prognosis+intraday wind energy prognosis deviation)
Positive balancing power per day: 1.7 - 3.2 GWh/day
Negative balancing power per day: 1.9 - 3.6 GWh/day
Gelsenkirchen 30-10-06 page 17 Wuppertal Institute
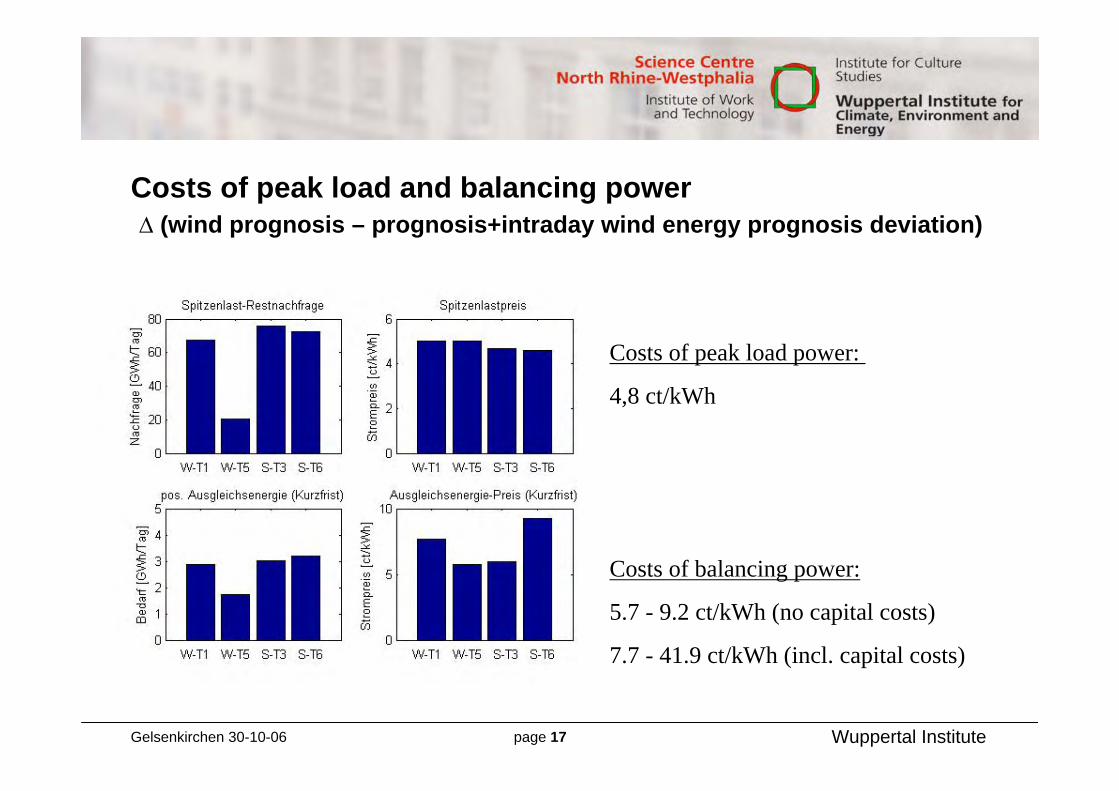
Costs of peak load and balancing power ∆ (wind prognosis – prognosis+intraday wind energy prognosis deviation)
Costs of peak load power:
4,8 ct/kWh
Costs of balancing power:
5.7 - 9.2 ct/kWh (no capital costs)
7.7 - 41.9 ct/kWh (incl. capital costs)

Gelsenkirchen 30-10-06 page 18 Wuppertal Institute
Pilot projects – storage technologies already in use
• 6 MWh Vanadium-Flowbattery - 30 MW wind farm (Japan)
12 MWh VRB-ESS in fall 2007 - 38 MW wind farm (Ireland)
• 1,6 MW Lead-Acid battery (Herne, Bocholt)
• 200 kW flywheel – 2 wind turbines a 600 kW
• planned: 200 MW CAES – 100 MW wind farm (Iowa)
• EU research project: adiabatic CAES
source: KBB Crotogino
source: Beacon Power
source: VRB Power Systemsr

Gelsenkirchen 30-10-06 page 19 Wuppertal Institute
Summary and conclusion
Exemplary results of the model show that high amounts of RES can be integrated in the electricity system if sufficient storage/balancing options are available.
Electricity demand coincided despite intermittend supply of wind+photovoltaics.
Next steps to prove:
• Detailed investment plan for new power plants/ new stoarge systems considering capital investment costs.
• Identifying benchmarks to place new technologies on the market.
• Verifying + modifying the model for different power plant systems (type and numberof base load plants etc.).
• Considering the electricity grid + regional feed-in of RES.

Gelsenkirchen 30-10-06 page 20 Wuppertal Institute
Thank you for your attention!
Kontakt:
Dipl.-Ing. Vanessa GrimmWuppertal InstitutDöppersberg 1942103 Wuppertal0202-2492-3060202-2492-109 (Sekretariat)[email protected]