energy spectrum of cosmic protons and helium nuclei with a … · 33rd international cosmic ray...
TRANSCRIPT
33RD INTERNATIONAL COSMIC RAY CONFERENCE, RIO DE JANEIRO 2013
THE ASTROPARTICLE PHYSICS CONFERENCE
Energy spectrum of cosmic Protons and Helium nuclei with a hybrid measure-ment by ARGO-YBJ and a wide field Cherenkov telescope
SHOUSHAN ZHANG1 , MIN ZHA1 FOR THE ARGO COLLABORATION AND LHAASO COLLABORATION.
1 Institute of High Energy Physics, CAS, Beijing, China
Abstract: The energy spectrum of the cosmic light component (protons + helium nuclei) from 5 TeV to 200 TeV
measured by the ARGO-YBJ experiment agrees well with the sum of the proton and helium spectra measured by
the CREAM experiment. However, this is still well below the “knee” of the cosmic ray spectrum. It is essential
to extend the energy spectrum to higher energy region. Using a wide field-of-view Cherenkov telescope and the
Resistive Plate Chamber (RPC) array of the ARGO-YBJ experiment at 4300 m a.s.l., cosmic protons and helium
nuclei above 100 TeV have been well separated from other cosmic ray components. A highly uniform energy
resolution of about 25% throughout the whole energy range is achieved by combining the geometric parameters
measured by the RPC array and the Cherenkov photon fluxes measured by the telescope. In this way, the sum
of proton and helium energy spectrum from 100 TeV to 800 TeV is obtained. No significant structures in the
spectrum have been observed.
Keywords: Cherenkov telescope; ARGO-YBJ; energy spectrum; hybrid measurement; composition.
1 Introduction
The energy spectrum of primary cosmic rays has been mea-sured by many experiments over a wide energy range, par-ticularly, in which there exists a “knee”. However, the ex-perimental results seem not to agree with each other wellin the “knee” region [1]. This does not help to make con-vergence among controversial arguments on the origin ofthe “knee”, or the origin of high energy cosmic rays. Iden-tifying cosmic ray nuclei and measuring the energy spec-trum for each species must be the first step in the process.Due to the limited apertures of detectors, direct measure-ments using space-borne detectors can well cover the lowenergy region, up to a few hundred TeV. For measuring the“knee”, one still needs to extend the measurements to high-er energy region with ground-based experiments. Becausespace-borne detectors are calibrated for their energy mea-surement and composition determination, these measure-ments serve as standards for setting the energy scale andabsolute abundance of each species. Ground based mea-surements in the energy region above 10 TeV play crucialroles due to the direct overlaps with the space-borne mea-surements.
The energy spectrum of cosmic light component (pro-tons + helium) from 5 TeV to 200 TeV has been measuredby the ARGO-YBJ experiment [2]. The ARGO-YBJ ener-gy spectrum agrees well with the sum of the proton andhelium spectra measured by the CREAM experiment [3].However, it is still well below the “knee” region of the cos-mic ray spectrum. It is essential to extend the energy spec-trum to higher energy regions. In this paper, the energyspectrum of cosmic proton and helium nuclei above 100TeV measured by a combination of the telescopes of WFC-TA and the ARGO-YBJ array is reported.
2 The experiment
The two prototype telescopes [4] of the WFCTA for amuch larger future experiment, i.e., the Large High Alti-
tude Air Shower Array (LHAASO) [5], have been success-fully operated at YangBaJing Cosmic Ray Observatory n-ear the ARGO-YBJ array since 2008. One Cherenkov tele-scope (WFCTA-02) is running at a fixed angle for cos-mic ray observation. WFCTA-02 is located on the south-east corner of the ARGO-YBJ array and is about 78.9 maway from the center of the ARGO-YBJ RPC carpet ar-ray. Several million hybrid cosmic ray events, which trig-ger both the ARGO-YBJ array and WFCTA-02 simultane-ously, have been collected.
The ARGO-YBJ experiment [6] is a “full-coverage” airshower array of Resistive Plate Chambers (RPC). The de-tector includes a central carpet of 74 × 78 m2, 130 cen-tral clusters made of a single layer of RPC with 93% ac-tive area, and 23 guard ring clusters. The digital picked upby the RPC, which has a maximum density of 23 strips/m2,can be used to study the primary spectrum below a fewhundred TeV [7]. To extend the dynamic range up to PeVenergies, each chamber is equipped with two large pads(139 × 123 cm2) to collect the total charge developed bythe particles hitting the detector [8]. These pick-up elec-trodes, called big pads, face the lower side of the RPC gasvolume.
3 Data selection
From Dec. 2010 to Feb. 2012, the cosmic ray coinciden-t events that trigger both the WFCTA-02 and the ARGO-YBJ detector simultaneously, are used to do data analy-sis in this work. Additional selections and processing arecarried out in the following to ensure that well measuredevents are used for data analysis.
3.1 Criteria for good weather
The intensity of starlight recorded by the Cherenkov tele-scope can be used to determine the weather conditions [9].Bright sources such as stars passing through the FOV ofthe Cherenkov telescope can increase the baseline record-
ICRC 2013 Template
33RD INTERNATIONAL COSMIC RAY CONFERENCE, RIO DE JANEIRO 2013
ed by the telescope. There is a clear correlation betweenthe total stellar flux and the baseline, where the flux of s-tarlight can be obtained from the star catalog [10]. The cor-relation is weakened or disappearing when the telescopesuffers bad weather such as clouds appearing in the FOV.Therefore, the correlation coefficient between the baselineand starlight can be used to determine the weather condi-tions. After comparison with the result of the infrared de-tector mounted at the same site, a correlation coefficientgreater than 0.8 is defined as good weather [9].
3.2 Criteria for well measured events
A previous study achieved core position resolution of bet-ter than 2 m and angular resolution of better than 0.4◦ us-ing a digital readout when shower cores were located in-side the ARGO-YBJ center carpet and the showers had hitmultiplicities (nhit) higher than 1000 [11]. The core posi-tion of each shower is estimated using the location of thebig pad that records the maximum number of particles ineach shower when the digital readout is saturated. The ac-curacy of the core position reconstruction is about 2 m forevents in which the cores are in the center of the carpetfrom simulations. Therefore, the coincident events whosecores are located inside the ARGO-YBJ center carpet areused for data analysis in the present paper.
In addition to the shower cores located inside theARGO-YBJ center carpet for good showers reconstruction,more cutoffs have been applied to guarantee good qualityin Cherenkov images. At least 6 triggered tubes in each im-age are required. The space angle between the direction ofthe brightest pixel and the direction of the telescope mainaxis in each event, denoted as α , is also required to be lessthan 6◦ to make sure that the images are fully contained.About 32,700 events survived after all the cutoffs beingapplied. They are well defined in the aperture of the tele-scope, namely zenith angle from 24◦ to 37◦ and azimuthangle from 249◦ to 273◦ and within the area of the RPCarray of 74 m × 78 m.
4 Monte Carlo simulation
Extensive air shower simulations are carried out by a COR-SIKA code using the high-energy hadronic interactionmodel QGSJETII-03 and the low-energy hadronic inter-action model GHEISHA 2002. A GEANT4-based simula-tion package (G4argo) is used for the ARGO-YBJ detec-tor [13]. A ray tracing package [14] is used to simulate theCherenkov telescope.
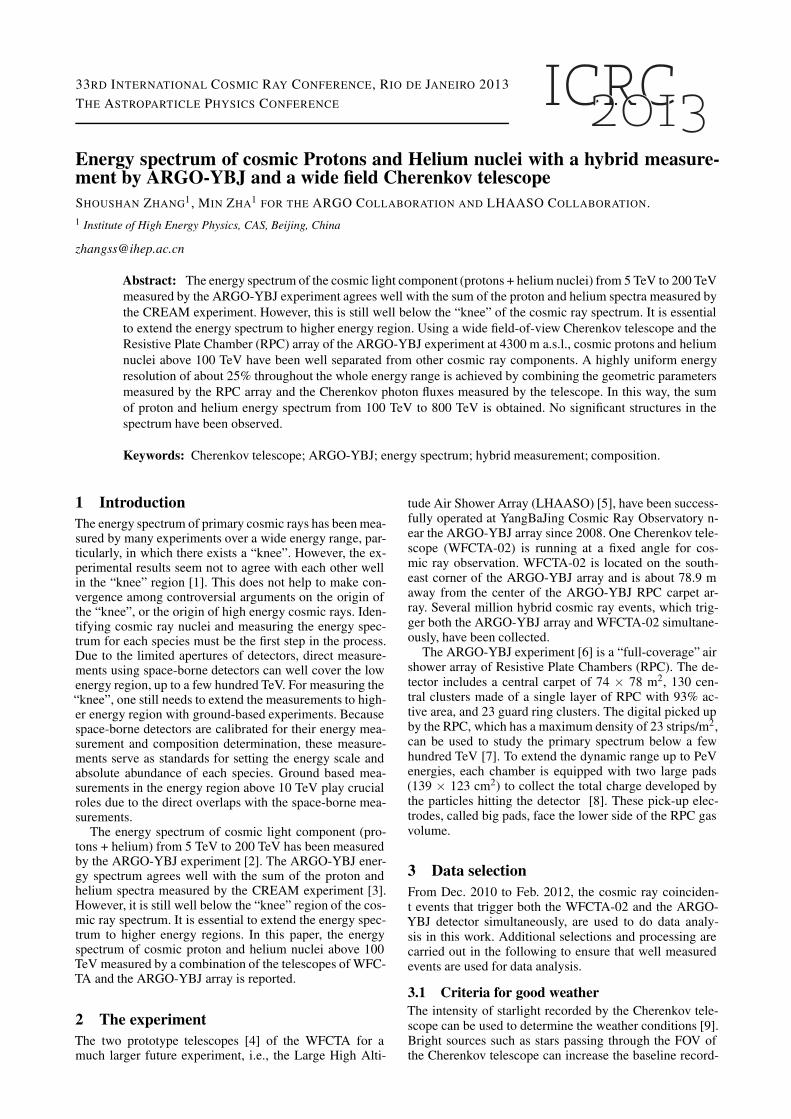
The primary particles are divided into five groups: pro-tons, helium, CNO (carbon, nitrogen and oxygen) group,MgAlSi (magnesium, alumina and silicon) group and iron.The energy distribution of the five groups before the lightcomponent selection and the primary energy distributionas the input to the simulation are shown in Fig.1. The hy-brid observation has nearly full efficiency for all compo-nents in the simulation when the primary particles energyis greater than 100 TeV.
5 Composition: selecting protons and
helium nuclei
The secondary particles in showers induced by heavier nu-clei are more diffused to the farther area laterally and pro-duce a more uniform distribution due to Coulomb scatter-
log10(Energy/TeV)1.2 1.4 1.6 1.8 2 2.2 2.4 2.6 2.8 3
En
trie
s
10
210
310
410
510
610 Proton
Helium
CNO
MgAlSi
Iron
Heavy component
Light componentPrimary
After selection Before selection
Fig. 1: Primary energy distribution of the five primary par-
ticle groups is shown before the light component selec-
tion. Energy distribution of the light component (protons
+ helium) and the heavy component (CNO+MgAlSi+Iron)
after the light component selection are shown as well.
Pre-injected primary energy spectrum (black solid line) is
shown as the reference.
ing. Therefore, it is clearly seen that there are significan-t differences between the lateral distributions of showersinduced by light and heavy nuclei in the vicinity of cores,while they are very similar at a certain distance, e.g., 30 maway from cores. With its 93% active area, the ARGO-YBJ detector measures the lateral distribution of secondaryparticle densities very near the shower cores. Usually thelargest number of particles recorded in the RPC in an even-t, denoted as RPCmax, is in the RPC that is closest to thecore. RPCmax cores due to a heavy nucleus must be lessthan those due to a light nucleus. Obviously, RPCmax isenergy dependent; therefore a normalization procedure isnecessary before it can be used for composition determi-nation. According to the simulation, RPCmax is proportion-al to E ′1.44, where E ′ is the reconstructed shower energyusing the Cherenkov telescope and assuming a pure he-lium composition for all recorded showers before know-ing the composition. The reduced parameter log10RPCmax
- 1.44log10E ′, denoted as pL, serves as a good indicator ofthe shower composition.
The other mass sensitive parameter is associated withshape of the Cherenkov images of showers recorded by thetelescopes. A Cherenkov image looks like an ellipse andis described by Hillas parameters [15] such as the widthand length of the image. The images are more stretched,i.e. narrower and longer, for showers that are more deeplydeveloped in the atmosphere. The ratio of the length to thewidth (L/W ) is therefore a good parameter that is sensitiveto the primary composition. It is also known that the imageis more elongated when the shower is farther away fromthe telescope, i.e., the image becomes longer and narrowerfor showers located farther away. Before they are used asindicators of the composition, images must be normalizedfor showers with different impact parameters, Rp. Further-more, the images are also more stretched for the more en-ergetic showers. According to simulation, the ratio L/W ofimages is linearly proportional to Rp and log10E ′. The re-duced parameter L/W −0.0091Rp−0.14log10E ′, denotedas pC, serves as an indicator for the primary components.
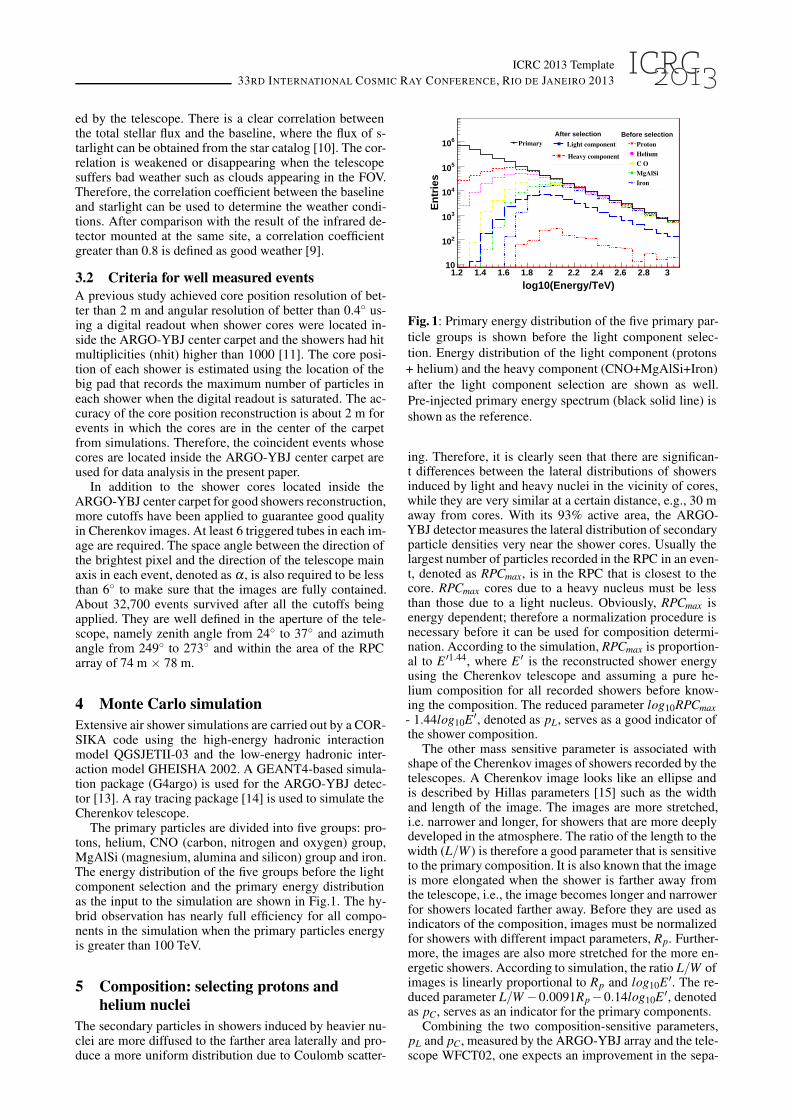
Combining the two composition-sensitive parameters,pL and pC, measured by the ARGO-YBJ array and the tele-scope WFCT02, one expects an improvement in the sepa-

ICRC 2013 Template
33RD INTERNATIONAL COSMIC RAY CONFERENCE, RIO DE JANEIRO 2013
Cp
0 1 2 3
Lp
-2
-1
0
1
2Proton
Helium
CNO
MgAlSi
Iron
Fig. 2: Two mass sensitive parameters from the ARGO-
YBJ (pL) and the WFCTA-02 (pC) are shown in a two
dimensional graph. See text for details.
ration between cosmic ray components, as shown in Fig.2.This offers a great opportunity of picking out a light com-position sample with high purity by simply cutting off theconcentrated heavy cluster in the lower-left region in themap, i.e. getting rid of the heavy cluster by excluding theregion pL ≤ −0.91 and pC ≤ 1.3. The nonlinearity of theRPC charge measurement is less than ±3% as the multi-plicity of an RPC is greater than 50 [12]. A good linearmeasurement of RPCmax when RPCmax is greater than 100is also applied in the light composition sample selectionprocess. As mentioned above, primary particles are divid-ed into five groups: proton, helium, CNO group, MgAl-Si group and iron with even shares in the simulation. Af-ter the above cutoffs are applied, the contamination of theheavy component (CNO group, MgAlSi group, and iron)is less than 5.1% in total. About 34.6% of protons and heli-um nuclei are picked out from proton and helium samples.The ratio of protons to helium changes from 1 to 2.68 af-ter the selection. For instance, using the CREAM measure-ment results (≤100 TeV) [3] as a simple extrapolation, Ho-randel composition model [1] or even the heavy dominan-t model and the proton dominant model [16], a systematiceffect not greater than 14.3% is found.
However, the contamination by heavier nuclei is quitestable, from 5.1% to 2.3% as the composition assumptionchanges from one extreme to the other. The SIBYLL mod-el has a selecting efficiency about 2.3% higher than theQGSJET model. Even for the low-energy hadronic interac-tion models, the difference between the GHEISHA and theFLUKA is about 3.5% in their selecting efficiency.
The energy distribution of the light component aftercomposition selection and the energy reconstruction isshown in the Fig.1. No extra bias is introduced in the spec-trum measurement due to the composition selection andenergy reconstruction. The spectral index remains as itwas before the selection and reconstruction. The simula-tion is applied only for overall efficiency correction, in oth-er words, only on the normalization of the spectrum.
6 Shower energy measurement
The total number of photoelectrons, Npe, recorded by thetelescope is an accumulation of all Cherenkov photons pro-duced in the whole shower development. Since the tele-scope stands at a certain distance from the shower core,the measured Npe varies dramatically with the impact pa-rameter Rp due to the rapid falling off of the lateral distri-
bution of the Cherenkov light. A look-up table can be es-tablished for energy reconstruction. By feeding in the twomeasured variables Npe and Rp, the shower energy can beinterpolated using the pre-generated table. In reality, a mi-nor effect due to the incident direction of the showers rel-ative to the telescope is taken into account in the look-uptables. A power-law function is used to fit the Npe distribu-tion after light component selection in a narrow Rp range.The fit range is restricted from the peak to the end of theNpe distribution. An index of -2.73 is obtained after the fit.Accordingly, the spectrum index of -2.73 is applied to theproton and helium energy spectrum in the table generationprocedure. A specific table for a mixture of protons and he-lium nuclei are generated with three entries of Npe, Rp andα . First, the table is generated by a Monte Carlo simula-tion. Then, the shower energy of the observation data canbe obtained from the table by using the measurement pa-rameters of total Npe, Rp and α . The energy resolution isabout 25% mainly due to the intrinsic fluctuation of show-er development. The resolution is quite uniform through-out the energy range and the systematic bias is less than2% throughout the entire energy range. This guarantees theability to estimate the spectral index and scan for any spe-cial structures in the spectrum.
Due to different mixture of proton and helium nuclei indifferent composition models, the systematic uncertaintyin the table generation is estimated by switching betweendifferent composition models. It turns out to be very smal-l, i.e. about 1.2% in the energy scale. The systematic un-certainty of hadronic interaction models in the table gener-ation is estimated by switching between the QGSJET andSIBYLL models, and between the GHEISHA and FLUKAmodels. The systematic uncertainty in the different hadron-ic interaction models is estimated to be less than 2.0%.
A calibrated UV-LED is mounted at the center of themirrors to calibrate the absolute gain of all pixels in thecamera twice a day, i.e., before and after the daily oper-ation. More details about the absolute calibration can befound elsewhere [4]. The uncertainty of the calibration con-stant is about 7%, corresponding to a systematic uncertain-ty of 5.6% in the energy determination.
7 Results and discussion
7.1 Light component spectrum
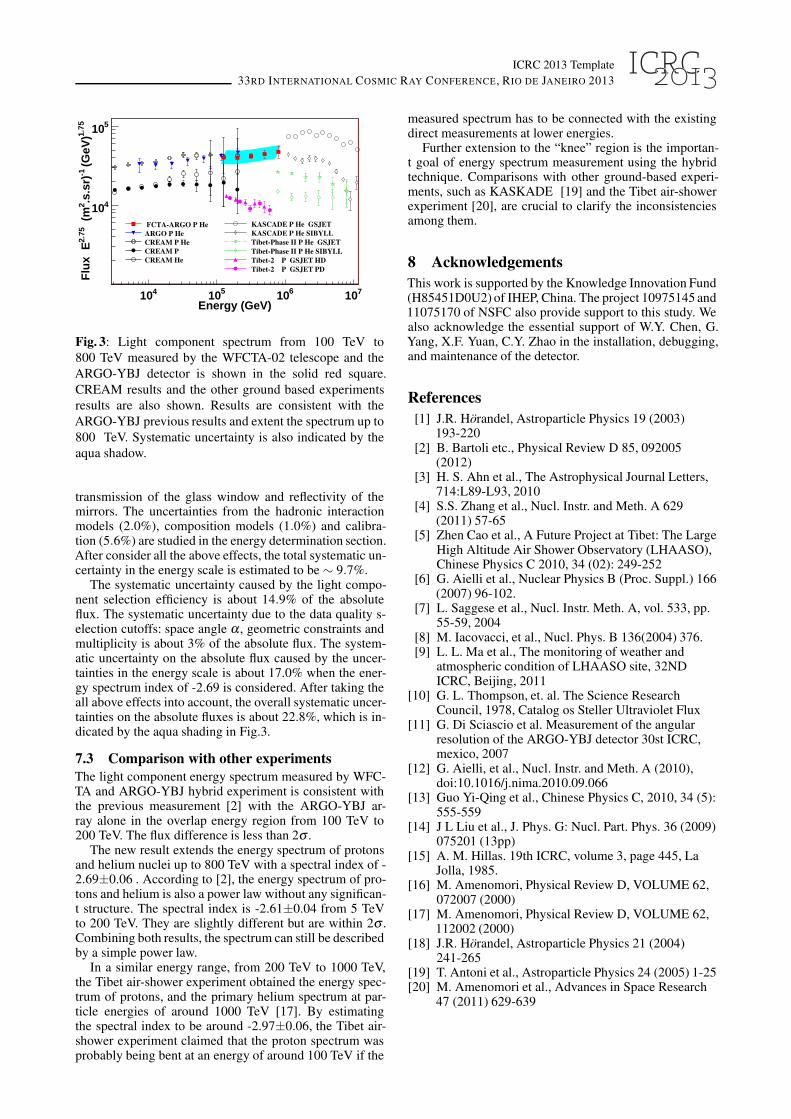
After composition selection, 1343 proton and helium likeevents from 100 TeV to 1 PeV are selected. The energyspectrum of cosmic proton and helium nuclei is obtainedusing the WFCTA-02 and ARGO-YBJ hybrid experiment.The result is shown in Fig.3, together with results of oth-er experiments. The energy spectrum covers the energy re-gion from 100 TeV up to 800 TeV. It follows a power lawwith a spectral index of -2.69 ± -0.06.
7.2 Systematic uncertainties
The starlight from the same area of the sky, such as thegalactic plane, is expected to emit a constant light fluxover time. The starlight passes through the atmosphere be-fore reaching to the telescope. The atmospheric absorptionintensity can be studied by monitoring the variance of s-tarlight recorded by the telescope from the same sky zone.After a good weather selection, the variance is less than9.5% that will cause the shower energy to be underesti-mated about 7.6%. The above process also includes the
ICRC 2013 Template
33RD INTERNATIONAL COSMIC RAY CONFERENCE, RIO DE JANEIRO 2013
Energy (GeV)410 510 610 710
1.75
(G
eV)
-1.s
.sr)
2(m´
2.75
E´F
lux
410
510
WFCTA-ARGO P+He
ARGO P+He
CREAM P+He
CREAM P
CREAM He
KASCADE P+He QGSJET
KASCADE P+He SIBYLL
Tibet-Phase II P+He QGSJET
Tibet-Phase II P+He SIBYLL
Tibet-2000 P QGSJET+HD
Tibet-2000 P QGSJET+PD
Fig. 3: Light component spectrum from 100 TeV to
800 TeV measured by the WFCTA-02 telescope and the
ARGO-YBJ detector is shown in the solid red square.
CREAM results and the other ground based experiments
results are also shown. Results are consistent with the
ARGO-YBJ previous results and extent the spectrum up to
800 TeV. Systematic uncertainty is also indicated by the
aqua shadow.
transmission of the glass window and reflectivity of themirrors. The uncertainties from the hadronic interactionmodels (2.0%), composition models (1.0%) and calibra-tion (5.6%) are studied in the energy determination section.After consider all the above effects, the total systematic un-certainty in the energy scale is estimated to be ∼ 9.7%.
The systematic uncertainty caused by the light compo-nent selection efficiency is about 14.9% of the absoluteflux. The systematic uncertainty due to the data quality s-election cutoffs: space angle α , geometric constraints andmultiplicity is about 3% of the absolute flux. The system-atic uncertainty on the absolute flux caused by the uncer-tainties in the energy scale is about 17.0% when the ener-gy spectrum index of -2.69 is considered. After taking theall above effects into account, the overall systematic uncer-tainties on the absolute fluxes is about 22.8%, which is in-dicated by the aqua shading in Fig.3.
7.3 Comparison with other experiments
The light component energy spectrum measured by WFC-TA and ARGO-YBJ hybrid experiment is consistent withthe previous measurement [2] with the ARGO-YBJ ar-ray alone in the overlap energy region from 100 TeV to200 TeV. The flux difference is less than 2σ .
The new result extends the energy spectrum of protonsand helium nuclei up to 800 TeV with a spectral index of -2.69±0.06 . According to [2], the energy spectrum of pro-tons and helium is also a power law without any significan-t structure. The spectral index is -2.61±0.04 from 5 TeVto 200 TeV. They are slightly different but are within 2σ .Combining both results, the spectrum can still be describedby a simple power law.
In a similar energy range, from 200 TeV to 1000 TeV,the Tibet air-shower experiment obtained the energy spec-trum of protons, and the primary helium spectrum at par-ticle energies of around 1000 TeV [17]. By estimatingthe spectral index to be around -2.97±0.06, the Tibet air-shower experiment claimed that the proton spectrum wasprobably being bent at an energy of around 100 TeV if the
measured spectrum has to be connected with the existingdirect measurements at lower energies.
Further extension to the “knee” region is the importan-t goal of energy spectrum measurement using the hybridtechnique. Comparisons with other ground-based experi-ments, such as KASKADE [19] and the Tibet air-showerexperiment [20], are crucial to clarify the inconsistenciesamong them.
8 Acknowledgements
This work is supported by the Knowledge Innovation Fund(H85451D0U2) of IHEP, China. The project 10975145 and11075170 of NSFC also provide support to this study. Wealso acknowledge the essential support of W.Y. Chen, G.Yang, X.F. Yuan, C.Y. Zhao in the installation, debugging,and maintenance of the detector.
References
[1] J.R. Horandel, Astroparticle Physics 19 (2003)193-220
[2] B. Bartoli etc., Physical Review D 85, 092005(2012)
[3] H. S. Ahn et al., The Astrophysical Journal Letters,714:L89-L93, 2010
[4] S.S. Zhang et al., Nucl. Instr. and Meth. A 629(2011) 57-65
[5] Zhen Cao et al., A Future Project at Tibet: The LargeHigh Altitude Air Shower Observatory (LHAASO),Chinese Physics C 2010, 34 (02): 249-252
[6] G. Aielli et al., Nuclear Physics B (Proc. Suppl.) 166(2007) 96-102.
[7] L. Saggese et al., Nucl. Instr. Meth. A, vol. 533, pp.55-59, 2004
[8] M. Iacovacci, et al., Nucl. Phys. B 136(2004) 376.[9] L. L. Ma et al., The monitoring of weather and
atmospheric condition of LHAASO site, 32NDICRC, Beijing, 2011
[10] G. L. Thompson, et. al. The Science ResearchCouncil, 1978, Catalog os Steller Ultraviolet Flux
[11] G. Di Sciascio et al. Measurement of the angularresolution of the ARGO-YBJ detector 30st ICRC,mexico, 2007
[12] G. Aielli, et al., Nucl. Instr. and Meth. A (2010),doi:10.1016/j.nima.2010.09.066
[13] Guo Yi-Qing et al., Chinese Physics C, 2010, 34 (5):555-559
[14] J L Liu et al., J. Phys. G: Nucl. Part. Phys. 36 (2009)075201 (13pp)
[15] A. M. Hillas. 19th ICRC, volume 3, page 445, LaJolla, 1985.
[16] M. Amenomori, Physical Review D, VOLUME 62,072007 (2000)
[17] M. Amenomori, Physical Review D, VOLUME 62,112002 (2000)
[18] J.R. Horandel, Astroparticle Physics 21 (2004)241-265
[19] T. Antoni et al., Astroparticle Physics 24 (2005) 1-25[20] M. Amenomori et al., Advances in Space Research
47 (2011) 629-639