energy policies of iea countries canada · energy policies of iea countries 2015 review canada ......
TRANSCRIPT
Energy Policies of IEA Countries
2015 Review
Canada
Please note that this PDF is subject to specific restrictions that limit its use and
distribution. The terms and conditions are available online at http://www.iea.org/t&c
Energy Policies of IEA Countries
2015 Review
Canada
INTERNATIONAL ENERGY AGENCY
The International Energy Agency (IEA), an autonomous agency, was established in November 1974. Its primary mandate was – and is – two-fold: to promote energy security amongst its member
countries through collective response to physical disruptions in oil supply, and provide authoritative research and analysis on ways to ensure reliable, affordable and clean energy for its 29 member countries and beyond. The IEA carries out a comprehensive programme of energy co-operation among its member countries, each of which is obliged to hold oil stocks equivalent to 90 days of its net imports. The Agency’s aims include the following objectives:
n Secure member countries’ access to reliable and ample supplies of all forms of energy; in particular, through maintaining effective emergency response capabilities in case of oil supply disruptions.
n Promote sustainable energy policies that spur economic growth and environmental protection in a global context – particularly in terms of reducing greenhouse-gas emissions that contribute to climate change.
n Improve transparency of international markets through collection and analysis of energy data.
n Support global collaboration on energy technology to secure future energy supplies and mitigate their environmental impact, including through improved energy
efficiency and development and deployment of low-carbon technologies.
n Find solutions to global energy challenges through engagement and dialogue with non-member countries, industry, international
organisations and other stakeholders.IEA member countries:
Australia Austria
Belgium Canada
Czech RepublicDenmark
EstoniaFinland
FranceGermany
GreeceHungary
Ireland Italy
JapanKoreaLuxembourgNetherlandsNew Zealand NorwayPolandPortugalSlovak RepublicSpainSwedenSwitzerlandTurkey
United KingdomUnited States
The European Commission also participates in
the work of the IEA.
Please note that this publication is subject to specific restrictions that limit its use and distribution.
The terms and conditions are available online at www.iea.org/t&c/
© OECD/IEA, 2016International Energy Agency
9 rue de la Fédération 75739 Paris Cedex 15, France
www.iea.org
Together
SecureSustainable
Table of contents
3
TABLE OF CONTENTS 1. EXECUTIVE SUMMARY AND KEY RECOMMENDATIONS .......................................................................... 9
Executive summary ...................................................................................................................... 9 Shaping progress ........................................................................................................................ 12 Key recommendations ............................................................................................................... 16 References ................................................................................................................................. 16
PART I POLICY ANALYSIS .......................................................................................................17
2. GENERAL ENERGY POLICY...................................................................................................................... 19
Country overview ....................................................................................................................... 19 Supply and demand ................................................................................................................... 20 Institutional framework ............................................................................................................. 23 Key energy policies..................................................................................................................... 29 Energy Data ................................................................................................................................ 35 Assessment ................................................................................................................................ 36 Recommendations ..................................................................................................................... 38 References ................................................................................................................................. 38
3. CLIMATE CHANGE .................................................................................................................................. 41
Targets and objectives ............................................................................................................... 41 Energy-related CO2 emissions .................................................................................................... 42 Institutions ................................................................................................................................. 45 Policies and measures ................................................................................................................ 46 Climate change vulnerability and adaptation ............................................................................ 52 Assessment ................................................................................................................................ 56 Recommendations ..................................................................................................................... 58 References ................................................................................................................................. 58
4. ENERGY EFFICIENCY ............................................................................................................................... 61
Overview .................................................................................................................................... 61 Final consumption of energy ..................................................................................................... 61 Energy efficiency progress ......................................................................................................... 63 Sectoral developments .............................................................................................................. 64 Institutional framework ............................................................................................................. 70 Policies and measures ................................................................................................................ 73 Federal programmes by sector .................................................................................................. 75 Provincial and territorial programmes and measures ............................................................... 85 Assessment ................................................................................................................................ 90 Recommendations ..................................................................................................................... 92 References ................................................................................................................................. 93
© O
EC
D/IE
A, 2
016
Table of contents
4
PART II SECTOR ANALYSIS .....................................................................................................95
5. NATURAL GAS ........................................................................................................................................ 97
Overview .................................................................................................................................... 97 Supply and demand ................................................................................................................... 98 Natural gas trade .....................................................................................................................101 Regulatory and institutional framework ..................................................................................102 Natural gas infrastructure ........................................................................................................104 Unconventional gas production in Canada ..............................................................................110 Natural gas market structure and regulation ..........................................................................117 Natural gas prices .....................................................................................................................118 Security of natural gas supply ..................................................................................................120 Assessment ..............................................................................................................................122 Recommendations ...................................................................................................................123 References ...............................................................................................................................124
6. OIL ........................................................................................................................................................125
Overview ..................................................................................................................................125 Supply and demand .................................................................................................................126 Demand ....................................................................................................................................130 Institutional framework ...........................................................................................................136 Regulatory oversight ................................................................................................................137 Oil market and Infrastructure ..................................................................................................138 Oil prices and taxes ..................................................................................................................145 Oil security ...............................................................................................................................147 Assessment ..............................................................................................................................149 Recommendations ...................................................................................................................151 References ...............................................................................................................................151
7. COAL ....................................................................................................................................................153
Overview ..................................................................................................................................153 Supply and demand .................................................................................................................153 Coal transportation ..................................................................................................................158 Industry structure ....................................................................................................................160 Policies and measures ..............................................................................................................162 Assessment ..............................................................................................................................165 Recommendations ...................................................................................................................167 References ...............................................................................................................................168
8. ELECTRICITY .........................................................................................................................................169
Overview ..................................................................................................................................169 Supply and demand .................................................................................................................170 Transmission and trade ............................................................................................................179 Electricity industry structure ....................................................................................................184 Retail markets ..........................................................................................................................197
© O
EC
D/IE
A, 2
016
Table of contents
5
Demand response management and smart grids ....................................................................198 Electricity prices .......................................................................................................................199 Electricity security ....................................................................................................................201 Assessment ..............................................................................................................................205 Recommendations ...................................................................................................................207 References ...............................................................................................................................208
9. RENEWABLE ENERGY ...........................................................................................................................209
Overview ..................................................................................................................................209 Supply and demand .................................................................................................................210 Institutional framework ...........................................................................................................213 Federal policies and programmes ............................................................................................213 Renewable electricity in the provinces and territories of Canada ...........................................215 Integration of variable renewable energy sources ..................................................................224 Assessment ..............................................................................................................................225 Recommendations ...................................................................................................................228 References ...............................................................................................................................228
10. NUCLEAR ENERGY ..............................................................................................................................229
Overview ..................................................................................................................................229 Institutional oversight and regulation .....................................................................................236 Provincial nuclear programmes ...............................................................................................238 Nuclear safety ..........................................................................................................................240 Waste disposal and decommissioning .....................................................................................240 Nuclear research and development .........................................................................................241 Assessment ..............................................................................................................................243 Recommendations ...................................................................................................................245 References ...............................................................................................................................245
PART III ENERGY TECHNOLOGY ........................................................................................... 247
11. ENERGY TECHNOLOGY RESEARCH, DEVELOPMENT AND DEMONSTRATION ...................................249
Overview ..................................................................................................................................249 Institutional framework ...........................................................................................................249 Policies, priorites and evaluation .............................................................................................251 Policies and programMEs .........................................................................................................252 Funding ....................................................................................................................................254 Provinces, territories and private sector .................................................................................257 Nuclear research and development .........................................................................................259 Carbon capture and storage RD&D ..........................................................................................260 International cooperation ........................................................................................................262 Assessment ..............................................................................................................................263 Recommendations ...................................................................................................................265 References ...............................................................................................................................266
© O
EC
D/IE
A, 2
016
Table of contents
6
PART IV ANNEXES ............................................................................................................... 267
ANNEX A: Organisation of the review .....................................................................................................269 ANNEX B: Energy balances and key statistical data ...............................................................................273 ANNEX C: International Energy Agency “Shared Goals” .........................................................................279 ANNEX D: Glossary and list of abbreviations ..........................................................................................281
List of figures, tables and boxes
FIGURES
2.1 Map of Canada ................................................................................................................. 18 2.2 Energy production by source, 1973-2013........................................................................ 20 2.3 TPES, 1973-2013 .............................................................................................................. 21 2.4 Breakdown of TPES in IEA member countries, 2013 ....................................................... 22 2.5 TFC by sector, 1973-2013 ................................................................................................ 23 3.1 CO2 emissions by sector, 1973-2013 ............................................................................... 43 3.2 CO2 emissions by fuel, 1973-2013 ................................................................................... 43 3.3 Energy-related CO2 emissions per unit of GDP in Canada and in other selected IEA
member countries, 1973-2013 ........................................................................................ 44 3.4 CO2 emissions and main drivers in Canada, 1990-2013 .................................................. 44 3.5 Examples of insured losses from extreme weather events in Canada ............................ 53 4.1 Energy intensity in Canada and in other selected IEA member countries, 1973-2013 ... 62 4.2 TPES per capita in IEA member countries, 2013 ............................................................. 62 4.3 Energy per capita and energy intensity per GDP in Canada by province, 2013 .............. 62 4.4 Changes in TFC broken down by activity, structure and efficiency effects ..................... 63 4.5 Energy savings from energy efficiency and energy consumption by energy source
in Canada, 1990-2012 ...................................................................................................... 64 4.6 Savings in TFC from energy efficiency improvements, by sector, 2012 .......................... 64 4.7 TFC by sector and by source, 1973-2013 ......................................................................... 65 4.8 Energy consumption (TFC) in industry, by fuel and GDP (CAD), 2003 versus 2013 ........ 66 4.9 Energy intensities in selected industries, index for 1990 and 2012 ................................ 67 4.10 Transport energy by subsector and mode/vehicle type, 2012 ........................................ 67 4.11 Freight transport, 1990, 2002 and 2012 .......................................................................... 68 4.12 Passenger transport intensities, 1990, 2002 and 2012 ................................................... 68 4.13 Freight transport intensities, 1990, 2002 and 2012 ........................................................ 69 4.14 Energy intensities in the residential sector, index for 1990, 2002 and 2012 .................. 69 4.15 Energy intensities in the commercial sector, 1990, 2002 and 2012 ................................ 70 4.16 Annual unit energy consumption of large appliances, 1990, 2002 and 2012 ................. 70 4.17 Status of Building Energy Codes in Canada, 2015 ........................................................... 79 4.18 International comparison of fuel economy standards for passenger cars, 2000-25....... 82 4.19 Average fuel efficiency of passenger cars and freight trucks, 1990-2012 ....................... 83 4.20 Average passenger car occupancy, 1990- 2012 .............................................................. 84 4.21 Average freight truck load, 1990-2012 ............................................................................ 85 5.1 Natural gas production, 1973-2013 ................................................................................. 98 5.2 Natural gas supply by sector, 1973-2013 ......................................................................100
© O
EC
D/IE
A, 2
016
Table of contents
7
5.3 Canada’s export and import trends ...............................................................................102 5.4 Location and status of planned LNG terminals and NEB approval in Canada ...............106 5.5 Map of the natural gas infrastructure in Canada ..........................................................111 5.6 North America’s shale gas resources in Canada and the United States ........................112 5.7 Trends in natural gas and oil wholesale prices in Canada and the US, 2000-15 ...........118 5.8 Natural gas prices in IEA member countries, 2013 .......................................................119 5.9 Natural gas prices in Canada and in other selected IEA member countries, 1980-2013 .... 120 6.1 Oil basins, gas plays, oil and natural gas liquids plays in Canada, 2014 ........................127 6.2 Crude oil and NGLs production, 1973-2013 ..................................................................128 6.3 Canadian tight oil production by province, 2006-14 .....................................................128 6.4 Canadian oil production forecast, 2012-20 ...................................................................130 6.5 Oil TFC by sector, 1973-2013 .........................................................................................131 6.6 Oil products consumption by type, 2013 ......................................................................131 6.7 Crude oil imports by source, 1973-2014 .......................................................................135 6.8 Oil infrastructure map ...................................................................................................140 6.9 Wholesale oil price trends 2005-15 ...............................................................................146 6.10 Unleaded gasoline prices and taxes in selected OECD member countries,
1st quarter 2015 ............................................................................................................146 7.1 Hard coal and brown coal production, 1973-2013 ........................................................154 7.2 Coal supply by sector, 1973-2013 ..................................................................................155 7.3 Coal production in Canada by provinces with major mines, ports and rail
infrastructure .................................................................................................................156 7.4 Canadian hard coal trade, 2008-13 ...............................................................................158 7.5 Canadian coal export distribution by region .................................................................159 8.1 Electricity generation by source, 1973-2013 .................................................................170 8.2 Electricity generation by source in IEA member countries, 2013 .................................171 8.3 Electricity generation in Canada, by province and fuel type, 2013 ...............................172 8.4 Electricity consumption by sector, 1973-2013 ..............................................................172 8.5 Net electricity exports from Canada to the United States, 1990-2013 .........................173 8.6 Electricity exports and imports between Canada and the US, by province, 2014 ........175 8.7 Electricity transmission in Canada and interconnections with the United States .........181 8.8 Wholesale market and industry structure in Canada’s provinces and territories, 2014 ..... 187 8.9 Electricity prices in IEA member countries, 2013 ..........................................................199 8.10 Electricity prices in Canada and in other selected IEA member countries, 1980-2013 ....... 200 8.11 Average electricity prices including taxes, by province (in CAD cents per kWh),
April 2014 .......................................................................................................................200 8.12 Capacity additions and retirements by 2040, reference case .......................................202 8.13 Reliability NERC regions and assessment areas.............................................................204 9.1 Renewable energy as a percentage of TPES, 1973-2013 ...............................................209 9.2 Renewable energy as a percentage of TPES in Canada and IEA member countries,
2013 ........................................................................................................................................ 210 9.3 Electricity generation from renewable sources as a percentage of all generation
in Canada and IEA member countries, 2013 .................................................................211 9.4 Canada’s installed wind power capacity and installed hydro capacity and
theoretical technical potential (MW), by province and territory in 2014. ....................212 9.5 Renewable energy procurement mechanisms by province, May 2013 ........................219 10.1 Share of nuclear power in electricity generation, 1973-2013 .......................................230
© O
EC
D/IE
A, 2
016
Table of contents
8
10.2 Total electricity generation from nuclear and impact of refurbishment projects, 2000-14 ..........................................................................................................................232
10.3 Nuclear fuel cycle facilities in Canada ...........................................................................233 11.1 Energy RD&D landscape in Canada ...............................................................................251 11.2 Total government energy RD&D spending, 1974/75 to 2015/16 .................................256 11.3 Federal and provincial/territorial government energy RD&D spending, 2009/10
to 2015/16 .....................................................................................................................256 11.4 Government energy RD&D spending as a ratio of GDP in IEA member countries, 2013 .... 257
TABLES
2.1 Decision-making structure for energy policy in Canada .................................................. 23 2.2 Federal excise taxes and provincial product-specific taxes on gasoline and
diesel fuel, April 2015 ...................................................................................................... 35 3.1 Provincial and territorial emissions reduction targets, total GHG emissions, and
per-capita emissions in 2005 and 2013 ........................................................................... 47 4.1 Energy efficiency policies and institutional map ............................................................. 72 4.2 SWOT analysis of renewable energy use for district heating in Canada ......................... 89 5.1 Canadian marketable natural gas resources (in bcm), 31 December 2012 ..................... 99 5.2 Major natural gas power plants planned or under construction (>200 MW) ...............101 5.3 Planned LNG projects in Canada (as of October 2015) .................................................105 5.4 Planned natural gas pipelines in Canada .......................................................................109 6.1 Canadian petroleum refineries, 2014 ............................................................................139 6.2 Canadian upgrader facilities, 2014 ................................................................................141 6.3 Major crude oil pipelines in Canada ..............................................................................143 7.1 Canadian coal-fired power plants, 2015 ........................................................................157 7.2 Units reaching their end of life under federal regulations before 2020 .......................157 7.3 Coal mines in Canada, 2013 ...........................................................................................161 8.1 Designated major projects in the electricity sector, 2015 .............................................179 9.1 Canada’s installed renewable electricity capacity (MW), 1990-2013 ...........................211 9.2 Provincial and territorial renewable energy policies and initiatives .............................220 9.3 Canada’s main drivers and challenges to renewable energy deployment ....................225 10.1 Nuclear power reactors in operation, 2015 ..................................................................231 10.2 Nuclear power reactors in permanent shut-down, 2015 ..............................................231
BOXES
2.1 Canadian Energy Strategy ................................................................................................ 28 4.1 Innovation in the Canadian forest sector ........................................................................ 76 4.2 EnerGuide labelling .......................................................................................................... 80 5.1 Golden Rules for a Golden Age of Gas ...........................................................................115 6.1 Impact of the low oil price environment on the Canadian oil outlook .........................129 6.2 Canada’s oil-sands .........................................................................................................131 10.1 Refurbishment of the Darlington nuclear power plant .................................................235 11.1 NRCan RD&D success stories .........................................................................................253 11.2 Energy innovation in the Canadian oil industry .............................................................259
© O
EC
D/IE
A, 2
016
1. Executive summary and key recommendations
9
1. EXECUTIVE SUMMARY AND KEY RECOMMENDATIONS
EXECUTIVE SUMMARY
Since the last in-depth review was published in 2009, the government of Canada (hereinafter: the federal government) has taken actions to foster the natural resource development and move the country towards an environmentally sustainable, reliable, and affordable economy.1
Canada is one of the largest energy producers in the world, with the highest energy supply per capita among IEA members. At home, Canada has a low-carbon electricity generation mix with over 75% of its electricity coming from non-emitting sources (mostly hydro and nuclear). In 2014, Canada was the fifth-largest crude oil and the fourth-largest natural gas producer; it ranked third as coking coal exporter and second as generator of hydropower (2013) and uranium producer. The country makes a contribution to global energy security by ensuring diversified, competitive, secure and reliable energy supplies.
Canada has been able to make significant progress in the implementation of several key IEA policy recommendations from the 2009 review, notably with regard to energy efficiency data and policies, streamlining of approval processes for major energy infrastructure projects, deploying carbon capture and storage (CCS) and carrying out the restructuring of Atomic Energy Canada Limited (AECL). Co-operation between the federal government and the provincial/territorial governments on these matters is a welcome improvement. A number of provinces have also recently proposed significant action to combat climate change within their jurisdictions.
Over the past decade, Canadian energy consumption has increased by 2%, but its energy intensity has decreased by 20%. Several energy-intensive industries, including metals, paper, print and pulp have cut their energy consumption while increasing production, thanks to efficient and innovative processing. The forest industry, supported by the federal government, has implemented several efficiency programmes. In co-operation with the provinces and territories, the federal government promoted the establishment of more stringent federal energy efficiency standards in several sectors. A National Energy Code for Buildings was introduced in 2011. Stringent emission regulations for light- and heavy-duty vehicles and coal-fired power generation facilities were enacted. Despite these new legal frameworks, however, Canada maintains one of the most energy-intensive economies among IEA member countries.
Under the Responsible Resource Development (RRD) plan, federal environmental and regulatory review procedures of major resource projects (including oil, gas, electricity, nuclear and mining projects) have been streamlined. Substitution and equivalency agreements with provincial and territorial governments, arrangements for better consultation with Aboriginal Peoples and First Nations, and legislated timelines
1. The IEA 2015 in-depth review was conducted in 2014/15 and provides an assessment of energy and climate policies adopted up to November 2015.
© O
EC
D/IE
A, 2
016
1. Executive summary and key recommendations
10
for environmental impact assessments as well as single contact points have been created with a view to reduce the regulatory burden for project developers. In addition, administrative monetary penalties, established as part of RRD, should improve the efficiency and effectiveness of regulatory systems by providing an additional compliance and enforcement tool for the Canadian Nuclear Safety Commission and the National Energy Board. Based on the positive experience to date, the mandate of the Major Projects Management Office (MPMO) Initiative, initiated in 2007, has been extended until 2020. In addition, the Northern Projects Management Office (NPMO) was created in 2013 for major resource and infrastructure projects in the three northern territories, and in 2014 the MPMO-West was established to lead engagement with First Nations on issues related to west coast energy infrastructure development. Despite the progress, public acceptance of new energy infrastructure projects remains a challenge.
Since the last review, Canada has made significant progress in carbon capture and storage (CCS) technology deployment with four large-scale projects either in operation or under construction in 2015, thanks to the efforts of industry and support from provincial and federal governments. The Boundary Dam CCS project, which began operating in October 2014, is the world’s first commercial application of CCS to a coal-fired power plant. In November 2015, the Shell Quest project was launched in Alberta, the world’s first large-scale CCS project that will reduce emissions from oil sands processing.
Environmental and safety concerns associated with oil transportation have increased, as a result of oil pipeline spills and the increasing use of rail to transport oil in the absence of sufficient oil pipeline capacity in some regions. To respond to the risks of oil pipeline spills and rail accidents (notably the Lac Mégantic disaster in 2013), the government of Canada adopted new measures to strengthen the safety of marine, rail and pipeline transportation. In 2015, new rules under the Railway Safety Act were introduced and the Pipeline Safety Act and the Energy Safety and Security Act (formerly Bill C-22) were enacted. The purpose of this legislation is to enhance prevention, preparedness and response, and corporate liability and compensation actions by the federal government. Regulatory co-ordination with the United States (US) on environmental and safety standards is also gaining importance, given the increasing amounts of crude oil being transported across borders by rail or pipeline.
Key legislative enhancements were introduced in the nuclear sector. The nuclear part of the Energy Safety and Security Act modernised Canada’s civil nuclear liability regime, bringing it in line with international standards and enabling Canada to join the Convention on Supplementary Compensation for Nuclear Damage.
The government also successfully completed the restructuring of Atomic Energy Canada Limited (AECL) in the fall of 2015, following the sale of AECL’s commercial nuclear vendor business in 2011 to private operator Candu Energy Inc. and the establishment of a government-owned, contractor-operated model for the management and operations of AECL’s nuclear laboratories, the Canadian Nuclear Laboratories (CNL), which will be managed and operated by the Canadian National Energy Alliance (CNEA).
CHALLENGES REMAIN
Despite these positive developments, however, Canada faces a number of challenges if the country wants to continue developing its natural resources in a sustainable and cost-effective manner, and to enhance its position as responsible energy supplier and user.
First, despite good progress in energy efficiency, Canada remains one of the most energy-intensive countries among IEA members. This is largely because of its energy reserves, its
© O
EC
D/IE
A, 2
016
1. Executive summary and key recommendations
11
energy-intensive extraction and processing for exports, its high standard of living, but also its large geography requiring transport and in-land shipping and the climatic conditions which demand more energy for heating. Total final energy consumption has been growing in the mining and quarrying sectors (including oil-sands production) and the petrochemical sector, exceeding GDP growth generated in these sectors in the past decade.
Secondly, in 2013, one-quarter of Canada’s greenhouse gas (GHG) emissions came from the oil and gas sectors, the emissions from which have grown by 14% since 2005 (the base year for Canada’s Copenhagen commitments) and by 67% since 1990. This now makes the oil and gas sectors together the largest contributor to Canadian GHG emissions. The emissions intensity of oil-sands production is one of the most important factors in determining the country’s future energy consumption and emission performance. In December 2009, Canada announced a 17% reduction target by 2020 (below 2005 levels) under the Copenhagen Accord and, in 2011, Canada withdrew from the Kyoto Protocol. Canada will now need to implement further action if it wants to meet its 2020 target, which remains ambitious given its current emission profile. Action is also required in light of the longer-term perspective. In May 2015, Canada announced new targets to cut GHG emissions by 30% below 2005 levels by 2030.
Thirdly, Canada needs to adapt to the current low-price environment in global oil and natural gas markets, partly the result of the shale gas and tight oil revolutions in North America. These revolutions have rapidly increased oil and gas supplies and contributed to a rise in the self-sufficiency of the US, which remains Canada’s main export market. While Canadian oil has been able to maintain a stronghold in its traditional US Midwest markets, Canadian gas exports to the US decreased by 30% during 2007-14. North American natural gas trade flows are being reversed, leading to increased competition. Domestic natural gas production in eastern Canada has been displaced by US imports from the nearby Marcellus Shale basin. Low North American natural gas prices were followed by the fall in the global oil price, and both prices exacerbated the impact on the Canadian upstream sector, reducing revenues and royalties. Greenfield projects are being delayed or cancelled, and drilling activity has declined with many oil rigs and wells shut in, as the industry is scaling back capital investment and operating costs (ARC, 2015).
Fourthly, changing electricity generation patterns and energy prices, including the ongoing reduction of coal use in power generation and the coming to an end of the economic life of the nuclear reactors in the next ten to 20 years, could challenge the self-sufficiency approach taken by some of the provinces. Success with the planned refurbishments of 10 nuclear reactors in the province of Ontario will be important for maintaining the contribution of nuclear energy to Canada’s largely decarbonised power system. Canada’s vast renewable energy potential can play a vital role in securing the further decarbonisation of the power system and in maintaining affordable energy prices. Electricity markets, however, remain fragmented with very limited interconnection between provinces.
Lastly, Canada’s public energy research, development and demonstration (RD&D) budget from federal and provincial/territorial governments and public enterprises is large in comparison to other IEA members. Total public funding for core energy research and development programmes, however, has been declining since 2009. It amounted to CAD 1.34 billion in 2013-14, and is budgeted to CAD 941.9 million in 2014-15. This has been offset by increases in short-term, targeted, but time-limited federal programmes and funding from state-owned companies in provinces/territories, including large-scale demonstrations. Thus, despite a solid foundation and the success of CCS, the financial resources available for basic, publicly funded energy R&D in Canada are under pressure.
© O
EC
D/IE
A, 2
016
1. Executive summary and key recommendations
12
SHAPING PROGRESS
The energy sector plays a strong role in the economic performance of Canada. In 2014, the energy sector contributed about 10% of gross domestic product (GDP), employed approximately 280 000 people and was responsible for about 30% of Canada’s total exports. Each year, the energy sector also contributes on average CAD 20 to 25 billion in taxes, royalties and other payments to federal and provincial governments.
Next to economic goals, the federal government’s energy administration has the task of ensuring positive environmental outcomes and energy safety and security. The energy policy of the federal government of Canada is framed by a number of factors: the emphasis on a competitive tax environment and a free-market approach, the jurisdictional authority of provinces and territories with regard to the use of their natural resources, including electricity markets and renewable energy policies, and the shared responsibility in several other energy policy areas. Last but not least, the strong market integration with the US and Mexico within the North American Free Trade Area (NAFTA) plays an important role for the energy policy.
MARKET INTEGRATION AND DIVERSIFICATION
In the wake of the shale gas and tight oil revolution in North America, the medium-term outlook for Canadian energy exports has changed significantly for oil and gas (and electricity), following the near-50% drop in international crude oil prices since July 2014. Canada needs to develop new export markets, beyond the United States, while at the same time deepening market integration within NAFTA. The future outlook will be determined by global oil price trends, the timing and pace of US energy exports and energy infrastructure development in Canada.
In a scenario of low oil and gas prices for a prolonged period of time, a “lower for longer” environment, investments in greenfield projects in Canada (oil-sands, shale gas, transport infrastructure, including liquefied natural gas (LNG) export terminals and associated gas pipelines) would slow down, impacting energy supply growth potential beyond 2020. While Canadian light tight oil is already impacted by the price environment in general, oil-sands production has so far proven relatively resilient to short-term price fluctuations, given the field structure, well portfolio and significant improvements in efficiency and well completion technologies.
On the other hand, securing investment for new export facilities in Canada remains a challenge, as global LNG markets are well supplied. To date, 26 LNG terminals projects are planned, but only one has taken a conditional final investment decision. To improve the financial terms, the federal government has recently extended the LNG export licence from 25 to 40 years and provided accelerated capital cost allowance (CCA) treatment for assets used in facilities that liquefy natural gas. By October 2015, the National Energy Board (NEB) has approved export licences for 23 LNG projects; and 10 facilities have received Governor in Council (GiC) approval.
Much will depend on developments in US oil and gas markets. Natural gas consumption in the US is expected to grow; and the US plans to authorise gas and oil exports in 2015-16. If the US can maintain the production of large quantities at a price that remains competitive compared to Canadian output, then further displacement (of Canadian exports) will occur. With export demand for US gas set to increase, however, Canadian production could ultimately find room in North American supply to feed into
© O
EC
D/IE
A, 2
016
1. Executive summary and key recommendations
13
a growing call from abroad. At the same time, some US gas will be exported through the Canadian east coast LNG terminals. As US light tight oil production is slowly starting to fall back, it leaves a market for Canadian oil-sands which are priced at an increasing discount to US oil. Canada can therefore reap significant benefits from both strengthening its market integration within NAFTA and from opening new export markets beyond the US.
Canada’s prospects for energy exports mainly depend on the availability of adequate transport infrastructure to access global markets. Despite the progress made on the Responsible Resource Development (RRD) plan, obtaining social licence for new infrastructure projects remains a major challenge. Concerns remain with regard to permitting procedures and environmental performance. Ongoing monitoring and review of the implementation of the work under the RRD plan can help to ensure those concerns are addressed. It is important that Canada can ensure high standards of environmental protection, compliance, safety, public consultation and transparency of information provided by the industry on major projects. The RRD initiative can also be a driver for using innovative technologies and sharing best practices for resource development.
Canada is well positioned for supporting global growth in nuclear energy demand, driven by rising concerns over security of energy supply, climate change mitigation, and air quality. Canada is currently the world’s second-largest producer of uranium, supplying 16% of world demand. More than 85% of Canada’s uranium production is exported. Although uranium prices have declined in recent years, Canada’s uranium mines remain profitable thanks to extremely high ore grades. In 2014, the high-grade Cigar Lake mine began operation, which will enable Canada’s uranium production to increase by 50%. The industry has secured major contracts to supply uranium for the nuclear power programmes in India and China, ensuring continued demand for Canada’s uranium.
Amid the rapidly changing nature of the integrated North American energy markets, the need for co-ordinated energy and climate policies and robust energy data, capturing the new trade and product flows, is growing. In May 2015, the Energy Ministers of Canada, the US and Mexico established a ministerial-level working group on climate change and energy, giving further impetus to trilateral energy policy co-operation within NAFTA. Co-operation on energy data and regulatory best practices for shale/tight oil and gas development among the provinces, federal and regional trade partners as well as industry, is of key importance for the North American energy market.
Canadian electricity markets are regulated by the provinces; however, reliability is co-ordinated at North American level and requires the co-operation between Canadian provincial regulatory bodies and US institutions, such as the North American Electric Reliability Corporation (NERC) and the Federal Energy Regulatory Commission (FERC). The IEA encourages the federal government to continue its efforts to develop efficient energy markets across Canada and North America, to support co-ordination among the regional system operators, including energy generation and network adequacy and infrastructure planning, environmental and safety rules, reliability, resilience and interoperability.
CANADA AS A RESPONSIBLE ENERGY SUPPLIER AND USER
In May 2015, Canada announced that it intends to reduce its GHG emissions by 30% below 2005 levels by 2030. This target was included in the country’s Intended Nationally Determined Contribution (INDC) submission to the United Nations Framework Convention on Climate Change (UNFCCC) 21st Conference of the Parties (COP21). The federal
© O
EC
D/IE
A, 2
016

1. Executive summary and key recommendations
14
government has pursued a “sector-by-sector regulatory approach”, which targets GHG emission reductions in each sector rather than mitigation across the economy, including through cap-and-trade action. As part of its INDC, the government announced plans to address methane emissions from the oil and gas sectors, GHG emissions from the production of chemicals and nitrogen fertilisers (two of the largest sources of emissions from the energy-intensive manufacturing sector), and the emissions intensity of natural gas-fired electricity generation. Conversely, there was no specific timeline given for the introduction of these measures. Federal regulations of methane emissions from oil and gas are to be aligned with similar actions taken by the US.
In order to effectively achieve its pledges for the COP21 and emissions reduction targets for 2020 and 2030, Canada should establish a timeline for regulating emissions from energy-intensive industries and oil and gas production, as well as for putting in place emission standards for gas-fired power plants. The impact on the cost of producing oil and gas in Canada – particularly for the oil-sands – is likely to be manageable. Even under the emissions restrained 450 Scenario described in the IEA World Energy Outlook, growth in oil-sands production is consistent with estimates of near-term production potential of Canada (IEA, 2015). Investment in efficient technologies and industrial processes, including large-scale application of CCS and use, and stringent energy management, can underscore Canada’s position as a responsible energy supplier and user.
At the provincial level, several governments have established regulations and targets to reduce flaring and venting of hydrocarbons and the environmental impacts of unconventional oil and gas production. Alberta, British Columbia and Saskatchewan have long-standing experience in unconventional oil and gas production and regulation for more than a decade. Other provinces, such as Quebec, New Brunswick and Nova Scotia as well as Yukon and the Northwest Territories, are in the early stages of creating the conditions for oil and gas development. Canada’s industry has made progress in strengthening the environmental performance of oil-sands production, including oil-sands tailing ponds, water and land use, and reclamation. On the other hand, mitigating GHG and air emissions from venting and flaring at existing production sites and planning for the management of legacy wells remain regulatory challenges, along with the need to continuously ensure safety, environmental protection and transparency. The provinces and territories are in the process of reviewing and modernising their regulatory frameworks, which presents an opportunity to address these shortfalls. Canada’s experience is of interest to many IEA members, notably the US, which can underpin the responsible development of the unconventional oil and gas. In this regard, Canada hosted the IEA Unconventional Gas Forum in 2014 to foster such exchange of best practises with international partners.
The IEA review of 2009 had called for a co-ordinated climate change policy targeted on key emitting sectors. Many domestic and other international observers believe that Canada needs to make more progress towards setting an energy strategy at federal level in order to balance its energy and climate objectives. Despite the introduction of new federal GHG regulations in the transport and power sectors, the federal government has not been able to implement policies to bridge the differences between provinces in terms of sharing the burden of climate ambitions. There are areas of overlap as well as gaps between federal and provincial efforts. Provinces and territories have developed ambitious energy and climate policies, ranging from a carbon tax in British Columbia to cap-and-trade-mechanisms in Quebec, and in the future in Ontario, to intensity-based reductions for major emitters in Alberta and the phase-out of coal in several provinces. While there is no
© O
EC
D/IE
A, 2
016
1. Executive summary and key recommendations
15
formal mechanism in place to forge collective action on climate change, the Canadian Council of Ministers of the Environment (CCME) has recently established a new climate change committee to facilitate ongoing engagement on this issue among federal, provincial and territorial governments. Building upon those efforts, an enhanced collaboration between levels of government is needed to ensure a cohesive approach.
On 17 July 2015, the Premiers of Canada’s provinces and territories agreed upon a Canadian Energy Strategy (CES) under the Council of the Federation (CoF, 2015), including on a shared vision, a series of objectives and recommendations. Among others, the Strategy calls upon the federal government to create collaborative mechanisms to enable provinces and territories to participate more fully in international energy and climate change discussion and negotiations. COP21 in Paris in December 2015 was an important milestone for the collaboration of the federal government and provinces in this respect.
Building upon the CES, the federal government needs to devise a mechanism for collective action to enable provinces and territories to collectively address climate goals. Such a mechanism can support the investment conditions for low-carbon energy technologies, including the longer-term operation of nuclear power plants, investment in renewable energy, CCS and other clean energy technologies. The IEA urges Canada to seize the opportunity to pursue such action, aligning its 2030 ambitions with the outcome of the international climate negotiations of COP21 in Paris in December 2015.
ENERGY TECHNOLOGY AND INNOVATION
Canada is in a strong position to foster innovation and become a leader in clean energy technologies. This will contribute to reducing the environmental impact of energy use and production, as well as the cost of natural resource development, notably for oil-sands operations. In order to capitalise on these opportunities, policy action needs to focus on strengthening the public and private energy RD&D in Canada.
In recent years, RD&D has been supported mainly by short-term federal programmes and energy-related RD&D investment by provincially owned utilities. Since 2009, a noticeable decrease in public funding has been witnessed at both federal and provincial/territorial levels, outside the CCS demonstration projects. The ability for applied technology to reduce costs is crucial to addressing many of the challenges facing resource development. Long-term public funding of basic RD&D is necessary to maintain and increase opportunities for leveraging private funding and commercialisation, international leadership and co-operation on RD&D. To this end, in November 2015, Canada was one of 20 countries that signed on to the Mission Innovation initiative – a global partnership aimed at doubling government investment in clean energy innovation over five years.
The oil industry has stepped up collaboration on technology and research under Canada’s Oil Sands Innovation Alliance (COSIA). This industry-led alliance of 13 oil-sands producers is focused on accelerating the pace of improvements in environmental performance by means of collaborative action and innovation. COSIA member companies have shared around 800 distinct technologies and innovations that cost over CAD 950 million, which is a unique experience in a globally competitive sector.
Canada’s industry could benefit from a dedicated federal energy RD&D strategy, building on stronger domestic and international collaboration and co-ordination of RD&D activities between industry and provinces/territories, notably on clean energy technologies, CCS and environmentally beneficial methods for unconventional oil and gas production.
© O
EC
D/IE
A, 2
016
1. Executive summary and key recommendations
16
KEY RECOMMENDATIONS
The government of Canada should:
o Facilitate market integration by taking leadership at federal level to increase co-operation across Canada and within NAFTA, on energy data, trade of energy commodities, safety and reliability, and the environmental integrity of the transportation.
o Take action to implement Canada’s climate target for 2030 to strengthen the country’s role as responsible energy supplier and user by:
Supporting provincial collaboration on energy and climate matters, building on the 2015 Canadian Energy Strategy. Devising, at federal level, mechanisms for provincial and territorial governments’ co-operation to collectively meet its climate target of cutting emissions by 30% below 2005 levels by 2030; to improve energy efficiency and interconnections, and to develop renewable energy and other low-carbon energy technologies.
Reducing uncertainty for investors and project developers by setting a clear timeline for the implementation of federal GHG regulations in the oil and gas sectors and energy-intensive industries.
Sharing knowledge, best practices and experience on unconventional gas and oil regulations with international partners.
o Monitor the implementation of the work under the Responsible Resource Development Plan and consider additional measures, as necessary, to facilitate investment in future energy projects, including further advancing the monitoring, compliance with and enforcement of high standards of environmental performance and safety, public consultation and transparency of information.
o Continue to work with international partners (such as the United States, China and India) with the objective of ensuring access to market and the diversification of export markets for Canadian products, technologies and services.
o Strengthen Canadian leadership in clean energy technologies and innovation through stable, higher and longer-term federal and provincial funding, and work towards a dedicated energy RD&D strategy which builds on close co-operation of RD&D activities with industry and Canadian provinces/territories.
References ARC Financial Corp. (2015), The Fiscal Pulse of Canada’s Oil and Gas Industry, Frist Quarter 2015, at: www.arcfinancial.com/assets/672/2015_Q1_Industry_Fiscal_Pulse_-_ARC_Financial.pdf.
CoF (Council of the Federation), (2015), Canadian Energy Strategy, 17 July 2015, at: www.pmprovincesterritoires.ca/phocadownload/publications/canadian_energy_strategy_eng_fnl.pdf.
IEA (International Energy Agency) (2015), World Energy Outlook, OECD/IEA, Paris.
© O
EC
D/IE
A, 2
016

PART I POLICY ANALYSIS
© O
EC
D/IE
A, 2
016
2. General energy policy
18
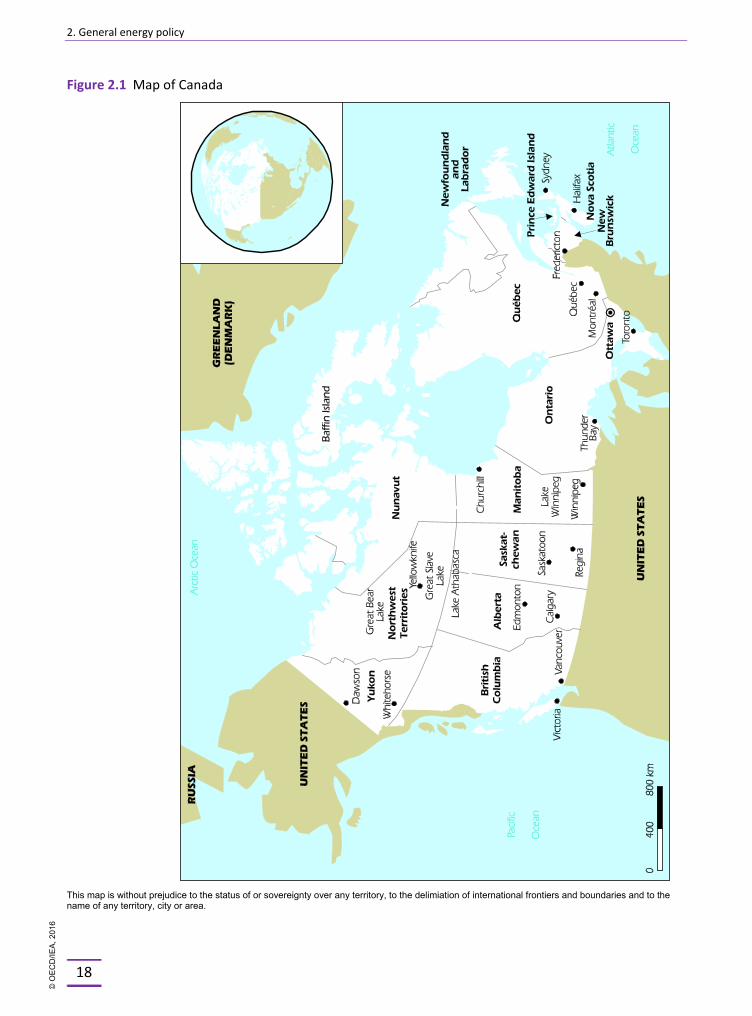
Figure 2.1 Map of Canada
This map is without prejudice to the status of or sovereignty over any territory, to the delimiation of international frontiers and boundaries and to the name of any territory, city or area.
© O
EC
D/IE
A, 2
016
2. General energy policy
19
2. GENERAL ENERGY POLICY
Key data (2013)
Energy production: 435.1 Mtoe (oil 44.9%, natural gas 30%, coal 8.1%, hydro 7.7%, nuclear 6.2%, biofuels and waste 3%, wind 0.2%), +12.7% since 2003
TPES: 253.2 Mtoe (natural gas 34.4%, oil 31%, hydro 13.3%, nuclear 10.6%, coal 6.9%, biofuels and waste 5.2%, wind 0.4%, electricity net exports -1.7%), -3.4% since 2003
TPES per capita: 7.2 toe (IEA average: 4.5 toe)
TPES per GDP: 0.19 toe/USD 1 000 PPP (IEA average: 0.13 toe/USD 1 000 PPP)
Electricity generation: 651.8 TWh (hydro 60.1%, nuclear 15.8%, natural gas 10.3%, coal 10%, wind 1.8%, oil 1.2%, biofuels and waste 0.8%, solar 0.1%), +10.6% since 2003
Electricity and heat generation per capita: 18.8 MWh (IEA average: 10 MWh)
COUNTRY OVERVIEW
With an area of 9.98 million square kilometres in total, Canada is the world's second-largest country by total area. Around 80% of the 35.7 million Canadians live in the southern part along the US border: 5.6 million in Toronto (Ontario), 3.8 million in Montreal (Quebec), 2.3 million in Vancouver (British Columbia), 1.2 million in the Ottawa–Gatineau metropolitan area (Ontario/Quebec) and 1.2 million in Calgary (Alberta). Population has been increasing strongly, by 6.6% since 2009, mostly as a result of growing international labour migration attracted by the high standards of living in Canada.
Canada is a parliamentary democracy and constitutional monarchy with a federal structure of ten provinces (Alberta, British Columbia, Manitoba, New Brunswick, Newfoundland and Labrador, Nova Scotia, Ontario, Prince Edward Island, Quebec and Saskatchewan) and three territories (Northwest Territories, Nunavut and the Yukon). The ten provinces draw their rights directly from the Constitution (Constitution Act, 1982) which recognises three Aboriginal groups: First Nations, Métis and Inuit.
On 4 November 2015, Justin Pierre James Trudeau took office as new Prime Minister following the victory of the Liberal party at the general elections on 19 October 2015. He succeeds Stephen Harper who served as Prime Minister of a Conservative government from 2006-15.
Canada has experienced a solid economic recovery, growing at an annual average rate of 2.6% since the recent recession in 2008. This has translated into a significant decline in the unemployment rate, to 6.7% by the end of 2014, from a recession peak of 8.7%. Overall, in 2014, gross domestic product (GDP) reached USD 1.575 trillion or USD 44 319 per capita (2010 PPP-based). Looking forward, the Canadian economy is expected to grow at a rate of 2.2% in 2015 and 2.1% in 2016 (OECD, 2014).
© O
EC
D/IE
A, 2
016
2. General energy policy
20
The energy sector plays a strong role in the economic performance of Canada. In 2014, the energy sector contributed about 10% of GDP, employed approximately 280 000 people and was responsible for about 30% of Canada’s total exports. Each year, the energy sector also contributes on average CAD 20 to 25 billion in taxes, royalties and other payments to governments.
Around CAD 100 billion is invested each year in new capital goods in Canada’s energy sector, representing 40% of total non-residential and machinery and equipment. Canada’s energy sector attracted foreign direct investment of CAD 182 billion in 2013, up from CAD 27 billion in 1999, representing over a quarter of Canada’s total foreign direct investment across all sectors.
Canada is one of the largest energy producers in the world and the country with the highest energy supply per capita among IEA members. By land, Canada is the second-largest country by total area, after Russia. In 2014, country was the fifth-largest crude oil and the fourth-largest natural gas producer; it ranked third as coking coal exporter, and came second as generator of hydropower (2013) and as uranium producer. The country has vast oil and gas reserves and makes a strong contribution to global energy security by ensuring diversified, competitive, secure and reliable energy supplies. At home, Canada has a low-carbon electricity generation mix with over 75% of its electricity coming from non-emitting sources (mostly hydro and nuclear).
SUPPLY AND DEMAND
SUPPLY
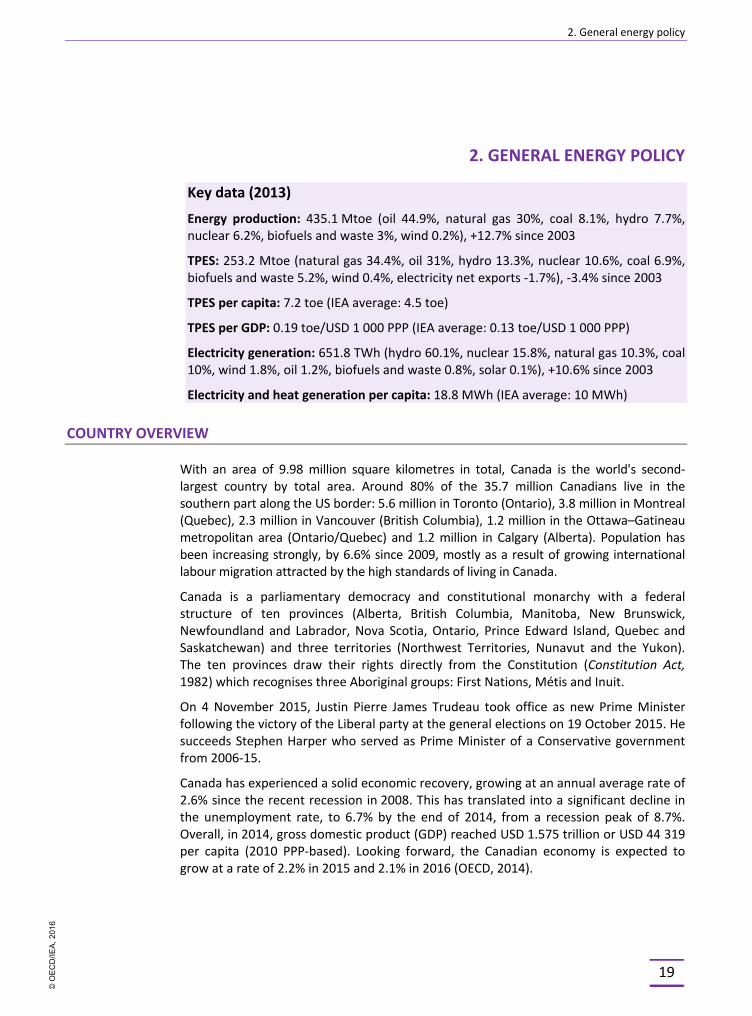
Canada produced 435.1 million tonnes of oil-equivalent (Mtoe) of energy in 2013. Around 45% of energy produced comes from oil with the remainder from natural gas (30%), coal (8.1%), hydro (7.7%), nuclear (6.2%), biofuels and waste (3%), wind (0.2%) and solar (Figure 2.2). Production has been increasing for decades and was 12.7% higher in 2013 compared to 2003, with a 5.6% contraction in 2008 and 2009.
Figure 2.2 Energy production by source, 1973-2013
* Negligible.
Source: IEA (2015), Energy Balances of OECD Countries, www.iea.org/statistics/.
0
50
100
150
200
250
300
350
400
450
500
1973 1976 1979 1982 1985 1988 1991 1994 1997 2000 2003 2006 2009 2012
Mtoe
Oil
Coal
Natural gas
Biofuels and waste
Nuclear
Hydro
Solar*
Wind*
© O
EC
D/IE
A, 2
016
2. General energy policy
21
Production of all fuels other than natural gas has increased over the past ten years. Natural gas production declined by 13.8% during the period, while oil, coal and nuclear power grew by 35.4%, 15.8% and 16.6%, respectively. Development of wind and solar boomed, increasing 13-fold each. Growth in hydro and biofuels and waste was more moderate, at 16.1% and 7.8% over the ten years, respectively.
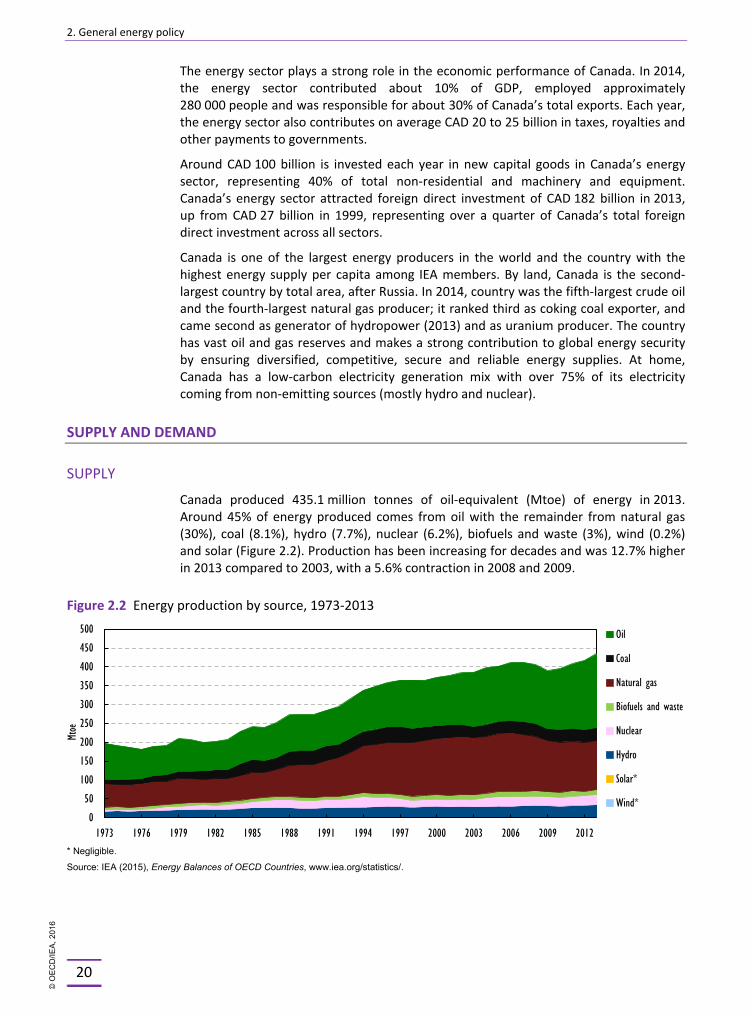
Canada’s total primary energy supply (TPES)1 was 253.2 Mtoe in 2013. It was 3.4% lower in 2013 than in 2003 with a peak of 270.3 Mtoe in 2005 (Figure 2.3). Energy supply increased steadily for decades before peaking in 2005. It reached a plateau just before the economic downturn in 2008 and has been falling since.
Figure 2.3 TPES, 1973-2013
* Negligible.
Source: IEA (2015), Energy Balances of OECD Countries, www.iea.org/statistics/.
Fossil fuels accounted for 72.2% of TPES in 2013, including natural gas (34.4%), oil (31%) and coal (6.9%). Nuclear power represented 10.6% while the remaining 18.9% came from renewables. Renewables include hydro (13.3%), biofuels and waste (5.2%), wind (0.4%) and solar. The fossil fuel share has contracted from 77.1% of TPES in 2003 as renewable energy has gained a larger share of the total energy mix. The nuclear power share in TPES has remained constant over the years.
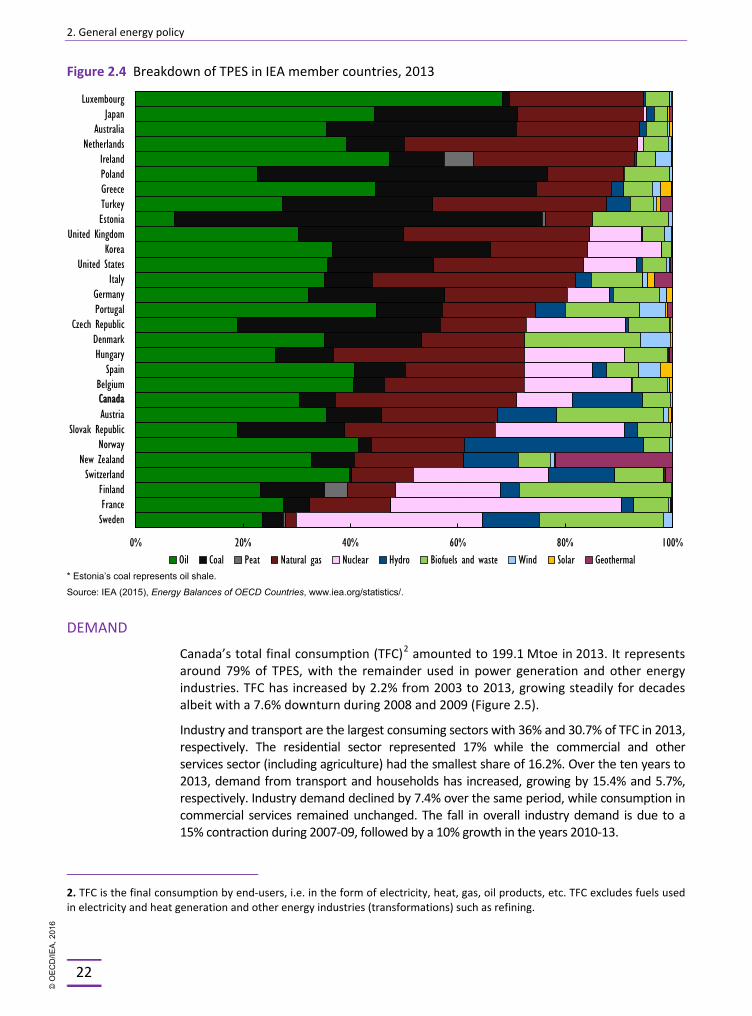
Canada produces 172% of domestic demand and is therefore a net exporter. Total net exports were 184.5 Mtoe in 2013, made up mainly of crude oil net exports (55.3%), natural gas net exports (25.2%), coal net exports (9.8%) and oil products net exports (7.5%). Canada’s fossil fuel share in TPES is ninth-lowest among IEA member countries, similar to Belgium’s share (Figure 2.4). The share of hydro is second-highest behind Norway and the share of natural gas is fourth-highest behind the Netherlands, Italy and the United Kingdom.
Uranium, while not considered an energy resource within energy statistics, saw approximately 85% of its production exported to international markets. If counted as an energy resource, its energy value would approximate that of Canadian natural gas production.
1. TPES is made up of production + imports - exports - international marine bunkers - international aviation bunkers ± stock changes. This equals the total supply of energy that is consumed domestically, either in transformation (for example in refining) or in final use.
0
50
100
150
200
250
300
1973 1976 1979 1982 1985 1988 1991 1994 1997 2000 2003 2006 2009 2012
Mtoe
Oil
Coal
Natural gas
Biofuels and waste
Nuclear
Hydro
Solar*
Wind*
© O
EC
D/IE
A, 2
016
2. General energy policy
22
Figure 2.4 Breakdown of TPES in IEA member countries, 2013
* Estonia’s coal represents oil shale.
Source: IEA (2015), Energy Balances of OECD Countries, www.iea.org/statistics/.
DEMAND
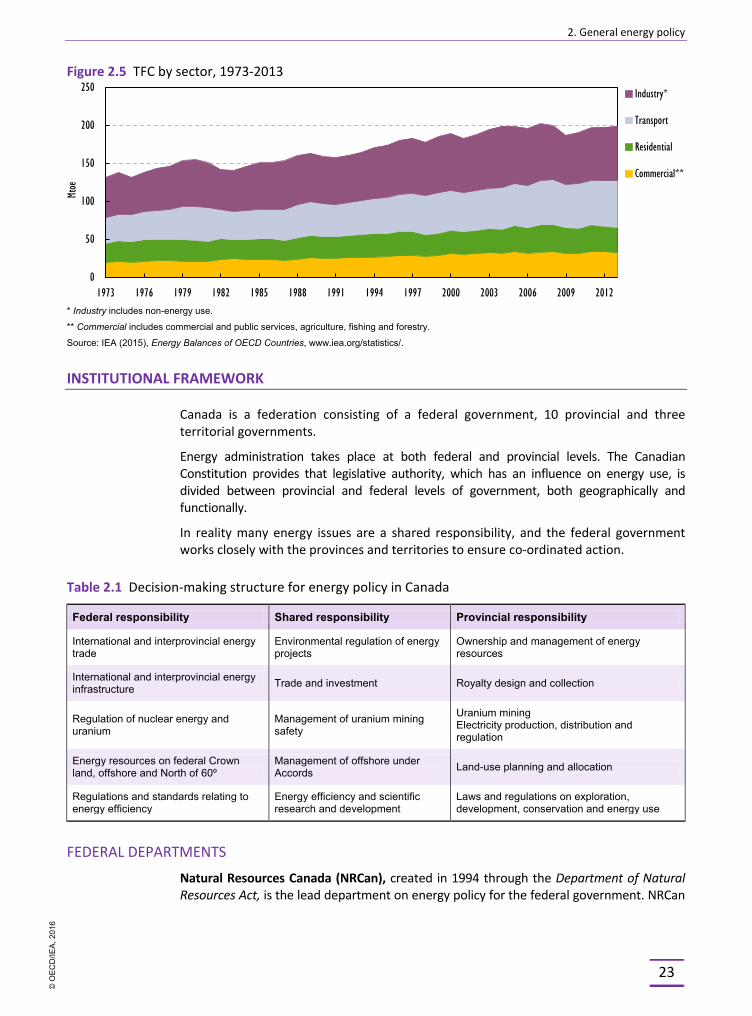
Canada’s total final consumption (TFC)2 amounted to 199.1 Mtoe in 2013. It represents around 79% of TPES, with the remainder used in power generation and other energy industries. TFC has increased by 2.2% from 2003 to 2013, growing steadily for decades albeit with a 7.6% downturn during 2008 and 2009 (Figure 2.5).
Industry and transport are the largest consuming sectors with 36% and 30.7% of TFC in 2013, respectively. The residential sector represented 17% while the commercial and other services sector (including agriculture) had the smallest share of 16.2%. Over the ten years to 2013, demand from transport and households has increased, growing by 15.4% and 5.7%, respectively. Industry demand declined by 7.4% over the same period, while consumption in commercial services remained unchanged. The fall in overall industry demand is due to a 15% contraction during 2007-09, followed by a 10% growth in the years 2010-13.
2. TFC is the final consumption by end-users, i.e. in the form of electricity, heat, gas, oil products, etc. TFC excludes fuels used in electricity and heat generation and other energy industries (transformations) such as refining.
0% 20% 40% 60% 80% 100%
SwedenFranceFinland
SwitzerlandNew Zealand
NorwaySlovak Republic
AustriaCanadaBelgium
SpainHungaryDenmark
Czech RepublicPortugalGermany
ItalyUnited States
KoreaUnited Kingdom
EstoniaTurkeyGreecePolandIreland
NetherlandsAustralia
JapanLuxembourg
Oil Coal Peat Natural gas Nuclear Hydro Biofuels and waste Wind Solar Geothermal
Canada
© O
EC
D/IE
A, 2
016
2. General energy policy
23
Figure 2.5 TFC by sector, 1973-2013
* Industry includes non-energy use.
** Commercial includes commercial and public services, agriculture, fishing and forestry.
Source: IEA (2015), Energy Balances of OECD Countries, www.iea.org/statistics/.
INSTITUTIONAL FRAMEWORK
Canada is a federation consisting of a federal government, 10 provincial and three territorial governments.
Energy administration takes place at both federal and provincial levels. The Canadian Constitution provides that legislative authority, which has an influence on energy use, is divided between provincial and federal levels of government, both geographically and functionally.
In reality many energy issues are a shared responsibility, and the federal government works closely with the provinces and territories to ensure co-ordinated action.
Table 2.1 Decision-making structure for energy policy in Canada
Federal responsibility Shared responsibility Provincial responsibility
International and interprovincial energy trade
Environmental regulation of energy projects
Ownership and management of energy resources
International and interprovincial energy infrastructure Trade and investment Royalty design and collection
Regulation of nuclear energy and uranium
Management of uranium mining safety
Uranium mining Electricity production, distribution and regulation
Energy resources on federal Crown land, offshore and North of 60º
Management of offshore under Accords Land-use planning and allocation
Regulations and standards relating to energy efficiency
Energy efficiency and scientific research and development
Laws and regulations on exploration, development, conservation and energy use
FEDERAL DEPARTMENTS
Natural Resources Canada (NRCan), created in 1994 through the Department of Natural Resources Act, is the lead department on energy policy for the federal government. NRCan
0
50
100
150
200
250
1973 1976 1979 1982 1985 1988 1991 1994 1997 2000 2003 2006 2009 2012
Mtoe
Industry*
Transport
Residential
Commercial**
© O
EC
D/IE
A, 2
016
2. General energy policy
24
deals with the responsible development of Canada's natural resources, including energy, forests, minerals and metals. In the energy sector, NRCan is organised with branches and offices in charge of general energy policy (Energy Policy Branch), and sector-specific policies for oil, gas, energy infrastructure and offshore petroleum management (Petroleum Resources Branch), nuclear energy, uranium and radioactive waste, renewable and electrical energy (Electricity Resources Branch), energy efficiency (Office of Energy Efficiency), and energy security, including energy safety and security (Energy Safety and Security). NRCan’s actions are governed by a number of acts, including the Canadian Petroleum Resources Act, the Energy Efficiency Act, and the Nuclear Energy Act.
NRCan also maintains an Innovation and Energy Technology sector that manages a variety of federal funding programmes related to energy technology innovation, while also housing the national CanmetENERGY laboratories, which conduct targeted research and development (R&D) on energy-related technologies from three locations across the country (Ottawa Ontario, Varennes Quebec, Devon Alberta).
Environment Canada (EC) is the lead department to support the Minister of Environment and Climate Change (since November 2015) and design domestic and international climate change policies and adaptation. EC is the direct regulator of greenhouse gas (GHG) and air pollutant emissions (e.g. from industrial and some transportation sources, such as on-road and off-road vehicles). It also develops policies with regard to sustainable development, waste and pollution prevention, water and biodiversity, conservation and protection of the environment through promoting, inspecting and enforcing regulatory requirements under the different legislative acts.
These acts include the Canadian Environmental Protection Act 1999 (CEPA 1999), the Canada Water Act and the International Rivers Improvement Act (IRIA), the Canadian Environmental Assessment Act (2012), the Federal Sustainable Development Act (2010), the Environmental Enforcement Act and the sections of the Fisheries Act related to water pollution.
Transport Canada (TC) is responsible for transportation policy, including safety and security, airport and ports programmes, road and rail. Transport Canada's five regions − Pacific, Prairie and Northern, Ontario, Quebec, and Atlantic − are headed by regional director-generals. TC has authority to regulate air emissions from rail, aviation and marine modes of transport.
Aboriginal Affairs and Northern Development Canada (AANDC) is responsible for meeting Canada’s obligations and commitments to First Nations, Inuit and Métis. Canada has been active to create a strong partnership with its Aboriginal groups, in particular for oil and gas production. Canada has a legal duty to consult and accommodate Aboriginal groups, if it has been determined that treaty and Aboriginal rights could be adversely impacted. This legal duty also applies to provinces and territories. AANDC also has responsibility for the administration of oil and gas rights in Nunavut and the Arctic offshore.
AGENCIES AND OTHER BODIES
The National Energy Board (NEB) is the independent federal agency established by the Parliament of Canada in 1959 to regulate international and interprovincial hydrocarbon, commodity pipelines and international power lines. The NEB also regulates exports of oil, gas, natural gas liquids and electricity, and imports of natural gas. It has limited powers with respect to regulation of oil and natural gas production, as the provinces have their own regulators, e.g. Alberta Energy Regulator (AER) and British Columbia Oil and Gas Commission (BCOGC).
© O
EC
D/IE
A, 2
016

2. General energy policy
25
However, the NEB has regulatory responsibility for oil and gas exploration and production in the Canadian Arctic offshore, offshore areas of British Columbia and the east coast that fall outside the jurisdiction of the Canada-Newfoundland and Labrador Offshore Petroleum Board (C-NLOPB), the Canada-Nova Scotia Offshore Petroleum Board (CNSOPB), the onshore part of the Inuvialuit Settlement Region in the Northwest Territories, in accordance with territorial legislation that currently mirrors federal legislation, the Norman Wells Proven area, and Nunavut. These regulatory responsibilities are set out in the Canada Oil and Gas Operations Act (COGOA) and the Canada Petroleum Resources Act (CPRA). The NEB is also responsible for worker safety under the Canada Labour Act, Part II. For oil and gas exploration and production activities in the Arctic, the Board regulates safety, protection of the environment, including emergency preparedness and response, and the conservation of oil and gas resources, among other things.
Statistics Canada (StatsCan) is the federal agency responsible for the collection, compilation and dissemination of official statistics in Canada. These include energy supply and demand data for crude oil, natural gas, refined petroleum products, electricity and coal. Legal authority for StatsCan as the national statistical agency for Canada is provided by the Statistics Act.
The Canadian Nuclear Safety Commission (CNSC) is the nuclear energy and materials watchdog in Canada. The CNSC regulates nuclear power plants, nuclear research facilities and the numerous other uses of nuclear material. It is almost exclusively concerned with safety standards in the nuclear industry and rarely addresses market issues or environmental concerns beyond public safety needs. CNSC reports to Parliament through NRCan.
Atomic Energy of Canada Limited (AECL) is a Crown corporation responsible for the long-term, contractual arrangement with Canadian National Energy Alliance (CNEA) for the management and operations of the Canadian Nuclear Laboratories (CNL). This concludes the restructuring of the AECL, a process that had started in 2009 with the divestiture of AECL’s CANDU reactor division and its sale to Candu Energy Inc. in 2011, and the creation of a government-owned and contractor-operated (GoCo) model for the AECL’s Nuclear Laboratories under the new CNL in 2014. The CNEA was selected as contractor through competitive procurement in the fall of 2015. The CNEA is an alliance of CH2M Hill, EnergySolutions, Fluor, SNC-Lavalin Inc, and Rolls-Royce. AECL is tasked to monitor performance under the GoCo arrangement and retains the ownership of the nuclear laboratories’ physical and intellectual property assets and its liabilities. AECL leverages its facilities, assets and intellectual property by bringing in private-sector rigour in the operation of the nuclear laboratories through the contract with CNEA, and fulfils its core mandate to:
§ manage Canada’s radioactive waste management and decommissioning responsibilities
§ provide nuclear science and technology support and expertise to meet federal responsibilities
§ offer services to Canada’s nuclear industry through access to science and technology facilities and expertise on commercial terms.
The Canadian Environmental Assessment Agency (CEA Agency) is responsible for the administration and co-ordination of the federal environmental assessment (EA) process and related Aboriginal consultations under the Canadian Environmental Assessment Act 2012. It also develops policies, procedures and guidance materials to enhance EAs and support integration of Aboriginal consultations in EAs.
© O
EC
D/IE
A, 2
016
2. General energy policy
26
Shared management by offshore petroleum boards was established for the regulation of oil and gas activities in the offshore areas in Newfoundland and Labrador, and Nova Scotia, respectively under the Canada-Newfoundland and Labrador Atlantic Accord Implementation Act and the Canada-Nova Scotia Offshore Petroleum Resources Accord Implementation Act. The C-NLOPB and the CNSOPB boards have the responsibility for direct government response in all petroleum-related emergencies in their mandated area.
The mandate of the C-NLOPB is to interpret and apply the provisions of the Atlantic Accord and the Atlantic Accord Implementation Acts to all activities of operators in the Newfoundland and Labrador Offshore Area; and to oversee operator compliance with those statutory provisions. In the implementation of this mandate, the C-NLOPB facilitates the exploration for and development of the hydrocarbon resources in the Newfoundland and Labrador Offshore Area in a manner that conforms to the statutory provisions for worker safety; environmental protection and safety; effective management of land tenure; maximum hydrocarbon recovery and value; and Canada/Newfoundland & Labrador benefits.
The CNSOPB is the independent joint agency of the governments of Canada and Nova Scotia responsible for the regulation of petroleum activities in the Nova Scotia offshore area. It was established in 1990 pursuant to the Canada-Nova Scotia Offshore Petroleum Accord Implementation Acts (Accord Acts). Responsibilities include: health and safety of offshore workers; protection of the environment; management and conservation of offshore petroleum resources; compliance with the provisions of the Accord Acts that deal with Canada-Nova Scotia employment; industrial benefits issuance of licences for offshore exploration and development; and resource evaluation, data collection, curation and distribution. The board reports to the Federal Minister of Natural Resources Canada in Ottawa, Ontario, and the provincial Minister of Energy in Halifax, Nova Scotia.
The Major Projects Management Office (MPMO) Initiative was established in 2007 by the federal government to improve the federal regulatory system for major natural resource projects. This horizontal initiative brings together 12 federal departments and agencies with: i) an operational mandate to improve the process for major project reviews; and ii) a policy mandate to address cross-cutting issues to drive further improvements to the regulatory system as a whole. The mandate of the MPMO Initiative was extended in the Economic Action Plan 2015 for five years to 2019/20.
In 2014, a new office, the MPMO-West, was established in British Columbia to provide an on-the-ground federal presence with First Nations. It is leading extensive engagement on issues related to energy infrastructure development on the west coast.
PROVINCES AND TERRITORIES
In Canada, provinces and territories determine the development and use of their resources and devise their own energy and climate policies and measures. Several driving forces shape energy policy at the provincial and territorial levels:
§ Provinces and territories have significantly different primary resource endowments.
§ Provinces are owners of their ground resources (apart from resources located in Aboriginal lands and some small pockets of federal land) and have primary responsibilities in shaping policies to be implemented in their jurisdictions.
Energy plays a large role in the creation of wealth in some provinces and territories (e.g. Alberta, Quebec, Saskatchewan, Nova Scotia, and Newfoundland and Labrador).
© O
EC
D/IE
A, 2
016
2. General energy policy
27
For most provinces, the share of their external energy trade with bordering US states is often larger than with Canadian neighbouring provinces and territories. Electricity is almost exclusively regulated by the provincial and territorial governments, except international electricity lines that transport power from Canada to the United States and certain designated interprovincial power lines (to date there has been none).
The Canadian Council of Ministers of the Environment (CCME) and the Energy and Mines Ministers’ Conference (EMMC) and their working groups are the principal forums where Canada’s federal, provincial and territorial governments collaborate and align their efforts on climate, and energy priorities, respectively.
Increasing co-ordination and co-operation between the federal and provincial/territorial governments towards common objectives has been achieved through the EMMC and the CCME and their working groups. In recent years, governments have worked together to advance priorities related to energy innovation, R&D, energy transportation, electricity reliability, energy efficiency, renewable energy and oil and gas pipeline safety and security.
The recently released Canadian Energy Strategy (CES), led by Canada’s Premiers, will drive future inter-provincial and territorial collaboration on energy policy.
CANADIAN ENERGY STRATEGY
In 2011, federal, provincial and territorial energy ministers endorsed a collaborative approach to guide action on shared priorities on energy through the EMMC. The collaborative approach provided a shared vision that “Canada is a recognized global leader in secure and sustainable energy supply, use, and innovation”. The vision was supported by a preliminary series of common principles to guide action on shared priorities:
§ acknowledge the need for an adequate and reliable supply of energy;
§ recognise the importance of socially and environmentally responsible development, transportation and use of energy;
§ maintain a market-oriented approach to energy policies governed by effective, efficient and transparent regulatory systems;
§ recognise that federal, provincial and territorial co-operation is essential while respecting distinct constitutional jurisdictions and government authorities.
At their summer meeting in July 2015 in St. John’s, Newfoundland, the Council of the Federation (CoF), consisting of Canada’s provincial and territorial Premiers, released a Canadian Energy Strategy (CoF, 2015), providing a foundation for provinces and territories to work together on energy priorities and shared energy and climate goals, including at international level.
The Canadian Energy Strategy (CES) is based on the three principles of collaboration and transparency; climate change, social and environmental responsibility; and energy security and stability. CES sets out three themes (see Box 2.1) – sustainability and conservation, technology and innovation, and delivering energy to people – with corresponding focus areas and a series of key objectives and actions to guide their implementation. Premiers agreed to focus the next steps of the CES on the following priorities, under the leadership of provincial and territorial energy ministers: energy efficiency; delivering energy to people; climate change and transition to a lower-carbon economy; and technology and innovation.
© O
EC
D/IE
A, 2
016
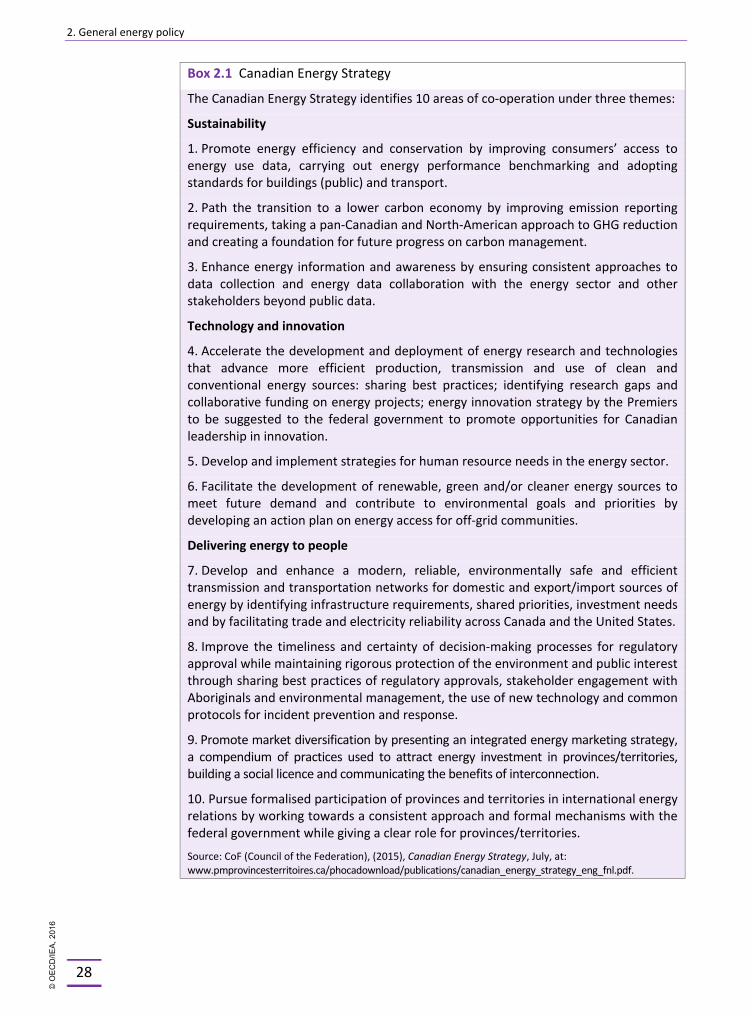
2. General energy policy
28
Box 2.1 Canadian Energy Strategy
The Canadian Energy Strategy identifies 10 areas of co-operation under three themes:
Sustainability
1. Promote energy efficiency and conservation by improving consumers’ access to energy use data, carrying out energy performance benchmarking and adopting standards for buildings (public) and transport.
2. Path the transition to a lower carbon economy by improving emission reporting requirements, taking a pan-Canadian and North-American approach to GHG reduction and creating a foundation for future progress on carbon management.
3. Enhance energy information and awareness by ensuring consistent approaches to data collection and energy data collaboration with the energy sector and other stakeholders beyond public data.
Technology and innovation
4. Accelerate the development and deployment of energy research and technologies that advance more efficient production, transmission and use of clean and conventional energy sources: sharing best practices; identifying research gaps and collaborative funding on energy projects; energy innovation strategy by the Premiers to be suggested to the federal government to promote opportunities for Canadian leadership in innovation.
5. Develop and implement strategies for human resource needs in the energy sector.
6. Facilitate the development of renewable, green and/or cleaner energy sources to meet future demand and contribute to environmental goals and priorities by developing an action plan on energy access for off-grid communities.
Delivering energy to people
7. Develop and enhance a modern, reliable, environmentally safe and efficient transmission and transportation networks for domestic and export/import sources of energy by identifying infrastructure requirements, shared priorities, investment needs and by facilitating trade and electricity reliability across Canada and the United States.
8. Improve the timeliness and certainty of decision-making processes for regulatory approval while maintaining rigorous protection of the environment and public interest through sharing best practices of regulatory approvals, stakeholder engagement with Aboriginals and environmental management, the use of new technology and common protocols for incident prevention and response.
9. Promote market diversification by presenting an integrated energy marketing strategy, a compendium of practices used to attract energy investment in provinces/territories, building a social licence and communicating the benefits of interconnection.
10. Pursue formalised participation of provinces and territories in international energy relations by working towards a consistent approach and formal mechanisms with the federal government while giving a clear role for provinces/territories.
Source: CoF (Council of the Federation), (2015), Canadian Energy Strategy, July, at: www.pmprovincesterritoires.ca/phocadownload/publications/canadian_energy_strategy_eng_fnl.pdf.
© O
EC
D/IE
A, 2
016
2. General energy policy
29
REGIONAL CO-OPERATION ON ENERGY
Under the Clean Energy Dialogue (CED), the federal government has collaborated with the US on matters related to R&D on clean energy science and technologies to reduce GHGs and mitigate climate change. Priority areas to date have included carbon capture and storage (CCS), the electricity grid, clean energy R&D (including marine renewables, biofuels, transportation, buildings and communities) and energy efficiency. Launched in 2009 by Prime Minister Harper and President Obama, the CED’s work has been guided by two action plans that have delivered over 60 bilateral projects ranging from enhanced collaborative R&D, to the development and demonstration of clean energy technologies, to workshops and dialogues on policy and regulatory issues, and to increased public awareness and outreach.
Canada has sought close alignment with US measures, notably with regard to energy efficiency, electricity generation and transportation, but recently also on climate change policies and GHG regulations. Given the high market integration, alignment with the US energy regulations and standards, notably product-related energy efficiency performance standards or GHG emission regulations, is increasingly essential. This alignment has been recently facilitated through the work of the Canada-US Regulatory Co-operation Council which was created in 2011.
In May 2015, the energy ministers of the United States, Canada and Mexico agreed to establish a Working Group on Climate Change and Energy, expanding the North American Energy Ministers Dialogue, which was created at the 2014 North American Leaders Summit. The new trilateral working group supports the implementation of the clean energy and climate change goals of each of the three countries. This co-operation extends to reliable, resilient and low-carbon electricity grids; the modelling and deployment of clean energy technologies, including renewables; energy efficiency for equipment, appliances, industries and buildings, including energy management systems; carbon capture, use and storage, climate change adaptation and resilience; and emissions from the oil and gas sectors, including methane and black carbon.
KEY ENERGY POLICIES
Given the energy sector’s significant contributions to the Canadian economy and changes in the global energy landscape, Canada’s energy policy has made natural resource development a strong priority.
Within the framework of the Responsible Resource Development (RRD) Plan, the energy policy goals of the federal government are aimed at promoting energy market access and diversification; modernising regulatory systems for project reviews; enhancing energy safety and security; ensuring the participation of Aboriginal people in Canada’s energy resource development; supporting energy innovation and efficiency across all sectors; and promoting an open, competitive tax and investment regime for energy resource development.
RESPONSIBLE RESOURCE DEVELOPMENT PLAN
The overwhelming majority of Canada’s energy exports have traditionally been to the US, but with growing US energy production, Canada has actively been seeking opportunities to diversify its export markets — particularly to Asian and European
© O
EC
D/IE
A, 2
016
2. General energy policy
30
countries. Canada will continue to be a key supplier to the US but shifting global demand and supply conditions make it imperative for Canada to have access to new and growing markets. Diversifying export markets would enable Canadian producers to access global markets and apply global prices for Canadian natural gas, crude oil and petroleum products. Moreover, it would contribute to global energy security. To date, Canadian products are traded at a discount to US products, given the transport constraints.
Diversifying energy export markets requires expanding energy infrastructure projects, including pipelines and LNG terminals. These projects will allow Canada to deliver energy to customers in Asia, Europe and North America. The federal government, in close co-operation with provinces and territories, has taken steps to foster the implementation of major energy projects across the country.
Over the next decade, hundreds of major resource projects (mining, energy) are currently planned or under construction across Canada. Major projects are being proposed in all regions, including LNG facilities in British Columbia, oil and minerals extraction in the Prairies, the chromite mines in the Ring of Fire in Ontario, iron mining in northern Quebec and Labrador, hydropower projects in Atlantic Canada and British Columbia, and mining in the Northwest Territories.
The federal government is responsible for assessing and regulating major projects that may have effects on areas under federal jurisdiction (fish and fish habitat, species at risk, migratory birds, federal lands and Aboriginal peoples). As part of Canada’s Economic Action Plan, the government’s plan for Responsible Resource Development (RRD) recognises that an efficient and effective regulatory system is essential both to ensure Canada’s competitiveness and to uphold environmental standards.
Launched in 2012, RRD is focused on four priority areas:
§ making project reviews more predictable timely: by setting maximum beginning-to-end timelines for environmental assessments (EAs) and panel reviews
§ reducing duplication of project review: through substitution and equivalency provisions allowing provincial EAs that meet the federal requirements to replace federal assessments (for substituted processes, the federal government retains decision-making powers) and to help eliminate duplication between the two levels of government
§ strengthening environmental protection: by focusing assessments on major projects that have a greater potential for significant adverse environmental effects and introducing substantial financial penalties for non-compliance with conditions
§ enhancing Aboriginal consultations: by better integrating Aboriginal consultations into the assessment and regulatory processes, and establishing consultation protocols or agreements with Aboriginal groups for project reviews.
Modernising project reviews, approvals and consultation
In the course of the 2012 Budget implementation, the Jobs, Growth and Long-Term Prosperity Economic Action Plan 2012, Bill C-38 was adopted in 2012 with the aim to streamline major project reviews.
Bill C-38 repealed the Canadian Environmental Assessment Act (CEAA) of 1992, replacing it with the new CEAA 2012, which included significant changes to the definition of environmental effects and reduced the number and scope of federal EAs (only for projects designated by regulation or by the Minister of the Environment). This would
© O
EC
D/IE
A, 2
016
2. General energy policy
31
enable substitution and equivalency of federal EAs with provincial processes where certain conditions are met, with the goal of having one project, one review in a clearly defined time period. Bill C-38 also made significant amendments to other federal environmental laws (Canadian Environmental Protection Act, Species at Risk Act, the National Energy Board Act, the Canadian Oil and Gas Operations Act, the Nuclear Safety and Control Act, and the Fisheries Act).
These changes provide for legislative timelines for hearings by the NEB and CNSC, and new enforcement powers, including administrative monetary penalties. Environmental issues may no longer be considered in the granting of electricity export licences and, if the NEB recommends that a certificate of public convenience and necessity is not to be granted for a major project, the final decision will ultimately reside with Cabinet.
In March 2013, the federal government and the government of British Columbia signed the first memorandum of understanding (MOU) on the substitution of EAs. Under the MOU, where the federal government approves a request for substitution, the government of British Columbia will conduct the environmental assessment for the approved project; however, both governments will take their own EA decision.
In 2014, the federal government allocated CAD 28 million over two years to the NEB to enhance the comprehensiveness and timeliness of reviews of project applications and to support the Participant Funding Program, which provides financial assistance to NEB’s oral hearing process, including individuals, Aboriginal groups, land-owners, and non-industry not-for-profit groups.
The mandate of the Major Projects Management Office has been extended in the Economic Action plan 2015 for another five years up to 2019.
Aboriginal participation in energy resource development
The federal government has obligations to respect and uphold established or potential Aboriginal and treaty rights under Section 35 of the Constitution Act 1982. The duty of the Crown to consult Aboriginal groups (e.g., the First Nations, Métis or Inuit peoples of Canada) arises whenever the Crown contemplates conduct that could adversely impact established or potential Aboriginal or treaty rights. The Crown is committed to fulfilling these obligations, while at the same time working to support meaningful Aboriginal participation in the opportunities provided by the development of natural resources, towards a renewed relationship built on trust and reconciliation.
Most proposed interprovincial and international pipeline projects and major oil-sands facilities require a number of federal decisions, permits or authorisations. In many cases, these decisions require prior consultation with Aboriginal groups in line with the Canadian Constitution. To fulfill these responsibilities, a whole-of-government approach to Aboriginal consultation is implemented through the MPMO Initiative in which consultation is integrated into the federal EA and regulatory process, to the fullest extent possible. Through this approach, relevant federal organisations (e.g. the CEAA, NEB, and other regulatory departments) work in a co-ordinated and collaborative manner. Alignment and integration of Aboriginal consultation requirements and the project review are an established means through which the potential impacts of the Crown’s conduct on both the environment and Aboriginal or Treaty rights are considered and addressed.
© O
EC
D/IE
A, 2
016
2. General energy policy
32
In the case where the NEB is the only decision maker (i.e. minor NEB Act section 58 applications for pipelines less than 40 km-long), the Crown relies entirely on the NEB process to satisfy the duty to consult.
Major Projects Management Office-West
In 2013, the Prime Minister appointed a special federal representative (SFR) for west coast energy infrastructure who issued 29 recommendations in his report to substantively engage Aboriginal communities by building trust, fostering inclusion, advancing reconciliation and taking action (Eyford, 2013). Subsequently, in 2014 the federal government created the MPMO-West in Vancouver, British Columbia to engage with First Nations on issues related to west coast energy infrastructure development and create partnerships in the areas of employment and training, business development and environmental safety.
Energy safety and security
In February 2015, the Energy Safety and Security Act (ESSA) (Bill C-22), an Act to strengthen energy safety and security for Canada’s offshore and nuclear sectors, received Royal Assent. The legislation focuses on four main areas – prevention, response, accountability and transparency – which help to further strengthen safety and security in Canada’s offshore. The legislation enshrines the “polluter pays” principle into law by implementing an absolute liability limit of CAD 1 billion for offshore petroleum and nuclear companies. The ESSA came into force in February 2015.
As part of the RRD plan, the federal government also introduced the Pipeline Safety Act (Bill C-46), which received Royal Assent on 18 June 2015. This Act strengthens Canada’s pipeline safety system based on prevention, preparedness and response, and liability and compensation. The Act builds on and aligns with work to strengthen the offshore, nuclear, marine and rail sectors, and is complemented by ongoing policy initiatives to enhance Aboriginal participation in pipeline safety, and seeking guidance on best available technologies.
The federal government has addressed oil transportation safety by reinforcing the regime for oil pipeline, tanker and rail safety. On 6 July 2013, a serious rail accident near Lac-Mégantic in Quebec caused a major environmental and human disaster, after a train carrying light crude oil from North Dakota got loose, derailed and careered into the small town of Lac-Mégantic. Since 2013, Transport Canada has presented new regulations, based on the recommendations of the Transport Safety Board, including speed limits for trains carrying dangerous goods through urban areas, and requirements on companies to develop emergency plans. Co-operation was started with the United States on upgrading the standards for tank cars for crude and ethanol shipping.
CLIMATE POLICIES
At federal level, the Ministry of the Environment leads on climate change mitigation and adaptation. The federal government has adopted several ambitious climate targets over the past years in a top-down approach. In 2010, the government announced a 17% GHG reduction target by 2020 (below 2005 levels) under the Copenhagen Accord and, in 2011, Canada formally withdrew from the Kyoto Protocol and its commitment to reduce GHG emissions by 6% below 1990 levels in the first period of 2008-12.
© O
EC
D/IE
A, 2
016
2. General energy policy
33
With a view to implement the 17% by 2020 target, the federal government has been implementing an approach that focuses on regulating domestic GHG emissions on a sector-by-sector basis and that is also aligned with US regulatory decisions. This approach has considered the circumstances of each sector, and tailored regulations to attain significant GHG emissions reduction while maintaining competitiveness. Regulations have already been implemented in the transport and coal-fired electricity sectors, but not yet in the emission-intensive industry sectors. Canada has been co-operating with the US Environmental Protection Agency (EPA) to develop common GHG emission standards for on-road light- and heavy-duty vehicles. In advance of the US, Canada enacted emission performance standards for coal-fired power plants in 2015 (see Chapter 3 on Climate Change for the detailed description of the sector-by-sector regulatory approach).
In May 2015, the federal government announced its Intended Nationally Determined Contribution (INDC). Canada’s INDC states that it intends to achieve an economy-wide target to reduce GHG emissions by 30% below 2005 levels by 2030. As part of its INDC, Canada also announced several additional measures to address GHG emissions.
First, the federal government intends to develop regulations to address methane emitted from the oil and gas sectors and GHG emissions from the production of chemicals and nitrogen fertilizers, which together comprise the largest source of emissions in the country’s manufacturing sector. Secondly, the government announced plans to regulate GHG emissions from natural gas-fired electricity generation. While its intended GHG reduction target for the post-2020 period is not aligned with that of the US, Canada continues to seek regulatory alignment with the US wherever appropriate for competitiveness reasons.
Federal regulatory approaches are being developed through consultation, including with provinces. Provinces can enter into equivalency agreements with the federal government to help avoid regulatory duplication in case the province has an enforceable regulation with an equivalent (or better) outcome. An equivalency agreement will allow the federal regulation to be suspended in that province. The federal government has finalised an equivalency agreement with Nova Scotia in respect of federal coal-fired electricity regulations.
A feature of the Canadian federalism, besides federal targets and regulations, is that provinces and territories are active in the United Nations Framework Convention on Climate Change (UNFCCC); they regularly attend the Conferences of the Parties (COP) and have also put in place energy and climate strategies with targets and various regulatory measures, including regulations and targets to limit venting, flaring and fugitive emissions at upstream oil and gas facilities (as in British Columbia, Alberta, Saskatchewan); a carbon tax (in British Columbia); a regulatory framework for industrial emissions and the Climate Change Emissions Management Fund (Alberta); the renewables support policies in Ontario and Atlantic provinces; the cap-and-trade system in Quebec and proposed in Ontario under the Western Climate Initiative (see Chapter 3 on Climate Change); and an absolute cap on emissions from electricity in Nova Scotia. Ontario has been leading efforts to phase out coal-fired power plants since 2003. Following Regulation O. Reg. 496/07, Ontario has closed its five coal-fired electricity generation stations.
ENERGY TAXATION
The Canadian Constitution provides the federal government with comprehensive taxation powers and considerable flexibility for provinces to raise their own taxes. In practice, the only tax bases that are not typically shared between federal and provincial governments
© O
EC
D/IE
A, 2
016
2. General energy policy
34
are the resource and property tax bases, which the federal government generally does not apply. There is also a degree of sales tax harmonisation between the federal and provincial governments. Intergovernmental arrangements are also in place to improve administrative efficiency on shared tax bases and to narrow the scope of interprovincial tax competition. A federal equalisation transfer to provincial governments compensates in part for differences in provincial fiscal capacity.
Provinces generally have the ownership and control over the development and use of their natural resources, and they levy royalties on their extraction, which are deductible for corporate income tax purposes. With a view to improving business tax competitiveness, Canada has significantly reduced federal general corporate income tax rates, from 29.12% in 2000 to 15% as of 2012, and eliminated the federal capital tax in 2006.
To make it more attractive to build LNG facilities in Canada, an accelerated capital cost allowance (CCA) treatment was announced on 19 February 2015 for assets used in facilities that liquefy natural gas. Liquefaction equipment at an LNG facility will receive an additional 22% allowance that will bring the CCA rate up to 30% for equipment acquired before 2025.
In the area of energy, the federal government provides two income tax incentives to promote investment in clean energy generating equipment that uses renewable energy or energy from waste (e.g., landfill gas, wood waste), or conserves energy (including in the use of fossil fuels). Since the last IEA in-depth review 2009, the scope of these provisions has been expanded to cover additional equipment in areas including water-current energy, district energy, waste heat and waste gasification. The two tax incentives are:
§ Accelerated CCA is provided for clean energy investments under CCA Class 43.2 at 50% per year on a declining balance basis.
§ The Canadian Renewable and Conservation Expense provision allows certain intangible start-up expenses associated with Class 43.2 projects to be deducted in full in the year expenses were incurred or transferred to investors using flow-through shares.
A number of important reforms are under way with respect to the corporate income tax treatment of the oil and gas and mining sectors, consistent with the G-20 commitment to rationalise and phase out inefficient fossil fuel subsidies. The phase-out of the accelerated capital cost allowance for tangible assets in oil-sands projects, announced in Budget 2007, was completed as of 1 January 2015. In addition, since 2009 the government announced the phase-out of several tax preferences for the oil and gas and mining (which includes coal mining) sectors:
§ reduction in the deduction rates for intangible capital expenses in oil-sands projects, in order to align these rates with those applicable in the conventional oil and gas sector (Budget 2011)
§ phase-out of the Atlantic Investment Tax Credit for tangible assets in the oil and gas and mining sectors (Budget 2012)
§ phase-out of the accelerated capital cost allowance for tangible assets in mining projects (Budget 2013)
§ reduction in the deduction rate for pre-production intangible mine development expenses, in order to align the rate for expenses in the mining sector with that applicable in the oil and gas sector (Budget 2013).
© O
EC
D/IE
A, 2
016

2. General energy policy
35
A green levy is imposed on the most fuel-inefficient vehicles used in Canada, with rates ranging from CAD 1 000 to CAD 4 000 per vehicle, based on weighted average fuel consumption (55% city fuel consumption and 45% highway fuel consumption).
Federal excise taxes are imposed on leaded and unleaded gasoline and aviation gasoline, as well as on diesel and aviation fuels. Current excise tax rates are CAD 10 cents per litre for unleaded gasoline and unleaded aviation gasoline, CAD 11 cents per litre for leaded gasoline and leaded aviation gasoline, CAD 4 cents per litre for diesel fuel and aviation fuel (other than aviation gasoline). Diesel fuel that is used as heating oil is exempt. Diesel fuel that is used in the generation of electricity is also exempt, except where the electricity so generated is used primarily in the operation of a vehicle. Individual provinces apply product-specific taxes on fuels at rates that are generally higher than the federal rates and offer a range of tax credits and rebates (see Table 2.2).
Table 2.2 Federal excise taxes and provincial product-specific taxes on gasoline and diesel fuel, April 2015
Fuel taxes Fed. BC AB SK MB ON QC NB NS PEI NL
Gasoline (CAD cents/L) 10.0 14.5 13.0 15.0 14.0 14.7 19.2 15.5 15.5 13.1 16.5
Diesel (CAD cents/L) 4.0 15.0 13.0 15.0 14.0 14.3 20.2 21.5 15.4 20.2 16.5
Source: Finance Canada (2015).
ENERGY DATA
Statistics Canada (StatsCan) is the federal agency responsible for the collection, compilation and dissemination of official statistics in Canada. This includes the collection of supply and demand data for crude oil, natural gas, refined petroleum products, coal and electricity for IEA reporting purposes. The Environment, Energy, Transportation Statistics Division is in charge of the Energy Statistics Program (ESP). StatsCan was established as legal authority under the Statistics Act.
Energy information is used and supplied by StatsCan, NRCan, Environment Canada (EC) and the National Energy Board (NEB) as well as by the statistical offices of the energy departments of the provinces and territories. In addition, the ESP interacts with energy industry associations, as well as international organisations the International Energy Agency, JODI, United Nation Framework Convention on Climate Change (UNFCCC) and the Energy Information Administration.
At the federal level, NRCan collects and analyses energy data, on the basis of StatsCan data and its questionnaires and data surveys. It publishes every year the Energy Market Fact Book. The NEB collects and monitors data on oil, gas, electricity flows and exports/imports, and publishes every two years a supply/demand outlook with projections on different Energy Futures. Regular and emergency oil and natural gas reporting to the IEA is a shared responsibility of NRCan and StatsCan.
Work on the energy data and statistics is tackling new challenges which arise from the shale gas boom and a more and more integrated North American energy market. There are new producers, new products, new energy flows which will require close co-operation with the United States and industry players, keeping up with data sharing through data-sharing agreements, seeking legal authority to ensure that companies or provinces report energy data, and promoting transparency as well as securing continuity of federal programme funding for the data work.
© O
EC
D/IE
A, 2
016
2. General energy policy
36
Against this background and building upon the international co-operation under the Oslo Group created by the United Nations Statistical Commission (UNSC), a new Energy Statistics Framework is being developed for Canada by StatsCan and NRCan. The objective of this framework is to outline a comprehensive and efficient approach to collecting, processing and disseminating energy and related statistics in Canada. The framework is intended to:
§ serve as a foundation for the establishment, maintenance and improvement of the energy statistical system in Canada
§ facilitate communication between data providers, data compilers, and major data users
§ support the identification and prioritisation of data gaps and deficiencies in the current energy statistics programme
§ guide the formulation of strategies to improve Canada's energy statistical system with the goal of providing Canadians with access to relevant, timely, coherent and quality statistical information on energy supply and demand.
In addition, building on the memorandum of understanding (MOU) signed between Canada, the United States and Mexico in December 2014, an enhanced co-operation is envisaged on energy data, statistics and mapping of commodities and infrastructure in North America within NAFTA. Under this MOU, four areas of co-operation were identified:
§ comparing, validating and improving respective energy import and export data
§ sharing publicly available geospatial information related to energy infrastructure
§ exchanging views and information on projections of cross-border energy flows
§ developing a cross-reference for terminology commonly used in the energy sector with a view towards harmonisation of terms, concepts and definitions for energy products and flows, or understanding their differences.
ASSESSMENT
Since the last IEA in-depth review in 2009, Canada has taken action towards developing its natural resources and promoting market diversification, with a set of policies implemented by the provinces and territories, supported by the federal government through the Responsible Resource Development (RRD) plan and the measures supporting a regulatory and tax environment conducive to investment.
The energy policy of the federal government needs to operate on the basis of three main requirements: i) the division of roles and responsibilities under the Canadian federalism, with the jurisdiction of provinces and territories over their natural resources but shared responsibility for many areas of energy; ii) the strong market integration with the US and Mexico within the North American Free Trade Agreement (NAFTA), and iii) the need to meet several energy policy objectives, including market and economic development, environmental sustainability and energy security.
Energy policy at federal level is conditioned by the fact that provincial governments are generally the direct owners and managers of energy resources, for which they collect royalties, and have primary responsibility for electricity sector regulation, land-use planning and regulations on exploration, development, conservation and energy use. Many areas are under shared jurisdiction with the federal government, without a clear
© O
EC
D/IE
A, 2
016
2. General energy policy
37
legal delineation of powers (trade and investment, energy efficiency, environmental regulation, R&D and the offshore). The federal government represents Canadian interests on climate change, nuclear energy safety and security and uranium, interprovincial and international energy trade and infrastructure, and leads the engagement at international level. Co-operation on energy matters mainly takes place through the annual Energy and Mines Ministers’ Conference (EMMC) and the Canadian Council of Ministers of the Environment (CCME) as the principal forum for Canada’s federal, provincial and territorial governments to collaborate and align efforts on shared energy priorities and to clarify the complementary roles of the federal, provincial and territorial governments.
Since the previous review in 2009, the federal government has engaged with provinces to improve the efficiency and effectiveness of regulatory reviews, advance energy efficiency rules and enhance the safety of maritime, rail and pipeline transportation, under the Responsible Resource Development Plan. Recent EMMC have focused on energy R&D and innovation, energy transportation, electricity reliability, energy efficiency and renewable energy. However, energy infrastructure projects and the project reviews face criticism from the local communities and international partners.
Given the dynamic regulatory, energy markets and legislative landscape across North America, Canada and the US have been working closely through the Clean Energy Dialogue and the North American Energy Ministers Dialogue. On the climate agenda, there are further opportunities from such co-operation for reducing emissions in the transport sector across North America by harmonising standards for the use of natural gas and electric vehicles, exchange of experience in unconventional oil and gas production, and safety and reliability co-operation.
And many policy challenges need to be addressed at the regional level, including climate change mitigation and adaptation, energy trade, oil transportation and resilience of the energy infrastructure. Within the North American Free Trade Agreement (NAFTA), in May 2015 the trilateral Climate Change and Energy Working Group was created involving the energy ministers of the United States, Canada and Mexico. As part of the memorandum of understanding (MOU) signed between Canada, the United States and Mexico in December 2014, an enhanced co-operation is also envisaged on energy data, statistics and mapping of commodities and infrastructure in North America within NAFTA. The IEA welcomes the Trilateral Working Group as a milestone towards an enhanced co-operation in energy markets.
The IEA encourages the government of Canada to discuss under the trilateral co-operation within NAFTA and in collaboration with provincial governments, energy data, energy infrastructure investment, market access to the US and Asia-Pacific markets, securing transparency of energy market information, fostering energy trade and safety of transportation.
In 2009, the IEA review called for greater leadership at the federal level in putting forward a Canadian climate strategy. To date, the federal government, by taking a sector-by-sector regulatory approach, has addressed emissions in the transport and electricity generation sectors and has announced its intention to regulate other sectors of the Canadian economy. However, no climate strategy has been adopted that would bring together provincial-territorial and federal objectives. Mechanisms for collective action on meeting the climate targets will be needed, if Canada wants to meet its climate commitments, including the GHG emission target set for 2020 and the target of 30% reduction by 2030.
© O
EC
D/IE
A, 2
016
2. General energy policy
38
Since 2007, Canadian Premiers have been working on a longer-term energy strategy for Canada which would balance climate and energy objectives. A success in this respect is the Canadian Energy Strategy (CES) which was adopted in July 2015 by the Premiers of the provinces and territories under the Council of the Federation, where the federal government had not been present. The IEA encourages the federal authorities to have an active engagement with the Council of the Federation on the implementation of the CES. The federal government should seek opportunities to work with provinces and territories and take the lead in areas of federal jurisdiction and devise mechanisms for co-operation and consultation on international energy policy. In particular, working to develop shared environmental, resource and economic goals in the follow-up to COP21 in Paris December 2015 can provide a longer-term outlook for investment in low-carbon energy sources, including renewable energy sources, and balance climate and energy policies and resource production goals. Such an approach can foster trust in Canada as responsible energy supplier and user and help building public confidence in the new energy infrastructure projects at home and abroad.
RECOMMENDATIONS
The government of Canada should:
o Take action to implement Canada’s climate target for 2030 with a view to strengthen its role as responsible energy supplier and user. Building on the 2015 Canadian Energy Strategy, devise at federal level mechanisms for provincial and territorial governments’ co-operation to collectively meet its target of reducing emissions by 30% by 2030, to improve energy efficiency, and interconnections, and to develop renewable and other low-carbon energy technologies.
o Monitor the implementation of the work under the Responsible Resource Development Plan and consider additional measures, as necessary, to facilitate investment in future energy projects, including further advancing the monitoring, compliance with, and enforcement of, high standards of environmental performance and safety, public consultation and transparency of information.
o With the objective of ensuring access to markets and the diversification of export markets for Canadian products, technologies and services, continue to work with international partners (such as the United States, China and India).
o Under the new Energy Statistics Framework, continue the work with provinces, provincial-level regulators, the energy industry and trade partners (United States, Mexico) to improve reporting, timeliness, coverage, quality and transparency of relevant energy data in a fast growing North American energy market.
o Take leadership to increase co-operation across Canada and within NAFTA, on energy data, safety and reliability, unconventional oil and gas production, and environmental rules for the transportation and trade of energy commodities.
References Angus, D. (2012), Now or never: Canada must act urgently to seize its place in the new energy world order, Senate Committee on Energy, the Environment and Natural Resources, Ottawa.
© O
EC
D/IE
A, 2
016
2. General energy policy
39
CoF (Council of the Federation), (2015), Canadian Energy Strategy, July, at: www.pmprovincesterritoires.ca/phocadownload/publications/canadian_energy_strategy_eng_fnl.pdf
Eyford, D. (2013), Forging Partnerships, Building Relationships, Aboriginal Canadians and Energy Development, Report to the Prime Minister.
IEA (International Energy Agency) (2015), Energy Balances of OECD Countries, www.iea.org/statistics/, OECD/IEA, Paris.
OECD (Organisation for Economic Co-operation and Development), (2014), OECD Economic Surveys: Canada 2014, OECD, Paris.
Heelan Powel, B. (2014), An Overview of Bill C-38: The Budget Bill that Transformed Canada’s Federal Environmental Laws, Environmental Law Centre, Alberta.
Natural Resources Canada (NRCan), (2012), Evaluation of the Major Projects Management Office Initiative (MPMOI), at: https://www.nrcan.gc.ca/evaluation/reports/2012/786.
© O
EC
D/IE
A, 2
016

©
OE
CD
/IEA
, 201
6
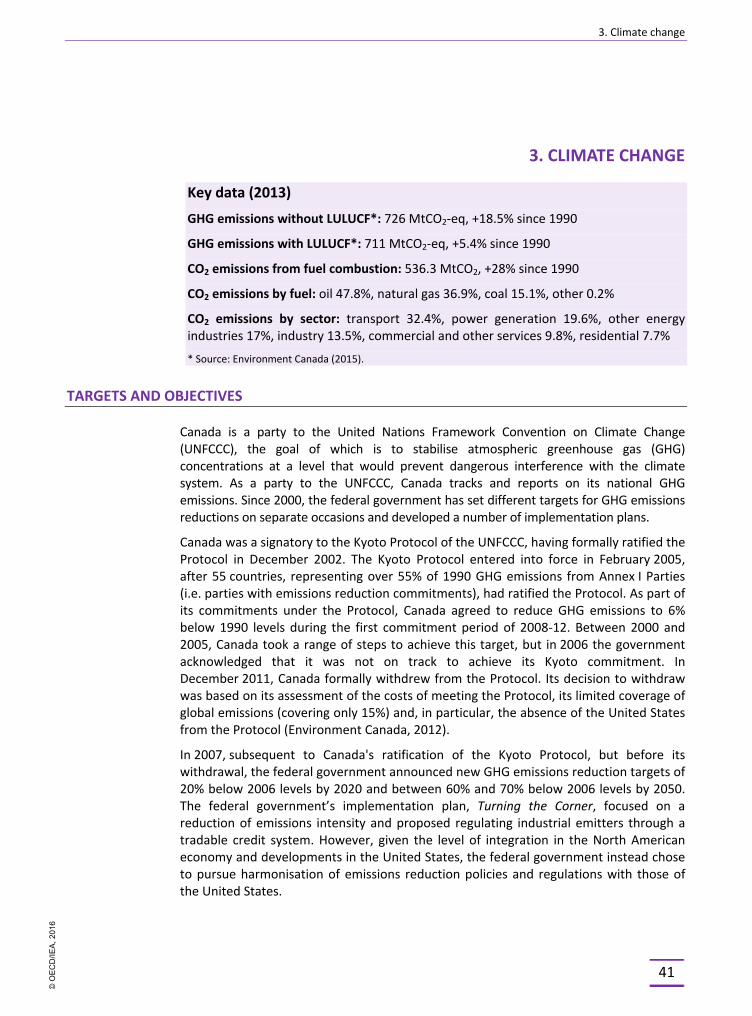
3. Climate change
41
3. CLIMATE CHANGE
Key data (2013)
GHG emissions without LULUCF*: 726 MtCO2-eq, +18.5% since 1990
GHG emissions with LULUCF*: 711 MtCO2-eq, +5.4% since 1990
CO2 emissions from fuel combustion: 536.3 MtCO2, +28% since 1990
CO2 emissions by fuel: oil 47.8%, natural gas 36.9%, coal 15.1%, other 0.2%
CO2 emissions by sector: transport 32.4%, power generation 19.6%, other energy industries 17%, industry 13.5%, commercial and other services 9.8%, residential 7.7%
* Source: Environment Canada (2015).
TARGETS AND OBJECTIVES
Canada is a party to the United Nations Framework Convention on Climate Change (UNFCCC), the goal of which is to stabilise atmospheric greenhouse gas (GHG) concentrations at a level that would prevent dangerous interference with the climate system. As a party to the UNFCCC, Canada tracks and reports on its national GHG emissions. Since 2000, the federal government has set different targets for GHG emissions reductions on separate occasions and developed a number of implementation plans.
Canada was a signatory to the Kyoto Protocol of the UNFCCC, having formally ratified the Protocol in December 2002. The Kyoto Protocol entered into force in February 2005, after 55 countries, representing over 55% of 1990 GHG emissions from Annex I Parties (i.e. parties with emissions reduction commitments), had ratified the Protocol. As part of its commitments under the Protocol, Canada agreed to reduce GHG emissions to 6% below 1990 levels during the first commitment period of 2008-12. Between 2000 and 2005, Canada took a range of steps to achieve this target, but in 2006 the government acknowledged that it was not on track to achieve its Kyoto commitment. In December 2011, Canada formally withdrew from the Protocol. Its decision to withdraw was based on its assessment of the costs of meeting the Protocol, its limited coverage of global emissions (covering only 15%) and, in particular, the absence of the United States from the Protocol (Environment Canada, 2012).
In 2007, subsequent to Canada's ratification of the Kyoto Protocol, but before its withdrawal, the federal government announced new GHG emissions reduction targets of 20% below 2006 levels by 2020 and between 60% and 70% below 2006 levels by 2050. The federal government’s implementation plan, Turning the Corner, focused on a reduction of emissions intensity and proposed regulating industrial emitters through a tradable credit system. However, given the level of integration in the North American economy and developments in the United States, the federal government instead chose to pursue harmonisation of emissions reduction policies and regulations with those of the United States.
© O
EC
D/IE
A, 2
016
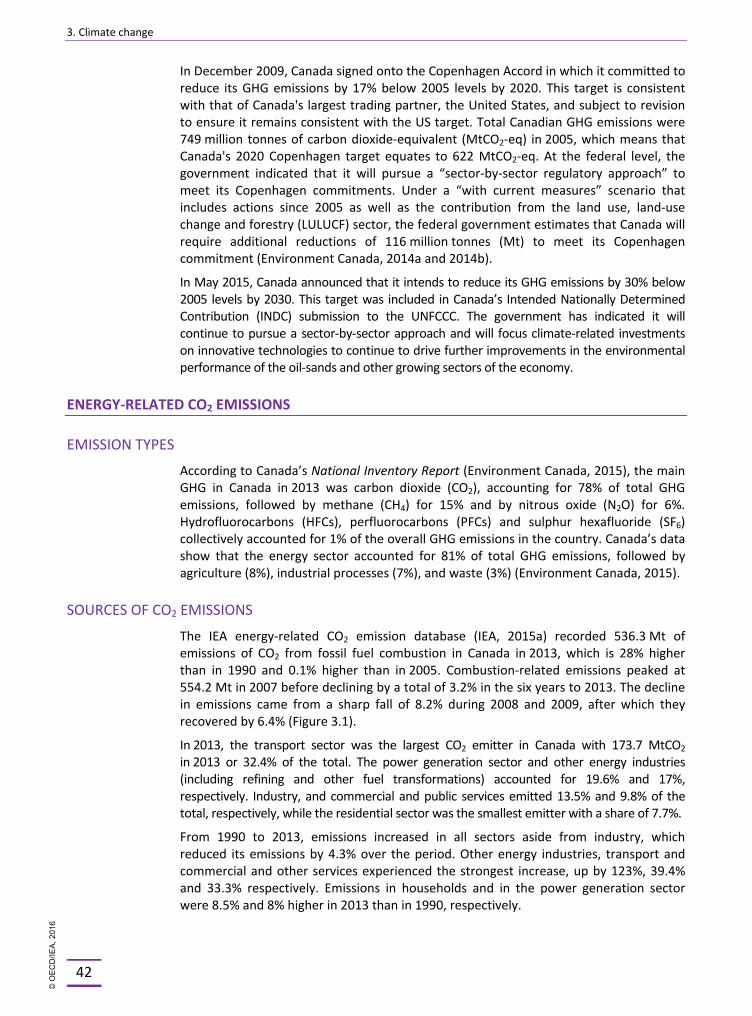
3. Climate change
42
In December 2009, Canada signed onto the Copenhagen Accord in which it committed to reduce its GHG emissions by 17% below 2005 levels by 2020. This target is consistent with that of Canada's largest trading partner, the United States, and subject to revision to ensure it remains consistent with the US target. Total Canadian GHG emissions were 749 million tonnes of carbon dioxide-equivalent (MtCO2-eq) in 2005, which means that Canada's 2020 Copenhagen target equates to 622 MtCO2-eq. At the federal level, the government indicated that it will pursue a “sector-by-sector regulatory approach” to meet its Copenhagen commitments. Under a “with current measures” scenario that includes actions since 2005 as well as the contribution from the land use, land-use change and forestry (LULUCF) sector, the federal government estimates that Canada will require additional reductions of 116 million tonnes (Mt) to meet its Copenhagen commitment (Environment Canada, 2014a and 2014b).
In May 2015, Canada announced that it intends to reduce its GHG emissions by 30% below 2005 levels by 2030. This target was included in Canada’s Intended Nationally Determined Contribution (INDC) submission to the UNFCCC. The government has indicated it will continue to pursue a sector-by-sector approach and will focus climate-related investments on innovative technologies to continue to drive further improvements in the environmental performance of the oil-sands and other growing sectors of the economy.
ENERGY-RELATED CO2 EMISSIONS
EMISSION TYPES
According to Canada’s National Inventory Report (Environment Canada, 2015), the main GHG in Canada in 2013 was carbon dioxide (CO2), accounting for 78% of total GHG emissions, followed by methane (CH4) for 15% and by nitrous oxide (N2O) for 6%. Hydrofluorocarbons (HFCs), perfluorocarbons (PFCs) and sulphur hexafluoride (SF6) collectively accounted for 1% of the overall GHG emissions in the country. Canada’s data show that the energy sector accounted for 81% of total GHG emissions, followed by agriculture (8%), industrial processes (7%), and waste (3%) (Environment Canada, 2015).
SOURCES OF CO2 EMISSIONS
The IEA energy-related CO2 emission database (IEA, 2015a) recorded 536.3 Mt of emissions of CO2 from fossil fuel combustion in Canada in 2013, which is 28% higher than in 1990 and 0.1% higher than in 2005. Combustion-related emissions peaked at 554.2 Mt in 2007 before declining by a total of 3.2% in the six years to 2013. The decline in emissions came from a sharp fall of 8.2% during 2008 and 2009, after which they recovered by 6.4% (Figure 3.1).
In 2013, the transport sector was the largest CO2 emitter in Canada with 173.7 MtCO2 in 2013 or 32.4% of the total. The power generation sector and other energy industries (including refining and other fuel transformations) accounted for 19.6% and 17%, respectively. Industry, and commercial and public services emitted 13.5% and 9.8% of the total, respectively, while the residential sector was the smallest emitter with a share of 7.7%.
From 1990 to 2013, emissions increased in all sectors aside from industry, which reduced its emissions by 4.3% over the period. Other energy industries, transport and commercial and other services experienced the strongest increase, up by 123%, 39.4% and 33.3% respectively. Emissions in households and in the power generation sector were 8.5% and 8% higher in 2013 than in 1990, respectively.
© O
EC
D/IE
A, 2
016
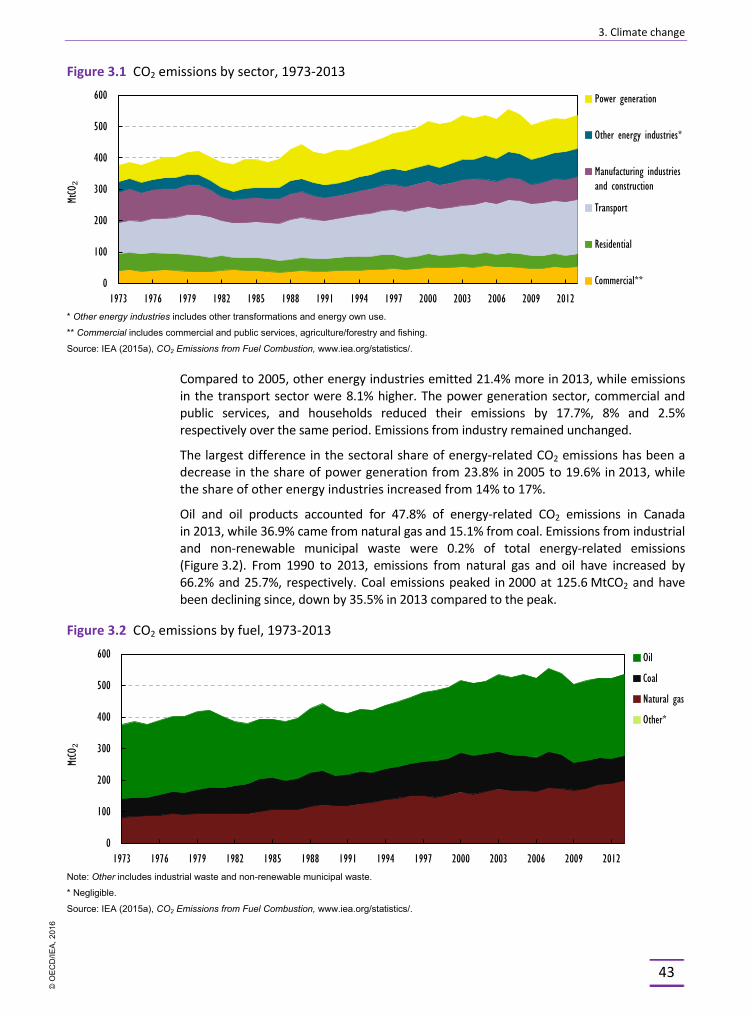
3. Climate change
43
Figure 3.1 CO2 emissions by sector, 1973-2013
* Other energy industries includes other transformations and energy own use.
** Commercial includes commercial and public services, agriculture/forestry and fishing.
Source: IEA (2015a), CO2 Emissions from Fuel Combustion, www.iea.org/statistics/.
Compared to 2005, other energy industries emitted 21.4% more in 2013, while emissions in the transport sector were 8.1% higher. The power generation sector, commercial and public services, and households reduced their emissions by 17.7%, 8% and 2.5% respectively over the same period. Emissions from industry remained unchanged.
The largest difference in the sectoral share of energy-related CO2 emissions has been a decrease in the share of power generation from 23.8% in 2005 to 19.6% in 2013, while the share of other energy industries increased from 14% to 17%.
Oil and oil products accounted for 47.8% of energy-related CO2 emissions in Canada in 2013, while 36.9% came from natural gas and 15.1% from coal. Emissions from industrial and non-renewable municipal waste were 0.2% of total energy-related emissions (Figure 3.2). From 1990 to 2013, emissions from natural gas and oil have increased by 66.2% and 25.7%, respectively. Coal emissions peaked in 2000 at 125.6 MtCO2 and have been declining since, down by 35.5% in 2013 compared to the peak.
Figure 3.2 CO2 emissions by fuel, 1973-2013
Note: Other includes industrial waste and non-renewable municipal waste.
* Negligible.
Source: IEA (2015a), CO2 Emissions from Fuel Combustion, www.iea.org/statistics/.
0
100
200
300
400
500
600
1973 1976 1979 1982 1985 1988 1991 1994 1997 2000 2003 2006 2009 2012
MtCO₂
Power generation
Other energy industries*
Manufacturing industriesand construction
Transport
Residential
Commercial**
0
100
200
300
400
500
600
1973 1976 1979 1982 1985 1988 1991 1994 1997 2000 2003 2006 2009 2012
MtCO₂
Oil
Coal
Natural gas
Other*
© O
EC
D/IE
A, 2
016
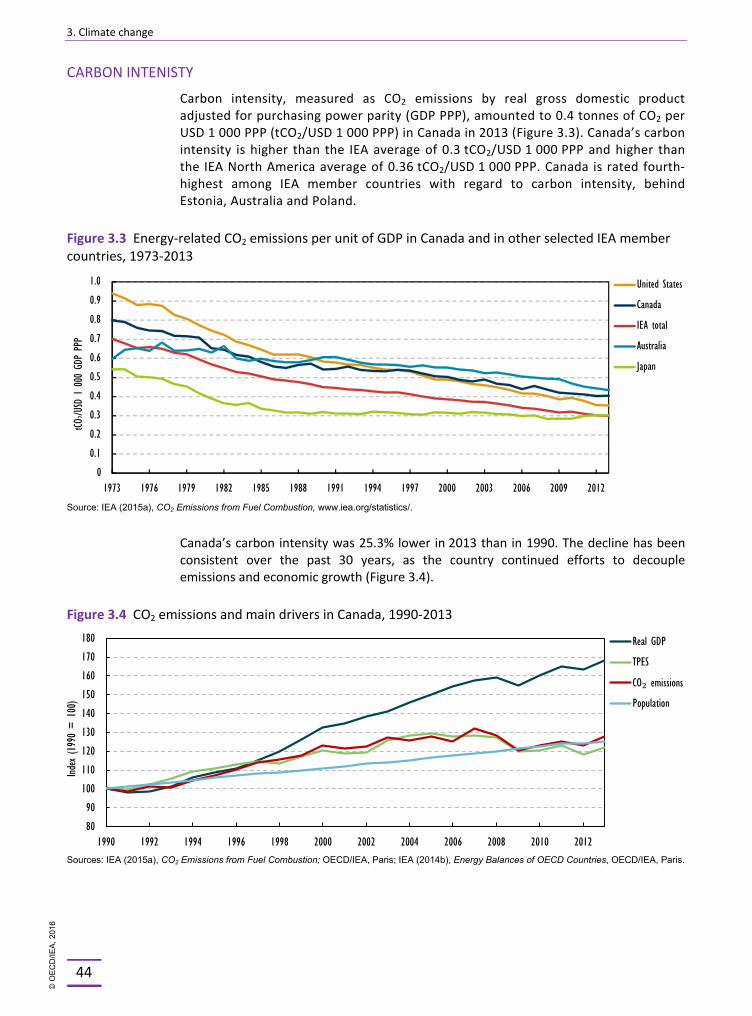
3. Climate change
44
CARBON INTENISTY
Carbon intensity, measured as CO2 emissions by real gross domestic product adjusted for purchasing power parity (GDP PPP), amounted to 0.4 tonnes of CO2 per USD 1 000 PPP (tCO2/USD 1 000 PPP) in Canada in 2013 (Figure 3.3). Canada’s carbon intensity is higher than the IEA average of 0.3 tCO2/USD 1 000 PPP and higher than the IEA North America average of 0.36 tCO2/USD 1 000 PPP. Canada is rated fourth-highest among IEA member countries with regard to carbon intensity, behind Estonia, Australia and Poland.
Figure 3.3 Energy-related CO2 emissions per unit of GDP in Canada and in other selected IEA member countries, 1973-2013
Source: IEA (2015a), CO2 Emissions from Fuel Combustion, www.iea.org/statistics/.
Canada’s carbon intensity was 25.3% lower in 2013 than in 1990. The decline has been consistent over the past 30 years, as the country continued efforts to decouple emissions and economic growth (Figure 3.4).
Figure 3.4 CO2 emissions and main drivers in Canada, 1990-2013
Sources: IEA (2015a), CO2 Emissions from Fuel Combustion; OECD/IEA, Paris; IEA (2014b), Energy Balances of OECD Countries, OECD/IEA, Paris.
80
90
100
110
120
130
140
150
160
170
180
1990 1992 1994 1996 1998 2000 2002 2004 2006 2008 2010 2012
Index (1
990
= 1
00)
Real GDP
TPES
CO₂ emissions
Population
0.0 0.1 0.2 0.3 0.4 0.5 0.6 0.7 0.8 0.9 1.0
1973 1976 1979 1982 1985 1988 1991 1994 1997 2000 2003 2006 2009 2012
tCO2/U
SD 1
000
GDP
PPP
United States Canada IEA total Australia Japan
0 0
© O
EC
D/IE
A, 2
016
3. Climate change
45
INSTITUTIONS
Two orders of government have been created in the Canadian Constitution: a central federal government and provincial governments, the latter having powers specifically assigned in the Constitution.1 The division of competences between the federal and provincial governments makes them effectively coequal in order (Krupa, 2011). The provinces have jurisdiction over, for example, property and civil rights, education, and natural resources within their boundaries. The federal government, on the other hand, has jurisdiction over, among other things, foreign affairs, trade and commerce, nuclear energy, and interprovincial works. While this split may seem rather concrete, there are many areas of shared jurisdiction, in this case, the most relevant being the environment (and GHG emissions). At the federal level, several institutions are involved in developing and implementing climate policies.
Environment Canada (EC) – Within the federal government, the Minister of the Environment and Climate Change (since November 2015) is the lead minister for domestic and international climate change mitigation and adaptation policies and is responsible for the direct regulation of GHG and air pollutant emissions (e.g. from industrial and some transportation sources such as on-road and off-road vehicles) and conservation and protection of the environment. Under the Department of the Environment Act, the powers, duties and functions of the Minister of the Environment extend to and include matters relating to the preservation and enhancement of the quality of the natural environment; renewable resources; and co-ordination of the policies and programmes of the government in these areas among others. EC’s statutory responsibilities for GHG measures and regulations are found primarily in the Canadian Environmental Protection Act 1999 (CEPA).
Natural Resources Canada (NRCan) – NRCan seeks to enhance the responsible development and use of Canada’s natural resources and the competitiveness of its natural resources products. NRCan sets federal energy policy and administers many programmes on clean energy supply and energy demand reduction. It also delivers programmes and provides expertise on climate change impacts and adaptation and on clean energy technology. The Canadian Forest Service within NRCan provides climate change mitigation and adaptation expertise in the forestry sector. NRCan is also involved in the development of policy options on international climate change, particularly on technology, land-use and deforestation.
Transport Canada (TC) – Transport Canada supports the federal government's environmental agenda through policies, regulations and programmes that work to reduce the harmful impact of rail, aviation and marine transportation sectors on Canada's air and water.
Aboriginal Affairs and Northern Development Canada (AANDC) – AANDC works with Aboriginal and northern communities across Canada to address both short-term and long-term climate change adaptation and energy-related issues. The department assists Aboriginal and northern communities in adapting to the effects of a changing climate and in developing sustainable forms of energy that reduce GHG emissions.
1. The territories are under the constitutional authority of the federal government, although, in practice, they have the authority to self-governance.
© O
EC
D/IE
A, 2
016
3. Climate change
46
At the provincial level, the bodies responsible for climate policy vary. The government of Canada works multilaterally with the provinces and territories on climate change policy primarily through the Canadian Council of Ministers of the Environment (CCME). A new Climate Change Committee has recently been established within CCME. Provinces and territories also engage on a multilateral and bilateral basis and with neighbouring US states to co-ordinate climate policies. Provinces, as resource owners and regulators, play a key role in environmental regulation and are taking action to regulate GHG emissions within their jurisdiction.
POLICIES AND MEASURES
The shared jurisdiction over environmental matters means that policies and measures to reduce emissions are in place at both the federal and provincial levels. Federal policies to address GHG emissions are underpinned by several legislative instruments, most notably by the CEPA 1999, which includes authority to regulate GHG emissions and, indirectly, the Energy Efficiency Act (1992) which provides authority to regulate minimum energy efficiency standards for energy-consuming products, product labelling, and collection of data on energy use. As noted earlier, most GHG-focused federal regulations have taken the form of sector-specific, intensity-based standards derived from authorities under CEPA 1999.
In May 2015, to support Canada’s Intended Nationally Determined Contribution (INDC), the federal government announced its intent to develop additional regulatory measures under CEPA 1999 to address GHG emissions. The focus is on emissions of CO2 and methane which together constitute 93% of Canadian GHG emissions. These regulations will address: methane emissions from the oil and gas sectors; GHG emissions from the production of chemicals and nitrogen fertilizers (two of the largest sources of emissions from the manufacturing sector) and GHG emissions from natural gas-fired electricity generation. In autumn 2014, the federal government announced its intention to regulate the manufacture, import and use of hydrofluorocarbons (HFCs) under CEPA 1999. The regulations for methane emissions from oil and gas and HFCs will be aligned with similar action and possible forthcoming regulations in the United States.
At the provincial level, the focus of emissions reduction policies and their form vary according to individual priorities and specific circumstances. Four provinces – Alberta, British Columbia, Ontario and Quebec – have moved forward with carbon pricing schemes. Provinces are also taking action focused on low-carbon innovation and technology development, and on local adaptation to a changing climate.
Overall provincial and territorial emissions reduction targets are provided in Table 3.1, along with the total and per-capita GHG emissions in 2005 and 2013. In 2013, per capita emissions range from a low of 10 tonnes of carbon dioxide per capita (tCO2/capita) in the province of Quebec – principally as the result of an electricity system dominated by hydroelectric electricity – to a high of 68 tCO2/capita in the province of Saskatchewan – mainly explained by a small population with an economy based on mining, oil and gas, and agriculture.
Environment Canada develops regulations through active consultation with the provinces (and others) and co-ordinates with the provinces in implementation. For example, provinces can enter into equivalency agreements with the federal government to avoid regulatory duplication where the province has an enforceable regulation with
© O
EC
D/IE
A, 2
016
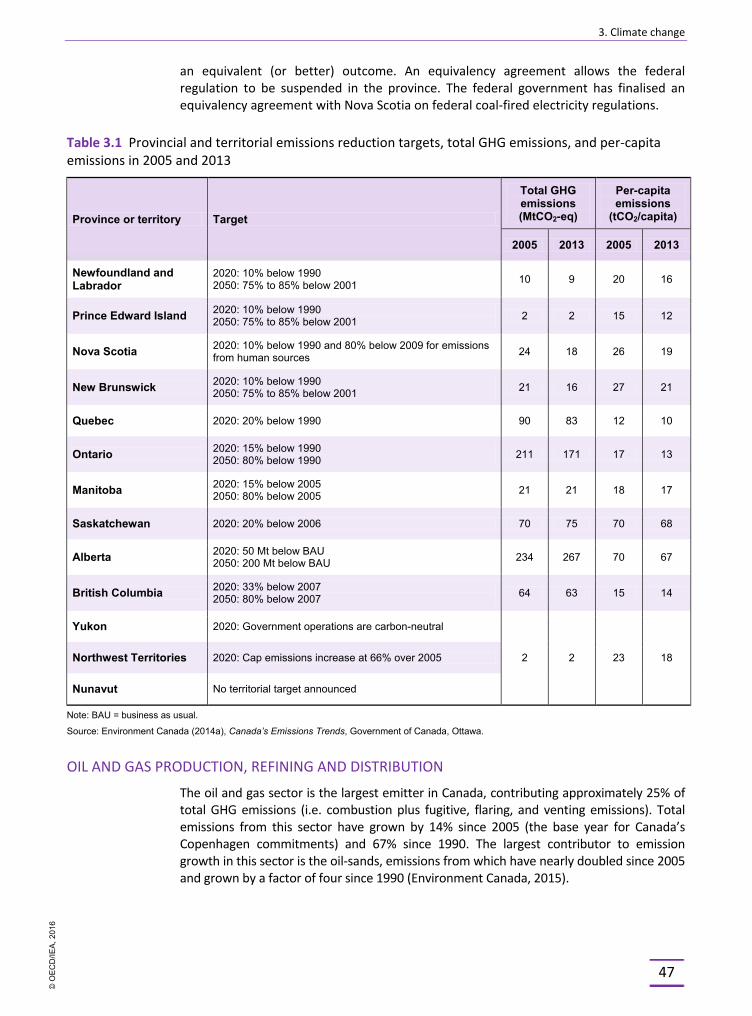
3. Climate change
47
an equivalent (or better) outcome. An equivalency agreement allows the federal regulation to be suspended in the province. The federal government has finalised an equivalency agreement with Nova Scotia on federal coal-fired electricity regulations.
Table 3.1 Provincial and territorial emissions reduction targets, total GHG emissions, and per-capita emissions in 2005 and 2013
Province or territory Target
Total GHG emissions (MtCO2-eq)
Per-capita emissions
(tCO2/capita)
2005 2013 2005 2013
Newfoundland and Labrador
2020: 10% below 1990 2050: 75% to 85% below 2001 10 9 20 16
Prince Edward Island 2020: 10% below 1990 2050: 75% to 85% below 2001 2 2 15 12
Nova Scotia 2020: 10% below 1990 and 80% below 2009 for emissions from human sources 24 18 26 19
New Brunswick 2020: 10% below 1990 2050: 75% to 85% below 2001 21 16 27 21
Quebec 2020: 20% below 1990 90 83 12 10
Ontario 2020: 15% below 1990 2050: 80% below 1990 211 171 17 13
Manitoba 2020: 15% below 2005 2050: 80% below 2005 21 21 18 17
Saskatchewan 2020: 20% below 2006 70 75 70 68
Alberta 2020: 50 Mt below BAU 2050: 200 Mt below BAU 234 267 70 67
British Columbia 2020: 33% below 2007 2050: 80% below 2007 64 63 15 14
Yukon 2020: Government operations are carbon-neutral
2 2 23 18 Northwest Territories 2020: Cap emissions increase at 66% over 2005
Nunavut No territorial target announced
Note: BAU = business as usual.
Source: Environment Canada (2014a), Canada’s Emissions Trends, Government of Canada, Ottawa.
OIL AND GAS PRODUCTION, REFINING AND DISTRIBUTION
The oil and gas sector is the largest emitter in Canada, contributing approximately 25% of total GHG emissions (i.e. combustion plus fugitive, flaring, and venting emissions). Total emissions from this sector have grown by 14% since 2005 (the base year for Canada’s Copenhagen commitments) and 67% since 1990. The largest contributor to emission growth in this sector is the oil-sands, emissions from which have nearly doubled since 2005 and grown by a factor of four since 1990 (Environment Canada, 2015).
© O
EC
D/IE
A, 2
016

3. Climate change
48
In 2013, emissions from oil sands production (both mining and in situ) and upgrading contributed 9% of national GHG emissions (Environment Canada, 2015). Growth in oil-sands emissions has been the result of strong production growth, and offset by a long-term decline in the GHG emissions intensity of oil-sands production. However, more recently, emissions intensity has plateaued as production has shifted from mining to in situ production (Evans and Bryant, 2013). Under current policies, Environment Canada (2014a) expects emissions from oil-sands operations to be more than three times those in 2005 by 2020, resulting in an almost 30% increase in oil and gas sector GHG emissions over 2005.
The government of Canada first announced its intention to regulate emissions from the oil and gas sectors in 2006. Since then, the regulations have been in development and their public release repeatedly delayed (Office of the Auditor General of Canada, 2014). The government of Canada has not publicly disclosed a timeline for publication or implementation of the regulations, but has stated that it intends to move forward on these regulations in parallel with equivalent regulations in the United States. Three-quarters of all oil production, almost all gas production, and over two-thirds of Canadian refining capacity is subject to provincial carbon pricing schemes (as discussed below), however their impact towards meeting climate targets has been limited so far. At the provincial level, a number of governments, including British Columbia, Alberta and Saskatchewan, have established requirements that limit venting, flaring and fugitive emissions at upstream oil and gas facilities. These will not only reduce GHG emissions, but also have positive impacts on local and regional air quality.
These regulations are partially the basis for best practices promoted by the World Bank-sponsored Global Gas Flaring Reduction Partnership, which works to monitor and reduce gas flaring associated with oil and gas production worldwide (GGFR, 2009). The government of Canada and the provincial governments of Alberta and Saskatchewan have made substantial investments in carbon capture and storage (CCS) projects. These CCS projects are expected to contribute directly to reducing emissions, as well as building confidence in the future use of CCS technology in the oil and gas sector (e.g. the Shell Quest project and Alberta Carbon Trunk Line) and electricity generation (e.g. the SaskPower Boundary Dam project) while reducing the cost of this technology. Working collaboratively, the federal and provincial governments of Alberta, Saskatchewan and British Columbia have invested over CAD 1.8 billion in carbon capture and storage (CCS).
TRANSPORT
Transport is the second-largest contributor to Canadian GHG emissions and emissions from road transport have been the largest contributor to long-term (i.e. since 1990) growth in Canadian GHG emissions. Road transport is, thus, an important focus for emissions reduction policies. Working in collaboration with the US Environmental Protection Agency (EPA), the federal government has developed common GHG emission standards for on-road light- and heavy-duty vehicles. The alignment of standards between the two neighbours is important given the highly integrated North American automotive market. Standards in place for new cars and light trucks of the 2011-2016 model years are expected to result in emissions reductions of about 10 MtCO2-eq per year by 2020. More stringent standards were proposed in 2012 for model years 2017-2025, and finalised in September 2014. These initiatives are expected to reduce GHG emissions from 2025 model year cars and light trucks by about 50% compared to 2008 models.
© O
EC
D/IE
A, 2
016
3. Climate change
49
Standards in place for on-road heavy-duty vehicles and engines of the 2014-2018 model years are expected to reduce GHG emissions from 2018 model-year heavy-duty vehicles by up to 23%. The federal government has also announced that it intends to further regulate GHG emissions from post-2018 model year on-road heavy-duty vehicles.
The federal government is also developing or implementing measures for other modes of transport:
§ Aviation – Canada is encouraging all segments of the Canadian aviation sector, from airlines and airports to air traffic navigation and aircraft manufacturers, to improve fuel efficiency from a 2005 baseline by an average rate of at least 2% per year until 2020 as part of the Action Plan to Reduce GHG Emissions from Aviation. The Action Plan forms the basis for the federal government’s response to the International Civil Aviation Organization’s (ICAO) Assembly Resolution A37-19, which encouraged member states to submit national action plans by June 2012 setting out measures each state is taking or will take to address international aviation emissions. Canada is also participating in the development of an international CO2 standard for new airplanes and a market-based measure for international civil aviation through ICAO.
§ Rail – Canada is partnering with the U.S. Environmental Protection Agency in the Regulatory Cooperation Council Locomotive Emissions Initiative to develop voluntary strategies to reduce GHG emissions from locomotives. Among other elements, a Canadian industry-government memorandum of understanding that includes measures, targets and actions to reduce GHG emission intensity from rail operations was signed in 2013 as part of this initiative. The initiative also involves work towards a Canada–US industry-government voluntary action plan to reduce GHG emissions from locomotives.
§ Marine – Canada has enacted national regulations to implement new energy efficiency requirements negotiated under Annex VI of the International Maritime Organization’s (IMO) International Convention for the Prevention of Pollution from Ships (MARPOL, short for marine pollution). The regulations require all vessels of 400 gross tonnage and above to monitor their fuel efficiency via a Ship Energy Efficiency Management Plan, which is intended to induce ship-owners and operators to consider new technologies and operational practices when seeking to optimise the performance of their vessels, thereby reducing GHG emissions. Additionally, under the regulations, the Energy Efficiency Design Index (EEDI) requires new vessels of 400 gross tonnage and above to meet progressively more stringent minimum energy efficiency standards from 2015 onwards, thereby increasing energy efficiency by up to 30% by 2025. EEDI requirements do not apply to domestic vessels voyaging only in Canadian waters, as it was found that applying these standards to domestic vessels, which are smaller and face different operational conditions compared to ocean-going vessels, could result in safety issues and increased emissions. Finally, the Shore Power Technology for Ports Program provides cost-shared funding for the deployment of marine shore power technology at Canadian ports. This technology allows ships to plug into the local electrical grid to power the vessel instead of using their auxiliary diesel engines when docked.
In the area of transport fuels, the federal Renewable Fuels Regulations (2010) require fuel producers and importers to have an annual average renewable fuel content of at least 5% by volume of gasoline and at least 2% by volume of diesel fuel and heating distillate oil that they produce or import. The Renewable Fuels Regulations are a key element of the government's Renewable Fuels Strategy and, in combination with comparable provincial requirements, are expected to lead to GHG emissions reductions of approximately 4 MtCO2 per year by 2020.
© O
EC
D/IE
A, 2
016

3. Climate change
50
The provinces of British Columbia and Alberta have implemented fuel standards that explicitly seek to reduce emissions from transport fuels. In the case of British Columbia, this is through a combination of requirements to use lower-carbon intensity fuels and renewable fuels; while in Alberta, this is achieved by a blending mandate for lower GHG-intensity renewable fuels. The provinces of Saskatchewan, Manitoba and Ontario have requirements for ethanol (or other renewable) blending that could, depending on the source of fuel, result in emissions reductions. In addition, British Columbia (BC), Manitoba and Ontario have incentives for hybrid and full electric vehicles and associated infrastructure. Rather than focus on reducing the GHG emissions intensity of liquid fuels, Quebec has chosen to focus on increasing the use of electric vehicles in both private and public transport, and develop electric vehicle charging infrastructure.
In addition to these voluntary standards, regulatory measures and funding programmes, the federal government also supports testing and evaluation of, as well as knowledge sharing about environmental and safety performance of advanced light-duty vehicle and heavy-duty vehicle technologies through the ecoTECHNOLOGY for Vehicles programme. The ecoTECHNOLOGY programme is not expected to directly result in emissions reductions; however, it will inform the development of Canada’s regulations on light-duty and heavy-duty vehicles’ GHG emissions and help more low-emission vehicle technologies to enter the Canadian market.
ELECTRICITY GENERATION
Electric power generation is the fourth-largest emissions source in Canada. Emissions from power generation peaked around 2000, and have since fallen below their 1990 level. The emissions intensity of electric power generation has fallen substantially since 1990 as a result of growth in generation from renewable sources and of a shift away from coal towards natural gas, reaching around 150 grams of carbon dioxide per kilowatt-hour (gCO2 per kWh) – about two-thirds lower than the OECD average. The fall in emissions intensity has more than offset a 30% increase in demand for electricity since 1990. The reduction in emissions intensity of electricity generation is expected to continue as a result of new regulations on coal-fired generation that were published in 2012 and came into effect in July 2015. These regulations apply a performance standard of 420 tCO2 per gigawatt-hour (GWh) of net generation to new coal-fired electricity generation units and to existing units that have reached the end of their useful life. For coal-fired units, these standards can be met by applying carbon capture and storage (CCS) technology. Thus, Canada was the first major coal user to effectively ban the construction of coal-fired electricity generation units without CCS. The regulations contain a number of provisions to provide flexibility for new and end-of-life units incorporating CCS. For example, these units can apply for a temporary deferral from the application of the performance standard until 31 December 2024. These regulations are expected to reduce direct GHG emissions by 3 MtCO2 per year by 2020, and a cumulative reduction of approximately 214 MtCO2-eq of GHG emissions over the period 2015–35 (for further detail, see Chapter 7 on Coal).
As noted earlier, as part of Canada’s INDC, the federal government has also announced its intent to regulate GHG emissions from natural gas-fired electricity generation. The aim of these regulations is to address growth in emissions from natural gas-fired electricity by ensuring that new natural gas-fired equipment is efficient, as well as provide regulatory certainty for investment into generating capacity.
© O
EC
D/IE
A, 2
016
3. Climate change
51
The provinces have taken varying approaches to emissions reduction policies from electricity generation as a result of their differing resource bases. Examples of GHG emissions reduction measures being taken by the provinces that are specific to the electricity sector include:
§ The province of Ontario has mandated the cessation of all coal-fired electricity generation. In April 2014, Ontario’s last coal-fired electricity generating facility shut down, and there is no longer any coal-fired generation in Ontario. The Ontario government estimates that this policy will reduce GHG emissions from the electricity sector by up to 30 MtCO2 compared to 2003 levels. Ontario is replacing coal-fired generation with increased conservation and lower-emitting energy sources (e.g. natural gas, biomass, solar and wind).
§ The province of Nova Scotia has implemented a mandatory declining cap on GHG emissions from Nova Scotia Power Inc., starting at an average of 9.6 Mt over 2010 and 2011 to 7.5 Mt by 2020. In June 2014, the Nova Scotia government and the Canadian federal government finalised an equivalency agreement on coal-fired electricity, which allowed the federal government to suspend the application of the coal-fired electricity regulations in Nova Scotia. The agreement committed Nova Scotia to additional reduction requirements for the 2021 to 2030 period. Under Nova Scotia regulations, the GHG emissions cap declines from 7.5 Mt in 2020 to 4.5 Mt in 2030.
§ The provinces of British Columbia, Manitoba, Ontario, Quebec, New Brunswick, Nova Scotia, Prince Edward Island, and Newfoundland and Labrador also have measures in place to increase generation from renewable sources of energy. These measures will have a positive impact on GHG emissions from electricity generation.
CROSS-SECTORAL POLICIES AND MEASURES
Many provinces have implemented measures that aim to reduce CO2 emissions across multiple sectors.
§ British Columbia has implemented a revenue-neutral carbon tax on virtually all fossil fuels, including: gasoline, diesel, natural gas, coal, propane, and home heating fuel. The carbon tax covers over 70% of emissions in British Columbia. The tax started in 2008 at a rate based on CAD 10 per tonne of associated carbon or carbon-equivalent emissions, and rose by CAD 5 each year over the next four years, reaching CAD 30 per tonne in 2012. The revenue generated by this tax (approximately CAD 1.1 billion in 2014) is returned to individuals and businesses through reductions on other taxes and other tax credits (approximately CAD 1.4 billion in 2014), making the tax revenue neutral.
§ In Alberta, the Specified Gas Emitters Regulation (SGER) requires industrial facilities – including those in the oil and gas sectors – that produce more than 100 000 tonnes of GHG emissions annually to reduce their emissions intensity. The baseline is calculated as the average of a facility’s emissions intensity over the years 2003, 2004 and 2005. Companies have three options in order to comply with the SGER Act: improve the GHG intensity of their operations; buy offset credits generated by reductions from certain unregulated activities; buy performance credits from other regulated facilities that have surpassed their requirements; or, for every tonne of GHG emitted above their target, pay into a technology fund administered by the Climate Change and Emissions Management Corporation (CCEMC). As of 2014, the regulation covers 111 facilities from 13 industrial sectors (about half of Alberta’s GHG emissions). At the time of writing, the required reduction from the baseline is 12% and is scheduled to increase
© O
EC
D/IE
A, 2
016
3. Climate change
52
to 15% on 1 January 2016 and 20% on 1 January 2017. The fee will increase from CAD 12/tCO2 to CAD 20/tCO2, and then to CAD 30/tCO2 on the same schedule. Through early 2015, over CAD 575 million has been paid into the clean technology fund, and about half has been invested in projects. Since the programme was established in 2007, a total of 61 Mt of cumulative emissions have been reduced from business-as-usual levels, of which 37 Mt were from facility reductions, and 24 Mt were from offset credits. On 22 November 2015, Alberta government presented the Climate Leadership Plan with intentions to phase-out coal-fired power generation, going beyond federal emission performance standards, in favour of increasing the share of renewable energy in the electricity mix to 30% by 2030. The plan also envisages an emission limit of 100 megatonnes on oilsands related activities, including provisions for upgrading and co-generation, and a methane reduction strategy to reduce emissions by 45% from 2014 levels by 2025. Alberta decided to introduce a price on carbon in all sectors at CAD 20 per tonne in January 2017 and CAD 30 per tonne in January 2018.
§ In April 2015, Ontario announced its intention to create a cap-and-trade system for GHGs and that it will link its system to that of the neighbouring province, Quebec, and with the US State of California. In May 2015, Ontario was the first province in Canada to announce a 2030 GHG target. Ontario intends to reduce emissions by 37% below 1990 levels by 2030.
§ One of the key elements of Quebec’s approach to climate change is a cap-and-trade system, which became effective in January 2012, with a first compliance period that started in January 2013. Covered entities primarily include electricity production and distribution and large industrial facilities. In 2015, the system expanded to cover the distribution of fuel used in the transport, building, and small and medium-sized business sectors. Quebec and California formally linked their emissions trading schemes in 2014, holding the first auction in November 2014.
§ On December 3, 2015, Manitoba announced that it will implement a cap-and-trade system as part of its new Climate Change and Green Economy Plan. The system will apply to large emitters and will be linked with Ontario, Quebec and California. Additionally, under its new Plan, Manitoba committed to explore additional carbon pricing options for sectors not covered by the cap-and-trade system. On November 23, 2015, Saskatchewan announced an objective to double its renewable power generation capacity to 50% by 2030. To meet this goal, Saskatchewan will undertake a major expansion of wind power augmented by other renewables, such as solar, biomass, geothermal and hydro.
CLIMATE CHANGE VULNERABILITY AND ADAPTATION
Over the last six decades, Canada has become warmer, with average temperatures over land increasing by 1.5°C between 1950 and 2010, which is about double the global average reported over the same time period. Warming has been occurring even faster in many areas of northern Canada.
Other climate indicators and their trends have also been observed. Total precipitation has increased at most stations in spring and autumn, while many sites, especially those in western Canada, show declining winter precipitation. The Arctic has seen rapid declines in sea ice extent, in both summer and winter. In addition, snowfall has decreased across southern Canada, while the snow cover is melting earlier in spring, and glaciers in western Canada and the Arctic are shrinking (Environment Canada, 2014b).
© O
EC
D/IE
A, 2
016

3. Climate change
53
Figure 3.5 Examples of insured losses from extreme weather events in Canada
This map is without prejudice to the status of or sovereignty over any territory, to the delimitation of international frontiers and boundaries and to the name of any territory, city or area.
Source: Government of Canada (2014).
© O
EC
D/IE
A, 2
016
3. Climate change
54
Thawing of permafrost is one of the greatest climate change concerns regarding northern infrastructure. Transportation networks, pipelines and building foundations have already shown signs of failure and deterioration.
While there are strong regional differences in relative sea level changes in Canada, changes in sea ice cover as well as in the frequency and magnitude of storms present risks of coastal erosion and flooding, impacting coastal infrastructure.
Increased water scarcity as a result of rising temperatures and increased evaporation are growing concerns in the southern parts of Alberta and Saskatchewan. Water supplies for both oil-sands processing and hydraulic fracturing could be impacted by climate change, and the federal government considers adaptation options to reduce water use.
Changes in the hydrological cycle also have implications for hydropower production, which comprises an important share of the electricity generation mix (59%). Reduced snowpack, increased precipitation and runoff in northern regions, and increased evapotranspiration in southern regions, will produce varying regional impacts on hydropower production. Increased intensity of precipitation events may result in higher seasonal variability of water.
Losses from severe weather have been rising across the country. Extreme events, including storms (wind, ice and snow), flooding and heat waves have had significant economic impacts (see Figure 3.5). In 2011, the Canadian insurance industry paid out a record CAD 1.7 billion for property damage associated with weather events, such as flooding, wind and wildfires. This record was broken in 2013 owing to insured losses from flooding damage in southern Alberta and Toronto that were estimated to be between CAD 3 and 5 billion (Government of Canada 2014, see Figure 3.5 adapted). While factors other than climate also contributed to the rising pay-out trend (e.g. increased exposure of property, growing wealth and ageing infrastructure), these losses, along with the many possible health impacts, demonstrate that Canadian society and economic sectors are vulnerable to extreme weather events.
Severe weather is a common cause of interruptions in power supply. The 1998 ice storm in eastern Canada, which had estimated costs of more than CAD 5 billion, provides an extreme example of the vulnerability of electricity transmission infrastructure. Extreme temperatures can affect the performance of a large amount of infrastructure, including electricity transmission (reduced efficiency and increased line drag), pipelines (reduced efficiency of compressors and fan coolers) and railroads (heat buckling).
Lastly, energy demand is subject to change with warmer average temperatures, decreasing heating demand in winter and raising cooling demand in summer.
Over the past several years, understanding of climate change impacts and adaptation in Canada have increased both as a result of new research and through practical experience. Federal adaptation funding has increased over the years: in 2007 the government allocated CAD 85.9 million for a 4-year adaptation programme, and in 2011 CAD 148.8 million was made available for a 5-year programme. This funding of federal programmes continues and expands across nine departments and agencies. Improving the understanding of climate change helps prepare for climate-related impacts. The earlier funding in 2007 encouraged and supported provinces, territories, municipalities, and professional organisations to take action to adapt to climate change, and laid a strong foundation through increased knowledge, regional capacity building, and risk management tools for planners and engineers.
© O
EC
D/IE
A, 2
016
3. Climate change
55
The Federal Adaptation Policy Framework is the key document in defining the federal role on adaptation. It signals the government’s intentions to mainstream adaptation into federal priorities and notes that the “costs associated with future climate-related failures in infrastructure could potentially be avoided by changing current infrastructure design protocols to become more resilient to predicted future changes in climate” (Government of Canada, 2011).
The federal government has also supported the development of several tools and knowledge platforms in recent years, most notably Natural Resource Canada’s Adaptation Platform which was launched in March 2012. Its goal is to promote collaboration on adaptation among various levels of government, professional organisations, industry and financial institutions, and to produce information and tools that regions and sectors need in order to understand and adapt to the effects of a changing climate. Collaboration has emerged as an important mechanism for successful and efficient adaptation to climate change. One of the working groups is dedicated to the energy sector. It included projects focused on assessing awareness and action, on evaluating the impacts of future climate change on urban and suburban electricity distribution, and on understanding climate change impacts on energy demand. Some of the areas of work identified by the Energy Working Group included climate and hydrology information, risk assessment, best practices and tools, and the business case for resilience and adaptation investments. In 2013-14 twenty projects were launched in Canada’s oil and gas and electricity sectors to address the emerging adaptation needs.
In addition, the New Building Canada Fund provides financial support to eligible public infrastructure projects, to those that mitigate the potential damage resulting from natural hazards, including impacts or events related to climate change. A national project to assess climate change impacts on projected investments required for Canada’s electricity infrastructure system estimated to be at CAD 350 billion to 2030.
Public-private partnerships (PPP) offer the benefit of sharing the risks of an infrastructure project between both sectors. The west coast Infrastructure Exchange (WCX) serves as one interesting PPP model. It aims at enhancing private financing of public infrastructure across the US States of California, Oregon and Washington, and the Canadian Province of British Columbia. The WCX includes as one of its objectives to ensure that infrastructure investment considers climate risk factors. It has released project standards, stating: “Planning and execution of long-term infrastructure investments should address resilience to future conditions. In other words, the increased risk of flooding, drought, higher water levels, hotter temperatures, seismic events and other external events as appropriate, should be factored into decisions about where and what type of infrastructure should be built” (west coast Infrastructure Exchange, 2013).
The Standards Council of Canada (SCC) has also been engaged in work to integrate adaptation considerations into codes and standards through the five-year programme (2011–16), and the CAD 2.5 million from the Northern Infrastructure Standardization Initiative (NISI). By 2016, NISI intends to contribute to the development and application of several new standards reflective of climate impacts. Setting weather resilience standards may also be a way to motivate transmission and distribution network operators to invest in resilience. For example, after the 1998 ice storm, Quebec changed design standards for electricity transmission lines.
Increasing energy rates, including through the application of public benefit charges, can spread costs between energy producers and energy users. For example, Toronto Hydro has requested a 2.5% rate increase to allow for various investments and enhance the resilience of infrastructure to extreme events.
© O
EC
D/IE
A, 2
016
3. Climate change
56
Since provincial governments have legislative authority for natural resources within their jurisdiction, there are differing approaches and levels of activity across Canada. While many frameworks for adaptation exist, examples of their application and documentation on implemented measures remain relatively few.
ASSESSMENT
The IEA in-depth review of 2009 called for a co-ordinated climate change policy focusing on key sectors, supported by enhanced collaboration between the federal and provincial governments. Since 2009, the Canadian approach to climate policy has crystalised around sector-by-sector regulation of GHG emissions, aligned with those in the United States wherever appropriate. While the federal government has made some progress in the past five years on sector-specific regulations, focusing on transport and electricity, there is little evidence of a pan-Canadian, co-ordinated climate policy. Co-ordination with the provinces and territories is particularly important given the shared jurisdiction for climate change in Canada and the national goal of reducing GHG emissions by 17% below 2005 levels by 2020 and by 30% by 2030.
In a scenario that accounts for policy measures introduced in May 2014 and assumes no new policy measures are introduced between 2014 and 2020, Environment Canada estimates that total GHG emissions in 2020 will be 727 MtCO2-eq (Environment Canada, 2014a). While this is 130 MtCO2-eq below emissions in the "without measures" scenario, highlighting the success of policies implemented to date, additional reductions of 116 MtCO2-eq would be required if Canada is to meet its Copenhagen commitments (Environment Canada, 2014a). Planned federal measures (e.g. for HFCs; standards for post-2018 model-year heavy-duty vehicles), including those announced as part of Canada’s INDC, as well as planned provincial and territorial measures, are expected to drive additional emissions reductions. However, it is not yet clear whether these measures will be sufficient to close the gap.
Despite the fact that Canada is not currently on track to meet its 2020 GHG emissions reduction goals, there are several positive trends. Among them is a marked decrease in emissions from electricity generation that has resulted from, among others, the phase-out of coal-fired plants in Ontario and the federal emissions performance standards for coal-fired electricity generation published in 2012. The federal emissions performance standards for coal-fired electricity are projected to achieve cumulative emissions reductions of 214 MtCO2-eq between 2015 and 2035. However, because a high proportion of Canadian electricity generation already comes from non-emitting sources (i.e. about 80% in 2014), further emissions reductions will require displacement of gas-fired generation or application of CCS.
While emissions from transport have continued to grow, the rate of increase has slowed as a result of various federal and provincial policies. These policies include federal GHG emission regulations for both on-road light- and heavy-duty vehicles, provincial and federal low-carbon (or renewable) fuel standards, and investments in public transit infrastructure. Canada has the potential to further reduce GHG and other air emissions from transport by expanding the use of natural gas and biofuels for freight and passenger transport and increasing the penetration of electric vehicles in urban areas. In addition, the progressive shift of public transport towards more efficient modes (e.g. bus and rail) could support additional emissions reductions from transport.
© O
EC
D/IE
A, 2
016

3. Climate change
57
The distribution of GHG emissions in Canada is determined by the distribution of the wealth of natural resource and the historical patterns of development. Despite the differences between the provinces and territories, all have strong potential for renewable energy (in one form or another), are seeking to grow their economies through increased energy exports, and face the common challenge of long-distances and large seasonal variations in climate. Commonalities of particular note include:
§ The provinces of Alberta, Saskatchewan and Nova Scotia have a substantial reliance on fossil-fuelled electricity generation.
§ Alberta and British Columbia, in particular, hope to see growth in their oil and gas sectors. In Alberta, this takes the form of continued growth in production and in-province upgrading of bitumen, and, in British Columbia, increased production of shale gas to support a strong LNG export industry.
§ British Columbia, along with Manitoba, Ontario, and Quebec, has a large share of emissions from transport.
§ Manitoba, Quebec and some Atlantic provinces are seeking to grow generation and exports of hydroelectricity.
To date, the provinces have developed energy and climate policies that address their priorities and are suited to their circumstances. The varying approaches to climate policy being pursued at the provincial level means there are both areas of overlap and gaps. While the federal government has undertaken a collaborative and consultative approach to developing sectoral policies, it has not effectively addressed the gaps and overlaps between provincial policies. Additional co-ordination between the provincial and the federal governments is needed to ensure a cohesive approach that avoids undue duplication of efforts.
In the past, repeated changes to goals and approaches to reduce emissions at the federal level and, more recently, delays in implementing regulations have created uncertainty for the provinces and industry. However, looking forward, Canada's INDC released in May 2015 sets clear expectations for emissions reductions through 2030. As part of Canada's INDC, the federal government has announced its intent to address methane emissions from the oil and gas sectors but also GHG emissions from the chemicals and nitrogen fertilizer sectors and from natural gas-fired power generation. These are in addition to the transportation, coal-fired electricity, and HFC regulations already in place or announced. To reduce uncertainty for the provinces and industry, the federal government should clearly establish a timeline for developing these GHG regulations, and adhere to it.
The implementation of GHG regulations for the oil and gas sectors would underscore Canada’s position as a responsible energy supplier and help obtain a social licence for the growing exports. While these regulations would inevitably have an impact on the cost of producing oil and gas in Canada – particularly for the oil-sands – the impacts are likely to be manageable (IEA, 2010). Indeed, even in the IEA World Energy Outlook 450 Scenario, growth in oil-sands production is consistent with recent estimates of near-term production potential based on projects at various stages of development (IEA 2014, AER, 2014). Furthermore, the government has stated its intent to focus climate-related investments in innovative technologies to continue to drive further improvements in environmental performance in the oil-sands and other growing sectors of the economy. This should aid the flow of new technologies that can reduce the cost of achieving GHG emissions reductions (IEA, 2015c).
© O
EC
D/IE
A, 2
016
3. Climate change
58
Investments to enhance the resilience of the energy sector to extreme events are expected to bring significant adaptation benefits. However, adapting to a changing climate will require more than just investments into energy-sector resilience. Federal and provincial governments can and should play a leading role in creating mechanisms for climate risk evaluation as well as measures for risk management. The federal government has made some progress in the adaptation area recently through the Federal Adaptation Policy Framework and the NRCan Adaptation Platform. In future, the government of Canada should work with the provinces and industry to develop an adaptation strategy tailored to the specifics of Canada's energy sector.
Finally, the government of Canada’s commitment to align national GHG mitigation policies with those of the US, as appropriate, is sensible given the strong economic integration between the neighbouring nations. However, close coupling of policies can be a double-edged sword as the pace of domestic developments in the US could unduly restrain – or put undue pressure – Canadian climate policy developments.
RECOMMENDATIONS
The government of Canada should:
o Reduce uncertainty for investors, project developers, and the provinces by establishing a clear timeline for the implementation of federal GHG regulations.
o Underscore Canada’s position as an environmentally responsible energy supplier by developing long-term emissions reduction strategies for the oil and gas sectors in a joint effort with the provinces and territories.
o Continue to drive the decarbonisation of transport by introducing policies that go beyond GHG emission standards, and encourage the increased use of renewable fuels, electrification of transport, use of natural gas, and mode switching. These could include additional vehicle and fuel taxation measures.
o In line with the COP21 climate pledge, work collaboratively with provinces to integrate federal and provincial measures, including carbon pricing schemes, towards meeting Canada’s 2030 target and beyond.
o Collaborate with the US in forums such as the Clean Energy Dialogue that promote policies to reduce emissions across North America and support low-carbon technologies, including, for example, shared carbon-pricing mechanisms, and investment that aligns with shared climate policies.
References AER (Alberta Energy Regulator), (2014) Alberta’s Energy Reserves 2013 and Supply/Demand Outlook 2014–2023, Report ST98-2014, Government of Alberta, Edmonton
Environment Canada (2015), National Inventory Report, Government of Canada, Ottawa.
Environment Canada (2014a), Canada’s Emissions Trends, Government of Canada, Ottawa.
Environment Canada (2014b), National Inventory Report, Government of Canada, Ottawa.
© O
EC
D/IE
A, 2
016
3. Climate change
59
Environment Canada (2012), A Climate Change Plan for the Purposes of the Kyoto Protocol Implementation Act, Government of Canada, Ottawa.
Evans, R.L. and T. Bryant (2013), Trottier Energy Futures: Greenhouse Gas Emissions from the Canadian Oil and Gas Sector, Trottier Energy Futures Project, Ottawa.
GGFR (Global Gas Flaring Reduction Partnership), (2009), Guidance on Upstream Flaring and Venting: Policy and Regulation, World Bank, Washington, DC.
Government of Canada (2014): Warren, F.J. and Lemmen, D.S., editors (2014): Canada in a Changing Climate: Sector Perspectives on Impacts and Adaptation; Government of Canada, Ottawa, ON, at: www.nrcan.gc.ca/sites/www.nrcan.gc.ca/files/earthsciences/pdf/assess/2014/pdf/Full-Report_Eng.pdf.
Government of Canada (2011): Federal Adaptation Policy Framework; Environment.
IEA (International Energy Agency) (2015a), CO2 Emissions from Fuel Combustion, www.iea.org/statistics/, OECD/IEA, Paris.
IEA (2015b), Energy Balance of OECD Countries, www.iea.org/statistics/, OECD/IEA, Paris.
IEA (2015c), Energy Technology Perspectives 2015, OECD/IEA, Paris.
IEA (2014), World Energy Outlook, OECD/IEA, Paris.
IEA (2010), World Energy Outlook, OECD/IEA, Paris.
Krupa, H.J. (2011), “The Legal Framework for Carbon Capture and Storage in Canada”, in Carbon Capture and Storage: Emerging Legal and Regulatory Issues, I. Havercroft, R.B. Macrory, R.B. Stewart, eds. Hart, Oxford.
Office of the Auditor General of Canada (2014), Report of the Commissioner of the Environment and Sustainable Development – Fall 2014, Government of Canada, Ottawa.
UNFCCC (2014), GHG Emission Profiles data series, http://unfccc.int/ghg_data/ghg_data_unfccc/ghg_profiles/items/3954.php, accessed on 24 November 2014.
west coast Infrastructure Exchange (2013) http://westcoastx.com/assets/documents/Final_WCX_standards%20document-12-20-13.pdf.
© O
EC
D/IE
A, 2
016

© O
EC
D/IE
A, 2
016
4. Energy efficiency
61
4. ENERGY EFFICIENCY
Key data (2013)
Energy supply per capita: 7.2 toe (IEA average: 4.5 toe), -13% since 2003
Energy intensity: 0.19 toe/USD 1 000 PPP (IEA average: 0.13 toe/USD 1 000 PPP), -20.4% since 2003
TFC: 199.1 Mtoe (oil 47.5%, natural gas 23.7%, electricity 21%, biofuels and waste 6%, coal 1.6%, heat 0.3%), +2.2% since 2003
Consumption by sector: industry 36%, transport 30.7%, residential 17%, commercial and other services 16.2%
OVERVIEW
Since 2003, energy intensity improved by around 20% and energy supply per capita has decreased by 13% despite increasing oil and gas production. Canada has one of the most energy-intensive economies among IEA member countries, largely owing to its energy production and the energy industries’ need to extract and process energy resources into exports; its large geography requiring more transport and in-land shipping; its climatic conditions requiring more energy for heating; and its high standard of living. Despite progress on energy efficiency achieved, specifically in industry, buildings, and transport, the country has the highest total energy supply (TPES) per capita of IEA countries. However, national averages overlook important sub-national differences in energy intensity and energy efficiency performance.
FINAL CONSUMPTION OF ENERGY
Canada’s total final consumption (TFC) was 199.1 million tonnes of oil-equivalent (Mtoe) in 2013. Since 2003, TFC has increased by 2.2%. In the review period, TFC fell from 202.2 Mtoe in 2007 to 187.1 Mtoe by the end of 2009 and has been recovering since. The short decline in 2008-09 was driven by the recession when demand fell in all sectors of the economy.
ENERGY INTENSITY
Energy intensity, measured as the ratio of total primary energy supply (TPES) by real gross domestic product adjusted for purchasing power parity (GDP PPP, base year 2005) was 0.19 tonnes of oil-equivalent per USD 1 000 PPP (toe/USD 1 000 PPP) in 2013. The ratio is higher than the IEA average of 0.13 toe/USD 1 000 PPP and the IEA North America average of 0.15 toe/USD 1 000 PPP. Canada’s overall energy intensity was ranked third-highest among IEA member countries, behind Estonia and Finland. However, energy intensity in Canada was 20.4% lower in 2013 than ten years before, while the average IEA intensity declined by 17.8% over the same period (Figure 4.1).
© O
EC
D/IE
A, 2
016
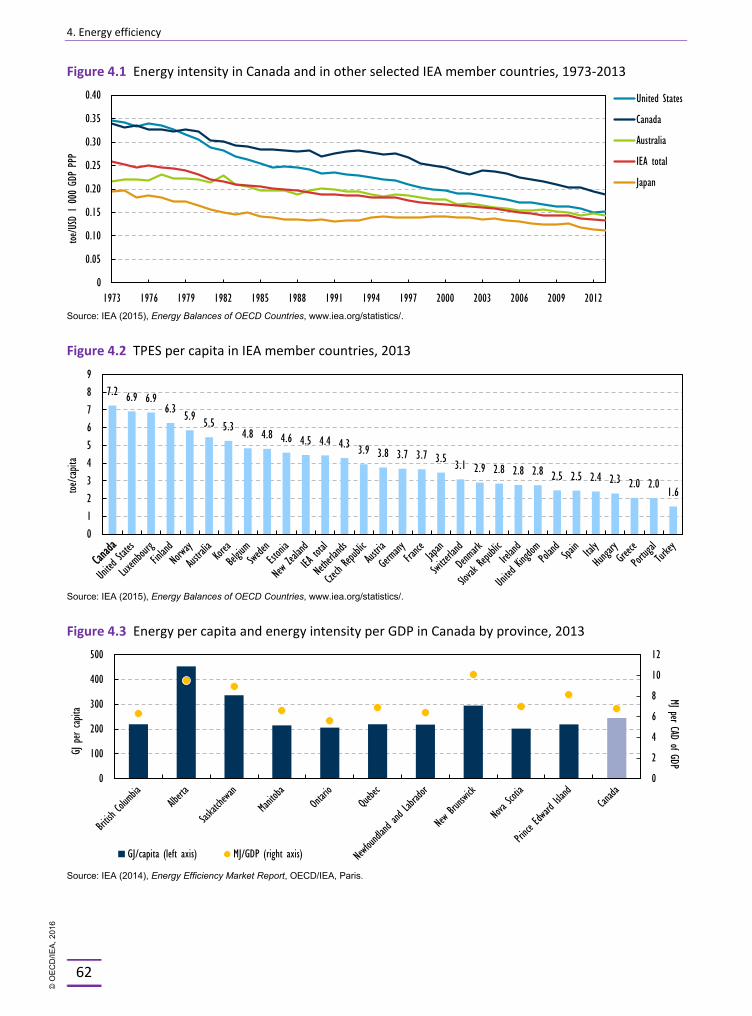
4. Energy efficiency
62
Figure 4.1 Energy intensity in Canada and in other selected IEA member countries, 1973-2013
Source: IEA (2015), Energy Balances of OECD Countries, www.iea.org/statistics/.
Figure 4.2 TPES per capita in IEA member countries, 2013
Source: IEA (2015), Energy Balances of OECD Countries, www.iea.org/statistics/.
Figure 4.3 Energy per capita and energy intensity per GDP in Canada by province, 2013
Source: IEA (2014), Energy Efficiency Market Report, OECD/IEA, Paris.
0.00
0.05
0.10
0.15
0.20
0.25
0.30
0.35
0.40
1973 1976 1979 1982 1985 1988 1991 1994 1997 2000 2003 2006 2009 2012
toe/U
SD 1
000
GDP
PPP
United States
Canada
Australia
IEA total
Japan
00
7.2 6.9 6.96.3 5.9 5.5 5.3 4.8 4.8 4.6 4.5 4.4 4.3 3.9 3.8 3.7 3.7 3.5 3.1 2.9 2.8 2.8 2.8 2.5 2.5 2.4 2.3 2.0 2.0
1.6
0123456789
toe/ca
pita
0
2
4
6
8
10
12
0
100
200
300
400
500
MJ per CAD of GDPGJ p
er capit
a
GJ/capita (left axis) MJ/GDP (right axis)
© O
EC
D/IE
A, 2
016
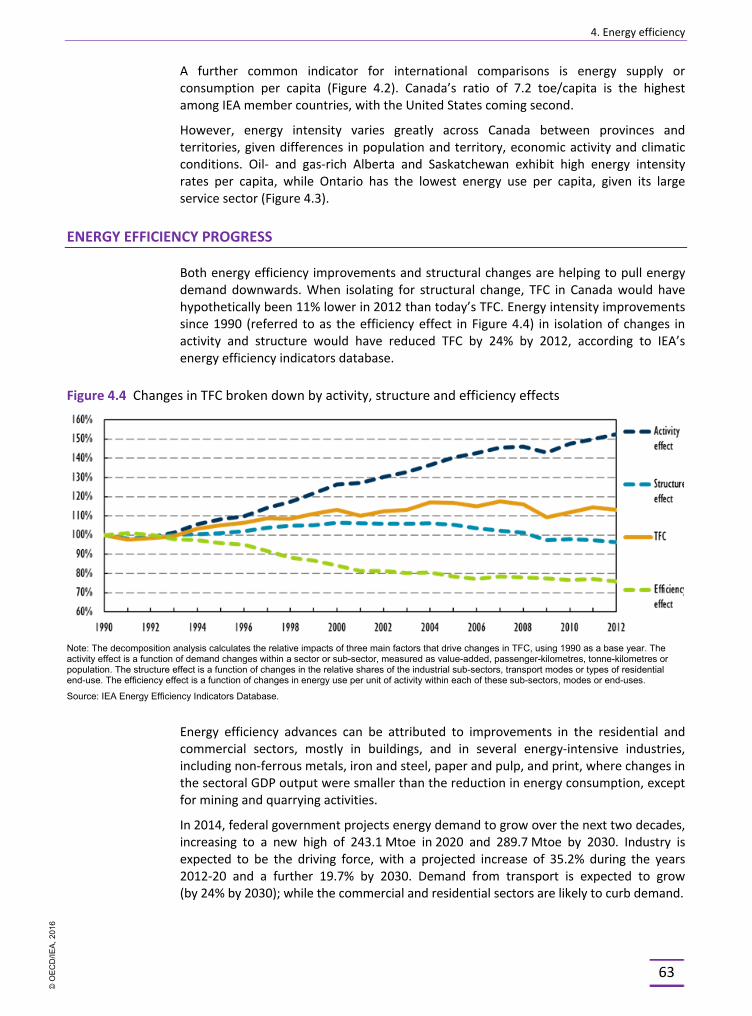
4. Energy efficiency
63
A further common indicator for international comparisons is energy supply or consumption per capita (Figure 4.2). Canada’s ratio of 7.2 toe/capita is the highest among IEA member countries, with the United States coming second.
However, energy intensity varies greatly across Canada between provinces and territories, given differences in population and territory, economic activity and climatic conditions. Oil- and gas-rich Alberta and Saskatchewan exhibit high energy intensity rates per capita, while Ontario has the lowest energy use per capita, given its large service sector (Figure 4.3).
ENERGY EFFICIENCY PROGRESS
Both energy efficiency improvements and structural changes are helping to pull energy demand downwards. When isolating for structural change, TFC in Canada would have hypothetically been 11% lower in 2012 than today’s TFC. Energy intensity improvements since 1990 (referred to as the efficiency effect in Figure 4.4) in isolation of changes in activity and structure would have reduced TFC by 24% by 2012, according to IEA’s energy efficiency indicators database.
Figure 4.4 Changes in TFC broken down by activity, structure and efficiency effects
Note: The decomposition analysis calculates the relative impacts of three main factors that drive changes in TFC, using 1990 as a base year. The activity effect is a function of demand changes within a sector or sub-sector, measured as value-added, passenger-kilometres, tonne-kilometres or population. The structure effect is a function of changes in the relative shares of the industrial sub-sectors, transport modes or types of residential end-use. The efficiency effect is a function of changes in energy use per unit of activity within each of these sub-sectors, modes or end-uses.
Source: IEA Energy Efficiency Indicators Database.
Energy efficiency advances can be attributed to improvements in the residential and commercial sectors, mostly in buildings, and in several energy-intensive industries, including non-ferrous metals, iron and steel, paper and pulp, and print, where changes in the sectoral GDP output were smaller than the reduction in energy consumption, except for mining and quarrying activities.
In 2014, federal government projects energy demand to grow over the next two decades, increasing to a new high of 243.1 Mtoe in 2020 and 289.7 Mtoe by 2030. Industry is expected to be the driving force, with a projected increase of 35.2% during the years 2012-20 and a further 19.7% by 2030. Demand from transport is expected to grow (by 24% by 2030); while the commercial and residential sectors are likely to curb demand.
© O
EC
D/IE
A, 2
016
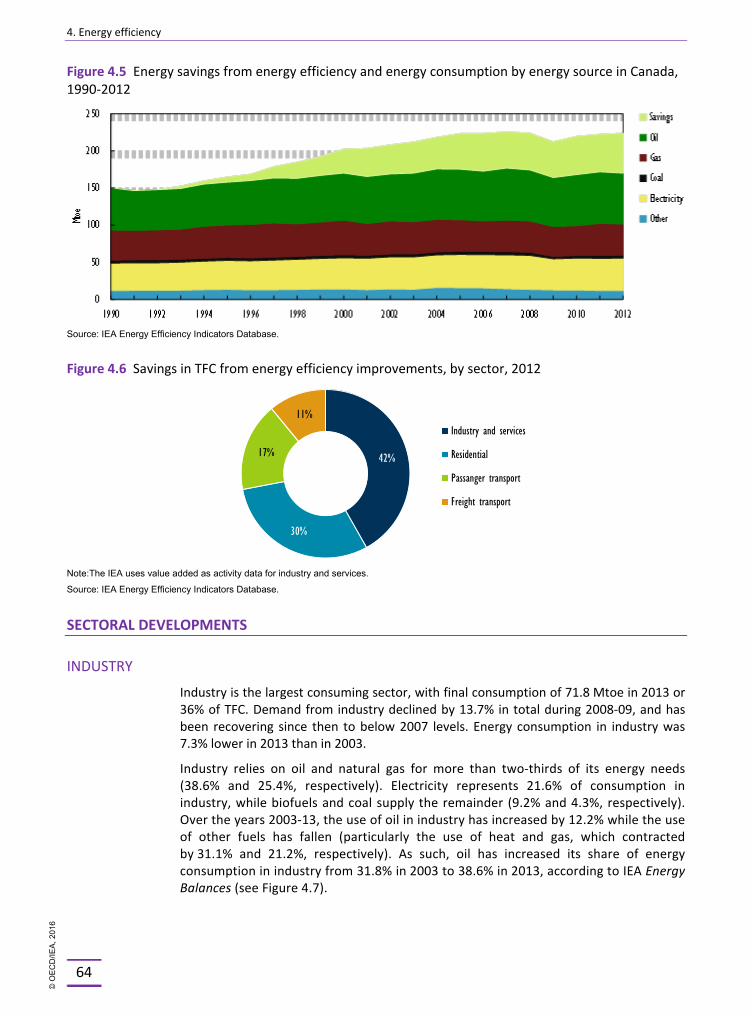
4. Energy efficiency
64
Figure 4.5 Energy savings from energy efficiency and energy consumption by energy source in Canada, 1990-2012
Source: IEA Energy Efficiency Indicators Database.
Figure 4.6 Savings in TFC from energy efficiency improvements, by sector, 2012
Note:The IEA uses value added as activity data for industry and services.
Source: IEA Energy Efficiency Indicators Database.
SECTORAL DEVELOPMENTS
INDUSTRY
Industry is the largest consuming sector, with final consumption of 71.8 Mtoe in 2013 or 36% of TFC. Demand from industry declined by 13.7% in total during 2008-09, and has been recovering since then to below 2007 levels. Energy consumption in industry was 7.3% lower in 2013 than in 2003.
Industry relies on oil and natural gas for more than two-thirds of its energy needs (38.6% and 25.4%, respectively). Electricity represents 21.6% of consumption in industry, while biofuels and coal supply the remainder (9.2% and 4.3%, respectively). Over the years 2003-13, the use of oil in industry has increased by 12.2% while the use of other fuels has fallen (particularly the use of heat and gas, which contracted by 31.1% and 21.2%, respectively). As such, oil has increased its share of energy consumption in industry from 31.8% in 2003 to 38.6% in 2013, according to IEA Energy Balances (see Figure 4.7).
42%
30%
17%
11%Industry and services
Residential
Passanger transport
Freight transport
© O
EC
D/IE
A, 2
016
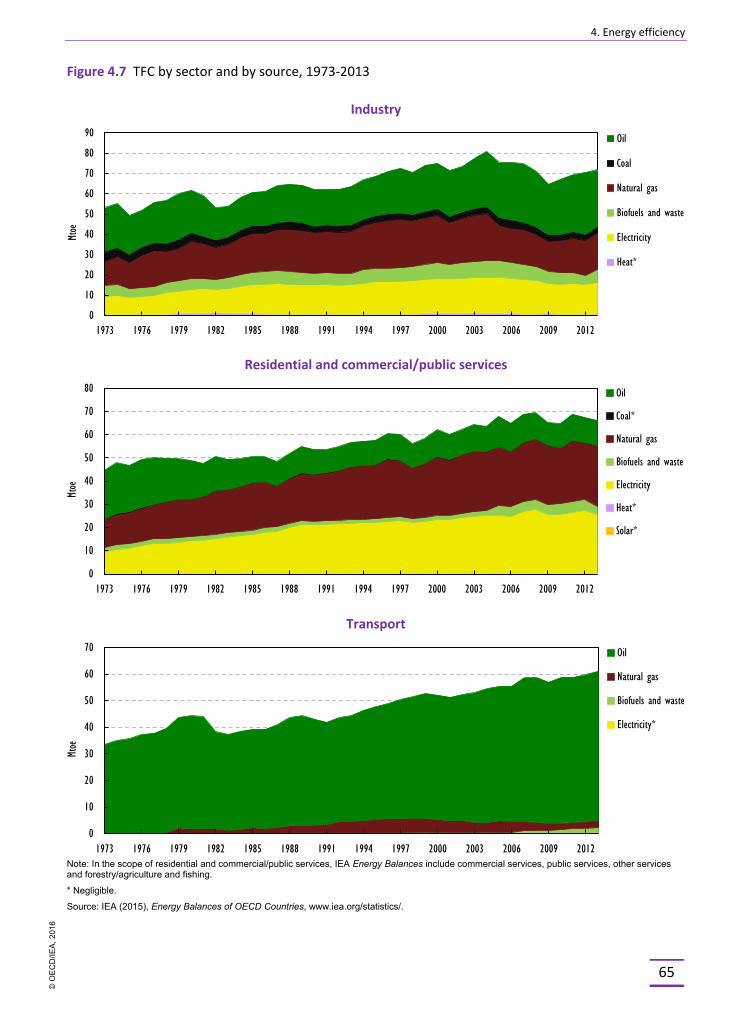
4. Energy efficiency
65
Figure 4.7 TFC by sector and by source, 1973-2013
Industry
Residential and commercial/public services
Transport
Note: In the scope of residential and commercial/public services, IEA Energy Balances include commercial services, public services, other services and forestry/agriculture and fishing.
* Negligible.
Source: IEA (2015), Energy Balances of OECD Countries, www.iea.org/statistics/.
0
10
20
30
40
50
60
70
80
90
1973 1976 1979 1982 1985 1988 1991 1994 1997 2000 2003 2006 2009 2012
Mtoe
Oil
Coal
Natural gas
Biofuels and waste
Electricity
Heat*
0
10
20
30
40
50
60
70
80
1973 1976 1979 1982 1985 1988 1991 1994 1997 2000 2003 2006 2009 2012
Mtoe
Oil
Coal*
Natural gas
Biofuels and waste
Electricity
Heat*
Solar*
0
10
20
30
40
50
60
70
1973 1976 1979 1982 1985 1988 1991 1994 1997 2000 2003 2006 2009 2012
Mtoe
Oil
Natural gas
Biofuels and waste
Electricity*
© O
EC
D/IE
A, 2
016
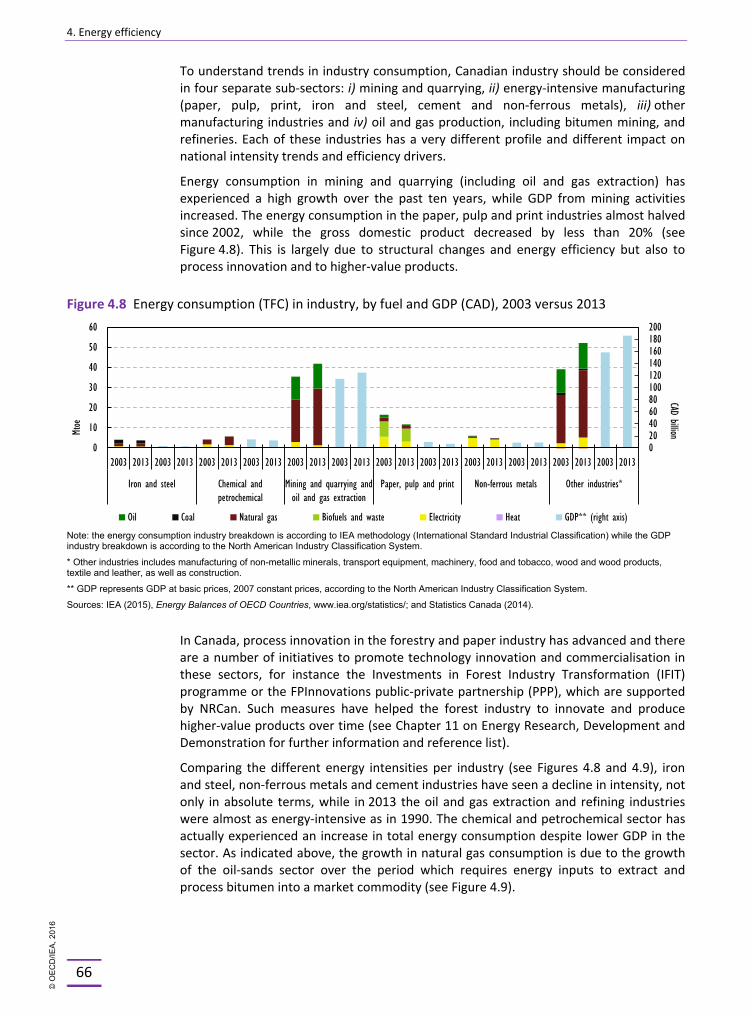
4. Energy efficiency
66
To understand trends in industry consumption, Canadian industry should be considered in four separate sub-sectors: i) mining and quarrying, ii) energy-intensive manufacturing (paper, pulp, print, iron and steel, cement and non-ferrous metals), iii) other manufacturing industries and iv) oil and gas production, including bitumen mining, and refineries. Each of these industries has a very different profile and different impact on national intensity trends and efficiency drivers.
Energy consumption in mining and quarrying (including oil and gas extraction) has experienced a high growth over the past ten years, while GDP from mining activities increased. The energy consumption in the paper, pulp and print industries almost halved since 2002, while the gross domestic product decreased by less than 20% (see Figure 4.8). This is largely due to structural changes and energy efficiency but also to process innovation and to higher-value products.
Figure 4.8 Energy consumption (TFC) in industry, by fuel and GDP (CAD), 2003 versus 2013
Note: the energy consumption industry breakdown is according to IEA methodology (International Standard Industrial Classification) while the GDP industry breakdown is according to the North American Industry Classification System.
* Other industries includes manufacturing of non-metallic minerals, transport equipment, machinery, food and tobacco, wood and wood products, textile and leather, as well as construction.
** GDP represents GDP at basic prices, 2007 constant prices, according to the North American Industry Classification System.
Sources: IEA (2015), Energy Balances of OECD Countries, www.iea.org/statistics/; and Statistics Canada (2014).
In Canada, process innovation in the forestry and paper industry has advanced and there are a number of initiatives to promote technology innovation and commercialisation in these sectors, for instance the Investments in Forest Industry Transformation (IFIT) programme or the FPInnovations public-private partnership (PPP), which are supported by NRCan. Such measures have helped the forest industry to innovate and produce higher-value products over time (see Chapter 11 on Energy Research, Development and Demonstration for further information and reference list).
Comparing the different energy intensities per industry (see Figures 4.8 and 4.9), iron and steel, non-ferrous metals and cement industries have seen a decline in intensity, not only in absolute terms, while in 2013 the oil and gas extraction and refining industries were almost as energy-intensive as in 1990. The chemical and petrochemical sector has actually experienced an increase in total energy consumption despite lower GDP in the sector. As indicated above, the growth in natural gas consumption is due to the growth of the oil-sands sector over the period which requires energy inputs to extract and process bitumen into a market commodity (see Figure 4.9).
020406080100120140160180200
0
10
20
30
40
50
60
2003 2013 2003 2013 2003 2013 2003 2013 2003 2013 2003 2013 2003 2013 2003 2013 2003 2013 2003 2013 2003 2013 2003 2013
Iron and steel Chemical andpetrochemical
Mining and quarrying andoil and gas extraction
Paper, pulp and print Non-ferrous metals Other industries*
CAD billionMtoe
Oil Coal Natural gas Biofuels and waste Electricity Heat GDP** (right axis)
© O
EC
D/IE
A, 2
016
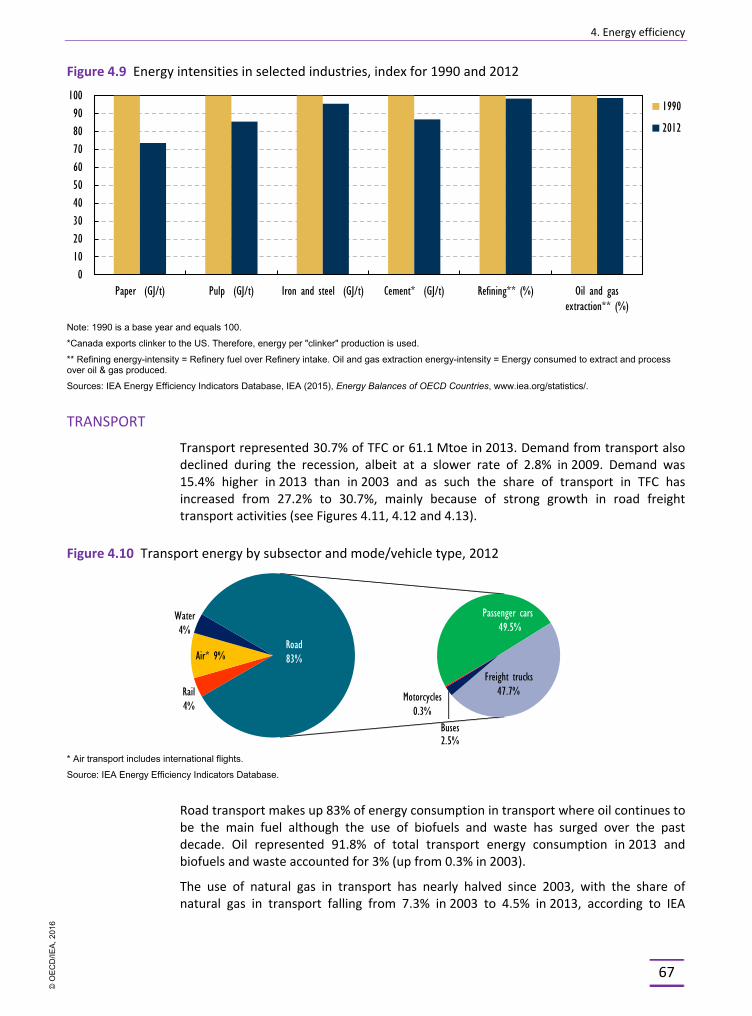
4. Energy efficiency
67
Figure 4.9 Energy intensities in selected industries, index for 1990 and 2012
Note: 1990 is a base year and equals 100.
*Canada exports clinker to the US. Therefore, energy per "clinker" production is used.
** Refining energy-intensity = Refinery fuel over Refinery intake. Oil and gas extraction energy-intensity = Energy consumed to extract and process over oil & gas produced.
Sources: IEA Energy Efficiency Indicators Database, IEA (2015), Energy Balances of OECD Countries, www.iea.org/statistics/.
TRANSPORT
Transport represented 30.7% of TFC or 61.1 Mtoe in 2013. Demand from transport also declined during the recession, albeit at a slower rate of 2.8% in 2009. Demand was 15.4% higher in 2013 than in 2003 and as such the share of transport in TFC has increased from 27.2% to 30.7%, mainly because of strong growth in road freight transport activities (see Figures 4.11, 4.12 and 4.13).
Figure 4.10 Transport energy by subsector and mode/vehicle type, 2012
* Air transport includes international flights.
Source: IEA Energy Efficiency Indicators Database.
Road transport makes up 83% of energy consumption in transport where oil continues to be the main fuel although the use of biofuels and waste has surged over the past decade. Oil represented 91.8% of total transport energy consumption in 2013 and biofuels and waste accounted for 3% (up from 0.3% in 2003).
The use of natural gas in transport has nearly halved since 2003, with the share of natural gas in transport falling from 7.3% in 2003 to 4.5% in 2013, according to IEA
0102030405060708090
100
Paper (GJ/t) Pulp (GJ/t) Iron and steel (GJ/t) Cement* (GJ/t) Refining** (%) Oil and gasextraction** (%)
1990
2012
Rail 4%
Air* 9%
Water 4%
Passenger cars 49.5%
Freight trucks 47.7%
Buses 2.5%
Motorcycles 0.3%
Road 83%
© O
EC
D/IE
A, 2
016
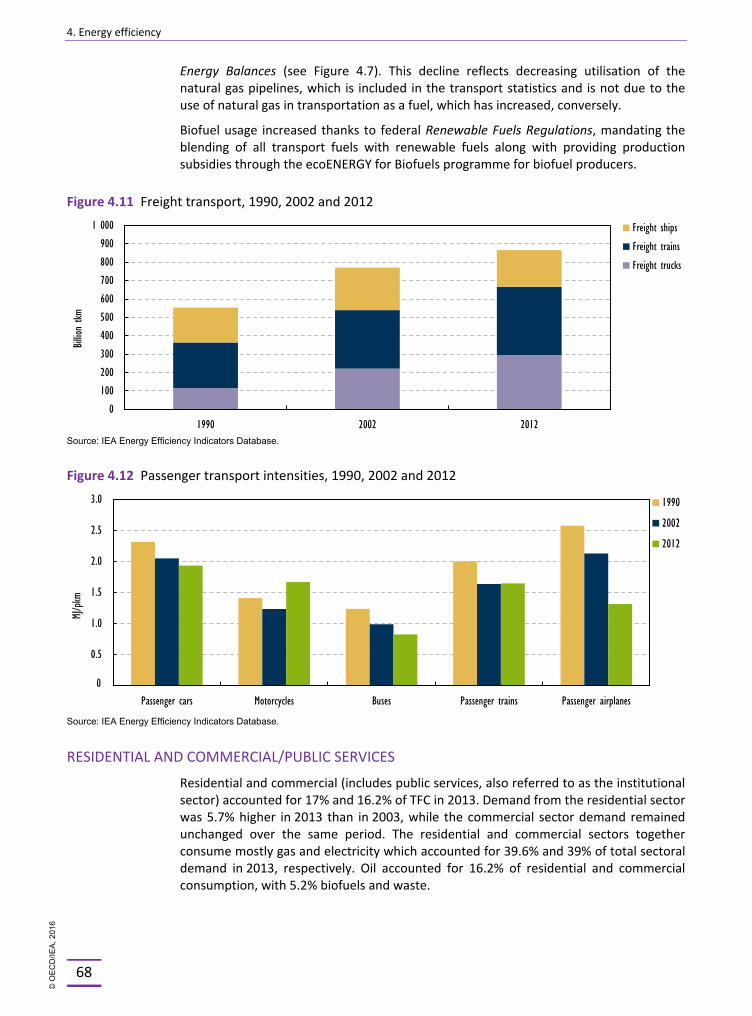
4. Energy efficiency
68
Energy Balances (see Figure 4.7). This decline reflects decreasing utilisation of the natural gas pipelines, which is included in the transport statistics and is not due to the use of natural gas in transportation as a fuel, which has increased, conversely.
Biofuel usage increased thanks to federal Renewable Fuels Regulations, mandating the blending of all transport fuels with renewable fuels along with providing production subsidies through the ecoENERGY for Biofuels programme for biofuel producers.
Figure 4.11 Freight transport, 1990, 2002 and 2012
Source: IEA Energy Efficiency Indicators Database.
Figure 4.12 Passenger transport intensities, 1990, 2002 and 2012
Source: IEA Energy Efficiency Indicators Database.
RESIDENTIAL AND COMMERCIAL/PUBLIC SERVICES
Residential and commercial (includes public services, also referred to as the institutional sector) accounted for 17% and 16.2% of TFC in 2013. Demand from the residential sector was 5.7% higher in 2013 than in 2003, while the commercial sector demand remained unchanged over the same period. The residential and commercial sectors together consume mostly gas and electricity which accounted for 39.6% and 39% of total sectoral demand in 2013, respectively. Oil accounted for 16.2% of residential and commercial consumption, with 5.2% biofuels and waste.
0
100
200
300
400
500
600
700
800
900
1 000
1990 2002 2012
Billio
n tkm
Freight ships
Freight trains
Freight trucks
0.0
0.5
1.0
1.5
2.0
2.5
3.0
Passenger cars Motorcycles Buses Passenger trains Passenger airplanes
MJ/pkm
1990
2002
2012
0
© O
EC
D/IE
A, 2
016
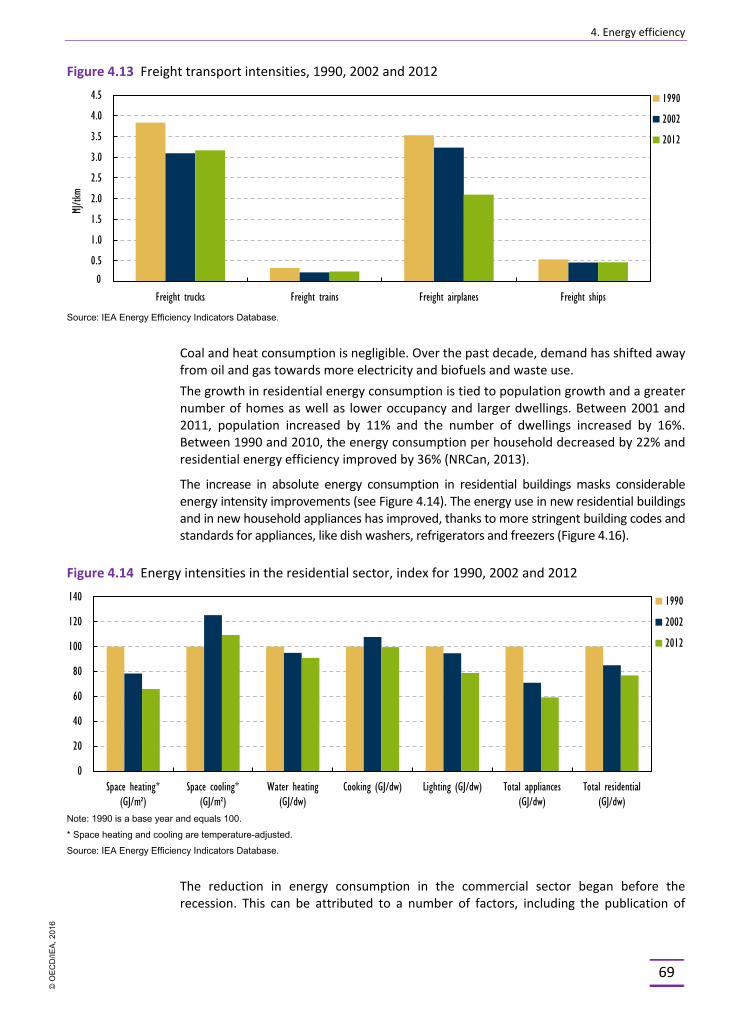
4. Energy efficiency
69
Figure 4.13 Freight transport intensities, 1990, 2002 and 2012
Source: IEA Energy Efficiency Indicators Database.
Coal and heat consumption is negligible. Over the past decade, demand has shifted away from oil and gas towards more electricity and biofuels and waste use. The growth in residential energy consumption is tied to population growth and a greater number of homes as well as lower occupancy and larger dwellings. Between 2001 and 2011, population increased by 11% and the number of dwellings increased by 16%. Between 1990 and 2010, the energy consumption per household decreased by 22% and residential energy efficiency improved by 36% (NRCan, 2013).
The increase in absolute energy consumption in residential buildings masks considerable energy intensity improvements (see Figure 4.14). The energy use in new residential buildings and in new household appliances has improved, thanks to more stringent building codes and standards for appliances, like dish washers, refrigerators and freezers (Figure 4.16).
Figure 4.14 Energy intensities in the residential sector, index for 1990, 2002 and 2012
Note: 1990 is a base year and equals 100.
* Space heating and cooling are temperature-adjusted.
Source: IEA Energy Efficiency Indicators Database.
The reduction in energy consumption in the commercial sector began before the recession. This can be attributed to a number of factors, including the publication of
0.0
0.5
1.0
1.5
2.0
2.5
3.0
3.5
4.0
4.5
Freight trucks Freight trains Freight airplanes Freight ships
MJ/tk
m
1990
2002
2012
0
0
20
40
60
80
100
120
140
Space heating*(GJ/m²)
Space cooling*(GJ/m²)
Water heating(GJ/dw)
Cooking (GJ/dw) Lighting (GJ/dw) Total appliances(GJ/dw)
Total residential(GJ/dw)
1990
2002
2012
© O
EC
D/IE
A, 2
016
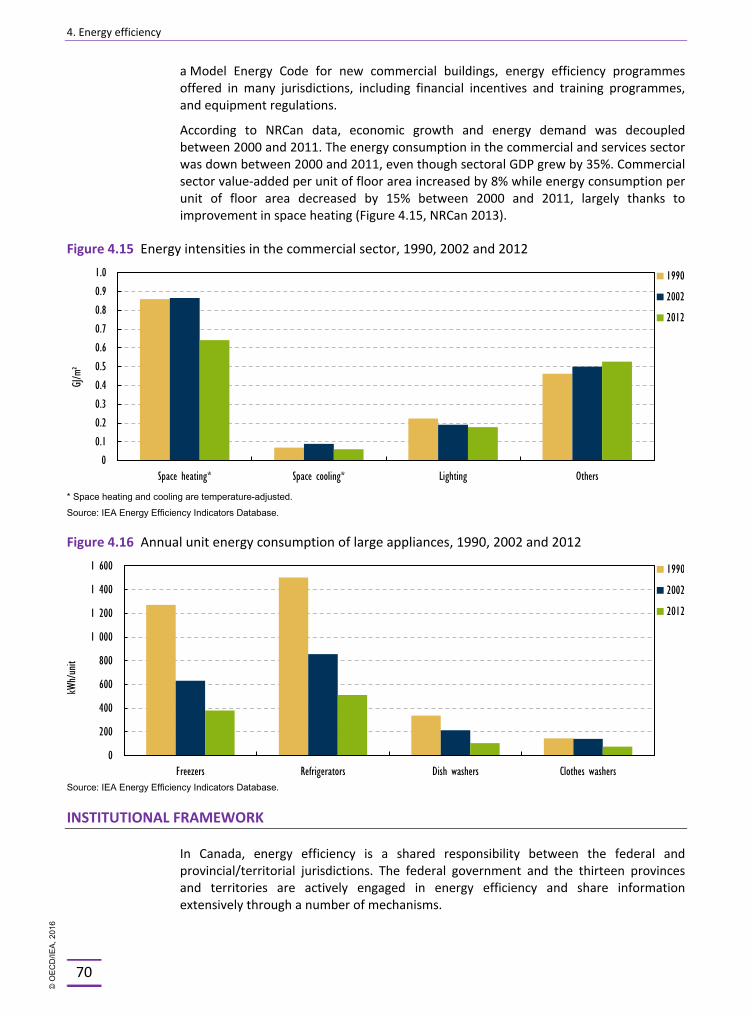
4. Energy efficiency
70
a Model Energy Code for new commercial buildings, energy efficiency programmes offered in many jurisdictions, including financial incentives and training programmes, and equipment regulations.
According to NRCan data, economic growth and energy demand was decoupled between 2000 and 2011. The energy consumption in the commercial and services sector was down between 2000 and 2011, even though sectoral GDP grew by 35%. Commercial sector value-added per unit of floor area increased by 8% while energy consumption per unit of floor area decreased by 15% between 2000 and 2011, largely thanks to improvement in space heating (Figure 4.15, NRCan 2013).
Figure 4.15 Energy intensities in the commercial sector, 1990, 2002 and 2012
* Space heating and cooling are temperature-adjusted.
Source: IEA Energy Efficiency Indicators Database.
Figure 4.16 Annual unit energy consumption of large appliances, 1990, 2002 and 2012
Source: IEA Energy Efficiency Indicators Database.
INSTITUTIONAL FRAMEWORK
In Canada, energy efficiency is a shared responsibility between the federal and provincial/territorial jurisdictions. The federal government and the thirteen provinces and territories are actively engaged in energy efficiency and share information extensively through a number of mechanisms.
0.0
0.1
0.2
0.3
0.4
0.5
0.6
0.7
0.8
0.9
1.0
Space heating* Space cooling* Lighting Others
GJ/m
²
1990
2002
2012
0
0
200
400
600
800
1 000
1 200
1 400
1 600
Freezers Refrigerators Dish washers Clothes washers
kWh/un
it
1990
2002
2012
© O
EC
D/IE
A, 2
016
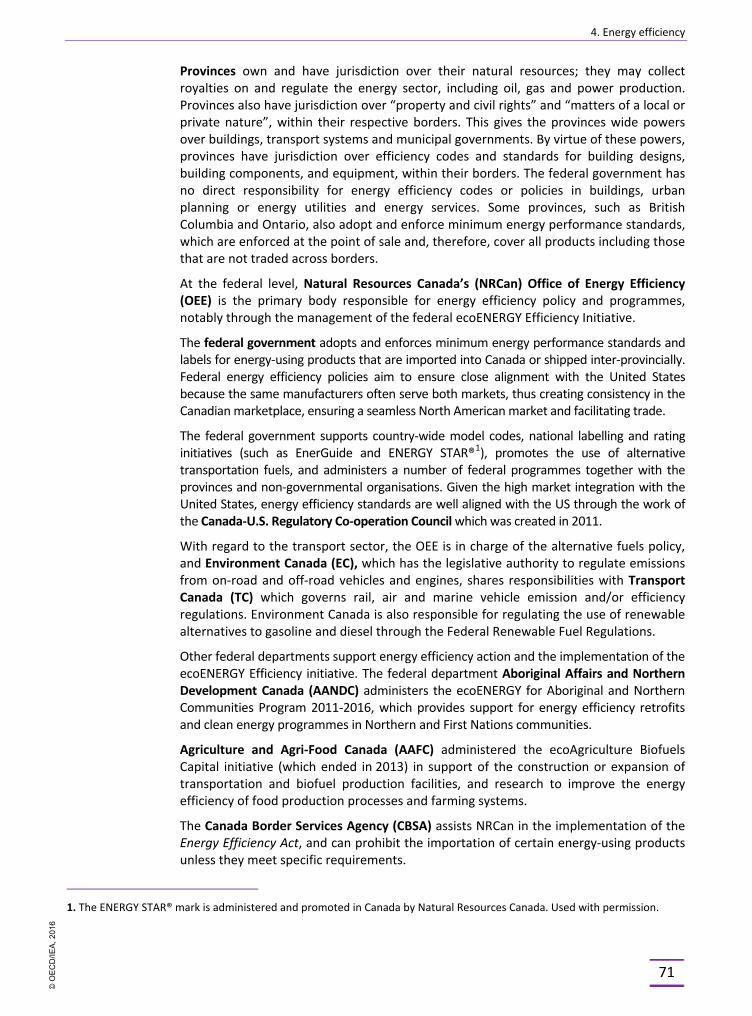
4. Energy efficiency
71
Provinces own and have jurisdiction over their natural resources; they may collect royalties on and regulate the energy sector, including oil, gas and power production. Provinces also have jurisdiction over “property and civil rights” and “matters of a local or private nature”, within their respective borders. This gives the provinces wide powers over buildings, transport systems and municipal governments. By virtue of these powers, provinces have jurisdiction over efficiency codes and standards for building designs, building components, and equipment, within their borders. The federal government has no direct responsibility for energy efficiency codes or policies in buildings, urban planning or energy utilities and energy services. Some provinces, such as British Columbia and Ontario, also adopt and enforce minimum energy performance standards, which are enforced at the point of sale and, therefore, cover all products including those that are not traded across borders.
At the federal level, Natural Resources Canada’s (NRCan) Office of Energy Efficiency (OEE) is the primary body responsible for energy efficiency policy and programmes, notably through the management of the federal ecoENERGY Efficiency Initiative.
The federal government adopts and enforces minimum energy performance standards and labels for energy-using products that are imported into Canada or shipped inter-provincially. Federal energy efficiency policies aim to ensure close alignment with the United States because the same manufacturers often serve both markets, thus creating consistency in the Canadian marketplace, ensuring a seamless North American market and facilitating trade.
The federal government supports country-wide model codes, national labelling and rating initiatives (such as EnerGuide and ENERGY STAR®1), promotes the use of alternative transportation fuels, and administers a number of federal programmes together with the provinces and non-governmental organisations. Given the high market integration with the United States, energy efficiency standards are well aligned with the US through the work of the Canada-U.S. Regulatory Co-operation Council which was created in 2011.
With regard to the transport sector, the OEE is in charge of the alternative fuels policy, and Environment Canada (EC), which has the legislative authority to regulate emissions from on-road and off-road vehicles and engines, shares responsibilities with Transport Canada (TC) which governs rail, air and marine vehicle emission and/or efficiency regulations. Environment Canada is also responsible for regulating the use of renewable alternatives to gasoline and diesel through the Federal Renewable Fuel Regulations.
Other federal departments support energy efficiency action and the implementation of the ecoENERGY Efficiency initiative. The federal department Aboriginal Affairs and Northern Development Canada (AANDC) administers the ecoENERGY for Aboriginal and Northern Communities Program 2011-2016, which provides support for energy efficiency retrofits and clean energy programmes in Northern and First Nations communities.
Agriculture and Agri-Food Canada (AAFC) administered the ecoAgriculture Biofuels Capital initiative (which ended in 2013) in support of the construction or expansion of transportation and biofuel production facilities, and research to improve the energy efficiency of food production processes and farming systems.
The Canada Border Services Agency (CBSA) assists NRCan in the implementation of the Energy Efficiency Act, and can prohibit the importation of certain energy-using products unless they meet specific requirements.
1. The ENERGY STAR® mark is administered and promoted in Canada by Natural Resources Canada. Used with permission.
© O
EC
D/IE
A, 2
016
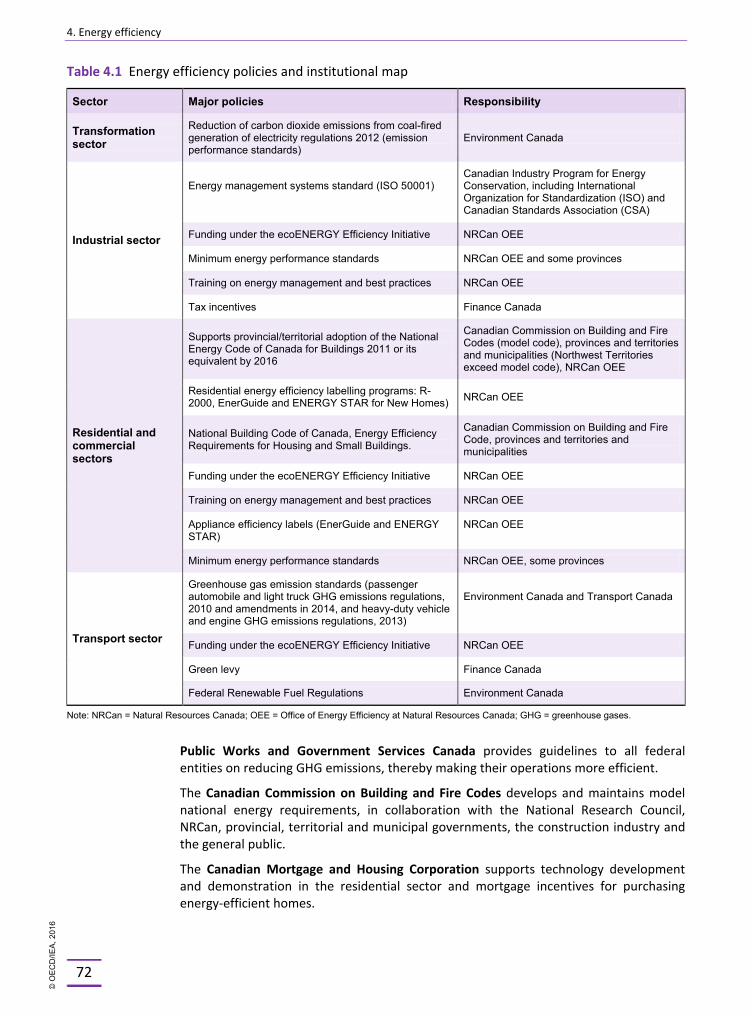
4. Energy efficiency
72
Table 4.1 Energy efficiency policies and institutional map
Sector Major policies Responsibility
Transformation sector
Reduction of carbon dioxide emissions from coal-fired generation of electricity regulations 2012 (emission performance standards)
Environment Canada
Industrial sector
Energy management systems standard (ISO 50001)
Canadian Industry Program for Energy Conservation, including International Organization for Standardization (ISO) and Canadian Standards Association (CSA)
Funding under the ecoENERGY Efficiency Initiative NRCan OEE
Minimum energy performance standards NRCan OEE and some provinces
Training on energy management and best practices NRCan OEE
Tax incentives Finance Canada
Residential and commercial sectors
Supports provincial/territorial adoption of the National Energy Code of Canada for Buildings 2011 or its equivalent by 2016
Canadian Commission on Building and Fire Codes (model code), provinces and territories and municipalities (Northwest Territories exceed model code), NRCan OEE
Residential energy efficiency labelling programs: R-2000, EnerGuide and ENERGY STAR for New Homes) NRCan OEE
National Building Code of Canada, Energy Efficiency Requirements for Housing and Small Buildings.
Canadian Commission on Building and Fire Code, provinces and territories and municipalities
Funding under the ecoENERGY Efficiency Initiative NRCan OEE
Training on energy management and best practices NRCan OEE
Appliance efficiency labels (EnerGuide and ENERGY STAR)
NRCan OEE
Minimum energy performance standards NRCan OEE, some provinces
Transport sector
Greenhouse gas emission standards (passenger automobile and light truck GHG emissions regulations, 2010 and amendments in 2014, and heavy-duty vehicle and engine GHG emissions regulations, 2013)
Environment Canada and Transport Canada
Funding under the ecoENERGY Efficiency Initiative NRCan OEE
Green levy Finance Canada
Federal Renewable Fuel Regulations Environment Canada
Note: NRCan = Natural Resources Canada; OEE = Office of Energy Efficiency at Natural Resources Canada; GHG = greenhouse gases.
Public Works and Government Services Canada provides guidelines to all federal entities on reducing GHG emissions, thereby making their operations more efficient.
The Canadian Commission on Building and Fire Codes develops and maintains model national energy requirements, in collaboration with the National Research Council, NRCan, provincial, territorial and municipal governments, the construction industry and the general public.
The Canadian Mortgage and Housing Corporation supports technology development and demonstration in the residential sector and mortgage incentives for purchasing energy-efficient homes.
© O
EC
D/IE
A, 2
016
4. Energy efficiency
73
First Nations communities are in charge of planning and managing their own transportation and building codes on and, in some cases, off First Nations land, and can reduce energy costs while increasing energy security in remote areas.
Although there is no requirement to align, efforts are made to co-ordinate energy efficiency policies across Canada’s federal, provincial and territorial authorities at the ministerial level through the Energy and Mines Ministers’ Conference (EMMC) and its Steering Committee on Energy Efficiency (SCEE). Based on the 2011 Collaborative Approach to Energy and its associated action plan, the EMMC put forward a co-ordinated, complementary agenda for energy efficiency in the built environment and equipment, industry and transportation sectors in 2012.
Municipalities and local authorities influence energy use through land-use planning policy, building code enforcement, transportation, and funding energy efficiency projects with support of federal programmes and other initiatives.
POLICIES AND MEASURES
LEGISLATION
Federal energy efficiency policies in Canada are governed by the Energy Efficiency Act (1992), the Railway Safety Act and the Canada Shipping Act (2001).
The Energy Efficiency Act authorises the federal government to establish minimum energy performance standards (MEPS), set labelling requirements, promote energy efficiency and the use of alternative energy sources, and to collect data for energy-using products that are marketed in Canada.
Since regulations were adopted first in 1995, MEPS have been regularly created, strengthened and aligned with the United States’ standards, a major export market for Canadian products.
With the help of federal programmes, like the ecoENERGY Efficiency Initiative, the federal government has worked together with the provinces and territories as well as with all industry stakeholders and non-governmental organisations (NGOs) on the preparation of harmonised approaches to avoid diverging requirements across Canada. For instance in the buildings sector, the National Energy Code for Buildings was adopted as a federal model code, which provinces and territories can adopt and adapt to their local requirements.
Other federal standards are set under the Railway Safety Act which provides the legal basis for Transport Canada to regulate federal railways with regard to rail safety, security and environmental impacts of rail operations in Canada. The Shipping Act and its regulations promote the protection of the marine environment from navigation and shipping activities and implement the International Maritime Organization’s energy efficiency and emissions standards in Canada.
The Canadian Environment Protection Act 1999 (CEPA 1999) is the legal basis for regulating GHG emissions from various types of facilities, from vehicles, engines and equipment. Under the 2006 Clean Air Regulatory Agenda, the government has so far presented GHG regulations for the transport and power sectors.
FEDERAL PROGRAMMES
Next to regulatory intervention with standards and labels, the federal government provides some financial support to energy efficiency through subsidies and tax incentives.
© O
EC
D/IE
A, 2
016
4. Energy efficiency
74
However, spending on energy efficiency has scaled back since 2011. The federal government now relies more on the promotion of voluntary actions by building partnerships with industry, NGOs and banks and catalysing co-ordination between the provinces and territories across Canada. The federal government supports benchmarking activities, incentive-based reward programmes and innovative energy efficiency data tools.
Federal financial support to energy efficiency
The ecoENERGY Efficiency Initiative is the federal programme which has been financing federal policy action (as indicated below) under sector-specific sub-programmes for industry and commercial, residential, appliances and equipment, vehicles and alternative fuels.
With a total funding of CAD 195 million available for the period of 2011-16, the government supports energy efficiency activities under the following sub-programmes (and its main actions):
§ ecoENERGY Efficiency for Industry (Canadian Industry Program for Energy Conservation (CIPEC), ISO 50001 and specialised energy audit)
§ ecoENERGY Efficiency for Buildings (National Energy Code for Buildings, ENERGY STAR benchmarking tool)
§ ecoENERGY Efficiency for Housing (National energy requirements for houses and small buildings, EnerGuide Rating System, R-2000 and ENERGY STAR for New Homes)
§ ecoENERGY Efficiency for Equipment Standards and Labelling
§ ecoENERGY Efficiency for Vehicles (vehicle and tyre fuel efficiency information and labelling for consumers, SmartWay Transport Partnership, fuel-efficient driver training, information and tools).
The ecoENERGY Retrofit ̶Homes programme (funding has ended) provided incentives for home-owners to undertake energy-efficient retrofits. More than 640 000 Canadian households benefitted from over CAD 934 million of federal funds between 2007 and 2012.
Actual funding levels have decreased as the federal government has put a greater focus on regulations, codes and standards, as well as on the provision of information and tools, and demand-side management programmes that are financed by energy utilities and supported by the provinces (see below).
Tax incentives
Cost-effective tax incentives are used to promote business investments. Canada provides two income tax incentives to encourage investment in energy-efficient and alternative energy technologies, in order to contribute to reductions in GHG emissions, improvements in air quality and diversification of the energy supply.
§ Accelerated capital cost allowance (CCA) under Class 43.2 – at a rate of 50% per year on a declining balance basis – allows the cost of eligible capital assets to be deducted more quickly than usual. It includes a variety of stationary equipment that generates energy by using renewable energy sources (e.g. wind, solar, geothermal) or fuels from waste, or that conserves energy by using fuel more efficiently. Eligibility is reviewed on an ongoing basis to ensure inclusion of appropriate technologies that have the potential to contribute to a reduction in GHG and air pollutants emissions, and diversify the energy supply.
© O
EC
D/IE
A, 2
016
4. Energy efficiency
75
§ The Canadian Renewable and Conservation Expense allows certain intangible start-up expenses associated with clean energy and energy conservation projects eligible for Class 43.2 to be deducted in full in the year incurred, or transferred to investors using flow-through shares.
In addition, the Canadian Mortgage and Housing Corporation offers reduced mortgage loan insurance premiums for home-buyers who purchase energy-efficient homes or make energy efficiency upgrades.
FEDERAL PROGRAMMES BY SECTOR
INDUSTRY SECTOR
In 2011, federal, provincial and territorial governments endorsed the implementation of ISO 50001 Energy Management Systems standard as a national standard.
Improved industrial energy management is guided by the continuous adoption of the ISO 50001 by Canada’s industry, which is also supported by the Canadian Industry Program for Energy Conservation (CIPEC) — a voluntary industry-government partnership, which brings together 50 trade associations in 21 industrial sectors and 2400 facilities. Between 2011 and 2013, over 300 new companies joined CIPEC to reduce their energy costs; 12 industrial plants have received cost-shared assistance to implement ISO 50001 energy management systems, and 9 industrial plants have received cost-shared assistance to implement in-depth energy audits. This model is currently being adopted in Germany and considered best practice under the German G7 Presidency as a model for an energy network for industrial efficiency.
Between 1990 and 2011, Canada records a combined improvement in energy efficiency by 10.4% or an average of 0.5% per year across the CIPEC industry partners (CIPEC, 2013). CIPEC is funded under the ecoENERGY Efficiency for Industry initiative.
Despite these positive achievements, the adoption of energy-efficient technologies is more challenging in energy-intensive industries and small and medium-sized enterprises (SMEs), which largely serve provincial and territorial markets.
Thanks to the availability of low-cost natural gas and electricity from hydropower industrial energy users in many provinces have been shielded from the cost of their activities. However, across Canada, electricity prices for industrial users have been on the rise and have been above the prices in the United States since 2009/10 (see Chapter 8 on Electricity, Figures 8.9 and 8.10.). Energy efficiency investment could prove an important strategy for industrial players to maintain the competitiveness of their Canadian operations.
International comparison confirms the large potential for future action. By May 2014, eleven sites were certified ISO 50001 in Canada, according to the latest data collected by the Federal Environment Agency of Germany (Peglau R., 2014). All the plants certified are CIPEC members, such as Broan-NuTone, Chrysler Canada Inc. (Brampton), IBM Canada Limitée (Bromont), Lincoln Electric Company of Canada, New Gold Inc. (New Afton Mine), Soprema Inc., 3M Canada (London), and VeriForm Inc. At global scale, there were 7 345 sites ISO 50001 certified in total. The US had 62 certified sites, Japan 40 sites, while Germany led efforts in improving industrial management with 3 441 certified sites, followed by France (973 sites), the Netherlands (408) and
© O
EC
D/IE
A, 2
016
4. Energy efficiency
76
the United Kingdom (355). Between 2011 and 2016, an ISO 50001 pilot programme will be completed, mainly through CIPEC, that should also provide valuable lessons for provinces, territories and utilities that are considering their own initiatives to support ISO 50001 implementation.
Box 4.1 Innovation in the Canadian forest sector
Energy efficiency improvements have a direct impact on the competitiveness of industry, and can be achieved by innovation to move to higher value products. In Canada, process innovation in the forestry and paper industry has advanced and there are a number of initiatives to promote technology innovation in these sectors, for instance the Investments in Forest Industry Transformation (IFIT) programme or the FPInnovations public-private partnership (PPP).
IFIT was created in 2010. It is funded by the government of Canada to improve economic competitiveness and environmental sustainability by supporting the deployment of innovative “first-in-kind” forestry technologies. The programme provides non-repayable contributions up to 50% of the cost of pilot or commercial-scale projects. Eight of the 14 projects supported to date correspond to world-leading technologies. IFIT has been allocated about USD 81 million (CAD 90.4 million) over the next four years (NRCan, 2014).
FPInnovations is a public-private partnership created in 2007 to improve profitability, performance, sustainability and value creation in the Canadian forest sector by aligning government and private objectives, and incorporates collaboration with universities (FPInnovations, 2011). It has become the world’s largest partnership focusing on forest sector innovation (FPAC, 2014) with a reference budget of almost USD 90 million (CAD 100 million) and around 550 staff. The organisation measures its performance by assessing returns on innovation investment in terms of outcomes such as new products and services introduced in the market (FPInnovations, 2011). Such measures have helped the forest industry to innovate and produce higher value products over time.
International experience shows that key drivers to significantly improving the level of efficiency in the industry sector are the impact of energy prices, the regular monitoring and auditing of energy management processes and the adoption of voluntary conservation targets in a bottom-up approach by facility as a basis for joint agreements with the industry. Growth in the oil production is the most influential factor in the energy intensity performance of the country. The industry has started to address the emissions and environmental track record of oil and gas production for instance, at provincial level, Alberta’s Specified Gas Emitters Regulation (2007), applicable to all emitters over 100 000 tonnes GHG per year, the first Canadian province to develop legislation relating to GHG emissions, and through industry action, such as the Canada’s Oil Sands Innovation Alliance (COSIA). These activities could be scaled up to reduce the energy intensity and improve the performance of oil-sands production. Technology innovation has been driving the cost down and new production methods that use less energy input should be promoted through networks of industry and government from an energy-efficiency objective point of view.
© O
EC
D/IE
A, 2
016
4. Energy efficiency
77
RESIDENTIAL AND COMMERCIAL SECTOR
Appliance and equipment standards and labelling
Under the Energy Efficiency Act and its related Energy Efficiency Regulations, minimum energy performance standards (MEPS) have been established for more than forty product categories.2
The federal government strongly emphasises alignment with the United States. Under an agreement with the United States Environmental Protection Agency (EPA), NRCan administers the ENERGY STAR programme in Canada. After ENERGY STAR benchmarking tool pilot projects, Canada decided in 2013 to offer the same product categories using the same specifications as the US EPA. The ENERGY STAR technical specifications in Canada are today completely aligned with US EPA, reducing the administrative burden on manufacturers, and ensuring full product information is available for consumers and utilities.3
Eleven provinces and territories, including utilities in these jurisdictions, deliver programmes and incentives for high-efficiency equipment using the international labelling programmes: the ENERGY STAR and the EnerGuide labels are the national label for key consumer items—houses, light-duty vehicles, and a number of energy-using products. The ENERGY STAR marking indicates that the product or appliance is in the top 15% to 30% of its class for energy performance, making it easier for consumers to choose highly efficient products. Products that display the symbol have been tested according to prescribed procedures and have been certified to meet or exceed higher energy efficiency levels without compromising performance. About 1 000 major manufacturers and retailers of energy-efficient products, utilities and energy retailers promote the label in over 70 product categories.
The Energy Efficiency Regulations were amended 13 times since 1995, the last time in 2014. However, technologies are evolving rapidly, notably in electronics, much faster than the time it takes to develop and implement new MEPS.
At the same time, federal regulatory misalignment with the United States is growing. Amid these challenges, the federal government will need to update MEPS more frequently and closely align them with those of the United States to keep pace with new technology developments and consumption patterns.
Based on the impact of Energy Efficiency Regulations, NRCan estimates aggregate annual energy savings to almost double from 185.15 petajoules (PJ) in 2011 to 336.47 PJ in 2020. Figure 4.16 illustrates the advances in energy efficiency, with decreasing annual unit energy consumption of large appliances, between 1990, 2002 and 2012 for refrigerators, freezers and dish washers.
2. MEPs are established in 47 product categories, including major household appliances, home electronics, water heaters, heating and air conditioning, heating equipment, automatic icemakers, dehumidifiers, dry-type transformers, electric motors below 200 horsepower, heat pumps, beverage-vending machines, commercial refrigeration, and general service and other lighting. 3. Alignment is complete with the exception of windows, doors, skylights and heat recovery ventilators, where there are Canadian specific requirements because of the colder climate.
© O
EC
D/IE
A, 2
016

4. Energy efficiency
78
Buildings codes
Building regulation largely falls under the responsibility of the provincial and territorial governments and local authorities. Building requirements and local needs and interests differ depending on climatic conditions and energy resource endowment.
Federal action on energy efficiency aims to set minimum safety and environmental standards for new buildings through model codes.
The federal government (NRCan) developed a first National Energy Code of Canada for Buildings in collaboration with the National Research Council Canada in 1997.
After the first code, NRCan’s OEE, in co-operation with the National Research Council’s Canadian Codes Centre championed and co-funded the development of the National Energy Code of Canada for Buildings (NECB) 2011. The NECB covers new commercial buildings and new residential buildings larger than 600 m2 or higher than three storeys. The NECB 2011 was developed by the Canadian Commission on Building and Fire Codes (CCBFC) in consultation with various industry and public forums.
Provinces and territories can adopt the model code and adapt it to local requirements. As of April 2015, five provinces (Ontario, British Columbia, Nova Scotia, Manitoba and Alberta), representing 70% of forecasted new commercial/institutional floor space, had adopted it (see Figure 4.17). In total, 12 Canadian provinces and territories are in the process of adopting or adapting the Code or considering adopting it, and one territory (Northwest Territories) published guidelines that exceed it. NRCan’s OEE is committed to a cycle of further improvements in a new Code with the next iteration to include new equipment standards and regulations, and energy performance improvements to progress towards net-zero-energy buildings. NRCan is also investigating metrics to rate the progression of new building designs towards net-zero-energy consumption that may be used for the recognition of leading building designs. The NEBC 2015 has been published by NRC with 90 changes, further improving the NECB 2011 and clarifying the application of the code for residential and small buildings.
For residential buildings smaller than 600 m2 and three storeys-high or less, an update to the 2010 National Building Code was published and it adds energy efficiency requirements into the code. By April 2016, over 73% of new houses in Canada will be built following energy requirements in building codes.
Benchmarking and labelling for homes and buildings
Next to model building codes, national building labelling and ratings to encourage energy efficiency investment in buildings have been developed by the federal government, the construction and manufacturing industry, home-owners, the public and non-governmental organisations (NGOs).
Canada has adapted the U.S. EPA ENERGY STAR Portfolio Manager benchmarking tool for evaluating existing commercial/institutional buildings in Canada. The free on-line tool was officially launched in Canada in August 2013. As of March 2015, nearly 10 600 Canadian buildings, representing over 17% of floor space in Canada, are using the tool. The ENERGY STAR for New Homes label promotes the construction of new residential homes that are 20% more energy-efficient than those built to minimum building code requirements. Up to fiscal year 2014/15, there have been over 50 000 ENERGY STAR qualified homes built in Canada. For over 30 years, NRCan has administered the R-2000 Standard that certifies residential dwellings that are 50% more
© O
EC
D/IE
A, 2
016
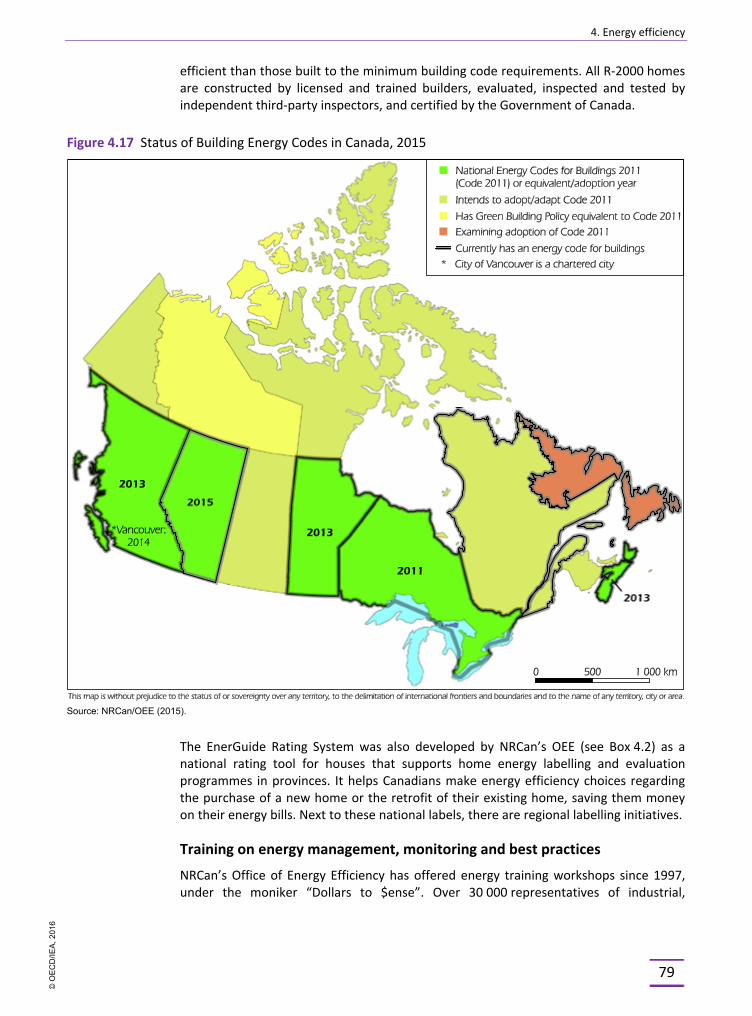
4. Energy efficiency
79
efficient than those built to the minimum building code requirements. All R-2000 homes are constructed by licensed and trained builders, evaluated, inspected and tested by independent third-party inspectors, and certified by the Government of Canada.
Figure 4.17 Status of Building Energy Codes in Canada, 2015
Source: NRCan/OEE (2015).
The EnerGuide Rating System was also developed by NRCan’s OEE (see Box 4.2) as a national rating tool for houses that supports home energy labelling and evaluation programmes in provinces. It helps Canadians make energy efficiency choices regarding the purchase of a new home or the retrofit of their existing home, saving them money on their energy bills. Next to these national labels, there are regional labelling initiatives.
Training on energy management, monitoring and best practices
NRCan’s Office of Energy Efficiency has offered energy training workshops since 1997, under the moniker “Dollars to $ense”. Over 30 000 representatives of industrial,
© O
EC
D/IE
A, 2
016
4. Energy efficiency
80
commercial and institutional organisations and government departments from across Canada have participated in these professional training workshops and gained invaluable education and insight into several areas of energy management, including energy management planning, monitoring, key saving opportunities, energy project financing, existing buildings commissioning and Energy Management Information Systems (EMIS). The original delivery model (in which OEE exclusively scheduled and marketed the workshops) has evolved over the last two years into a more collaborative arrangement with utilities, industry associations and other partners; the offering of customised workshops has also become more common. NRCan has also collaborated on other training initiatives, including the development of a practitioner training course for building commissioning agents.
Box 4.2 EnerGuide labelling
EnerGuide labels for products
Under the Energy Efficiency Regulations, the EnerGuide is a mandatory national energy label for the rating and labelling of the energy performance of key consumer items—clothes dryers, clothes washers (including integrated washer-dryers), dishwashers, freezers, electric ranges, cooktops and ovens, refrigerators, refrigerator-freezers and wine chillers, and room air conditioners. The EnerGuide label compares the energy performance of a product to others in its class, and is administered by NRCan. The label must, by law, be affixed on major appliances and room air conditioners and be visible before sale. NRCan also works with manufacturer associations to administer the EnerGuide label on a voluntary basis for many home-heating products. With water-heater manufacturers joining in 2013 to offer a label for consumers, there are now five products with a voluntary EnerGuide label: central air conditioners, furnaces (oil-, gas- or propane-fired), heat pumps-air source, gas fireplaces and water heaters.
EnerGuide label for residential properties
The EnerGuide Rating System is also used to voluntarily label low-rise residential properties (new and existing dwellings). It provides easily accessible energy performance information that can help Canadians take decisions when designing, constructing, purchasing, renovating or operating a home. It has been instrumental in the transformation of the residential market towards more energy-efficient homes in Canada. To date, many provinces, territories, and utilities lever the EnerGuide Rating System in their own programming, codes, and regulations. Since 1998, over one million Canadian homes (one in twenty) have benefitted from having their energy performance rated using EnerGuide.
The EnerGuide Rating System estimates the energy performance of houses. The home evaluation and rating provide guidance to home-owners who want to make energy improvements to their house. In addition, the EnerGuide Rating System continues to support the delivery of retrofit incentive programmes by provinces, territories, and utilities. It helps ensure that qualifying retrofits improve the energy efficiency of a home.
Over 2 000 builders also use the EnerGuide Rating System to provide home-owners with efficient new homes. It helps builders to choose the most beneficial and cost-effective upgrades for energy efficiency during the planning stage. EnerGuide also underpins the R-2000 and ENERGY STAR premium home labels.
© O
EC
D/IE
A, 2
016
4. Energy efficiency
81
Federal Buildings Initiative
Canada also continues to show leadership through the management of its own buildings. The federal government offers support to federally owned buildings to help reduce their energy footprint. Since 1991, the Federal Building Initiative has provided knowledge, training, expertise, and assistance to plan and implement energy-saving projects. The programme provides support to plan for an energy performance contract. The government is saving CAD 59 million annually in energy costs thanks to these projects. Some CAD 420 million in costs has been financed by the companies, instead of the government.
Energy efficiency market and energy service providers
Canada has a strong market for energy services led by demand-side management (DSM) programmes and other energy efficiency services offered through utility programmes. Energy utility-led efficiency programmes account for between 35% and 48% of all residential and service-based energy efficiency programmes. In 2013, total DSM spending from electric and natural gas utilities amounted to CAD 800 million (IEA 2014).
In Canada, most electrical capacity is publicly owned (see Chapter 8) and provincial Crown Corporations continue to dominate the generation and transmission components of the industry. As publicly owned businesses, utilities have been assigned the responsibility to implement energy efficiency programmes through both business and policy drivers. British Columbia has requirements for DSM to be treated equally in resource planning, with a DSM target for BC Hydro, and all utilities (including private) are allowed to earn a rate of return on DSM activities.
Electricity retail prices are rising in most provinces, emphasising the importance of energy efficiency programmes and services. DSM programmes range from supporting building retrofits by grants and rebates, to offering consulting services, and providing financing for reducing industrial energy consumption. The federal programmes, EnerGuide and ENERGY STAR, are widely used by electric utilities in incentive programmes that recognise efficient purchases and home renovations.
TRANSPORT SECTOR
Transportation (road, rail, air, and marine) plays a large role in Canada, given the need to move people, freight, raw materials and manufactured goods over large geographical distances across the North American market. Between 1990 and 2011, the total number of vehicles in Canada increased by 50%, with heavy-duty vehicles (HDVs) having the largest increase, by 137% (Transports Canada, 2014). There has also been a shift to larger sport utility vehicles (SUVs) and trucks, and growing use of freight transportation. Passenger cars and light-duty vehicles (LDVs) account for 13% of Canada’s total GHG emissions; HDVs account for 36% (Government of Canada, 2014).
Canadian GHG emission regulations for improved vehicle efficiency closely align with American regulations which are a product of the integrated vehicle market between Canada and the US where free trade of automobiles across borders has converged on performance and policies.
In close alignment with US EPA rules, Canada put in place GHG emission standards for passenger cars, light-duty and on-road heavy-duty vehicles, manufactured or imported
© O
EC
D/IE
A, 2
016
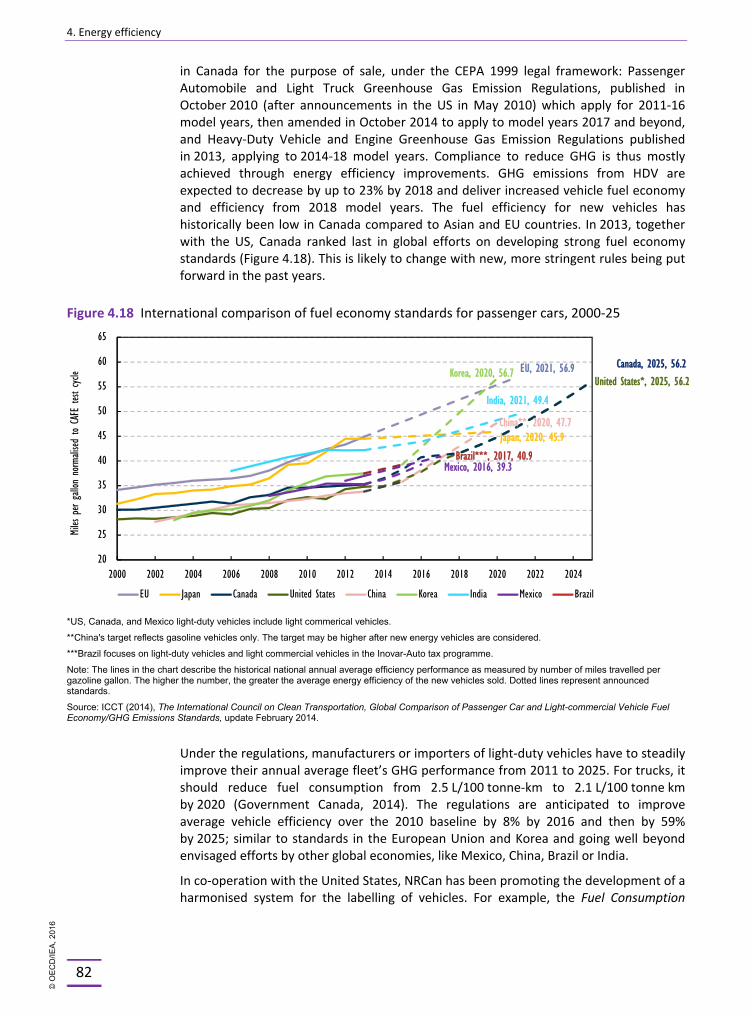
4. Energy efficiency
82
in Canada for the purpose of sale, under the CEPA 1999 legal framework: Passenger Automobile and Light Truck Greenhouse Gas Emission Regulations, published in October 2010 (after announcements in the US in May 2010) which apply for 2011-16 model years, then amended in October 2014 to apply to model years 2017 and beyond, and Heavy-Duty Vehicle and Engine Greenhouse Gas Emission Regulations published in 2013, applying to 2014-18 model years. Compliance to reduce GHG is thus mostly achieved through energy efficiency improvements. GHG emissions from HDV are expected to decrease by up to 23% by 2018 and deliver increased vehicle fuel economy and efficiency from 2018 model years. The fuel efficiency for new vehicles has historically been low in Canada compared to Asian and EU countries. In 2013, together with the US, Canada ranked last in global efforts on developing strong fuel economy standards (Figure 4.18). This is likely to change with new, more stringent rules being put forward in the past years.
Figure 4.18 International comparison of fuel economy standards for passenger cars, 2000-25
*US, Canada, and Mexico light-duty vehicles include light commerical vehicles.
**China's target reflects gasoline vehicles only. The target may be higher after new energy vehicles are considered.
***Brazil focuses on light-duty vehicles and light commercial vehicles in the Inovar-Auto tax programme.
Note: The lines in the chart describe the historical national annual average efficiency performance as measured by number of miles travelled per gazoline gallon. The higher the number, the greater the average energy efficiency of the new vehicles sold. Dotted lines represent announced standards.
Source: ICCT (2014), The International Council on Clean Transportation, Global Comparison of Passenger Car and Light-commercial Vehicle Fuel Economy/GHG Emissions Standards, update February 2014.
Under the regulations, manufacturers or importers of light-duty vehicles have to steadily improve their annual average fleet’s GHG performance from 2011 to 2025. For trucks, it should reduce fuel consumption from 2.5 L/100 tonne-km to 2.1 L/100 tonne km by 2020 (Government Canada, 2014). The regulations are anticipated to improve average vehicle efficiency over the 2010 baseline by 8% by 2016 and then by 59% by 2025; similar to standards in the European Union and Korea and going well beyond envisaged efforts by other global economies, like Mexico, China, Brazil or India.
In co-operation with the United States, NRCan has been promoting the development of a harmonised system for the labelling of vehicles. For example, the Fuel Consumption
United States*, 2025, 56.2 Canada, 2025, 56.2 EU, 2021, 56.9
Japan, 2020, 45.9 China**, 2020, 47.7
Korea, 2020, 56.7
India, 2021, 49.4
Mexico, 2016, 39.3
20
25
30
35
40
45
50
55
60
65
2000 2002 2004 2006 2008 2010 2012 2014 2016 2018 2020 2022 2024
Miles
per
gallo
n no
rmali
sed to
CAF
E tes
t cycl
e
EU Japan Canada United States China Korea India Mexico Brazil
Brazil***, 2017, 40.9
© O
EC
D/IE
A, 2
016
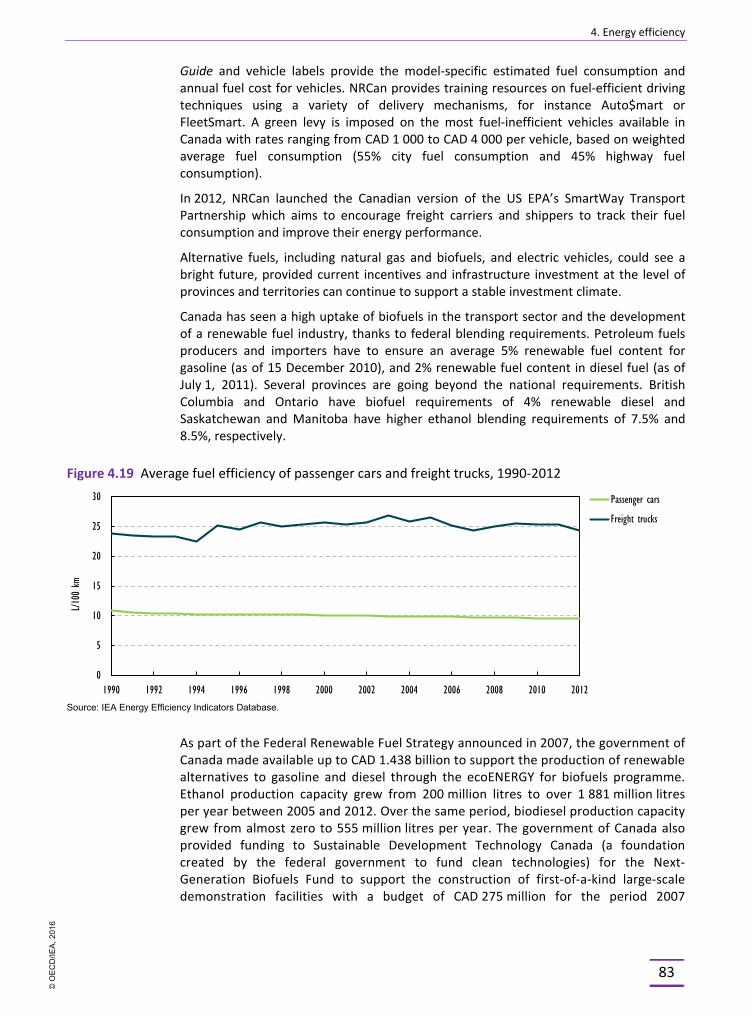
4. Energy efficiency
83
Guide and vehicle labels provide the model-specific estimated fuel consumption and annual fuel cost for vehicles. NRCan provides training resources on fuel-efficient driving techniques using a variety of delivery mechanisms, for instance Auto$mart or FleetSmart. A green levy is imposed on the most fuel-inefficient vehicles available in Canada with rates ranging from CAD 1 000 to CAD 4 000 per vehicle, based on weighted average fuel consumption (55% city fuel consumption and 45% highway fuel consumption).
In 2012, NRCan launched the Canadian version of the US EPA’s SmartWay Transport Partnership which aims to encourage freight carriers and shippers to track their fuel consumption and improve their energy performance.
Alternative fuels, including natural gas and biofuels, and electric vehicles, could see a bright future, provided current incentives and infrastructure investment at the level of provinces and territories can continue to support a stable investment climate.
Canada has seen a high uptake of biofuels in the transport sector and the development of a renewable fuel industry, thanks to federal blending requirements. Petroleum fuels producers and importers have to ensure an average 5% renewable fuel content for gasoline (as of 15 December 2010), and 2% renewable fuel content in diesel fuel (as of July 1, 2011). Several provinces are going beyond the national requirements. British Columbia and Ontario have biofuel requirements of 4% renewable diesel and Saskatchewan and Manitoba have higher ethanol blending requirements of 7.5% and 8.5%, respectively.
Figure 4.19 Average fuel efficiency of passenger cars and freight trucks, 1990-2012
Source: IEA Energy Efficiency Indicators Database.
As part of the Federal Renewable Fuel Strategy announced in 2007, the government of Canada made available up to CAD 1.438 billion to support the production of renewable alternatives to gasoline and diesel through the ecoENERGY for biofuels programme. Ethanol production capacity grew from 200 million litres to over 1 881 million litres per year between 2005 and 2012. Over the same period, biodiesel production capacity grew from almost zero to 555 million litres per year. The government of Canada also provided funding to Sustainable Development Technology Canada (a foundation created by the federal government to fund clean technologies) for the Next-Generation Biofuels Fund to support the construction of first-of-a-kind large-scale demonstration facilities with a budget of CAD 275 million for the period 2007
0
5
10
15
20
25
30
1990 1992 1994 1996 1998 2000 2002 2004 2006 2008 2010 2012
L/100
km
Passenger cars
Freight trucks
© O
EC
D/IE
A, 2
016
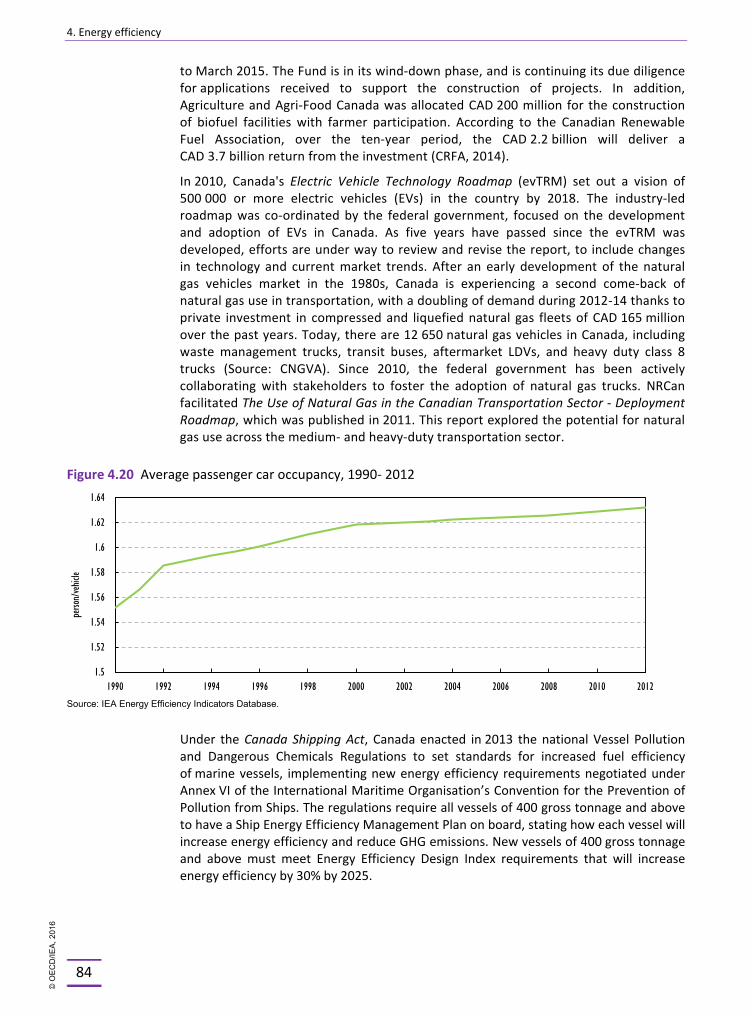
4. Energy efficiency
84
to March 2015. The Fund is in its wind-down phase, and is continuing its due diligence for applications received to support the construction of projects. In addition, Agriculture and Agri-Food Canada was allocated CAD 200 million for the construction of biofuel facilities with farmer participation. According to the Canadian Renewable Fuel Association, over the ten-year period, the CAD 2.2 billion will deliver a CAD 3.7 billion return from the investment (CRFA, 2014).
In 2010, Canada's Electric Vehicle Technology Roadmap (evTRM) set out a vision of 500 000 or more electric vehicles (EVs) in the country by 2018. The industry-led roadmap was co-ordinated by the federal government, focused on the development and adoption of EVs in Canada. As five years have passed since the evTRM was developed, efforts are under way to review and revise the report, to include changes in technology and current market trends. After an early development of the natural gas vehicles market in the 1980s, Canada is experiencing a second come-back of natural gas use in transportation, with a doubling of demand during 2012-14 thanks to private investment in compressed and liquefied natural gas fleets of CAD 165 million over the past years. Today, there are 12 650 natural gas vehicles in Canada, including waste management trucks, transit buses, aftermarket LDVs, and heavy duty class 8 trucks (Source: CNGVA). Since 2010, the federal government has been actively collaborating with stakeholders to foster the adoption of natural gas trucks. NRCan facilitated The Use of Natural Gas in the Canadian Transportation Sector - Deployment Roadmap, which was published in 2011. This report explored the potential for natural gas use across the medium- and heavy-duty transportation sector.
Figure 4.20 Average passenger car occupancy, 1990- 2012
Source: IEA Energy Efficiency Indicators Database.
Under the Canada Shipping Act, Canada enacted in 2013 the national Vessel Pollution and Dangerous Chemicals Regulations to set standards for increased fuel efficiency of marine vessels, implementing new energy efficiency requirements negotiated under Annex VI of the International Maritime Organisation’s Convention for the Prevention of Pollution from Ships. The regulations require all vessels of 400 gross tonnage and above to have a Ship Energy Efficiency Management Plan on board, stating how each vessel will increase energy efficiency and reduce GHG emissions. New vessels of 400 gross tonnage and above must meet Energy Efficiency Design Index requirements that will increase energy efficiency by 30% by 2025.
1.5
1.52
1.54
1.56
1.58
1.6
1.62
1.64
1990 1992 1994 1996 1998 2000 2002 2004 2006 2008 2010 2012
perso
n/vehic
le
© O
EC
D/IE
A, 2
016
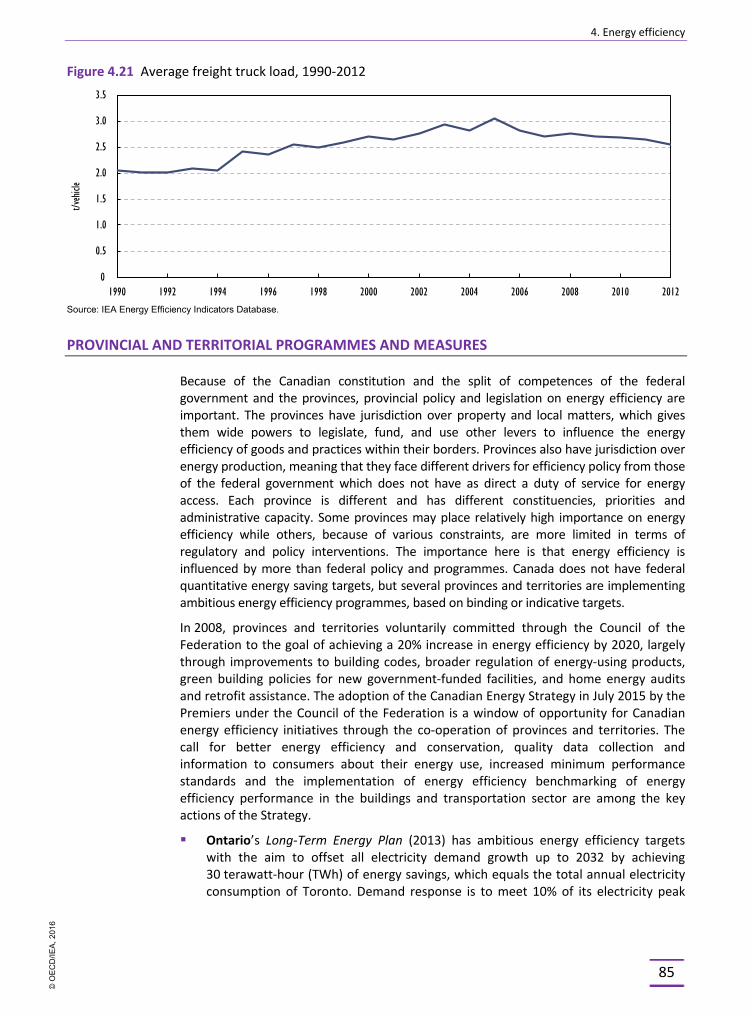
4. Energy efficiency
85
Figure 4.21 Average freight truck load, 1990-2012
Source: IEA Energy Efficiency Indicators Database.
PROVINCIAL AND TERRITORIAL PROGRAMMES AND MEASURES
Because of the Canadian constitution and the split of competences of the federal government and the provinces, provincial policy and legislation on energy efficiency are important. The provinces have jurisdiction over property and local matters, which gives them wide powers to legislate, fund, and use other levers to influence the energy efficiency of goods and practices within their borders. Provinces also have jurisdiction over energy production, meaning that they face different drivers for efficiency policy from those of the federal government which does not have as direct a duty of service for energy access. Each province is different and has different constituencies, priorities and administrative capacity. Some provinces may place relatively high importance on energy efficiency while others, because of various constraints, are more limited in terms of regulatory and policy interventions. The importance here is that energy efficiency is influenced by more than federal policy and programmes. Canada does not have federal quantitative energy saving targets, but several provinces and territories are implementing ambitious energy efficiency programmes, based on binding or indicative targets.
In 2008, provinces and territories voluntarily committed through the Council of the Federation to the goal of achieving a 20% increase in energy efficiency by 2020, largely through improvements to building codes, broader regulation of energy-using products, green building policies for new government-funded facilities, and home energy audits and retrofit assistance. The adoption of the Canadian Energy Strategy in July 2015 by the Premiers under the Council of the Federation is a window of opportunity for Canadian energy efficiency initiatives through the co-operation of provinces and territories. The call for better energy efficiency and conservation, quality data collection and information to consumers about their energy use, increased minimum performance standards and the implementation of energy efficiency benchmarking of energy efficiency performance in the buildings and transportation sector are among the key actions of the Strategy.
§ Ontario’s Long-Term Energy Plan (2013) has ambitious energy efficiency targets with the aim to offset all electricity demand growth up to 2032 by achieving 30 terawatt-hour (TWh) of energy savings, which equals the total annual electricity consumption of Toronto. Demand response is to meet 10% of its electricity peak
0.0
0.5
1.0
1.5
2.0
2.5
3.0
3.5
1990 1992 1994 1996 1998 2000 2002 2004 2006 2008 2010 2012
t/vehicle
0
© O
EC
D/IE
A, 2
016
4. Energy efficiency
86
demand by 2025 (or 2400 MW). The Ontario Building Code is phasing in higher energy efficiency requirements for new buildings with an estimated mitigation impact of 2.9 Mt resulting from initiatives related to the Growth Plan for the Greater Golden Horseshoe; natural gas demand-side management programmes, building code changes and other related buildings and cross-cutting initiatives. In Ontario, innovative energy saving tools for consumers have been developed, including the Green Button Initiative which makes it easier for utility customers to find out how much energy they use at home. Ontario’s electric utilities offer air miles reward points to customers that make a commitment and take action to save energy at home. The Race to Reduce and Greening Greater Toronto Program is a collaboration between office building landlords and tenants, and core utility providers to encourage smart energy use by behavioural change and positive team-building among landlords, tenants and employees. Ontario offers rebates for fuel-efficient vehicles, for the purchase of electric vehicles and charging stations for private use, up to CAD 8 500 for the purchase or lease of an eligible electric vehicle, and up to CAD 1 000 on the purchase and installation of an eligible charging station.
§ Quebec’s Energy Strategy 2006-15 provides for an increase in energy efficiency for all types of energy in all sectors and the deployment of new renewable energy generation (hydroelectricity, wind and bioenergy). Quebec is currently preparing a new Energy Strategy for the period 2016-25. Quebec spent over CAD 250 million in 2010 on energy efficiency programmes and had the second-highest energy efficiency spending per capita among Canadian provinces (IndEco, 2011). The measures to meet the energy efficiency targets set by the Energy Strategy are defined and implemented by the comprehensive Energy Efficiency and Innovative Plan approved by the government. With regard to electric vehicles, the Province of Quebec offers financial incentives (rebates) for the acquisition of battery electric vehicles and plug-in hybrids as well as home and workplace charging stations.
§ Northwest Territories has a large number of energy efficiency programmes for residential and commercial sectors. Eligible small businesses receive free energy audits and 25% of the cost of retrofit expenses, up to a CAD 10 000. The Energy Efficiency Incentive Program provides rebates for energy-efficient appliances, residential retrofits, and new homes ranging from CAD 50 to 4 500. The Northwest Territories Capital Asset Retrofit Fund tracks actual financial savings from retrofits and reinvests them into the Capital Asset Retrofit Fund. Through energy audits, building surveys and energy benchmarking, buildings are identified and retrofitted to improve their energy efficiency.
§ British Columbia provided incentives for home-owners to improve the energy efficiency of their homes under the LiveSmart BC Efficiency Incentive Program. Since the programme was launched in 2008, around CAD 110 million has been invested until it ended in March 2014. It has since become a cross-utility programme (Home Energy Retrofit Offer) and will soon be supplemented by some provincial dollars for conversions from oil heat to electric air source heat pumps. British Columbia has strong requirements for both electric and natural gas utilities to pursue demand-side management (DSM) and has introduced regulations that acknowledge the greenhouse gas reduction benefits of DSM. British Columbia actively regulates minimum energy performance standards (MEPS) for both equipment and building components, often with standards that match or exceed the US or California. In 2008, British Columbia adopted new energy and water efficiency
© O
EC
D/IE
A, 2
016
4. Energy efficiency
87
objectives and requirements for all buildings in the British Columbia Building Code (“Greening the BC Building Code”). In December 2013 and December 2014, the national building code standards for commercial and residential buildings, respectively, were adopted. Under the LiveSmart BC, the province offers financial incentives for fuel-efficient cars, including the Scrap-It Program, the Clean Energy Vehicle (CEV) Program and the Plug In BC (EV Charging Stations).
§ Newfoundland and Labrador regulated its electric utilities to kick-start energy efficiency programmes in 2009, for residential homes, businesses and large industry. The provincial government supports a programme to improve the energy efficiency of homes owned by low-income households, seeks to build new public buildings to the Leadership in Energy and Environmental Design (LEED) Silver standard, and requires municipalities to implement the energy efficiency provisions of the National Building Code. These factors, combined with ongoing industrial restructuring, have allowed the province to reduce its energy intensity ratio by 14.7% between 2007 and 2013. By comparison, the national ratio improved by 6.8% over the same period.
DISTRICT HEATING AND COOLING
To date, district heating and cooling (DHC) has a relatively low penetration in Canada but it is a growing industry in the larger cities of the country such as Montreal, Ottawa, Toronto, Vancouver and Winnipeg.
Industry surveys of existing schemes show a recent surge in installations, currently delivering around 5 TWhth (TWh thermal) or 1% of Canadian energy consumption for thermal comfort and water heating (CIEEDAC 2015). Electricity and natural gas dominate in the country, accounting for more than three-quarters of energy used for space heating. District heating (DH) is considered as an alternative local heating system or district energy system.
A total of 37 DH systems have been studied and 21 initiated since the last IEA review in 2009. This upswing in interest can be attributed to several factors:
§ municipal concern over energy security and reliable supply
§ municipal concern over environmental degradation and the need to manage its carbon impact of heating
§ implementation of legislation (in British Columbia) requiring emissions inventories, plans and actions against climate change.
The introduction of similar legislation in Ontario in 2013 is predicted to create a similar surge in the interest in district energy over the next 5 years.
There are a few DHC projects in the Canadian provinces. Since August 2004, a deep lake water cooling system has been operated by the Enwave Energy Corporation in Toronto, Ontario. It draws cold water from Lake Ontario to provide cooling in a high-density system that covers most of the city’s downtown core and serves more than 140 buildings. Canada also has a series of smaller DH projects. Notably, in Alberta, the Drake Landing Solar Community has achieved a world record 97% annual solar fraction for heating needs, using solar-thermal panels on the garage roofs and thermal storage in a borehole cluster.
© O
EC
D/IE
A, 2
016
4. Energy efficiency
88
Quality Urban Energy Systems of Tomorrow (QUEST) commissioned a study by MKJA/Navius on the potential for district heating in Canada; however, the results showed only a fairly small role for district heating (MKJA/Navius, 2010).
Legislation affecting the development of district energy is a provincial responsibility and therefore varies across Canada. In the majority of provinces and territories, there is no specific legislation governing either the ownership or operation of a system. The exceptions are Ontario and British Columbia, the two provinces where most of the growth trends can be found, next to new initiatives in the Province of Quebec.
British Columbia
British Columbia includes district energy as a qualifying energy supply within the BC Utilities Commission Act and therefore requires oversight by either the BC Utilities Commission (for private-sector systems) or the appropriate Municipal Council (for municipal undertakings). The rate structure for billing district energy is assessed in the same manner as those for electricity and natural gas. The province’s primary distributor of natural gas, FortisBC, began to offer alternative energy services but, in 2012, the BC Utilities Commission ruled against allowing this activity because of competition concerns and ordered that the activity be run as a separate company. There has been relatively little uptake of alternative energy services since that time.
The introduction of Bill 27: Local Government Statutes in 2008 required communities to undertake an inventory of GHG emissions, create a plan to reduce their level and implement that plan. This led to a significant increase in interest in the use of renewable energy and in particular district energy as a means of reducing airborne emissions.
Ontario
Further to a review of the Provincial Policy Statement and Ontario Planning Act, the Ontario provincial government enacted changes to better support the implementation of energy efficiency measures within the province. The more detailed definition of alternative energy included within the statement is anticipated to allow planners to incorporate district energy within urban development scenarios. The requirement for community energy planning, as included within the provincial Green Energy Act has been supported by a funding programme that also provides a basis for system development.
Quebec
Quebec has provided financial support to community heating projects using residual forest biomass. This is part of the Quebec 2013-2020 Climate Change Action Plan and aims to reduce usage of fossil fuels.
POTENTIAL OF DISTRICT HEATING AND COOLING
DH networks allow the delivery of heat from a large number of different sources, thus increasing the efficiency, diversity and security of heat supply. They can also reduce costs of heat delivery through economies of scale that are unavailable to single buildings. Sources that can be exploited in DH networks include heat that would
© O
EC
D/IE
A, 2
016
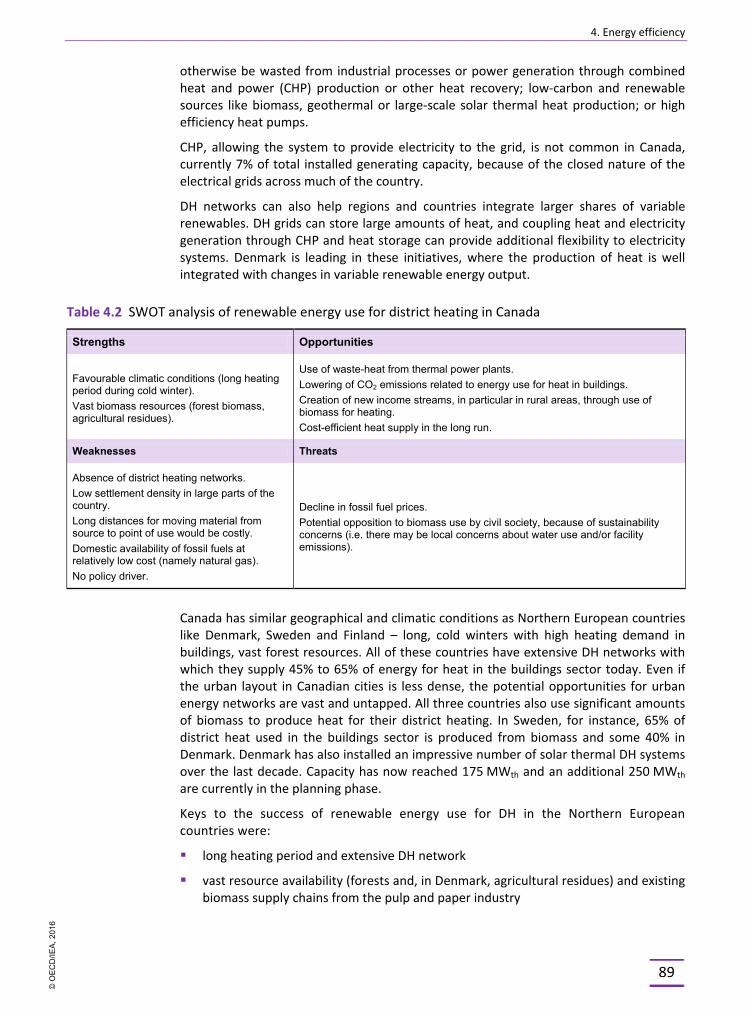
4. Energy efficiency
89
otherwise be wasted from industrial processes or power generation through combined heat and power (CHP) production or other heat recovery; low-carbon and renewable sources like biomass, geothermal or large-scale solar thermal heat production; or high efficiency heat pumps.
CHP, allowing the system to provide electricity to the grid, is not common in Canada, currently 7% of total installed generating capacity, because of the closed nature of the electrical grids across much of the country.
DH networks can also help regions and countries integrate larger shares of variable renewables. DH grids can store large amounts of heat, and coupling heat and electricity generation through CHP and heat storage can provide additional flexibility to electricity systems. Denmark is leading in these initiatives, where the production of heat is well integrated with changes in variable renewable energy output.
Table 4.2 SWOT analysis of renewable energy use for district heating in Canada
Strengths Opportunities
Favourable climatic conditions (long heating period during cold winter).
Vast biomass resources (forest biomass, agricultural residues).
Use of waste-heat from thermal power plants. Lowering of CO2 emissions related to energy use for heat in buildings. Creation of new income streams, in particular in rural areas, through use of
biomass for heating. Cost-efficient heat supply in the long run.
Weaknesses Threats
Absence of district heating networks. Low settlement density in large parts of the
country. Long distances for moving material from
source to point of use would be costly. Domestic availability of fossil fuels at
relatively low cost (namely natural gas). No policy driver.
Decline in fossil fuel prices. Potential opposition to biomass use by civil society, because of sustainability
concerns (i.e. there may be local concerns about water use and/or facility emissions).
Canada has similar geographical and climatic conditions as Northern European countries like Denmark, Sweden and Finland – long, cold winters with high heating demand in buildings, vast forest resources. All of these countries have extensive DH networks with which they supply 45% to 65% of energy for heat in the buildings sector today. Even if the urban layout in Canadian cities is less dense, the potential opportunities for urban energy networks are vast and untapped. All three countries also use significant amounts of biomass to produce heat for their district heating. In Sweden, for instance, 65% of district heat used in the buildings sector is produced from biomass and some 40% in Denmark. Denmark has also installed an impressive number of solar thermal DH systems over the last decade. Capacity has now reached 175 MWth and an additional 250 MWth
are currently in the planning phase.
Keys to the success of renewable energy use for DH in the Northern European countries were:
§ long heating period and extensive DH network
§ vast resource availability (forests and, in Denmark, agricultural residues) and existing biomass supply chains from the pulp and paper industry
© O
EC
D/IE
A, 2
016
4. Energy efficiency
90
§ policy support, namely in the form of a fossil fuel or CO2 tax, that made the use of renewable energy for heat very cost-competitive
§ robust energy planning at the local level, including mapping of low-carbon heat sources and clusters of energy demand.
With its extensive forest cover, and to a smaller extent, agricultural residues, and a relatively long winter, Canada appears to have conditions that would support the enhanced use of renewable energy for heat. However, the availability of cheap fossil fuels – in particular natural gas – and the absence of DH networks form significant barriers for the use of renewable energy via DH systems.
A summary of issues is provided in the Strength-Weakness-Opportunities-Threats (SWOT) analysis in Table 4.2.
ASSESSMENT
Canada has achieved impressive gains in energy efficiency in the past decade. Since 2003, energy intensity improved by around 20% and total energy supply per capita has decreased by 13%, while at the same time GDP strongly increased.
Despite this progress, Canada’s energy intensity per capita is ranked the highest among IEA member countries, higher than the United States, Norway and Finland. Factors contributing towards Canada’s energy mix and intensity include its northern climate, geographic considerations, the prevalence of energy-intensive (resource extraction) industries, and its role as a major energy producer of oil, gas and coal.
Canada’s large geographical territorial area and relatively low population density drives a large share of its final consumption, particularly in transport (29% of TFC in 2013) and industry (40% of TFC in 2013). Between 2002 and 2013, total final energy consumption (TFC) increased by 9% to reach 211.7 million tonnes of oil-equivalent (Mtoe) in 2013. Increased energy use in industry and transport remains a key challenge.
In overall terms, considerable progress has been achieved on reducing energy intensity in the paper, pulp, and print, iron and steel, and cement industries. However, there remains significant energy-saving potential across the Canadian economy, notably in oil and gas production, and refining. Those sectors have seen an increasing use of energy over the past decade with practically no changes in their energy intensity. Technology innovation in the production and processing stages is mainly reducing GHG emissions, but only marginally impacting energy use.
The IEA welcomes Canada’s best practices for achieving greater energy efficiency in industry, including the Canadian Industry Program for Energy Conservation (CIPEC) model which is currently being adopted in Germany and considered under the German G7 Presidency as a model for other G7 countries. World class industry innovation is supported by public-private partnerships in the forestry sector. These are good examples of grass-roots and industry-led initiatives.
With respect to future priorities, energy intensity in industry could be further improved, as today there are few standards adopted in this sector. While the adoption of the international energy management standard (e.g. ISO 50001) is a positive development, the progress of certification is still slow. Policies that encourage businesses to undertake regular energy audits, for instance performance-based tax breaks or incentives for
© O
EC
D/IE
A, 2
016
4. Energy efficiency
91
maintaining certification (like in Germany), would be a significant step in improving industrial productivity with the associated economic competitive advantages that would flow from that. This would go some way towards addressing business concerns about rising energy costs, notably in the small and medium-sized enterprises.
At the federal level, energy efficiency policy has been led by NRCan principally through the ecoENERGY Efficiency programme to help consumers and businesses reduce their energy costs; regulations on minimum energy performance levels and labelling on energy-using products and those that affect energy use; and the ecoENERGY for Alternative Fuels programme to encourage the use of alternative fuels, including the development of relevant codes and standards. The standards and labelling policies have been driving energy efficiency progress and results can be seen in terms of decreasing energy intensities in new buildings and lower energy consumption of new appliances and passenger cars.
On the other hand, since the last IEA in-depth review, the federal government has made a shift away from financial support to more voluntary action, data collection and awareness-raising activities as well as building partnerships with industry and NGOs, and encouraging co-operation and exchange of best practices across the provinces and territories. NRCan and its Office of Energy Efficiency (OEE) have a strong track record in data collection and evaluation with regard to energy use and intensities which stands out in international comparisons.
In 2011, the ecoENERGY Efficiency programme was renewed for five years with a funding allocation of CAD 195 million, less than in previous programming years. The programme aims to reduce the energy bills of Canadian consumers and businesses by CAD 1 billion in 2016 and reduce GHG emissions by 4 MtCO2-eq. (equivalent to the emissions of approximately 1 million cars), in partnership with provinces/territories, municipalities, utilities and other stakeholders.
Provincial and territorial governments have responsibility for many policies affecting energy end use and intensity, covering everything from building energy codes, utility regulation and responsible resource development. Provincially owned utilities have made significant investment in demand-side management, in public education and awareness-building, and in retrofits and tools for managing energy consumption.
Since the last in-depth review, there has been increasing co-operation between the federal and provincial levels on energy efficiency in the framework of the Energy and Mines Ministers’ Conference (EMMC) and its regular meetings, and an annual ministers’ conference. Federal-provincial-territorial efforts have achieved a number of successes, including the introduction of model building codes and co-operation on activities to improve the efficiency of energy-using products through the use of standards, labels and promotional activities.
Maintaining leadership is a challenge and improving energy efficiency should remain a key objective in achieving the Canadian government’s economic and sustainability priorities. There is a significant opportunity for reducing GHG emissions by enhancing energy efficiency, thereby driving economic growth, sustainable employment and increased productivity, along with the associated climate and social benefits. Energy efficiency can also improve the competitiveness of the Canadian industry where this involves, for instance, process innovation that leads to higher-value products. In the transport sector, substantial emissions reductions can be achieved through energy efficiency action.
© O
EC
D/IE
A, 2
016

4. Energy efficiency
92
The adoption of the Canadian Energy Strategy by the Council of the Federation in July 2015 by the Premiers of the provinces and territories is an opportunity to foster energy efficiency data, policies and programmes across Canada.
In the transport sector, accelerated deployment of electric vehicles and switching to alternative fuels should be promoted, depending also on the regulatory agenda in the United States, as Canada is seeking close alignment with US EPA rules. For Canada, a progressive switch from high-emission fossil fuels (e.g. oil products) through appropriate tax incentives, infrastructure investment, and renewable energy development and technologies would be desirable to address the relatively high fossil-based secondary energy use.
Federal and provincial governments could show leadership by setting appropriate energy saving targets and objectives for the public sector to reduce its own energy consumption. Areas for consideration could include buildings construction and operation, fleet management, public lighting and water services. This could encompass retrofitting an annual percentage of the worst-performing buildings after an inventory of their energy consumption.
Since the last in-depth IEA review, progress has been strong on delivering the National Energy Code for Buildings in 2011 and 2015, after the announcement to review the 1997 model code in 2007. The rapid adoption and adaptation of the 2011 code is under way, and the upgrade of the code in 2015, is a key contribution to capturing the yet untapped savings in buildings. A timeline by which the code should be implemented would be an important market signal.
Aligned with the promotion and deployment of information tools and educational initiatives to inform consumers of the benefits of retrofitting their dwellings, this would have positive results for the built environment. Supported by appropriate financial incentives to encourage take-up of a package of retrofit measures, this would assist consumers to mitigate high residential electricity prices in some provinces and territories, particularly those with low incomes. In this regard the business benchmarking tool, the ENERGY STAR Portfolio Manager programme, is an important initiative by the federal government.
With its cold climate and long heating periods and vast natural resources (forest and agricultural residues), there are several opportunities for more efficient use of waste-heat from thermal power plants, lowering of CO2 emissions related to energy use for heat in buildings and the creation of new income streams, in particular in rural areas, through the use of biomass for heating and a more cost-efficient heat supply in the long run. Such opportunities can only come forward if major policy drivers support the introduction of these technologies and networks, as current low fuel prices and the absence of the district heating networks are not supporting the case of district heating or cooling. As the government aims to increase energy efficiency in buildings, through the forthcoming implementation of the model building codes, towards zero-energy buildings, the value of district heating and cooling could be explored.
RECOMMENDATIONS
The government of Canada should:
o Encourage the provinces and territories to continue working collaboratively, including in the framework of the Canadian Energy Strategy, on a strong energy efficiency focus, including the adoption of quantitative targets to improve efficiency.
© O
EC
D/IE
A, 2
016
4. Energy efficiency
93
o Improve industrial energy productivity by implementing benchmarks and standards for energy process management and reviewing them regularly in energy audits. Based on this, work with industry stakeholders and networks to develop voluntary agreements, notably with the oil and gas production industry and SMEs. These energy efficiency measures can help support emissions reduction objectives in Canadian industries.
o Encourage the timely implementation of the National Energy Code for Buildings (2011 and 2015), review progress and regularly amend the code, as needed. Establish targets for the progressive improvement of building energy regulations to address energy use and consumption in the built environment.
o Explore the use of advanced heating and cooling technologies to promote energy efficiency in buildings, industry and the commercial sectors.
References CNGVA (Canadian Natural Gas Vehicle Alliance),(2014), Natural Gas for Transportation in Canada.
CNGVA (2010), Natural Gas Use in the Canadian Transportation Sector, Deployment Roadmap, December.
CRFA (2014), Canadian Renewable Fuel Association, From Biofuels to Bioeconomy.
CIEEDAC (Canadian Industrial Energy End-use Data and Analysis Centre ), (2015), , District Energy Inventory for Canada 2014, prepared for CanmetENERGY, Natural Resources Canada Environment Canada and CIEEDAC Supporters, March , www.cieedac.sfu.ca/DB_DE/index.php (accessed on 19 March 2015).
CIPEC (Canadian Industry Program for Energy Conservation), (2013), Canadian Industry Project for Energy Conservation , Annual Report 2013.
ICCT (The International Council on Clean Transportation), (2014), Global Comparison of Passenger Car and Light-commercial Vehicle Fuel Economy/GHG Emissions Standards, update February 2014.
IEA (International Energy Agency) (2015), Energy Balance of OECD Countries, www.iea.org/statistics/, OECD/IEA, Paris.
IEA (2014), Energy Efficiency Market Report, OECD/IEA, Paris.
IEA (2013), Energy Efficiency Market Report, OECD/IEA, Paris.
IndEco (2011), Canadian Energy Efficiency Program Study. Toronto: IndEco Strategic Consulting Inc.
FPInnovations (2011), Making innovation happen: FPInnovations – Turning research into competitive advantage, submission to the Review of Federal Support to Research and Development, 18 February.
FPAC (Forest Products Association of Canada) (2014), Vision2020 Report Card 2010 to 2020: Pathways to Prosperity for Canada’s Forest Products Sector, FPAC, Ontario.
Government of Canada (2014), Canada’s Sixth National Report on Climate Change.
NRCan (Natural Resources Canada), (2014), Investments in Forest Industry Transformation (IFIT), www.nrcan.gc.ca/forests/federal-programs/13139 (accessed 9 January 2015).
NRCan (2013), Improving Energy Performance in Canada – Report to Parliament under the Energy Efficiency Act for the Fiscal Year 2011-2012, Ottawa.
© O
EC
D/IE
A, 2
016

4. Energy efficiency
94
NRCan (2012), National Energy Use Database (NEUD), http://oee.nrcan.gc.ca/statistics
Peglau, R. (2014), Number of ISO 50001 certified sites worldwide, data by the Federal Environment Agency of Germany, May.
MKJA/Navius (2010), commissioned by Quality Urban Energy Systems of Tomorrow (QUEST), The capacity for integrated community energy solutions policies to reduce urban greenhouse gas emissions, 2010”, http://questcanada.org/sites/default/files/publications/Final%20Full%20Study %20Report.pdf.
Statistics Canada (2014), Gross domestic product (GDP) at basic prices, by North American Industry Classification System (NAICS), provinces and territories, annual (Percentage share), 2002 to 2014, 379-0028 (accessed on 19 March 2015).
Transports Canada (2014), Transportation in Canada 2013, 2014.
© O
EC
D/IE
A, 2
016

PART II SECTOR ANALYSIS
© O
EC
D/IE
A, 2
016

© O
EC
D/IE
A, 2
016
5. Natural gas
97
5. NATURAL GAS
Key data (2013)
Natural gas production: 156.1 bcm, -15.2% since 2003
Imports: 26.7 bcm (United States 96%, Qatar 3%, Trinidad & Tobago 1%)
Exports: 82.5 bcm (United States 100%)
Net exports: 55.8 bcm
Share of natural gas: 34.4% of TPES and 10.3% of electricity generation
Consumption by sector: 109.6 bcm (energy industries other than power generation 34.1%, industry 19.9%, residential 16.1%, power generation 14.4%, commercial and other services 12.6%, transport 3%)
OVERVIEW
In 2014, Canada was the world’s fourth-largest natural gas producer, after the United States (US), the Russian Federation, and Iran, moving up from the fifth position in 2013, slightly above Qatar. Canada is part of an integrated, North American natural gas market and, currently, all Canadian exports go to the US.
The boom of unconventional gas in North America has been shifting the outlook over the last decade. Thanks to new technologies, tight and shale gas now make up the majority of domestic production in Canada. At the same time, increased North American natural gas production is driving down prices and reduces the US requirements for imports. In fact, imports into Canada have increased by 178% over the last decade, while Canadian gross exports dropped by 25 billion cubic metres (bcm) during 2007-14. Eastern Canada now finds it more economical to import natural gas from nearby US production areas (Marcellus field) rather than transporting western Canadian gas across the country. With surging North American production, the key imperative for Canada is to pursue new international markets while promoting energy market diversification and developing natural gas export infrastructure, such as liquefied natural gas (LNG) facilities and associated pipelines. By October 2015, 26 natural gas liquefaction projects on Canada’s west and east coasts are waiting for final investment and regulatory approval.
Natural gas production in Canada is set to remain stable in the medium term, depending on the pace of US production and its penetration into US Midwest and eastern Canada. In the short term, a decline of production is anticipated as several upstream projects are delayed in a context of low oil and gas prices. In the medium term, production is set for growth, as domestic demand for natural gas picks up, supported by increasing use of natural gas for oil-sands production and in power generation as provinces phase out some of the older coal-fired power plants amid stricter emission performance standards. In the longer term, Canadian natural gas production and exports are set to increase as North America enters the global LNG market.
© O
EC
D/IE
A, 2
016
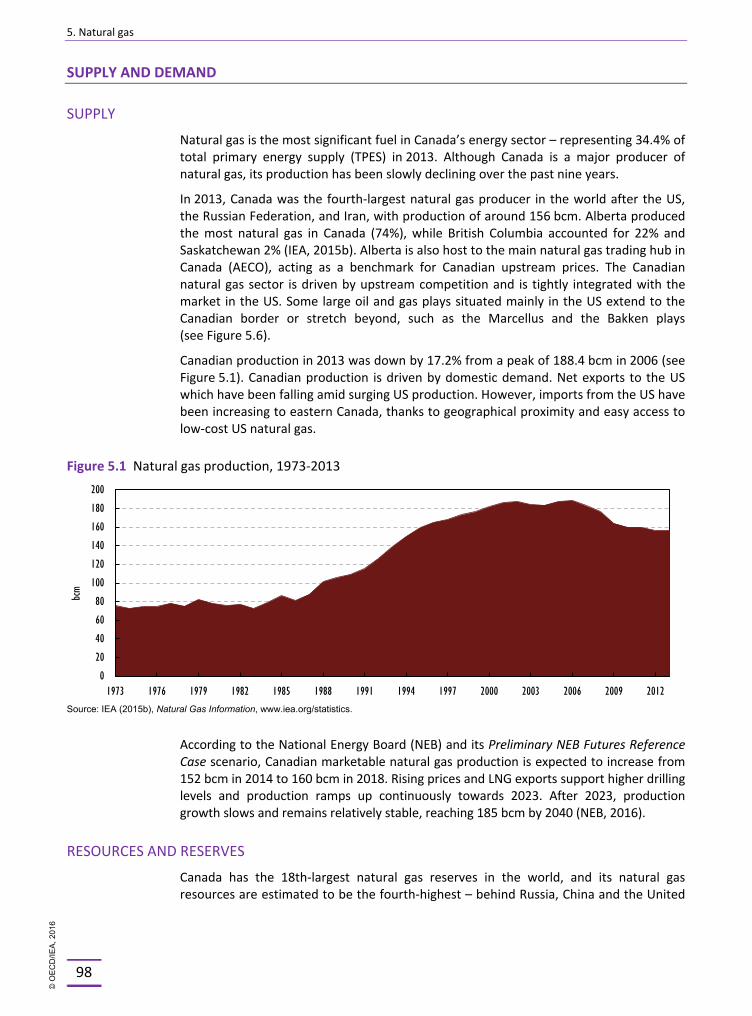
5. Natural gas
98
SUPPLY AND DEMAND
SUPPLY
Natural gas is the most significant fuel in Canada’s energy sector – representing 34.4% of total primary energy supply (TPES) in 2013. Although Canada is a major producer of natural gas, its production has been slowly declining over the past nine years.
In 2013, Canada was the fourth-largest natural gas producer in the world after the US, the Russian Federation, and Iran, with production of around 156 bcm. Alberta produced the most natural gas in Canada (74%), while British Columbia accounted for 22% and Saskatchewan 2% (IEA, 2015b). Alberta is also host to the main natural gas trading hub in Canada (AECO), acting as a benchmark for Canadian upstream prices. The Canadian natural gas sector is driven by upstream competition and is tightly integrated with the market in the US. Some large oil and gas plays situated mainly in the US extend to the Canadian border or stretch beyond, such as the Marcellus and the Bakken plays (see Figure 5.6).
Canadian production in 2013 was down by 17.2% from a peak of 188.4 bcm in 2006 (see Figure 5.1). Canadian production is driven by domestic demand. Net exports to the US which have been falling amid surging US production. However, imports from the US have been increasing to eastern Canada, thanks to geographical proximity and easy access to low-cost US natural gas.
Figure 5.1 Natural gas production, 1973-2013
Source: IEA (2015b), Natural Gas Information, www.iea.org/statistics.
According to the National Energy Board (NEB) and its Preliminary NEB Futures Reference Case scenario, Canadian marketable natural gas production is expected to increase from 152 bcm in 2014 to 160 bcm in 2018. Rising prices and LNG exports support higher drilling levels and production ramps up continuously towards 2023. After 2023, production growth slows and remains relatively stable, reaching 185 bcm by 2040 (NEB, 2016).
RESOURCES AND RESERVES
Canada has the 18th-largest natural gas reserves in the world, and its natural gas resources are estimated to be the fourth-highest – behind Russia, China and the United
0
20
40
60
80
100
120
140
160
180
200
1973 1976 1979 1982 1985 1988 1991 1994 1997 2000 2003 2006 2009 2012
bcm
© O
EC
D/IE
A, 2
016
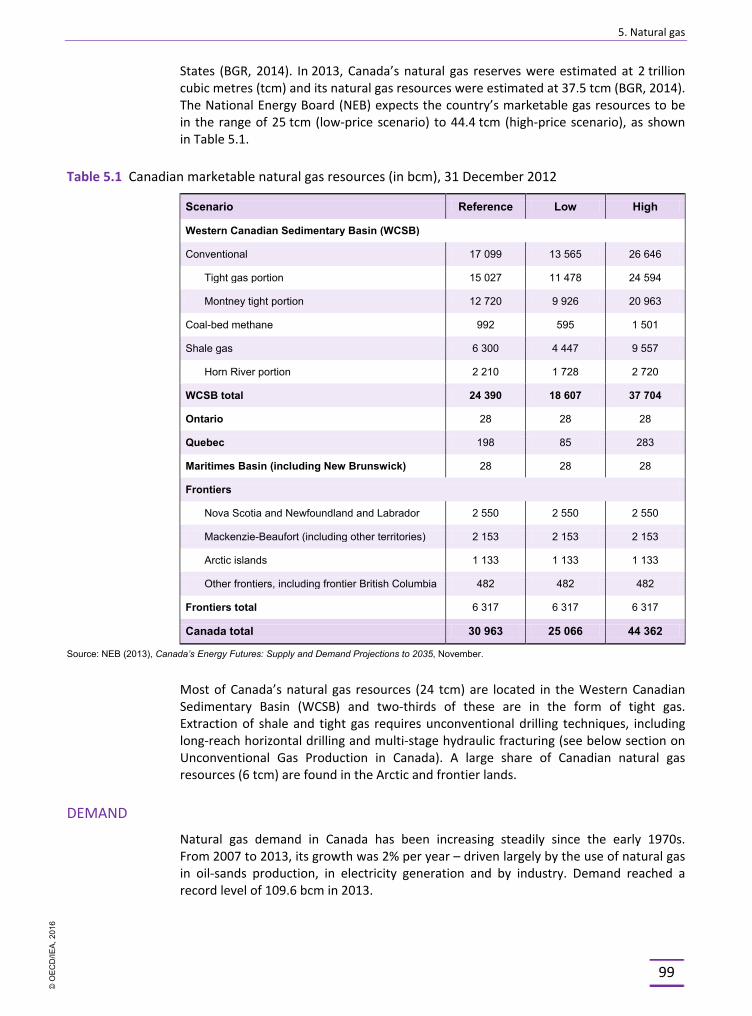
5. Natural gas
99
States (BGR, 2014). In 2013, Canada’s natural gas reserves were estimated at 2 trillion cubic metres (tcm) and its natural gas resources were estimated at 37.5 tcm (BGR, 2014). The National Energy Board (NEB) expects the country’s marketable gas resources to be in the range of 25 tcm (low-price scenario) to 44.4 tcm (high-price scenario), as shown in Table 5.1.
Table 5.1 Canadian marketable natural gas resources (in bcm), 31 December 2012
Scenario Reference Low High
Western Canadian Sedimentary Basin (WCSB)
Conventional 17 099 13 565 26 646
Tight gas portion 15 027 11 478 24 594
Montney tight portion 12 720 9 926 20 963
Coal-bed methane 992 595 1 501
Shale gas 6 300 4 447 9 557
Horn River portion 2 210 1 728 2 720
WCSB total 24 390 18 607 37 704
Ontario 28 28 28
Quebec 198 85 283
Maritimes Basin (including New Brunswick) 28 28 28
Frontiers
Nova Scotia and Newfoundland and Labrador 2 550 2 550 2 550
Mackenzie-Beaufort (including other territories) 2 153 2 153 2 153
Arctic islands 1 133 1 133 1 133
Other frontiers, including frontier British Columbia 482 482 482
Frontiers total 6 317 6 317 6 317
Canada total 30 963 25 066 44 362
Source: NEB (2013), Canada’s Energy Futures: Supply and Demand Projections to 2035, November.
Most of Canada’s natural gas resources (24 tcm) are located in the Western Canadian Sedimentary Basin (WCSB) and two-thirds of these are in the form of tight gas. Extraction of shale and tight gas requires unconventional drilling techniques, including long-reach horizontal drilling and multi-stage hydraulic fracturing (see below section on Unconventional Gas Production in Canada). A large share of Canadian natural gas resources (6 tcm) are found in the Arctic and frontier lands.
DEMAND
Natural gas demand in Canada has been increasing steadily since the early 1970s. From 2007 to 2013, its growth was 2% per year – driven largely by the use of natural gas in oil-sands production, in electricity generation and by industry. Demand reached a record level of 109.6 bcm in 2013.
© O
EC
D/IE
A, 2
016
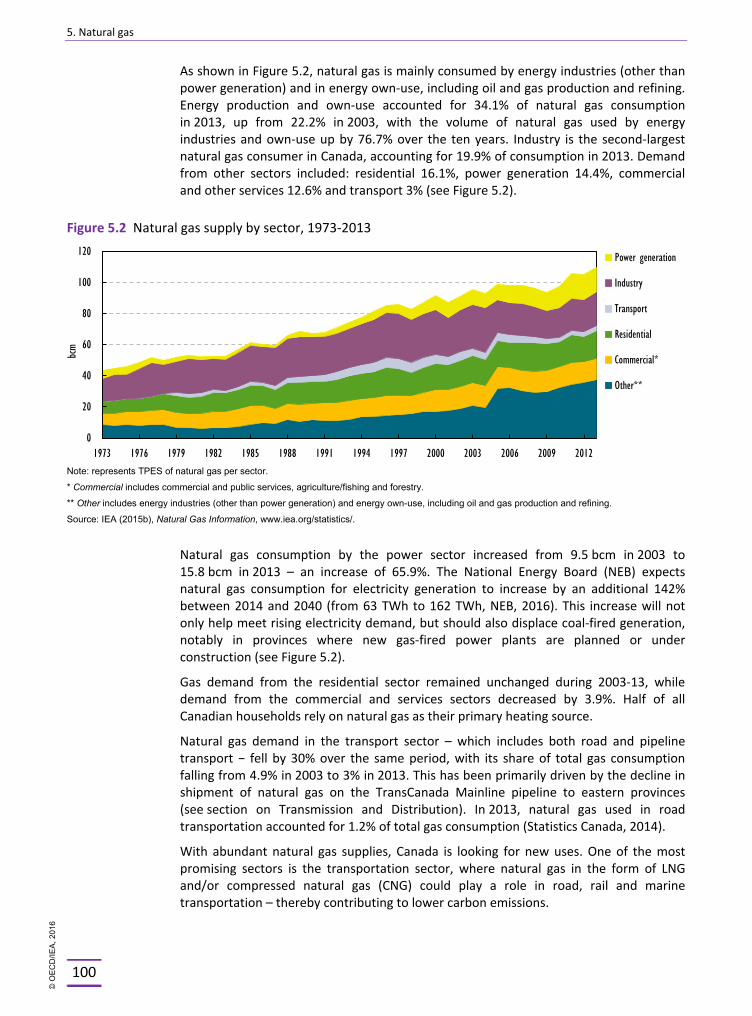
5. Natural gas
100
As shown in Figure 5.2, natural gas is mainly consumed by energy industries (other than power generation) and in energy own-use, including oil and gas production and refining. Energy production and own-use accounted for 34.1% of natural gas consumption in 2013, up from 22.2% in 2003, with the volume of natural gas used by energy industries and own-use up by 76.7% over the ten years. Industry is the second-largest natural gas consumer in Canada, accounting for 19.9% of consumption in 2013. Demand from other sectors included: residential 16.1%, power generation 14.4%, commercial and other services 12.6% and transport 3% (see Figure 5.2).
Figure 5.2 Natural gas supply by sector, 1973-2013
Note: represents TPES of natural gas per sector.
* Commercial includes commercial and public services, agriculture/fishing and forestry.
** Other includes energy industries (other than power generation) and energy own-use, including oil and gas production and refining.
Source: IEA (2015b), Natural Gas Information, www.iea.org/statistics/.
Natural gas consumption by the power sector increased from 9.5 bcm in 2003 to 15.8 bcm in 2013 – an increase of 65.9%. The National Energy Board (NEB) expects natural gas consumption for electricity generation to increase by an additional 142% between 2014 and 2040 (from 63 TWh to 162 TWh, NEB, 2016). This increase will not only help meet rising electricity demand, but should also displace coal-fired generation, notably in provinces where new gas-fired power plants are planned or under construction (see Figure 5.2).
Gas demand from the residential sector remained unchanged during 2003-13, while demand from the commercial and services sectors decreased by 3.9%. Half of all Canadian households rely on natural gas as their primary heating source.
Natural gas demand in the transport sector – which includes both road and pipeline transport − fell by 30% over the same period, with its share of total gas consumption falling from 4.9% in 2003 to 3% in 2013. This has been primarily driven by the decline in shipment of natural gas on the TransCanada Mainline pipeline to eastern provinces (see section on Transmission and Distribution). In 2013, natural gas used in road transportation accounted for 1.2% of total gas consumption (Statistics Canada, 2014).
With abundant natural gas supplies, Canada is looking for new uses. One of the most promising sectors is the transportation sector, where natural gas in the form of LNG and/or compressed natural gas (CNG) could play a role in road, rail and marine transportation – thereby contributing to lower carbon emissions.
0
20
40
60
80
100
120
1973 1976 1979 1982 1985 1988 1991 1994 1997 2000 2003 2006 2009 2012
bcm
Power generation
Industry
Transport
Residential
Commercial*
Other**
© O
EC
D/IE
A, 2
016
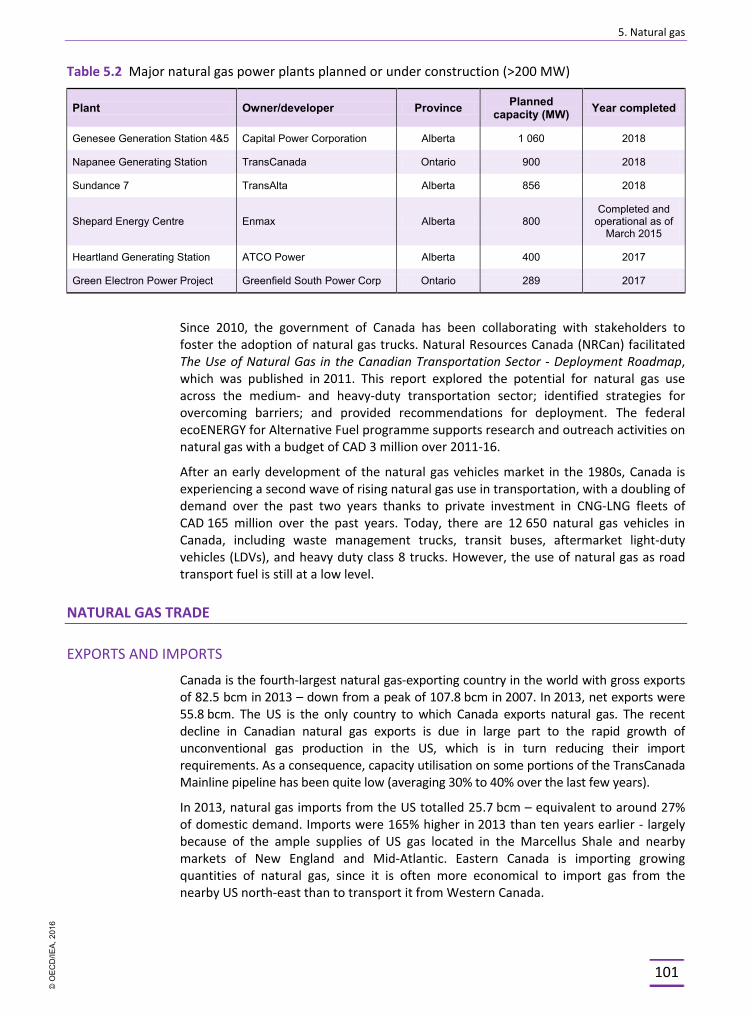
5. Natural gas
101
Table 5.2 Major natural gas power plants planned or under construction (>200 MW)
Plant Owner/developer Province Planned capacity (MW) Year completed
Genesee Generation Station 4&5 Capital Power Corporation Alberta 1 060 2018
Napanee Generating Station TransCanada Ontario 900 2018
Sundance 7 TransAlta Alberta 856 2018
Shepard Energy Centre Enmax Alberta 800 Completed and
operational as of March 2015
Heartland Generating Station ATCO Power Alberta 400 2017
Green Electron Power Project Greenfield South Power Corp Ontario 289 2017
Since 2010, the government of Canada has been collaborating with stakeholders to foster the adoption of natural gas trucks. Natural Resources Canada (NRCan) facilitated The Use of Natural Gas in the Canadian Transportation Sector - Deployment Roadmap, which was published in 2011. This report explored the potential for natural gas use across the medium- and heavy-duty transportation sector; identified strategies for overcoming barriers; and provided recommendations for deployment. The federal ecoENERGY for Alternative Fuel programme supports research and outreach activities on natural gas with a budget of CAD 3 million over 2011-16.
After an early development of the natural gas vehicles market in the 1980s, Canada is experiencing a second wave of rising natural gas use in transportation, with a doubling of demand over the past two years thanks to private investment in CNG-LNG fleets of CAD 165 million over the past years. Today, there are 12 650 natural gas vehicles in Canada, including waste management trucks, transit buses, aftermarket light-duty vehicles (LDVs), and heavy duty class 8 trucks. However, the use of natural gas as road transport fuel is still at a low level.
NATURAL GAS TRADE
EXPORTS AND IMPORTS
Canada is the fourth-largest natural gas-exporting country in the world with gross exports of 82.5 bcm in 2013 – down from a peak of 107.8 bcm in 2007. In 2013, net exports were 55.8 bcm. The US is the only country to which Canada exports natural gas. The recent decline in Canadian natural gas exports is due in large part to the rapid growth of unconventional gas production in the US, which is in turn reducing their import requirements. As a consequence, capacity utilisation on some portions of the TransCanada Mainline pipeline has been quite low (averaging 30% to 40% over the last few years).
In 2013, natural gas imports from the US totalled 25.7 bcm – equivalent to around 27% of domestic demand. Imports were 165% higher in 2013 than ten years earlier - largely because of the ample supplies of US gas located in the Marcellus Shale and nearby markets of New England and Mid-Atlantic. Eastern Canada is importing growing quantities of natural gas, since it is often more economical to import gas from the nearby US north-east than to transport it from Western Canada.
© O
EC
D/IE
A, 2
016
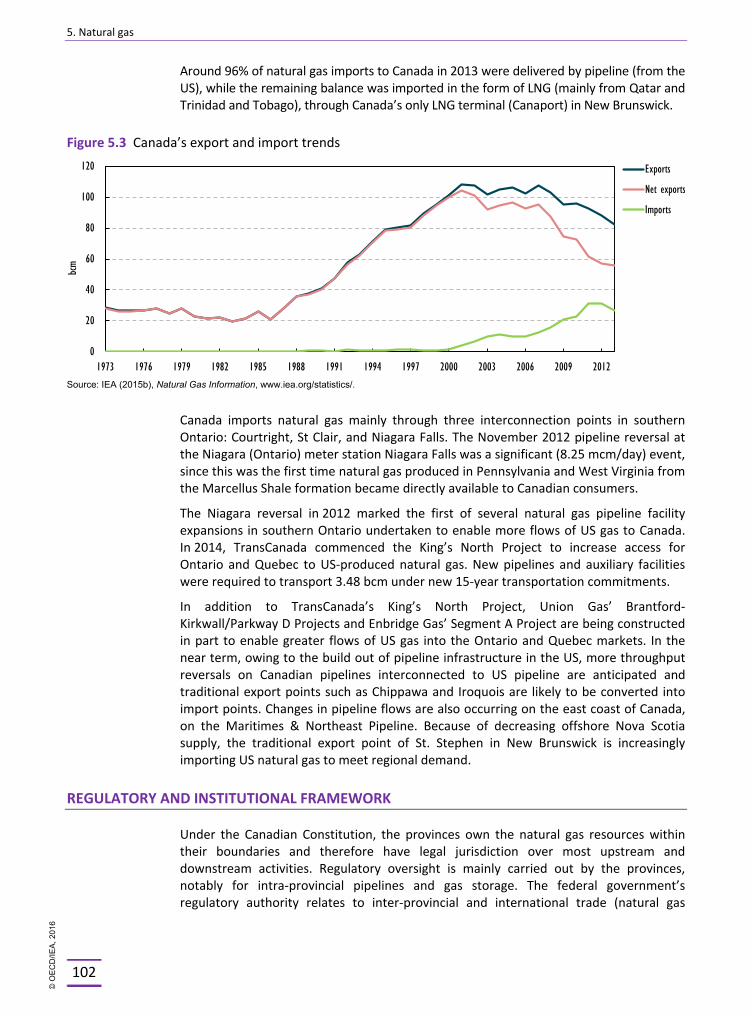
5. Natural gas
102
Around 96% of natural gas imports to Canada in 2013 were delivered by pipeline (from the US), while the remaining balance was imported in the form of LNG (mainly from Qatar and Trinidad and Tobago), through Canada’s only LNG terminal (Canaport) in New Brunswick.
Figure 5.3 Canada’s export and import trends
Source: IEA (2015b), Natural Gas Information, www.iea.org/statistics/.
Canada imports natural gas mainly through three interconnection points in southern Ontario: Courtright, St Clair, and Niagara Falls. The November 2012 pipeline reversal at the Niagara (Ontario) meter station Niagara Falls was a significant (8.25 mcm/day) event, since this was the first time natural gas produced in Pennsylvania and West Virginia from the Marcellus Shale formation became directly available to Canadian consumers.
The Niagara reversal in 2012 marked the first of several natural gas pipeline facility expansions in southern Ontario undertaken to enable more flows of US gas to Canada. In 2014, TransCanada commenced the King’s North Project to increase access for Ontario and Quebec to US-produced natural gas. New pipelines and auxiliary facilities were required to transport 3.48 bcm under new 15-year transportation commitments.
In addition to TransCanada’s King’s North Project, Union Gas’ Brantford-Kirkwall/Parkway D Projects and Enbridge Gas’ Segment A Project are being constructed in part to enable greater flows of US gas into the Ontario and Quebec markets. In the near term, owing to the build out of pipeline infrastructure in the US, more throughput reversals on Canadian pipelines interconnected to US pipeline are anticipated and traditional export points such as Chippawa and Iroquois are likely to be converted into import points. Changes in pipeline flows are also occurring on the east coast of Canada, on the Maritimes & Northeast Pipeline. Because of decreasing offshore Nova Scotia supply, the traditional export point of St. Stephen in New Brunswick is increasingly importing US natural gas to meet regional demand.
REGULATORY AND INSTITUTIONAL FRAMEWORK
Under the Canadian Constitution, the provinces own the natural gas resources within their boundaries and therefore have legal jurisdiction over most upstream and downstream activities. Regulatory oversight is mainly carried out by the provinces, notably for intra-provincial pipelines and gas storage. The federal government’s regulatory authority relates to inter-provincial and international trade (natural gas
0
20
40
60
80
100
120
1973 1976 1979 1982 1985 1988 1991 1994 1997 2000 2003 2006 2009 2012
bcm
Exports
Net exports
Imports
© O
EC
D/IE
A, 2
016
5. Natural gas
103
export and import licences) and cross-border transmission of natural gas. The federal government also conducts environmental assessments (EAs) and permitting of major resource development projects.
Under the Canadian Environmental Assessment Act 2012 (CEAA 2012), the regulations designating physical activities (project list) clearly identifies the types of natural gas projects that may be subject to federal EAs, focusing on projects with potential for significant adverse environmental effects. These include: offshore natural gas and oil exploration and production; sour gas processing plants; LNG facilities, and natural gas pipelines regulated by the National Energy Board. There are also clear, legislated timelines for completing EAs and issuing permits. New measures in CEAA 2012 also enable federal environmental processes to be substituted by provincial processes where certain conditions are met. As of October 2015, the federal government had approved 12 projects for substitution, including five LNG projects in British Columbia.
To support the legislative and regulatory changes introduced under the Responsible Resource Development plan, a number of complementary measures are also being introduced, including pipeline, marine, and rail safety systems. This includes the proposed Pipeline Safety Act, which received Royal Assent on 18 June 2015. The strengthening of the safety aspects of Canada’s energy transportation systems has focused on spill prevention, with complementary preparedness and response systems, and greater clarity about the fact that the polluter is liable for the costs of clean-up and for compensating for any losses.
The federal regulator is the National Energy Board (NEB), an independent federal quasi-judicial agency. The NEB reports to the Parliament of Canada through the Minister of Natural Resources. Its purpose is to promote safety, security, environmental protection and economic efficiency in the Canadian public interest by regulating the following areas:
§ the construction and operation of interprovincial and international pipelines
§ the tolls and tariffs of interprovincial and international pipelines
§ the construction and operation of international power lines
§ the exports of oil and electricity
§ the exports and imports of natural gas
§ the exploration and development of oil and gas in non-Accord frontier areas.
The NEB may authorise short-term (up to 2 years) or long-term export licences of up to 40 years.1 For long-term export licences, the Board considers whether the quantity to be exported is surplus, taking into consideration forecasts of supply and demand. Governor in Council approval is required before the NEB can issue the long-term export licence.
The management of oil and gas resources on Crown lands in Nunavut and in the Arctic offshore is the responsibility of the Minister of Aboriginal Affairs and Northern Development Canada (AANDC).
Petroleum resource management on Canada’s northern frontier lands is exercised under two federal statutes: the Canada Petroleum Resources Act (CPRA), which governs the allocation of Crown lands to the private sector, tenure to the allocated rights, and
1. Budget 2015 amended the NEB Act to extend long-term natural gas export licences from a maximum of 25 years to 40 years.
© O
EC
D/IE
A, 2
016
5. Natural gas
104
the setting and collection of royalties; and the Canada Oil and Gas Operations Act (COGOA), which regulates petroleum operations in the interest of the production and conservation of resources, protection of the environment and safety of workers. The Canadian legal framework for petroleum management in the North provides for an organisational separation between the policy, land management and royalty roles of AANDC and the technical regulator roles of the NEB.
The NEB has regulatory responsibility for the Canadian Arctic offshore, the onshore part of the Inuvialuit Settlement Region in the Northwest Territories in accordance with territorial legislation that currently mirrors federal legislation, the Norman Wells proven area, and Nunavut. In addition to responsibilities under CPRA and COGOA, the NEB is also responsible for worker safety under the Canada Labour Act, Part II.
Policy, rights issuance and administration, royalty collection and benefit plan provisions are the responsibility of AANDC’s Petroleum and Mineral Resources Management Directorate. Other legislation concerning land use and environmental protection are fundamental to the sustainable development of petroleum resources in the North, aspects of which are managed by independent boards set up pursuant to Aboriginal land claim agreements.
In the two Atlantic offshore areas, the federal government shares responsibility for the management of petroleum resources with the provincial governments of Nova Scotia and of Newfoundland and Labrador under the Canada-Newfoundland Atlantic Accord Implementation Act and the Canada-Nova Scotia Offshore Petroleum Resources Accord Implementation Act respectively. The two “Accord Acts” establish regimes that are nearly identical to the combination of CPRA and COGOA elsewhere in Canada’s offshore. The Accord Acts set out the rules for the administration of rights to explore for and produce petroleum, the regulation of oil and gas drilling and production activities, revenue sharing, and the authorities of the offshore regulators.
New measures for offshore oil and gas exploration, production and transportation were initiated by the federal government, including the Arctic Offshore Drilling Review of 2010-11 and the Pipeline and Marine Tanker World-Class Safety Initiatives, amendments to the Coasting Trade Act as well as measures under Bill C.22 Energy Safety and Security Act, which was consented by Parliament in February 2015.
NATURAL GAS INFRASTRUCTURE
LNG TERMINALS
Since 2009, Canada has built one operational LNG terminal – the Canaport LNG import facility in Saint John, New Brunswick on the country’s east coast. LNG imported through this facility serves markets in Atlantic Canada and the US northeast. In 2015, there are plans to turn the import terminal into an export terminal, amid the US shale gas boom.
As is the case with crude oil, the need to diversify natural gas exports to markets beyond the US − notably Asia and Europe − remains a policy priority. New LNG export terminals and associated pipelines are required for Canada to take advantage of its natural gas production potential. Current initiatives for new LNG facilities and for pipelines to deliver natural gas to these facilities are at different stages of development.
© O
EC
D/IE
A, 2
016
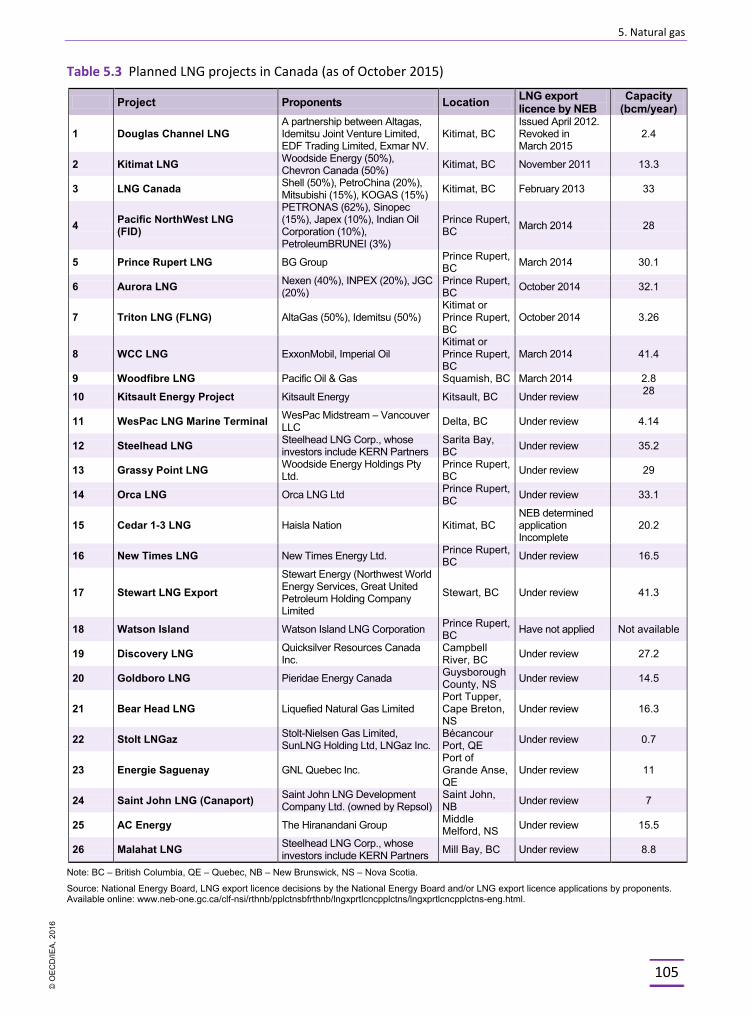
5. Natural gas
105
Table 5.3 Planned LNG projects in Canada (as of October 2015)
Project Proponents Location LNG export licence by NEB
Capacity (bcm/year)
1 Douglas Channel LNG A partnership between Altagas, Idemitsu Joint Venture Limited, EDF Trading Limited, Exmar NV.
Kitimat, BC Issued April 2012. Revoked in March 2015
2.4
2 Kitimat LNG Woodside Energy (50%), Chevron Canada (50%) Kitimat, BC November 2011 13.3
3 LNG Canada Shell (50%), PetroChina (20%), Mitsubishi (15%), KOGAS (15%) Kitimat, BC February 2013 33
4 Pacific NorthWest LNG (FID)
PETRONAS (62%), Sinopec (15%), Japex (10%), Indian Oil Corporation (10%), PetroleumBRUNEI (3%)
Prince Rupert, BC March 2014 28
5 Prince Rupert LNG BG Group Prince Rupert, BC March 2014 30.1
6 Aurora LNG Nexen (40%), INPEX (20%), JGC (20%)
Prince Rupert, BC October 2014 32.1
7 Triton LNG (FLNG) AltaGas (50%), Idemitsu (50%) Kitimat or Prince Rupert, BC
October 2014 3.26
8 WCC LNG ExxonMobil, Imperial Oil Kitimat or Prince Rupert, BC
March 2014 41.4
9 Woodfibre LNG Pacific Oil & Gas Squamish, BC March 2014 2.8
10 Kitsault Energy Project Kitsault Energy Kitsault, BC Under review 28
11 WesPac LNG Marine Terminal WesPac Midstream – Vancouver LLC Delta, BC Under review 4.14
12 Steelhead LNG Steelhead LNG Corp., whose investors include KERN Partners
Sarita Bay, BC Under review 35.2
13 Grassy Point LNG Woodside Energy Holdings Pty Ltd.
Prince Rupert, BC Under review 29
14 Orca LNG Orca LNG Ltd Prince Rupert, BC Under review 33.1
15 Cedar 1-3 LNG Haisla Nation Kitimat, BC NEB determined application Incomplete
20.2
16 New Times LNG New Times Energy Ltd. Prince Rupert, BC Under review 16.5
17 Stewart LNG Export Stewart Energy (Northwest World Energy Services, Great United Petroleum Holding Company Limited
Stewart, BC Under review 41.3
18 Watson Island Watson Island LNG Corporation Prince Rupert, BC Have not applied Not available
19 Discovery LNG Quicksilver Resources Canada Inc.
Campbell River, BC Under review 27.2
20 Goldboro LNG Pieridae Energy Canada Guysborough County, NS Under review 14.5
21 Bear Head LNG Liquefied Natural Gas Limited Port Tupper, Cape Breton, NS
Under review 16.3
22 Stolt LNGaz Stolt-Nielsen Gas Limited, SunLNG Holding Ltd, LNGaz Inc.
Bécancour Port, QE Under review 0.7
23 Energie Saguenay GNL Quebec Inc. Port of Grande Anse, QE
Under review 11
24 Saint John LNG (Canaport) Saint John LNG Development Company Ltd. (owned by Repsol)
Saint John, NB Under review 7
25 AC Energy The Hiranandani Group Middle Melford, NS Under review 15.5
26 Malahat LNG Steelhead LNG Corp., whose investors include KERN Partners Mill Bay, BC Under review 8.8
Note: BC – British Columbia, QE – Quebec, NB – New Brunswick, NS – Nova Scotia.
Source: National Energy Board, LNG export licence decisions by the National Energy Board and/or LNG export licence applications by proponents. Available online: www.neb-one.gc.ca/clf-nsi/rthnb/pplctnsbfrthnb/lngxprtlcncpplctns/lngxprtlcncpplctns-eng.html.
© O
EC
D/IE
A, 2
016
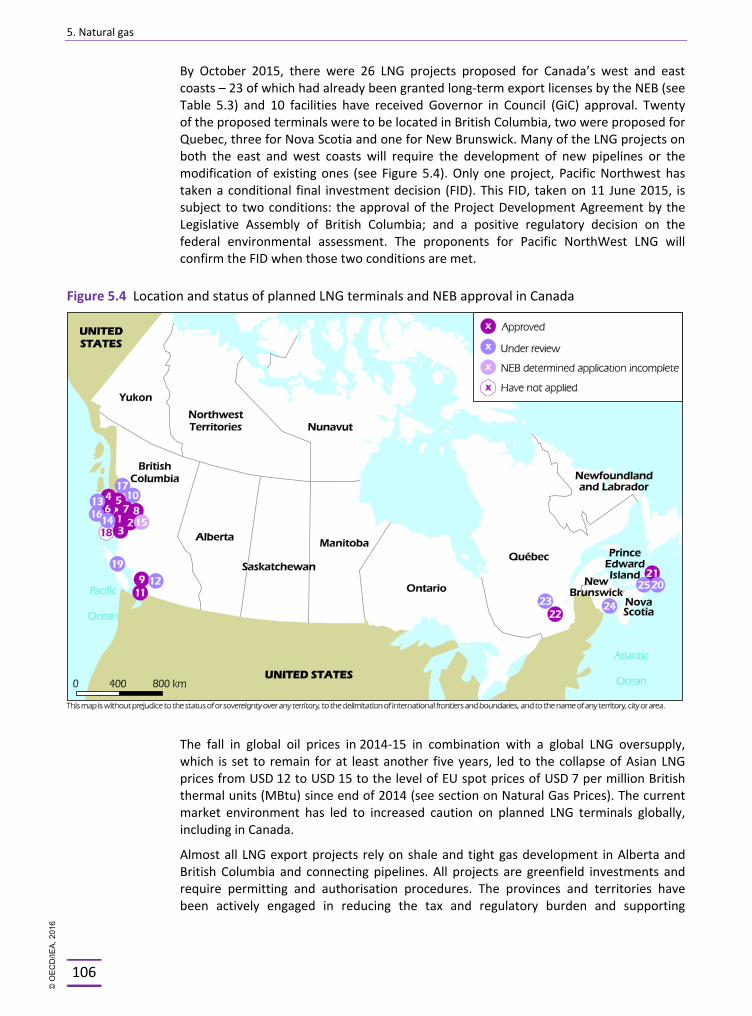
5. Natural gas
106
By October 2015, there were 26 LNG projects proposed for Canada’s west and east coasts – 23 of which had already been granted long-term export licenses by the NEB (see Table 5.3) and 10 facilities have received Governor in Council (GiC) approval. Twenty of the proposed terminals were to be located in British Columbia, two were proposed for Quebec, three for Nova Scotia and one for New Brunswick. Many of the LNG projects on both the east and west coasts will require the development of new pipelines or the modification of existing ones (see Figure 5.4). Only one project, Pacific Northwest has taken a conditional final investment decision (FID). This FID, taken on 11 June 2015, is subject to two conditions: the approval of the Project Development Agreement by the Legislative Assembly of British Columbia; and a positive regulatory decision on the federal environmental assessment. The proponents for Pacific NorthWest LNG will confirm the FID when those two conditions are met.
Figure 5.4 Location and status of planned LNG terminals and NEB approval in Canada
The fall in global oil prices in 2014-15 in combination with a global LNG oversupply, which is set to remain for at least another five years, led to the collapse of Asian LNG prices from USD 12 to USD 15 to the level of EU spot prices of USD 7 per million British thermal units (MBtu) since end of 2014 (see section on Natural Gas Prices). The current market environment has led to increased caution on planned LNG terminals globally, including in Canada.
Almost all LNG export projects rely on shale and tight gas development in Alberta and British Columbia and connecting pipelines. All projects are greenfield investments and require permitting and authorisation procedures. The provinces and territories have been actively engaged in reducing the tax and regulatory burden and supporting
© O
EC
D/IE
A, 2
016
5. Natural gas
107
dialogue with First Nations. However, environmental, political and social concerns remain a challenge to moving these types of projects forward. On the positive side, Canadian LNG faces no transport impediment and is in close reach of Asian and European markets from the respective coasts.
The federal government initiated several important measures to help private investment to come forward, through the Plan for Responsible Resource Development, new safety and security measures linked to pipeline and maritime transport and arctic offshore drilling. In addition, in Canada’s Economic Action Plan 2015, the federal government extended the length of natural gas export licences from 25 to 40 years and provided for accelerated capital cost allowance (CCA) treatment for assets used in facilities that liquefy natural gas.
Most LNG terminal proposals require both federal and provincial EAs and permits. CEAA 2012 provides tools to the federal government to collaborate with the provinces (e.g. substitution, co-ordinated EAs). EAs are part of the regulatory review process and positive decisions are required before commencing construction. A number of other federal permits may also be required before construction (e.g. Fisheries Act authorisations, Navigation Protection Act, etc.).
Extending natural gas export licences term lengths
The NEB is responsible for issuing oil and gas export licences. Taking into consideration the significant investments required for LNG projects, and their significant anticipated economic benefits, the government took additional steps to support the LNG industry and natural gas exporters. Canada’s Economic Action Plan 2015 extended the maximum length of natural gas export licences from 25 years to 40 years to improve regulatory certainty for natural gas exporters.
Accelerated capital cost allowance (CCA) treatment for LNG facilities
On 19 February 2015, Canada also announced its intention to provide accelerated capital cost allowance (CCA) treatment for assets used in facilities that liquefy natural gas, specifically:
§ Equipment used for natural gas liquefaction is generally included in CCA Class 47 with a CCA rate of 8%. The accelerated CCA will take the form of an additional 22% allowance that will bring the CCA rate up to 30% for Class 47 property used in Canada in connection with natural gas liquefaction.
§ Non-residential buildings at a facility that liquefies natural gas are currently eligible for a CCA rate of 6%. A second additional allowance will bring the CCA rate up to 10% for non-residential buildings that are part of a liquefaction facility.
The deferral of tax associated with this measure is expected to reduce federal taxes by CAD 45 million over the 2015–16 to 2019–20 period.
STORAGE
Canada has a number of commercial natural gas storage facilities located all around the country. Storage facilities are used to manage pipeline flows, production levels and to capture price arbitrage opportunities. Producer storage is mostly not subject to rate regulation.
© O
EC
D/IE
A, 2
016
5. Natural gas
108
As of 2013, Canada had 20 bcm in natural gas storage capacity. The majority of the storage facilities are located in western Canada (62%), mostly in Alberta, and are typically owned by pipeline companies or producers (except in Saskatchewan where all storage facilities are owned by the Crown Corporation, TransGas). The remainder of the natural gas storage facilities are in eastern Canada (37%), primarily in southern Ontario, and are typically owned by local distribution companies to meet seasonal demand fluctuations. Distribution is handled by private companies that have exclusive rights to distribute gas in a given regional or local area. Distribution companies are provincially regulated.
In both cases, underground natural gas storage facilities are an essential tool for allowing operators to balance their systems and optimise their gas use. There is no public or strategic natural gas storage in Canada.
TRANSMISSION AND DISTRIBUTION The Canadian natural gas network consists of a 66 905 km transmission network, a 241 563 km distribution network and a 135 384 km service network. The natural gas transmission pipeline system (see Figure 5.4) is made up of eight key pipelines with a combined 670 mcm/d capacity:
§ Westcoast Energy Inc. (Westcoast)
§ Alliance Pipeline Ltd. (Alliance)
§ Nova Gas Transmission Ltd.
§ Foothills PipeLines Ltd.
§ TransCanada Pipelines Ltd. (TransCanada)
§ Trans Quebec and Maritimes Pipeline Inc.
§ Maritimes & Northeast Pipeline LP.
§ Emera Brunswick Pipeline Company Inc.
For analytical purposes it is useful to divide Canadian natural gas infrastructure into two distinct geographical regions – western and eastern Canada. Western Canada is where most of the country’s natural gas production is located; the local pipeline network is thus extensive and well supplied, but there are only a few large pipelines linking the two regions. Historically, the supply of natural gas to customers in eastern Canada used to flow predominantly from western Canada through transmission pipelines that constitute the TransCanada Mainline. The TransCanada Mainline extends from the Alberta/Saskatchewan border to the Quebec/Vermont border, and has interconnections with other natural gas pipeline networks in both Canada and the US.
In eastern Canada, gas pipeline flows have changed significantly in recent years with rising imports from the United States. As a consequence of these developments, natural gas volumes transported on the TransCanada Mainline system from Empress, Alberta to Dawn, Ontario have sharply and steadily declined from 141 mcm/d in January 2008 to 56 mcm/d in August 2013. Throughput declines have been particularly pronounced on the Prairies and northern Ontario segments of this pipeline. Natural gas produced from the US Rockies region and US shale gas plays, such as the Marcellus play, increasingly compete with Canadian supply delivered via the TransCanada Mainline to key markets such as Ontario, Quebec and the US northeast. An average of 29% of the capacity on the Prairies segment and 38% of the capacity on the northern Ontario segment of the Mainline was used in the first nine months of 2013.
© O
EC
D/IE
A, 2
016
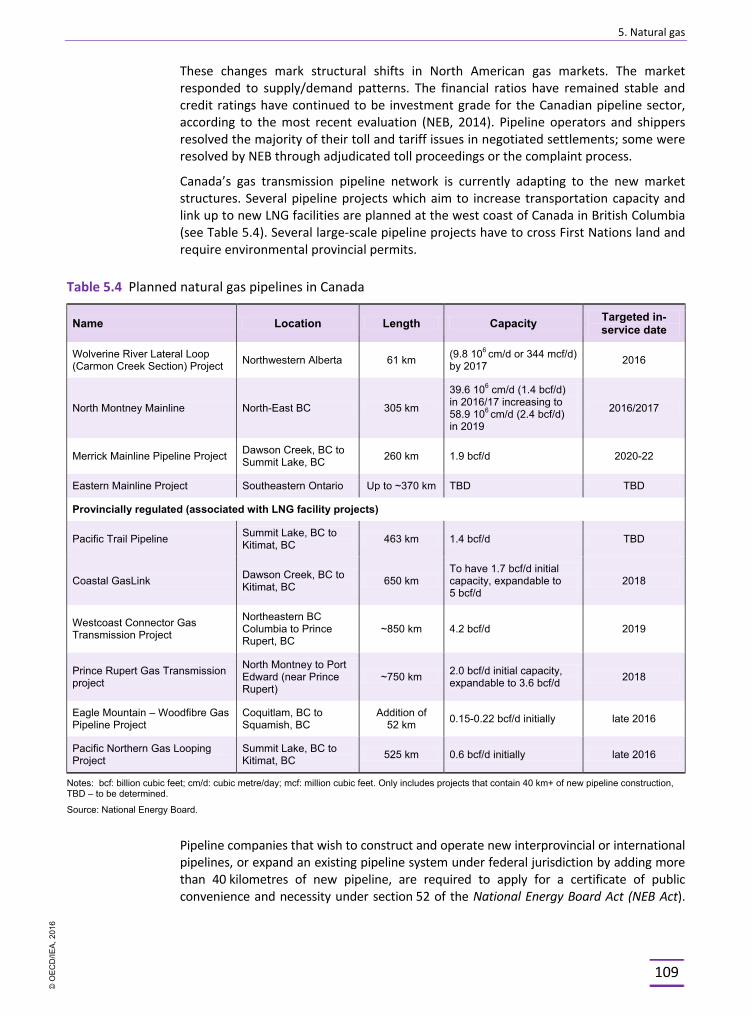
5. Natural gas
109
These changes mark structural shifts in North American gas markets. The market responded to supply/demand patterns. The financial ratios have remained stable and credit ratings have continued to be investment grade for the Canadian pipeline sector, according to the most recent evaluation (NEB, 2014). Pipeline operators and shippers resolved the majority of their toll and tariff issues in negotiated settlements; some were resolved by NEB through adjudicated toll proceedings or the complaint process.
Canada’s gas transmission pipeline network is currently adapting to the new market structures. Several pipeline projects which aim to increase transportation capacity and link up to new LNG facilities are planned at the west coast of Canada in British Columbia (see Table 5.4). Several large-scale pipeline projects have to cross First Nations land and require environmental provincial permits.
Table 5.4 Planned natural gas pipelines in Canada
Name Location Length Capacity Targeted in-service date
Wolverine River Lateral Loop (Carmon Creek Section) Project Northwestern Alberta 61 km (9.8 106 cm/d or 344 mcf/d)
by 2017 2016
North Montney Mainline North-East BC 305 km
39.6 106 cm/d (1.4 bcf/d) in 2016/17 increasing to 58.9 106 cm/d (2.4 bcf/d) in 2019
2016/2017
Merrick Mainline Pipeline Project Dawson Creek, BC to Summit Lake, BC 260 km 1.9 bcf/d 2020-22
Eastern Mainline Project Southeastern Ontario Up to ~370 km TBD TBD
Provincially regulated (associated with LNG facility projects)
Pacific Trail Pipeline Summit Lake, BC to Kitimat, BC 463 km 1.4 bcf/d TBD
Coastal GasLink Dawson Creek, BC to Kitimat, BC 650 km
To have 1.7 bcf/d initial capacity, expandable to 5 bcf/d
2018
Westcoast Connector Gas Transmission Project
Northeastern BC Columbia to Prince Rupert, BC
~850 km 4.2 bcf/d 2019
Prince Rupert Gas Transmission project
North Montney to Port Edward (near Prince Rupert)
~750 km 2.0 bcf/d initial capacity, expandable to 3.6 bcf/d 2018
Eagle Mountain – Woodfibre Gas Pipeline Project
Coquitlam, BC to Squamish, BC
Addition of 52 km 0.15-0.22 bcf/d initially late 2016
Pacific Northern Gas Looping Project
Summit Lake, BC to Kitimat, BC 525 km 0.6 bcf/d initially late 2016
Notes: bcf: billion cubic feet; cm/d: cubic metre/day; mcf: million cubic feet. Only includes projects that contain 40 km+ of new pipeline construction, TBD – to be determined.
Source: National Energy Board.
Pipeline companies that wish to construct and operate new interprovincial or international pipelines, or expand an existing pipeline system under federal jurisdiction by adding more than 40 kilometres of new pipeline, are required to apply for a certificate of public convenience and necessity under section 52 of the National Energy Board Act (NEB Act).
© O
EC
D/IE
A, 2
016
5. Natural gas
110
Applications under section 52 of the NEB Act trigger a public hearing. Under section 55.2 of the NEB Act, the Board must consider the representations of any person the Board determines as directly affected by a project and may also consider representations from those with relevant information or expertise.
Public hearings for pipeline projects are generally headed by a panel of three NEB Board members. During a hearing, the NEB considers all information that is relevant to the question of whether or not the application for the pipeline project should be approved. While each pipeline project has its own list of issues that will be considered at the hearing, some of the topics that are usually discussed include: the design and safety of the project, environmental matters, socio-economic and land matters, the impact of the project on Aboriginal groups, the impact of the project on directly affected persons, financial responsibility of the applicant, economic feasibility of the project; and the Canadian public interest.
Legislated timelines (maximum of 18 months) were introduced by the government in 2012 for all projects reviewed by the NEB that require an EA. The NEB has 15 months to conduct the review and to issue a report with a recommendation on the project to the Minister of Natural Resources. The NEB’s recommendation includes the terms and conditions to be attached to any certificate issued. The Governor in Council then has three months to take a decision on the project, subject to any extensions allowed under the NEB Act.
UNCONVENTIONAL GAS PRODUCTION IN CANADA
Unconventional gas resources (shale gas, tight gas and coal-bed methane) can be found in eastern and western Canada, but their development stage differs across the Canadian jurisdictions (see Figure 5.6).
Today, two major areas for shale and tight gas development are the Montney and Horn River plays in northeast British Columbia and northwest Alberta. Significant resources are located in the Quebec’s Utica shale play, the Muskwa and Spirit River formations in Alberta, in the St. Lawrence Lowlands, the Frederick Brook Shale in New Brunswick, the Liard Basin in BC/Yukon/Northwest Territories and arctic lands (see Figures 5.5 and 6.1).
Alberta, British Columbia and Saskatchewan have gained experience in unconventional oil and gas production and regulation for more than a decade, while other provinces, Quebec, New Brunswick, Nova Scotia, Yukon and the Northwest Territories, are still in the early stage of creating the conditions for their oil and gas development.
Environmental and regulatory considerations
Unconventional resource development has been brought about by new scientific research and assessments, technological innovation (see also Chapter 11 on Energy Research, Development and Demonstration) and has led to new regulatory action.
In Canada, unconventional gas (shale and tight) development is governed by strict regulatory frameworks, at both federal and provincial levels. Over the past five years, provinces and territories are in the process of reviewing and modernising their frameworks.
© O
EC
D/IE
A, 2
016
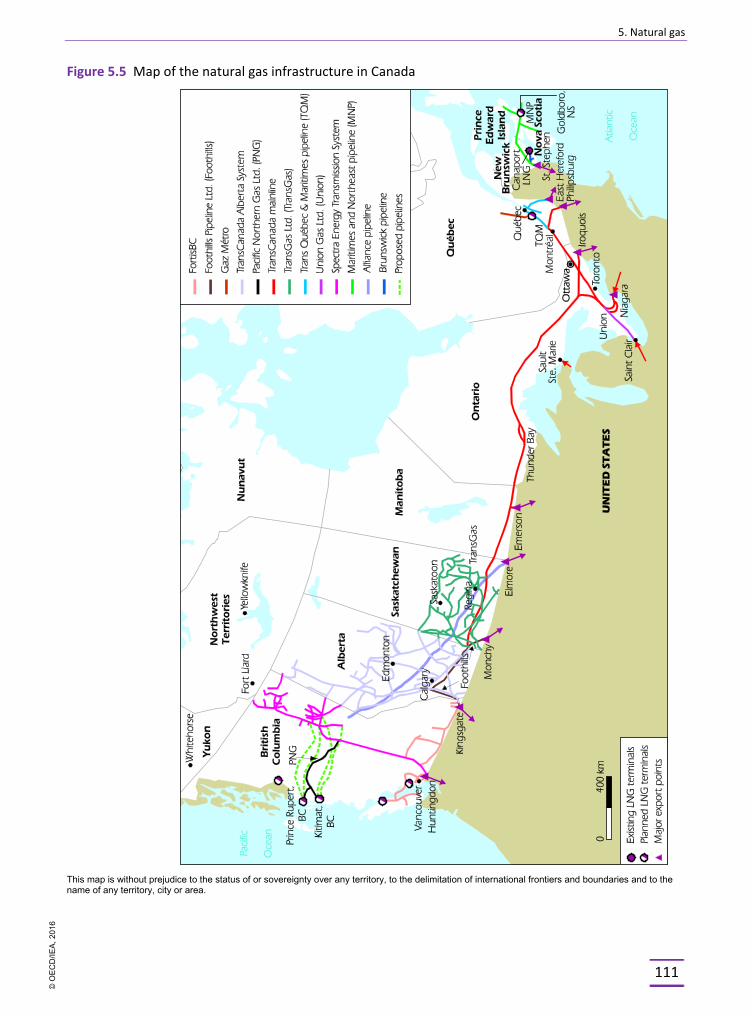
5. Natural gas
111
Figure 5.5 Map of the natural gas infrastructure in Canada
This map is without prejudice to the status of or sovereignty over any territory, to the delimitation of international frontiers and boundaries and to the name of any territory, city or area.
© O
EC
D/IE
A, 2
016
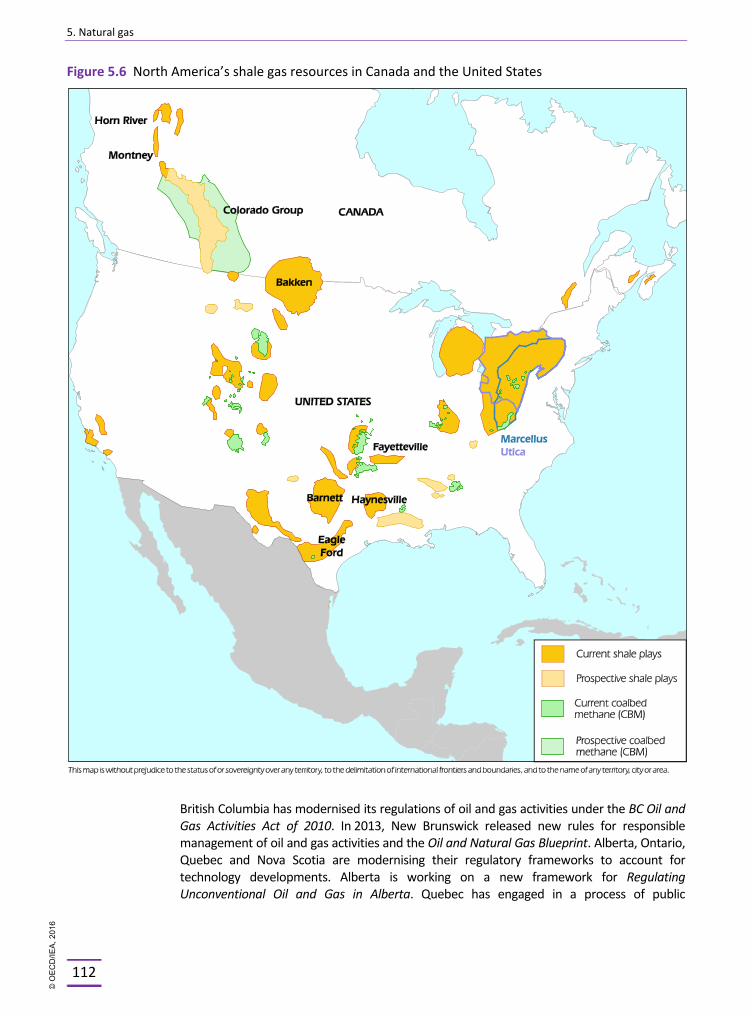
5. Natural gas
112
Figure 5.6 North America’s shale gas resources in Canada and the United States
British Columbia has modernised its regulations of oil and gas activities under the BC Oil and Gas Activities Act of 2010. In 2013, New Brunswick released new rules for responsible management of oil and gas activities and the Oil and Natural Gas Blueprint. Alberta, Ontario, Quebec and Nova Scotia are modernising their regulatory frameworks to account for technology developments. Alberta is working on a new framework for Regulating Unconventional Oil and Gas in Alberta. Quebec has engaged in a process of public
© O
EC
D/IE
A, 2
016
5. Natural gas
113
consultation, geological evaluations and risk assessments for the development of its hydrocarbon sector and oil and gas transportation. A first and second Strategic Environmental Assessments (SEA) for shale gas development were carried out in 2011 and 2014. Quebec revised the Mining Act in December 2013, adopted the Water Withdrawal and Protection Regulation in 2014. In May 2014 the Quebec Government Hydrocarbons Action Plan was published and a new Hydrocarbons Act is under preparation in 2015.
Shale gas, tight gas and tight oil deposits are located in deep rock formations and require the combined use of long-reach horizontal drilling and multi-stage hydraulic fracturing techniques to release the hydrocarbons and allow them to flow to the well at commercial rates. Half of Canada’s drilling fleet is made up of rigs that can reach deeper than 3 000 metres, according to the Canadian Association of Oilwell Drilling Contractors (CAODC). In 2014, there were 757 land-based drilling rigs, 4 offshore rigs and 1 106 service rigs (CAODC). Over 180 000 wells have been hydraulically fractured in Alberta alone since the technology was introduced in the 1950s. Regulations across Canada govern wellbore construction to ensure steel casing and cement barriers separate the wellbore from nearby water sources.
And production techniques for shale and tight gas are opposed or questioned by some for their alleged adverse environmental impacts. Opposition to shale gas development, particularly in non-traditional hydrocarbon-producing provinces such as Quebec and New Brunswick, is primarily due to public concerns around the environmental and health risks of this activity. Concerns include: water use and perceived threat of contamination (including fracturing fluid disclosure); air emissions including GHG and seismic activities as well as surface footprint, road dust and noise. Some shale formations are located under populated or agricultural areas and below key Canadian aquifers, which has increased these concerns. The induced seismicity of hydraulic fracturing is another concern.
Canada is entering the unconventional revolution and both oil and natural gas exploration and production will require strong environmental management and regulatory reviews and updates as technology innovation becomes available.
The Canadian industry has innovated in shale resource technologies, including well completion technologies, multi-stage fracturing, the use of capture and supply of carbon dioxide (CO2) as fracturing agent or the use of saline water or liquefied petroleum gas (LPG) as alternative to fresh water, with a view to improve well productivity and reduce the need for water.
On the industry side, in 2012 the Canadian Association of Petroleum Producers (CAPP) adopted Voluntary Hydraulic Fracturing Guiding Principles and Operating Practices, which include water management practices and action for the protection of water resources during the hydraulic fracturing operations. The Petroleum Services Association of Canada (PSAC) has signed up to the CAPP principles and created its own Hydraulic Fracturing Code of Conduct.
Public disclosure of key technical and scientific information is an area where Canadian provinces work together. A mandatory online registry of hydraulic fracturing fluids and chemical disclosure, the Canadian FracFocus portal (FracFocus.ca.) has been established by British Columbia Oil and Gas Commission (BCOGC) in 2012 which Alberta Energy Regulator and the National Energy Board subsequently joined. New Brunswick is also a member province.
Eastern provinces, New Brunswick, Nova Scotia, Quebec, and Newfoundland and Labrador have recently put in place restrictions to onshore shale gas development using
© O
EC
D/IE
A, 2
016
5. Natural gas
114
hydraulic fracturing and are conducting independent reviews to evaluate scientific evidence and address public concerns. Nova Scotia’s provincial government passed legislation prohibiting high-volume hydraulic fracturing and New Brunswick’s government similarly passed a one-year moratorium on hydraulic fracturing. Ontario is currently reviewing its policy framework for high-volume hydraulic fracture treatment. The Northwest Territories government is developing a Policy Framework and Guidelines for Hydraulic Fracturing in NWT.
Alberta’s Integrated Resource Management System Regulation considers not only the project-related impacts but the overall capacity of air shed, watershed, and land base while also establishing limits for total impacts on water, air, land, and wildlife. It includes public consultation and a comprehensive land-use framework and involves the Alberta Energy Regulator which regulates oil, gas and coal development. Alberta is developing an unconventional regulatory framework with a dedicated environmental impacts agency, the Alberta Environmental Monitoring, Evaluation and Reporting Agency (AEMERA). Alberta Energy Regulator, Alberta Energy, and Environment and Sustainable Resource Development are collaborating to reduce the overall water use, to promote reusing or recycling hydraulic fracturing fluid and a number of transparency and monitoring activities, including the Provincial Groundwater Inventory Program, Groundwater Observation Well Network or the Baseline Water Well Testing for Coal-bed Methane programme as well as Oilfield Injection programme.
During the period 2011 to 2015, the multi-stakeholder initiative, the Beaufort Regional Environmental Assessment (BREA), has supported regional environmental and socio-economic research to inform the environmental impact assessment processes of oil and gas activities in the Beaufort Sea. It addresses key regional issues, including cumulative effects assessment, information management, regional waste management, oil spill preparedness and response, socio-economic indicators, and climate change. The proposal was initiated and is supported by partners from the Inuvialuit Settlement region, territorial and federal governments, the oil and gas private sector, and academia.
Whenever natural gas is produced and cannot be marketed or reinjected into an oil or gas well, it must be either vented or flared. Next to flaring of associated gas during oil production, another concern is the venting of large volumes of methane during unconventional gas well construction. The World Bank ranked Canada eleventh (2.4 bcm in 2011) in the top 20 list of countries flaring natural gas (World Bank, 2012), compared to Russia (1st rank with 37.4 bcm), Nigeria (2nd rank with 14.6 bcm) and the United States (4th rank with 7.1 bcm).
For environmental, economic and safety reasons, the governments of British Columbia and Alberta have established regulations and targets to reduce flaring and venting of hydrocarbons and the environmental impacts of unconventional oil and gas production. The Canadian Standards Association is developing a national standard on venting and flaring. Several air quality monitoring activities are under way, notably in British Columbia, in a partnership across the government, the regulator and the industry (North East Air Monitoring Project) and in New Brunswick.
While the regulation of unconventional gas development is primarily provincial, the federal government has developed a number of collaborative activities to address the environmental and health concerns by fostering scientific research and analysis, including through the Energy and Mines Ministers’ Conferences (EMMC). Natural Resources Canada funds and performs a number of R&D activities geared at
© O
EC
D/IE
A, 2
016
5. Natural gas
115
unconventional gas through the ecoENERGY Innovation Initiative (ecoEII) and the Program of Energy Research and Development (PERD). Research activities are focused on improving the environmental performance and economic competitiveness of shale and tight gas. The department is also engaging numerous partners to address science gaps and identify opportunities for collaboration.
The Geologic Survey of Canada, Canada’s oldest scientific agency founded in 1842, carries out aquifer mapping and monitoring, shale gas formation mapping and resource estimation and risk assessment to evaluate production risks, including induced seismicity. This includes initiatives, like the Geoscience for New Energy Supplies (GNES) Program, the ESS Environmental Geoscience Program (2009-14) or the Geo-mapping for Energy and Minerals. Many programmes are run in collaboration with provinces and territories. The government of Canada supported the development of the “GHGenius” modelling tool for the life cycle analysis of GHG emission of various fuels in industries.
At the international level, the government of Canada is co-operating through the International Energy Agency with other jurisdictions and industry around the globe to exchange best practises on unconventional production, including in the process of the “Golden Rules for a Golden Age of Gas” (see Box 5.1). In March 2014, Canada hosted the Second Unconventional Gas Forum in Calgary (Alberta).
Golden Rules
The IEA has emphasised that the world’s vast unconventional natural gas resource potential holds the key to a golden age of gas. However, for that to happen, government, industry and other stakeholders must work together to address legitimate public concerns about the associated environmental and social impacts. The future of unconventional gas development hinges on building the adequate regulatory framework.
Box 5.1 Golden Rules for a Golden Age of Gas
Recent North American experience shows that unconventional gas, notably shale gas, can be exploited economically and many countries hope to emulate this success. In many cases, governments are hesitant, or even actively opposed, responding to public concerns that production could involve unaccepenvironmental and social damage.
In 2012, as part of the World Energy Outlook series, the IEA developed its Golden Rules for a Golden Age of Gas, which suggested principles that can allow policy makers, regulators, operators and others to address these environmental and social impacts.
Application of these rules can bring a level of environmental performance and public acceptance that can maintain or earn the industry a “social licence to operate” within a given jurisdiction, paving the way for the widespread development of unconventional gas resources on a large scale.
Measure, disclose and engage
§ Integrate engagement with local communities, residents and other stakeholders into each phase of a development starting before exploration; provide sufficient opportunity for comment on plans, operations and performance; listen to concerns and respond appropriately and promptly.
§ Establish baselines for key environmental indicators, such as groundwater quality, before commencing activity, with continued monitoring during operations.
© O
EC
D/IE
A, 2
016
5. Natural gas
116
Box 5.1 Golden Rules for a Golden Age of Gas (continued)
§ Measure and disclose operational data on water use, on the volumes and characteristics of waste water, and on methane and other air emissions, alongside full, mandatory disclosure of fracturing fluid additives and volumes.
§ Minimise disruption during operations, taking a broad view of social and environmental responsibilities, and ensure that economic benefits are also felt by local communities.
Watch where you drill
§ Choose well sites so as to minimise impacts on the local community, heritage, existing land use, individual livelihoods and ecology.
§ Properly survey the geology of the area to make smart decisions about where to drill and where to hydraulically fracture: assess the risk that deep faults or other geological features could generate earthquakes or permit fluids to pass between geological strata.
§ Monitor to ensure that hydraulic fractures do not extend beyond the gas-producing formations.
Isolate wells and prevent leaks
§ Put in place robust rules on well design, construction, cementing and integrity testing as part of a general performance standard that gas-bearing formations must be completely isolated from other strata penetrated by the well, in particular freshwater aquifers.
§ Consider appropriate minimum-depth limitations on hydraulic fracturing to underpin public confidence that this operation takes place only well away from the water table.
§ Take action to prevent and contain surface spills and leaks from wells, and to ensure that any waste fluids and solids are disposed of properly.
Treat water responsibly
§ Reduce freshwater use by improving operational efficiency; reuse or recycle, wherever practicable, to reduce the burden on local water resources.
§ Store and dispose of produced and waste water safely.
§ Minimise use of chemical additives and promote the development and use of more environmentally benign alternatives.
Eliminate venting, minimise flaring and other emissions
§ Target zero-venting and minimal flaring of natural gas during well completion and seek to reduce fugitive and vented greenhouse gas emissions during the entire productive life of a well.
§ Minimise air pollution from vehicles, drilling rig engines, pump engines and compressors.
Be ready to think big
§ Seek opportunities for realising the economies of scale and co-ordinated development of local infrastructure that can reduce environmental impacts.
© O
EC
D/IE
A, 2
016
5. Natural gas
117
Box 5.1 Golden Rules for a Golden Age of Gas (continued)
§ Take into account the cumulative and regional effects of multiple drilling, production and delivery activities on the environment, notably on water use and disposal, land use, air quality, traffic and noise.
Ensure a consistently high level of environmental performance
§ Ensure that anticipated levels of unconventional gas output are matched by commensurate resources and political backing for robust regulatory regimes at the appropriate levels, sufficient permitting and compliance staff, and reliable public information.
§ Find an appropriate balance in policy making between prescriptive regulation and performance-based regulation in order to guarantee high operational standards while also promoting innovation and technological improvement.
§ Ensure that emergency response plans are robust and match the scale of risk.
§ Pursue continuous improvement of regulations and operating practices.
§ Recognise the case for independent evaluation and verification of environmental performance.
Source: IEA (2012), World Energy Outlook 2012 Special Report: Golden Rules for a Golden Age of Gas, OECD/IEA, Paris.
NATURAL GAS MARKET STRUCTURE AND REGULATION
MARKET STRUCTURE
The Canadian natural gas market is fully liberalised. Investment in the sector is open to both private and foreign capital, and the commodity price of natural gas is determined by market supply and demand since gas pricing was deregulated in Canada in 1985. North America has an integrated natural gas market, with interconnected gas transmission networks transporting gas freely in both directions across the US-Canadian border.
Natural gas transmission pipeline flows are determined by the outcome of commercial negotiations between buyers (e.g. the local distribution companies) and sellers (e.g. production companies), and are also governed by regulator-approved pipeline tariffs. The tariff “rules of operation” for the pipeline cover issues such as shipper input and off-take requirements, daily balancing, and gas quality. The individual pipeline companies are responsible for load balancing on their networks, and pipeline load balancing is forced by rules for shippers and penalties for non-compliance. Shippers must therefore arrange for storage or other balancing services if these are needed to ensure they stay in balance (pipeline input must equal output for each shipper).
Natural gas distribution in Canada is managed by private companies that have exclusive rights to distribute gas in a given region. Distribution companies are provincially regulated.
The upstream industry is highly competitive in Canada. There are close to 700 natural gas producers operating in the country, although the top 10 producers contribute about 41% of gross natural gas production. In 2012, the largest natural gas producer in Canada, EnCana, produced approximately 40 mcm/d, or 8% of total Canadian natural gas production.
© O
EC
D/IE
A, 2
016
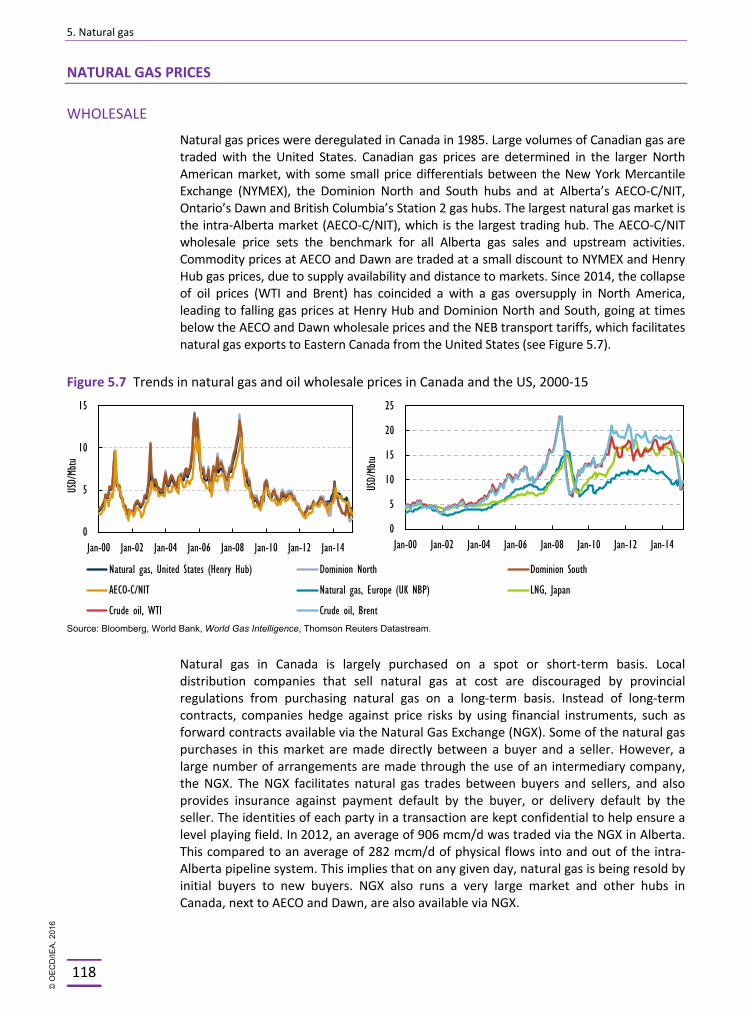
5. Natural gas
118
NATURAL GAS PRICES
WHOLESALE
Natural gas prices were deregulated in Canada in 1985. Large volumes of Canadian gas are traded with the United States. Canadian gas prices are determined in the larger North American market, with some small price differentials between the New York Mercantile Exchange (NYMEX), the Dominion North and South hubs and at Alberta’s AECO-C/NIT, Ontario’s Dawn and British Columbia’s Station 2 gas hubs. The largest natural gas market is the intra-Alberta market (AECO-C/NIT), which is the largest trading hub. The AECO-C/NIT wholesale price sets the benchmark for all Alberta gas sales and upstream activities. Commodity prices at AECO and Dawn are traded at a small discount to NYMEX and Henry Hub gas prices, due to supply availability and distance to markets. Since 2014, the collapse of oil prices (WTI and Brent) has coincided a with a gas oversupply in North America, leading to falling gas prices at Henry Hub and Dominion North and South, going at times below the AECO and Dawn wholesale prices and the NEB transport tariffs, which facilitates natural gas exports to Eastern Canada from the United States (see Figure 5.7).
Figure 5.7 Trends in natural gas and oil wholesale prices in Canada and the US, 2000-15
Source: Bloomberg, World Bank, World Gas Intelligence, Thomson Reuters Datastream.
Natural gas in Canada is largely purchased on a spot or short-term basis. Local distribution companies that sell natural gas at cost are discouraged by provincial regulations from purchasing natural gas on a long-term basis. Instead of long-term contracts, companies hedge against price risks by using financial instruments, such as forward contracts available via the Natural Gas Exchange (NGX). Some of the natural gas purchases in this market are made directly between a buyer and a seller. However, a large number of arrangements are made through the use of an intermediary company, the NGX. The NGX facilitates natural gas trades between buyers and sellers, and also provides insurance against payment default by the buyer, or delivery default by the seller. The identities of each party in a transaction are kept confidential to help ensure a level playing field. In 2012, an average of 906 mcm/d was traded via the NGX in Alberta. This compared to an average of 282 mcm/d of physical flows into and out of the intra-Alberta pipeline system. This implies that on any given day, natural gas is being resold by initial buyers to new buyers. NGX also runs a very large market and other hubs in Canada, next to AECO and Dawn, are also available via NGX.
0
5
10
15
Jan-00 Jan-02 Jan-04 Jan-06 Jan-08 Jan-10 Jan-12 Jan-14
USD/
Mbtu
Natural gas, United States (Henry Hub) Dominion North Dominion South
AECO-C/NIT Natural gas, Europe (UK NBP) LNG, Japan
Crude oil, WTI Crude oil, Brent
0
5
10
15
20
25
Jan-00 Jan-02 Jan-04 Jan-06 Jan-08 Jan-10 Jan-12 Jan-14
USD/
Mbtu
© O
EC
D/IE
A, 2
016
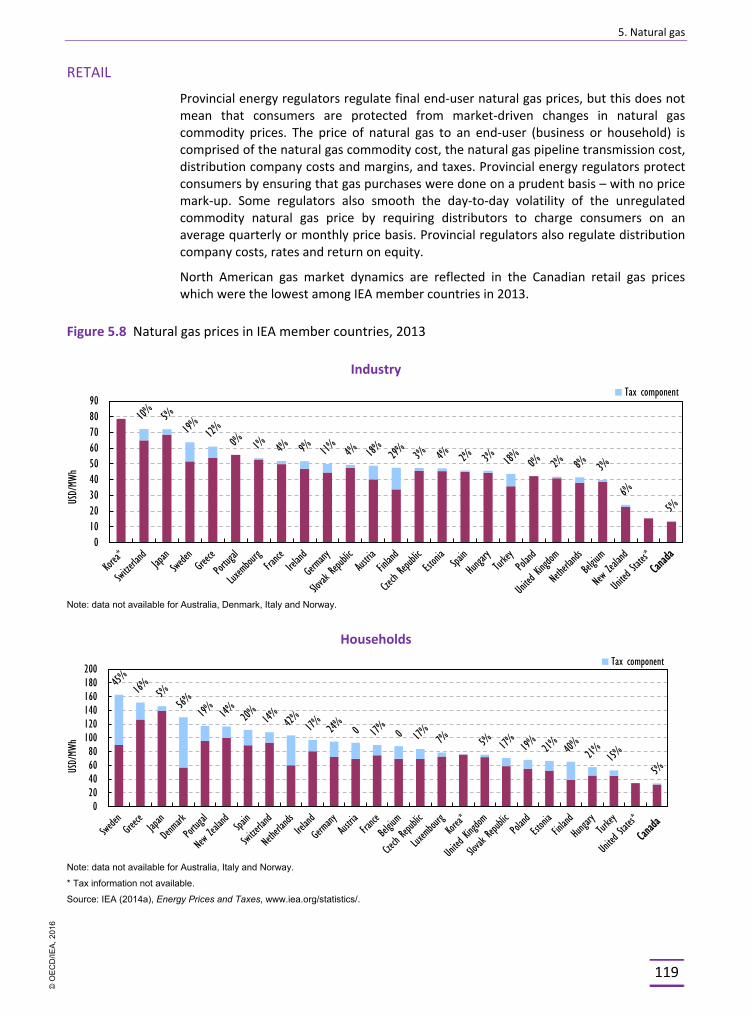
5. Natural gas
119
RETAIL
Provincial energy regulators regulate final end-user natural gas prices, but this does not mean that consumers are protected from market-driven changes in natural gas commodity prices. The price of natural gas to an end-user (business or household) is comprised of the natural gas commodity cost, the natural gas pipeline transmission cost, distribution company costs and margins, and taxes. Provincial energy regulators protect consumers by ensuring that gas purchases were done on a prudent basis – with no price mark-up. Some regulators also smooth the day-to-day volatility of the unregulated commodity natural gas price by requiring distributors to charge consumers on an average quarterly or monthly price basis. Provincial regulators also regulate distribution company costs, rates and return on equity.
North American gas market dynamics are reflected in the Canadian retail gas prices which were the lowest among IEA member countries in 2013.
Figure 5.8 Natural gas prices in IEA member countries, 2013
Industry
Note: data not available for Australia, Denmark, Italy and Norway.
Households
Note: data not available for Australia, Italy and Norway.
* Tax information not available.
Source: IEA (2014a), Energy Prices and Taxes, www.iea.org/statistics/.
0102030405060708090
USD/
MWh
Tax component
020406080
100120140160180200
USD/
MWh
Tax component
© O
EC
D/IE
A, 2
016
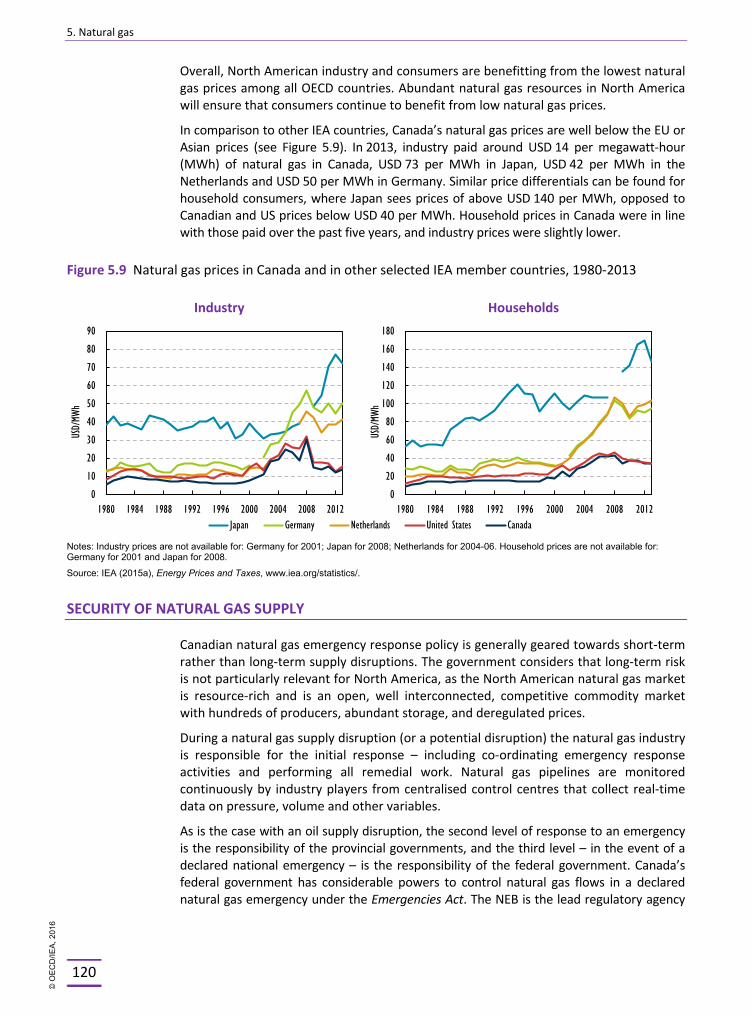
5. Natural gas
120
Overall, North American industry and consumers are benefitting from the lowest natural gas prices among all OECD countries. Abundant natural gas resources in North America will ensure that consumers continue to benefit from low natural gas prices.
In comparison to other IEA countries, Canada’s natural gas prices are well below the EU or Asian prices (see Figure 5.9). In 2013, industry paid around USD 14 per megawatt-hour (MWh) of natural gas in Canada, USD 73 per MWh in Japan, USD 42 per MWh in the Netherlands and USD 50 per MWh in Germany. Similar price differentials can be found for household consumers, where Japan sees prices of above USD 140 per MWh, opposed to Canadian and US prices below USD 40 per MWh. Household prices in Canada were in line with those paid over the past five years, and industry prices were slightly lower.
Figure 5.9 Natural gas prices in Canada and in other selected IEA member countries, 1980-2013
Industry Households
Notes: Industry prices are not available for: Germany for 2001; Japan for 2008; Netherlands for 2004-06. Household prices are not available for: Germany for 2001 and Japan for 2008.
Source: IEA (2015a), Energy Prices and Taxes, www.iea.org/statistics/.
SECURITY OF NATURAL GAS SUPPLY
Canadian natural gas emergency response policy is generally geared towards short-term rather than long-term supply disruptions. The government considers that long-term risk is not particularly relevant for North America, as the North American natural gas market is resource-rich and is an open, well interconnected, competitive commodity market with hundreds of producers, abundant storage, and deregulated prices.
During a natural gas supply disruption (or a potential disruption) the natural gas industry is responsible for the initial response – including co-ordinating emergency response activities and performing all remedial work. Natural gas pipelines are monitored continuously by industry players from centralised control centres that collect real-time data on pressure, volume and other variables.
As is the case with an oil supply disruption, the second level of response to an emergency is the responsibility of the provincial governments, and the third level – in the event of a declared national emergency – is the responsibility of the federal government. Canada’s federal government has considerable powers to control natural gas flows in a declared natural gas emergency under the Emergencies Act. The NEB is the lead regulatory agency
0
10
20
30
40
50
60
70
80
90
1980 1984 1988 1992 1996 2000 2004 2008 2012
USD/
MWh
Japan Germany Netherlands United States Canada
0
20
40
60
80
100
120
140
160
180
1980 1984 1988 1992 1996 2000 2004 2008 2012
USD/
MWh
© O
EC
D/IE
A, 2
016
5. Natural gas
121
on federally regulated facilities or operations and has its own Emergency Management Program in place to establish a prompt and co-ordinated response to an incident. The Pipelines, Gas and LNG Division (PGLD) of NRCan is responsible for providing policy advice and recommendations for natural gas-related issues.
In the event of a natural gas supply disruption, Canada has a number of options to ensure that demand will be met. Although there are no government-owned strategic reserves of natural gas in Canada and no government-imposed compulsory stockholding obligations on market participants – the country’s natural gas industry has significant commercial natural gas storage infrastructure that is primarily used to service peak winter demand. These storage volumes can be drawn down at very short notice to help meet demand or to help address a supply shortfall.
In the event of a domestic natural gas supply disruption, Canada could import additional quantities of natural gas via pipeline from the US or, in the event of a prolonged disruption, could also bid on LNG spot cargoes, to be received at the Canaport LNG terminal. However, pipelines leaving Canaport do not provide access to the bulk of the Canadian market, except indirectly through the US.
In the past, many large industrial natural gas consumers (including some electricity generators) had “interruptible” service contracts, meaning that their natural gas supplies can be diverted elsewhere if required. In recent years, lower capacity utilisation has decreased the importance of interruptible contracts. TransCanada has full discretion to set bid floors for these services. Bid floors have been set very high to encourage shippers to contract for firm transmission capacity. Currently, most gas shipped on TransCanada Mainline is shipped under firm contracts, as interruptible is deemed too expensive.
A reduction in natural gas export volumes may also be an option in some emergency scenarios. The North American Free Trade Agreement (NAFTA) prohibits the federal government from imposing any export volume restrictions except under certain circumstances. These exceptions include: the relief of a critical shortage of natural gas; domestic price stabilisation; the acquisition of products in short supply; and conservation measures in relation to restrictions on domestic production or consumption. However, any export restriction would invoke the proportionality clause, which provides that the restriction must not reduce the proportion of Canadian production offered to export customers below the percentage of Canadian production exported over the previous 36 months. It is important to note that in the case of an IEA emergency, Canada’s IEA obligations supersede any NAFTA restrictions. In general, therefore, the use of export curtailment to manage a natural gas supply disruption would be problematic.
The Canadian government does not have any policies to encourage fuel switching in the natural gas sector, and the country has limited capacity in this regard. While it may be possible for some electricity generators to switch to different fuels, a natural gas supply disruption would more likely be handled by using other forms of power generation to meet demand. However, some provinces are more reliant on natural gas for electricity supply than others. Around 10% of Canadian electricity is produced by natural gas, and that is likely regionally focused. A loss of natural gas and subsequent loss of power generating capacity could be problematic, notably in provinces were natural gas is replacing coal-fired power plants.
Fuel switching capacity exists in some industrial facilities, where the alternative fuel is oil, coal or wood. The primary motivation for these natural gas consumers to switch fuels would be the natural gas price. There are no government requirements to maintain
© O
EC
D/IE
A, 2
016
5. Natural gas
122
specific stocks of alternative fuels. For electricity generation, there are no requirements to maintain stocks of alternative fuels at the provincial level (or the federal level given that electricity supply falls under provincial jurisdiction).
ASSESSMENT
Since the last in-depth review in 2009, North American natural gas markets have experienced major changes, including the unconventional gas revolution, which has significantly shifted the natural gas supply outlook. North American natural gas markets, including Canada, the US and Mexico within NAFTA are becoming more and more integrated as gas trade flows change significantly.
In 2014, Canada was the fourth-largest gas producer in the world, up from its fifth position in 2013. Canada has large marketable natural gas resources of around 36 tcm, most of which is unconventional. However, Canada is losing some ground in its only current export market, while US imports to Canada have increased by 165% between 2003 and 2013. In particular, natural gas consumers in Eastern Canada are increasingly finding it more efficient to import gas from the nearby US northeast than transporting it from production sites in the Western Canadian Sedimentary Basin (WCSB).
Canadian natural gas production has declined by 15% since 2003. The pace of future development will depend on the US market, the economics of Canada’s unconventional resources and the time and scale of diversification of its exports to Europe and Asia-Pacific. The volume of Canadian natural gas available for export is projected to increase over the longer term.
The key imperative for Canada is to pursue new international markets and to promote energy market diversification. This will require the development of natural gas export infrastructure (e.g. LNG facilities and associated pipelines). Today, Canada has one LNG import facility; however, there are 26 LNG projects out of which 23 have received an export licence by the NEB and 10 facilities have received Governor in Council (GiC) approval. Six LNG facilities are located at the east coast and the lion’s share at ports in British Columbia, in close proximity to Asia-Pacific markets. The realisation of large-scale and project finance-intensive greenfield investment will strongly depend on oil prices and global LNG markets. The current low-price environment is expected to slow down the development in the medium-term. The province of British Columbia and the government of Canada have taken steps to ensure that the greenfield investment in Canada is competitive with that of brownfield project competition in the United States. In 2015, the federal government extended the export licence for LNG facilities from 25 years to a maximum of 40 years and increased the tax incentives. In general, the proximity of Canada to export markets from both coast sides, cooler temperatures, large gas resources and an advanced regulatory system make Canada an attractive place for LNG investment.
Domestic demand for natural gas for the production of the oil-sands and the role of gas in power generation and industry supports natural gas production in Canada in the medium term. In the longer term, US gas prices are set to rise amid expanding exports and could boost Canadian production and exports to the US.
The Canadian natural gas market is fully liberalised and appears to operate efficiently and in line with market supply and demand fundamentals for the benefit of both producers and consumers alike. Natural gas prices are the lowest among IEA member countries and natural gas serves as an important feedstock to Canada’s oil production and energy-intensive industries.
© O
EC
D/IE
A, 2
016
5. Natural gas
123
The Canadian natural gas transmission pipeline network is highly resilient, with significant (and in some cases growing) levels of spare capacity, adequate commercial natural gas storage facilities, and good integration with gas transmission networks in the US. Trade flows in Canada and the US are changing rapidly and the industry is adapting. In Eastern Canada, new US supply is displacing gas which TransCanada’s Mainline transports from the WCSB. Exacerbating the decline of TransCanada Mainline throughput is the fact that low gas prices have reduced production rates in the WCSB, and more of the remaining natural gas production was absorbed by Alberta’s oil-sands industry – decreasing the overall availability of WCSB gas for export.
The federal government took action to strengthen safety of offshore oil and gas production and transportation, through the Arctic Offshore Drilling Review of 2010-11, the Pipeline and Marine Tanker Safety Package, amendments to the Coasting Trade Act as well as measures under Bill C.22 Energy Safety and Security Act, which was consented by Parliament in February 2015.
Another key priority for Canada is the need to develop its unconventional resources in a sustainable manner. At the international level, the federal government has worked with the IEA in the “golden rules” process and hosted the IEA Unconventional Gas Forum in May 2014 in Calgary (Alberta) to discuss the challenges of unconventional gas production around the world and exchange best practices. Commendably, many initiatives are also taken by the provinces, territories and the industry. Many lessons can be learnt from the North American (including the Canadian) experience, shared and applied to policy and regulatory practice to support a regulatory landscape conducive to social acceptance, community land bonds and environmental sustainability of resource development.
In order for Canada to secure the responsible development of its unconventional resources, the cumulative impacts of unconventional gas and oil production need to be managed. Mitigating GHG and air emissions from venting and flaring at existing production sites and planning for the management of legacy wells are key regulatory challenges, along with the need to continuously ensure safety, environmental protection and transparency.
Finally, with abundant resources, natural gas could play a significant role in Canada’s transportation sector going forward. The sector is experiencing a second wave of investment. NRCan facilitated the preparation of a deployment roadmap for natural gas in transportation, in a round with industry, fleet end-users, academics, environmental NGOs and provincial governments, and promotes research and innovation. However, only a few natural gas vehicles are deployed in Canada, the majority still from the older generation, as LNG has been introduced only in 2012. Considerable research and regulatory work is needed to remove barriers to its use as marine or rail fuel and to put in place the necessary infrastructure.
Canada has vast natural gas resources. Developing these resources efficiently and sustainably, will contribute strongly to Canada’s economic prosperity.
RECOMMENDATIONS
The government of Canada should:
o Continue to work with all stakeholders on the research, development and deployment of technologies for the environmentally sustainable exploration and development of shale and tight gas, as well as on informing and involving the wider public on these technologies.
© O
EC
D/IE
A, 2
016
5. Natural gas
124
o Under the plan for Responsible Resource Development, work through the Energy and Mines Ministers’ Conference (EMMC) with the provinces and territories to share best practices with regard to the success factors, incentives and rules for unconventional gas production in order to, among other things, address concerns expressed by companies as well as the environmental concerns of the wider public.
o Continue to work with industry and regulators in the provinces and territories as well as in the United States on the regulatory framework for the use of natural gas (compressed and/or liquefied) in the on-road, rail and marine transportation sector with a view to ensure investment in necessary infrastructure.
References BGR (Bundesanstalt für Geowissenschaften und Rohstoffe), (2014), Energy Study 2014: Reserves, Resources and Availability of Energy, Hannover, December.
CNGVA (Canadian Natural Gas Vehicle Alliance), (2014), Natural Gas for Transportation in Canada.
CNGVA (2010), Natural Gas Use in the Canadian Transportation Sector, Deployment Roadmap, December.
IEA (International Energy Agency) (2015a), Energy Prices and Taxes, www.iea.org/statistics/, OECD/IEA, Paris.
IEA (2015b), Natural Gas Information, www.iea.org/statistics/, OECD/IEA, Paris.
IEA (2012), World Energy Outlook 2012 Special Report: Golden Rules for a Golden Age of Gas, OECD/IEA, Paris.
NEB (National Energy Board) (2016), Canada's Energy Future 2016, Energy Supply and Demand Projections to 2040.
NEB (2014), Canadian Pipeline Transportation System - Energy Market Assessment, April.
NEB (2013), Canada’s Energy Futures: Supply and Demand Projections to 2035, November.
NRCan (Natural Resources Canada) (2014), Energy Markets Fact Book, 2014/2015.
Statistics Canada (2014), Report on Energy Supply and Demand in Canada: 2013 Preliminary, Catalogue no 57-003-X., Ottawa, Canada.
World Bank (2012), Guidance Document: Flaring Estimates Produced by Satellite Observations, World Bank, Washington, D.C.
© O
EC
D/IE
A, 2
016
6. Oil
125
6. OIL
Key data (2013)
Crude oil, NGLs and synthetic crude oil production: 191.2 Mt, +36.2% since 2003
Crude oil, NGLs and synthetic crude oil net exports: 100.2 Mt, +263% since 2003
Oil products net exports: 13.2 Mt, +45.5% since 2003
Share of oil: 31% of TPES and 1.2% of electricity generation
TFC of oil products by sector1: 94.5 Mt (transport 59.4%, industry 29.3%, commercial and public services 9%, residential 2.3%), +11.6% since 2003
OVERVIEW
Canada is the world’s fifth-largest oil producer after the United States (US), Saudi Arabia, Russia and China. Oil (crude oil, natural gas liquids and synthetic crude oil)2 remains the most important source in the Canadian energy supply, accounting for 31% of total primary energy supply (TPES) in 2013. Canada’s total crude oil production that same year was 191.2 million tonnes (Mt), with 56% stemming from oil-sands.
Canada is a significant net oil exporter, and the country’s indigenous oil production is on the rise and more and more driven by oil-sands and new offshore production. While Canadian oil-sands have been less sensitive to fluctuating oil prices than light tight oil, the low oil price environment in 2015 and global oversupply will affect Canadian oil-sands production in the medium term, with greenfield projects being postponed.
Canada saw a 263% increase in net exports of crude oil, rising from 38.1 Mt in 2003 to 100.2 Mt in 2013. Priced at a discount, Canadian crude oil was imported by US refineries, adapted to heavy oil. Canada was also able to reduce its own import needs. Crude oil imports fell by 19% over a 10-year period, from 44.5 Mt in 2003 to 35.9 Mt in 2013, mostly concerning non-US markets. Eastern Canadian refineries, usually relying on global oil imports, have been absorbing more US oil, thereby replacing more expensive imports. Oil imports from the US have grown dramatically from 87 thousand barrels per day (kb/d) in 2012 to over 465 kb/d (including condensates) in the first four months of 2015.
1. Total final consumption (TFC) of oil products is the final consumption by end-users, i.e. transport, industry, households, businesses, agriculture and others. TFC excludes oil or oil products used in electricity and heat generation and other energy industries (transformations) such as refining. In the case of Canada, the quantity of recycled fuels reported to the IEA under transformations exaggerates the energy value of this classification and reduces the overall value of total primary energy supply (TPES) of oil as the exaggeration leads to higher than expected inputs into refining, or, oil products consumed in anything other than final consumption. As such, oil TPES is smaller than TFC for Canada. Therefore, the IEA has chosen TFC as the more true representation of sectoral demand. 2. Crude oil includes light, medium, heavy crude oil and crude bitumen, as well as condensates and pentanes (since 2005), conventional and unconventional crude oil. NGL includes natural gas liquids. Condensates and pentanes were included from 1990 to 2004. Synthetic crude oil is produced from oil sands by upgrading and processing bitumen into a high quality, light, low sulphur crude oil. Oil sands crudes include both diluted bitumen and synthetic crude oil.
© O
EC
D/IE
A, 2
016
6. Oil
126
Around 72% of Canadian oil production was exported in 2013 – with total exports of 136.5 Mt. In 2013, 99% of Canadian exports went to the United States (US), its main export market, with small export cargoes being sent to other markets in Asia and Europe. Canada is focused on diversifying its oil exports to markets beyond North America.
For Canadian oil to reach global markets, increased pipeline capacity is needed for exports. Similarly, many areas in Canada’s domestic markets are currently supplied by imported oil and cannot benefit from North American supplies. The development of significant new oil pipeline transport infrastructure for supplying both the domestic and export markets is therefore a priority. The process of expanding access to the domestic market has already begun, with pipeline developments – including flow reversals on Enbridge – underpinning a trend of falling non-US crude oil imports to eastern Canada and their replacement with North American crude supplies. With the planned expansion and diversification of infrastructure to supply eastern Canada, notably via planned pipeline projects, like Energy East, the security of oil supply is further improving.
SUPPLY AND DEMAND
Oil is the second most significant energy source in Canada, accounting for 31% of TPES in 2013. Total energy supply from oil3 was 78.4 million tonnes of oil-equivalent (Mtoe) in 2013, a decline of 5.9% from the previous year and an 18.8% decline from a peak of 96.6 Mtoe in 2004. Total final consumption (TFC) of oil – an alternative measure to total energy supply – was 94.5 Mtoe in 2013. TFC represents the total of oil products consumed in the country, and excludes calculation of oil and oil products consumed in refining and electricity generation. Oil consumption in electricity generation is marginal, at 1.9 Mtoe in 2013. The consumption of oil in refining is exaggerated in Canada under the current reporting system to the IEA because of inclusions of recycled oil products. This exaggeration leads to higher than expected inputs into refining or oil products consumed in anything other than final consumption. As such, oil TFC has been larger than oil TPES for most of the past decade, and is the more accurate measure of total consumption/supply of oil within the country.
RESERVES
Canada has proven oil reserves of 171.0 billion barrels (bb), sufficient to maintain the 2014 production rate for 130 years. The majority of Canadian reserves (97% or 166.3 bb) can be found in the oil-sands of Alberta, with the remaining 4.7 bb of oil in the Western Canadian Sedimentary Basin, East Coast Offshore and the Arctic (AER 2015, CAPP).
3. Oil TPES is normally calculated as production + imports − exports − international marine bunkers − international aviation bunkers ± stock changes. This equals the total supply of crude oil, oil-sands, natural gas liquids (NGL) and oil products that is consumed domestically, either in transformation (for example refining) or in final use. However, in the case of Canada, the quantity of recycled fuels reported to the IEA under transformations exaggerates the energy value of this classification and reduces the overall value of TPES of oil as the exaggeration leads to higher than expected inputs into refining, or, oil products consumed in anything other than final consumption. As such, oil TPES is smaller than TFC for Canada. Therefore, the IEA has chosen TFC as the more true representation of sectoral demand. Therefore, TFC is a better representation of total oil consumed in Canada, rather than TPES.
© O
EC
D/IE
A, 2
016
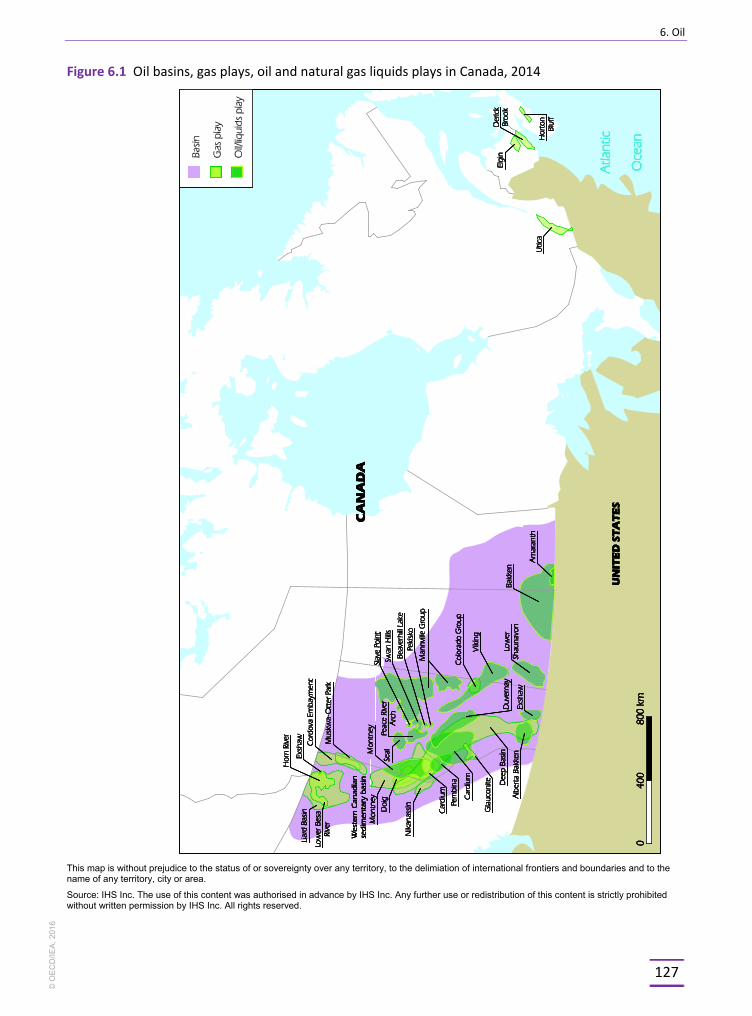
6. Oil
127
Figure 6.1 Oil basins, gas plays, oil and natural gas liquids plays in Canada, 2014
This map is without prejudice to the status of or sovereignty over any territory, to the delimiation of international frontiers and boundaries and to the name of any territory, city or area.
Source: IHS Inc. The use of this content was authorised in advance by IHS Inc. Any further use or redistribution of this content is strictly prohibited without written permission by IHS Inc. All rights reserved.
© O
EC
D/IE
A, 2
016
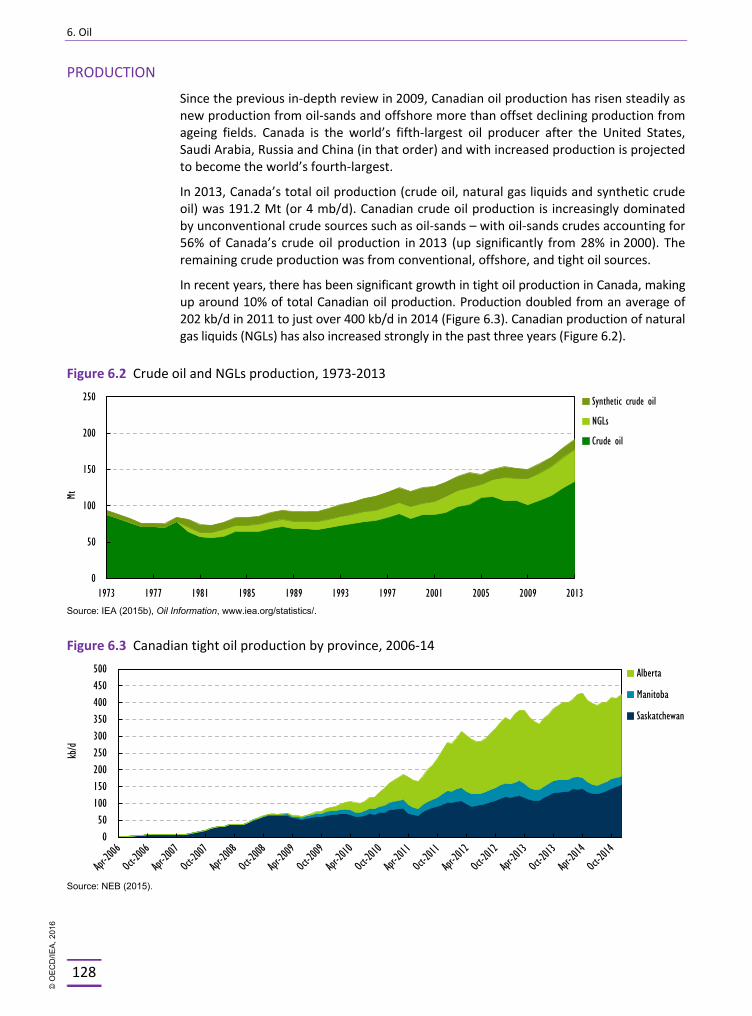
6. Oil
128
PRODUCTION
Since the previous in-depth review in 2009, Canadian oil production has risen steadily as new production from oil-sands and offshore more than offset declining production from ageing fields. Canada is the world’s fifth-largest oil producer after the United States, Saudi Arabia, Russia and China (in that order) and with increased production is projected to become the world’s fourth-largest.
In 2013, Canada’s total oil production (crude oil, natural gas liquids and synthetic crude oil) was 191.2 Mt (or 4 mb/d). Canadian crude oil production is increasingly dominated by unconventional crude sources such as oil-sands – with oil-sands crudes accounting for 56% of Canada’s crude oil production in 2013 (up significantly from 28% in 2000). The remaining crude production was from conventional, offshore, and tight oil sources.
In recent years, there has been significant growth in tight oil production in Canada, making up around 10% of total Canadian oil production. Production doubled from an average of 202 kb/d in 2011 to just over 400 kb/d in 2014 (Figure 6.3). Canadian production of natural gas liquids (NGLs) has also increased strongly in the past three years (Figure 6.2).
Figure 6.2 Crude oil and NGLs production, 1973-2013
Source: IEA (2015b), Oil Information, www.iea.org/statistics/.
Figure 6.3 Canadian tight oil production by province, 2006-14
Source: NEB (2015).
0
50
100
150
200
250
1973 1977 1981 1985 1989 1993 1997 2001 2005 2009 2013
Mt
Synthetic crude oil
NGLs
Crude oil
0 50
100 150 200 250 300 350 400 450 500
kb/d
Alberta
Manitoba
Saskatchewan
© O
EC
D/IE
A, 2
016
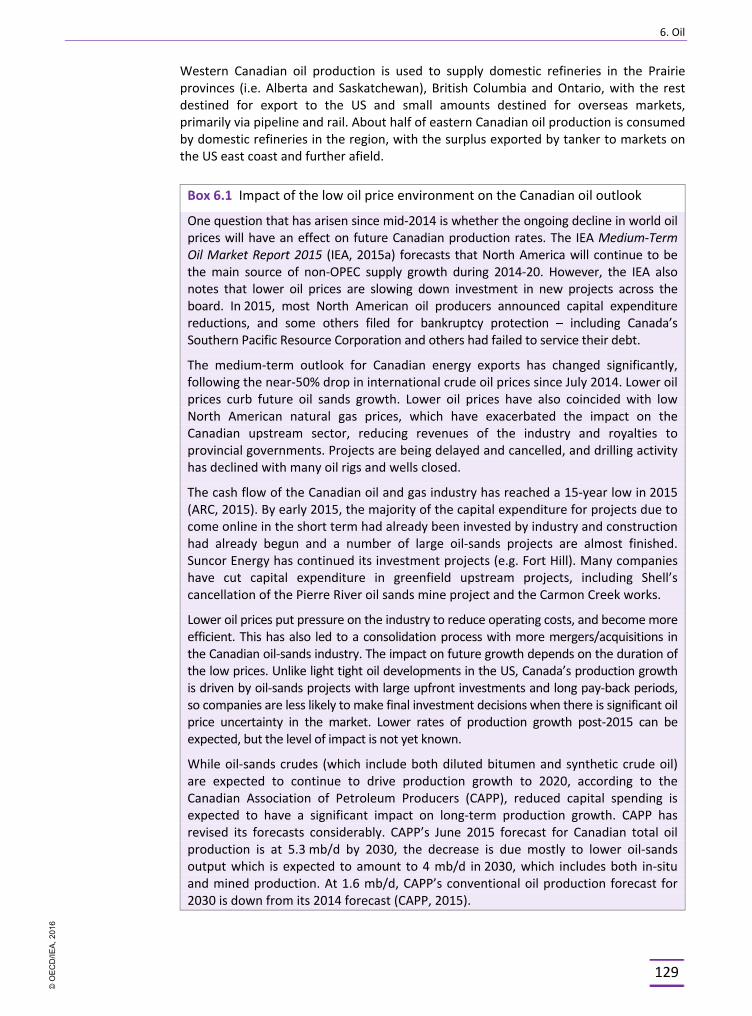
6. Oil
129
Western Canadian oil production is used to supply domestic refineries in the Prairie provinces (i.e. Alberta and Saskatchewan), British Columbia and Ontario, with the rest destined for export to the US and small amounts destined for overseas markets, primarily via pipeline and rail. About half of eastern Canadian oil production is consumed by domestic refineries in the region, with the surplus exported by tanker to markets on the US east coast and further afield.
Box 6.1 Impact of the low oil price environment on the Canadian oil outlook
One question that has arisen since mid-2014 is whether the ongoing decline in world oil prices will have an effect on future Canadian production rates. The IEA Medium-Term Oil Market Report 2015 (IEA, 2015a) forecasts that North America will continue to be the main source of non-OPEC supply growth during 2014-20. However, the IEA also notes that lower oil prices are slowing down investment in new projects across the board. In 2015, most North American oil producers announced capital expenditure reductions, and some others filed for bankruptcy protection – including Canada’s Southern Pacific Resource Corporation and others had failed to service their debt.
The medium-term outlook for Canadian energy exports has changed significantly, following the near-50% drop in international crude oil prices since July 2014. Lower oil prices curb future oil sands growth. Lower oil prices have also coincided with low North American natural gas prices, which have exacerbated the impact on the Canadian upstream sector, reducing revenues of the industry and royalties to provincial governments. Projects are being delayed and cancelled, and drilling activity has declined with many oil rigs and wells closed.
The cash flow of the Canadian oil and gas industry has reached a 15-year low in 2015 (ARC, 2015). By early 2015, the majority of the capital expenditure for projects due to come online in the short term had already been invested by industry and construction had already begun and a number of large oil-sands projects are almost finished. Suncor Energy has continued its investment projects (e.g. Fort Hill). Many companies have cut capital expenditure in greenfield upstream projects, including Shell’s cancellation of the Pierre River oil sands mine project and the Carmon Creek works.
Lower oil prices put pressure on the industry to reduce operating costs, and become more efficient. This has also led to a consolidation process with more mergers/acquisitions in the Canadian oil-sands industry. The impact on future growth depends on the duration of the low prices. Unlike light tight oil developments in the US, Canada’s production growth is driven by oil-sands projects with large upfront investments and long pay-back periods, so companies are less likely to make final investment decisions when there is significant oil price uncertainty in the market. Lower rates of production growth post-2015 can be expected, but the level of impact is not yet known.
While oil-sands crudes (which include both diluted bitumen and synthetic crude oil) are expected to continue to drive production growth to 2020, according to the Canadian Association of Petroleum Producers (CAPP), reduced capital spending is expected to have a significant impact on long-term production growth. CAPP has revised its forecasts considerably. CAPP’s June 2015 forecast for Canadian total oil production is at 5.3 mb/d by 2030, the decrease is due mostly to lower oil-sands output which is expected to amount to 4 mb/d in 2030, which includes both in-situ and mined production. At 1.6 mb/d, CAPP’s conventional oil production forecast for 2030 is down from its 2014 forecast (CAPP, 2015).
© O
EC
D/IE
A, 2
016
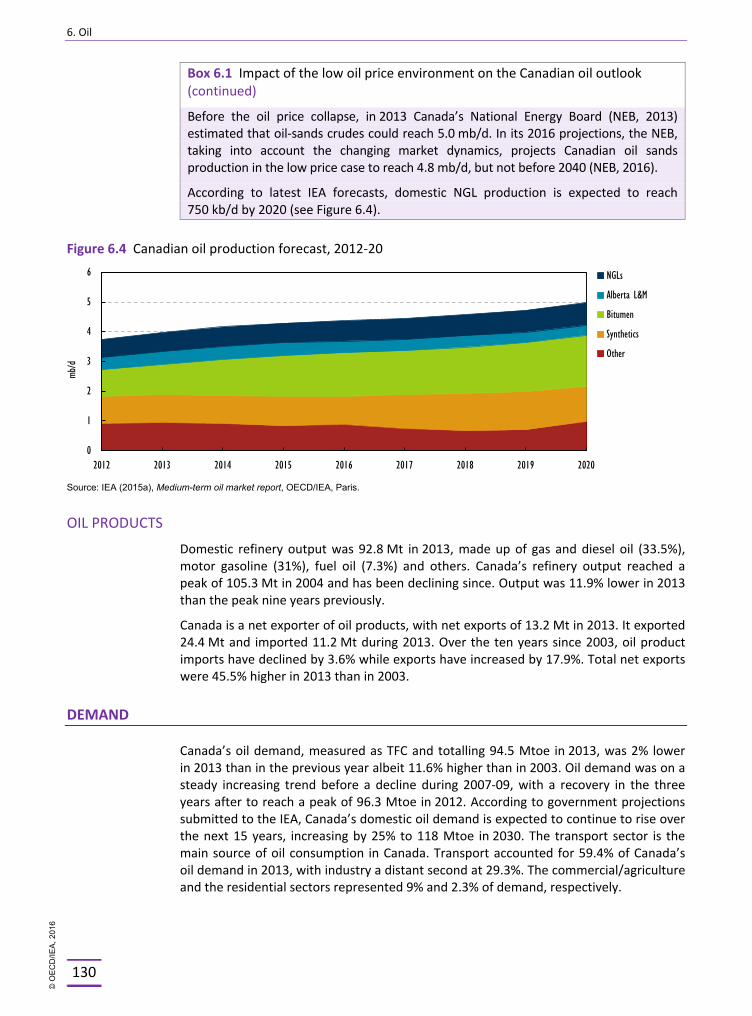
6. Oil
130
Box 6.1 Impact of the low oil price environment on the Canadian oil outlook (continued)
Before the oil price collapse, in 2013 Canada’s National Energy Board (NEB, 2013) estimated that oil-sands crudes could reach 5.0 mb/d. In its 2016 projections, the NEB, taking into account the changing market dynamics, projects Canadian oil sands production in the low price case to reach 4.8 mb/d, but not before 2040 (NEB, 2016).
According to latest IEA forecasts, domestic NGL production is expected to reach 750 kb/d by 2020 (see Figure 6.4).
Figure 6.4 Canadian oil production forecast, 2012-20
Source: IEA (2015a), Medium-term oil market report, OECD/IEA, Paris.
OIL PRODUCTS
Domestic refinery output was 92.8 Mt in 2013, made up of gas and diesel oil (33.5%), motor gasoline (31%), fuel oil (7.3%) and others. Canada’s refinery output reached a peak of 105.3 Mt in 2004 and has been declining since. Output was 11.9% lower in 2013 than the peak nine years previously.
Canada is a net exporter of oil products, with net exports of 13.2 Mt in 2013. It exported 24.4 Mt and imported 11.2 Mt during 2013. Over the ten years since 2003, oil product imports have declined by 3.6% while exports have increased by 17.9%. Total net exports were 45.5% higher in 2013 than in 2003.
DEMAND
Canada’s oil demand, measured as TFC and totalling 94.5 Mtoe in 2013, was 2% lower in 2013 than in the previous year albeit 11.6% higher than in 2003. Oil demand was on a steady increasing trend before a decline during 2007-09, with a recovery in the three years after to reach a peak of 96.3 Mtoe in 2012. According to government projections submitted to the IEA, Canada’s domestic oil demand is expected to continue to rise over the next 15 years, increasing by 25% to 118 Mtoe in 2030. The transport sector is the main source of oil consumption in Canada. Transport accounted for 59.4% of Canada’s oil demand in 2013, with industry a distant second at 29.3%. The commercial/agriculture and the residential sectors represented 9% and 2.3% of demand, respectively.
0
1
2
3
4
5
6
2012 2013 2014 2015 2016 2017 2018 2019 2020
mb/d
NGLs
Alberta L&M
Bitumen
Synthetics
Other
© O
EC
D/IE
A, 2
016
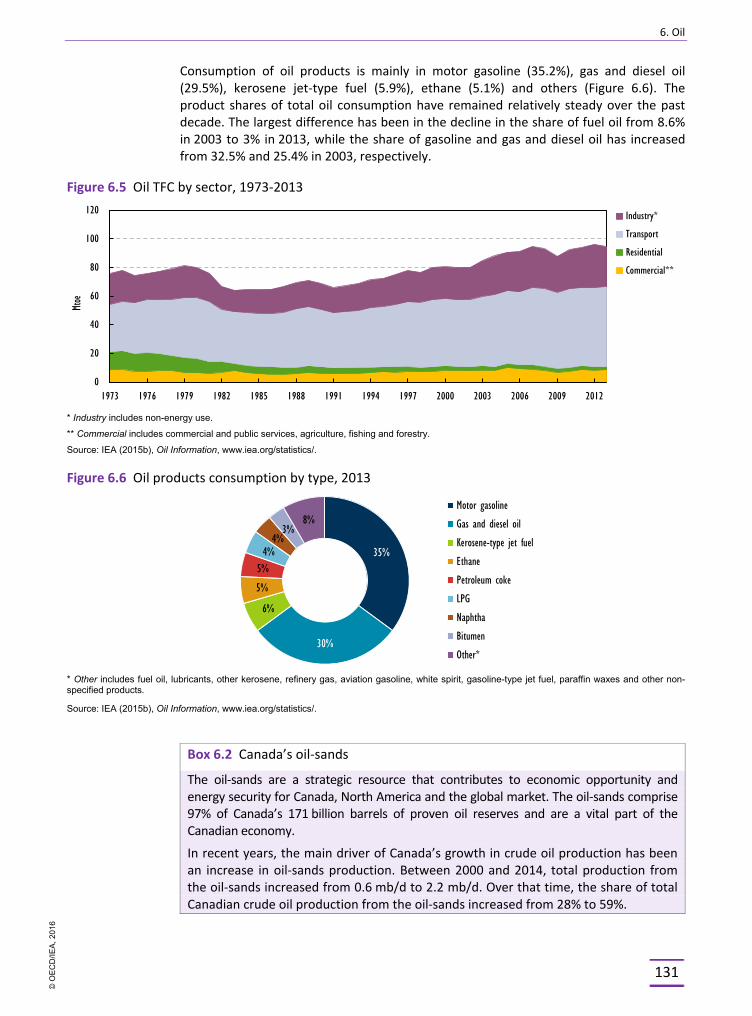
6. Oil
131
Consumption of oil products is mainly in motor gasoline (35.2%), gas and diesel oil (29.5%), kerosene jet-type fuel (5.9%), ethane (5.1%) and others (Figure 6.6). The product shares of total oil consumption have remained relatively steady over the past decade. The largest difference has been in the decline in the share of fuel oil from 8.6% in 2003 to 3% in 2013, while the share of gasoline and gas and diesel oil has increased from 32.5% and 25.4% in 2003, respectively.
Figure 6.5 Oil TFC by sector, 1973-2013
* Industry includes non-energy use.
** Commercial includes commercial and public services, agriculture, fishing and forestry.
Source: IEA (2015b), Oil Information, www.iea.org/statistics/.
Figure 6.6 Oil products consumption by type, 2013
* Other includes fuel oil, lubricants, other kerosene, refinery gas, aviation gasoline, white spirit, gasoline-type jet fuel, paraffin waxes and other non-specified products.
Source: IEA (2015b), Oil Information, www.iea.org/statistics/.
Box 6.2 Canada’s oil-sands
The oil-sands are a strategic resource that contributes to economic opportunity and energy security for Canada, North America and the global market. The oil-sands comprise 97% of Canada’s 171 billion barrels of proven oil reserves and are a vital part of the Canadian economy.
In recent years, the main driver of Canada’s growth in crude oil production has been an increase in oil-sands production. Between 2000 and 2014, total production from the oil-sands increased from 0.6 mb/d to 2.2 mb/d. Over that time, the share of total Canadian crude oil production from the oil-sands increased from 28% to 59%.
0
20
40
60
80
100
120
1973 1976 1979 1982 1985 1988 1991 1994 1997 2000 2003 2006 2009 2012
Mtoe
Industry*
Transport
Residential
Commercial**
35%
30%
6%
5%
5%4%
4%3%
8%Motor gasoline
Gas and diesel oil
Kerosene-type jet fuel
Ethane
Petroleum coke
LPG
Naphtha
Bitumen
Other*
© O
EC
D/IE
A, 2
016
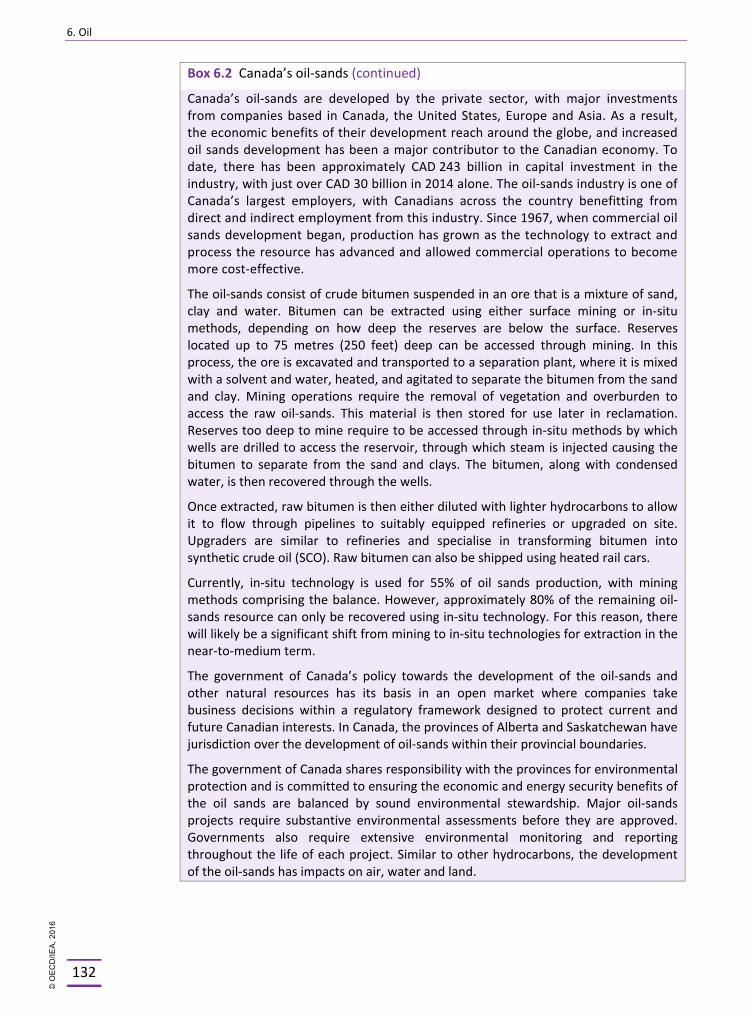
6. Oil
132
Box 6.2 Canada’s oil-sands (continued)
Canada’s oil-sands are developed by the private sector, with major investments from companies based in Canada, the United States, Europe and Asia. As a result, the economic benefits of their development reach around the globe, and increased oil sands development has been a major contributor to the Canadian economy. To date, there has been approximately CAD 243 billion in capital investment in the industry, with just over CAD 30 billion in 2014 alone. The oil-sands industry is one of Canada’s largest employers, with Canadians across the country benefitting from direct and indirect employment from this industry. Since 1967, when commercial oil sands development began, production has grown as the technology to extract and process the resource has advanced and allowed commercial operations to become more cost-effective.
The oil-sands consist of crude bitumen suspended in an ore that is a mixture of sand, clay and water. Bitumen can be extracted using either surface mining or in-situ methods, depending on how deep the reserves are below the surface. Reserves located up to 75 metres (250 feet) deep can be accessed through mining. In this process, the ore is excavated and transported to a separation plant, where it is mixed with a solvent and water, heated, and agitated to separate the bitumen from the sand and clay. Mining operations require the removal of vegetation and overburden to access the raw oil-sands. This material is then stored for use later in reclamation. Reserves too deep to mine require to be accessed through in-situ methods by which wells are drilled to access the reservoir, through which steam is injected causing the bitumen to separate from the sand and clays. The bitumen, along with condensed water, is then recovered through the wells.
Once extracted, raw bitumen is then either diluted with lighter hydrocarbons to allow it to flow through pipelines to suitably equipped refineries or upgraded on site. Upgraders are similar to refineries and specialise in transforming bitumen into synthetic crude oil (SCO). Raw bitumen can also be shipped using heated rail cars.
Currently, in-situ technology is used for 55% of oil sands production, with mining methods comprising the balance. However, approximately 80% of the remaining oil-sands resource can only be recovered using in-situ technology. For this reason, there will likely be a significant shift from mining to in-situ technologies for extraction in the near-to-medium term.
The government of Canada’s policy towards the development of the oil-sands and other natural resources has its basis in an open market where companies take business decisions within a regulatory framework designed to protect current and future Canadian interests. In Canada, the provinces of Alberta and Saskatchewan have jurisdiction over the development of oil-sands within their provincial boundaries.
The government of Canada shares responsibility with the provinces for environmental protection and is committed to ensuring the economic and energy security benefits of the oil sands are balanced by sound environmental stewardship. Major oil-sands projects require substantive environmental assessments before they are approved. Governments also require extensive environmental monitoring and reporting throughout the life of each project. Similar to other hydrocarbons, the development of the oil-sands has impacts on air, water and land.
© O
EC
D/IE
A, 2
016
6. Oil
133
Box 6.2 Canada’s oil-sands (continued)
Oil-sands mining operations required, on average, about 3 billion barrels of fresh water per barrel of SCO between 2005 and 2013 (CERI, 2014). Much of their water is withdrawn from the Athabasca River in Alberta. The Athabasca River Water Management Framework ensured that annual withdrawals by oil-sands companies represented 0.6% of the average annual river flow and less than 3% of the lowest weekly winter flow in 2012. Regulations also control instantaneous flows, based on the given flow in the river, as river flow changes considerably from season to season. To protect the quality of the river water, no production water is returned to the river. Instead, it is stored in tailings ponds and about 80% of the water used in the production process has been recycled. While this reduces the amount of fresh water that needs to be drawn from the river, the management of the tailings poses a challenge (CERI, 2014). The government of Alberta has established thresholds for the management of fluid tailings that result from oil-sands mining processes.
Oil-sands in-situ operations require an average of 0.4 to 0.5 barrels of water per barrel of bitumen. In-situ projects rely largely on groundwater for their water needs, with an increasing amount being saline or brackish water (CERI, 2014). The in-situ method of accessing oil-sands resources does not produce tailing ponds. It uses natural gas as feedstock to fuel the steam production needed to extract the oil-sands from the wells.
The government of Alberta requires that companies remediate and reclaim 100% of the land after the oil-sands have been extracted. Reclamation means that land is returned to a self-sustaining ecosystem with local vegetation and wildlife. Long before the landscape is touched by development, comprehensive assessments identify potential environmental impacts, such as those affecting land, air, water and biodiversity.
Steps are then taken during the life of a project to minimise any negative effects. Oil sands companies must file a Conservation and Reclamation Plan as part of their initial project application, keep it current, and post financial security bonds for reclamation. The provincial government ensures that all oil-sands companies fulfil their legal obligation to reclaim the land. Oil-sands mining started in 1967, and while 1.04 km2 of land disturbed by mining has been certified reclaimed by regulators, reclamation of tailings ponds and most disturbed land is just beginning, and will take many years. A typical oil-sands mine has a 25- to 50-year lifespan and an in situ operation runs for 10 to 15 years on average (CAPP, 2015).
Even though oil-sands operations are projected to expand, the vast majority of this growth is anticipated to arise from in situ operations. The land impact of an in-situ project is 10% to 15% the size of a similar mining operation, and no tailings ponds are produced. As a result, site reclamation occurs more quickly and requires less remediation.
The federal and provincial governments, and industry, have been active in addressing environmental concerns through several initiatives, such as the joint Canada-Alberta Oil Sands Environmental Monitoring Information Portal; the Alberta-Canada Collaboration in Cleaner Oil Sands' Development Memorandum of Understanding; and the new Alberta Environmental Monitoring, Evaluation and Reporting Agency (AEMERA). In addition to these efforts, Canada's Oil Sands Innovation Alliance (COSIA), an industry-led alliance of 13 oil-sands producers, is focused on accelerating the pace of improvements to environmental performance in Canada’s oil-sands through collaborative action and innovation.
© O
EC
D/IE
A, 2
016
6. Oil
134
EXPORTS
As a result of its robust and growing domestic oil production, Canada is a large and growing net exporter of crude oil and NGLs. The country’s net oil exports stood at 100.2 Mt in 2013, equivalent to around 52% of indigenous oil production – a 263% increase since 2003 when net exports were 38.1 Mt.
The fastest increase in net exports has been in crude oil, up by 255% from 27.5 Mt in 2003 to 97.7 Mt in 2013. Net exports of NGLs have declined by 76.4% over the ten years, down from 10.6 Mt to 2.5 Mt.
Canada is a major crude oil exporter and is by far the largest supplier of crude oil to the United States. In fact, the US Energy Information Administration (EIA) indicates that since September 2014 Canadian crude oil imports into the US have exceeded the total volume of US crude imports coming from all members of the Organisation of the Petroleum Exporting Countries (OPEC) combined. Canadian crude oil exports to the US have continued to grow with rising oil-sands production and thanks to the exception for Canadian oil re-exports from the US oil export ban. Though US crude oil production is surging, it is mostly light tight oil. In contrast, most of Canada’s oil exports to the US are heavy crude (oil-sands) oil exports. The US is expected to continue to import large volumes of crude, given the structure of its refining sector, with significant volume (particularly in the US Gulf of Mexico) tailored for processing heavy oil. Imports of heavy oil from Venezuela to the US are declining.
However, US demand for Canadian oil exports is not expected to keep pace with the rising quantity of Canadian oil available for export in the coming years. This means that in the future, Canada will need to find new markets for its oil, predominantly heavy oil – a situation which poses a significant challenge for the country in coming years. As a consequence, market diversification has become a top energy policy priority in Canada. For Canada to continue to take full advantage of its growing production, the country will require significantly increased pipeline access to coastal “tidewater” for exports to countries beyond North America (see below section on pipeline capacity expansion).
In 2014, highlighting the potential overseas demand for Canadian oil, some Canadian crude oil was delivered to the coast by rail and a variety of countries, including China, India, Italy and Spain, purchased tanker shipments for testing with their refineries.
In energy security terms, the rise of crude delivered by rail has increased the diversity and flexibility of the Canadian energy supply system. The resulting increase in resiliency has improved Canada’s ability to respond to both domestic supply disruptions and the effects of international shortages.
New energy infrastructure projects (in particular pipeline projects) will not only enhance Canada’s export capacity, but also its emergency preparedness and its ability to supply world oil markets during international oil supply disruptions.
Canada is also an exporter of refined petroleum products – primarily gasoline, gas and diesel oil and, to a lesser extent, fuel oil. The country’s gross oil product exports stood at 24.4 Mt in 2013 – a 17.9% increase since 2003. Most of the products destined for export are produced by refineries in eastern Canada.
IMPORTS
Despite its status as a major oil exporter, Canada still imports significant amounts of crude oil (35.9 Mt in 2013) to supply some domestic markets, notably eastern Canada.
© O
EC
D/IE
A, 2
016
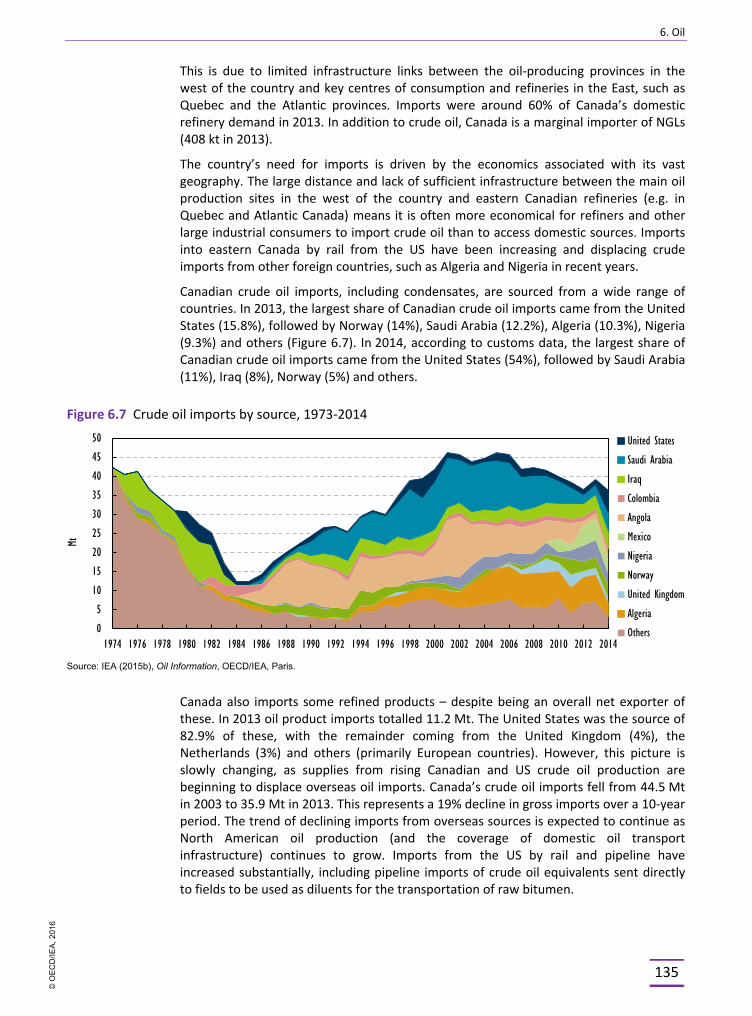
6. Oil
135
This is due to limited infrastructure links between the oil-producing provinces in the west of the country and key centres of consumption and refineries in the East, such as Quebec and the Atlantic provinces. Imports were around 60% of Canada’s domestic refinery demand in 2013. In addition to crude oil, Canada is a marginal importer of NGLs (408 kt in 2013).
The country’s need for imports is driven by the economics associated with its vast geography. The large distance and lack of sufficient infrastructure between the main oil production sites in the west of the country and eastern Canadian refineries (e.g. in Quebec and Atlantic Canada) means it is often more economical for refiners and other large industrial consumers to import crude oil than to access domestic sources. Imports into eastern Canada by rail from the US have been increasing and displacing crude imports from other foreign countries, such as Algeria and Nigeria in recent years.
Canadian crude oil imports, including condensates, are sourced from a wide range of countries. In 2013, the largest share of Canadian crude oil imports came from the United States (15.8%), followed by Norway (14%), Saudi Arabia (12.2%), Algeria (10.3%), Nigeria (9.3%) and others (Figure 6.7). In 2014, according to customs data, the largest share of Canadian crude oil imports came from the United States (54%), followed by Saudi Arabia (11%), Iraq (8%), Norway (5%) and others.
Figure 6.7 Crude oil imports by source, 1973-2014
Source: IEA (2015b), Oil Information, OECD/IEA, Paris.
Canada also imports some refined products – despite being an overall net exporter of these. In 2013 oil product imports totalled 11.2 Mt. The United States was the source of 82.9% of these, with the remainder coming from the United Kingdom (4%), the Netherlands (3%) and others (primarily European countries). However, this picture is slowly changing, as supplies from rising Canadian and US crude oil production are beginning to displace overseas oil imports. Canada’s crude oil imports fell from 44.5 Mt in 2003 to 35.9 Mt in 2013. This represents a 19% decline in gross imports over a 10-year period. The trend of declining imports from overseas sources is expected to continue as North American oil production (and the coverage of domestic oil transport infrastructure) continues to grow. Imports from the US by rail and pipeline have increased substantially, including pipeline imports of crude oil equivalents sent directly to fields to be used as diluents for the transportation of raw bitumen.
0
5
10
15
20
25
30
35
40
45
50
1974 1976 1978 1980 1982 1984 1986 1988 1990 1992 1994 1996 1998 2000 2002 2004 2006 2008 2010 2012 2014
Mt
United States
Saudi Arabia
Iraq
Colombia
Angola
Mexico
Nigeria
Norway
United Kingdom
Algeria
Others
© O
EC
D/IE
A, 2
016

6. Oil
136
Two examples of pipeline developments that will increase Canada’s capacity to ship oil eastwards from western to eastern Canada are as follows:
§ On 1 August 2013 TransCanada announced it had received sufficient commercial interest from potential crude oil shippers to pursue its proposed CAD 12 billion Energy East project. The proposed pipeline will ship 1.1 mb/d of crude oil from Alberta, Saskatchewan and the US to refineries in eastern Canada, and also to a marine terminal on the east coast for export by tanker to the US or beyond.
§ In March 2014, the NEB approved Enbridge's plan to reverse the flow of the Enbridge Line 9 pipeline, and also to increase the capacity of the section of the pipeline that runs between Sarnia, Ontario and Montreal, Quebec from 240 kb/d to 300 kb/d. This would allow oil from western Canada and the US to serve Quebec refineries and further reduce eastern Canada’s reliance on crude oil imports from outside North America. Flows will not start on Line 9 until after the NEB approves the proponent’s hydrostatic testing results.
One category in which Canada is a net importer is that of condensate. The country requires condensate for blending with heavy oil to facilitate its transportation in oil pipelines. Although Canada produces small quantities of condensate domestically (13 kb/d in 2013), significant – and growing – volumes of this also need to be imported and the infrastructure needs to be in place. In its 2016 Energy Futures report, NEB projects Canadian condensate imports to grow from 189 kb/d in 2014 to around 800 kb/d in 2040 (NEB, 2016).
INSTITUTIONAL FRAMEWORK
Regulatory authority over oil production lies primarily with the provincial governments, e.g. Alberta Energy Regulator, the British Columbia government and others. For the offshore areas, the shared management under the Accord Acts (the Canada-Newfoundland Atlantic Accord Implementation Act and the Canada-Nova Scotia Offshore Petroleum Resources Accord Implementation Act) has established shared regulation of oil and gas activities in the offshore areas by the Canada-Newfoundland and Labrador Offshore Petroleum Board (C-NLOPB) and the Canada-Nova Scotia Offshore Petroleum Board (CNSOPB). The offshore boards have the responsibility for oversight of the operator’s response in all petroleum-related emergencies in their mandated area. The federal government also has jurisdiction for petroleum rights management, including royalties (as administered by Aboriginal Affairs and Northern Development Canada) in frontier lands in the Arctic offshore and Nunavut.
The National Energy Board (NEB) is responsible for regulating oil and gas pipelines which fall under federal jurisdiction, such as those which cross interprovincial and international borders. The NEB is the lead federal agency in emergency situations that occur on NEB regulated facilities or operations. NEB works together with the Transportation Safety Board (TSB), which may act as lead investigator in the event of a pipeline incident/emergency affecting NEB-regulated facilities. The NEB also regulates oil exports and is the lead regulator of petroleum activity in the above-mentioned frontier lands.
Co-chaired by the federal government (Natural Resources Canada, NRCan) and an industry representative, the Energy and Utilities Sector Network is a forum that meets at least twice a year to exchange knowledge and best practices regarding security of critical infrastructure. Members include stakeholders from industry, industry associations, NRCan portfolio agencies, other government departments, and academia.
© O
EC
D/IE
A, 2
016
6. Oil
137
Canadian oil resources are the property of the Crown (referring to both the federal and provincial governments), with the federal, provincial and territorial (i.e. Yukon, Nunavut and Northwest Territories) governments setting the rules and regulations covering oil exploration, production and transportation. Many existing and proposed oil resource and infrastructure projects are located on or near Aboriginal lands or through their traditional territories. In Canada, the Crown has a legal duty to consult Aboriginal groups and, where appropriate, accommodate when the Crown contemplates conduct that may adversely affect their established or potential Aboriginal or Treaty rights. To achieve this, Canada has adopted an approach to Aboriginal consultation to develop resources in partnership with Aboriginal groups, in a way that protects the local environment, and is respectful of Aboriginal and Treaty rights. The MPMO-West was established in British Columbia as a single window for west coast First Nations to work with the federal government on issues related to the development of west coast energy infrastructure. The Major Project Management Office (MPMO)-West is set to strengthen opportunities for collaboration in employment, business opportunities, environmental management and safety.
In general, onshore natural resources are owned and managed at the provincial level. The provinces are thus responsible for the structure and administration of royalty programmes. These regimes are designed to reflect different production techniques and regional characteristics of the projects. Royalty regimes for long-term projects are structured to allow proponents to recover their capital costs before a higher net royalty is paid. For smaller-scale projects, the royalty rates are dependent on a combination of the quantity produced and the price received at the well level. In Alberta, the Bitumen Royalty-in-Kind (BRIK) programme gives the provincial government the option of taking bitumen royalties in kind rather than in cash, which can then be used strategically to supply potential upgrading activities and pipeline projects.
REGULATORY OVERSIGHT
Since 2008, in response to delays in the permitting approval processes of major energy infrastructure projects, Canada has streamlined its federal approval processes with the single window into the federal review process under the Major Projects Management Office Initiative (MPMO) and through a series of legislative reforms (see Chapter 2 on General Energy Policy). Under the Canadian Environmental Assessment Act 2012 (CEAA 2012), the Regulations Designating Physical Activities (Project List) identifies the types of projects in the oil sector that may be subject to a federal environmental assessment (EA), which include: offshore oil exploration and production; oil-sands mines; oil refineries and heavy oil upgraders; petroleum storage facilities; offshore oil pipelines; and NEB-regulated pipelines. There are clear legislated timelines for EAs and permitting. An 18-month timeline applies for National Energy Board reviews of oil pipeline projects.
To ensure pipeline, marine, and rail safety systems, the Pipeline Safety Act has received Royal Assent on 18 June 2015. The Act aims at strengthening the safety of Canada’s energy transportation, including spill prevention, with complementary preparedness and response systems, and greater clarity around the principle that the polluter is liable for the costs of clean-up and for compensating for any losses.
A number of federal environmental regulations have been introduced which impact the oil sector, notably the refining sector. Federal Renewable Fuels Regulations require an annual average of 5% renewables content in gasoline and 2% renewables content in diesel and took effect in 2010 (for gasoline) and 2011 (for diesel). Some provincial
© O
EC
D/IE
A, 2
016
6. Oil
138
governments impose their own, separate biofuel standards. British Columbia, Alberta, Saskatchewan, Manitoba and Ontario have differing provincial-level biofuel content regulations – several in excess of the federal requirements. For example, Manitoba requires that gasoline contain a minimum 8.5% renewables content (well above the 5% federal requirement), and British Columbia requires that diesel contain a minimum 4% renewables content (double the 2% federal requirement).
Provinces have adopted stringent GHG emission regulations, notably Alberta’s Specific Gas Emitters Regulation (SGER), which is expected to increase its current CAD 15 carbon price per tonne in the coming years (see Chapter 3 on Climate Change).
On 15 May 2015, while announcing Canada’s Intended Nationally Determined Contribution to the United Nations Framework Convention on Climate Change (UNFCCC), the Minister of the Environment indicated the government’s intentions to develop regulations to reduce methane emissions from Canada’s oil and natural gas sectors. The federal government is also proposing an approach to address both new and existing air pollutant emission sources at refineries.
On 29 July 2015 the federal government published amendments, in line with standards finalised by the United States Environmental Protection Agency (EPA) in 2014, to the Sulphur in Gasoline Regulations which will lower the annual average sulphur content in gasoline from 30 parts per million (ppm) to 10 ppm, taking effect on 1 January 2017.
OIL MARKET AND INFRASTRUCTURE
REFINERIES
The refining sector in Canada has undergone significant rationalisation over the past four decades, with the number of refineries dropping from 44 in the 1960s to 14 as of end-2014. In addition, there are other plants with crude oil-processing capability, namely Husky & Moose Jaw asphalt plants in Saskatchewan, and Suncor’s petrochemical plant in Ontario. There are six upgraders with total upgrading capacity of about 1.4 mb/d (see below section on upgraders).
Most of the closures took place before 1995, while 2006 saw one refinery closed for economic reasons. Recent closures include Shell’s Montreal refinery in 2010 and Imperial Oil’s Dartmouth refinery in September 2013, which were converted into refined product terminals. Since the early 1980s, despite the closures, refining capacity has been relatively stable, and national average utilisation rates have ranged from 80% to 85% in the period 2010-14 (see Table 6.1). The total processing capacity of Canada’s 14 refineries was 1.85 mb/d in 2014.
The refining sector is fully liberalised, with the refineries owned by a range of private-sector oil companies, including Suncor, Shell Canada, Chevron, Irving Oil, Imperial Oil and Valero. There are four main refining centres in Canada: Edmonton (Alberta), Sarnia (Ontario), Montreal/Quebec City (Quebec), and Saint John (New Brunswick).
Canada’s refineries produce the majority of products consumed in the country (with the exception of LPG and ethane and, to a lesser extent, gasoline), with imports making up any shortfall. Diesel and light fuel oil accounted for around 33.5% of refining output in 2013, followed by gasoline at 31%. Refinery gross output was 1.89 mb/d in 2013.
© O
EC
D/IE
A, 2
016
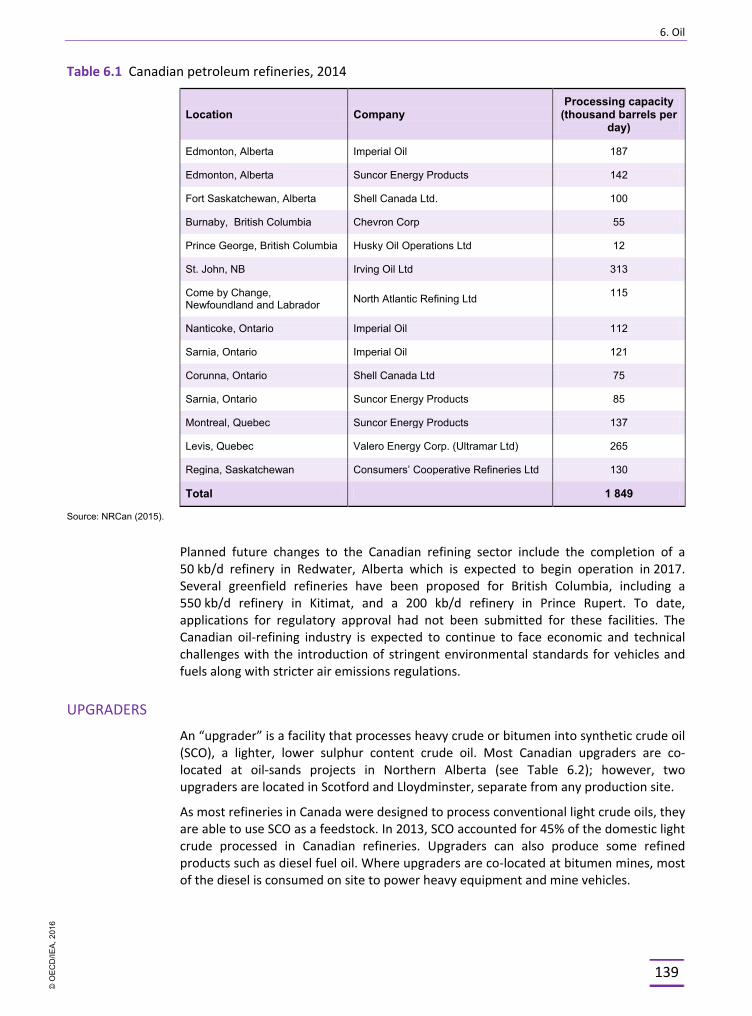
6. Oil
139
Table 6.1 Canadian petroleum refineries, 2014
Location Company Processing capacity
(thousand barrels per day)
Edmonton, Alberta Imperial Oil 187
Edmonton, Alberta Suncor Energy Products 142
Fort Saskatchewan, Alberta Shell Canada Ltd. 100
Burnaby, British Columbia Chevron Corp 55
Prince George, British Columbia Husky Oil Operations Ltd 12
St. John, NB Irving Oil Ltd 313
Come by Change, Newfoundland and Labrador North Atlantic Refining Ltd 115
Nanticoke, Ontario Imperial Oil 112
Sarnia, Ontario Imperial Oil 121
Corunna, Ontario Shell Canada Ltd 75
Sarnia, Ontario Suncor Energy Products 85
Montreal, Quebec Suncor Energy Products 137
Levis, Quebec Valero Energy Corp. (Ultramar Ltd) 265
Regina, Saskatchewan Consumers’ Cooperative Refineries Ltd 130
Total 1 849
Source: NRCan (2015).
Planned future changes to the Canadian refining sector include the completion of a 50 kb/d refinery in Redwater, Alberta which is expected to begin operation in 2017. Several greenfield refineries have been proposed for British Columbia, including a 550 kb/d refinery in Kitimat, and a 200 kb/d refinery in Prince Rupert. To date, applications for regulatory approval had not been submitted for these facilities. The Canadian oil-refining industry is expected to continue to face economic and technical challenges with the introduction of stringent environmental standards for vehicles and fuels along with stricter air emissions regulations.
UPGRADERS
An “upgrader” is a facility that processes heavy crude or bitumen into synthetic crude oil (SCO), a lighter, lower sulphur content crude oil. Most Canadian upgraders are co-located at oil-sands projects in Northern Alberta (see Table 6.2); however, two upgraders are located in Scotford and Lloydminster, separate from any production site.
As most refineries in Canada were designed to process conventional light crude oils, they are able to use SCO as a feedstock. In 2013, SCO accounted for 45% of the domestic light crude processed in Canadian refineries. Upgraders can also produce some refined products such as diesel fuel oil. Where upgraders are co-located at bitumen mines, most of the diesel is consumed on site to power heavy equipment and mine vehicles.
© O
EC
D/IE
A, 2
016
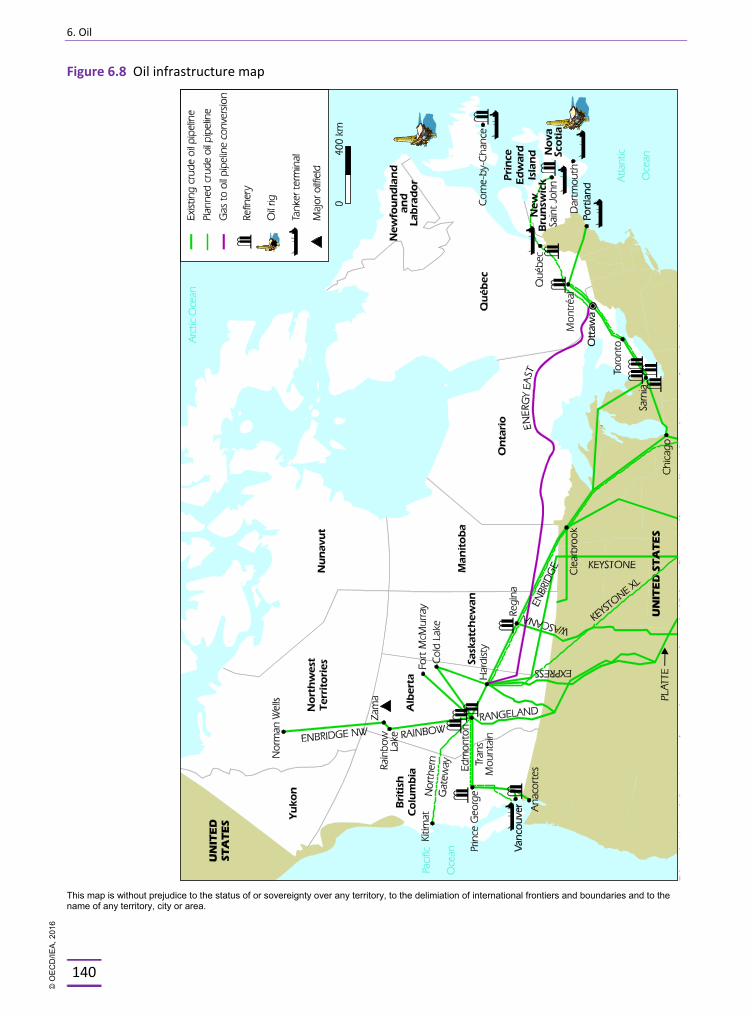
6. Oil
140
Figure 6.8 Oil infrastructure map
This map is without prejudice to the status of or sovereignty over any territory, to the delimiation of international frontiers and boundaries and to the name of any territory, city or area.
© O
EC
D/IE
A, 2
016
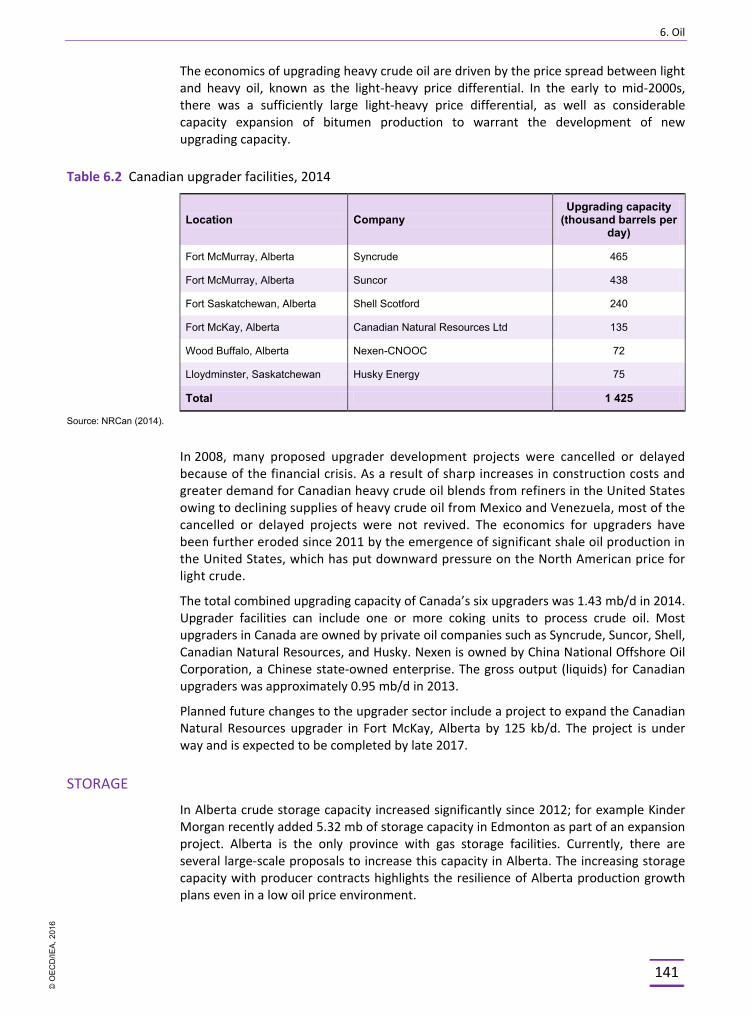
6. Oil
141
The economics of upgrading heavy crude oil are driven by the price spread between light and heavy oil, known as the light-heavy price differential. In the early to mid-2000s, there was a sufficiently large light-heavy price differential, as well as considerable capacity expansion of bitumen production to warrant the development of new upgrading capacity.
Table 6.2 Canadian upgrader facilities, 2014
Location Company Upgrading capacity
(thousand barrels per day)
Fort McMurray, Alberta Syncrude 465
Fort McMurray, Alberta Suncor 438
Fort Saskatchewan, Alberta Shell Scotford 240
Fort McKay, Alberta Canadian Natural Resources Ltd 135
Wood Buffalo, Alberta Nexen-CNOOC 72
Lloydminster, Saskatchewan Husky Energy 75
Total 1 425
Source: NRCan (2014).
In 2008, many proposed upgrader development projects were cancelled or delayed because of the financial crisis. As a result of sharp increases in construction costs and greater demand for Canadian heavy crude oil blends from refiners in the United States owing to declining supplies of heavy crude oil from Mexico and Venezuela, most of the cancelled or delayed projects were not revived. The economics for upgraders have been further eroded since 2011 by the emergence of significant shale oil production in the United States, which has put downward pressure on the North American price for light crude.
The total combined upgrading capacity of Canada’s six upgraders was 1.43 mb/d in 2014. Upgrader facilities can include one or more coking units to process crude oil. Most upgraders in Canada are owned by private oil companies such as Syncrude, Suncor, Shell, Canadian Natural Resources, and Husky. Nexen is owned by China National Offshore Oil Corporation, a Chinese state-owned enterprise. The gross output (liquids) for Canadian upgraders was approximately 0.95 mb/d in 2013.
Planned future changes to the upgrader sector include a project to expand the Canadian Natural Resources upgrader in Fort McKay, Alberta by 125 kb/d. The project is under way and is expected to be completed by late 2017.
STORAGE
In Alberta crude storage capacity increased significantly since 2012; for example Kinder Morgan recently added 5.32 mb of storage capacity in Edmonton as part of an expansion project. Alberta is the only province with gas storage facilities. Currently, there are several large-scale proposals to increase this capacity in Alberta. The increasing storage capacity with producer contracts highlights the resilience of Alberta production growth plans even in a low oil price environment.
© O
EC
D/IE
A, 2
016

6. Oil
142
§ Gibson plans to add 900 000 barrels at Hardisty as part of a long-term agreement with Teck Resources Ltd.
§ Keyera and Kinder Morgan plan to build 4.8 mb of new oil storage at Edmonton under a 50-50 joint venture, with potential to expand to 6.6 mb depending on future demand.
§ TransCanada Corp. has submitted applications for regulatory approval to build an expanded Keystone terminal with 2.6 mb of storage capacity.
§ Enbridge Inc. is also expanding tank storage facilities in Cheecham.
PIPELINES
In Canada, crude oil is predominantly transported by pipeline. In 2013, approximately 1.3 billion barrels of oil (or 3.38 mb/d) were transported along 19 090 km of active oil pipelines in the federally regulated pipeline system. The total system capacity is 4.7 billion barrels of oil (see Table 6.3), and accounting for maintenance shut downs and disruptions the capacity remains tight. The country’s oil pipeline network consists of five major pipeline systems (see Table 6.3). They are: Enbridge; Spectra Express; Keystone (from Hardisty in Alberta to US Midwest); Trans-Mountain; and Trans-Northern.
Pipelines remain the primary mode of transportation for crude oil owing to their ability to efficiently move products to market at a relatively low cost. While additional pipeline infrastructure is expected in the future to maintain take-away capacity for the planned expansion of the oil-sands, crude-by-rail transportation has grown to supplement the expanding pipeline network. Six major pipeline projects (including terminal expansions) are proposed for the period up to 2020 to connect to East, West and US Gulf Coasts:
§ TransCanada’s Energy East pipeline from Alberta to New Brunswick with a capacity of 1.1 mb/d which will mainly use existing gas pipelines for oil transportation.
§ Kinder Morgan’s TransMountain Expansion Project, which would increase current 300 kb/d Trans Mountain’s capacity by 590 kb/d to 890 kb/d, by twinning the existing pipeline between Edmonton (Alberta) and Vancouver (British Columbia). In 2015, it is pending NEB approval.
§ Enbridge’s Northern Gateway pipelines from Alberta to coastal British Columbia with the capacity to export 525 kb/d of crude oil and import 193 kb/d of condensate. In 2014, it has been approved by the federal government subject to 209 conditions, but federal court proceedings are ongoing in 2015.
§ Keystone XL pipeline from Alberta to Nebraska in the US, with a capacity of 830 kb/d. Keystone XL would have provided direct access to US Midwest and indirect access to US Gulf Coast. Despite full approvals in Canada, on 6 November 2015 US-President Obama rejected the application of the Keystone XL project.
There are several expansion projects in the Enbridge pipeline network envisaged. In 2015, Enbridge’s “Line 9” flow reversal has been completed from Sarnia to Quebec under the Eastern Canadian Refinery Access Initiative with capacity expansion from 240 kb/d to 300 kb/d, while two other projects are under planning and approval procedures:
§ Enbridge’s Line 3 replacement project, part of Enbridge’s mainline system that will increase the current capacity from 390 to 760 kb/d.
§ Enbridge’s Line 67 expansion project, part of Enbridge’s mainline system that will expand the capacity of the current line from 450 to 570 kb/d.
© O
EC
D/IE
A, 2
016
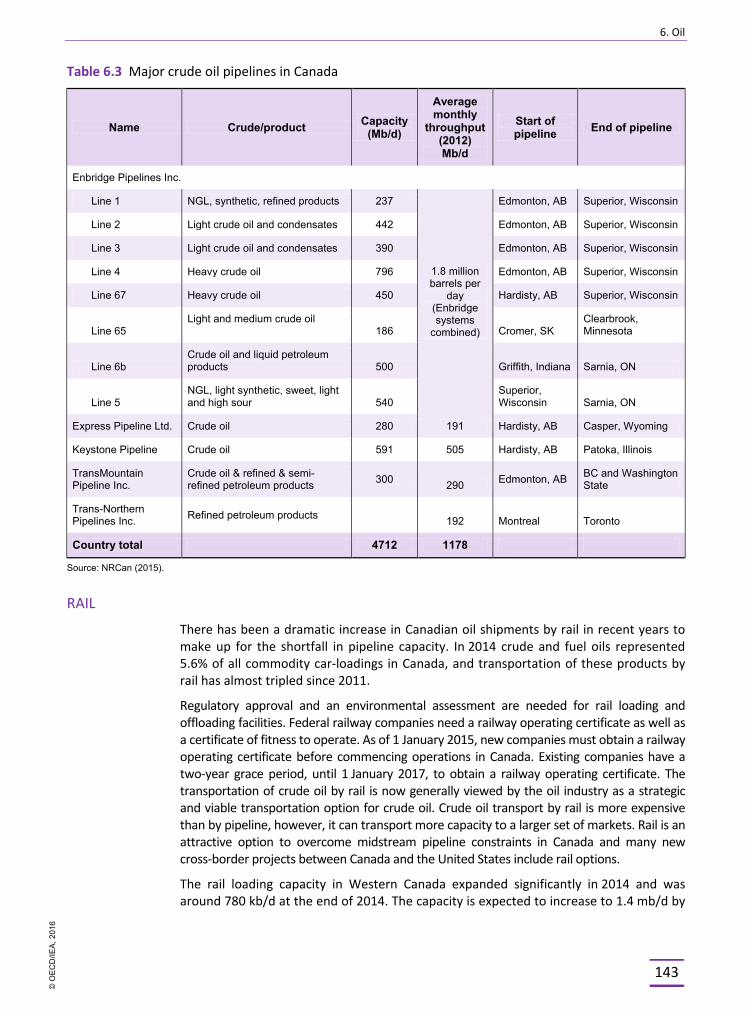
6. Oil
143
Table 6.3 Major crude oil pipelines in Canada
Name Crude/product Capacity (Mb/d)
Average monthly
throughput (2012) Mb/d
Start of pipeline End of pipeline
Enbridge Pipelines Inc.
Line 1 NGL, synthetic, refined products 237
1.8 million barrels per
day (Enbridge systems
combined)
Edmonton, AB Superior, Wisconsin
Line 2 Light crude oil and condensates 442 Edmonton, AB Superior, Wisconsin
Line 3 Light crude oil and condensates 390 Edmonton, AB Superior, Wisconsin
Line 4 Heavy crude oil 796 Edmonton, AB Superior, Wisconsin
Line 67 Heavy crude oil 450 Hardisty, AB Superior, Wisconsin
Line 65 Light and medium crude oil
186 Cromer, SK Clearbrook, Minnesota
Line 6b Crude oil and liquid petroleum products 500 Griffith, Indiana Sarnia, ON
Line 5 NGL, light synthetic, sweet, light and high sour 540
Superior, Wisconsin Sarnia, ON
Express Pipeline Ltd. Crude oil 280 191 Hardisty, AB Casper, Wyoming
Keystone Pipeline Crude oil 591 505 Hardisty, AB Patoka, Illinois
TransMountain Pipeline Inc.
Crude oil & refined & semi-refined petroleum products 300 290 Edmonton, AB BC and Washington
State
Trans-Northern Pipelines Inc. Refined petroleum products 192 Montreal Toronto
Country total 4712 1178
Source: NRCan (2015).
RAIL
There has been a dramatic increase in Canadian oil shipments by rail in recent years to make up for the shortfall in pipeline capacity. In 2014 crude and fuel oils represented 5.6% of all commodity car-loadings in Canada, and transportation of these products by rail has almost tripled since 2011.
Regulatory approval and an environmental assessment are needed for rail loading and offloading facilities. Federal railway companies need a railway operating certificate as well as a certificate of fitness to operate. As of 1 January 2015, new companies must obtain a railway operating certificate before commencing operations in Canada. Existing companies have a two-year grace period, until 1 January 2017, to obtain a railway operating certificate. The transportation of crude oil by rail is now generally viewed by the oil industry as a strategic and viable transportation option for crude oil. Crude oil transport by rail is more expensive than by pipeline, however, it can transport more capacity to a larger set of markets. Rail is an attractive option to overcome midstream pipeline constraints in Canada and many new cross-border projects between Canada and the United States include rail options.
The rail loading capacity in Western Canada expanded significantly in 2014 and was around 780 kb/d at the end of 2014. The capacity is expected to increase to 1.4 mb/d by
© O
EC
D/IE
A, 2
016
6. Oil
144
the end of 2015 (EAI, 2014), but there are several delays in the expansion. CAPP estimates that the volume of western Canadian crude transported by rail will reach 200 kb/d in 2015, up from 185 kb/d in 2014 (CAPP, 2015).
Oil transportation safety has gained significant attention, with rail safety at the forefront along with pipeline safety issues. A number of oil shipping incidents in the US and Canada have led to oil spills and explosions. Such incidents include the 2010 Enbridge pipeline rupture in Michigan, and the 2013 oil train disaster in Lac Mégantic. Rail shipments of bitumen carry lower explosion risks than Lac Megantic accident where cars were carrying unstabilised light oil. Oil sands crude hardly flows in ambient temperature (and that is why it is less explosive) and needs to be either properly diluted by lighter liquids (condensates, butanes) - up to 15%-20% of total volume, or be carried in heavily insulated and heated rail cars. Pipeline transport requires even higher volumes of diluents (up to 30%).
In 2015, the federal government enacted comprehensive regulatory measures to enhance rail safety, including higher standards for tank cars and closer scrutiny of the hazardous potential of crude oil. New rules under the Railway Safety Act, the Pipeline Safety Package and Energy Safety and Security Act (Bill C-22) will enable enhanced prevention, preparedness and response, and liability and compensation actions by the federal government. Given the high levels of cross-border oil traffic, it is under discussion that Canada and the US agree to further harmonise their oil transport safety regulations. Transport Canada continues to work in close collaboration with the US Pipeline and Hazardous Materials Safety Administration and the Federal Railroad Administration to develop stricter requirements for tank cars carrying flammable liquids in North America.
TERMINALS
There are nine major oil import or export terminals in Canada. These are:
§ Westridge Marine Terminal, at Burnaby, British Columbia
§ Whiffen Head, Newfoundland and Labrador
§ Stanovan Wharf, at Burnaby, British Columbia
§ Point Tupper, Nova Scotia
§ Quebec City, Quebec
§ Saint John, New Brunswick
§ Dartmouth, Nova Scotia
§ Come-by-Chance, Newfoundland and Labrador
§ Montreal, Quebec.
Whiffen Head in Newfoundland and the Westridge Dock in British Columbia are mostly used for oil exports, while the other ports are mostly oil import facilities. All oil import facilities (Quebec City, Montreal, Saint John, Come-by-Chance, Stanovan Wharf and Dartmouth) serve nearby oil refineries, and are also used for oil product exports.
UPSTREAM INDUSTRY STRUCTURE
The Canadian oil sector is largely run on free market principles, with little government ownership of assets in the sector. The government of Canada holds an 8.5% share of the Hibernia Oil Project (offshore Newfoundland and Labrador) and a one-third stake in
© O
EC
D/IE
A, 2
016
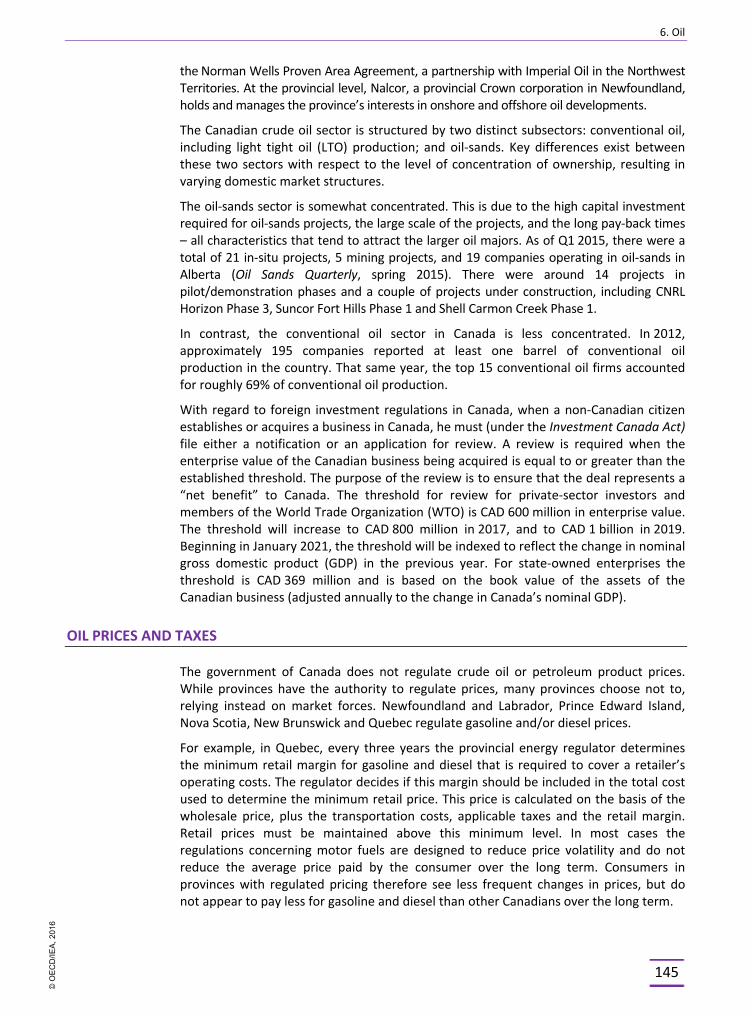
6. Oil
145
the Norman Wells Proven Area Agreement, a partnership with Imperial Oil in the Northwest Territories. At the provincial level, Nalcor, a provincial Crown corporation in Newfoundland, holds and manages the province’s interests in onshore and offshore oil developments.
The Canadian crude oil sector is structured by two distinct subsectors: conventional oil, including light tight oil (LTO) production; and oil-sands. Key differences exist between these two sectors with respect to the level of concentration of ownership, resulting in varying domestic market structures.
The oil-sands sector is somewhat concentrated. This is due to the high capital investment required for oil-sands projects, the large scale of the projects, and the long pay-back times – all characteristics that tend to attract the larger oil majors. As of Q1 2015, there were a total of 21 in-situ projects, 5 mining projects, and 19 companies operating in oil-sands in Alberta (Oil Sands Quarterly, spring 2015). There were around 14 projects in pilot/demonstration phases and a couple of projects under construction, including CNRL Horizon Phase 3, Suncor Fort Hills Phase 1 and Shell Carmon Creek Phase 1.
In contrast, the conventional oil sector in Canada is less concentrated. In 2012, approximately 195 companies reported at least one barrel of conventional oil production in the country. That same year, the top 15 conventional oil firms accounted for roughly 69% of conventional oil production.
With regard to foreign investment regulations in Canada, when a non-Canadian citizen establishes or acquires a business in Canada, he must (under the Investment Canada Act) file either a notification or an application for review. A review is required when the enterprise value of the Canadian business being acquired is equal to or greater than the established threshold. The purpose of the review is to ensure that the deal represents a “net benefit” to Canada. The threshold for review for private-sector investors and members of the World Trade Organization (WTO) is CAD 600 million in enterprise value. The threshold will increase to CAD 800 million in 2017, and to CAD 1 billion in 2019. Beginning in January 2021, the threshold will be indexed to reflect the change in nominal gross domestic product (GDP) in the previous year. For state-owned enterprises the threshold is CAD 369 million and is based on the book value of the assets of the Canadian business (adjusted annually to the change in Canada’s nominal GDP).
OIL PRICES AND TAXES
The government of Canada does not regulate crude oil or petroleum product prices. While provinces have the authority to regulate prices, many provinces choose not to, relying instead on market forces. Newfoundland and Labrador, Prince Edward Island, Nova Scotia, New Brunswick and Quebec regulate gasoline and/or diesel prices.
For example, in Quebec, every three years the provincial energy regulator determines the minimum retail margin for gasoline and diesel that is required to cover a retailer’s operating costs. The regulator decides if this margin should be included in the total cost used to determine the minimum retail price. This price is calculated on the basis of the wholesale price, plus the transportation costs, applicable taxes and the retail margin. Retail prices must be maintained above this minimum level. In most cases the regulations concerning motor fuels are designed to reduce price volatility and do not reduce the average price paid by the consumer over the long term. Consumers in provinces with regulated pricing therefore see less frequent changes in prices, but do not appear to pay less for gasoline and diesel than other Canadians over the long term.
© O
EC
D/IE
A, 2
016
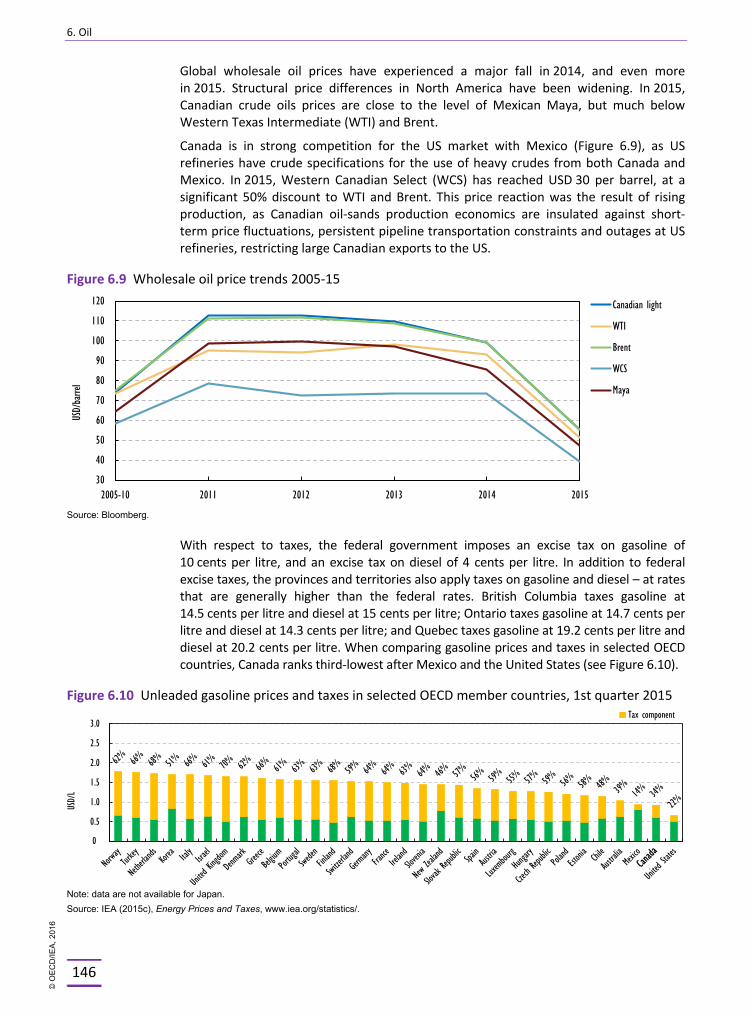
6. Oil
146
Global wholesale oil prices have experienced a major fall in 2014, and even more in 2015. Structural price differences in North America have been widening. In 2015, Canadian crude oils prices are close to the level of Mexican Maya, but much below Western Texas Intermediate (WTI) and Brent.
Canada is in strong competition for the US market with Mexico (Figure 6.9), as US refineries have crude specifications for the use of heavy crudes from both Canada and Mexico. In 2015, Western Canadian Select (WCS) has reached USD 30 per barrel, at a significant 50% discount to WTI and Brent. This price reaction was the result of rising production, as Canadian oil-sands production economics are insulated against short-term price fluctuations, persistent pipeline transportation constraints and outages at US refineries, restricting large Canadian exports to the US.
Figure 6.9 Wholesale oil price trends 2005-15
Source: Bloomberg.
With respect to taxes, the federal government imposes an excise tax on gasoline of 10 cents per litre, and an excise tax on diesel of 4 cents per litre. In addition to federal excise taxes, the provinces and territories also apply taxes on gasoline and diesel – at rates that are generally higher than the federal rates. British Columbia taxes gasoline at 14.5 cents per litre and diesel at 15 cents per litre; Ontario taxes gasoline at 14.7 cents per litre and diesel at 14.3 cents per litre; and Quebec taxes gasoline at 19.2 cents per litre and diesel at 20.2 cents per litre. When comparing gasoline prices and taxes in selected OECD countries, Canada ranks third-lowest after Mexico and the United States (see Figure 6.10).
Figure 6.10 Unleaded gasoline prices and taxes in selected OECD member countries, 1st quarter 2015
Note: data are not available for Japan. Source: IEA (2015c), Energy Prices and Taxes, www.iea.org/statistics/.
30
40
50
60
70
80
90
100
110
120
2005-10 2011 2012 2013 2014 2015
USD/
barre
l
Canadian light
WTI
Brent
WCS
Maya
0.0
0.5
1.0
1.5
2.0
2.5
3.0
USD/
L
Tax component
0
© O
EC
D/IE
A, 2
016
6. Oil
147
OIL SECURITY
As Canada is a major oil producer and significant net exporter, the federal government’s oil emergency response policy is primarily based on the ongoing ability of the market to meet demand. In general terms, this translates into a reliance on the market to continuously enhance the growth, flexibility and diversity of the energy supply system in order to reduce the risks, and potential impacts, of oil supply disruptions. The policy therefore places primary reliance upon the use of market instruments to achieve energy objectives, but the government also has the authority to take direct action in the event of market failure or in pursuit of important non-economic objectives. The government’s priority is to maintain exports of crude oil and product at pre-crisis levels.
Canada’s decision-making processes for responding to an oil supply disruption vary depending on the nature and scale of the emergency. The initial response to an oil supply disruption is the responsibility of the energy industry (i.e. oil infrastructure owners and operators). For larger disruptions, any emergency response is the responsibility of provincial and territorial governments. The federal government would only become involved in the management of an energy-related emergency if asked to do so by the provincial government, or if the emergency occurred in an area over which the federal government had jurisdiction. Such areas include: interprovincial or international energy systems and offshore areas.
As information system, the National Energy Board (NEB) publicly reports incidents by means of an Online Incident Map that is updated quarterly. The Online Incident Map is an interactive web-based map showing where pipeline incidents (liquids, gas releases and others) have occurred from 2008 to present. Reported incidents shown include those that fall under the definitions of the Onshore Pipeline Regulations (OPR) made under the National Energy Board Act. Under the OPR, companies must immediately notify the NEB of any incident that relates to the construction, operation or abandonment of a pipeline.
In the event of an oil supply shortfall requiring federal government intervention, Canada would first use policy-driven demand restraint measures in co-ordination with provincial/territorial governments and industry. In the event of a domestic emergency (not limited to but including energy supply disruptions), emergency response actions are co-ordinated through the Federal Emergency Response Management System (FERMS) – part of the government’s “all hazards” approach to emergency response planning.
Canada’s emergency response planning is underpinned by the National Strategy for Critical Infrastructure (NSCI) and its Action Plan for Critical Infrastructure, which classifies critical infrastructure into 10 specific sectors – one of which is “energy and utilities”. The NSCI is also supported by the Beyond the Border Action Plan, issued jointly in 2011 by Canada and the United States. The Action Plan includes measures to enhance the resiliency of the two countries’ shared critical and cyber infrastructure, and to enable them to rapidly respond to and recover from disasters and emergencies on either side of the Canada-US border.
In the case of a declared national emergency, the federal government of Canada can invoke provisions under one of two pieces of legislation: in case of a short-term disruption, the Emergencies Act provides the federal government with the authority to direct disposition of energy commodities; and in case of long-term impacts, the Energy Supplies Emergency Act (ESEA) allows the federal government to activate the Energy Supplies Allocation Board (ESAB) which has wide-ranging authority to control all aspects
© O
EC
D/IE
A, 2
016
6. Oil
148
of crude oil and petroleum product movements and provides the legal instruments to satisfy Canada’s obligations under the International Energy Program. Since its creation in 1979, the ESAB has never been formally activated. However, plans to activate it were undertaken in advance of the first Gulf War in 1990.
As Canada is a net oil exporter, it is not obligated to maintain 90 days of stocks and does not hold any oil stocks for emergency purposes – either as government stocks or in the form of a compulsory stockholding obligation on industry. The country is, however, obliged to contribute its assessed share of oil to the market during an IEA collective action. According to NRCan, Canada’s obligation to participate in an IEA collective action would be met primarily through demand restraint measures, but also potentially via surge production and accelerated production growth.
STOCKHOLDING REGIME As Canada is not subject to the IEA 90-day oil stock obligation and does not hold any public stocks or have a compulsory stockholding obligation on industry. All oil stocks on Canadian territory are industry stocks held for commercial/operational purposes – equating to around 81 days of crude oil and refined product demand as of March 2015.
NRCan conducted multiple studies examining the possibility of building a Strategic Petroleum Reserve (SPR), but concluded that the costs associated with establishing, maintaining and administering such a reserve would outweigh the benefits to Canada. Given the rapid growth in Canadian production and the diversification of import sources for refiners in Eastern Canada, Canadian oil security has improved in recent years and reduced the need for such a project. These trends are expected to continue in the coming decades, for example with the recent reversal of Enbridge Line 9 from Sarnia to Montreal and the Energy East pipeline, if approved.
Given these developments, the benefits of an SPR from a Canadian perspective will only diminish. The federal government remains confident that during times of significant supply disruptions Canada would be able to meet domestic demand with available supplies.
OTHER EMERGENCY RESPONSE MEASURES Voluntary demand restraint measures are the Administration’s stated preferred option in the event of an oil supply disruption or of an IEA collective action.
During previous demand response efforts, representatives of the federal government (including the Prime Minister) and provincial environment ministries have made public statements urging Canadians to reduce their consumption of oil (e.g. by driving less) during the collective action period.
If such efforts are found to be insufficient to reduce demand enough to meet Canada’s international obligations, the Administration states that more specific and/or compulsory demand restraint measures could be implemented. The basis for this claim is that in a very severe crisis, the federal government could declare a national emergency and activate sweeping federal powers to fulfil its IEA commitments. (Short of this declaration, all legal powers in relation to natural resources and demand restraint measures are the sole purview of the provinces.) It is not clear what specific demand restraint measures would or could be implemented by the federal government in the event of a severe energy crisis, or how much energy each specific measure could be expected to save. The Administration is planning to conduct a study to quantify the estimated volumetric impact of specific demand restraint measures.
© O
EC
D/IE
A, 2
016
6. Oil
149
Another means of potential Canadian participation in an IEA collective action is surge production. During an oil supply disruption, the federal government states that it would encourage regulators in the producing provinces to lift maximum rate limitations (MRLs) to allow for a short-term surge in production. This would have particular relevance in Alberta where MRLs are used in certain conventional oil wells to ensure equity (in multi-well pools) and more generally to ensure optimum oil and gas production. Approximately 15% of conventional oil pools (accounting for approximately 10% of conventional production) in Alberta are subject to MRLs.
Outside a formal declaration of a national emergency, surge production would require consultation with and approval of the producing provinces to allow wells to increase production and to ensure pipeline capacity exists to transport it. Furthermore, surge production can only be achieved over a short period of time (i.e. months) because of the risk of damaging wells and reservoirs. So while capacity exists to increase production in this manner, it would be dependent on circumstances at the time.
Following Hurricanes Katrina and Rita, the Alberta Energy and Utilities Board (AEUB) took steps to allow for increased oil production on a temporary basis. In particular, the AEUB suspended its MRLs, which made it possible to increase production by 15 kb/d. The suspension was in place from September to December 2005.
Canadian oil production is expected to increase significantly in the short to medium term. Depending on the timing of new production coming online, NRCan states that increased indigenous production (i.e. bringing forward planned increases) could play a significant role in meeting Canada’s IEA obligations during a collective action. For example, during the Hurricane Katrina collective action in 2005, Canada increased production by an average of 89 kb/d over the two-month period (5.5 mb total).
There is no longer any significant capacity in Canada to switch from oil-based fuels to other fuels such as natural gas or electricity. The capacity that did exist has been permanently switched.
ASSESSMENT
Canada is a significant and growing net exporter of oil, with resilient and well-integrated oil supply infrastructure. While oil continues to be a key source of energy in Canada, its share of total energy supply has declined markedly since the early 1970s, from 51% in 1975 to 31% in 2013. It is now second to natural gas, which increased its share from 23% of total energy supply to 34% over the same period.
At the same time, domestic oil production has risen steadily since 1999. The growth in domestic production is increasingly driven by unconventional sources such as oil-sands, with new oil-sands production more than offsetting declines in ageing conventional fields. This trend is expected to continue for the foreseeable future and Canada is addressing the challenges related to this in a sound way.
Several issues impact the oil sector outlook in Canada: i) the light tight oil boom in the United States brings about the need to diversify export markets outside US over time; ii) sustainable development of the unconventional reserves, notably the Alberta oil-sands; iii) possible project delays or cancellations amid lower oil prices in the medium term; and iv) the need for more oil transportation pipeline capacity in North America and related export facilities, and while ensuring safety of increased railing of oil products.
© O
EC
D/IE
A, 2
016
6. Oil
150
Canada is a large and growing oil net-exporter – with the country’s exports projected to grow. In 2013, 99% of Canada’s crude exports were destined for the US, but surging domestic oil production in the US means that Canada will likely need to find additional export markets outside North America for an increasing proportion of its oil exports in future. Competition is growing also within the North American Free Trade Agreement (NAFTA), as Mexico can supply a similar quality of oil to US markets. This trend is increasingly supported also by the fact that the Keystone XL expansion project did not receive approval by the US Administration President Obama in November 2015.
Additional pipeline capacity is needed to transport Canada’s growing oil production to existing markets (rail capacity is making up for a growing pipeline capacity shortfall in this regard), but to be able to export this oil to markets beyond North America, substantial new oil export terminal capacity (and associated pipeline infrastructure) is required. As a consequence, energy market diversification is now a top energy policy priority in Canada.
Environmental concerns relating to oil-sands production have become an issue in Canada and abroad. Regulatory and safety measures were adopted by the federal and provincial governments to address the environmental performance as well as public acceptance of oil production and transportation. Since the last review, the federal government has continued to work with First Nations and provincial governments on the major project reviews process, in addition to creating the MPMO-West in British Columbia. Both the Alberta government and the oil-sands industry have initiated programmes and innovative solutions, including AEMERA and COSIA. The federal government should monitor the results of the initiatives and work to further encourage reductions in the environmental impact of the oil-sands. For example, the federal government could promote the uptake of clean and innovative industry technologies by developing and implementing emissions reduction regulations and energy efficiency standards (among other measures). The government should also ensure that transparent information on new technology developments is made available to the public.
Fluctuating global oil prices pose an additional challenge to the development of Canada’s unconventional oil reserves. Within Canada itself, the majority of the capital expenditure for new oil production development projects due to come online by 2016 has already been committed, meaning that currently low prices are unlikely to lead to lower growth-rates in domestic production in the short term. However, in the longer term, reductions in capital expenditure could affect projects that were planned for start-up beyond 2016.
Since the last in-depth review, oil transportation safety has become a concern, with rail safety at the forefront along with pipeline safety issues. Because of pipeline constraints, rail shipments are expected to rise in the near future. CAPP estimates that the volume of western Canadian crude transported by rail will reach 200 000 b/d in 2015, up from 185 000 b/d in 2014 (CAPP, 2015).
Another issue related to increased domestic oil production rates is the trend towards falling overseas crude oil imports to eastern Canada and their replacement with mid-continental (Canadian and US) supplies. This trend is increasing the oil security of supply in eastern Canada, but it also necessitates additional pipeline infrastructure to transport the oil from western Canada (where the majority of the oil is produced) to eastern Canada. A significant proportion of the needed additional pipeline infrastructure for this purpose has either already been developed or is in progress.
Commendably, the Canadian government has proposed comprehensive regulatory measures to enhance pipeline, marine and rail safety, including higher standards for tank
© O
EC
D/IE
A, 2
016
6. Oil
151
cars and closer scrutiny of the hazardous potential of crude oil. Given the high levels of cross-border oil traffic, it is necessary that Canada and the US agree to harmonise their oil transport safety regulations. Such measures could be implemented by the US Pipeline and Hazardous Materials Safety Administration (PHSMA), the US National Transportation Safety Board and Transport Canada.
Finally, as Canada is a net exporter of oil, the country is not obliged by the IEA to hold emergency oil stocks. In terms of domestic oil security of supply, Canada enjoys a relatively high – and improving – level of energy security. However, there is still a need for the country to develop additional oil emergency response policies (e.g. a set of mandatory demand restraint policies) to ensure that it can meet its treaty obligation under the International Energy Programme (IEP) to contribute its allocated share of additional oil to the market in the event of an IEA collective action.
RECOMMENDATIONS
The government of Canada should:
o Continue to monitor and encourage the reduction of environmental impacts of the oil sands and promote the uptake of clean and innovative technologies by industry, including through energy efficiency standards. Ensure transparent information is provided to the public about technology developments.
o Continue to work towards enhancing and harmonising rail regulations for shipping oil to ensure equal standards across provinces and with the US to ensure safety of transportation.
o Work with pipeline companies to better communicate and reassure the public of the safety of Canadian oil pipelines.
o Establish a clear set of oil demand restraint measures to help ensure that the country can meet its IEA obligations during a collective action; and seek formal agreements with the provinces for the effective implementation of these measures in an emergency.
References AER (Alberta Energy Regulator), (2015), ST98: Alberta's Energy Reserves & Supply/Demand Outlook, at: https://www.aer.ca/documents/sts/ST98/ST98-2015.pdf.
ARC Financial Corp (2015), The Fiscal Pulse of Canada’s Oil and Gas Industry, Frist Quarter 2015, at: www.arcfinancial.com/assets/672/2015_Q1_Industry_Fiscal_Pulse_-_ARC_Financial.pdf.
CAPP (Canadian Association of Petroleum Producers), (2015), Crude Oil Forecast, Markets & Transportation, June, at: http://capp.ca/publications-and-statistics/publications/264673.
CERI (Canadian Energy Research Institute), (2014), Oil Sands Environmental Impacts, July 2014, at: www.ceri.ca/images/stories/2014-09-18_CERI_Study_143.pdf.
IEA (International Energy Agency) (2015a), Medium-term oil market report, OECD/IEA, Paris.
IEA (2015b), Oil Information, www.iea.org/statistics/, OECD/IEA, Paris.
IEA (2015c), Energy Prices and Taxes, www.iea.org/statistics/, OECD/IEA, Paris.
© O
EC
D/IE
A, 2
016

6. Oil
152
IEA (2013), Resources to Reserves: Oil, Gas and Coal Technologies for the Energy Markets of the Future, OECD/IEA, Paris.
NEB (National Energy Board) (2016), Canada’s Energy Future 2016 – Energy Supply and Demand Projections to 2040.
NEB (2013), Canada’s Energy Future 2013: Energy Supply and Demand Projections to 2035, November.
NRCan (Natural Resources Canada), (2014), Energy Markets Fact Book, 2014/2015.
Oil Sands Quarterly, Edition of spring 2015, at: http://albertacanada.com/business/statistics/oil-sands-quarterly.aspx
© O
EC
D/IE
A, 2
016
7. Coal
153
7. COAL
Key data (2013)
Coal supply: 17.4 Mtoe, -41.5% since 2003
Production: 68.9 Mt with 38.3 Mt of hard coal and 30.6 Mt of brown coal1
Net exports: 32.7 Mt of hard coal
Share of coal: 7% of TPES and 10% of electricity generation
Inland consumption: 17.4 Mtoe (power generation 79.5%, industry 14.9%, coke ovens and other transformations 5.5%, residential 0.1%)
OVERVIEW
After Australia and the United States, Canada is the third-largest seaborne coking coal exporter in the world, supplying the global steel industry. Coal is a top-ranked commodity transported by rail and handled by ports. There is a need for continuous investment in new coal-mining and transportation infrastructure if Canada is to further develop its export potential by 2020.
Domestic use of thermal coal in power generation is on the decline, following the trends of the past decade. Canada is reducing the use of old and inefficient coal-fired generation under federal and provincial regulations.
Canada leads global clean coal demonstration and deployment efforts and the province of Saskatchewan began commercial operation of the first large-scale application of carbon capture and storage (CCS) technology. The outlook for domestic coal use in power generation will depend on the commercial availability of CCS over the next decade, the spread between gas and coal prices, and pending new federal regulations on emission performance of gas-fired power plants.
SUPPLY AND DEMAND
SUPPLY
Coal accounted for around 7% of total primary energy supply (TPES) and 10% of electricity generation in Canada in 2013. Coal supply was 17.4 million tonnes of oil-equivalent (Mtoe) in 2013, which is 41.5% lower than in 2003. Supply peaked in 2000 at 31.7 Mtoe and has been falling since, mainly owing to declining coal-fired power generation (Figure 7.2).
1. Note: In IEA coal statistics, brown coal comprises sub-bituminous coal and lignite, while hard coal comprises anthracite, bituminous and other bituminous coal.
© O
EC
D/IE
A, 2
016
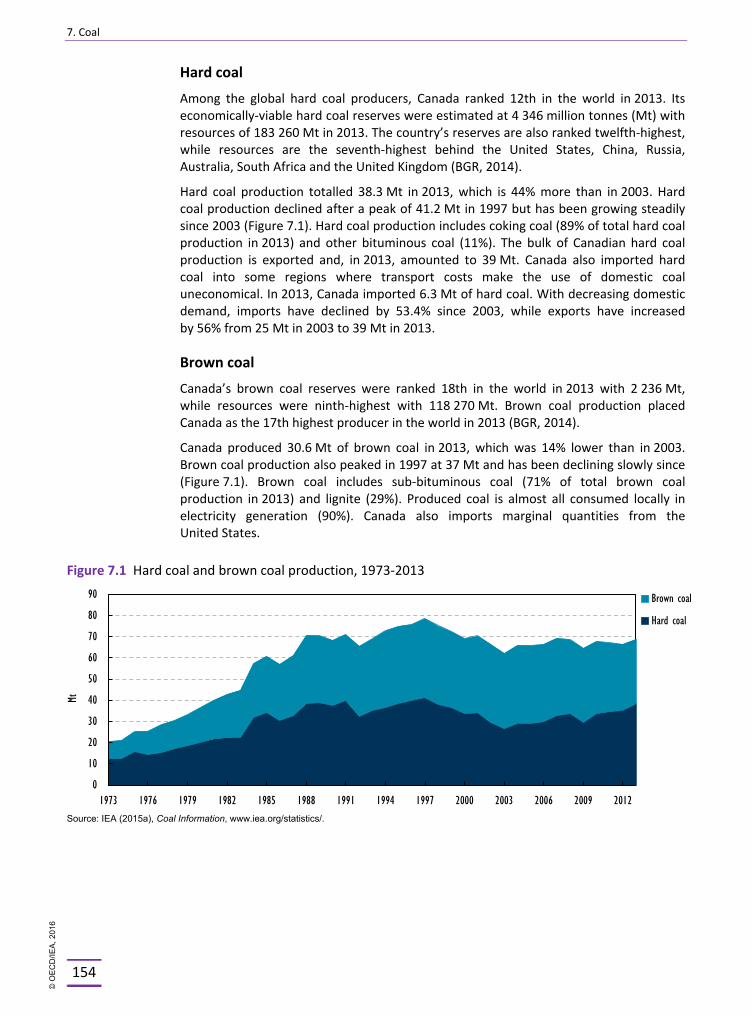
7. Coal
154
Hard coal
Among the global hard coal producers, Canada ranked 12th in the world in 2013. Its economically-viable hard coal reserves were estimated at 4 346 million tonnes (Mt) with resources of 183 260 Mt in 2013. The country’s reserves are also ranked twelfth-highest, while resources are the seventh-highest behind the United States, China, Russia, Australia, South Africa and the United Kingdom (BGR, 2014).
Hard coal production totalled 38.3 Mt in 2013, which is 44% more than in 2003. Hard coal production declined after a peak of 41.2 Mt in 1997 but has been growing steadily since 2003 (Figure 7.1). Hard coal production includes coking coal (89% of total hard coal production in 2013) and other bituminous coal (11%). The bulk of Canadian hard coal production is exported and, in 2013, amounted to 39 Mt. Canada also imported hard coal into some regions where transport costs make the use of domestic coal uneconomical. In 2013, Canada imported 6.3 Mt of hard coal. With decreasing domestic demand, imports have declined by 53.4% since 2003, while exports have increased by 56% from 25 Mt in 2003 to 39 Mt in 2013.
Brown coal
Canada’s brown coal reserves were ranked 18th in the world in 2013 with 2 236 Mt, while resources were ninth-highest with 118 270 Mt. Brown coal production placed Canada as the 17th highest producer in the world in 2013 (BGR, 2014).
Canada produced 30.6 Mt of brown coal in 2013, which was 14% lower than in 2003. Brown coal production also peaked in 1997 at 37 Mt and has been declining slowly since (Figure 7.1). Brown coal includes sub-bituminous coal (71% of total brown coal production in 2013) and lignite (29%). Produced coal is almost all consumed locally in electricity generation (90%). Canada also imports marginal quantities from the United States.
Figure 7.1 Hard coal and brown coal production, 1973-2013
Source: IEA (2015a), Coal Information, www.iea.org/statistics/.
0
10
20
30
40
50
60
70
80
90
1973 1976 1979 1982 1985 1988 1991 1994 1997 2000 2003 2006 2009 2012
Mt
Brown coal
Hard coal
© O
EC
D/IE
A, 2
016
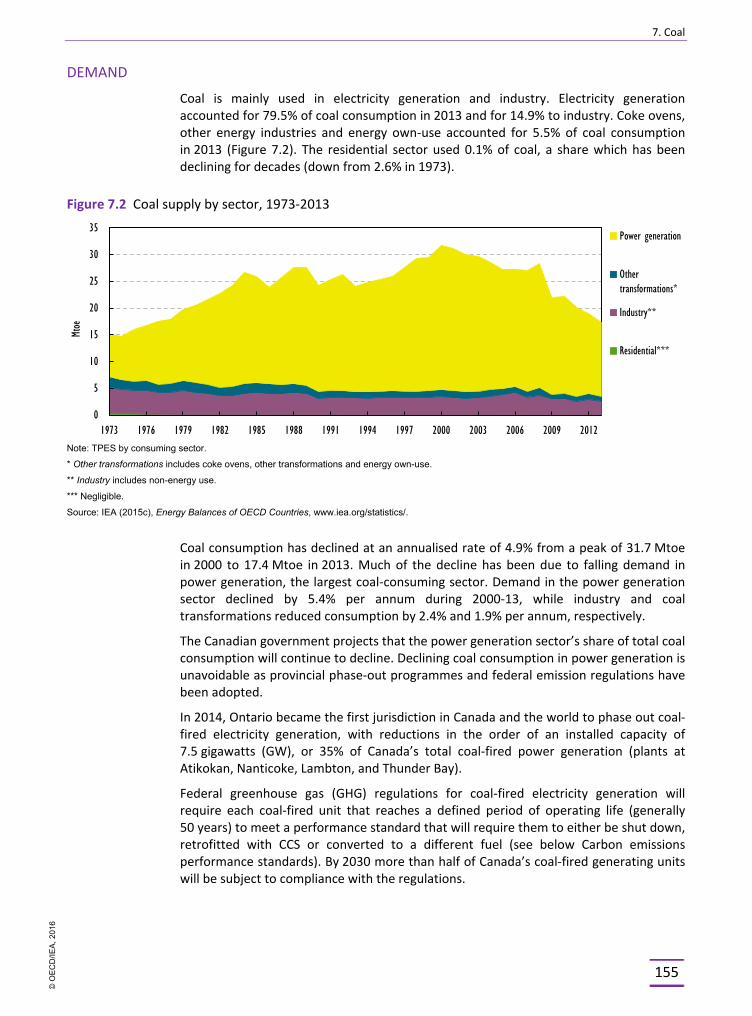
7. Coal
155
DEMAND
Coal is mainly used in electricity generation and industry. Electricity generation accounted for 79.5% of coal consumption in 2013 and for 14.9% to industry. Coke ovens, other energy industries and energy own-use accounted for 5.5% of coal consumption in 2013 (Figure 7.2). The residential sector used 0.1% of coal, a share which has been declining for decades (down from 2.6% in 1973).
Figure 7.2 Coal supply by sector, 1973-2013
Note: TPES by consuming sector.
* Other transformations includes coke ovens, other transformations and energy own-use.
** Industry includes non-energy use.
*** Negligible.
Source: IEA (2015c), Energy Balances of OECD Countries, www.iea.org/statistics/.
Coal consumption has declined at an annualised rate of 4.9% from a peak of 31.7 Mtoe in 2000 to 17.4 Mtoe in 2013. Much of the decline has been due to falling demand in power generation, the largest coal-consuming sector. Demand in the power generation sector declined by 5.4% per annum during 2000-13, while industry and coal transformations reduced consumption by 2.4% and 1.9% per annum, respectively.
The Canadian government projects that the power generation sector’s share of total coal consumption will continue to decline. Declining coal consumption in power generation is unavoidable as provincial phase-out programmes and federal emission regulations have been adopted.
In 2014, Ontario became the first jurisdiction in Canada and the world to phase out coal-fired electricity generation, with reductions in the order of an installed capacity of 7.5 gigawatts (GW), or 35% of Canada’s total coal-fired power generation (plants at Atikokan, Nanticoke, Lambton, and Thunder Bay).
Federal greenhouse gas (GHG) regulations for coal-fired electricity generation will require each coal-fired unit that reaches a defined period of operating life (generally 50 years) to meet a performance standard that will require them to either be shut down, retrofitted with CCS or converted to a different fuel (see below Carbon emissions performance standards). By 2030 more than half of Canada’s coal-fired generating units will be subject to compliance with the regulations.
0
5
10
15
20
25
30
35
1973 1976 1979 1982 1985 1988 1991 1994 1997 2000 2003 2006 2009 2012
Mtoe
Power generation
Othertransformations*
Industry**
Residential***
© O
EC
D/IE
A, 2
016
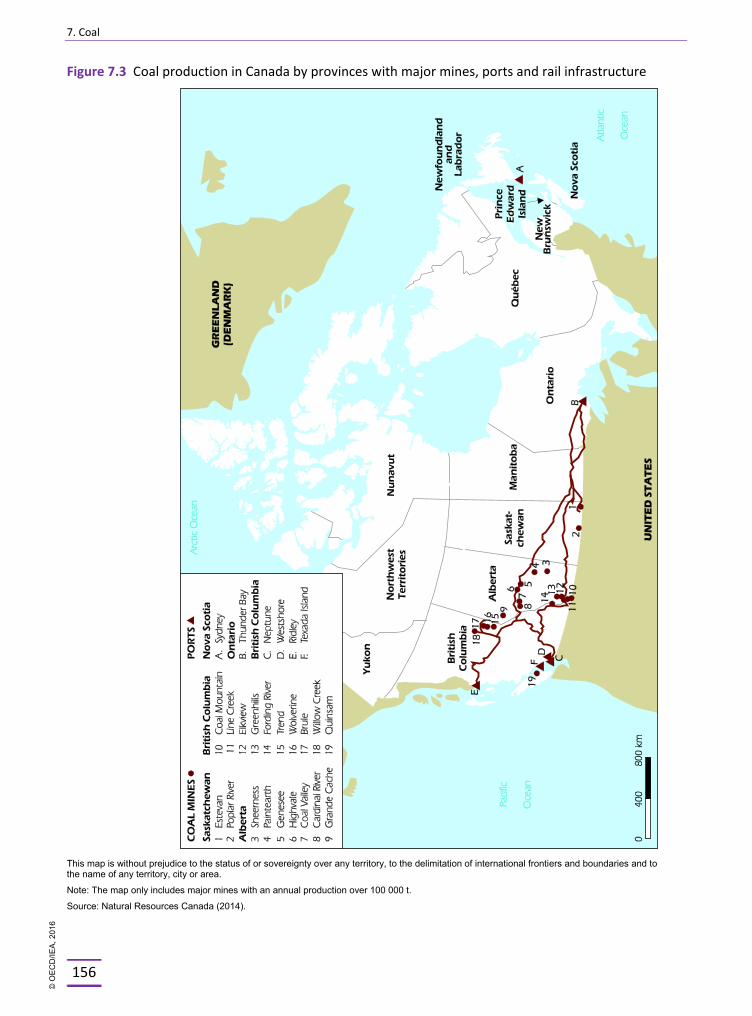
7. Coal
156
Figure 7.3 Coal production in Canada by provinces with major mines, ports and rail infrastructure
This map is without prejudice to the status of or sovereignty over any territory, to the delimitation of international frontiers and boundaries and to the name of any territory, city or area.
Note: The map only includes major mines with an annual production over 100 000 t.
Source: Natural Resources Canada (2014).
© O
EC
D/IE
A, 2
016
7. Coal
157
Table 7.1 Canadian coal-fired power plants, 2015
Facility Province Capacity (MW) Units, on-stream
Sundance Alberta 2 126 6 units: 1970-1980, Uprates on units 3, 4, 5 and 6 in 2012, 2007, 2009, 2001
Genesee Alberta 1 266 3 units: 1989, 1994, 2005
Keephills Alberta 1 253 3 units: 1983, 1983, 2011
Boundary Dam Saskatchewan 700
unit 1: 1959 (shut down permanently in 2013); unit 2: 1960 (shut down permanently in 2014); unit 3: 1969 (rebuilt in 2013 with CCS); unit 4: 1970; unit 5: 1973; unit 6: 1978
Sheerness Alberta 780 2 units: 1986 and 1990
Battle River Alberta 689 units 1 and 2: 1956 (decommissioned in 2000), unit 3, 4, 5: in 1969, 1975, 1981
Poplar River Saskatchewan 630 unit 1 and 2: 1981, 1983
Lingan Nova Scotia 620 4 units: 1979-1984
Note: Plants with over 500 MW installed capacity.
Table 7.2 Units reaching their end of life under federal regulations before 2020
Province Number of units Capacity (MW)
Alberta 4 869
Saskatchewan 5 540
Manitoba 1 105
Ontario* 2 950
Nova Scotia 1 150
Total 13 2 614
* As of 2014, all coal-fired units in Ontario have been phased out under provincial regulation.
IMPORTS AND EXPORTS
Canada is a net exporter of coal and, in fact, is the third-largest seaborne coking coal exporter in the world. Almost half of Canada’s coal production was metallurgical (coking) coal, most of which is destined for export markets; the other half (mostly brown coal) was used in domestic coal-fired power generation.
Canada exported 37 Mt of coal in 2013, of which 33 Mt was coking or hard coal and 4 Mt was thermal coal. Exports of coking coal saw a steady increase since 2009. Canada exports coking coal mainly to Asian markets and these exports are rising with high coking coal demand for steel production. In 2013, 30% of Canadian coking coal was exported to China, 23% to Japan and 20% to Korea, with the remainder destined for Brazil, India and European markets. Only 2.5% of Canadian coking coal exports went to the United States.
© O
EC
D/IE
A, 2
016
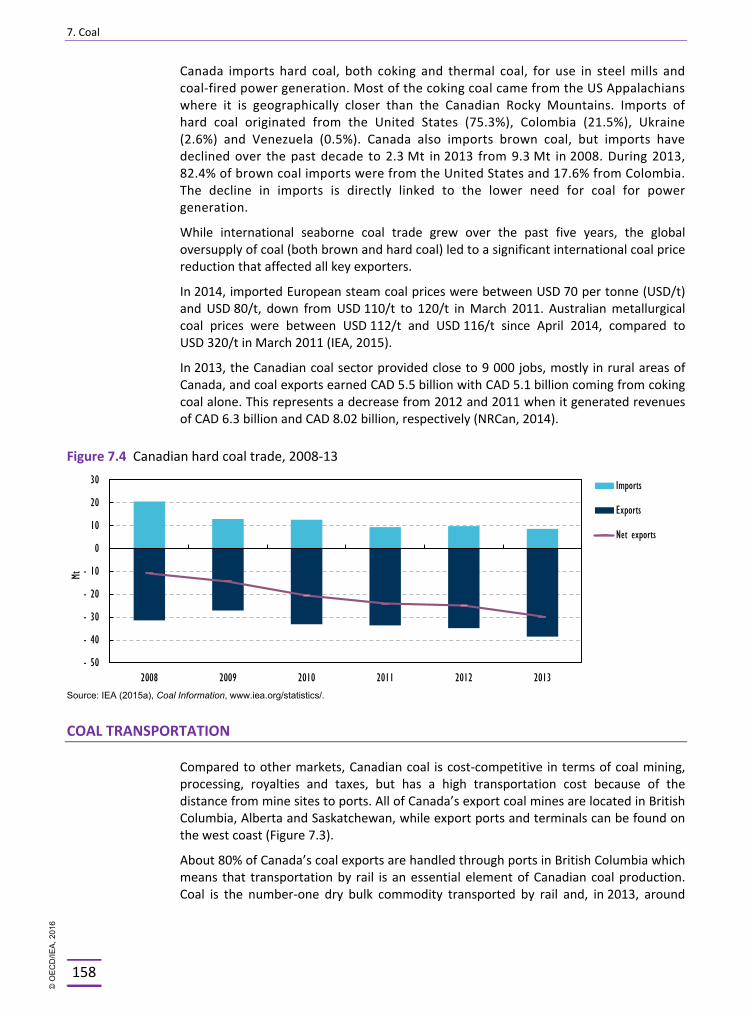
7. Coal
158
Canada imports hard coal, both coking and thermal coal, for use in steel mills and coal-fired power generation. Most of the coking coal came from the US Appalachians where it is geographically closer than the Canadian Rocky Mountains. Imports of hard coal originated from the United States (75.3%), Colombia (21.5%), Ukraine (2.6%) and Venezuela (0.5%). Canada also imports brown coal, but imports have declined over the past decade to 2.3 Mt in 2013 from 9.3 Mt in 2008. During 2013, 82.4% of brown coal imports were from the United States and 17.6% from Colombia. The decline in imports is directly linked to the lower need for coal for power generation.
While international seaborne coal trade grew over the past five years, the global oversupply of coal (both brown and hard coal) led to a significant international coal price reduction that affected all key exporters.
In 2014, imported European steam coal prices were between USD 70 per tonne (USD/t) and USD 80/t, down from USD 110/t to 120/t in March 2011. Australian metallurgical coal prices were between USD 112/t and USD 116/t since April 2014, compared to USD 320/t in March 2011 (IEA, 2015).
In 2013, the Canadian coal sector provided close to 9 000 jobs, mostly in rural areas of Canada, and coal exports earned CAD 5.5 billion with CAD 5.1 billion coming from coking coal alone. This represents a decrease from 2012 and 2011 when it generated revenues of CAD 6.3 billion and CAD 8.02 billion, respectively (NRCan, 2014).
Figure 7.4 Canadian hard coal trade, 2008-13
Source: IEA (2015a), Coal Information, www.iea.org/statistics/.
COAL TRANSPORTATION
Compared to other markets, Canadian coal is cost-competitive in terms of coal mining, processing, royalties and taxes, but has a high transportation cost because of the distance from mine sites to ports. All of Canada’s export coal mines are located in British Columbia, Alberta and Saskatchewan, while export ports and terminals can be found on the west coast (Figure 7.3).
About 80% of Canada’s coal exports are handled through ports in British Columbia which means that transportation by rail is an essential element of Canadian coal production. Coal is the number-one dry bulk commodity transported by rail and, in 2013, around
- 50
- 40
- 30
- 20
- 10
0
10
20
30
2008 2009 2010 2011 2012 2013
Mt
Imports
Exports
Net exports
© O
EC
D/IE
A, 2
016
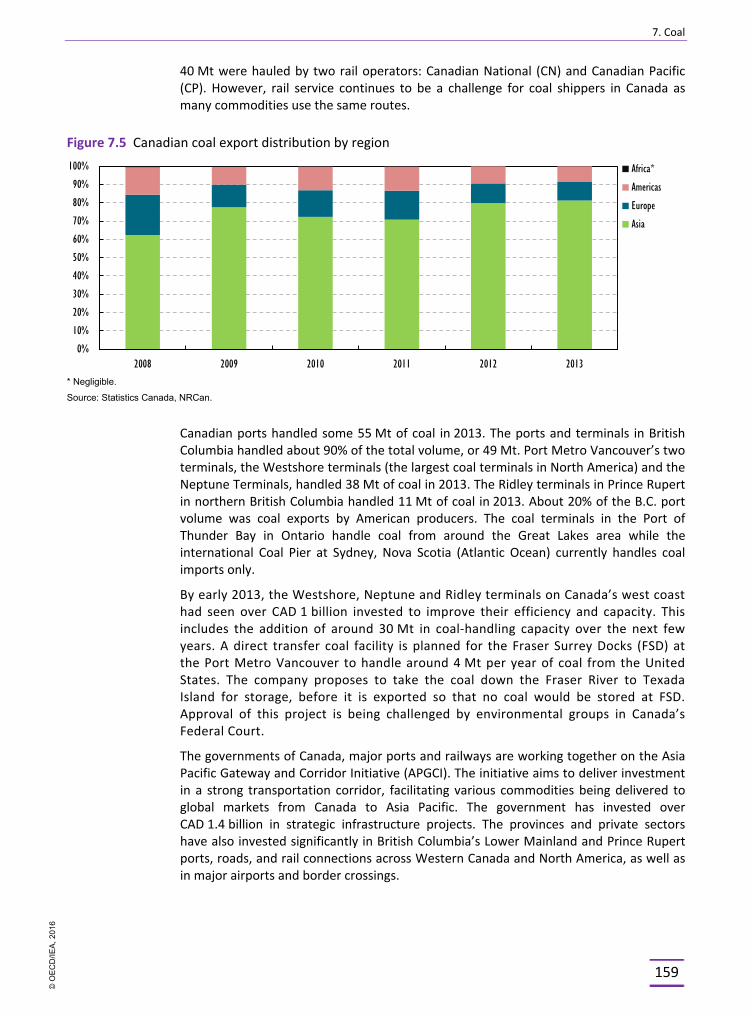
7. Coal
159
40 Mt were hauled by two rail operators: Canadian National (CN) and Canadian Pacific (CP). However, rail service continues to be a challenge for coal shippers in Canada as many commodities use the same routes.
Figure 7.5 Canadian coal export distribution by region
* Negligible.
Source: Statistics Canada, NRCan.
Canadian ports handled some 55 Mt of coal in 2013. The ports and terminals in British Columbia handled about 90% of the total volume, or 49 Mt. Port Metro Vancouver’s two terminals, the Westshore terminals (the largest coal terminals in North America) and the Neptune Terminals, handled 38 Mt of coal in 2013. The Ridley terminals in Prince Rupert in northern British Columbia handled 11 Mt of coal in 2013. About 20% of the B.C. port volume was coal exports by American producers. The coal terminals in the Port of Thunder Bay in Ontario handle coal from around the Great Lakes area while the international Coal Pier at Sydney, Nova Scotia (Atlantic Ocean) currently handles coal imports only.
By early 2013, the Westshore, Neptune and Ridley terminals on Canada’s west coast had seen over CAD 1 billion invested to improve their efficiency and capacity. This includes the addition of around 30 Mt in coal-handling capacity over the next few years. A direct transfer coal facility is planned for the Fraser Surrey Docks (FSD) at the Port Metro Vancouver to handle around 4 Mt per year of coal from the United States. The company proposes to take the coal down the Fraser River to Texada Island for storage, before it is exported so that no coal would be stored at FSD. Approval of this project is being challenged by environmental groups in Canada’s Federal Court.
The governments of Canada, major ports and railways are working together on the Asia Pacific Gateway and Corridor Initiative (APGCI). The initiative aims to deliver investment in a strong transportation corridor, facilitating various commodities being delivered to global markets from Canada to Asia Pacific. The government has invested over CAD 1.4 billion in strategic infrastructure projects. The provinces and private sectors have also invested significantly in British Columbia’s Lower Mainland and Prince Rupert ports, roads, and rail connections across Western Canada and North America, as well as in major airports and border crossings.
0%
10%
20%
30%
40%
50%
60%
70%
80%
90%
100%
2008 2009 2010 2011 2012 2013
Africa*
Americas
Europe
Asia
© O
EC
D/IE
A, 2
016
7. Coal
160
INDUSTRY STRUCTURE
In 2013, Canada had 20 large operating coal mines (see Table 7.3), 18 were opencast and two were underground mines. There were ten mines in British Columbia: Brule, Coal Mountain, Elkview, Fording River, Greenhills, Line Creek, Quinsam, Trend, Perry Creek (Wolverine), and Willow Creek; seven coal mines in Alberta: Cardinal River, Coal Valley, Genesee, Grande Cache, Highvale, Paintearth, and Sheerness; and three in Saskatchewan: Bienfait, Boundary Dam, and Poplar River. In April 2014, Westmoreland Coal Company (Westmoreland) merged Boundary Dam and Bienfait into the operation named Estevan.
Seven publicly traded companies own or jointly own nineteen mines, while one private entity owns and operates one mine. There are no government-owned or operated coal mines in Canada; all are owned and operated by the private sector (see Table 7.3). Four companies produce coking coal or pulverised coal for export: Teck Resources Ltd. (Teck); Walter Energy, Inc. (Walter Energy); Canadian Operations; Winsway Coking Coal Holdings Ltd. (Winsway); and Marubeni Corp. (Marubeni) jointly owned Grande Cache Coal Corp. (GCC); and Anglo American Plc’s Peace River Coal Inc. Two companies produce bituminous thermal coal for export: Westmoreland (previously Sherritt International Corp.) and Vitol Group’s Hillsborough Resources Ltd. Westmoreland produces brown coal for domestic coal-fired power generation. TransAlta Corp. (TransAlta) produces sub-bituminous coal for its own power plants.
Amid falling international coal prices and the need for cost reductions across the sector, the Canadian coal industry is witnessing growing consolidation and restructuring, with workforce reductions, closure of less profitable mines and changes and delays in investment in new mines and infrastructure.
Major U.S. metallurgical coal producer, Walter Energy, idled its Canadian operations, the Wolverine and Brule mines in 2014, and suspended operations at its Willow Creek mine in 2013, pending price recovery. Anglo American also suspended operations at the Trend mine starting from 2015. By spring 2015, there were no coal mines in operation in the Peace River Coalfield. In 2013, Canadian electricity generator, TransAlta Corp., took over the Highvale coal mining operations from Sherritt. TransAlta Corp. operates over 70 power plants in Canada, the United States and Australia and is Canada’s largest renewable energy investor. The Highvale mine is the largest producing coal mine in Canada with an annual production capacity of approximately 13 Mt per year. In 2014, U.S. Westmoreland acquired the largest Canadian brown coal producer Sherritt, and its seven producing thermal coal mines in Alberta and Saskatchewan, thereby doubling the company’s production and making it the sixth-largest coal producer in North America.
At the same time, several mine projects were deferred because of low international coal prices. This includes the planned restart of Teck’s Quintette coal mine, which would produce 3 to 4 Mt per year of coking coal for export.
Despite restructuring and consolidation, several export mine investments made in the high-price period are expected to come online in the medium term, including Coalspur’s Vista project in Alberta which has received all required regulatory approvals for mine construction. Coalspur delayed the start of its construction in 2014 because of the depressed coal market price and capital financing. The mine would produce bituminous thermal coal (hard coal) for export. Mine development would be in two phases, reaching 12 Mt per year in total in the medium term. First production is targeted for mid-2016.
© O
EC
D/IE
A, 2
016
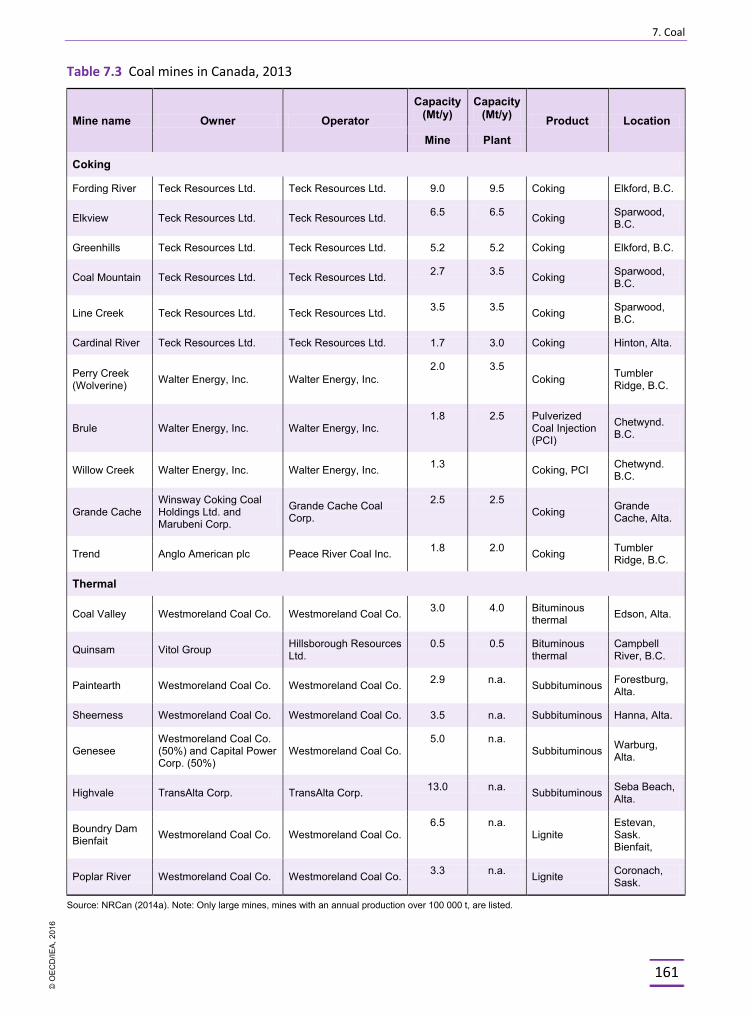
7. Coal
161
Table 7.3 Coal mines in Canada, 2013
Mine name Owner Operator Capacity
(Mt/y) Capacity
(Mt/y) Product Location Mine Plant
Coking
Fording River Teck Resources Ltd. Teck Resources Ltd. 9.0 9.5 Coking Elkford, B.C.
Elkview Teck Resources Ltd. Teck Resources Ltd. 6.5 6.5 Coking Sparwood, B.C.
Greenhills Teck Resources Ltd. Teck Resources Ltd. 5.2 5.2 Coking Elkford, B.C.
Coal Mountain Teck Resources Ltd. Teck Resources Ltd. 2.7 3.5 Coking Sparwood, B.C.
Line Creek Teck Resources Ltd. Teck Resources Ltd. 3.5 3.5 Coking Sparwood, B.C.
Cardinal River Teck Resources Ltd. Teck Resources Ltd. 1.7 3.0 Coking Hinton, Alta.
Perry Creek (Wolverine) Walter Energy, Inc. Walter Energy, Inc.
2.0 3.5 Coking Tumbler
Ridge, B.C.
Brule Walter Energy, Inc. Walter Energy, Inc. 1.8 2.5 Pulverized
Coal Injection (PCI)
Chetwynd. B.C.
Willow Creek Walter Energy, Inc. Walter Energy, Inc. 1.3 Coking, PCI Chetwynd. B.C.
Grande Cache Winsway Coking Coal Holdings Ltd. and Marubeni Corp.
Grande Cache Coal Corp.
2.5 2.5 Coking Grande
Cache, Alta.
Trend Anglo American plc Peace River Coal Inc. 1.8 2.0 Coking Tumbler Ridge, B.C.
Thermal
Coal Valley Westmoreland Coal Co. Westmoreland Coal Co. 3.0 4.0 Bituminous thermal Edson, Alta.
Quinsam Vitol Group Hillsborough Resources Ltd.
0.5 0.5 Bituminous thermal
Campbell River, B.C.
Paintearth Westmoreland Coal Co. Westmoreland Coal Co. 2.9 n.a. Subbituminous Forestburg, Alta.
Sheerness Westmoreland Coal Co. Westmoreland Coal Co. 3.5 n.a. Subbituminous Hanna, Alta.
Genesee Westmoreland Coal Co. (50%) and Capital Power Corp. (50%)
Westmoreland Coal Co. 5.0 n.a.
Subbituminous Warburg, Alta.
Highvale TransAlta Corp. TransAlta Corp. 13.0 n.a. Subbituminous Seba Beach, Alta.
Boundry Dam Bienfait Westmoreland Coal Co. Westmoreland Coal Co.
6.5 n.a. Lignite
Estevan, Sask. Bienfait,
Poplar River Westmoreland Coal Co. Westmoreland Coal Co. 3.3 n.a. Lignite Coronach, Sask.
Source: NRCan (2014a). Note: Only large mines, mines with an annual production over 100 000 t, are listed.
© O
EC
D/IE
A, 2
016
7. Coal
162
Several mining projects in British Columbia are undergoing environmental assessments (EAs). One of them is HD Mining’s Murray River underground coal mine project with an envisaged production capacity of 6 Mt per year of coking coal for export for over 31 years. The Donkin mine project (acquired by Cline from Glencore (75%) and Morien (25%) on Cape Breton Island, Nova Scotia, received environmental approval in 2013 and is expected to produce 2.75 Mt per year by 2016. Exports would go through the port of Sydney. These projects, including the upgrade of terminal and port capacity on the west coast, are forecast to support growth in Canadian exports by 3.4% per year to reach 39 Mt by 2019 (IEA, 2015b). This growth is mainly driven by the expected global increase in demand for hard coal.
POLICIES AND MEASURES
Canada does not have a specific coal policy. However, the Minerals and Metals Policy of the government applies to the mining sector and several environmental acts and regulations set standards for coal producers and consumers.
MINERALS AND METALS POLICY
Existing coal mine operators need to comply with the rules under the Canadian Environmental Protection Act 1999 which protects the environment and human health, applies the precautionary principle, and promotes and reinforces enforceable pollution prevention approaches.
The provincial governments are mainly responsible for oversight of mining − the exploration for and the development and extraction of mineral resources, as well as the construction, management, reclamation and closure of mine sites – within their jurisdiction. Direct federal involvement in the regulation of mining operations is limited and specific in nature.
Under the Canadian Environmental Assessment Act (CEAA 2012), the Regulations Designating Physical Activities identify the types of projects that may be subject to federal environmental assessment, which include coal mines. CEAA 2012 also promotes co-operation between federal and provincial governments, and provides opportunities for public participation, including consultation with Aboriginal groups. As of July 2015, the federal government has approved eleven projects for substitution, including seven mining projects in British Columbia.
With regard to coal production, environmental impacts are managed in two ways, i) through federal, provincial and territorial regulatory permits and environmental assessments and ii) through the environmental management programmes of the industry.
SUBSIDIES TO THE COAL SECTOR
Under Canadian taxation, exploration and mine development expenses have benefitted from several incentives, allowing mining companies to recover their initial capital investment at accelerated rates. The general income tax regime also includes generous loss carry-over rules that help mitigate the negative financial effects of fluctuating prices.
© O
EC
D/IE
A, 2
016
7. Coal
163
At the federal level, the tax incentives have included the accelerated capital cost allowance (ACCA) for mining, earned depletion2, flow-through shares3 and Canadian exploration expense (CEE) treatment (100% deductible in the year incurred) for development and exploration expenditures incurred to bring a new mine into production, including pre-production costs, covering land clearance, community consultations and environmental studies.
Next to federal support, provinces also support mining exploration through substantial tax credits and set their own income tax incentives, for instance via the mining exploration tax credit in British Columbia which amounted to CAD 15 million per year in 2010 and 2011(OECD, 2013).4
In recent years, the government has announced the medium-term phase-out of several corporate income tax preferences relevant to coal mining, consistent with the G20 commitment to rationalise inefficient fossil fuel subsidies.
§ Phase-out of the Atlantic Investment Tax Credit for investments in the oil and gas and mining sectors by 2016
§ Phase-out of the accelerated capital cost allowance for tangible assets in mining projects by 2021
§ Reduction in the deduction rate for pre-production, intangible mine development expenses by 2018, in order to align the rate for expenses in the mining sector with that applicable in the oil and gas sectors.
ENVIRONMENTAL RULES
Coal use in power generation is governed by a number of federal environmental rules with regard to air pollutants and GHG emissions but also with regard to provincial energy and climate policies as well as new technology developments, such as CCS.
The Canadian Environmental Protection Act 1999 (CEPA 1999) provides legislative authority for the government of Canada to regulate air pollutants such as sulphur oxides (SOx), nitrogen oxides (NOx), volatile organic compounds (VOCs), particulate matters (PM), mercury and other pollutants. Under the CEPA, permitting of facilities is generally carried out by the provinces through equivalency agreements.
Under the Clean Air Regulatory Agenda (CARA) of 2006, the government of Canada set out its ambitions to reduce air pollutant and GHGs emissions from power generation and industrial facilities. In 2006, the government had presented a Notice of Intent to regulate air emissions under CARA with targets for given air pollutants from different industrial facilities and sectors and maximum levels for each year which were to be reached by 2015.
However, air pollutant control has not been at the forefront of the regulatory agenda in the past years, but is now partly addressed under the new emission regulations, which are outlined below.
2. New earned depletion has not been available to be earned since 1990, though deductions can still be made in relation to unused depletion pools accumulated before that time. 3. Flow-through shares allow companies to “flow through” expenses associated with Canadian exploration and mine development to investors, who can deduct the expenses in calculating their own taxable income. This facilitates the raising of equity by enabling companies to sell their shares at a premium. 4. This figure was estimated by the OECD on the basis of an estimate of the overall cost of the British Columbia mineral exploration tax credit attributable to coal and is not necessarily reflective of the actual amount.
© O
EC
D/IE
A, 2
016
7. Coal
164
Since 2006, Canada-Wide Standards (CWS) are in place for mercury emissions from coal-fired power plants. These standards include provincial caps for mercury emissions from existing plants, and mercury emission limits for new power stations on the basis of best available control technology.
CARBON EMISSION PERFORMANCE STANDARDS
Under CEPA 1999, new emission performance standards were adopted at the federal level in 2012 with the Reduction of Carbon Dioxide Emissions from Coal-Fired Generation of Electricity Regulations. These regulations aim to reduce carbon dioxide (CO2) emissions from new coal-fired power plants and those reaching the end of their economic life, by setting an emission intensity performance standard limit at 420 tonnes of CO2 per gigawatt-hour (tCO2 per GWh), the level achievable by using efficient natural gas combined cycle technology. The performance standards come into effect on 1 July 2015. This will have a major impact on existing coal-fired power plants, mainly in Alberta, Saskatchewan and Nova Scotia. Regulated firms will be subject to enforcement and compliance requirements and penalties under CEPA 1999.
The federal regulations aim to facilitate a permanent transition towards low-carbon generation, including high-efficiency natural gas, coal with CCS and renewable energy generation sources. To meet these stringent regulations, existing coal-fired power plants will need to be retrofitted with CCS, to convert to biomass or to use natural gas, or choose to be shut down once they reach their end of life as defined in the regulations. The regulations allow new and end-of-life units that incorporate CCS to defer compliance with the emission performance standards until 31 December 2024. Existing units that install CCS before the end of their life may apply for a two-year deferral of the performance standards.
In general, coal-fired power plants reach their end-of-useful-life under the regulations 50 years from the unit’s commissioning date. Units that were commissioned before 1975 will reach their end-of-life after 50 years of operation or at the end of 2019, whichever comes earlier. Units commissioned in or after 1975 but before 1986 will reach their end-of-life after 50 years of operation or at the end of 2029, whichever comes earlier.
Under the CEPA 1999, the federal government can enter into equivalency agreements with provinces where there is an enforceable provincial regime which delivers an equivalent environmental outcome. An equivalency agreement has been developed with Nova Scotia; the federal government and Saskatchewan have announced that they are working towards equivalency; and similar discussions have also begun with Alberta.
According to the federal government, the regulations are projected to result in a net reduction of approximately 214 MtCO2-eq of GHG, over the period 2015–35. The new emission performance standards are set to significantly reduce air pollution levels from precursor pollutants, such as NOx and SOx. They are expected to lead to a reduction in SO2 emission below 2005 levels by 21.7% by 2035, and a reduction in NOx emissions below 2005 levels by 10% by 2035 (Regulation’s Regulatory Impact Analysis Statement, 2015).
At provincial level, Ontario has been leading efforts to phase out coal-fired power plants since 2003. It mandated the cessation of its five coal-fired electricity generation stations by the end of 2014 under regulation O. Reg. 496/07. Three generating stations were shut down (Lakeview, Nanticoke, Lambton); others converted to biomass (Thunder Bay and Atikokan). By April 2014, Ontario had retired its five coal-fired power plants with a total capacity of 7 555 MW. This represented 24% of total electricity generated in the province and 35% of Canada’s coal-fired electricity generation.
© O
EC
D/IE
A, 2
016
7. Coal
165
In 2010 Manitoba decided to downgrade the sole coal-fired power plant, Brandon, to emergency use only, under section 16 of the Manitoba Climate Change and Emissions Reductions Act. Nova Scotia has signed an equivalency agreement with the federal government that will allow the province to increase its consumption of hydropower while continuing to use coal at a reduced capacity.
British Columbia, with its 2009 BC Energy Plan, mandated it will have zero GHG emissions from coal, effectively banning coal-fired power plants that cannot capture and sequester emissions. Alberta, which holds the largest capacity with 7.6 GW, requires large emitters, including coal-fired power plants, to pay into a technology fund or purchase offsets. Alberta is at the forefront globally of considering and addressing CCS regulatory issues through completion of its CCS Regulatory Framework Assessment (RFA) with over 70 recommendations for enhancing Alberta’s regulatory framework. Under existing federal regulations, 12 of Alberta’s 18 coal-fired generating plants would be retired by 2030. Without action, the remaining 6 plants would continue operations, reducing air quality and impacting human health – in one case until 2061. In November 2015, Alberta presented its new Climate Leadership Plan and set out plans for an accelerated phase-out coal-fired power generation in favour of an increased deployment of renewable energies. A price will be put on carbon to provide an incentive for everyone to reduce greenhouse gas pollution. The price will be introduced in two steps: CAD 20 per tonne in January 2017 and CAD 30 per tonne in January 2018. Saskatchewan aims to close 132 MW or 7% of capacity by 2020 and the province is the first jurisdiction in the world to implement CCS technology to coal-fired power generation on a commercial scale.
Canada has become a world leader in CCS technologies with the opening of the SaskPower Boundary Dam CCS facility in October 2014, the first large-scale CCS project at a coal-fired power station in the world. In this project, CO2 is permanently stored through enhanced oil recovery in nearby oilfields. The project will be able to reduce Boundary Dam Unit 3’s CO2 emissions by 90%, or up to 1 MtCO2 per year, while also reducing the plants NOx and SO2 emissions by 50% and 100% respectively.
In addition, federal funds and research programmes support clean energy technology research, development and demonstration (RD&D) activities, including CCS, through the Program of Energy Research and Development (PERD), the ecoENERGY Innovation Initiative (ecoEII), the Clean Energy Fund (CEF) and through federal contributions to the Sustainable Development Technology Canada (SDTC). The federal government works with interested provinces (Alberta, Saskatchewan and Nova Scotia being the most closely engaged), many universities (20 or more), and industry and industrial collaboratives (e.g. Canadian Clean Power Coalition, Petroleum Technology Research Centre). Also at the international level, the partners are engaged in CCS through both bilateral (e.g. Canada-US Clean Energy Dialogue) and multilateral dialogues and co-operation (e.g. International Energy Agency, Carbon Sequestration Leadership Forum).
ASSESSMENT
Since the last review in 2009, the share of coal in TPES has been on the decline, from 11% (2008) to 7% (2013). In 2013, coal made up 10% of the electricity mix, down from 14% in 2008.
© O
EC
D/IE
A, 2
016

7. Coal
166
Three main trends significantly changed the Canadian coal industry outlook: i) the decline in coking coal prices on world markets, ii) the gradual phase-out of thermal coal use in power generation with decisions taken both by provinces (Ontario, Manitoba) and new emission performance standards imposed through federal regulation, and iii) lower demand by energy-intensive industries (steel production). As a result, coal imports and coal use have decreased, while Canadian coking coal exports are on the rise.
Canada has been able to maintain its strong position as the third-largest seaborne coking coal exporter after Australia and the United States. Despite the changes in global coal markets, the sector continues to play an important role in Canada’s economy; coal exports earned USD 5.5 billion in 2013 thanks to strong production from large-scale mines, mainly located in the western provinces of Alberta, British Columbia and Saskatchewan. These provinces are also the main users of thermal coal whose share in the electricity mix remains important in Alberta (59%) and Saskatchewan (27%). Both provinces have taken steps to change their coal-use and promote CCS.
However, Canadian coal production has been affected by the low prices for coking coal on world markets, resulting in several mines shutting down or suspending operations. The competitiveness of Canadian coking coal is under pressure, where those high-cost producers cannot cover the relatively high share of rail transportation costs. Several mines have suspended operations, including Willow Creek, Trend, Wolverine and Brule. The coalfields in south-eastern British Columbia (Elk River and Crowsnest coalfields) remain profitable with 2015 coking coal prices. Competitive and adequate rail service continues to be a challenge for coal shippers as many commodities use the same routes.
Canada has good prospects to remain a global leader of coking coal as its largest export market is Asia with 75% of its total exports going to China, Japan and South Korea, which is undoubtedly a growing coal market. For this, the government will need to ensure that the country has competitive and adequate rail and port capacities and mine projects can be developed in a sustainable, timely and efficient manner.
Efforts have already been made in this direction. The federal and provincial governments, major ports and railways have been cooperating to address this issue through the Asia Pacific Gateway and Corridor Initiative and through capacity improvements and investment during the recent boom. Some of the planned improvements have now been delayed; however, port capacity remains ahead of mine production capacity and demand.
Since the last in-depth review, Canada has made further efforts to ensure coal mining takes place in an environmentally acceptable manner. Canadian mining companies prioritise environmental management, applying international best practices for rehabilitation and reclamation. The federal government should ensure that high standards of environmental regulation and mining operations are maintained. New mines are under development; environmental safety therefore remains a concern for citizens and industry and the government should ensure that the streamlining of regulatory approvals is not happening at the expense of environmental protection.
Thermal coal use in power generation is on the decline as the country is further decarbonising its already low-carbon electricity mix. Among IEA member countries, Canada has taken the lead in clean coal technology, with federal regulations effectively prohibiting the construction of new coal-fired generation without CCS (and phasing out existing traditional coal-fired units). Efforts to support R&D in clean energy are made at the provincial and federal levels.
© O
EC
D/IE
A, 2
016
7. Coal
167
Ontario became the first jurisdiction in the world to have phased out coal use in power generation in 2014. Since January 2012, Manitoba imposes a tax on coal emissions (Emissions Tax on Coal and Petroleum Coke Act) offers capital support for coal users to convert to cleaner energy; and provides support for developing biomass as an alternative to coal.
In 2012, new federal regulations under the Canadian Environmental Protection Act introduced an emission performance standard applicable to new coal-fired electricity generating units and to old ones that have reached the end of their economic life. The performance standard of 420 tCO2 per gigawatt hour, equivalent to the performance of a gas-fired power plant, will come into force on 1 July 2015.
While some older plants will be decommissioned or converted to biomass or natural gas, the future of coal use in power generation will depend on the commercial availability of CCS in Canada, notably with regard to large installed coal-fired capacity in Alberta and Saskatchewan. In the absence of widespread adoption of CCS retrofits at existing coal-fired power plants, natural gas-fired generation is expected to increase as traditional coal-fired generating capacity is phased out under federal regulations.
Canada is among the world leaders in the research, development and demonstration of CCS and has a large CO2 storage potential. Canada hosts four large-scale integrated CCS demonstration projects that are either operational or under construction, including one in which CO2 is captured in the US and stored in Canada. Canada, the Saskatchewan government and SaskPower are to be commended for the results of the Boundary Dam power plant, which is the first large-scale demonstration of post-combustion CO2 capture applied to a coal-fired power facility in the world. It is hoped that it will provide the confidence for future commercial deployment of CCS in Canada and around the world. Canada has an opportunity to lead global efforts and should build on these initiatives for the future.
In Canada, CCS application hinges on the ability to sell captured CO2 for enhanced oil recovery (EOR) or to receive credits through provincial carbon pricing systems. Without EOR opportunities, strong carbon pricing mechanisms, or regulations that are even more stringent than the federal coal-fired electricity regulations, the outlook for coal-fired generation equipped with CCS is dim. The business case for CCS should improve, however, with cost reductions based on lessons learned from current demonstration projects and the continued development of second- and third-generation technologies.
RECOMMENDATIONS
The government of Canada should:
o Maintain and expand the country’s leadership in global efforts to demonstrate and deploy large-scale CCS technology in Canada for clean coal technologies and industrial applications.
o Continue to expand transportation capacities, e.g. rail and port facilities, for coal destined for exports to world markets, notably through the implementation of the Asia Pacific Gateway Corridor Initiative (APGCI).
o Continue to ensure mining operations are regulated and managed in an environmentally acceptable manner.
© O
EC
D/IE
A, 2
016
7. Coal
168
References BGR (Bundesanstalt für Geowissenschaften und Rohstoffe), (2014), Energy Study 2014: Reserves, Resources and Availability of Energy, Hannover, December.
CEA (Canadian Electricity Association), (2014), Canada’s electricity industry.
Department of Finance (2015), Harper Government Announces New Measures to Support Canadian Mining, News, 1 March, at: www.fin.gc.ca/n15/15-021-eng.asp (accessed on 3 March 2015).
IEA (International Energy Agency), (2015a), Coal Information, www.iea.org/statistics, OECD/IEA, Paris.
IEA (2015b), Medium-Term Coal Market Report, OECD/IEA, Paris.
IEA (2015c), Energy Balance of OECD Countries, www.iea.org/statistics, OECD/IEA, Paris.
NRCan (2014a), Annual Coal Review 2013, 2015.
NRCan (2014b) Energy Markets Fact Book 2014-2015.
OECD (2013), Inventory of Estimated Budgetary Support and Tax Expenditures for Fossil Fuels, Paris.
Office of the Auditor General of Canada (2012), Federal Support to the Fossil Fuel Sector, 2012 Fall Report of the Commissioner of the Environment and Sustainable Development.
Government of Canada (2015), Canada Gazette, Regulation’s Regulatory Impact Analysis Statement, at: www.gazette.gc.ca/rp-pr/p2/2012/2012-09-12/html/sor-dors167-eng.html.
© O
EC
D/IE
A, 2
016
8. Electricity
169
8. ELECTRICITY
Key data (2013)
Total electricity generation: 651.8 TWh, +10.6% since 2003
Electricity generation mix: hydro 60.1%, nuclear 15.8%, natural gas 10.3%, coal 10%, wind 1.8%, oil 1.2%, biofuels and waste 0.8%, solar 0.1%
Installed capacity: 132.6 GW
Peak load: 53.9 GW
Electricity consumption: 514.4 TWh (industry 35.1%, residential 30.6%, commercial and other services 27.7%, energy sector 5.7%, transport 0.9%)
OVERVIEW
Canada has a low-carbon electricity mix thanks to the strong role of hydro (60.1%) and nuclear power (15.8%). In 2013, Canada was the world’s second-largest hydropower generator behind China. The country has vast natural resource potential as a source of low-carbon electricity and flexibility in North American power markets, for both domestic consumption and exports to the United States (US).
Canada does not have one common electricity market. The Canadian electricity sector is driven by the different energy policies of the provinces and territories. There are large differences among the provinces and territories in terms of electricity mix, resource management and regulatory models adopted in the provincial electricity markets.
Climate change and energy policies of the federal and provincial governments aim to further decarbonise the power system. The share of natural gas and variable renewable energy resources is set to grow and partly replace the use of coal which is expected to be phased out in the medium term. At the same time, public utilities in the large provinces have substantially invested in large-scale demand-side management (DSM) programmes and the roll-out of smart meters and grids.
Canada is going through the modernisation of its power system with rising investment needs in the power industry, as many assets are nearing the end of their lifetime and must be replaced in coming decades, including nuclear assets.
The Canadian electricity system is strongly integrated with the US interconnected systems and power trade follows a north-south pattern. By contrast, there are far fewer east-west interties between the electricity transmission networks within Canada, largely as a result of geography and the uneven distribution of the population. In response to higher electricity cost, security of supply considerations and changing electricity mixes, some provinces are exploring options to increase the interconnectivity across Canada through interprovincial ties.
© O
EC
D/IE
A, 2
016
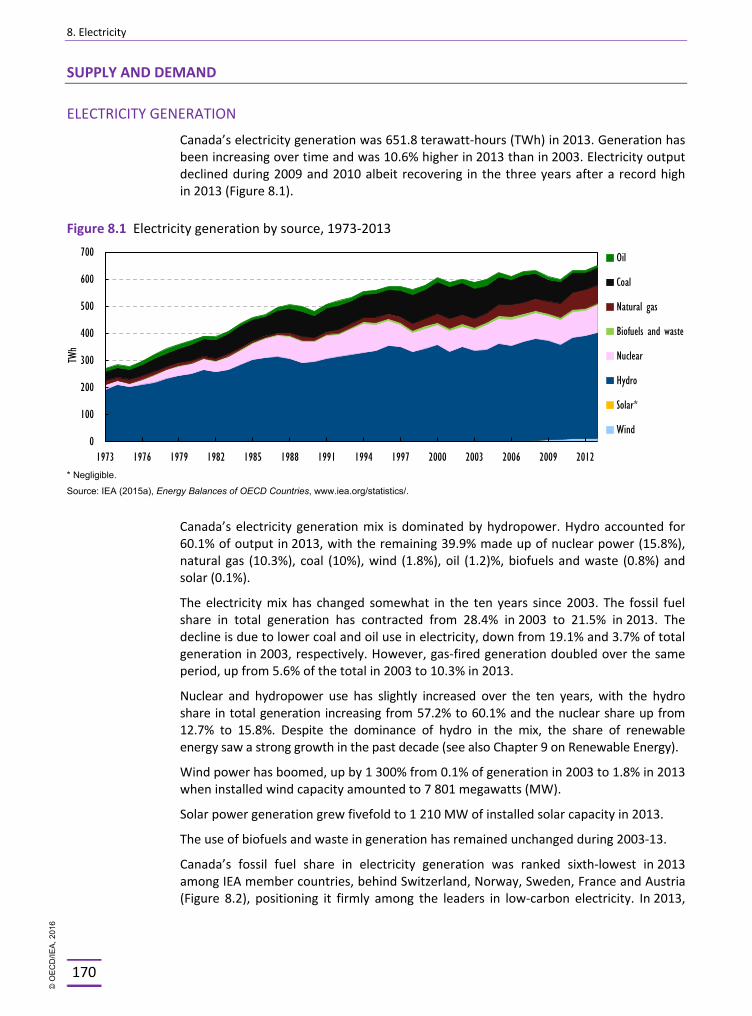
8. Electricity
170
SUPPLY AND DEMAND
ELECTRICITY GENERATION
Canada’s electricity generation was 651.8 terawatt-hours (TWh) in 2013. Generation has been increasing over time and was 10.6% higher in 2013 than in 2003. Electricity output declined during 2009 and 2010 albeit recovering in the three years after a record high in 2013 (Figure 8.1).
Figure 8.1 Electricity generation by source, 1973-2013
* Negligible.
Source: IEA (2015a), Energy Balances of OECD Countries, www.iea.org/statistics/.
Canada’s electricity generation mix is dominated by hydropower. Hydro accounted for 60.1% of output in 2013, with the remaining 39.9% made up of nuclear power (15.8%), natural gas (10.3%), coal (10%), wind (1.8%), oil (1.2)%, biofuels and waste (0.8%) and solar (0.1%).
The electricity mix has changed somewhat in the ten years since 2003. The fossil fuel share in total generation has contracted from 28.4% in 2003 to 21.5% in 2013. The decline is due to lower coal and oil use in electricity, down from 19.1% and 3.7% of total generation in 2003, respectively. However, gas-fired generation doubled over the same period, up from 5.6% of the total in 2003 to 10.3% in 2013.
Nuclear and hydropower use has slightly increased over the ten years, with the hydro share in total generation increasing from 57.2% to 60.1% and the nuclear share up from 12.7% to 15.8%. Despite the dominance of hydro in the mix, the share of renewable energy saw a strong growth in the past decade (see also Chapter 9 on Renewable Energy).
Wind power has boomed, up by 1 300% from 0.1% of generation in 2003 to 1.8% in 2013 when installed wind capacity amounted to 7 801 megawatts (MW).
Solar power generation grew fivefold to 1 210 MW of installed solar capacity in 2013.
The use of biofuels and waste in generation has remained unchanged during 2003-13.
Canada’s fossil fuel share in electricity generation was ranked sixth-lowest in 2013 among IEA member countries, behind Switzerland, Norway, Sweden, France and Austria (Figure 8.2), positioning it firmly among the leaders in low-carbon electricity. In 2013,
0
100
200
300
400
500
600
700
1973 1976 1979 1982 1985 1988 1991 1994 1997 2000 2003 2006 2009 2012
TWh
Oil
Coal
Natural gas
Biofuels and waste
Nuclear
Hydro
Solar*
Wind
© O
EC
D/IE
A, 2
016
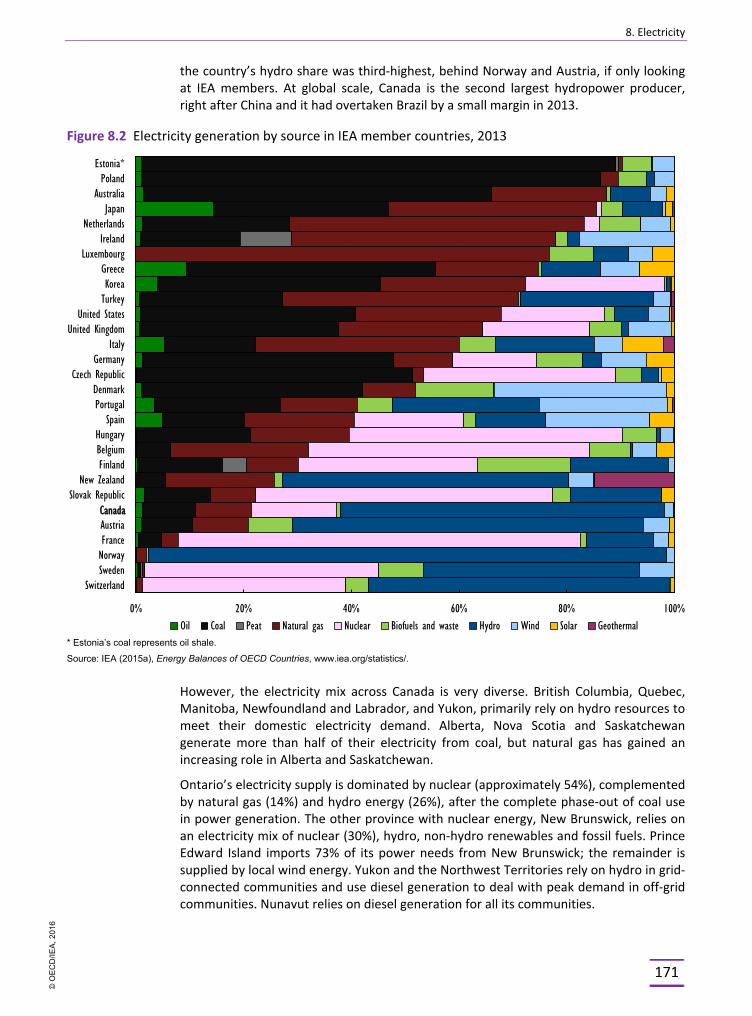
8. Electricity
171
the country’s hydro share was third-highest, behind Norway and Austria, if only looking at IEA members. At global scale, Canada is the second largest hydropower producer, right after China and it had overtaken Brazil by a small margin in 2013.
Figure 8.2 Electricity generation by source in IEA member countries, 2013
* Estonia’s coal represents oil shale.
Source: IEA (2015a), Energy Balances of OECD Countries, www.iea.org/statistics/.
However, the electricity mix across Canada is very diverse. British Columbia, Quebec, Manitoba, Newfoundland and Labrador, and Yukon, primarily rely on hydro resources to meet their domestic electricity demand. Alberta, Nova Scotia and Saskatchewan generate more than half of their electricity from coal, but natural gas has gained an increasing role in Alberta and Saskatchewan.
Ontario’s electricity supply is dominated by nuclear (approximately 54%), complemented by natural gas (14%) and hydro energy (26%), after the complete phase-out of coal use in power generation. The other province with nuclear energy, New Brunswick, relies on an electricity mix of nuclear (30%), hydro, non-hydro renewables and fossil fuels. Prince Edward Island imports 73% of its power needs from New Brunswick; the remainder is supplied by local wind energy. Yukon and the Northwest Territories rely on hydro in grid-connected communities and use diesel generation to deal with peak demand in off-grid communities. Nunavut relies on diesel generation for all its communities.
0% 20% 40% 60% 80% 100%
SwitzerlandSwedenNorwayFranceAustriaCanada
Slovak RepublicNew Zealand
FinlandBelgiumHungary
SpainPortugalDenmark
Czech RepublicGermany
ItalyUnited Kingdom
United StatesTurkeyKoreaGreece
LuxembourgIreland
NetherlandsJapan
AustraliaPoland
Estonia*
Oil Coal Peat Natural gas Nuclear Biofuels and waste Hydro Wind Solar Geothermal
Canada
© O
EC
D/IE
A, 2
016
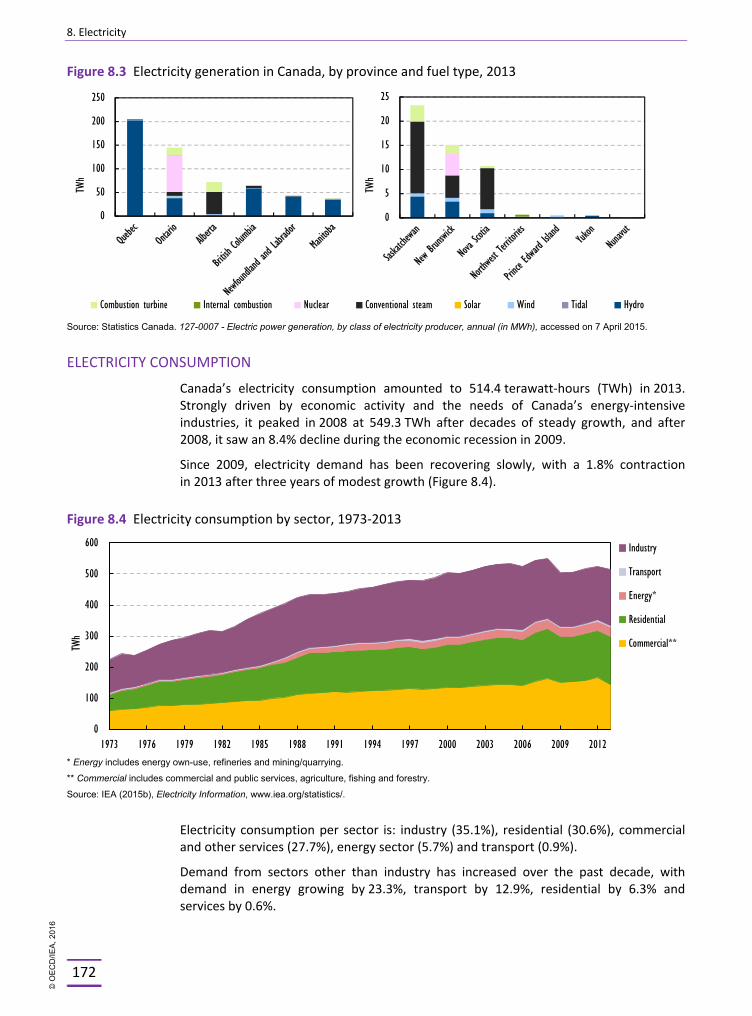
8. Electricity
172
Figure 8.3 Electricity generation in Canada, by province and fuel type, 2013
Source: Statistics Canada. 127-0007 - Electric power generation, by class of electricity producer, annual (in MWh), accessed on 7 April 2015.
ELECTRICITY CONSUMPTION
Canada’s electricity consumption amounted to 514.4 terawatt-hours (TWh) in 2013. Strongly driven by economic activity and the needs of Canada’s energy-intensive industries, it peaked in 2008 at 549.3 TWh after decades of steady growth, and after 2008, it saw an 8.4% decline during the economic recession in 2009.
Since 2009, electricity demand has been recovering slowly, with a 1.8% contraction in 2013 after three years of modest growth (Figure 8.4).
Figure 8.4 Electricity consumption by sector, 1973-2013
* Energy includes energy own-use, refineries and mining/quarrying.
** Commercial includes commercial and public services, agriculture, fishing and forestry.
Source: IEA (2015b), Electricity Information, www.iea.org/statistics/.
Electricity consumption per sector is: industry (35.1%), residential (30.6%), commercial and other services (27.7%), energy sector (5.7%) and transport (0.9%).
Demand from sectors other than industry has increased over the past decade, with demand in energy growing by 23.3%, transport by 12.9%, residential by 6.3% and services by 0.6%.
0
100
200
300
400
500
600
1973 1976 1979 1982 1985 1988 1991 1994 1997 2000 2003 2006 2009 2012
TWh
Industry
Transport
Energy*
Residential
Commercial**
0
50
100
150
200
250 TW
h
Combustion turbine Internal combustion Nuclear Conventional steam Solar Wind Tidal Hydro
0
5
10
15
20
25
TWh
© O
EC
D/IE
A, 2
016
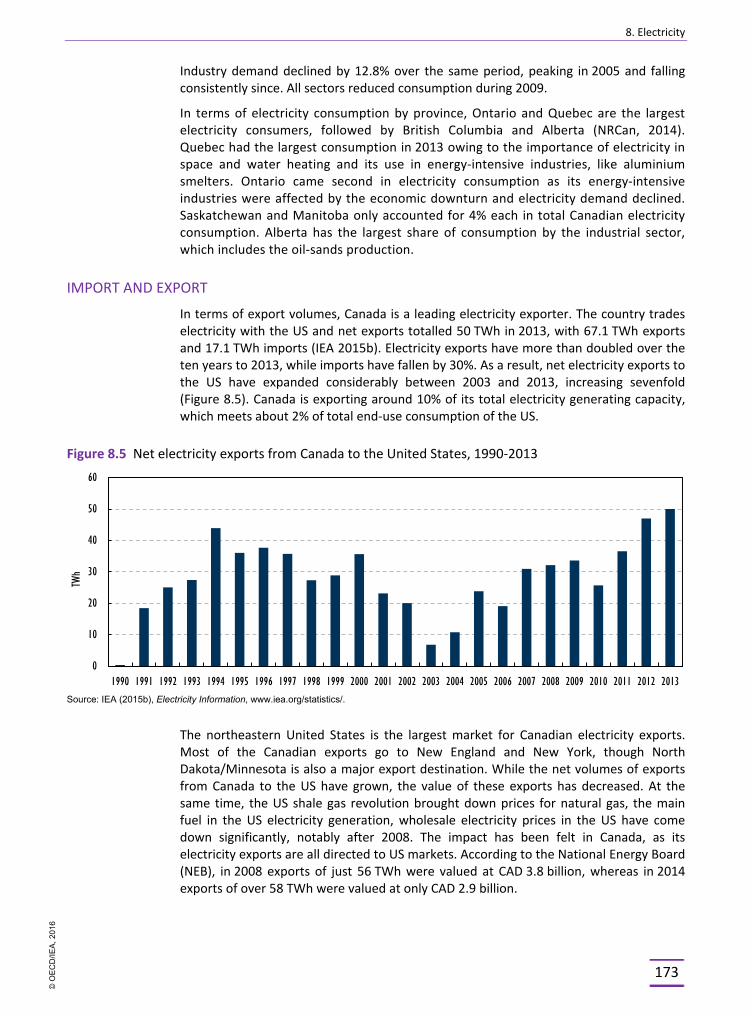
8. Electricity
173
Industry demand declined by 12.8% over the same period, peaking in 2005 and falling consistently since. All sectors reduced consumption during 2009.
In terms of electricity consumption by province, Ontario and Quebec are the largest electricity consumers, followed by British Columbia and Alberta (NRCan, 2014). Quebec had the largest consumption in 2013 owing to the importance of electricity in space and water heating and its use in energy-intensive industries, like aluminium smelters. Ontario came second in electricity consumption as its energy-intensive industries were affected by the economic downturn and electricity demand declined. Saskatchewan and Manitoba only accounted for 4% each in total Canadian electricity consumption. Alberta has the largest share of consumption by the industrial sector, which includes the oil-sands production.
IMPORT AND EXPORT
In terms of export volumes, Canada is a leading electricity exporter. The country trades electricity with the US and net exports totalled 50 TWh in 2013, with 67.1 TWh exports and 17.1 TWh imports (IEA 2015b). Electricity exports have more than doubled over the ten years to 2013, while imports have fallen by 30%. As a result, net electricity exports to the US have expanded considerably between 2003 and 2013, increasing sevenfold (Figure 8.5). Canada is exporting around 10% of its total electricity generating capacity, which meets about 2% of total end-use consumption of the US.
Figure 8.5 Net electricity exports from Canada to the United States, 1990-2013
Source: IEA (2015b), Electricity Information, www.iea.org/statistics/.
The northeastern United States is the largest market for Canadian electricity exports. Most of the Canadian exports go to New England and New York, though North Dakota/Minnesota is also a major export destination. While the net volumes of exports from Canada to the US have grown, the value of these exports has decreased. At the same time, the US shale gas revolution brought down prices for natural gas, the main fuel in the US electricity generation, wholesale electricity prices in the US have come down significantly, notably after 2008. The impact has been felt in Canada, as its electricity exports are all directed to US markets. According to the National Energy Board (NEB), in 2008 exports of just 56 TWh were valued at CAD 3.8 billion, whereas in 2014 exports of over 58 TWh were valued at only CAD 2.9 billion.
0
10
20
30
40
50
60
1990 1991 1992 1993 1994 1995 1996 1997 1998 1999 2000 2001 2002 2003 2004 2005 2006 2007 2008 2009 2010 2011 2012 2013
TWh
© O
EC
D/IE
A, 2
016
8. Electricity
174
Imports and exports strongly depend on industry demand in Canada, supply/demand balance, hydroelectric conditions and the electricity price differentials between Canada and the US. In 2014, most of Canada’s provinces with interconnections to the US have been net exporters of electricity to the US. By volume, British Columbia had the largest imports, while Quebec is the largest exporter. In 2014, Alberta, British Columbia and Saskatchewan were all net importers (see Figure 8.6).
Recently, new long-term export agreements were signed for more than 20 years, which benefit from the designation of large-scale hydropower as renewable energy in several US states. Vermont’s two largest utilities, Central Vermont Public Services and Green Mountain Power, signed a 26-year contract with Hydro Quebec, for purchases of up to 225 MW of hydroelectricity covering the period 2012 to 2038 Manitoba Hydro has signed numerous long-term power sale agreements with US purchasers such as Wisconsin Public Service, Minnesota Power, Northern States Power and Great River Energy. The agreements range in quantities from 100 to 350 MW and terms of 5 to 15 years. In 2014 Manitoba Hydro also signed two major power sales with Wisconsin Public Service: the first for 108 MW of firm power from 2016 to 2021 and the second for 308 MW of firm power for up to 10 years. Certain agreements require an additional interconnection between Manitoba and Minnesota.
In June 2013, five New England States (Connecticut, Maine, Massachusetts, Rhode Island and Vermont) launched a regional initiative to expand imports of large hydro into the region, and to enable Canadian hydropower to count towards their renewable energy objectives. In 2013, Connecticut enacted Bill 1138 which allows large-scale hydro to court towards the renewable portfolio standards (RPS) target in certain circumstances.
In early 2014, Maine, Rhode Island and Vermont expressed their support for Canadian Hydropower imports in their “State of the State” addresses. Rhode Island passed legislation in 2014 (Affordable Clean Energy Security Act) that allows participation in regional or multi-state solicitations for the development and construction of transmission projects to bring large-scale hydroelectricity to New England.
REGULATORY OVERSIGHT Under the Canadian Constitution, provincial and territorial governments have jurisdiction over the ownership and management of energy resources within their boundaries. Each province/territory oversees its electricity market structure, operational system and the electric power generation, transmission and distribution.
Transmission planning is a provincial responsibility, but international power lines fall within the federal government’s remit. The federal government also has responsibility for energy resources on federal Crown land, offshore and north of 60o.
The federal government has regulatory oversight of nuclear safety and security and uranium, through the Canadian Nuclear Safety Commission, and of international electricity trade and international power lines as well as any designated interprovincial power lines, through the National Energy Board (NEB).
© O
EC
D/IE
A, 2
016
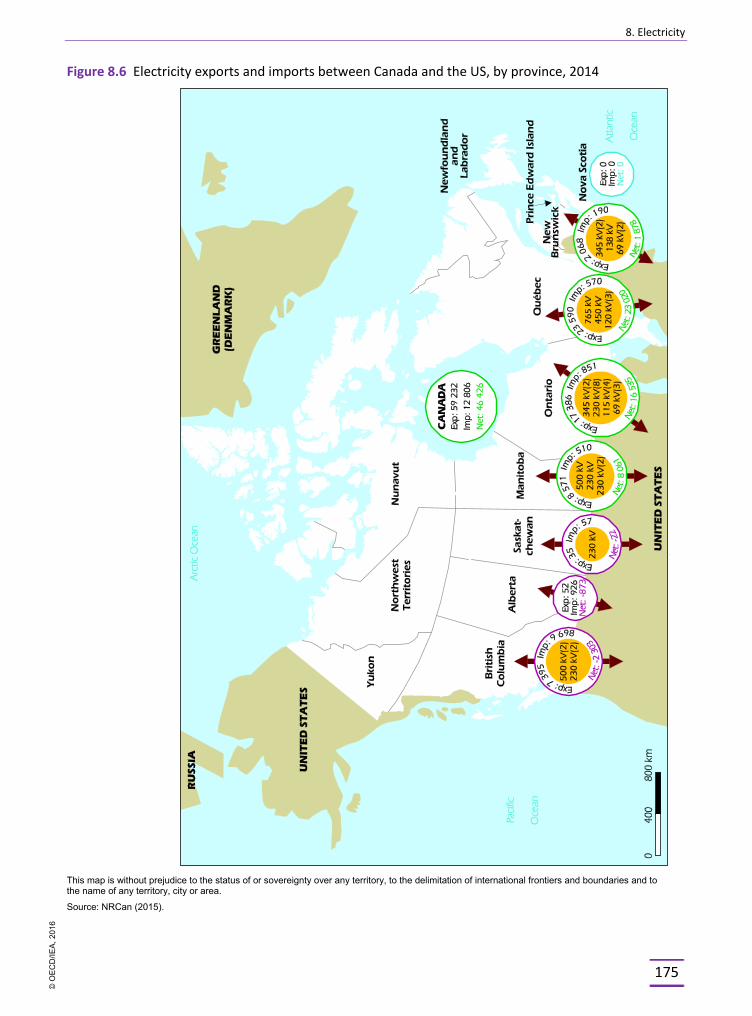
8. Electricity
175
Figure 8.6 Electricity exports and imports between Canada and the US, by province, 2014
This map is without prejudice to the status of or sovereignty over any territory, to the delimitation of international frontiers and boundaries and to the name of any territory, city or area.
Source: NRCan (2015).
© O
EC
D/IE
A, 2
016
8. Electricity
176
Environmental assessments (EAs) and environmental protection responsibilities are shared between the federal, provincial and territorial governments and jurisdictions. The Canadian Environmental Assessment Act 2012 (CEAA 2012) streamlines the EA process by avoiding duplication and consolidating responsibility for EAs to three agencies instead of 40 previously. These three agencies are the Canadian Environmental Assessment Agency (CEA Agency), the Canadian Nuclear Safety Commission (CNSC), or the National Energy Board (NEB). Federal environmental assessments on major projects provide for clear timelines for EAs and permitting, including 12 months for environmental assessments conducted by the Agency, 24 months for review panels, and 18 months for reviews under the NEB. Legally binding timelines have also been established for key regulatory permitting processes under the Fisheries Act, the Navigation Protection Act, the Species at Risk Act and the Canadian Environmental Protection Act (CEPA 1999). Timelines do not include time required by the proponent to provide information. New measures in the Canadian Environmental Assessment Act 2012 (Bill C-38, 2012) also enabled substitution and equivalency of federal EA processes with provincial processes where certain conditions are met.
NATIONAL ENERGY BOARD
Canada’s federal energy and safety regulator, the National Energy Board (NEB), regulates electricity exports and approves the construction and operation of international power lines used for import and export of electricity operating at voltages of 100 kilovolts (kV) and above. No existing interprovincial power line falls under NEB jurisdiction. NEB has similar roles in the oil and gas sectors. The NEB also conducts the EAs during its review of applications for facilities and activities under its jurisdiction. It has to meet the evolving public interests and concerns regarding environmental impacts for regulated facilities, as well as increasing consideration for land-owner and Aboriginal rights. Approximately 95% of the NEB’s expenditures are recovered from payments made by the companies it regulates, e.g. through the tolls and tariffs paid by gas pipeline operators and charges to electricity exporters. Located in Calgary (Alberta), the NEB is a court of record and has certain powers of a superior court of record, including attendance, swearing and examination of witnesses, the production and inspection of documents, the enforcement of its orders and the inspection of property. In an advisory function, the NEB also keeps under review and analyses matters related to its jurisdiction and provides information and advice on aspects of energy supply, transmission and disposition in and outside Canada.
PUBLIC UTILITY COMMISSIONS
Provincial governments and authorities provide electric utilities under their jurisdiction both policy guidance and policy objectives to fulfil federal responsibilities, to set policy direction with respect to electricity market structure, pricing and utility regulation.
Provincial governments and authorities hold significant power in determining both how the current electric system is operated as well as how the future system is planned and developed. They exercise their jurisdiction through provincial Crown utilities and regulatory agencies.
Depending on the degree of deregulation and competition and the market design adopted in each province, there are a large variety of regulatory authorities in the provinces with different regulatory competences and remits such as the following:
§ Alberta: Alberta Utilities Commission
§ British Columbia: British Columbia Utilities Commission
© O
EC
D/IE
A, 2
016
8. Electricity
177
§ Manitoba: Province of Manitoba and Public Utilities Board
§ New Brunswick: Province of New Brunswick and Energy and Utilities Board
§ Newfoundland and Labrador: Commissioners of Public Utilities
§ Northwest Territories: Public Utilities Board
§ Nova Scotia: Utility Review Board
§ Nunavut: Utility Rates Review Council
§ Ontario: Ontario Energy Board
§ Prince Edward Island: Island Regulatory and Appeals Commission of PEI
§ Quebec: Régie de l’énergie
§ Saskatchewan: Province of Saskatchewan Rate Review Panel
§ Yukon: Yukon Utilities Board.
RELIABILITY ENTITIES
Power reliability is implemented on a North America-wide basis. Canadian participation is formally integrated in the founding documents of the North American Electric Reliability Corporation (NERC), which is recognised as a standards-setting body by the NEB and provincial authorities in Canada (except Newfoundland and Labrador, Prince Edward Island, and the three Northern Territories), and by the Federal Energy Regulatory Commission (FERC) in the US. NERC is responsible for assessing reliability for the winter, summer and longer-term and for developing reliability standards which are applied in Canada and the US, including standards pertaining to emergency management. NERC and FERC enforce standards in the US.
All Canadian provinces have legislation granting authority to one or more provincial authorities to be responsible for electricity system reliability. While not all jurisdictions have the necessary legal / network structure to name an Electric Reliability Organisation (ERO), the NEB and all provinces (except the Maritime Provinces, and the three northern territories) have recognised NERC as an electric reliability standards-setting organisation.
Recognition of NERC, as the ERO, by a province is done either through legislation, regulation, orders in council, memoranda of understanding (MOU), or other agreements. The provinces of Ontario, Quebec, Nova Scotia, New Brunswick, Alberta, Saskatchewan as well as the NEB have such memoranda of understanding or agreements with NERC. While there are currently no MOUs in effect with British Columbia and Manitoba, both provinces have adopted NERC Reliability Standards as mandatory and enforceable, and work closely with the ERO.
Each Canadian jurisdiction with mandatory reliability standards has put in place processes to consider the adoption or modifications of NERC Standards. NERC standards, or modified NERC standards, are mandatory and enforceable, or are in the process of becoming mandatory and enforceable in all provinces except Prince Edward Island, and Newfoundland and Labrador. The New Brunswick system operator (NBSO) is in charge of reliability questions and is the Maritime area’s Reliability Coordinator. Likewise, NERC standards are mandatory on NEB-regulated international lines. Each Canadian jurisdiction with NERC standards has measures to enforce compliance. Authorities can order corrective actions, impose reporting requirement, and in some jurisdictions
© O
EC
D/IE
A, 2
016
8. Electricity
178
impose financial penalties. In addition, NEB is a non-voting Member of the Member Representative Committee (MRC) of the NERC and it regularly attends the MRC meetings on electric reliability within the scope of NEB competences.
CO-OPERATION STRUCTURES
Inter-provincial electricity, reliability and renewable energy matters are discussed between the federal government, provinces and territories in the Energy and Mines Ministers Conference (EMMC) and its Federal-Provincial-Territorial Electricity Working Group (FPT EWG). This is also known as Tri-lateral Working Group where the US Federal Energy Regulatory Commission (FERC), the North American Electricity Reliability Corporation (NERC), Canadian federal and provincial authorities meet regularly through teleconferences and face-to-face meetings to discuss electricity reliability matters. Occasionally, Comision Reguladora de Energia (CRE) from Mexico also participates in the meetings. Recently, a Monitoring and Enforcement Sub-Group (MESG) has been formed that includes Canadian utility industries and regulators. The MESG provides expertise to the FPT working group about the status of electricity reliability in Canada. NRCan is the co-chair of the FPT EWG which is also a forum for addressing Canada-US and North American electricity reliability matters, and supporting NERC’s role as the Electric Reliability Organisation within North America.
In addition, Canadian authorities interact bilaterally with the US regulator (FERC) and through the Clean Energy Dialogue (less through the Regulatory Cooperation Council which focuses on energy efficiency). The NEB is involved in trilateral meetings with the US and Mexico on reliability questions.
There is strong co-ordination across the industry through the Canadian Electricity Association (CEA) and the CAMPUT (Canadian Association of Members of Public Utility Tribunals).
In 2009, the Atlantic Energy Gateway (AEG) initiative set up a collaborative approach among the Atlantic Canada Opportunities Agency, Natural Resources Canada, the Atlantic Provinces, regional power utilities and electricity system operators. The first work plan was directed at eight modelling and research studies, grouped within two general areas: Power System Planning and Operations Modeling; and Clean Energy Industrial and Economic Development.
Under the Clean Energy Dialogue, the federal government seeks increased collaboration with the United States on matters of shared interest concerning the electric power grid and technologies. The Clean Energy Dialogue Action Plan II (2012-2014), the Electricity Grid Working Group (EGWG) identified four priority themes: offshore renewable energy technologies deployment, smart grid technologies, the potential of power storage technologies and electricity trade. The EGWG has undertaken a series of projects, such as studies on an international overview of marine renewable energy regulatory frameworks, smart grids and distributed energy storage.
MAJOR PROJECTS
The federal government supports the streamlining of federal regulatory approvals, including in the electricity sector for the construction of new or the upgrading of electricity generating facilities, transmission lines and related investment, i.e. nuclear waste repositories (Table 8.1).
© O
EC
D/IE
A, 2
016
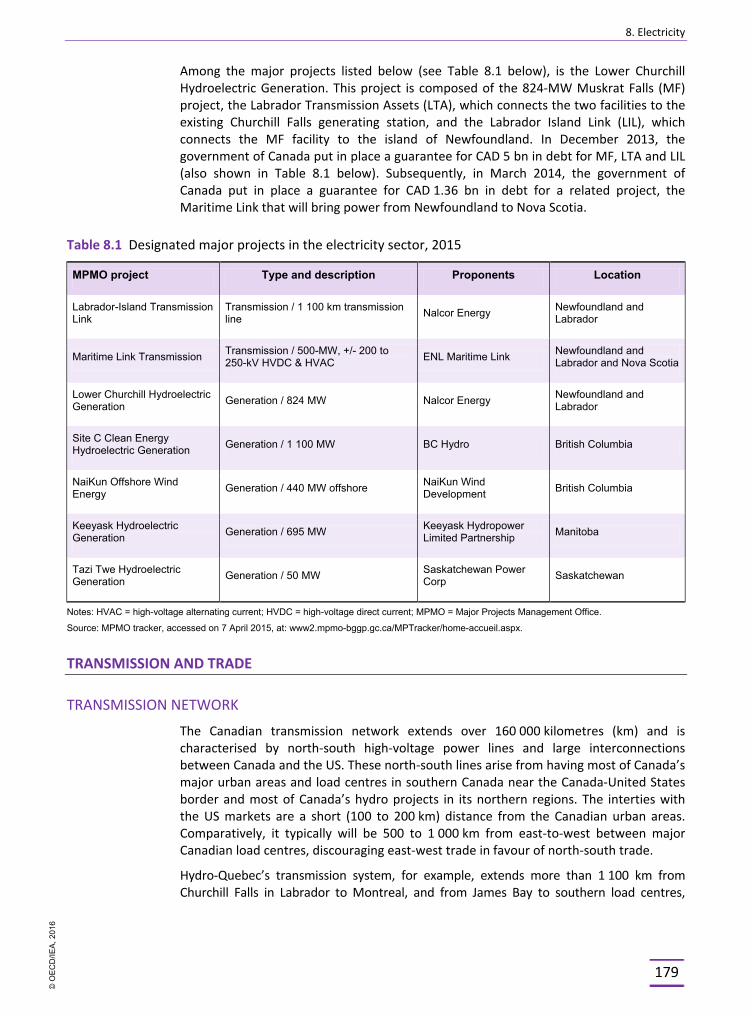
8. Electricity
179
Among the major projects listed below (see Table 8.1 below), is the Lower Churchill Hydroelectric Generation. This project is composed of the 824-MW Muskrat Falls (MF) project, the Labrador Transmission Assets (LTA), which connects the two facilities to the existing Churchill Falls generating station, and the Labrador Island Link (LIL), which connects the MF facility to the island of Newfoundland. In December 2013, the government of Canada put in place a guarantee for CAD 5 bn in debt for MF, LTA and LIL (also shown in Table 8.1 below). Subsequently, in March 2014, the government of Canada put in place a guarantee for CAD 1.36 bn in debt for a related project, the Maritime Link that will bring power from Newfoundland to Nova Scotia.
Table 8.1 Designated major projects in the electricity sector, 2015
MPMO project Type and description Proponents Location
Labrador-Island Transmission Link
Transmission / 1 100 km transmission line Nalcor Energy Newfoundland and
Labrador
Maritime Link Transmission Transmission / 500-MW, +/- 200 to 250-kV HVDC & HVAC ENL Maritime Link Newfoundland and
Labrador and Nova Scotia
Lower Churchill Hydroelectric Generation Generation / 824 MW Nalcor Energy Newfoundland and
Labrador
Site C Clean Energy Hydroelectric Generation Generation / 1 100 MW BC Hydro British Columbia
NaiKun Offshore Wind Energy Generation / 440 MW offshore NaiKun Wind
Development British Columbia
Keeyask Hydroelectric Generation Generation / 695 MW Keeyask Hydropower
Limited Partnership Manitoba
Tazi Twe Hydroelectric Generation Generation / 50 MW Saskatchewan Power
Corp Saskatchewan
Notes: HVAC = high-voltage alternating current; HVDC = high-voltage direct current; MPMO = Major Projects Management Office.
Source: MPMO tracker, accessed on 7 April 2015, at: www2.mpmo-bggp.gc.ca/MPTracker/home-accueil.aspx.
TRANSMISSION AND TRADE
TRANSMISSION NETWORK
The Canadian transmission network extends over 160 000 kilometres (km) and is characterised by north-south high-voltage power lines and large interconnections between Canada and the US. These north-south lines arise from having most of Canada’s major urban areas and load centres in southern Canada near the Canada-United States border and most of Canada’s hydro projects in its northern regions. The interties with the US markets are a short (100 to 200 km) distance from the Canadian urban areas. Comparatively, it typically will be 500 to 1 000 km from east-to-west between major Canadian load centres, discouraging east-west trade in favour of north-south trade.
Hydro-Quebec’s transmission system, for example, extends more than 1 100 km from Churchill Falls in Labrador to Montreal, and from James Bay to southern load centres,
© O
EC
D/IE
A, 2
016

8. Electricity
180
which include US markets. The high-voltage lines carry electricity at voltages above 50 kilovolts (kV) to move electricity in bulk over long distances. Because of Canada’s vast geographic size, its electricity systems require different types of high-voltage lines (typically 115 kv, 230 kv, 500 kv and 735 kv levels). The electricity network of Canada remains fragmented, with fewer power lines interconnecting the provinces and territories (Figure 8.7). There are transmission bottlenecks within Alberta, British Columbia and the three Maritime Provinces, Nova Scotia, Prince Edward Island and New Brunswick.
Transmission investment is required to accommodate greater load, more generation from renewable sources, to facilitate higher interprovincial and international trade and exports to the US, and to ensure reliability. In many provinces, investment in transmission is on the rise and, in response to higher electricity costs, new projects are being developed in Saskatchewan, Manitoba, Alberta and British Columbia. Alberta and Ontario have launched competitive processes to develop new transmission projects.
In Nova Scotia, as part of the Lower Churchill Project, Emera Inc. will build the Maritime Link to deliver a portion of the electricity generated by the 824 MW Muskrat Falls Generating Station in Labrador through Cape Ray on the island of Newfoundland to an area near Point Aconi in Cape Breton. The Maritime Link is a proposed new 500 MW, 200 to 250 kv high-voltage direct current (HVDC) transmission system, which will include two 180 km subsea cables across the Cabot Strait, less than 50 km of overland transmission in Nova Scotia and approximately 300 km of overland transmission on the Island of Newfoundland. Under the Major Projects Management Office initiative, the Maritime Link and the Labrador Island Link are designated major projects (see also Table 8.1).
TRANSMISSION ACCESS REGULATION
Canadian utilities must provide reciprocal open transmission access to sell electricity directly to customers in the US at market-based prices. As such, many Canadian transmission providers have filed open access transmission tariffs (OATT) consistent with the US Federal Energy Regulatory Commission's (FERC) Order 888. The OATT defines the rate terms and conditions associated with network transmission service. The tariff and the schedules of fees are usually posted on the website of the independent system operator (ISO) or the open access same-time information system (OASIS) site.
In Canada, one transmission provider is established for each province, so transmission tariff pancaking (the accumulation of transport charges as power moves across different systems) can only occur for transactions crossing many provincial borders. Given the large geographical area of most provinces, cross-jurisdictional transfers of electricity are not as common to date, as north-south interconnections between Canada and the US prevail. In the European Union or in the US, states are on average much smaller than Canadian provinces and rely on cross-border exchanges for security of supply and trade.
A strategy adopted in the US to eliminate transmission tariff pancaking is to put all the transmission providers under the control of a single system operator in the form of a multi-state RTO (regional transmission operator). This creates geographical systems with coverage matching that of larger Canadian provinces. Market participants within an RTO pay only a single transmission tariff, whether they are moving power within a single utility or across several utilities in that region. For trade purposes, Manitoba Hydro participates in the Midwest regional independent system operator (MISO).
© O
EC
D/IE
A, 2
016
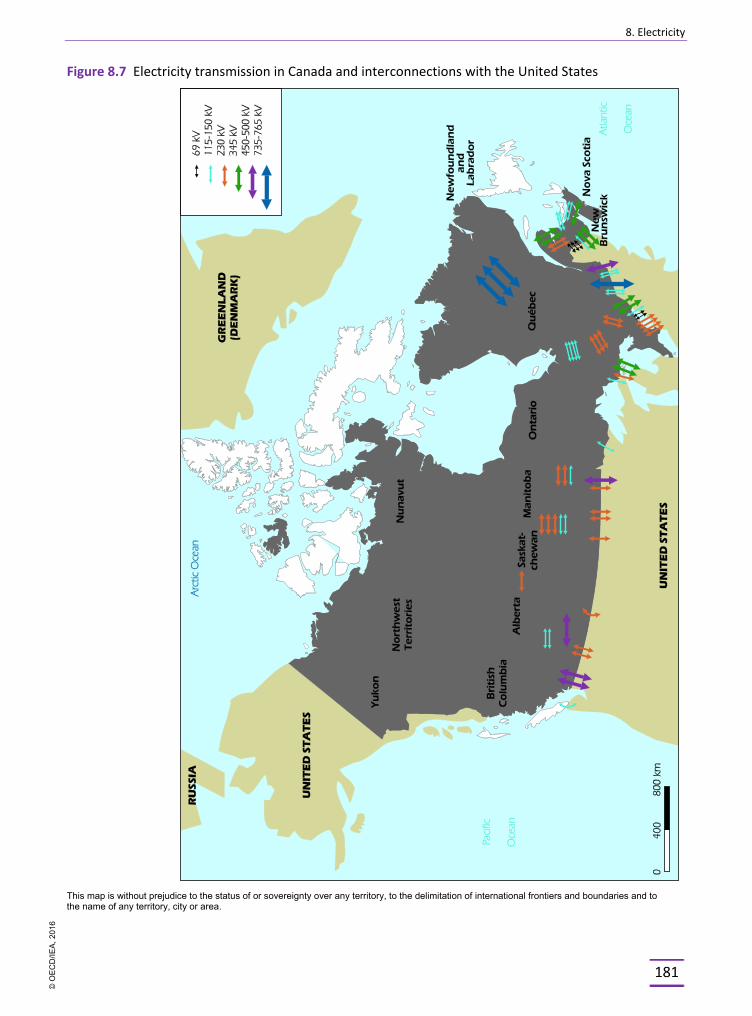
8. Electricity
181
Figure 8.7 Electricity transmission in Canada and interconnections with the United States
This map is without prejudice to the status of or sovereignty over any territory, to the delimitation of international frontiers and boundaries and to the name of any territory, city or area.
© O
EC
D/IE
A, 2
016
8. Electricity
182
Three provinces have transmission service providers that do not have FERC-compatible tariffs: Newfoundland and Labrador, Ontario, and Alberta. The regulated transmission owner in Ontario, Hydro One, filed its own tariff for approval with the Ontario Energy Board. FERC has ruled that the Ontario system provides transmission access equivalent to that in an OATT. Alberta is an energy-only market with no transmission rights, while Newfoundland and Labrador does not sell directly to the US at this time.
In jurisdictions with OATT and without a competitive wholesale market, potential transmission system users can reserve transmission capacity. When a new facility becomes available or when the OATT is first implemented, the transmission owner holds an open season, where all requests are treated as being received at the same time. After the initial allocation, all requests are treated on a first-come, first-served basis. In allocating transmission capacity, requests for firm service have priority over requests for non-firm service, and requests for long-term rights have priority over requests for short-term rights.
New network connections
Transmission planning is under provincial jurisdiction, and as a result the procedure for connecting new capacity to the grid varies from province to province. Although independent power generators have access to the wholesale markets in Quebec, Manitoba, Saskatchewan and Nova Scotia, the ownership and development of the transmission interconnections to provincial grids under open access transmission tariffs has been left to the incumbent utility in the province. New Brunswick Power, a Crown corporation, has taken back the ownership and development of most of the power lines in its respective jurisdictions from New Brunswick system operator (NBSO), which is today in charge of reliability issues as a non-for-profit organisation.
Alberta and Ontario have slightly different arrangements in place. In both provinces, the interconnection process is overseen by the independent system operator (ISO): however, the owners of the transmission or distribution facilities as well as the provincial regulatory board may also have a role in approving or assessing proposed connections to the grid.
Technical interconnection standards are determined by NERC and are a requirement for entities wishing to connect new generation to the Canadian transmission grid. While utilities are subject to NERC rules and reliability standards, these rules must be approved or adopted by the provincial regulators, who may impose stricter standards (often because of more severe climatic conditions in parts of Canada). The process to connect a generator is generally the same across the country. First, the utility, transmission system owner or ISO undertakes a number of studies at the proponent’s expense. This includes an interconnection impact study to evaluate the impact of the proposed interconnection on the reliability of the transmission system and a facilities study to provide a cost estimate of the equipment, engineering, procurement and construction work needed to connect the customer to the grid. A feasibility study to assess the viability of the project may also be required. Afterwards, the proponent signs an agreement with the grid administrator that governs the obligations and requirements of both the administrator and the interconnection customer.
INTERNATIONAL INTERCONNECTIONS
Electricity trade with the US is on the rise with increasing exports from Canada to the US. Canada is well integrated with the US, illustrated by 34 active major cross-border interconnections in 2014.
© O
EC
D/IE
A, 2
016
8. Electricity
183
Canadian electricity systems are part of three major North American interconnected systems or power grids, which form the integrated North American electricity system. Alberta and British Columbia are part of the Western Interconnect; Saskatchewan, Manitoba, Ontario, New Brunswick, Prince Edward Island, and Nova Scotia are part of the Eastern Interconnect, and Quebec has links to both Western and Eastern Interconnects.
The three territorial systems (Northwest Territories, Nunavut and Yukon) and Newfoundland are isolated from the North American system.
As of April, 2015, eight merchant international power lines are currently proposed and under regulatory review, which, if realised, would increase the overall import-export capacity by around 6 GW:
§ Hertel-New York Interconnection [Champlain Hudson Power Express] (Quebec to New York).
§ Quebec–New Hampshire Interconnection [Northern Pass] (Quebec to New England), a joint venture between New England’s Northeast Utilities and Hydro-Quebec.
§ Manitoba-Minnesota Transmission Project [Great Northern Transmission Line] (Manitoba to Minnesota) is a joint venture between Minnesota Power and Manitoba Hydro to balance hydro and wind power in North Dakota.
§ Clean Power Link (Quebec to Vermont).
§ Lake Erie Connector (Ontario to Pennsylvania).
§ Soule River Hydroelectric Project (Alaska to British Columbia).
§ Green Line Project (New Brunswick to Massachusetts) is a project by Aroostook County, from Maine to greater Boston, Massachusetts and may connect to the New Brunswick grid as well.
§ Houlton Water Company/NB Power Line (New Brunswick to Maine).This line would be financed by the Houlton Water Company, but the asset would belong to NB Power, and would allow Maine to purchase electricity from New Brunswick. The expected capacity and cost of the line are not public.
Since the last review in 2009, the new 230-kV to 300-MW merchant interconnection between Alberta and Montana (Montana Alberta Tie Line, MATL) has come online. MATL could double its capacity to transmit wind power between Montana and Alberta; however, there are some constraints within Alberta’s system to integrate further imports and use variable renewable energies at the present moment.
The listed projects are all linked to a power line proposal in the United States (see project name mentioned in brackets). On the US side, the permitting and licensing regime is different from the Canadian process.
Regulatory process for international power lines in Canada and the United States
In Canada, the NEB regulates the construction, operation and abandonment of international and designated interprovincial power lines under federal jurisdiction. An applicant elects to submit either an application for a permit or a Certification of Public
© O
EC
D/IE
A, 2
016
8. Electricity
184
Convenience and Necessity (certificate) to the NEB, depending on the applicant's preference to be regulated either by its provincial regulator or by the NEB respectively. A permit application can be elevated to a designated certificate process by the Governor in Council (GiC). The NEB (in evaluating whether or not to make a recommendation to GiC to elevate a permit application) takes into account all considerations that appear relevant, including the environmental impacts and the effect of the international power line on other provinces.
In addition, if a company intending to construct a power line also intends to export electricity as a commercial transaction, it must apply for an export permit or licence from the NEB. For electricity proposed to be exported, the review criteria are: the effect of the exportation on provinces other than the exporting one; and fair market access to the electricity on terms and conditions as favourable as those proposed for export to those who wish to purchase it for consumption in Canada. To date, only the Lake Erie Connector has filed an application with the NEB in May 2015.
In the US, anyone seeking to construct, operate, maintain or connect an electric transmission facility crossing international borders is required to obtain a Presidential Permit, approved by the Department of Energy (DOE). DOE has authority under Executive Order to issue Presidential Permits. In deciding to approve a line, DOE must assess whether the line is “consistent with the public interest” and whether all the environmental impacts of the proposed line and reasonable alternatives have been considered, pursuant to the National Environmental Policy Act, but also the impact of the proposed action on electric reliability, and any other factors that DOE may also consider relevant to the public interest. DOE needs concurrence from the Departments of State and Defense, which both must make “favourable recommendations” on the issuance of the permit.
The Champlain Hudson Power Express was approved for a Presidential Permit in September 2014. Projects 2-5 (Northern Pass, Great Northern, Clean Power Link, and Lake Erie Connector) are at various stages of review by DOE or another agency for a Presidential Permit. The Soule River Hydroelectric Projects is under review by the US Office of Electricity Delivery and Energy Reliability for a Presidential Permit. The other two projects (Green Line, and Houlton Water Company/NB Power) have not yet submitted applications for a Presidential Permit.
In addition to the Presidential Permit, all international power lines will require other federal permits and approvals as necessary. Permitting and approvals for the lines will be informed by their individual Environmental Impact Statements, led by the DOE with potential input from the US Environmental Protection Agency, the US Fish & Wildlife Service, the Army Corps of Engineers, the U.S Coast Guard, the U.S Forest Service, and state environmental and energy regulators.
ELECTRICITY INDUSTRY STRUCTURE
PUBLIC/PRIVATE OWNERSHIP
Canada’s electricity industry is largely characterised by public, i.e. provincial or municipal, ownership in seven of ten provinces and its three territories. Three provinces (Alberta, Nova Scotia and Prince Edward Island) feature private ownership of their utility sector. Eight of ten provinces maintain a single company with vertically integrated
© O
EC
D/IE
A, 2
016
8. Electricity
185
structures. Alberta and Ontario have opted for unbundling of generation and transmission/distribution since deregulation in the 1990s, including the creation of a competitive retail market for all final consumers of electricity. However, Ontario has maintained public ownership of these differing generation/transmission/distribution utility functions, whereas Alberta features private ownership. Both provinces feature private ownership of competitive resellers of electricity to final consumers.
At the distribution/supply level, large cities in Canada have municipally owned utilities, such as Toronto Hydro, Hydro Ottawa and Horizon Utilities in Ontario and EPCOR and ENMAX in Alberta, which are owned respectively by the City of Edmonton and the City of Calgary.
There are a few private industry players, such as Nova Scotia Power, Fortis BC, Newfoundland Power, and Maritime Electric in Prince Edward Island. An increasing number of independent (renewable) power producers can be found in British Columbia, Nova Scotia and Quebec.
WHOLESALE MARKETS
Alberta is the only province to have established a fully competitive electricity wholesale market.
Ontario retains a hybrid model with a regulated and partially open wholesale market structure.
With the exception of Alberta and Ontario, wholesale electricity prices are regulated in all provinces and territories by a quasi-judicial board or commission.
Alberta, British Columbia, Manitoba, New Brunswick, Nova Scotia, Ontario, Quebec and Saskatchewan have established open access to their wholesale electricity markets, an important requirement to meet the FERC rules of competitive and reliable electricity markets, with a view to facilitate power trade with the US.
UNBUNDLING/VERTICAL INTEGRATION
In most provinces, electricity is generated and supplied by vertically integrated electric utilities, the provincial Crown corporations, which are in most cases functionally unbundled. During the 2000s, several provinces had established independent system operators (New Brunswick, British Columbia and Manitoba) and wholesale open access to transmission to meet the requirements under US FERC rules for competitive electricity markets across North America.
However, in recent years, Canada’s provinces are shifting from independent system management. New Brunswick and British Columbia have moved back to a vertical integration. The largest power exporters of Canada − Quebec, Manitoba and British Columbia − have vertically integrated utilities with functionally unbundled transmission and distribution units. Only Alberta, Nova Scotia and Ontario maintain independent system operators to operate both the wholesale market and the grid.
ELECTRICITY MARKETS IN THE PROVINCES AND TERRITORIES
Canada’s provinces and territories have adopted different market and regulatory models, depending on their resource endowment, the size of their electricity consumption and generation, their historic electricity mix and industry structure. Ontario and Quebec are the largest electricity markets, accounting for around one-third of Canadian power consumption.
© O
EC
D/IE
A, 2
016
8. Electricity
186
Alberta
In 2013, the generation mix of Alberta was largely dominated by coal (55%), natural gas (35%, up from 29% in 2004), renewable and alternative sources (11%), including wind, hydro, biomass and co-generation. Natural gas is used in co-generation (with a share of 31%), mostly in upgrading facilities and in bitumen production from oil-sands projects.
Electricity wholesale and retail markets are organised in a fully competitive manner, while transmission and distribution functions are regulated. As explained above, the Alberta wholesale market is an open-access, energy-only competitive market for electric energy supply with a mandatory power pool. All electricity bought and sold in Alberta must be exchanged through the Power Pool of Alberta.
The retail market is partly competitive, for industrial and large commercial consumers and partly regulated, providing residential consumers and small and medium-sized enterprises (SMEs) who do not want to choose their supplier with a default regulated rate option (RRO). Amid price spikes, the government of Alberta has been reviewing its retail market design in 2012 (see below section on Retail markets).
The Alberta Electric System Operator (AESO) is a fully unbundled, independent system operator, responsible for the safe, reliable and economic planning and operation of Alberta’s transmission system, the Alberta Interconnected Electric System. It also develops and administers transmission tariffs, procures ancillary services to ensure system reliability. AESO is also the market operator, as it manages settlement of the hourly day-ahead wholesale market and transmission system services. The Power Pool does not buy or sell electric energy, but instead functions as an independent, central, open-access spot market where competing generators submit price bids for specific amounts of electricity. The System Coordination Centre then dispatches the required generation and import offers to service the actual system demand and exports in real time.
The AESO works with several transmission facility owners (TFOs) to acquire transmission services. TFOs own, operate, build and maintain the transmission system. There are four major TFOs in Alberta: ATCO Electric, AltaLink (acquired by Berkshire Hathaway Energy), EPCOR (owned by the City of Edmonton), and ENMAX (owned by the City of Calgary). Alberta’s competitive procurement process only applies to certain transmission facilities, including critical transmission infrastructure and interties.
A majority of Alberta’s distribution lines and facilities are owned and operated by four distribution facility owners (DFOs): municipally-owned ENMAX and EPCOR, and investor-owned ATCO Electric and FortisAlberta. The province also has several self-operating Rural Electrification Associations (REAs) – independent co-operatives established in rural municipalities to distribute electricity. The Alberta PowerLine partnership was selected by the AESO for the Fort McMurray West 500 kv Transmission Project, under its newly created competitive transmission process - the first to be awarded through a worldwide competitive concession tender process. Once approvals are obtained, construction of the transmission line is scheduled to start in 2017 and be in service in 2019.
Alberta is one of the least interconnected provinces of Canada and is a historic net importer. This has consequences for reliability. In addition to Alberta’s two existing interties with British Columbia and Saskatchewan, the new Montana-Alberta Tie Line came online in 2013. This merchant transmission line, owned by private investor Enbridge, provides Alberta with the first interconnection (310-MW import/export capability) to the US, greater reliability and an additional source of flexibility.
© O
EC
D/IE
A, 2
016
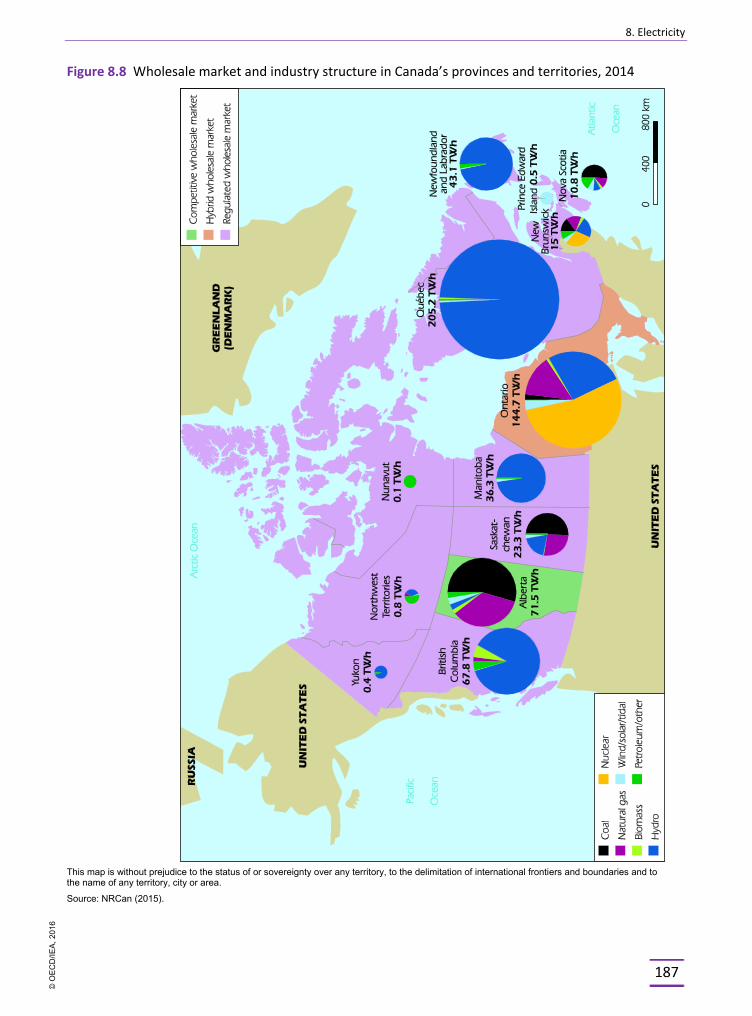
8. Electricity
187
Figure 8.8 Wholesale market and industry structure in Canada’s provinces and territories, 2014
This map is without prejudice to the status of or sovereignty over any territory, to the delimitation of international frontiers and boundaries and to the name of any territory, city or area.
Source: NRCan (2015).
© O
EC
D/IE
A, 2
016
8. Electricity
188
The reinforcement of the electricity grid of Alberta is under way. The 500 kv DC Eastern Alberta Transmission Line (EATL) is scheduled to be in service in 2015. The construction of the Western Alberta Transmission Line (WATL) is also under way with completion planned for 2015.
Price volatility, decreasing wholesale prices, and the integration of the growing wind power capacity bring about significant challenges to investment in new capacity under the energy-only market. Installed capacity of wind energy has seen major growth from 591 MW in 2009 to 1 459 MW by end of 2014.
The Alberta electricity market is regulated by the Alberta Utilities Commission (AUC), an independent, quasi-judicial agency, financed by administration fees and penalties imposed to the utilities. The AUC’s functions include regulating transmission additions and tariffs; issuing environmental and siting approvals for new generation projects; and investigating and ruling on transmission system access problems and regulated rate disputes. The AUC was given more competences in the area of transmission regulation to better scrutinise transmission tariffs and costs, and is currently reviewing electricity bill clarity and transparency.
The Market Surveillance Administrator (MSA) carries out surveillance to ensure that Alberta’s electricity market operates in a fair, efficient and openly competitive manner. Under rules established by the AUC, the MSA may issue penalties or request a hearing or other proceeding before the AUC to seek administrative penalties or other relief.
Most electricity trading transactions in Alberta take place on the Natural Gas Exchange (NGX) or as bilateral contracts and forward direct contracts in the over-the-counter (OTC) market. NGX is an electronic trading platform that provides counterparty clearing and data services to the North American natural gas and electricity markets. Alberta electricity financial contracts are among many instruments traded on NGX. The OTC market is largely facilitated by brokers.
British Columbia
British Columbia’s main source of electricity supply is hydropower which makes up 87% of the generation, the rest being biomass, wind and some natural gas. The province has large-scale storage capacity, including the Williston Reservoir with 393 million cubic metres (mcm) storage capacities.
BC Hydro, the publicly owned utility, owns and operates the majority of the province's electricity generation assets and is the supplier for most residential and commercial customers. BC Hydro provides generation, transmission and distribution services to 95% of the population; the remainder is served by privately owned FortisBC and some municipalities for distribution services.
The supply mix of BC Hydro is composed of a demand-side management programme (Power Smart), hydroelectric units and the proposed Site C facility (Heritage Hydro), some thermal units (Heritage Thermal), upgrades to existing heritage hydro facilities (Resource Smart) and the Canadian entitlement of run-of-the-river use from the Columbia River Treaty with the US (downstream benefits), as well as non-firm/market electricity imports and electricity purchase agreements (EPAs) with independent power producers, mainly for run-of-the-river hydropower.
After functional unbundling of generation and transmission in the 2000s, British Columbia recently moved back to a vertical integration of its electricity sector. Back
© O
EC
D/IE
A, 2
016
8. Electricity
189
in 2003, the British Columbia Transmission Corporation (BCTC) had been created to manage BC Hydro’s core transmission assets as an independent transmission entity to ensure non-discriminatory access to the transmission system for all market participants. BCTC developed an open access transmission tariff (OATT) to replace BC Hydro’s wholesale transmission services tariff in 2006. On 5 June 2010 the BCTC became part of BC Hydro as prescribed by the 2010 Clean Energy Act.
The British Columbia system is interconnected to Alberta and Washington State. In 2014, the Northwest Transmission Line in British Columbia entered into service and the 247-km Interior to Lower Mainland Transmission project is being constructed with planned completion in 2015. Further transmission resources are planned for the province’s northeast region.
The programme for wholesale access and free choice of electricity supplier to large industrial users has been suspended; all consumers are served by BC Hydro or their local distributor. The south-central portion of British Columbia is served by FortisBC, which provides wholesale electricity to municipal distributors in that region.
The province has ambitious low-carbon targets, mainly addressed to the power sector. Under the Clean Energy Act 2010, it aims to become a net exporter of clean energy; to make strong use of demand-side management and to have among the lowest electricity prices in North America. This requires the major utility BC Hydro to be electricity self-sufficient by 2016.
The British Columbia Utilities Commission (BCUC) has the regulatory oversight of supply, transmission and distribution of electricity, as the independent regulatory agency under the Utilities Commission Act.
Future electricity demand growth will largely be driven by the electricity needs of liquefied natural gas facilities, which are planned to be located on the coast of the province. BC Hydro estimates that an electricity supply gap could appear within the next 10 years, in particular if major LNG facilities are coming on stream. In 2013, BC Hydro presented its Integrated Resource Plan which outlines the electricity supply projections and transmission needs for the next 20 years (BC Hydro, 2013).
Manitoba
The electricity mix of Manitoba is almost 100% hydropower with a small share coming from commercial wind power. The province is a net exporter of electricity to the US and the Canadian market.
Manitoba Hydro owns and operates all electricity industry segments in Manitoba. It is the only entity to retail electricity, under Manitoba legislation. Manitoba Hydro is also a member of the Midwest independent system operator (MISO). In order to strengthen the system’s reliability against adverse weather events, the new Bipole III high-voltage direct current transmission project is scheduled to be in-service in 2018.
Retail electricity rates are regulated by the Manitoba Public Utilities Board, a quasi-judicial administrative tribunal that takes decisions independently of government direction, in accordance with enabling legislation, regulation and stated public policy. However, the Manitoba Public Utilities Board does not regulate Manitoba Hydro’s transmission tariff, which is not regulated in Manitoba. With the enactment of the Sustainable Development Act, it has been granted a say over energy efficiency, conservation and clean energy within the province. The board is comprised
© O
EC
D/IE
A, 2
016
8. Electricity
190
of an appointed full-time chairman and seven part-time members; it fulfils its mandate through public hearings, paper reviews and direct intervention, each involving enquiry, research, consultation and careful deliberation. It meets its direct costs through levies on regulated utilities and other parties and applicants.
New Brunswick
New Brunswick relies on a balanced electricity supply portfolio from hydro, natural gas, nuclear, coal and oil, and some wind power and biomass. Electricity is used for heating and processes in the energy-intensive industries, such as the forest industry of New Brunswick.
The generation, transmission and distribution of electricity in New Brunswick is dominated by NB Power Group (NBP), a provincially owned utility which supplies 47% of the province’s total requirements from its own plants.
Almost all the residential and industrial power consumers in the province are serviced by NB Power, which functions as a regulated monopoly.
Since October 2013, the NB Power Group of Companies became again a single, integrated Crown corporation responsible for generating, transmitting and distributing electricity throughout the province. The single utility was created to comply with the province's new Electricity Act which also required the creation of a new subsidiary, the New Brunswick Energy Marketing Corporation.
The four operating divisions of NB Power are:
§ NB Power Generation Corporation (Genco) generates most of the province’s electricity at 15 hydro-, coal-, oil- and diesel-powered stations. It wholly owns two subsidiaries: NB Power Coleson Cove Corporation, which owns and operates the Coleson Cove Generating Station, and NB Coal Limited, which mines coal to supply the Grand Lake Generating Station
§ NB Power Nuclear Corporation (Nuclearco) is responsible for operating the Point Lepreau generating station
§ NB Power Transmission Corporation (Transco) owns and operates the transmission system
§ NB Power Distribution and Customer Service Corporation (Disco) provides distribution services to most of the province's communities.
The rates set by the distribution division of NB Disco and the New Brunswick System Operator (NBSO) are regulated by the New Brunswick Energy and Utility Board.
The formerly independent system operator, NBSO, also underwent restructuring, as the province seized benefits from greater synergies and cost advantages in the form of integrated utility structure. Next to generation assets, NB Power is now also the sole developer and owner of the transmission system in New Brunswick and its interconnections with other markets, while NBSO is a non-for-profit organisation in charge of monitoring the reliability of the electrical system in the province.
Nova Scotia
Nova Scotia has only one interconnection to New Brunswick and remains an “energy island”. While it can export to New Brunswick, imports are not always firm. Of importance
© O
EC
D/IE
A, 2
016
8. Electricity
191
for the province is the development of the Maritime Link Project by Emera Inc., to provide hydroelectricity from 2017 onwards and link the province to Newfoundland and Labrador. This will also allow Nova Scotia to meet its renewable energy targets for 2020.
The role of renewable energy, including tidal energy, is of particular importance and independent power producers (IPPs) have been investing in it in recent years. Over 70% of the large-scale wind turbines generating electricity in Nova Scotia are independently owned. Canada’s leading test centre for in-stream tidal energy technology (FORCE) studies the potential for tidal turbines to operate within the Bay of Fundy environment. It is funded by Natural Resources Canada (NRCan), the province of Nova Scotia, Encana Corporation, and participating developers.
Nova Scotia has adopted wholesale open access which allows the province’s six municipally operated electrical companies to buy power from generators other than Nova Scotia Power, a privately owned and regulated monopoly owned by Emera Inc., and mandates the establishment of an open-access transmission tariff. The utilities can generate their own power and purchase it from any IPP. While the wholesale market is open for competition, retail market opening for renewable energy IPPs is under preparation and expected to enter into force in 2015.
Nova Scotia Power Incorporated (NSPI), a vertically integrated public utility and subsidiary of Halifax-based Emera, produces and distributes 95% of the electricity in the province. There are six municipally owned independent utilities that supply electricity to consumers within their territory (Antigonish, Berwick, Canso, Lunenburg, Mahone Bay and Riverport) and own and operate their own distribution systems. Together, they account for approximately 2% of the electrical load in the province. The remaining 3% of electricity in Nova Scotia comes from IPPs, mostly from commercial-scale wind turbine projects.
The Nova Scotia Power System Operator (NSPSO) operates the transmission and distribution lines and is responsible for the safe, reliable and efficient operation of Nova Scotia's bulk power system. The NSPSO functions independently from other Nova Scotia Power Inc. operations under Standards of Conduct approved by the Nova Scotia Utility and Review Board.
The Department of Energy and the Department of Environment are responsible for developing the regulations that govern the electricity sector under the Electricity Act. The Nova Scotia Utility and Review Board (UARB) is responsible for overseeing the regulation of the electricity sector and has a mandate under the Public Utilities Act to ensure universal access for all Nova Scotians to public utility services at “just and reasonable” rates.
Under the 2013 Electricity Reform Act, Nova Scotia carried out an electricity system review to determine the future of its electricity system. In early 2015, preliminary results were published, indicating a small growth in future electricity demand, and limited scope for full market liberalisation, but a need for greater transparency, competition, and accountability and independence of the institutions governing the sector. These findings will be taken into account by the government in the province’s electricity supply strategy to be presented in 2015 (Nova Scotia, 2015). In addition to the review, the government also plans to reform the electricity retail market under the Renewable to Retail Market Opening (see below section on Retail markets).
Nova Scotia’s Energy Efficiency Utility has a demand-side programme in place since 2010 with more than 190 000 programme participants. Investment in efficiency efforts to date
© O
EC
D/IE
A, 2
016
8. Electricity
192
will save Nova Scotians CAD 99 million in electricity costs in 2015 alone, and has reduced their annual need for electricity by 6.6%, making Nova Scotia the North American leader in energy conservation.
Newfoundland and Labrador
Almost 97% of the electricity generated in Newfoundland and Labrador (NL) comes from hydropower.
Newfoundland and Labrador Hydro (NLH), a Crown corporation, dominates the generation and transmission services in the province. NLH sells electricity wholesale to Newfoundland Power Inc. (NP), a regulated private subsidiary of Fortis Inc. for distribution to customers in urban areas. Both NLH and NP are regulated by the Board of Commissioners of Public Utilities, NLH on a rate-of-return basis, and NP on a cost-of-service/return-on-rate-base basis.
The Board of Commissioners of Public Utilities is an independent, quasi-judicial regulatory body appointed by the Lieutenant Governor in Council. It conducts public hearings of a quasi-judicial nature, in accordance with the provisions of the Public Enquiries Act and the Board's. Orders issued by the board as a result of Public Hearings have the force of law and can only be appealed to the Supreme Court of Newfoundland, Court of Appeal. The Board reports to the Minister of Justice administratively and submits to the minister an annual report. A panel decision on a hearing is independent of any reporting structure. The board is funded by assessments upon the industries it regulates and therefore is excluded from the general budget of government.
Northwest Territories
Northwest Territories (NWT) has an electricity mix which is dominated by diesel (54%), hydro (34%) and natural gas (10%), with the remaining 2% stemming from power imports and wind and solar energy.
The Northwest Territories Power Corporation (NTPC), a Crown corporation of the government of the territories, is the main producer of electric power and the operator of the grid. NTPC manages a capacity of 113 MW, including two hydroelectric systems (Snare and Taltson), 78 diesel generators, two natural gas generators in Inuvik, and solar panels in Fort Simpson. NWT has two partially integrated grids and a number of isolated communities and mines. In its latest Power System Plan, NTPC examines the need for grid expansion, use of liquefied natural gas and increased use of renewable resources for power generation (NTPC, 2014). LNG is now being trucked from Vancouver for use in Inuvik.
Power distribution is handled by Northland Utilities Ltd., a subsidiary of ATCO Electric, in Hay River, Yellowknife, and in four other isolated communities.
Electricity market oversight is carried out by the NWT Public Utilities Board (PUB), an independent, quasi-judicial agency of the NWT government. The utilities are regulated by using a rate-of return method.
Nunavut
The Nunavut electrical system consists of 25 isolated diesel power plants serving 25 communities with no interconnections between them and with neighbouring provinces. On 1 April 2001, Nunavut Power Corporation took up the mandate to supply electricity to communities in the Nunavut territory. Renamed Qulliq Energy Corporation
© O
EC
D/IE
A, 2
016
8. Electricity
193
(QEC) in 2003, this territorial corporation is fully owned by the government of Nunavut. QEC is the only generator, transmitter and distributor of electricity in Nunavut. All aspects of QEC are regulated by the Ministry of Energy; however a Utility Rates Review Council has been established to provide independent advisory services in reviewing utility applications, major capital projects, and electricity rates.
Ontario
Ontario deregulated its electricity market under the Electricity Act of 1998 and the Ontario Energy Board Act of 1998 which provided for the unbundling of generation and transmission, the creation of independent system and market operators and regulatory authority. In 2002, Ontario introduced fully competitive wholesale and retail markets.
Amid energy policy changes, Ontario has largely departed from the fully competitive electricity wholesale market and moved to a hybrid model, with largely regulated electricity prices and some limited wholesale competition.
Wholesale prices set through the market, the Hourly Ontario Electricity Price (HOEP), are tempered by regulated fixed prices or long-term government-backed contracts provided by the former Ontario Power Authority (OPA) to a majority of generators, notably renewable energy generators. The Ontario Power Authority (OPA) was established by the Electricity Restructuring Act of 2004, and was the majority buyer in the market, as it contracted electricity from new entrants, mainly renewable energy generators, which are remunerated by a feed-in tariff.
As of 1 January 2015, OPA merged with the independent electricity system operator (IESO) into one entity and, therefore, now directs the operation and maintains the reliability of the IESO-controlled grid. It operates the wholesale electricity market as well as the demand-side and renewable energy programmes. IESO is tasked to:
§ balance the supply of and demand for electricity in Ontario and direct its flow across the province's transmission lines
§ plan for the province's medium- and long-term energy needs, and secure clean sources of supply to meet those needs
§ oversee the electricity wholesale market
§ foster the development of a conservation culture in the province through programmes such as saveONenergy.
The price that customers pay for their electricity is determined by the HOEP set in the market which is subsequently adjusted to take into account the various types of contract prices paid to certain generators through the global adjustment (GA). Generators offer into the market and are paid the market price. Those with contracts receive fixed prices, monthly revenue guarantees, or guaranteed floor prices.
The Ontario Electricity Financial Corporation (OEFC) administers non-utility generation contracts with private generators built before the dissolution of Ontario Hydro.
Next to IESO, the other large electricity supplier is the Ontario Power Generation Inc. (OPG) owned by the province. The output from OPG’s baseload nuclear and hydroelectric production, around 50% of Ontario’s capacity, receives regulated payments (for so-called prescribed power plants) set by the Ontario Energy Board (OEB). OPG also owns unregulated power plants. It has two other nuclear generating stations, leased on a long-term basis to a private-sector operator, Bruce Power, which produce about 20%
© O
EC
D/IE
A, 2
016
8. Electricity
194
of the balance of electricity supply, while numerous smaller co-generation plants, natural gas facilities and additional renewable energy (e.g. wind and other hydroelectric) facilities comprise the remaining approximate 10% of the electricity produced in Ontario.
Hydro One Networks, an operating subsidiary of Hydro One Inc., so far wholly owned by the province of Ontario, is responsible for 97% of Ontario's electricity transmission and about one-third of the distribution system. The province has launched a competitive process to designate a transmission company that will develop a major new transmission project; this may be followed by other transmission projects. In April 2015, the province announced plans to sell 60% of Hydro One, following a report issued by the Ombudsman which recommended selling some of Hydro One's distribution systems, including power lines and hydropower facilities to local utilities.
The OEB regulates parts of OPG generation capacity, but not OPA generating or other generation. In line with the Ontario Energy Board Act, it reviews OPA activities related to conservation and distributor and retailer payments. The OEB determines electricity transmission and distribution tariffs, and approves the IESO budget and fees. The board also provides advice on energy matters referred to it by the Minister of Energy and the Minister of Natural Resources. The board is a self-funding Crown corporation without share capital. The board's mandate and authority come from the Ontario Energy Board Act 1998, the Electricity Act 1998, and a number of other provincial statutes.
Beginning in 1999, Ontario began to promote the rationalisation of the publicly owned distribution sector, resulting in a merging activity that has reduced the number of municipally owned local distribution companies (LDCs) in the province from 305 in 1999 to 76 at present. The government provides a transfer tax exemption to any publicly owned utility that sells its electricity assets to another publicly owned utility in Ontario to help facilitate further consolidation activity. This exemption was made permanent in October 2009. There are currently 90 licensed electricity distributors in Ontario. Hydro One serves 25% of Ontario’s customer base. The second-largest distributor, Toronto Hydro, serves about 15% while four large distributors in and around the greater Toronto area serve another 20%. The remaining 40% of customers are allocated among 85 local municipal and privately owned distributors.
With the feed-in tariffs and closure of its coal-fired capacity, and the refurbishment of nuclear plants, there is overcapacity in the Ontario power system, which has been exacerbated by the effect of the economic crisis and lower electricity consumption by large users, such as the automotive industry.
Reforms of the Ontario wholesale electricity market have been introduced in 2013 to make transmission-connected renewable resources (particularly wind) dispatchable. They have established independent regulatory oversight and create market-based capacity remuneration, through a competitive capacity market. Ontario’s IESO established a new dispatch process and floor prices for transmission connected wind and solar generation resources.
Prince Edward Island
Electricity in Prince Edward Island (PEI) is almost entirely produced from renewable resources, with wind power making up to 99% of total capacity. This local production meets about 30% of electricity demand. The province has no fossil fuel, nuclear or hydro resources in the mix. However, PEI has a reserve of 60 MW of thermal generation, and around 100 MW of diesel-fired combustion turbines, all of which is used primarily as backup when supply is not available from New Brunswick.
© O
EC
D/IE
A, 2
016
8. Electricity
195
The balance of PEI’s electricity needs are imported, on the basis of short-term contracts at the New England wholesale market and on the basis of long-term contracts with New Brunswick’s NB Power (Point Lepreau nuclear facility), via two submarine cables. Overproduction from PEI’s wind farms is exported via the same submarine cables during peak production and low demand.
The PEI Energy Corporation is responsible for pursuing and promoting the development of energy systems. It sells electricity from its own wind farms in North Cape, East Point and Hermaville/Clearsprings to Maritime Electric on the basis of long-term contracts.
Around 90% of PEI's electricity customers are serviced by the fully integrated, regulated private utility Maritime Electric Co. Ltd. (Maritime). Maritime is a wholly owned subsidiary of Fortis Inc., and provides transmission, distribution and a small amount of generation services. The remaining electricity customers are serviced by the municipally owned utility Summerside Electric.
Both Maritime and Summerside Electric are regulated by the all-purpose Island Regulatory and Appeals Commission on a cost-of-service basis. The Commission is an independent quasi-judicial tribunal financed through assessments of entities by the provincial government and through appellate and administrative services provided.
Quebec
Quebec is the largest electricity exporter in Canada. Around 99% of the electricity of the province comes from hydro and increasingly from wind energy. Quebec has the second-largest installed wind power capacity in Canada.
At the same time, Quebec has a number of energy-intensive industries, including aluminium smelters, and uses electricity for water and space heating, which makes the province the largest electricity consumer in Canada.
Hydro-Quebec is a fully integrated Crown corporation responsible for the generation, transmission and distribution of most of the electricity sold in Quebec. It is functionally unbundled into four divisions of Hydro-Quebec: Production, and TransÉnergie (transmission); Distribution, and Équipement et services partagés et la Société d’énergie de la Baie James (SEBJ).
Hydro-Quebec's TransÉnergie division owns and operates the provincial transmission grid under open-access rules and regulated tariffs. Hydro-Quebec TransÉnergie has sole responsibility of electricity transmission at regulated rates throughout the province with very limited exceptions.
Generation is not regulated in Quebec; however, Hydro-Quebec Production is mainly responsible for developing hydro facilities larger than 50 MW. By law, Hydro-Quebec Production is required to supply Hydro-Quebec the "heritage pool" at government fixed rate and conditions for 165 TWh/year for customers in Quebec. Competition exists in the wholesale market for all Hydro-Quebec Distribution as decided by government and upon approval of an energy supply plan by the Régie de l’énergie.
Transmission and distribution are regulated on a return-on-equity basis by the Régie de l'énergie, an independent agency funded mainly by duties and fees paid on a user-pay basis by the regulated distributor. The Régie de l'énergie is composed of seven permanent commissioners and three supernumerary commissioners.
© O
EC
D/IE
A, 2
016
8. Electricity
196
Saskatchewan
Saskatchewan’s electricity mix mainly relies on coal (around 51%), with the remainder split between natural gas and hydro, at equal shares.
Electricity generation, transmission and distribution services are primarily provided by the Crown corporation Saskatchewan Power Corporation (SaskPower). SaskPower is the main power generator of the province with a mix of coal, natural gas, hydro and wind generating facilities in its ownership. SaskPower owns and operates all hydropower and coal-fired plants. Private companies own Saskatchewan’s industrial co-generation natural gas power plants and wind power projects.
In 2014, SaskPower commissioned the Boundary Dam Power Station, the world's first commercial-scale coal-fired power plant with a fully integrated carbon capture and storage (CCS) system.
There is no independent regulatory authority, but the Saskatchewan Rate Review Panel, at the request of the Minister of Crown Management Board, reviews SaskPower’s proposed rates. The Panel receives specific instructions on the scope of each review through a "ministerial order" from the Minister of the Crown Management Board. Because the Panel acts as advisory committee to the Minister of the Crown Management Board, it can only provide its observations and recommendations with respect to matters that have been referred to it by the minister. It does not have the authority to implement any of its recommendations; the final decision on whether there will be action on any recommendations is left to the provincial Cabinet. The Panel is financed by the province and members are paid a retainer per year, as well as per diem rates for time spent working on the reviews. Private consulting firms (e.g. accountancy firms) are contracted to undertake staff work on a project basis.
Yukon
Over 76% of Yukon’s electricity is produced from hydropower, with 24% from oil. Most communities are connected to local grids with diesel backups but because of its low population density and large territory, there are still a few isolated communities that are served only by diesel power plants.
With the aim to reduce environmental impacts from diesel use and phase it out over time, Yukon is focusing on LNG. Since 2014, Yukon has licensed the first LNG regasification facility, with LNG being provided by trucks from Vancouver. Today, a mix of natural gas and diesel can be used at the Watson Lake power plant.
Yukon strives to maintaining its high level of renewable energy generation and is looking at all possible sources of clean energy, including geothermal, wind, waste-to-energy, new hydro, and the enhancement of existing hydro assets, in order to meet future demand.
Yukon Energy Corporation (Yukon Energy), a subsidiary of the Crown owned Yukon Development Corporation, is the dominant power generator with almost 90% of capacity, including all the major hydro facilities. Yukon Electric Company Limited (YECL), a subsidiary of ATCO Electric, owns and operates the remaining generating capacity in most of Yukon’s other rural communities. These utilities are regulated by the Yukon Utilities Board. The board consists of three to five members appointed by the government of Yukon and may be directed by the Minister of Justice to undertake the review of specific projects.
© O
EC
D/IE
A, 2
016
8. Electricity
197
RETAIL MARKETS
At the retail level, the price of electricity is not only affected by the cost of production but also by the cost of transmission and local distribution, which may vary depending on factors, such as geography and population density.
In Quebec, Nova Scotia, Prince Edward Island and Newfoundland and Labrador, electricity rates are regulated on a cost-of-service basis. In Alberta and Ontario, prices are set largely through the market, although households and smaller commercial consumers have the option of subscribing to a regulated rate.
The retail market of Alberta is currently undergoing reforms. Up to 2010, the regulated rate option (RRO) was based on a mixture of short- and long-term market prices for electricity. By 2010, the RRO was entirely based on the month-ahead average spot market price in the wholesale market. This was problematic as, at the same time, Alberta’s power market saw greater volatility in hourly wholesale prices, up to 140% in 2011.
Amid retail price volatility, in 2012 the Retail Market Review Committee (RMRC) was tasked to review the retail market and in particular the regulated rate option (RRO). The RMRC recommended further reforms to the Alberta Ministry of Energy (RMRC, 2012), including measures to increase price comparison, transparency and reduce barriers to competition and supplier switching. It concluded that the RRO was a barrier to a fully competitive retail market and should be phased out and replaced by a new “provider of last resort” (POLR). The government is currently reviewing the reforms and recommendations. The Alberta Utilities Commission scrutinises transmission tariffs and costs and is reviewing electricity bill clarity and transparency.
In the latest Annual Baseline Assessment of Choice in Canada and the United States (ABACCUS assessment) of restructured electricity markets, published by DEFG, a management consulting firm specialising in energy, in 2015, Alberta ranked second after Texas, the competitive residential electricity market leader for the eighth consecutive year, for choices available to residential consumers and ranked fourth for choice available to commercial and industrial consumers. Alberta’s electricity retail market has switching rates of 43% for residential and 96.3% for large customers (DEFG, 2015).
In Ontario, the retail market has become more regulated for residential and small business consumers; it remains more competitive for commercial and industrial customers. Residential and small business consumers may purchase from competitive retailers or pay a default price (time-of-use rates with off-, on- and mid-peak prices or a tiered rate at the regulated price plan RPP) which is passed through by their local distribution company. The default RPP price is set by OEB and smoothed twice a year by the OEB to reduce volatility. The vast majority of RPP eligible consumers uses time-of-use rates, mainly off-peak, as they benefit from their smart meter.
Nova Scotia is currently reforming its retail electricity market. Up to now, electricity generators can only sell to Nova Scotia Power and to the six municipal utilities but have no direct access to retail customers. The Electricity Reform Act passed in 2013 will allow customers to buy power directly from licensed renewable energy providers. The required “Renewable to Retail” regulations are expected in 2015.
© O
EC
D/IE
A, 2
016
8. Electricity
198
DEMAND RESPONSE MANAGEMENT AND SMART GRIDS
Canada has seen a strong development of demand response. Provincial Crown corporations, local distribution companies and integrated utilities have invested in the deployment and use of smart meters and demand-side management (DSM), mainly in the form of peak load reduction and energy efficiency programmes. DSM also includes time-of-use electricity retail prices. However, with the exception of Ontario, no province/territory adopted dynamic prices.
Ontario leads in the deployment of smart meters and smart grids in the country and has completed one of the largest and most successful roll-outs of smart meters in the world. Ontario’s Smart Meter Initiative was a driver for technological innovation in home energy management and peak load reduction. The early roll-out of smart meters has also supported the leadership of the province in the area of smart grids. Ontario has completed the roll-out of 4.6 million smart meters and mandatory time-of-use rates for 3.1 million customers. DSM programmes are co-ordinated by IESO through price signals.
BC Hydro and FortisBC successfully implemented smart meter and smart grid programmes for their residential and commercial customers. Over 99% of BC Hydro residential customers are covered under the programme. BC Hydro has introduced a residential conservation rate, a two-step rate, for residential customers to encourage energy efficiency. Industrial customers have both stepped rates, interruptible contract rates and some have time-of-use rates. British Columbia also has active DSM programmes, including Power Smart and the Home Energy Rebate Offer (HERO) programme.
Yukon Energy made DSM an integral component of its 20-year resource plan: 2011 to 2030. In 2011, Yukon Energy opened its Energy Conservation department and dedicated staff time to testing technology, working with large industrial, commercial and institutional customers, providing public education, conducting research, and co-ordinating a Yukon-wide DSM plan with the government of the province and Yukon Electrical. Moving forward, Yukon Energy will lead by example through its Internal Demand Side Management Program and will work with its large industrial customers on a one-on-one basis to increase understanding and uptake of energy-efficient equipment and best practices.
Nova Scotia has created an independent administrator of energy efficiency in the electricity sector. The Efficiency Nova Scotia Corporation (ENSC) was established through provincial legislation in 2009 as the agency responsible for the design and delivery of cost-effective DSM programmes and services in Nova Scotia through a Demand Side Management Plan, approved by the regulatory authority. To date, energy efficiency programmes have reduced the annual electricity load in Nova Scotia by 469 kWh, or 4.3%. A systems benefit charge is levied on all electricity consumers in Nova Scotia to cover ENSC costs.
In New Brunswick, NB Power agreed on a 10-year Smart Grid partnership with Siemens to integrate smart grid technology into the province’s electricity system, to reduce and shift electricity demand. Siemens will showcase their Demand Response Management System (DRMS) as well as their Decentralised Energy Management Suite (DEMS), developing the smart grid strategy in five work areas within NB Power, including: Network Operations, Customer Participation, Asset and Workforce Management, Smart Energy, and Smart Organization.
© O
EC
D/IE
A, 2
016
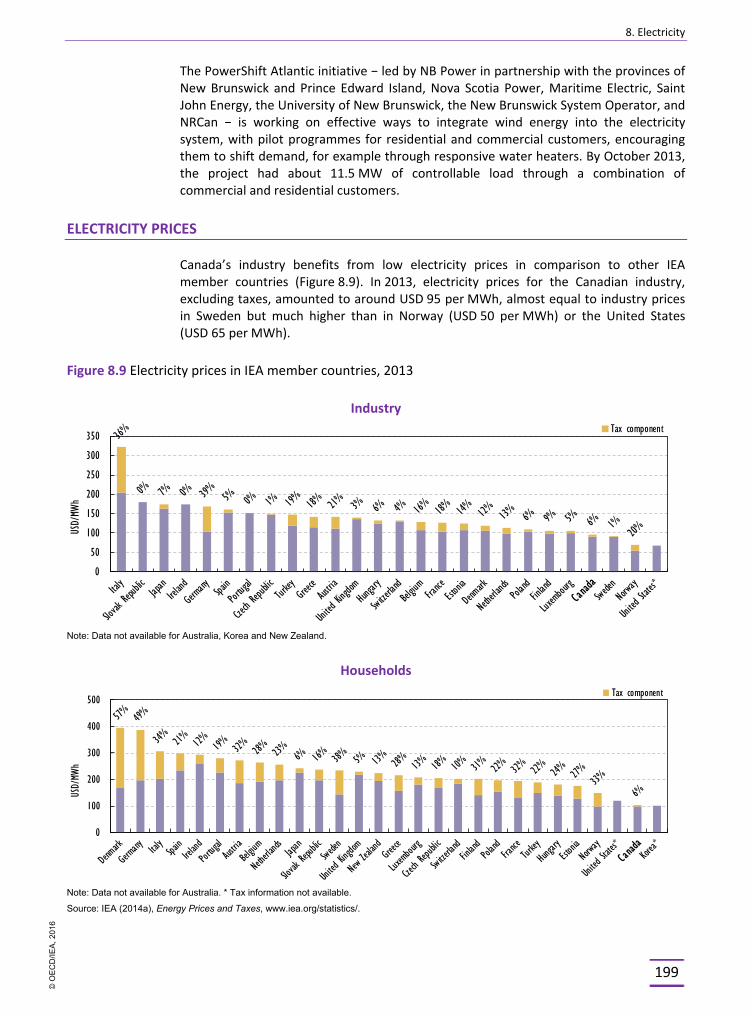
8. Electricity
199
The PowerShift Atlantic initiative − led by NB Power in partnership with the provinces of New Brunswick and Prince Edward Island, Nova Scotia Power, Maritime Electric, Saint John Energy, the University of New Brunswick, the New Brunswick System Operator, and NRCan − is working on effective ways to integrate wind energy into the electricity system, with pilot programmes for residential and commercial customers, encouraging them to shift demand, for example through responsive water heaters. By October 2013, the project had about 11.5 MW of controllable load through a combination of commercial and residential customers.
ELECTRICITY PRICES
Canada’s industry benefits from low electricity prices in comparison to other IEA member countries (Figure 8.9). In 2013, electricity prices for the Canadian industry, excluding taxes, amounted to around USD 95 per MWh, almost equal to industry prices in Sweden but much higher than in Norway (USD 50 per MWh) or the United States (USD 65 per MWh).
Figure 8.9 Electricity prices in IEA member countries, 2013
Industry
0
50
100
150
200
250
300
350
USD/
MWh
Tax component
Note: Data not available for Australia, Korea and New Zealand.
Households
0
100
200
300
400
500
USD/
MWh
Tax component
Note: Data not available for Australia. * Tax information not available.
Source: IEA (2014a), Energy Prices and Taxes, www.iea.org/statistics/.
© O
EC
D/IE
A, 2
016

8. Electricity
200
Among IEA member countries, Canadian households pay the lowest electricity prices, just below USD 100 per MWh, excluding taxes. The differentials for industry electricity prices to major industrialised export countries, however, are growing. Since 2010, Canada has been experiencing an increase in prices (see Figure 8.10), while US prices remained comparatively stable. German and Japanese industry users still paid almost twice as much as Canadian users. Such price averages however mask large price differences between the provinces of Canada, as shown in Figure 8.11.
Figure 8.10 Electricity prices in Canada and in other selected IEA member countries, 1980-2013
Industry Households
Note: Data are not available for Norway’s industry prices from 1991 to 1999.
Source: IEA (2014a), Energy Prices and Taxes, www.iea.org/statistics/.
Figure 8.11 Average electricity prices including taxes, by province (in CAD cents per kWh), April 2014
Households Large industry
Source: NRCan (2014), Energy Markets Fact Book, 2014-2015, Natural Resources Canada, 2014.
0
50
100
150
200
250
1980 1984 1988 1992 1996 2000 2004 2008 2012
USD/
MWh
Japan Germany United States Canada Norway
0
50
100
150
200
250
300
350
400
450
1980 1984 1988 1992 1996 2000 2004 2008 2012
USD/
MWh
0 2 4 6 8
10 12 14 16 18 20
CAD
cents/
kWh
Average residential price Average large industrial electricity prices including taxes
0
2
4
6
8
10
12
14
CAD
cents/
kWh
© O
EC
D/IE
A, 2
016
8. Electricity
201
Retail prices experienced by end-use consumers in Canada diverge widely across the Canadian territory for three main reasons: i) electricity regulation and policy are enacted at the provincial level rather than the federal level, ii) approximately 90% of the Canadian population is located within 250 kilometres of the US border (and sparsely populated elsewhere), and iii) the energy resources available for development are not equally distributed across the territory.
British Columbia, Manitoba, Newfoundland and Labrador, and Quebec have large amounts of hydro resources, while Alberta and Saskatchewan mainly use conventional fossil fuel resources and Ontario relies on nuclear energy and renewable energy. This is reflected in the prices of the large Canadian cities, such as Toronto, Montreal and Calgary. In April 2014, average retail prices for residential customers in Montreal, Quebec were 7.06 CAD cents per kWh, while retail prices in Toronto, Ontario they averaged 13.78 CAD cents per kWh and in Calgary, Alberta, 13.41 CAD cents per kWh (Hydro-Quebec, 2015).
While island systems, like Prince Edward Island or Nova Scotia, have traditionally higher electricity prices given the limited customer base, industry in several provinces has to shoulder the cost of increasingly regulated electricity prices, and cannot benefit from the declining natural gas prices in the North American electricity markets which are the price-setters in the neighbouring electricity systems.
ELECTRICITY SECURITY
GENERATION ADEQUACY
The modernisation of the Canadian electricity sector is under way as provincial energy strategies and federal GHG emission regulations1 promote the further decarbonisation of the power sector and the modernisation of the ageing power plant fleet. The generation mix is set for changes, as nuclear reactors are being refurbished with some units shut down by 2020 (for instance the Pickering units in Ontario) and coal- and oil-fired generation phased out and replaced by natural gas and renewable energies. There is no investment in new nuclear planned in the period up to 2040. As can be concluded from Figure 8.12, there will be an addition of capacity from natural gas and renewables while the shares of coal, oil, and uranium decrease due to retirements and lower growth compared to other types of generation. The share of nuclear power in the total capacity mix is expected to decline from 10% to 6% from 2014 to 2040, and the share of hydro decreases from 55% to 51%. In contrast, the proportion of capacity from non-hydro renewables increases from 9% to 16% (NEB, 2016). Several energy policy decisions in the Canadian provinces support these projections.
Under the Clean Energy Act (CEA), based on the 2007 Energy Plan, British Columbia aims to be self-sufficient in electricity by 2016 and generate at least 93% of its electricity from clean or renewable resources (biomass, biogas, geothermal heat, hydro, solar, ocean, wind or any other prescribed resource) and to build the infrastructure necessary to transmit that electricity.
1. New emission performance standards enacted under the Electricity Regulations (SOR/2012-167) on the Reduction of Carbon Dioxide Emissions from Coal-fired Generation and industry’s efforts and provincial energy strategies to curb energy-related greenhouse gas emissions.
© O
EC
D/IE
A, 2
016
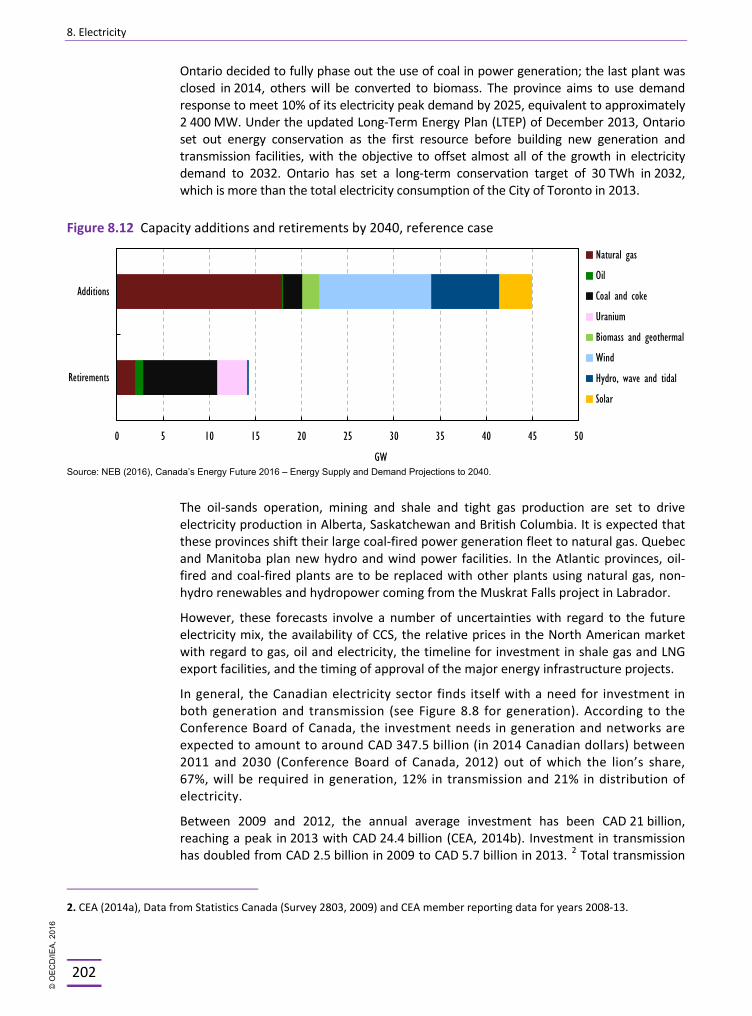
8. Electricity
202
Ontario decided to fully phase out the use of coal in power generation; the last plant was closed in 2014, others will be converted to biomass. The province aims to use demand response to meet 10% of its electricity peak demand by 2025, equivalent to approximately 2 400 MW. Under the updated Long-Term Energy Plan (LTEP) of December 2013, Ontario set out energy conservation as the first resource before building new generation and transmission facilities, with the objective to offset almost all of the growth in electricity demand to 2032. Ontario has set a long-term conservation target of 30 TWh in 2032, which is more than the total electricity consumption of the City of Toronto in 2013.
Figure 8.12 Capacity additions and retirements by 2040, reference case
Source: NEB (2016), Canada’s Energy Future 2016 – Energy Supply and Demand Projections to 2040.
The oil-sands operation, mining and shale and tight gas production are set to drive electricity production in Alberta, Saskatchewan and British Columbia. It is expected that these provinces shift their large coal-fired power generation fleet to natural gas. Quebec and Manitoba plan new hydro and wind power facilities. In the Atlantic provinces, oil-fired and coal-fired plants are to be replaced with other plants using natural gas, non-hydro renewables and hydropower coming from the Muskrat Falls project in Labrador.
However, these forecasts involve a number of uncertainties with regard to the future electricity mix, the availability of CCS, the relative prices in the North American market with regard to gas, oil and electricity, the timeline for investment in shale gas and LNG export facilities, and the timing of approval of the major energy infrastructure projects.
In general, the Canadian electricity sector finds itself with a need for investment in both generation and transmission (see Figure 8.8 for generation). According to the Conference Board of Canada, the investment needs in generation and networks are expected to amount to around CAD 347.5 billion (in 2014 Canadian dollars) between 2011 and 2030 (Conference Board of Canada, 2012) out of which the lion’s share, 67%, will be required in generation, 12% in transmission and 21% in distribution of electricity.
Between 2009 and 2012, the annual average investment has been CAD 21 billion, reaching a peak in 2013 with CAD 24.4 billion (CEA, 2014b). Investment in transmission has doubled from CAD 2.5 billion in 2009 to CAD 5.7 billion in 2013. 2 Total transmission
2. CEA (2014a), Data from Statistics Canada (Survey 2803, 2009) and CEA member reporting data for years 2008-13.
0 5 10 15 20 25 30 35 40 45 50
Retirements
Additions
GW
Natural gas
Oil
Coal and coke
Uranium
Biomass and geothermal
Wind
Hydro, wave and tidal
Solar
© O
EC
D/IE
A, 2
016
8. Electricity
203
miles are projected to increase by 4.8% over the next ten years. However, efforts to expand and reinforce transmission continue to lag behind growth of electricity demand and generating capacity in many areas of the country.
While the situation varies from province to province, certain markets are facing shortfalls in generating capacity (e.g. British Columbia) in the next 10-15 years. Others see lower loads after the 2008 economic crisis and lower demand by energy-intensive users (Ontario), which will also face lower supplies, amid nuclear refurbishments and phase-out of coal-fired capacities. In 2012, one nuclear power plant (one unit) was shut down in Quebec. Ontario is to gradually refurbish its Darlington and Bruce nuclear power plants up to 2030 (but the Pickering nuclear power plant will not be refurbished and will be shut down by 2020). These changes in the electricity mix can temporarily lead to lower reserve margins, notably during the time of refurbishment.
Demand-side management programmes provide a strong contribution to ensuring short-term reliability of the electricity system. In fact, provinces with strong hydropower exports are more likely to offer large DSM programmes, as there are strong correlations between the number and volume of DSM and hydropower exports (IEA, 2014b).
In addition, thanks to the regional electricity market integration with the United States, interconnection capacity is also a source of flexibility for Canadian provinces. With transmission systems that are interconnected at multiple points from east to west, Canada and the US are able to benefit from a significant electricity trading relationship. This relationship allows for efficient use of resources, especially between summer and winter peaks, and opens, commercial opportunities for both countries. It also improves the reliability of the electric system. The future outlook will also depend on the availability of new power lines with the US which are currently being planned and under review by the US authorities for Presidential Permit.
RELIABILITY Canada is well integrated in the three large interconnected systems of the US and NERC’s reliability regions and assessment areas (see Figure 8.13), where large independent system operators form the backbone of the interconnected regional power systems.
In Canada, SaskPower is the reliability co-ordinator for the province of Saskatchewan; Manitoba Hydro co-operates with the Midwest independent system operator (MISO).
The governments of Canada and the US are continuing to work together on common electricity reliability issues. Reliability is dealt with in the wider network and market area. Following the August 2003 blackout, several lessons were learnt in North America.
In its 2014 long-term adequacy assessment, which encompasses Canada’s provinces (see Figure 8.13), the North American Electric Reliability Corporation (NERC, 2014) expects that overall electricity generating capacity in North America will be sufficient to maintain reliability, provided new generation is added, as planned. However, there are a number of issues that may affect the long-term reliability and effectiveness of the system:
§ Reserve margins in several assessment areas are trending downward, despite low load growth.
§ Environmental regulations create uncertainty and require assessment.
§ A changing resource mix requires new approaches for assessing reliability. The trend is towards gas-fired power plants, as coal- and nuclear-using plants are being retired and replaced by variable renewable energy resources.
© O
EC
D/IE
A, 2
016
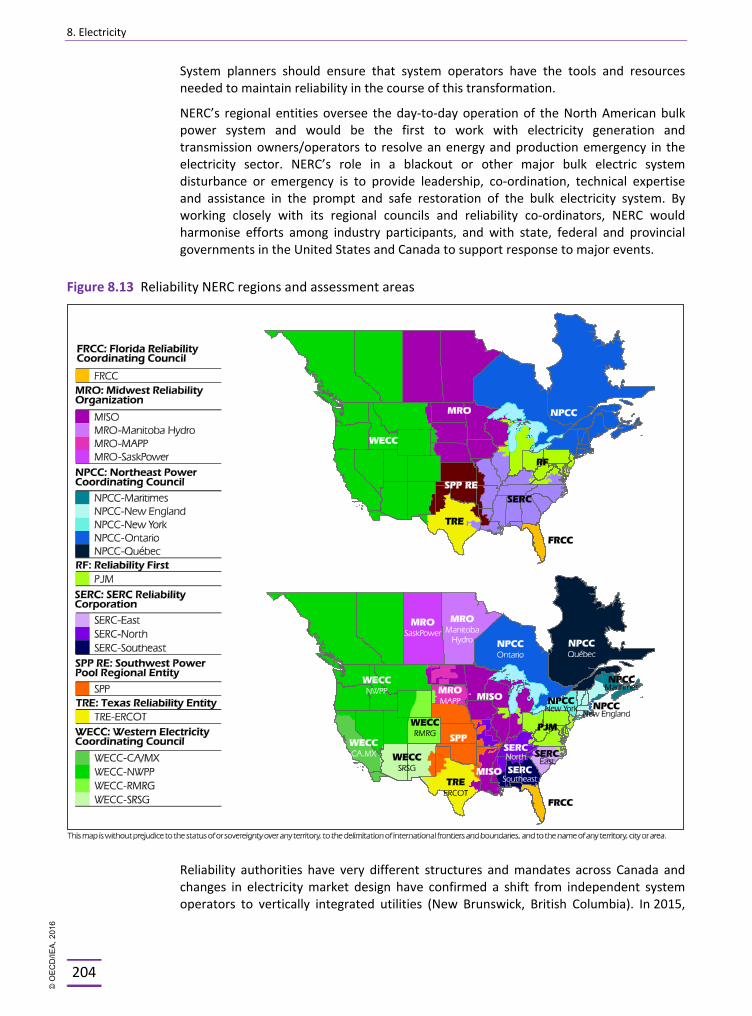
8. Electricity
204
System planners should ensure that system operators have the tools and resources needed to maintain reliability in the course of this transformation.
NERC’s regional entities oversee the day-to-day operation of the North American bulk power system and would be the first to work with electricity generation and transmission owners/operators to resolve an energy and production emergency in the electricity sector. NERC’s role in a blackout or other major bulk electric system disturbance or emergency is to provide leadership, co-ordination, technical expertise and assistance in the prompt and safe restoration of the bulk electricity system. By working closely with its regional councils and reliability co-ordinators, NERC would harmonise efforts among industry participants, and with state, federal and provincial governments in the United States and Canada to support response to major events.
Figure 8.13 Reliability NERC regions and assessment areas
Reliability authorities have very different structures and mandates across Canada and changes in electricity market design have confirmed a shift from independent system operators to vertically integrated utilities (New Brunswick, British Columbia). In 2015,
© O
EC
D/IE
A, 2
016
8. Electricity
205
there are three independent electricity system operators (Ontario, Alberta and Nova Scotia), but NBSO in New Brunswick, the independent reliability organisation, is no longer a system operator).
Ontario’s independent electricity system operator (IESO) manages the electricity wholesale marketplace and three separate reserve markets to provide a market-based way for the IESO to quickly replace the supply of electricity for a short period of time until requirements can again be supplied from normal dispatch, including the 10-minute synchronised reserve, 10-minute non-synchronized reserve and a 30-minute reserve.
The Alberta Electric System Operator (AESO) operates the grid and manages the system planning and electricity wholesale market.
As a non-for-profit organisation, the New Brunswick system operator (NBSO) remains in charge of reliability questions and is the Maritime area’s Reliability Coordinator, the highest level of authority for the operation of the bulk electricity system in North America. Manitoba Hydro co-operates with the Midwest independent system operator (MISO). Prince Edward Island works in co-operation with NB Power.
NERC also co-ordinates resilience testing and southern Canada has been included in the assessment. This important work in ensuring the resilience of the electricity system is area of major importance also for Canada, as adverse weather effects are frequent in North America. Canada’s hydropower industry also leads in weather and climate-modelling technologies to address climate change impacts over time.
There have been no major electricity disruptions in Canada since the blackout that affected millions of consumers in Ontario and the northeast of the US in August 2003. The security of the electricity networks in Canada is underpinned by NERC’s reliability, situational awareness and emergency preparedness standards, practices and procedures, which have been approved and implemented by most of Canada’s provinces.
ASSESSMENT
Canada’s electricity markets remain strongly integrated with those in the United States, and electricity is traded north-south in both directions. Canada’s only export market for electricity is the US, where Canada exports around 10% of its total electricity generating capacity, to meet about 2% of total end-use consumption within the US.
Since the last in-depth review, net export volumes from Canada to the US have almost doubled; however, the value of these exports has decreased by almost 25% between 2008 and 2012, amid falling US wholesale prices which are dwindling as a result of the shale gas revolution. Canadian electricity exports compete in a diversified set of market places in the US, from medium-term capacity markets in New England, New York and the Northeast/Midwest, to short-term capacity markets in Midwest, and co-ordinated power pools in the Western US.
Two factors have been impacting Canadian power exports since 2009. First, the ability of Canadian electricity exports to directly compete on price with conventional generation resources in the US has been impacted by the collapse of natural gas prices as a result of the shale gas revolution in the Northeast, Midwest, and South-Western US. A carbon price mechanism can bring an incentive to use low-carbon energy sources. Secondly, the Canadian industry has been paying a premium since 2012, in comparison with US industry consumers.
© O
EC
D/IE
A, 2
016
8. Electricity
206
Eight major international power lines are currently publicly proposed, which, if all constructed, would increase export capacity between Canada and the US by 6 000 MW. However, most of the projects are waiting for Presidential Permits in the United States, and have not filed regulatory applications with Canada’s National Energy Board. Canada has vast untapped potential in renewable and low-carbon electricity generation resources, particularly hydro and wind energy. While development of such resources requires careful consideration of its impact on the environment and local communities, there is also potential for new renewable generation to displace GHG-emitting generation in both countries.
Within Canada, changing electricity generation patterns and energy prices, including the phase-out of coal use in power generation and the refurbishments of large parts of its nuclear capacity in the next 10 to 20 years, are set to challenge the self-sufficiency approach taken by some of the provinces. However, this also presents an opportunity to invest in low-carbon energy sources to support the long-term adequacy, affordability and decarbonisation of power supplies in Canada. There are growing west-east trade flows, as provinces seek access to competitive price commodities. The IEA encourages the federal government to continue its efforts to facilitate greater cross-provincial investment in transmission by facilitating planning and permitting, in the interests of greater system flexibility and resilience. The federal government is further encouraged to support co-ordination across the regional system operators, including longer-term infrastructure planning, reliability and inter-operability, including in close co-ordination with North American reliability and regulatory bodies, like NERC.
Moving beyond local and small-size electricity markets, industry and consumers in Canada could benefit from integrating its wholesale markets into larger market areas with more diversified electricity options, which would also ensure greater reliability.
Electricity generating capacity is set to change in several provinces as a result of the expected phase-out of coal use in power generation, the refurbishment of existing nuclear reactors and the shut-down of others in Canada. Federal GHG regulations applying to new coal-fired power stations (and to existing plant at end-of-life) took effect in July 2015 and will encourage investment in low-carbon generation technologies. GHG regulations applying to gas-fired power plants are being developed, but their timing remains unclear.
In a context of price volatility and changes in the electricity resource mix, new inter- and intra-provincial electricity transmission lines are being considered by several provinces to have access to competitively priced gas supplies for power generation. However, the development of larger regional electricity markets in Canada faces a number of challenges, including traditions of provincial self-sufficiency, vertically integrated monopoly industry structures, and protection of access to local and export markets. The National Energy Board regulates international power lines and designated interprovincial transmission lines (so far none of the latter). However, there is no formal co-operation between the provinces on transmission and resource planning. In fact, inter-provincial power trade would also face substantial transmission tariff pancaking, as all provinces have one transmission system operator, and as there are no harmonised rules for inter-provincial electricity trade across Canada.
The economic and environmental benefits of stronger transmission interconnections between markets require careful analysis. Forums like the Federal-Provincial-Territorial Electricity Working Group could play an important role in considering how
© O
EC
D/IE
A, 2
016
8. Electricity
207
to improve market access for low-carbon electricity generation and how to undertake an integrated transmission investment planning between provinces, territories, and the US.
Canada has a strong interest in stepping up its co-operation with the US on resilience against weather and climate impacts on the power system and system reliability as well as on regional power market integration. Amid electricity market reforms in several provinces and the abolishment of independent system operators in favour of vertical integration, there is a need to ensure future co-operation with the US authorities on reliability. NERC finds lower reserve margins in the longer term, despite low load growth in a context of general system transformation, with retiring coal and nuclear plants and the growth of peak plants, natural gas and variable renewable energy resources. Despite the overall strong role of hydropower in the electricity mix of Canada’s provinces and territories, the impacts of system transformation have led to reforms in the electricity market.
Canada, like many countries, is facing the prospect of significant capital investment requirements in electricity infrastructure during the next two decades. While challenging, this need for new investment also presents a significant opportunity for Canada to invest in lower-emission generation, and in “smart grid” technology to ensure the efficient utilisation of network capacity, and to integrate intermittent renewables like wind and solar PV.
Canada’s provincially owned utilities have well-developed smart-grid strategies and demand-side management programmes. Canada is leading global efforts. It should leverage existing forums to collaborate on transmission and on the integration of renewable energies across its vast territory. Commendably, provinces and the federal government worked together in the Power Shift Atlantic, a very useful experience to share best practices and accelerate the uptake of innovation and programmes to limit inefficient growth in peak demand and facilitate integration of intermittent renewables. Given the vast experience of Canada and the differences in electricity market design across the territory, such initiatives should be further encouraged and developed.
RECOMMENDATIONS
The government of Canada should:
o Work with the provinces and the electricity industry to facilitate greater east-west interconnectivity between Canada’s electricity networks and greater integration of Canada’s electricity markets more generally.
o Study the costs and potential benefits of long-term system planning and system co-ordination at an interprovincial level to ensure efficient development of resources.
o Given the market integration with the US and changing electricity market design in several provinces, consider the development of mechanisms to formally and consistently engage on system reliability with US energy regulatory bodies, US system operators and system planners, to ensure the representation of both federal and provincial concerns.
o Foster the development of smart grid functionality by ensuring the development of security and interoperability standards across Canada.
© O
EC
D/IE
A, 2
016
8. Electricity
208
References BC Hydro (2013), Integrated Resource Plan, November.
CEA (Canadian Electricity Association), (2014a), Canada’s electricity industry data, at: http://powerforthefuture.ca/data-world/ (accessed on 9 April 2015).
CEA (2014b), Key Canadian electricity statistics, June.
Conference Board of Canada (2012), Shedding Light on the Economic Impact of Investing in Electricity Infrastructure, February.
DEFG (Distributed Energy Financial Group), (2015), Annual Baseline Assessment of Choice in Canada and the United States (ABACCUS), July.
Hydro-Quebec (2015), Comparison of electricity prices in major North American cities, rates in effect on 1 April 2014.
IEA (International Energy Agency) (2015a), Energy Balances of OECD Countries, www.iea.org/statistics/, OECD/IEA, Paris.
IEA (2015b), Electricity Information, www.iea.org/statistics, OECD/IEA, Paris.
IEA (2014a), Energy Prices and Taxes, www.iea.org/statistics, OECD/IEA, Paris.
IEA (2014b), Energy efficiency market report, OECD/IEA, Paris.
NEB (National Energy Board) (2016), Canada’s Energy Future 2016 – Energy Supply and Demand Projections to 2040.
NERC (North American Electric Reliability Corporation), (2014), 2014 Long-Term Reliability Assessment, November.
Nova Scotia (2015), Electricity Review Report Draft, February.
NRCan (2014), Energy Markets Fact Book, 2014-2015, Natural Resources Canada, 2014.
NTPC (Northwest Territories Power Corporation), (2014), Empowering, Annual Report.
OEB (Ontario Energy Board), (2013), Ontario’s System-Wide Electricity Supply Mix: 2013 Data, www.ontarioenergyboard.ca/oeb/_Documents/Regulatory/2013_Supply_Mix_Data.pdf.
RMRC (Retail Market Review Committee of the Member of the Legislative Assembly), (2012), Power for the People, Recommendations for the Minister of Energy, Government of Alberta, September.
© O
EC
D/IE
A, 2
016
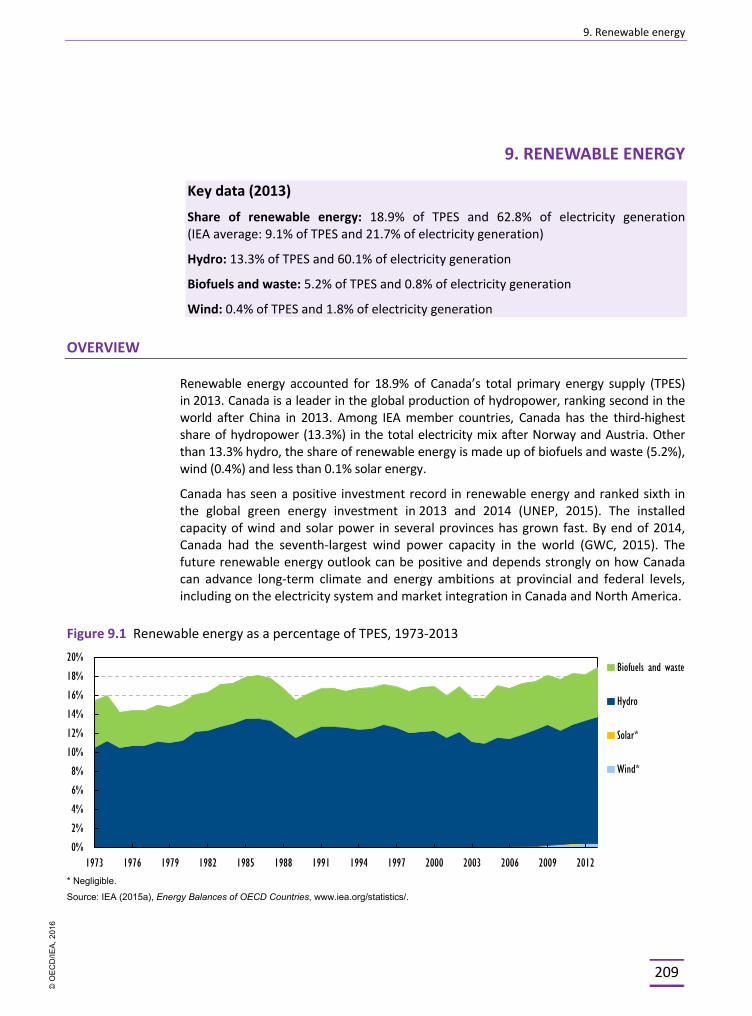
9. Renewable energy
209
9. RENEWABLE ENERGY
Key data (2013)
Share of renewable energy: 18.9% of TPES and 62.8% of electricity generation (IEA average: 9.1% of TPES and 21.7% of electricity generation)
Hydro: 13.3% of TPES and 60.1% of electricity generation
Biofuels and waste: 5.2% of TPES and 0.8% of electricity generation
Wind: 0.4% of TPES and 1.8% of electricity generation
OVERVIEW
Renewable energy accounted for 18.9% of Canada’s total primary energy supply (TPES) in 2013. Canada is a leader in the global production of hydropower, ranking second in the world after China in 2013. Among IEA member countries, Canada has the third-highest share of hydropower (13.3%) in the total electricity mix after Norway and Austria. Other than 13.3% hydro, the share of renewable energy is made up of biofuels and waste (5.2%), wind (0.4%) and less than 0.1% solar energy.
Canada has seen a positive investment record in renewable energy and ranked sixth in the global green energy investment in 2013 and 2014 (UNEP, 2015). The installed capacity of wind and solar power in several provinces has grown fast. By end of 2014, Canada had the seventh-largest wind power capacity in the world (GWC, 2015). The future renewable energy outlook can be positive and depends strongly on how Canada can advance long-term climate and energy ambitions at provincial and federal levels, including on the electricity system and market integration in Canada and North America.
Figure 9.1 Renewable energy as a percentage of TPES, 1973-2013
* Negligible.
Source: IEA (2015a), Energy Balances of OECD Countries, www.iea.org/statistics/.
0%
2%
4%
6%
8%
10%
12%
14%
16%
18%
20%
1973 1976 1979 1982 1985 1988 1991 1994 1997 2000 2003 2006 2009 2012
Biofuels and waste
Hydro
Solar*
Wind*
© O
EC
D/IE
A, 2
016
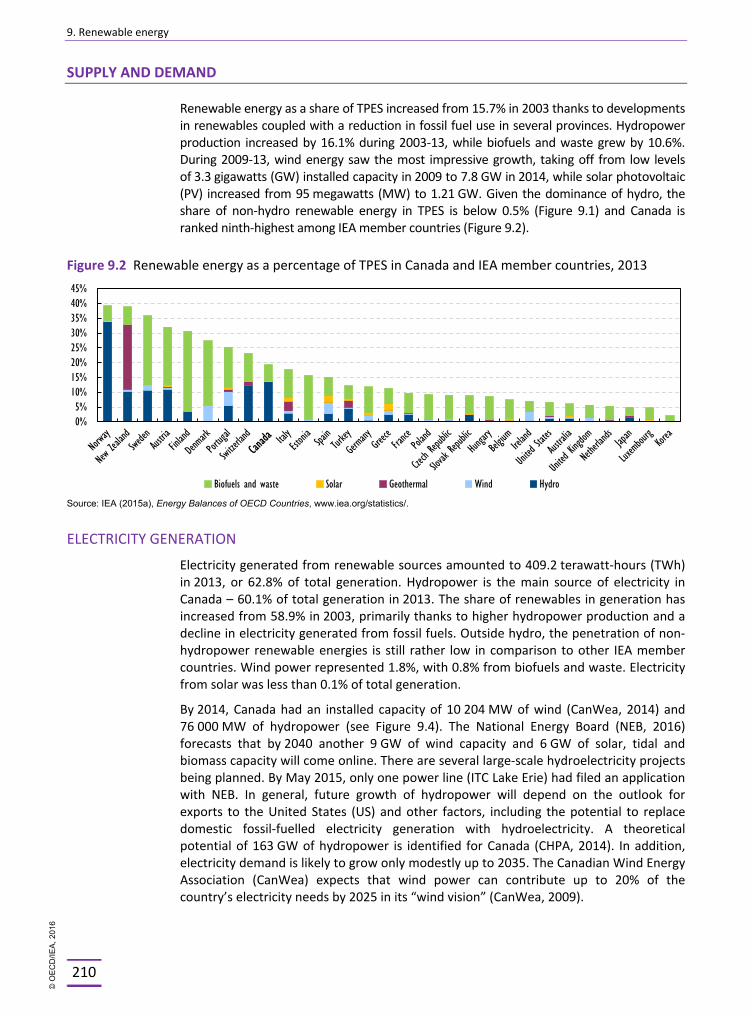
9. Renewable energy
210
SUPPLY AND DEMAND
Renewable energy as a share of TPES increased from 15.7% in 2003 thanks to developments in renewables coupled with a reduction in fossil fuel use in several provinces. Hydropower production increased by 16.1% during 2003-13, while biofuels and waste grew by 10.6%. During 2009-13, wind energy saw the most impressive growth, taking off from low levels of 3.3 gigawatts (GW) installed capacity in 2009 to 7.8 GW in 2014, while solar photovoltaic (PV) increased from 95 megawatts (MW) to 1.21 GW. Given the dominance of hydro, the share of non-hydro renewable energy in TPES is below 0.5% (Figure 9.1) and Canada is ranked ninth-highest among IEA member countries (Figure 9.2).
Figure 9.2 Renewable energy as a percentage of TPES in Canada and IEA member countries, 2013
Source: IEA (2015a), Energy Balances of OECD Countries, www.iea.org/statistics/.
ELECTRICITY GENERATION
Electricity generated from renewable sources amounted to 409.2 terawatt-hours (TWh) in 2013, or 62.8% of total generation. Hydropower is the main source of electricity in Canada – 60.1% of total generation in 2013. The share of renewables in generation has increased from 58.9% in 2003, primarily thanks to higher hydropower production and a decline in electricity generated from fossil fuels. Outside hydro, the penetration of non-hydropower renewable energies is still rather low in comparison to other IEA member countries. Wind power represented 1.8%, with 0.8% from biofuels and waste. Electricity from solar was less than 0.1% of total generation.
By 2014, Canada had an installed capacity of 10 204 MW of wind (CanWea, 2014) and 76 000 MW of hydropower (see Figure 9.4). The National Energy Board (NEB, 2016) forecasts that by 2040 another 9 GW of wind capacity and 6 GW of solar, tidal and biomass capacity will come online. There are several large-scale hydroelectricity projects being planned. By May 2015, only one power line (ITC Lake Erie) had filed an application with NEB. In general, future growth of hydropower will depend on the outlook for exports to the United States (US) and other factors, including the potential to replace domestic fossil-fuelled electricity generation with hydroelectricity. A theoretical potential of 163 GW of hydropower is identified for Canada (CHPA, 2014). In addition, electricity demand is likely to grow only modestly up to 2035. The Canadian Wind Energy Association (CanWea) expects that wind power can contribute up to 20% of the country’s electricity needs by 2025 in its “wind vision” (CanWea, 2009).
0%5%
10%15%20%25%30%35%40%45%
Biofuels and waste Solar Geothermal Wind Hydro
© O
EC
D/IE
A, 2
016
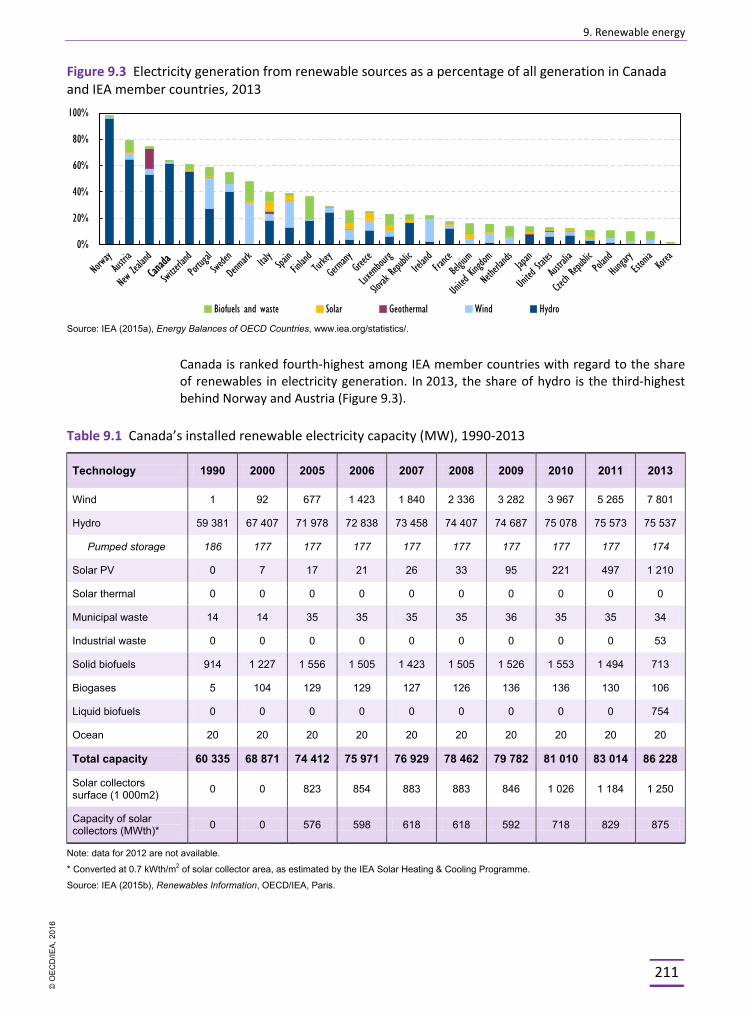
9. Renewable energy
211
Figure 9.3 Electricity generation from renewable sources as a percentage of all generation in Canada and IEA member countries, 2013
Source: IEA (2015a), Energy Balances of OECD Countries, www.iea.org/statistics/.
Canada is ranked fourth-highest among IEA member countries with regard to the share of renewables in electricity generation. In 2013, the share of hydro is the third-highest behind Norway and Austria (Figure 9.3).
Table 9.1 Canada’s installed renewable electricity capacity (MW), 1990-2013
Technology 1990 2000 2005 2006 2007 2008 2009 2010 2011 2013
Wind 1 92 677 1 423 1 840 2 336 3 282 3 967 5 265 7 801
Hydro 59 381 67 407 71 978 72 838 73 458 74 407 74 687 75 078 75 573 75 537
Pumped storage 186 177 177 177 177 177 177 177 177 174
Solar PV 0 7 17 21 26 33 95 221 497 1 210
Solar thermal 0 0 0 0 0 0 0 0 0 0
Municipal waste 14 14 35 35 35 35 36 35 35 34
Industrial waste 0 0 0 0 0 0 0 0 0 53
Solid biofuels 914 1 227 1 556 1 505 1 423 1 505 1 526 1 553 1 494 713
Biogases 5 104 129 129 127 126 136 136 130 106
Liquid biofuels 0 0 0 0 0 0 0 0 0 754
Ocean 20 20 20 20 20 20 20 20 20 20
Total capacity 60 335 68 871 74 412 75 971 76 929 78 462 79 782 81 010 83 014 86 228
Solar collectors surface (1 000m2) 0 0 823 854 883 883 846 1 026 1 184 1 250
Capacity of solar collectors (MWth)* 0 0 576 598 618 618 592 718 829 875
Note: data for 2012 are not available.
* Converted at 0.7 kWth/m2 of solar collector area, as estimated by the IEA Solar Heating & Cooling Programme.
Source: IEA (2015b), Renewables Information, OECD/IEA, Paris.
0%
20%
40%
60%
80%
100%
Biofuels and waste Solar Geothermal Wind Hydro
© O
EC
D/IE
A, 2
016
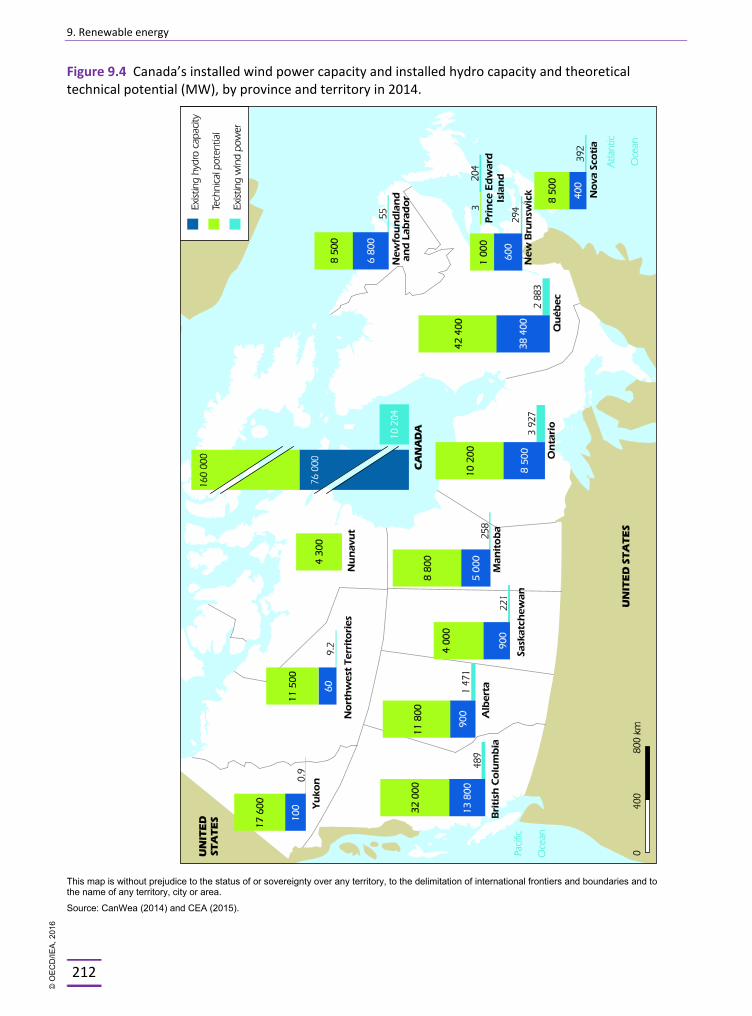
9. Renewable energy
212
Figure 9.4 Canada’s installed wind power capacity and installed hydro capacity and theoretical technical potential (MW), by province and territory in 2014.
This map is without prejudice to the status of or sovereignty over any territory, to the delimitation of international frontiers and boundaries and to the name of any territory, city or area.
Source: CanWea (2014) and CEA (2015).
© O
EC
D/IE
A, 2
016
9. Renewable energy
213
INSTITUTIONAL FRAMEWORK
Provincial governments have exclusive jurisdiction over the development and management of energy resources in their respective provinces, including the support mechanisms for renewable energy and the design of their electricity markets.
One exception is marine renewable energy development in Canada’s federal offshore. This is a federal responsibility, as the federal government has exclusive ownership of lands and jurisdiction over natural resources in offshore areas outside provincial boundaries.
At the federal level, Natural Resources Canada (NRCan) is responsible for developing and implementing policies and programmes aimed at increasing the deployment of renewable energy technologies for electricity and heat generation. NRCan also provides policy, funding, research and development (R&D) support related to alternative energy technologies and renewable fuels.
Environment Canada provides regulatory support for renewable fuels. Agriculture and Agri-food Canada oversees the participation of agriculture in the renewable fuels sector through various programmes and policies. Finance Canada is responsible for federal tax incentives.
The federal government collaborates with provincial governments on issues of pan-Canadian interest, such as electric reliability, under the auspices of the Energy and Mines Minister’s Conference (EMMC) and the Ministers of the Environment Conference.
Collaboration has increased among the Atlantic provinces with regard to renewable energy deployment and grid integration since 2011, which was also supported by federal funding under the Atlantic Energy Gateway Initiative.
Canada actively co-operates with the United States on renewable energy resources, notably under the Clean Energy Dialogue (CED), on the regulatory framework for marine energy, the integration of variable renewable energy and the role of hydro, distributed energy storage and smart grids.
FEDERAL POLICIES AND PROGRAMMES
The federal government aims to improve the relative economics of renewable energy investment through a mix of programmes and policies, with strong focus on tax incentives, environmental regulations and some funding programmes and loan guarantees.
ELECTRICITY AND HEAT
The federal government provides two related tax incentives to promote investment in clean energy generation equipment.
§ Accelerated capital cost allowance (CCA) is provided for capital assets under CCA Class 43.2 at 50% per year on a declining balance basis.1.2. The class includes
1. For income tax purposes, the capital cost allowance (CCA) system determines how much a business may deduct each year for the capital cost of an asset. CCA rates are generally set so that the deduction for capital costs is spread out over the useful life of the asset. Accelerated CCA rates promote investment in particular assets or sectors in specific circumstances. 2. Class 43.2 was introduced in 2005, to provide a higher CCA rate (50%) than the pre-existing Class 43.1 (30%) for assets acquired before 23 February 2005. The eligibility criteria are the same for the two classes except that co-generation systems that use fossil fuels must meet a higher efficiency standard for Class 43.2 than that for Class 43.1. Systems that only meet the lower efficiency standard continue to be eligible for Class 43.1 if acquired during the period from 2005 to 2020 while class 43.2 is in effect.
© O
EC
D/IE
A, 2
016
9. Renewable energy
214
a variety of equipments that generate or conserve energy by using a renewable energy source (e.g., wind, solar, small hydro), using fuels from waste (e.g. landfill gas, wood waste, manure), or by making efficient use of fossil fuels (e.g. high-efficiency co-generation systems).
§ The Canadian Renewable and Conservation Expense provision allows certain intangible start-up expenses associated with Class 43.2 projects to be deducted in full in the year incurred, or transferred to investors using flow-through shares. Since 2009, the scope of these provisions has been expanded to cover additional equipment in areas including bioenergy, water-current energy, district energy, waste heat and waste gasification.
The federal government is no longer providing funding for deployment of new renewable energy projects. In the past, it provided direct production subsidies through the ecoENERGY for Renewable Power (ecoRP), the ecoENERGY for renewable heat (ecoRH) and the wind power production incentive (WPPI) programmes. Funding for new projects ended on 31 March 2011 for ecoRP and for WPPI on 31 March 2007, but they continue to make payments for electricity production from existing projects until March 2021 and March 2017, respectively. Up to 2021, the ecoRP will have supported 4 458 MW of renewable energy capacity, such as hydro, wind, solar PV and biomass, through a production incentive of 1 CAD cent per kilowatt-hour (kWh) for up to ten years for electricity generated from eligible renewable energy projects.
The federal government has also provided a loan guarantee for the 824 MW Muskrat Falls Hydroelectric Generating Station in Labrador, along with associated transmission lines, including the Labrador Transmission Assets (LTA), the Labrador-Island Link (LIL), and the Maritime Link. The total amount of debt guaranteed by Canada is CAD 6.3 billion.
Under the Marine Renewable Energy Enabling Measures (MREEM) programme, the federal government is developing a federal policy framework for administering marine renewable energy activities (e.g. offshore wind, wave, tidal and ocean current) in the federal offshore. The programme involves research and analysis of federal legislation and regulations, examination of other countries’ marine renewable energy management regimes and consultations with stakeholders. The policy framework will provide the federal government with options and recommendations for administering marine renewable energy activities in the federal offshore.
TRANSPORT
Canada has seen an increase in the uptake of biofuels in the transport sector and the development of a renewable fuel industry, thanks to blending requirements set under federal Renewable Fuels Regulations, provincial regulations and public funding provided to technology development.
Producers and importers of petroleum fuels have to ensure an average 5% renewables content for gasoline (as of 15 December 2010), and 2% in diesel fuel (as of 1 July 2011). Federal rules build on existing fuel blending obligations and some provinces are going beyond national requirements. Alberta’s renewable fuels standard, implemented in 2011, requires an average of 2% renewable diesel in diesel fuel and 5% renewable alcohol content in gasoline sold in Alberta. British Columbia and Ontario have biofuel requirements of 4% renewable diesel and Saskatchewan and Manitoba have higher ethanol blending requirements of 7.5% and 8.5%, respectively.
© O
EC
D/IE
A, 2
016

9. Renewable energy
215
Under the federal ecoENERGY for Biofuels programme, up to CAD 1.5 billion in operating incentives will be given to producers of renewable alternatives to gasoline and diesel from 2008 to 2017. The ecoAgriculture Biofuels Capital Initiative provided capital for the construction or expansion of biofuel facilities with farmer participation until 31 March 2013 with a budget of CAD 159 million. NextGen Biofuels Fund provides funding to support the construction of first-of-a-kind large-scale demonstration facilities for the production of next-generation renewable fuels with a budget of CAD 275 million for the period 2007 to 31 March 2015.
RENEWABLE ELECTRICITY IN THE PROVINCES AND TERRITORIES OF CANADA
Federal and provincial tax measures and programmes have kicked off the renewable energy industry since early 2002.
Provinces have put in place competitive procurement requests for proposals, standard offer contracts, feed-in tariffs, renewable portfolio standards, small equipment rebates, tax credits, etc. The drivers behind the growth of renewables vary, depending on the province’s situation and objectives for GHG emissions reductions, climate change, local economic development, and energy diversification.
There are quantity-based or price-based power procurement methods (Figure 9.5). Table 9.2 provides an overview of the policies adopted by provinces and territories, including targets for renewable energies and support programmes.
The first mechanism sets a minimum quantity of energy or capacity from renewable power within a certain timeframe, through requests for proposals/tenders or renewable portfolio standards (RPS), and the market establishes the price. The standards are adopted by the Atlantic provinces of Prince Edward Island, Nova Scotia and New Brunswick.
In the price-based method, long-term contracts are set by technology at a pre-arranged price, through feed-in tariffs (FITs) or standard offer contracts, and the market subsequently determines the capacity or energy.
In addition to tenders, carbon mechanisms also support the development of renewable energy, as they encourage the use of clean fuels.
Quebec has a cap-and-trade mechanism; in April 2015, Ontario announced plans to join the Western Climate Initiative and to introduce such a system. In Alberta, renewable energy producers are participating in the wholesale spot market and have incentives through the carbon offset credit system under its Specific Gas Emitters Regulation.
Quebec and Ontario are the main growth markets for renewable deployment in terms of capacity increases, as can be seen from Figure 9.4 showing the installed capacity of wind power. Many other provinces have adopted energy strategies with objectives for renewable electricity.
Canada has not only a vast renewable resource potential but also a rich experience of deploying renewable energies in different electricity systems, energy markets and under different forms of support schemes and grid operation.
Figure 9.2 provides an overview of the policies adopted by provinces and territories including targets for renewable energies and support programmes. The following sections describe in detail the targets and special support programmes and their unique features for each province and territory.
© O
EC
D/IE
A, 2
016
9. Renewable energy
216
Alberta
Alberta saw wind power growth, reaching 1 459 MW in 2014, up by approximately 150% since 2009. However, despite its favourable geographic conditions, Alberta’s electricity mix is dominated by coal. On 22 November 2015, Alberta government presented the Climate Leadership Plan with intentions to phase-out coal-fired power generation, going beyond federal emission performance standards, in favour of increasing the share of renewable energy in the electricity mix to 30% by 2030. The plan also envisages an emission limit of 100 megatonnes on oilsands related activities, including provisions for upgrading and co-generation, and a methane reduction strategy to reduce emissions by 45% from 2014 levels by 2025. Alberta decided to introduce a price on carbon in all sectors at CAD 20 per tonne in January 2017 and CAD 30 per tonne in January 2018.
Alberta has the only electricity market in Canada with a fully competitive market, allowing for both wholesale and retail competition. To date, the province does not offer subsidies for alternative and renewable electricity. However, an Alternative and Renewable Energy Framework was in under preparation in 2015, in support of the new climate strategy.
Under its Climate Change and Emissions Management Act, Alberta promoted biofuels and implemented a renewable fuels standard (RFS) in April 2011. The RFS requires commercial fuel producers to blend renewable products into their fuels. Renewable fuels are made from biological sources such as grains and canola, and forestry and livestock waste products. An average of 5% of renewable alcohol is required in gasoline and 2% of renewable diesel is required in diesel fuel sold in the province. Renewable fuels must demonstrate at least 25% fewer greenhouse gas (GHG) emissions than the equivalent petroleum fuel to be eligible under the RFS. The RFS reduces GHG emissions by about one million tonnes (Mt) each year, which is equivalent to taking 260 000 vehicles off Alberta’s roads.
Alberta also has a Micro-generation Regulation that came into effect in January 2009. The regulation enables customers to generate their own alternative and renewable electricity to meet their electricity needs. There has been a steady growth in the number of micro-generation sites. In January 2010, Alberta had 119 sites for a total of 0.43 MW of capacity and in January 2015, Alberta had 1 147 sites for a total of 6.56 MW. The majority of the micro-generation sites are solar PV installations.
British Columbia
British Columbia‘s Clean Energy Act 2010 sets out provincial energy objectives, including the goal of at least 93% of the electricity generated in British Columbia to come from clean or renewable resources, including biomass, biogas, biogenic waste, geothermal heat, hydro, solar, ocean or wind. This is the highest renewable fuel standard in North America. The province aims to achieve electricity self-sufficiency by 2016, and have in place 3 000 GWh of reserve production capacity by 2020 and an increased contribution of demand-side management target (66%).
The province is a leader in clean transportation, with a world-leading hydrogen and fuel-cell industry, one of the highest per capita electric vehicle adoption rates in Canada, and the largest public charging network in Canada. British Columbia has revamped its standard offer programmes which are in place for large-scale deployment of mature renewable energy technologies, while the feed-in-tariff is limited to emerging technologies, such as ocean energy.
© O
EC
D/IE
A, 2
016
9. Renewable energy
217
The province’s regulation on renewable and low carbon fuel requirements identifies an annual average of 5% renewables content in gasoline sold in the province and a corresponding 4% renewables content in diesel. By 2020, a 10% reduction in the average carbon intensity of transport fuels should be achieved.
Created in 2008 from the revenues of a levy on energy sales, the Innovative Clean Energy (ICE) Fund continues to support government’s energy, economic, environmental priorities which include self-sufficiency, energy conservation and GHG emission reduction. Approximately CAD 19 million for clean energy projects is allocated over the next three years (2015/16 to 2017/18) in the ICE Fund for the following programmes:
§ Clean Energy Vehicle Program – Phase 2 with incentives to purchase electric vehicle and vehicle charging infrastructure
§ Public Sector Energy Partnerships
Community Energy Leadership Program
Post-Secondary Clean Energy Partnerships Program
§ Energy Efficiency and Conservation Programs
B.C. - NRCan ISO 50001 Implementation Incentive
Oil to Heat Pump Incentive Program
§ Completion of remaining 2008-2014 technology pre-commercialisation projects
Manitoba
In 2012, Manitoba adopted its Clean Energy Strategy and Tomorrow Now: Manitoba’s Green Plan with a strong focus on renewable electricity. Manitoba Hydro, a Crown corporation owned by the province, offers to eligible home-owners solar water-heating incentives and allows customers to generate their own electricity from renewable sources (e.g. wind or solar) or non-renewable energy (e.g. fossil fuels) up to 10 MW, so that they can use the energy they produce to meet their own needs and/or possibly sell excess production to Manitoba Hydro (net metering). There are no rebates for the installation of on-site renewable customer-owned generation sources.
New Brunswick
The provincially owned utility, New Brunswick Power, responsible for electricity generation and distribution in the province, has implemented a net metering programme which provides customers with the option to connect their own environmentally sustainable generation unit to NB Power's distribution system. The programme allows customers to generate their own electricity to offset their consumption, while still remaining connected to NB Power's distribution system. Net metering provides readings for both electricity consumption from NB Power, and the excess electricity sent back to the distribution system. Customers are billed for the “net” amount of electricity used. In order to qualify for the programme, the generation units must meet NB Power’s technical requirements, not to exceed 100 kW, come from renewable energy sources compatible with Environment Canada's Environmental Choice Program (EcoLogo TM) standards such as alternative use, biogas, biomass, solar, small hydro or wind, and use approved equipment – certified by an organisation recognised in
© O
EC
D/IE
A, 2
016
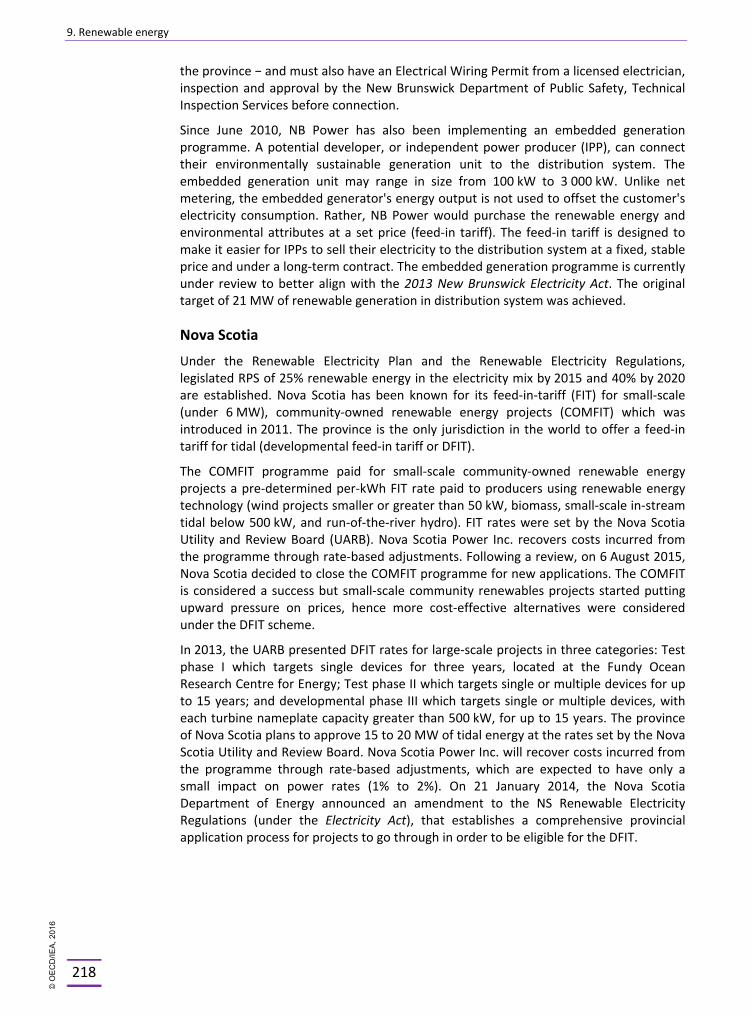
9. Renewable energy
218
the province − and must also have an Electrical Wiring Permit from a licensed electrician, inspection and approval by the New Brunswick Department of Public Safety, Technical Inspection Services before connection.
Since June 2010, NB Power has also been implementing an embedded generation programme. A potential developer, or independent power producer (IPP), can connect their environmentally sustainable generation unit to the distribution system. The embedded generation unit may range in size from 100 kW to 3 000 kW. Unlike net metering, the embedded generator's energy output is not used to offset the customer's electricity consumption. Rather, NB Power would purchase the renewable energy and environmental attributes at a set price (feed-in tariff). The feed-in tariff is designed to make it easier for IPPs to sell their electricity to the distribution system at a fixed, stable price and under a long-term contract. The embedded generation programme is currently under review to better align with the 2013 New Brunswick Electricity Act. The original target of 21 MW of renewable generation in distribution system was achieved.
Nova Scotia
Under the Renewable Electricity Plan and the Renewable Electricity Regulations, legislated RPS of 25% renewable energy in the electricity mix by 2015 and 40% by 2020 are established. Nova Scotia has been known for its feed-in-tariff (FIT) for small-scale (under 6 MW), community-owned renewable energy projects (COMFIT) which was introduced in 2011. The province is the only jurisdiction in the world to offer a feed-in tariff for tidal (developmental feed-in tariff or DFIT).
The COMFIT programme paid for small-scale community-owned renewable energy projects a pre-determined per-kWh FIT rate paid to producers using renewable energy technology (wind projects smaller or greater than 50 kW, biomass, small-scale in-stream tidal below 500 kW, and run-of-the-river hydro). FIT rates were set by the Nova Scotia Utility and Review Board (UARB). Nova Scotia Power Inc. recovers costs incurred from the programme through rate-based adjustments. Following a review, on 6 August 2015, Nova Scotia decided to close the COMFIT programme for new applications. The COMFIT is considered a success but small-scale community renewables projects started putting upward pressure on prices, hence more cost-effective alternatives were considered under the DFIT scheme.
In 2013, the UARB presented DFIT rates for large-scale projects in three categories: Test phase I which targets single devices for three years, located at the Fundy Ocean Research Centre for Energy; Test phase II which targets single or multiple devices for up to 15 years; and developmental phase III which targets single or multiple devices, with each turbine nameplate capacity greater than 500 kW, for up to 15 years. The province of Nova Scotia plans to approve 15 to 20 MW of tidal energy at the rates set by the Nova Scotia Utility and Review Board. Nova Scotia Power Inc. will recover costs incurred from the programme through rate-based adjustments, which are expected to have only a small impact on power rates (1% to 2%). On 21 January 2014, the Nova Scotia Department of Energy announced an amendment to the NS Renewable Electricity Regulations (under the Electricity Act), that establishes a comprehensive provincial application process for projects to go through in order to be eligible for the DFIT.
© O
EC
D/IE
A, 2
016
9. Renewable energy
219
Figure 9.5 Renewable energy procurement mechanisms by province, May 2013
This map is without prejudice to the status of or sovereignty over any territory, to the delimitation of international frontiers and boundaries and to the name of any territory, city or area.
Source: NRCan, (2014).
© O
EC
D/IE
A, 2
016

9. Renewable energy
220
Table 9.2 Provincial and territorial renewable energy policies and initiatives
Province/Territory Renewable energy policy and measures
Alberta
• Funding of renewable energy projects: Climate Change and Emissions Management Fund; Alberta Innovates; Energy and Environment Solutions; Alberta’s Bioenergy Programs (2011-2016) consisting of Bioenergy Producer Credit Program, Biorefining and Commercialisation and Market Development Grant; and Infrastructure Development Grant Program 2007/08 to 2010/11
• Net billing for micro-generation • Alberta Carbon Offset Program: offsets are granted to renewable energy producers at a rate of
approximately 0.6 tonne per MWh and have a value of CAD 10 to 14 per tonne.
British Columbia
• Clean Energy Act (2010) with a target of 93% of clean energy in the electricity mix • BC Hydro’s Standing Offer Program for clean energy resources up to 15 MW • BC Hydro’s Clean Power Calls (2006, 2008); Bioenergy Calls ((2008, 2010); and Community-based
Biomass Power Call (2010). • Net Metering Program (up to 100 kW) • All new electricity generation projects will have zero net greenhouse gas emissions • Innovative Clean Energy Fund Calls for Application (2008-2010) of which 62 approved clean
technology projects in bioenergy, solar, ocean, and energy conservation and management. • BC Energy Plan, Bioenergy Plan • Clean Energy Vehicle Incentive Program for vehicles and charging infrastructure • British Columbia is the only jurisdiction in Canada with both a renewable fuel requirement and a
low-carbon fuel requirement.
Manitoba • Clean Energy Strategy (2012) and Tomorrow Now: Manitoba’s Green Plan (2012) outlines a target
of 2.3 GW of new hydro and 1 GW of wind power • Manitoba Green Energy Equipment Tax Credit
New Brunswick
• Legislated RPS of 10% for 2016 and policy commitment to increase to 40% by 2020 under New Brunswick Energy Blueprint (2011)
• Net metering and embedded FIT for micro and small generators • Request for proposals for wind power
Nova Scotia
• Legislated RPS of 25% renewable energy in the electricity mix by 2015 and 40% by 2020 • Enhanced net metering for distribution-connected customers • Community FIT programme for distribution-connected projects • Tidal energy FIT • Request for proposals for large-scale, transmission-connected projects
Newfoundland and Labrador
• 98% of electricity will come from renewable energies with completion of Muskrat Falls in 2018 • Potential for hydro and wind in isolated areas to replace diesel generation
Northwest Territories • Hydro, biomass and solar energy strategies • Renewable Energy Fund subsidises renewable energy generation
Nunavut • Ikummatiit territorial energy strategy (2007) focuses on alternative energy sources and efficient use of energy
Ontario
• Plans to join Western Climate Initiative and introduce a cap-and trade system • Replace the Renewable Energy Standard Offer Program (2007-09), the 2009 Green Energy Act-
introduced FIT programme which was revised three times since • Target of 10 700 MW of RES, wind, solar PV, biomass, excluding hydro by 2018 • Competitive programme for larger projects • Net metering for small producers
Prince Edward Island • Since 2010 legislated RPS of 15% imposed on load-shifting utilities • Net metering for small energy producers
Quebec
• Cap-and-trade mechanism, linked with California (Western Climate Initiative) • Quebec Energy Strategy (2006-2015) outlines intended additions of 4.5 GW hydropower and 4 GW
wind power capacity • Hydro-Quebec Production mainly responsible for developing hydro facilities above 50 MW and
Hydro-Quebec tenders out wind and biomass capacity according to government orders and subject to approval by the regulator, la Régie de l’Énergie
• Net metering for small producers
© O
EC
D/IE
A, 2
016
9. Renewable energy
221
• Hydro-Quebec will install a total of 3.8 million smart meters by 2018 • Quebec Electric Circuit is Canada’s first public charging stations network for electric vehicles
(started in 2011), with 358 charging stations (2014)
Saskatchewan
• Saskatchewan Power Corporation (SaskPower) has a commercial target of doubling wind power capacity by 2017 to 9% of total generating capacity
• SaskPower awards projects following request for proposals • Net metering for small producers
Yukon • Yukon Energy Strategy considers renewables
Notes: FIT = feed-in tariff; RES = renewable energy sources; RPS = renewable portfolio standards.
Ontario
Ontario has been implementing the first large-scale feed-in tariff programme in North America under the 2009 Green Energy and Green Economy Act, replacing the earlier Renewable Energy Standard Offer Program (RESOP) of 2007. Investment in decarbonisation and renewable energy helps Ontario meet its goals for improving air quality and phasing out coal-fired generation, as set out in the Long-Term Energy Plan of 2010.
Ontario largely departed from the competitive wholesale market and deregulation of the 1990s and has today a hybrid model with regulated fixed prices, through long-term government-backed contracts provided by the independent electricity system operator (IESO), formerly through Ontario Power Authority (OPA), which remain outside the wholesale market and its hourly Ontario electricity price (HOEP).
The regulatory landscape for renewable electricity has been evolving since the introduction of the first feed-in tariff in 2009.
Several lessons were learnt from Ontario’s first FIT design which forced the Ontario government to review its policy: i) environmental concerns in municipalities accelerated as municipalities had to connect feed-in tariff-contracted projects (take or pay), ii) consumer prices increased substantially; iii) local content rules were challenged by global trade partners under the World Trade Organization (WTO); and iv) the role of OPA as system planner and FIT programme administrator vis-à-vis the independent electricity system operator was reinforced.
The Ontario Power Authority (OPA), established by the Electricity Restructuring Act of 2004, was the majority buyer in the market to contract electricity from renewable energy generators in return for a 20-year FIT contract (40 years for hydropower). As job creation and economic recovery were the major drivers of the first FIT programmes, local content requirements were added to the FIT programme. Originally, OPA had not only functions to ensure a reliable, sustainable, long-term supply of electricity for the province through FIT programmes but also the task to ensure adequacy and reliability of electricity for the medium and long term, independent planning for electricity generation, demand management, conservation and transmission.
Since 1 January 2015, the functions of OPA and the independent system operator were merged into the independent electricity system operator (IESO) who administers the FIT programme under the direction of the Ministry of Energy. The merger and the announcement of the government to join the Western Climate Initiative and introduce a cap-and-trade system aim to improve the cost-effectiveness of the renewable energy policy over time.
IESO progress report (IESO, 2014) outlines that, as of 31 December 2014, the total capacity under development under the FIT programme was 3 462 MW, of which
© O
EC
D/IE
A, 2
016
9. Renewable energy
222
2 228 MW of wind energy projects, 807 MW of solar photovoltaic projects, 251 MW of hydroelectric projects, and 176 MW of bioenergy projects. By 31 December 2014, a total of 2 409 MW of new renewable energy capacity was in operation in Ontario.
Following the FIT Two-Year Review Report in 2012, the government has amended the FIT programme several times (FIT 2 in 2013, FIT 3 in 2014 and FIT 4 in 2015). As of 2013, the FIT programme was limited to small-scale projects connected to the distribution grid. The main pillars of the Ontario FIT programme include:
§ Separate annual procurement targets for FIT (>10 kW and <500 kW electricity generation) and microFIT (10 kW and under) for each of the next four years (2014-2018)
§ Replacing the large FIT (>500 kW) programme with a new competitive large renewable procurement (LRP)
§ Strengthening participation of municipalities and public-sector entities (e.g. publicly funded schools, public colleges, public universities, hospitals, public transit services); Reviewing FIT prices every year in October with the updated price schedules to become effective on 1 January of the following year
§ There are special FIT price adders for Aboriginal, community, municipal and public sector participation.
The Ontario FIT has been continuously updated to make it consistent with WTO rules. On 16 August 2013, the Ontario Ministry of Energy also published changes to the domestic content rules to make the FIT programme compliant with the 24 May 2013 WTO ruling by lowering the domestic content requirements for onshore wind facilities and solar PV facilities. The Ontario Parliament adopted the changes to its Green Energy Act in August 2014. The domestic content requirements for new FIT contracts awarded as of 16 August 2013 are as follows:
§ 20% for onshore wind facilities
§ 22% minimum domestic content levels for solar PV facilities utilising crystalline silicon PV technology
§ 28% minimum domestic content levels for solar PV facilities utilising thin-film PV technology
§ 28% minimum domestic content levels for solar PV facilities utilising concentrated PV technology.
Several trade disputes are taking place over solar energy between the major economies. Next to European Union and the United States, the Canadian Border Services Agency has also commenced an investigation into the allegations that China subsidised photovoltaic modules and laminates in Canada, after four Ontario photovoltaic module and laminate producers filed a formal complaint in 2014.
Prince Edward Island
Prince Edward Island generates 99% of its electricity from wind power, as it does not have nuclear or hydropower generation facilities on the island. Wind power accounts for roughly 30% of the electricity mix, as the lion’s share of electricity supply comes primarily from nuclear and oil power supplied from New Brunswick via subsea cables. The island has 60 MW of thermal generation, and around 100 MW of diesel-fired combustion turbines, all of which is used primarily as backup when supply is not
© O
EC
D/IE
A, 2
016
9. Renewable energy
223
available from New Brunswick. Prince Edward Island’s electricity needs are covered by means of short-term contracts at the New England wholesale market and long-term contracts with New Brunswick’s NB Power (Point Lepreau nuclear facility), via two submarine cables. Overproduction from the island’s wind farms is exported via the same submarine cables during peak production and low demand.
Quebec
The Quebec Energy Strategy (2006-2015) outlined objectives to install 4.5 GW of new hydropower and 3 GW of wind power by 2015. Following this strategy, large hydro projects negotiations and studies were launched. In 2009, after all agreements and environmental permits have been obtained, Hydro-Quebec began the construction of La Romaine Complex, which will have a capacity of 1 550 MW and generate 8.0 TWh annually when completed (expected in 2020). In 2014, Romaine-2 generating station (640 MW) was commissioned.
To achieve the Energy Strategy objectives, Quebec also contracted new electricity supply through tendering of wind, biomass and small hydro.
When all wind projects contracted will operate, Quebec’s wind energy capacity will have attained nearly 4 GW, which represents 10% of the total installed capacity. Its subsidiary Hydro-Quebec TransÉnergie will have to integrate hydro and wind power in order to maintain grid stability of the electricity system, next to investment in transmission.
Hydro-Quebec Distribution purchases electricity mainly from hydro and wind sources. In all, 99% of the electricity sold in 2014 came from renewable sources. In 2014, when peak demand exceeded the province’s production capacity, the Régie de l’Énergie authorised Hydro-Quebec to call a tender for 500 MW of power supply. In order to manage the demand side, the installation of 3.8 million smart meters by 2018 has also been approved and is currently under way, with more than 2.7 million smart meters installed.
The Quebec Energy Strategy asked the natural gas and power distributors to implement energy efficiency programmes to 350 million cubic metres (mcm) and 8 TWh by 2015.
Quebec has the objective to reduce its GHG emissions by 20% below 1990 levels by 2020. The Climate Change Action Plans (2006-2012 and 2013-2020) measures, funded by the Fonds Vert, have financed many energy efficiency, fuel-switch and technology development projects in order to achieve the 20% target. Le Fonds Vert has been fed since 2007 with a due for each unit of fossil fuels sold and now for each carbon credit sold in the cap-and-trade system.
Transportation alone accounts for 42% of GHG emissions. Therefore, Quebec is strongly committed to promote the deployment of electric vehicles, for instance through the Electric Circuit, which is Canada’s first public charging stations network for electric vehicles.
Saskatchewan
Saskatchewan has launched three self-generation programmes in recent years, two of which are currently accepting new producers.
The Green Options Partners Program was introduced in 2010 to streamline the process by which medium-sized clean power producers can generate and sell between
© O
EC
D/IE
A, 2
016
9. Renewable energy
224
100 kilowatts (kW) and 10 megawatts (MW) of electricity to SaskPower, by paying producers a fixed price for electricity using a standing offer programme. This programme is currently on hold and under review.
The Small Power Producers Program allows customers who so wish to generate up to 100 kW of electricity for the purpose of offsetting power that would otherwise be purchased from SaskPower, or for selling all of the power generated to SaskPower. Suppliers choose whether to sell all generation or only excess generation to SaskPower. The programme only applies to facilities using environmentally preferred technologies.
The Net Metering Program allows residents, farms and businesses with approved environmentally preferred technologies of up to 100 kW of generating capacity to deliver their excess electricity to the electricity grid in exchange for credit on their next month’s bill.
Furthermore, in 2010 SaskPower announced a request for proposals for wind generation. In 2012, a 177-MW wind project (from Algonquin Power Co.) was announced as the successful proponent, and is expected to begin operations in 2015/16. Saskpower forecasts that 10% of their electricity generating capacity will be wind by 2020.
INTEGRATION OF VARIABLE RENEWABLE ENERGY SOURCES
With the growing deployment of variable renewable energy (VRE) sources, electricity systems around the world are undergoing a transformation which usually occurs at shares of above 10% of renewable energies (see IEA, 2014a). On the basis of the assessment of flexibility options currently available for VRE integration, the IEA considers that large shares of VRE (up to 45% in annual generation) can be integrated without significantly increasing power system costs in the long run. However, cost-effective integration calls very often for a system-wide transformation.
Amid recent growth, in the medium term, wind power and solar photovoltaic (PV) are expected to make a growing contribution to a secure and sustainable energy system in the provinces of Canada. Ontario and Quebec are the provinces with the highest installed wind power capacity in Canada. Quebec also has the highest hydropower capacity with 38.4 GW, while Ontario leads in terms of installed wind power capacity with 3.9 GW (see Figure 9.4).
Hydropower and storage as well as demand-side response can ensure the cost-effective integration of renewable energies. Today, hydropower dominates the electricity mix in Canada with around 60%, and non-hydro renewable energy making up less than 3%. Hydropower has the advantage of supporting the integration of VRE by providing balancing energy through storage, where hydropower is dispatchable. Moreover, Canada’s hydro storage capacities are vast. Canada has also rolled out large-scale demand-response management programmes, offered by the utilities in the provinces. Provinces that are power exporters (British Columbia, Manitoba, Ontario and Quebec) may have stronger incentives in managing domestic electricity demand through large demand-response programmes (see IEA, 2014b).
However, Canada does not have one regional Canadian electricity market. Provinces are closely integrated with the three US-interconnected systems and balance power and system reliability across the Canadian-US border. By comparison, there is greater integration and trade with the US than there is between Canada’s provinces.
© O
EC
D/IE
A, 2
016
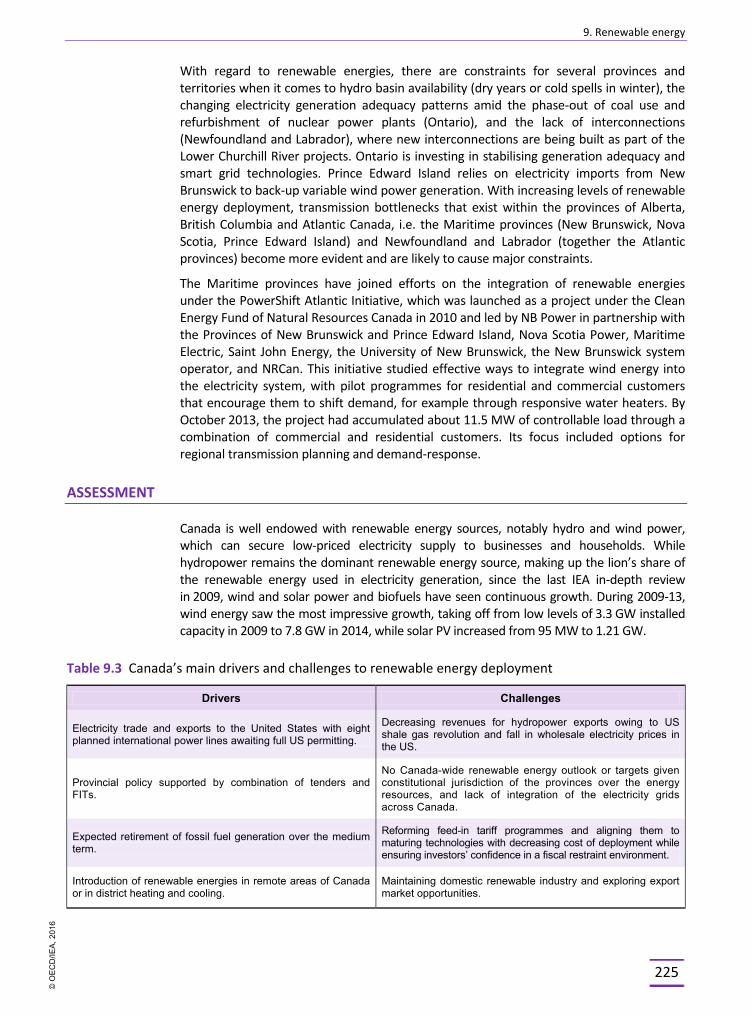
9. Renewable energy
225
With regard to renewable energies, there are constraints for several provinces and territories when it comes to hydro basin availability (dry years or cold spells in winter), the changing electricity generation adequacy patterns amid the phase-out of coal use and refurbishment of nuclear power plants (Ontario), and the lack of interconnections (Newfoundland and Labrador), where new interconnections are being built as part of the Lower Churchill River projects. Ontario is investing in stabilising generation adequacy and smart grid technologies. Prince Edward Island relies on electricity imports from New Brunswick to back-up variable wind power generation. With increasing levels of renewable energy deployment, transmission bottlenecks that exist within the provinces of Alberta, British Columbia and Atlantic Canada, i.e. the Maritime provinces (New Brunswick, Nova Scotia, Prince Edward Island) and Newfoundland and Labrador (together the Atlantic provinces) become more evident and are likely to cause major constraints.
The Maritime provinces have joined efforts on the integration of renewable energies under the PowerShift Atlantic Initiative, which was launched as a project under the Clean Energy Fund of Natural Resources Canada in 2010 and led by NB Power in partnership with the Provinces of New Brunswick and Prince Edward Island, Nova Scotia Power, Maritime Electric, Saint John Energy, the University of New Brunswick, the New Brunswick system operator, and NRCan. This initiative studied effective ways to integrate wind energy into the electricity system, with pilot programmes for residential and commercial customers that encourage them to shift demand, for example through responsive water heaters. By October 2013, the project had accumulated about 11.5 MW of controllable load through a combination of commercial and residential customers. Its focus included options for regional transmission planning and demand-response.
ASSESSMENT
Canada is well endowed with renewable energy sources, notably hydro and wind power, which can secure low-priced electricity supply to businesses and households. While hydropower remains the dominant renewable energy source, making up the lion’s share of the renewable energy used in electricity generation, since the last IEA in-depth review in 2009, wind and solar power and biofuels have seen continuous growth. During 2009-13, wind energy saw the most impressive growth, taking off from low levels of 3.3 GW installed capacity in 2009 to 7.8 GW in 2014, while solar PV increased from 95 MW to 1.21 GW.
Table 9.3 Canada’s main drivers and challenges to renewable energy deployment
Drivers Challenges
Electricity trade and exports to the United States with eight planned international power lines awaiting full US permitting.
Decreasing revenues for hydropower exports owing to US shale gas revolution and fall in wholesale electricity prices in the US.
Provincial policy supported by combination of tenders and FITs.
No Canada-wide renewable energy outlook or targets given constitutional jurisdiction of the provinces over the energy resources, and lack of integration of the electricity grids across Canada.
Expected retirement of fossil fuel generation over the medium term.
Reforming feed-in tariff programmes and aligning them to maturing technologies with decreasing cost of deployment while ensuring investors’ confidence in a fiscal restraint environment.
Introduction of renewable energies in remote areas of Canada or in district heating and cooling.
Maintaining domestic renewable industry and exploring export market opportunities.
© O
EC
D/IE
A, 2
016

9. Renewable energy
226
In the medium term, electricity from renewable sources is expected to increase at a much slower rate than in the neighbouring United States and there is still a vast and unexploited potential in Canada. In 2014, Canada ranked sixth in the world in terms of new investment in renewable energy (UNEP, 2015) with USD 8 billion, behind China (USD 81 billion), the United States (USD 36.3 billion), Japan (USD 34.3 billion), the United Kingdom (USD 13.9 billion), and Germany (USD 11.4 billion). This comparison shows that there is still large potential for Canada.
Drivers for the continuous growth have been policy support in several provinces, mainly Quebec and Ontario and the Atlantic provinces, through the combination of renewable portfolio standards, tenders and FITs, the expected retirement of fossil-fuel generation capacity under new federal GHG emission regulations, the close market integration with the US electricity markets, and the introduction of renewable energies to secure energy access in remote areas of Canada. Coal use has declined in Canada, notably as part of the phase-out of two of Ontario’s coal-fired power plants that were converted to use biomass, while more plants in other provinces are expected to retire by 2030 at the latest, under new GHG regulations. In October 2015, Alberta, which did not have dedicated renewable support schemes for electricity sector, announced plans to phase-out old coal-fired power plants and increase the share of renewable energy to meet climate targets. And new federal GHG regulations have been in the pipeline, including for gas-fired power plants.
Provincial governments have exclusive jurisdiction over the development and management of energy resources in their respective domains. While Ontario and Quebec have implemented and reformed policies to promote renewable energy, there are provinces that do not offer incentives, but net metering and self- consumption.
While the federal government has a role in promoting the development of renewable energy, its involvement has been focused on R&D and tax incentives. Today, the support for the deployment of renewable energy technologies at the federal level is limited to tax incentives, such as the accelerated capital cost allowances under Class 43.2 of the Income Tax Act. In fact, the federal government no longer provides direct funding for new projects (the ecoENERGY for renewable power and the Wind Power Production Incentive), except for biofuels. Under the ecoENERGY for Biofuels Program, up to CAD 1.5 billion in operating incentives will be given to producers of renewable alternatives to gasoline and to diesel from 2008 to 2017. The NextGen Biofuels Fund provides funding to support construction of first-of-a-kind large-scale demonstration facilities for the production of next-generation renewable fuels with a budget of CAD 275 million for the period of 2007 to 31 March 2015.
Canada harmonised blending requirements under federal Renewable Fuels Regulations, which was one of the recommendations in the last in-depth review. The federal government promotes the use of renewable energy resources in transport with federal regulations requiring 5% renewable fuel content based on the gasoline pool and 2% renewables fuel content in diesel. British Columbia, Saskatchewan and Manitoba have higher requirements. Biofuels have gained acceptance at current blending levels and offer opportunities for emissions reductions in passenger transport.
Commendable work has been carried out with regard to marine renewable energy (tidal, wave, offshore wind), where the government of Canada is developing a policy framework for the administration of projects beyond provincial boundaries in the offshore (which is federally regulated in most cases). The province of Nova Scotia has implemented feed-in tariffs and a licensing application process for projects within its boundaries.
© O
EC
D/IE
A, 2
016
9. Renewable energy
227
Since 2009, changes to the regulatory framework for renewable energies have taken place in the key provinces (Ontario, Quebec) following up on the first lessons learnt from the early renewables deployment. Ontario has reformed its FIT programme several times, learning from the experience in the early designs, and with a view to comply with the WTO ruling with regard to local content requirements. Experience in other jurisdictions shows that regulatory stability is an important driver for renewable investment and any retroactive changes could seriously harm investment portfolios. Canada has been able to maintain a continuous investment in renewable energy with significant incentives from the provincial and territorial governments.
Different support schemes and incentives across Canada reflect the structural differences between regions with regard to resource endowment and energy mixes as well as provincial policy ambitions. There is also the constitutional shared jurisdiction for energy matters, including renewable energy. These factors make it difficult for Canada to develop an overall renewables strategy with country-wide targets. Up to now, only Atlantic provinces (New Brunswick, Nova Scotia and Prince Edward Island) have mandatory, legislated Renewable Portfolio Standards.
In 2007, the Council of the Federation recognised the need and opportunity for pan-Canadian co-operation in facilitating the development of renewable energy sources. The Council of the Federation is working to develop a long-term strategy which also contains a vision for a long-term renewable energy growth. There are opportunities for greater cost-efficiency by working together between provinces on areas of future growth, but also with the United States. There are many benefits of closer co-operation on renewable energies between the federal government, provinces and territories. This has been acknowledged by the Energy and Mines Ministers Conference (EMMC, Charlottetown, Prince Edward Island in 2012), the subsequent Conference in 2013 (Yellowknife, Northwest Territories) and most recently, in the 2015 Canadian Energy Strategy (CES). The IEA believes that building upon the CES the government should support a co-ordinated effort for a renewable energy outlook for Canada to underscore the investment perspective for investors, technology innovation and projects for renewable energy for export, and the energy supply of remote areas.
Co-operation on renewable energy resources should be strengthened and formalised, for instance under the Electricity Working Group and together with the United States under the new Trilateral Climate Change and Energy Working Group, to seize the opportunities from better system reliability and electricity trade. This will improve system adequacy and ensure sustainability of the electricity systems of Canada and North America. To date, Canada supplies around 1% of the electricity needs of the United States. A large potential for hydropower and future exports has been identified and, as of April 2015, eight new international power lines are currently proposed and several large-scale hydropower projects are being pursued in many provinces.
Electricity supply to remote communities is challenged by lack of access, infrastructure, market size, local fuel resource options and lack of local technical expertise, all of which also impact energy prices. Since the last in-depth review, federal funding promoted remote electrification and off-grid technology solutions, for instance the Clean Energy Fund and the ecoENERGY for Innovation Initiative as well as the ecoENERGY for Aboriginal and Northern Communities programme. However, many remote areas still rely on diesel generators to ensure electricity supplies. Distributed renewable energy should be continuously encouraged by the federal government when the provinces and markets are not able to secure those investments.
© O
EC
D/IE
A, 2
016
9. Renewable energy
228
RECOMMENDATIONS
The government of Canada should:
o Building upon the Canadian Energy Strategy, develop together with provinces and territories a longer-term perspective for renewable energy in Canada so as to give policy certainty to investors, complementing and supporting the policies and targets foreseen in the provinces and territories.
o Continue to strengthen co-ordination among jurisdictions in Canada (and the United States) to improve the market and system integration of renewable energy in increasingly connected regional electricity markets and to seize regional opportunities for cost-efficient use of renewable energies.
o Work with provinces and territories to facilitate the development of electricity supply, and of heating and transportation options from renewable energy resources to improve electricity access, affordability and reduce environmental impacts of energy supply for remote communities.
References CanWea (Canadian Wind Energy Association), (2014), Installed Capacity, at: http://canwea.ca/wind-energy/installed-capacity/ (accessed on 9 April 2015).
CanWea (2009), Wind Vison 2025, Powering Canada’s Future, at: http://canwea.ca/pdf/windvision/Windvision_summary_e.pdf.
CHPA (Canadian Hydro Power Association), (2014), Report of Activities.
GWC (Global Wind Energy Council), (2015), Global installed wind power capacity (MW) – Regional distribution, at: www.gwec.net/global-figures/graphs/.
IEA (International Energy Agency) (2015a), Energy Balances of OECD Countries, www.iea.org/statistics, OECD/IEA, Paris.
IEA (2015), Renewables Information, www.iea.org/statistics/, OECD/IEA, Paris.
IEA (2014a): The Power of Transformation, www.iea.org/statistics/, OECD/IEA, Paris.
IEA (2014b): Medium-term energy efficiency market report, OECD/IEA, Paris.
IESO (Independent Electricity System Operator), (2014), A Progress Report on Contracted Electricity Supply, Q4 2014, at: www.ieso.ca/Documents/Supply/Progress-Report-Contracted-Supply-Q42014.pdf.
NEB (National Energy Board), (2013), Canada’s Energy Future 2013, Energy Supply and Demand Projections to 2035, An Energy Market Assessment, Calgary.
NEB (2016), Canada’s Energy Future 2016 – Energy Supply and Demand Projections to 2040.
UNEP (United Nations Environment Programme), (2015), Global Trends in Renewable Energy Investment, prepared by Frankfurt School-UNEP Collaborating Centre for Climate & Sustainable Energy Finance and Bloomberg New Energy Finance, UNEP and Bloomberg New Energy Finance.
© O
EC
D/IE
A, 2
016

10. Nuclear energy
229
10. NUCLEAR ENERGY
Key data (2013)
Number of plants in operation: 3 in Ontario (18 units); 1 in New Brunswick (1 unit)
Installed capacity: 13.3 GW (net capacity)
Electricity generation from nuclear: 102.8 TWh, +37.2% since 2003
Share of nuclear: 10.6% in TPES and 15.8% of electricity generation
Uranium production: 9136 tU in 2014 (15% of the world production, second-largest producer)
OVERVIEW
Canada is among the pioneers of nuclear power development, with research efforts dating back to the 1940s and the establishment of Atomic Energy of Canada Ltd (AECL) as a Crown corporation in 1952.
AECL’s National Research Universal (NRU) reactor was built in 1957 and is one of the oldest research reactors in the world and the most important source of supply of medical radioisotopes for medical diagnosis and cancer therapy. For many decades AECL has also been a leader in nuclear technology, with the development of its own line of nuclear power reactors, the heavy water-cooled and moderated pressurised-water reactors known as CANDUs (Canadian Deuterium Uranium Reactor), which Canada has exported to several countries.
Canada’s nuclear fleet is composed of 19 operating units of domestically developed CANDU reactors, all but one in the province of Ontario. Nuclear energy represents an important contributor to Canada’s electricity mix, accounting for an overall share of 15.8% in 2013, with larger shares in electricity generation in Ontario (58%) and in New Brunswick (38%) (OEB, 2013). The future outlook for new nuclear energy is less strong, as the government of Ontario has deferred previous plans for new builds in the province; instead, it is favouring long-term operation through extensive refurbishment programmes.
Canada is the world’s second-largest producer of uranium, with all the mining activity currently located in the province of Saskatchewan where some very high-grade uranium ore is extracted. The country’s nuclear sector employs directly over 30 000 people, including 5 000 in the uranium mining sector.
The government also successfully completed the restructuring of Atomic Energy Canada Limited (AECL) in the fall of 2015, following the sale of AECL’s commercial nuclear vendor business in 2011 to private operator Candu Energy Inc. and the establishment of a government-owned, contractor-operated model for the management and operations of AECL’s nuclear laboratories; the Canadian Nuclear Laboratories (CNL), which will be managed and operated by the Canadian National Energy Alliance (CNEA).
© O
EC
D/IE
A, 2
016
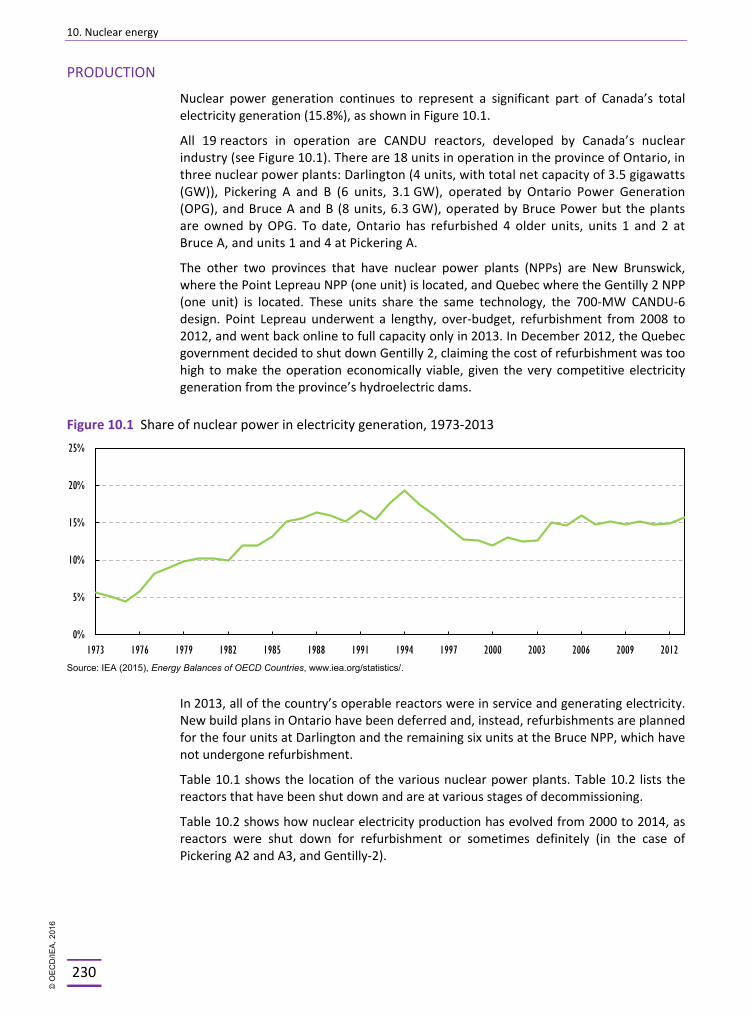
10. Nuclear energy
230
PRODUCTION
Nuclear power generation continues to represent a significant part of Canada’s total electricity generation (15.8%), as shown in Figure 10.1.
All 19 reactors in operation are CANDU reactors, developed by Canada’s nuclear industry (see Figure 10.1). There are 18 units in operation in the province of Ontario, in three nuclear power plants: Darlington (4 units, with total net capacity of 3.5 gigawatts (GW)), Pickering A and B (6 units, 3.1 GW), operated by Ontario Power Generation (OPG), and Bruce A and B (8 units, 6.3 GW), operated by Bruce Power but the plants are owned by OPG. To date, Ontario has refurbished 4 older units, units 1 and 2 at Bruce A, and units 1 and 4 at Pickering A.
The other two provinces that have nuclear power plants (NPPs) are New Brunswick, where the Point Lepreau NPP (one unit) is located, and Quebec where the Gentilly 2 NPP (one unit) is located. These units share the same technology, the 700-MW CANDU-6 design. Point Lepreau underwent a lengthy, over-budget, refurbishment from 2008 to 2012, and went back online to full capacity only in 2013. In December 2012, the Quebec government decided to shut down Gentilly 2, claiming the cost of refurbishment was too high to make the operation economically viable, given the very competitive electricity generation from the province’s hydroelectric dams.
Figure 10.1 Share of nuclear power in electricity generation, 1973-2013
Source: IEA (2015), Energy Balances of OECD Countries, www.iea.org/statistics/.
In 2013, all of the country’s operable reactors were in service and generating electricity. New build plans in Ontario have been deferred and, instead, refurbishments are planned for the four units at Darlington and the remaining six units at the Bruce NPP, which have not undergone refurbishment.
Table 10.1 shows the location of the various nuclear power plants. Table 10.2 lists the reactors that have been shut down and are at various stages of decommissioning.
Table 10.2 shows how nuclear electricity production has evolved from 2000 to 2014, as reactors were shut down for refurbishment or sometimes definitely (in the case of Pickering A2 and A3, and Gentilly-2).
0%
5%
10%
15%
20%
25%
1973 1976 1979 1982 1985 1988 1991 1994 1997 2000 2003 2006 2009 2012
© O
EC
D/IE
A, 2
016
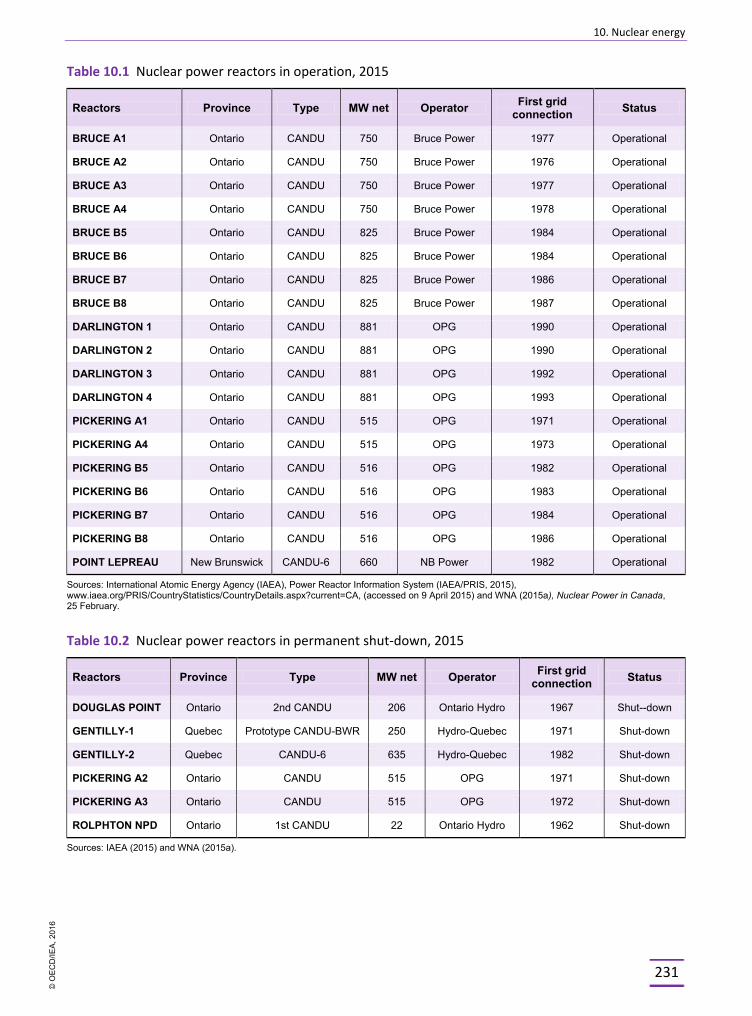
10. Nuclear energy
231
Table 10.1 Nuclear power reactors in operation, 2015
Reactors Province Type MW net Operator First grid connection Status
BRUCE A1 Ontario CANDU 750 Bruce Power 1977 Operational
BRUCE A2 Ontario CANDU 750 Bruce Power 1976 Operational
BRUCE A3 Ontario CANDU 750 Bruce Power 1977 Operational
BRUCE A4 Ontario CANDU 750 Bruce Power 1978 Operational
BRUCE B5 Ontario CANDU 825 Bruce Power 1984 Operational
BRUCE B6 Ontario CANDU 825 Bruce Power 1984 Operational
BRUCE B7 Ontario CANDU 825 Bruce Power 1986 Operational
BRUCE B8 Ontario CANDU 825 Bruce Power 1987 Operational
DARLINGTON 1 Ontario CANDU 881 OPG 1990 Operational
DARLINGTON 2 Ontario CANDU 881 OPG 1990 Operational
DARLINGTON 3 Ontario CANDU 881 OPG 1992 Operational
DARLINGTON 4 Ontario CANDU 881 OPG 1993 Operational
PICKERING A1 Ontario CANDU 515 OPG 1971 Operational
PICKERING A4 Ontario CANDU 515 OPG 1973 Operational
PICKERING B5 Ontario CANDU 516 OPG 1982 Operational
PICKERING B6 Ontario CANDU 516 OPG 1983 Operational
PICKERING B7 Ontario CANDU 516 OPG 1984 Operational
PICKERING B8 Ontario CANDU 516 OPG 1986 Operational
POINT LEPREAU New Brunswick CANDU-6 660 NB Power 1982 Operational
Sources: International Atomic Energy Agency (IAEA), Power Reactor Information System (IAEA/PRIS, 2015), www.iaea.org/PRIS/CountryStatistics/CountryDetails.aspx?current=CA, (accessed on 9 April 2015) and WNA (2015a), Nuclear Power in Canada, 25 February.
Table 10.2 Nuclear power reactors in permanent shut-down, 2015
Reactors Province Type MW net Operator First grid connection Status
DOUGLAS POINT Ontario 2nd CANDU 206 Ontario Hydro 1967 Shut--down
GENTILLY-1 Quebec Prototype CANDU-BWR 250 Hydro-Quebec 1971 Shut-down
GENTILLY-2 Quebec CANDU-6 635 Hydro-Quebec 1982 Shut-down
PICKERING A2 Ontario CANDU 515 OPG 1971 Shut-down
PICKERING A3 Ontario CANDU 515 OPG 1972 Shut-down
ROLPHTON NPD Ontario 1st CANDU 22 Ontario Hydro 1962 Shut-down
Sources: IAEA (2015) and WNA (2015a).
© O
EC
D/IE
A, 2
016
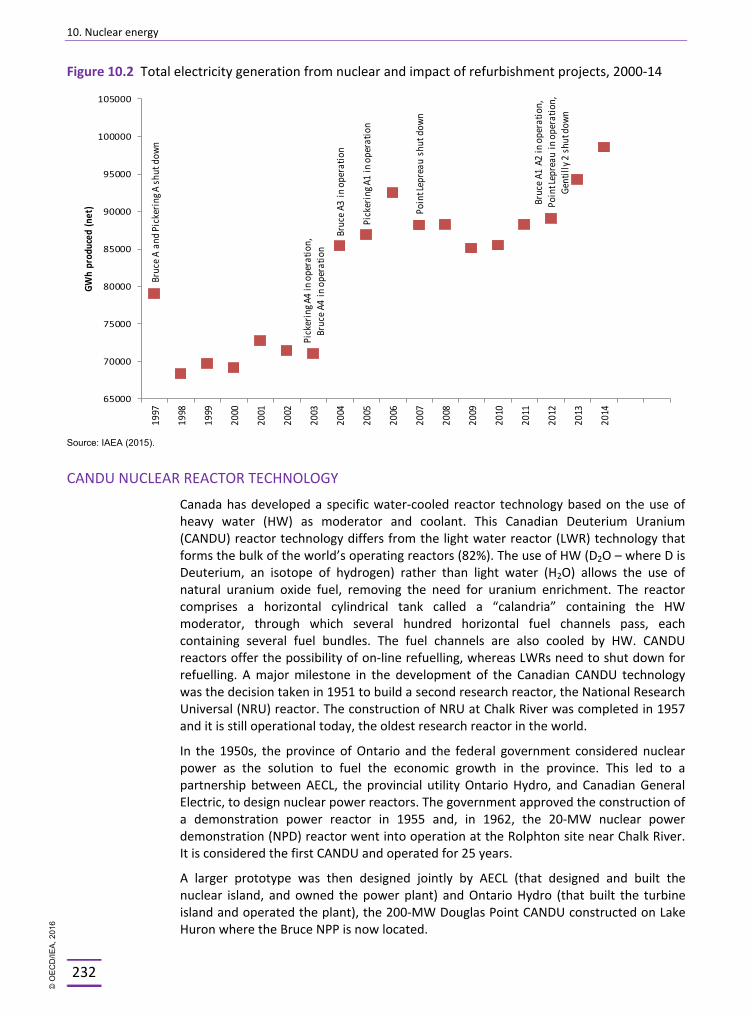
10. Nuclear energy
232
Figure 10.2 Total electricity generation from nuclear and impact of refurbishment projects, 2000-14
Bruc
e A a
nd Pi
cker
ing A
shut
dow
n
Pick
erin
g A4
in op
erat
ion,
Br
uce A
4 in
oper
atio
n
Bruc
e A3
in op
erat
ion
Pick
erin
g A1
in op
erat
ion
Poin
t Lep
reau
shu
t dow
n
Bruc
e A1
A2 in
oper
atio
n,Po
int L
epre
au in
oper
atio
n,Ge
ntill
y 2 sh
ut do
wn
65000
70000
75000
80000
85000
90000
95000
100000
105000
1997
1998
1999
2000
2001
2002
2003
2004
2005
2006
2007
2008
2009
2010
2011
2012
2013
2014
GWh
prod
uced
(net
)
Source: IAEA (2015).
CANDU NUCLEAR REACTOR TECHNOLOGY
Canada has developed a specific water-cooled reactor technology based on the use of heavy water (HW) as moderator and coolant. This Canadian Deuterium Uranium (CANDU) reactor technology differs from the light water reactor (LWR) technology that forms the bulk of the world’s operating reactors (82%). The use of HW (D2O – where D is Deuterium, an isotope of hydrogen) rather than light water (H2O) allows the use of natural uranium oxide fuel, removing the need for uranium enrichment. The reactor comprises a horizontal cylindrical tank called a “calandria” containing the HW moderator, through which several hundred horizontal fuel channels pass, each containing several fuel bundles. The fuel channels are also cooled by HW. CANDU reactors offer the possibility of on-line refuelling, whereas LWRs need to shut down for refuelling. A major milestone in the development of the Canadian CANDU technology was the decision taken in 1951 to build a second research reactor, the National Research Universal (NRU) reactor. The construction of NRU at Chalk River was completed in 1957 and it is still operational today, the oldest research reactor in the world.
In the 1950s, the province of Ontario and the federal government considered nuclear power as the solution to fuel the economic growth in the province. This led to a partnership between AECL, the provincial utility Ontario Hydro, and Canadian General Electric, to design nuclear power reactors. The government approved the construction of a demonstration power reactor in 1955 and, in 1962, the 20-MW nuclear power demonstration (NPD) reactor went into operation at the Rolphton site near Chalk River. It is considered the first CANDU and operated for 25 years.
A larger prototype was then designed jointly by AECL (that designed and built the nuclear island, and owned the power plant) and Ontario Hydro (that built the turbine island and operated the plant), the 200-MW Douglas Point CANDU constructed on Lake Huron where the Bruce NPP is now located.
© O
EC
D/IE
A, 2
016
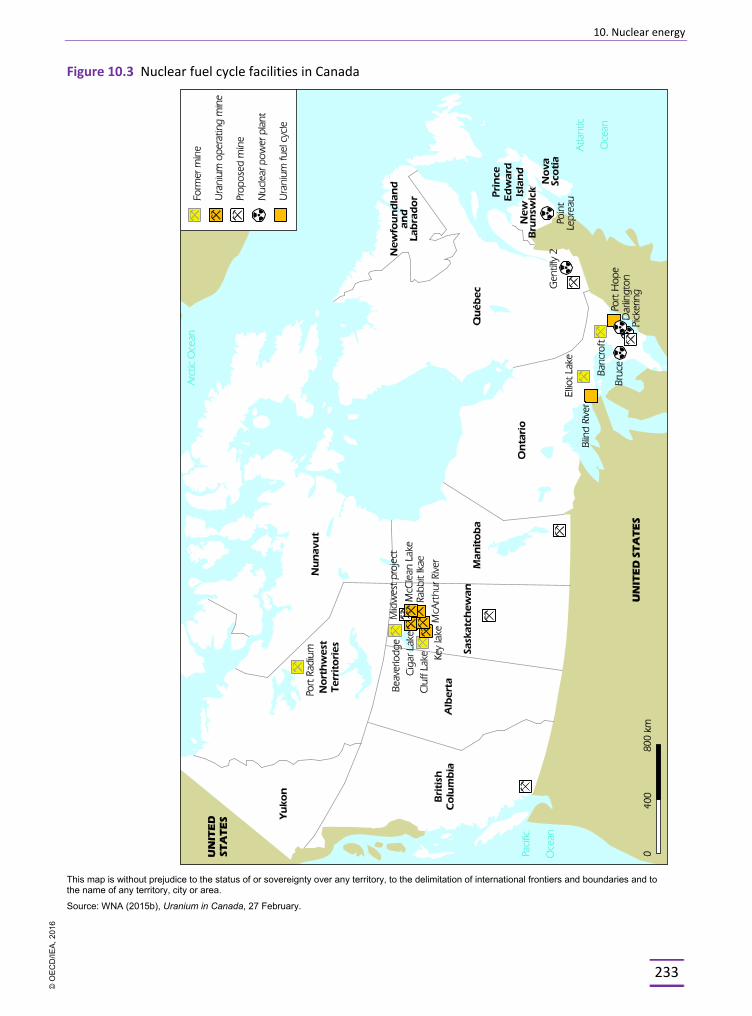
10. Nuclear energy
233
Figure 10.3 Nuclear fuel cycle facilities in Canada
This map is without prejudice to the status of or sovereignty over any territory, to the delimitation of international frontiers and boundaries and to the name of any territory, city or area.
Source: WNA (2015b), Uranium in Canada, 27 February.
© O
EC
D/IE
A, 2
016
10. Nuclear energy
234
The next step launched by the province of Ontario and the federal government was the decision to build the Pickering NPP near Toronto on Lake Ontario, a four-unit plant with 540-MW each. The first unit came online in 1971, and the last one in 1973. The construction of the plant was funded by the federal government (54%) and Ontario Hydro (46%), the latter being the owner and operator of the NPP and the owner of all NPPs built later in the province (Darlington and Bruce).
Existing CANDU reactors typically operate for around 25 to 30 years, after which they require a major refurbishment if long-term operation is envisaged. The refurbishment work involves a lengthy shut-down. Once refurbished, CANDU reactors should be able to operate for another 25 to 30 years. Past refurbishments of CANDU reactors in Canada (Pickering A4 in Ontario or Point Lepreau in New Brunswick) have often been marked by delays and cost overruns; however, lessons have been learnt and more recent refurbishments, including those carried out on CANDUs sold to other countries, have benefitted from this experience and have been successful.
The most modern version of CANDUs in operation in Canada is the CANDU-6, which entered in service at Point Lepreau in New Brunswick in 1983. The Enhanced CANDU-6 reactor (EC6) is a 700-MW evolutionary design based on the CANDU-6, but this has not yet been constructed. Canada also developed a more advanced CANDU called the ACR-1000, which is a 1 200-MW reactor. The EC6 and ACR-1000 are Gen III reactor designs. Both have completed phase 3 of the Canadian Nuclear Safety Commission’s (CNSC) pre-project design review. The CNSC has concluded that there were no fundamental barriers to licensing the ACR-1000 or the EC6 in Canada. However, there are currently no plans to build the ACR-1000 reactor in Canada. The EC6 reactor was being considered for the Darlington new nuclear project (currently deferred by the Ontario government).
Today, pressurised heavy-water reactors (PHWR) including Canada’s CANDUs, represent about 11% of the world’s reactors. CANDU-6 reactors have been exported by Canada to: Korea (4 units, Wolsong 1 to 4, which entered service in 1983, 1987, 1998 and 1999), Romania (2 units, Cernavoda 1 and 2, which entered service in 1996 and 2007), Argentina (1 unit, Embalse, which entered service in 1983), and China (2 units, Qinshan 4 and 5 which entered service in 2002 and 2003). Canada exported earlier versions of CANDU reactors to India and Pakistan. In 1963, an agreement was signed for export of a 200-MW reactor based on the Douglas Point design (the second CANDU), followed by the sale of a second reactor of the same design in 1966.
The Rajasthan atomic power project (RAPP-1) began operation in 1972. Construction of the RAPP-2 reactor was still under way when India detonated its first atomic bomb in 1974, leading Canada to end nuclear cooperation with India. Part of the sales agreement was a technology transfer process. When Canada withdrew from development, India continued the design and construction of PHWRs, first the 220-MW PHWR copied from the Douglas Point design, then a 500-MW design and more recently a 700-MW design. In 1965, Canada and Pakistan signed a nuclear energy pact to construct the country's first NPP, the Karachi nuclear power plant, KANUPP-1, which entered commercial operation in 1972.
In 2014, Chinese nuclear utilities signed agreements by which they would co-operate with Candu Energy Inc. in the construction and financing of new CANDU units at Romania's Cernavoda plant and at Argentina's Atucha plant.
© O
EC
D/IE
A, 2
016
10. Nuclear energy
235
REACTOR REFURBISHMENT
There are currently no plans for new builds in Canada (see below section on provincial nuclear programmes). With an ageing fleet, provincial governments and power companies face the decision to either shut down reactors reaching the end of their initial lifetime or take the decision to invest in long-term operation, and refurbish the existing reactors. Such decisions have been taken by the government of New Brunswick, for the Point Lepreau power plant and by the government of Ontario, for the Bruce and Darlington NPPs.
Refurbishment of CANDUs typically involves the replacement of fuel channels and steam generators, and upgrading ancillary equipment. From 1995 to 1998, the four Bruce A and the four Pickering A units were laid up, and plans for return-to-service were made. Issues with plant documentation, tracking of maintenance history and generally knowledge management issues meant that the return-to-service work was lengthy and over the expected budget. In the end, Pickering A1 and A4 returned to operation in 2005 and 2003, respectively. A decision was taken by OPG not to refurbish units A2 and A3.
Box 10.1 Refurbishment of the Darlington nuclear power plant
The Darlington CANDUs are the largest CANDU reactors in operation in the world, and the most recent ones built in Canada. The 4-unit plant typically produces 18% to 20% of the annual electricity demand in Ontario. The provincial utility OPG has decided that after 25 years of generating electricity, these units should be refurbished for long-term operation. Starting in 2016, the reactors will be removed from service for an outage period of approximately three years each. Completion is scheduled for late 2024. The refurbishment would enable the four units to operate for a further 25 to 30 years.
The total cost of the refurbishment project is expected to be less than CAD 10 billion. Lessons learnt from the recent refurbishments of Bruce A1 and A2 in Ontario as well as Point Lepreau in New Brunswick have been integrated into the Darlington refurbishment project.
Experience gained from the earlier return-to-service work for Pickering A1 and A4 will also be used by OPG, in particular with respect to the need for dedicated training facilities for contractors, in particular to prepare workers for conditions in the reactor, including becoming experienced with work in protective suits and with using remote automated tools. OPG has already completed the construction of a large training facility, the Darlington Energy Complex, which contains a full replica of a Darlington reactor and other mock-ups. OPG is also constructing other facilities to store the reactor system’s heavy water, a storage facility for reactor components, and a dry storage warehouse to store previously removed spent fuel from the reactors.
The refurbishment of the Darlington NPP will be one of the largest construction projects in Canada, with an estimated 2 000 contracted workers on site in addition to the 2 600 people normally working at the NPP.
Units 3 and 4 of Bruce A returned to operation in 2004 and 2003 respectively. The plan was to complete the refurbishment project in two stages: Bruce A1 and A2 first, followed by Bruce A3 and A4. The government of Ontario agreed to the refurbishment plan in 2005, but required Bruce Power to take most of the risk in case of delays and cost
© O
EC
D/IE
A, 2
016
10. Nuclear energy
236
overruns in exchange for receiving a guaranteed price for electricity production. In spite of that, the full refurbishment of units 1 and 2 of Bruce A and restart was only completed in 2012, with significant delays and cost overruns.
The government of Ontario plans to refurbish Darlington and its 4 units (see Box 10.1), Bruce A3 and A4 and Bruce B (4 units). The Pickering B units will not be refurbished, and will be shut down around 2020.
The refurbishment of Point Lepreau’s CANDU-6 included the replacement of all the calandria tubes, steam generators and instrument and control systems. That refurbishment also went over budget and encountered delays. However, the cost overruns of the Point Lepreau refurbishment may have played a role in the decision by Quebec not to proceed with the refurbishment of Gentilly-2 and to shut it down at the end of 2012.
URANIUM PRODUCTION
Canada is the world’s second-largest producer of uranium and has the world’s third-largest uranium resources. In 2014, Canadian production totalled 9 136 tonnes of uranium metal (tU), representing about 15% of the total world production. About 85% of the production is exported (about 40% to Asia, 35% to North and Latin America, and 25% to Europe). All Canadian production today is from mines located in northern Saskatchewan.
McArthur River, the world’s largest high-grade uranium mine, and the Key Lake mill, the world’s largest uranium mill, are operated by Cameco Corporation. These two facilities maintained their standing as the world’s largest uranium production centre by producing 7 358 tU in 2014. The Rabbit Lake mine and mill, which are wholly owned and operated by Cameco, produced 1 602 tU in 2014. Exploratory drilling has extended the life of the mine until at least 2017.
Production from the McClean Lake uranium mine and mill, operated by AREVA Resources Canada Inc., was suspended in July 2010 but resumed in 2014, producing 44 tU from the McClean Lake ore stockpile, as well as 132 tU from Cigar Lake ore.
Uranium ore production at Cigar Lake, the world’s second-largest high-grade uranium deposit (the average grade at Cigar Lake is in excess of 15% whereas the world average is about 0.2%), began in 2014. The ore is transported to the McClean Lake mill, which is located 70 km north-east of the mine site, for processing.
The uranium oxide concentrate (U3O8 also known as “yellow cake”) that is produced at the milling facilities is either shipped to customers overseas or transported to Cameco’s refinery in Blind River, Ontario, where it is converted into uranium trioxide (UO3). The UO3 is then shipped to Cameco’s conversion facility in Port Hope, Ontario, where it is converted into either uranium dioxide (UO2) to supply CANDU-type HW reactors, or uranium hexafluoride (UO6) which is exported and enriched for use as fuel in low-water reactors.
INSTITUTIONAL OVERSIGHT AND REGULATION
Provinces are responsible for the development of their natural resources, and choose their energy mix and electricity generating technology on the basis of the resource endowment and local requirements. However, nuclear (and uranium) safety and security is under federal jurisdiction.
© O
EC
D/IE
A, 2
016
10. Nuclear energy
237
Natural Resources Canada (NRCan) is responsible for the federal nuclear energy policy framework. This framework includes federal policies on nuclear research and development (R&D), nuclear science and technology, civil nuclear liability, radioactive waste management as well as international engagement. NRCan was also responsible for the restructuring of Atomic Energy of Canada Limited (AECL), a process that has been completed in September 2015 (see below).
Atomic Energy of Canada Limited (AECL) is a Crown corporation responsible for the long-term, contractual arrangement with Canadian National Energy Alliance (CNEA) for the management and operations of the Canadian Nuclear Laboratories (CNL). The restructuring process of the AECL, had started in 2009 with the divestiture of AECL’s CANDU reactor division and its sale to Candu Energy Inc. in 2011, and the creation of a government-owned and contractor-operated (GoCo) model for the AECL’s Nuclear Laboratories under the new CNL in 2014. The CNEA was selected as contractor through competitive procurement in the fall of 2015. The CNEA is an alliance of CH2M Hill, EnergySolutions, Fluor, SNC-Lavalin Inc, and Rolls-Royce. AECL is tasked to monitor performance under the GoCo arrangement and retains the ownership of the nuclear laboratories’ physical and intellectual property assets and its liabilities. AECL leverages its facilities, assets and intellectual property by bringing in private-sector rigour in the operation of the nuclear laboratories through the contract with CNEA, and fulfils its core mandate to:
§ manage Canada’s radioactive waste management and decommissioning responsibilities
§ provide nuclear science and technology support and expertise to meet federal responsibilities
§ offer services to Canada’s nuclear industry through access to science and technology facilities and expertise on commercial terms.
The Canadian Nuclear Safety Commission (CNSC) is the nuclear regulator. It regulates the use of nuclear energy and materials to ensure the health, safety and protection of the public and the workforce involved in the nuclear sector, and the protection of the environment. It implements Canada’s international commitments on the peaceful use of nuclear energy. CNSC reports to Parliament through the Minister of Natural Resources.
REGULATION
In general, federal government and provinces share the responsibility for environmental assessments (EAs). Since the regulation of nuclear facilities is a federal jurisdiction under the Nuclear Safety and Control Act and the Canadian Environmental Assessment Act 2012, Ontario’s Environmental Assessment Act does not apply to nuclear facilities. As such, there are no provincial EA requirements for nuclear projects in Ontario. Following the passage of the Canadian Environmental Assessment Act 2012, EAs for nuclear projects are now conducted exclusively by the CNSC. The federal government streamlines co-ordination of EAs for major nuclear projects, including waste repositories, through the Major Projects Management Office (MPMO) initiative. The new Darlington NPP in Ontario and the deep geological repository at Kincardine (Tiverton, Ontario) are designated major projects. Ontario has deferred the Darlington new NPP project.
The key legislative instruments in place in Canada are the following acts:
§ Nuclear Safety and Control Act
§ Nuclear Energy Act
© O
EC
D/IE
A, 2
016

10. Nuclear energy
238
§ Nuclear Fuel Waste Act
§ Nuclear Liability Act
but also other implementing legislation that covers nuclear energy and materials:
§ Canadian Environment Assessment Act 2012
§ Transportation of Dangerous Goods Acts
§ Export and Import Permits Act.
In terms of nuclear liability, the Nuclear Liability Act establishes the compensation and civil liability regime for the operators of certain nuclear facilities such as NPPs for damages arising from nuclear accidents. In 2014, the Department of Natural Resources introduced the Energy Safety and Security Act in Parliament. The bill received Royal Assent on 26 February 2015. Part 2 of the bill – the Nuclear Liability and Compensation Act – will replace the Nuclear Liability Act with stronger legislation to better deal with liability and compensation for a nuclear accident within Canada, increasing the liability limit for nuclear operators from the current CAD 75 million to CAD 1 billion. The Nuclear Liability and Compensation Act will also implement Canadian membership in the IAEA Convention on Supplementary Compensation for Nuclear Damage to address liability and compensation for damage within member countries arising from nuclear accidents within a member country or during transportation of nuclear material. Entry into force of the Nuclear Liability and Compensation Act will depend on key regulations and financial security documents being in place, likely in the spring of 2016.
Pursuant to Canada’s 1996 Policy Framework for Radioactive Waste, waste owners are responsible for the funding, organisation, management and operation of long-term waste-management facilities and other facilities required for their wastes. In terms of policies, Canada has a long-standing Nuclear Non-Proliferation Policy, a Non-Resident Ownership Policy in the Uranium Mining Sector, and is implementing a Policy Framework for Radioactive Waste.
Canada is a party to the Nuclear Non-Proliferation Treaty (NPT) as a non-nuclear weapons state. Its safeguards agreement under the NPT came into force in 1972, and the Additional Protocol in relation to this came into force in 2000.
Bilateral Nuclear Cooperation Agreements (NCAs) are required with each customer nation as a precondition for trade, which involves additional obligations beyond those of the NPT and the International Atomic Energy Agency (IAEA). New NCAs were established with the United Arab Emirates (2013) and Kazakhstan (2014). An existing NCA with China was updated with a Supplemental Protocol in 2013, and a 2010 NCA with India entered into force in 2013. Canada is also a member of the Nuclear Suppliers Group.
PROVINCIAL NUCLEAR PROGRAMMES
The Canadian nuclear energy value chain operates primarily in Ontario and New Brunswick for power generation, in Ontario and Quebec for engineering and manufacturing, and in Saskatchewan for uranium mining and research. R&D on nuclear energy has been undertaken in 9 provinces and 27 universities. Quebec was, with Ontario and New Brunswick, the only other province that had nuclear power, but the Gentilly 2 reactor was shut down in December 2012 owing to political and economic considerations. Its production only represented a very small fraction of
© O
EC
D/IE
A, 2
016
10. Nuclear energy
239
the overall electricity production of the province, dominated by its hydroelectric capacity. Some interest in nuclear power generation is emerging in other parts of the country − for example in the province of Alberta − including for new nuclear and nuclear fusion technology.
ONTARIO
The province that dominates the Canadian nuclear energy policy is by far the province of Ontario, hosting 18 of the country’s 19 operating nuclear reactors. The government of Ontario took a number of policy decisions in 2013 with regard to nuclear energy as part of its “Long Term Energy Plan” (LTEP) released in December 2013.
Ontario will not proceed at this time with the construction of two new nuclear reactors at the Darlington generating station. In 2012, the Ontario government had asked two vendor companies, AECL and Westinghouse, to provide detailed proposals in 2013 for new reactor construction. A year later, it cancelled its plans for new build. One of the main reasons is the economic crisis that affected the province, leading to a decrease in electricity demand from industry, in particular the automobile industry. Ontario is now in a situation of electricity oversupply, particularly as the province is also making efforts to stimulate electricity production from variable renewable sources.
Nuclear refurbishment is planned to begin at both the Darlington and Bruce generating stations in 2016. During refurbishment, both OPG and Bruce Power will be subject to the strictest possible oversight to ensure safety, reliable supply and value for ratepayers. Nuclear refurbishment will follow seven principles established by the government, including minimising commercial risk to the government and the taxpayer, and ensuring that operators and contractors are accounfor refurbishment costs and schedules. The Pickering generating station is expected to be in service until 2020. An earlier shut-down of the Pickering units may be possible, depending on projected demand going forward, the progress of the fleet refurbishment programme, and the timely completion of the Clarington transformer station. With Ontario deferring plans for new build, Canada’s nuclear generation will be ensured by extensive refurbishment and long-term operation of its existing CANDU fleet.
ALBERTA
Interest in nuclear energy in Alberta was initiated in 2005 by Energy Alberta Corporation (EAC). EAC and AECL worked together from 2006 onwards to investigate the possibility of building the advanced CANDU ACR-1000 in the province. To attract the interest of the oil industry, AECL also carried out feasibility studies of using nuclear energy to support the extraction of oil from the Alberta oil-sands, through the production of steam to be used in the so-called Steam-Assisted Gravity Drainage (SAGD) process and hydrogen production.
Bruce Power bought EAC in 2008, and explored the possibility of building a nuclear power plant closer to the Peace River. Bruce also opened up the bid to other competing firms, AREVA, GE-Hitachi and Westinghouse. After a public consultation exercise in 2009, the government of Alberta confirmed that the province will maintain its existing policy where power generation options, including nuclear, are proposed by the private sector in the province and considered on a case-by-case basis. On 12 December 2011, Bruce Power announced that it would no longer pursue the option for a new nuclear plant in Alberta, without citing any reason.
© O
EC
D/IE
A, 2
016
10. Nuclear energy
240
NUCLEAR SAFETY
The Canadian Nuclear Safety Commission (CNSC) is the federal nuclear regulator, responsible for regulating and enforcing strict safety standards in the country’s nuclear facilities, including uranium mines, research reactors, and NPPs. The CNSC reports to Parliament through the Minister of Natural Resources.
The CNSC also implements Canada’s international commitments on the peaceful uses of nuclear energy by facilitating access to the International Atomic Energy Agency (IAEA), to Canadian nuclear facilities and arranging for the installation of safeguards at the sites. The CNSC reports regularly to the IAEA on nuclear materials held in the country.
Recent changes to the nuclear regulatory framework include:
§ Environmental assessments: pursuant to the Canadian Environmental Assessment Act 2012, the CNSC now has sole responsibility for carrying out EAs of nuclear projects, as well as its usual regulatory review and licensing processes
§ Firm regulatory timelines: the CNSC has committed to licensing processes for a licence to prepare site for Class 1 facilities, and for a licence to prepare a site and construct an uranium mine and mill in maximum 24 months. These timelines include those requiring EAs, the hearing process for the licence, and the Commission decision (excluding time spent by the proponent to provide information)
§ Administrative monetary penalties: these can be imposed by CNSC without court involvement for the violation of a regulatory requirement.
These changes contribute to making CNSC an efficient and effective regulator. This was confirmed in successive Integrated Regulatory Review Service (IRRS) missions of the IAEA. In 2009, at the request of the Canadian government, the IAEA conducted an IRRS mission to review the CNSC regulatory framework and its effectiveness. In December 2010, the Canadian government requested a follow-up IRRS mission to review the recommendations made in the 2009 IRRS mission report. The follow-up IRRS mission took place in December 2011, and, besides the review of the previous recommendations, CNSC’s role in regulating the transport of radioactive material as well as the measures taken by the regulator after the Fukushima Daiichi accident of March 2011 were also reviewed. In their report, the IRRS team concluded that the recommendations made at the 2009 IRRS mission had been systematically addressed through senior management commitment; that the regulatory framework for transport of radioactive material was well established and commensurate with the large scope and volume of transport activities in Canada; and that the regulatory response to the Fukushima Daiichi accident had been prompt, robust and comprehensive. The IRRS team noted in particular that the CNSC had taken an open and transparent approach in its review of the Fukushima Daiichi accident, including steps to inform and engage with the public. These efforts contribute positively to the independence of the CNSC and to the trust of the public.
WASTE DISPOSAL AND DECOMMISSIONING
The Nuclear Waste Management Organization (NWMO) was established in 2002 by Canada’s nuclear utilities in accordance with the Nuclear Fuel Waste Act (NFWA). The mandate of the NWMO is to develop and implement an approach for the long-term management of Canada’s spent nuclear fuel that is socially acceptable, technically
© O
EC
D/IE
A, 2
016
10. Nuclear energy
241
sound, environmentally responsible and economically feasible. This approach is called adaptive phased management (APM), and emerged after a three-year dialogue, which engaged 18 000 Canadians across the country, including 2 500 Aboriginal persons and 500 specialists. Its end goal is to provide a safe, centralised containment to hold the country’s spent nuclear fuel in a deep geological repository (DGR).
The NWMO initiated a site selection process in 2010, which involves extensive dialogue with local communities and technical assessments. As of June 2015, nine communities in Ontario remain involved in the NWMO’s siting process. The geological repository could begin operation around 2035, a decade or so later than other geological repositories planned in Sweden and in Finland. Besides preparing for the licensing of a deep geological repository, the NWMO will also need to demonstrate that it can ship the spent nuclear fuel from the various storage facilities where it is currently stored on an interim basis to the centralised repository. Spent nuclear fuel in Canada is currently stored in facilities1 located at the reactor sites in Ontario, Quebec and New Brunswick as well as at AECL’s nuclear research facilities in Ontario and Manitoba. In Canada, the safe and secure transportation of nuclear materials is jointly regulated by the CNSC and Transport Canada.
The owners of spent nuclear fuel are required by the NFWA to establish trust funds to finance the long-term management of spent nuclear fuel. Thus, Ontario Power Generation, Hydro-Quebec, New Brunswick Power Corporation and AECL established such funds in 2002 and continue to make annual contributions to these funds.
Recent developments concerning low and intermediate waste include continued progress under the Nuclear Legacy Liabilities Program, which is aimed at decommissioning and environmental restoration activities at AECL sites, the Port Hope Area Initiative, aimed at cleaning up historic waste from the early years of the Canadian uranium-processing industry in the Port Hope area in Ontario, and the project by OPG to build a DGR at Kincardine (site of the Bruce NPP on Lake Huron) for all of OPG’s low and intermediate waste, which has been designated a major project and is being managed under the MPMO Initiative.
NUCLEAR RESEARCH AND DEVELOPMENT
Canada has been among the world’s leaders in nuclear R&D since the beginning of its nuclear programme in the 1940s. The Chalk River Laboratories in Ontario, for instance, have a long history of successful R&D and technical achievements.
Much of Canada’s R&D programme had been carried out by Atomic Energy of Canada Limited (AECL), which was established by the federal government as a Crown corporation in 1952, with the responsibility for managing the country’s nuclear R&D programme and the National Research Universal (NRU) research reactor.
AECL was the designer of the CANDU reactor technology and was later split in two divisions, the Nuclear Laboratories (research) and the CANDU Reactor Division. In 2011, the federal government divested AECL’s vendor and R&D activities by selling the commercial CANDU design and marketing business and licensing CANDU technology to Candu Energy Inc. (a wholly owned subsidiary of SNC-Lavalin) following an international bidding process. Candu Energy Inc. is responsible for providing services to the existing CANDU fleet, life-extension projects and reactor new builds.
1. Spent nuclear fuel is usually stored in wet storage pools for the first six to ten years after being discharged from the reactor, and then moved to a dry storage facility.
© O
EC
D/IE
A, 2
016
10. Nuclear energy
242
After the sale, AECL’s Nuclear Laboratories were re-organised into a government-owned contractor-operated (GoCo) model, similar to the model used in the United States and the United Kingdom. Today, the AECL is responsible for the long-term, contractual arrangement with Canadian National Energy Alliance (CNEA) for the management and operations of the Canadian Nuclear Laboratories (CNL) which assumed full operations of AECL’s laboratories in November 2014. The CNEA is an alliance of CH2M, EnergySolutions, Fluor, SNC-Lavalin Inc, and Rolls-Royce, which won the public tender for the operation and management of CNL in September 2015. AECL is tasked to monitor performance under the GoCo arrangement and retains the ownership of the nuclear laboratories’ physical and intellectual property assets and its liabilities. Under the GoCo model, AECL leverages its facilities, assets and intellectual property by bringing in private-sector rigour in the operation of the nuclear laboratories through the contract with CNEA, and fulfils its core mandate to:
§ manage Canada’s radioactive waste and decommissioning responsibilities
§ provide nuclear expertise to support federal responsibilities
§ offer services to users of the laboratories on commercial terms.
In February 2015, the government of Canada announced that it was supporting the continued operation of the NRU reactor from October 2016 until March 2018 (subject to the approval by the CNSC). This is designed to help support global medical isotope demand between 2016 and 2018 in the unexpected circumstances of shortages.
At the conclusion of this period, the NRU will be placed in a state of storage with surveillance until decommissioning. With the closure of NRU, Canada will also lose an important research facility and the irradiation services it provided to the scientific community.
While Candu Energy Inc. took over the development of the latest generation of CANDU reactors, including the Generation-III Enhanced CANDU-6 (EC6) reactor and advanced CANDU reactor (ACR), work on the Generation-IV supercritical water-cooled reactor (SCWR) remained with AECL (and now CNL). The Generation-IV SCWR operates at higher temperatures and pressure than current water-cooled reactors, thus offering the possibility of higher thermal efficiency and also non-electric applications of nuclear energy such as the production of hydrogen through thermo-chemical cycles. Canada is, alongside China, Europe and Japan, an active participant in international R&D projects for the SCWR under the umbrella of the Generation IV International Forum (GIF).
Research projects in the field of nuclear energy are also carried out in a number of universities across the country, either funded at government level or through CNL.
Since 2010, the federal government has committed CAD 60 million to the development of alternative isotope production technologies to diversify sources of isotope supply for Canadians, specifically cyclotron and linear accelerator technologies for the production of technetium-99m isotope. Projects involving researchers and facilities from across Canada have benefitted from this government support.
Some provinces are also taking initiatives to promote nuclear research. The Sylvia Fedoruk Centre for Nuclear Innovation (Fedoruk Centre), a wholly-owned subsidiary of the University of Saskatchewan, is one such example. The Centre’s objective, under its strategic plan entitled “Saskatchewan’s Future in Nuclear Innovation: Strategic Plan 2020”, is to ensure its investments will build nuclear R&D capacity in the province with impacts in nuclear science and technology. It is particularly targeting the fields of nuclear medicine,
© O
EC
D/IE
A, 2
016
10. Nuclear energy
243
materials, nuclear energy and safety, and society and environment, by supporting projects in these areas. Although initially funded by the province, the Fedoruk Centre aims at attracting private investments in public-private partnerships.
ASSESSMENT
Nuclear power generation continues to represent a significant part of Canada’s total electricity generation, with 19 CANDU reactors in operation, 18 in Ontario and one in New Brunswick, with shares of nuclear power in the electricity mix representing 58% and 38%, respectively, and 15.8% for Canada as a whole.
Since the last in-depth review in 2009, major investment has been made in continuously refurbishing Canada’s NPP fleet and in restructuring the country’s reactor vendor AECL which was previously fully owned by the federal government.
Despite announcements in 2009, the interest by operators to build new NPPs in Canada’s provinces (Alberta, Ontario, Saskatchewan and New Brunswick) has notably decreased. New build plans in Ontario have been deferred.
Canadian provinces are instead opting for the refurbishment of the existing reactors to ensure their longer-term operation, which will determine the future of the nuclear investment and nuclear industry in Canada. Since 2009, Ontario has refurbished two older units, units 1 and 2 at Bruce A. The other two provinces that have NPPs are New Brunswick, where the Point Lepreau NPP (one unit) is located, and Quebec where the Gentilly 2 NPP (one unit) is located. From 2008 to 2012, Point Lepreau underwent lengthy, over-budget, refurbishment and went back online to full capacity only in 2013. In December 2012, the Quebec government decided to shut down Gentilly 2, noting the cost of refurbishment was too high to make the operation economically viable, given the very competitive electricity generation from the province’s hydroelectric dams.
In 2013, all of the country’s operable reactors were in service and generating electricity, a scontributor to energy security. Looking ahead, there are refurbishments planned for the four units at Darlington and the remaining six units at the Bruce NPPs which have not undergone refurbishment. This will support the Canadian nuclear industry and supply chain, in the absence of domestic new build projects. The refurbishment of Darlington’s four units and 6 units at Bruce NPPs is expected to cost about CAD 25 billion, and will benefit from the lessons learnt from past refurbishment projects.
International contracts for new build or refurbishments are also likely to bring new opportunities for Canadian exports of nuclear energy expertise and technology. In 2014, Chinese nuclear utilities signed agreements that would see them co-operate, with Candu Energy Inc., on the construction and financing of new CANDU units at Romania's Cernavoda plant and at Argentina's Atucha plant. The Nuclear Cooperation Agreement between Canada and India signed in 2010 but which came into force only in September 2013, could also lead to opportunities for the Canadian nuclear sector. In April 2015, Cameco Inc. announced it had signed a supply agreement with the Department of Atomic Energy of India to provide 7.1 million pounds of uranium concentrate under a long-term contract through 2020.
The government of Canada has also recently established bilateral memoranda of understanding (MOU) on nuclear energy co-operation with China (November 2014), the United States (January 2015), and the United Kingdom (June 2015). The MOU with China
© O
EC
D/IE
A, 2
016
10. Nuclear energy
244
paved the way for a Joint Venture Framework Agreement between Candu Energy Inc. and the Chinese National Nuclear Corporation (CNNC) to collaborate on the further development of the Advanced Fuel CANDU reactor (AFCR) and further co-operation in third-market new build projects. In November 2014, an expert panel in China released a report stating that the AFCR should be part of China’s future energy strategy. The Implementing Arrangement with the United States under the Trilateral Energy Science and Technology Agreement will allow direct laboratory-to-laboratory collaboration on nuclear energy science and technology. The MOU with the United Kingdom will create opportunities for Canadian laboratories and industry to engage with UK counterparts, while the United Kingdom undergoes major refurbishments and new builds.
Canada is the world’s second-largest producer of uranium, behind Kazakhstan. All of the uranium currently produced comes from mines in northern Saskatchewan. Canada’s uranium production is set to continue to expand, with increasing production from the high-grade Cigar Lake mine which began operating in 2014. In 2013, Cameco shipped its first delivery of uranium concentrates to China under a multi-year, multi-billion-dollar agreement that was implemented pursuant to a Supplementary Protocol, to the existing Canada-China Nuclear Cooperation Agreement. Just as with other nuclear activities, uranium mining is a heavily regulated activity, and great efforts have been made by the industry to achieve very high levels of safety and environmental protection in their operations.
Canada is continuing to make progress in the area of waste management, in particular with the adaptive phased management approach that foresees the implementation of a DGR for high-level radioactive waste (spent fuel) in a willing community. The Nuclear Waste Management Organisation (NWMO) is currently engaging with local communities that have expressed an interest in hosting the deep geological repository. Strong stakeholder engagement will also be needed with communities located on the transport routes between the nuclear power plants where the used fuel is currently stored and the repository.
Although the short- to mid-term future of the nuclear power sector in Canada is clear, with a focus on refurbishment and long-term operation of the existing fleet, there is uncertainty as to its long-term future, and the share that nuclear power will have in the longer term, beyond the lifetime of existing reactors. This uncertainty could have impacts on the future of the industry and the workforce, including the research community.
The operation of the country’s new nuclear research laboratory under the GoCo model can be effective at managing short-term R&D projects, at attracting industry and private funding and at ensuring the transfer of knowledge to industry. However, the effectiveness of the restructured AECL to support long-term research objectives in the field of nuclear energy will depend also on significant public funding, as past experience shows.
A strategy is needed to evaluate what could be the future role of nuclear energy in Canada and its provinces. This strategy should recognise the benefits of nuclear power in terms of low-carbon baseload generation, and evaluate the potential of electricity exports to the United States, which also faces the problem of an ageing fleet. The potential of NPPs to operate in a co-generation mode that delivers low-carbon heat (steam) to industrial processes − to exploit oil-sands for instance − should also be assessed as a technology that can mitigate the rising GHG emissions from the industrial sector. The strategy should analyse long-term viability of the nuclear supply chain and associated high-quality jobs; assess the future competitiveness of nuclear power generation against gas-fired generation and against other low-carbon sources such as
© O
EC
D/IE
A, 2
016
10. Nuclear energy
245
hydroelectricity and renewable; and also consider the possible implications of climate change on nuclear power generation (for instance issues associated with cooling on the Great Lakes). Finally, having a well-researched analysis on the future of the nuclear energy sector should help define long-term objectives for nuclear R&D activities.
RECOMMENDATIONS
The government of Canada should:
o Following the successful completion of the restructuring of AECL and consistent with the federal government’s policy responsibilities and objectives, engage with stakeholders and provinces that have operating nuclear power plants or are considering nuclear energy as an option on a long-term strategy for the future of the nuclear sector in Canada.
o Continue to explore industrial opportunities abroad to further develop nuclear technology and secure the national industrial supply chain, and also further engage in international collaboration in the area of nuclear safety and security, waste management, emergency management, nuclear liability, and R&D as a way to leverage resources.
o Proceed with the implementation of Canada’s strategy for the management of nuclear waste, in particular the development of a deep geological repository for high-level radioactive waste (used fuel) under the mandate of the NWMO, taking full benefit of lessons learnt from stakeholder involvement experience in Canada and in other countries.
References Bratt, D. (2012), Canada, the provinces, and the global nuclear revival, advocacy coalitions in action, McGill-Queen’s University Press.
Canadian Nuclear Society (2014), Nuclear Canada Yearbook 2014 – annual industry review and buyer’s guide.
IAEA (International Atomic Energy Agency, (2015), Power Reactor Information System (IAEA/PRIS), www.iaea.org/PRIS/CountryStatistics/CountryDetails.aspx?current=CA, (accessed on 9 April 2015).
IEA (International Energy Agency), (2015), Energy Balances of OECD Countries, www.iea.org/statistics/, OECD/IEA, Paris.
IRRS (Integrated Regulatory Review Service), (2011), Follow-up mission to Canada, Ottawa, 28 November – 9 December, IAEA-NS-IRRS-2011/08.
NEA (Nuclear Energy Agency), (2014), Nuclear Energy Data, OECD, Paris.
OEB (Ontario Energy Board), (2013), Ontario’s System-Wide Electricity Supply Mix: 2013 Data, www.ontarioenergyboard.ca/oeb/_Documents/Regulatory/2013_Supply_Mix_Data.pdf.
WNA (World Nuclear Association), (2015a), Nuclear Power in Canada, 25 February.
WNA (2015b), Uranium in Canada, 27 February.
© O
EC
D/IE
A, 2
016

© O
EC
D/IE
A, 2
016

PART III ENERGY TECHNOLOGY
© O
EC
D/IE
A, 2
016

© O
EC
D/IE
A, 2
016
11. Energy technology research, development and demonstration
249
11. ENERGY TECHNOLOGY RESEARCH, DEVELOPMENT AND DEMONSTRATION
Key data (2014-15 estimated)
Government energy RD&D spending: CAD 941.9 million (CAD 439.1 million federal and CAD 502.8 million provincial and state-owned enterprises)
Share of GDP (2013-14): 0.8 units of GDP per USD 1 000 PPP (IEA median*: 0.5)
RD&D per capita: CAD 26.5 * Median of 22 IEA member countries for which data are available.
Note: Some provinces of Canada do not provide complete budget data; therefore this may be an underestimate.
OVERVIEW
The federal government supports energy research, development and demonstration (RD&D) activities with the aim of maximising the potential of Canada's energy resources and facilitating their development and use in a responsible way. The country has a solid foundation for energy technology innovation, including a highly educated workforce, well-respected research-focused universities, and well-established public and private energy R&D laboratories. Energy RD&D in Canada undertaken by the federal government focuses on three portfolio areas: cleaner fossil fuels (including oil and gas, carbon capture and storage); clean electricity (including renewable energy, smart grid, bioenergy, nuclear energy); and end use (including buildings and communities, transportation, industry).
The total government energy RD&D budget (including federal and provincial/territorial governments and their state-owned enterprises) is large in comparison to other IEA member countries and is estimated at CAD 941.9 million for 2014-15. Energy RD&D intensity, measured as the share of public energy RD&D spending in GDP, is above the IEA median. However, public funding for core energy R&D programmes has been declining in recent federal and provincial budgets. This has been offset somewhat by increases in targeted, time-limited federal programmes and energy RD&D funding from state-owned companies in provinces/territories, some of which include funding for large-scale demonstrations. Thus, despite a solid foundation and past successes, the financial resources available for publicly funded energy RD&D in Canada are dwindling.
INSTITUTIONAL FRAMEWORK
The federal government sets and implements its RD&D polices in close collaboration with the provincial and territorial governments. Close collaboration is a necessity because the provinces have jurisdiction over their natural resources, including energy
© O
EC
D/IE
A, 2
016
11. Energy technology research, development and demonstration
250
and electricity systems. Thus, the federal government often develops RD&D programmes that co-fund projects with the provinces and territories. The federal government is, however, responsible for international collaboration in energy RD&D.
Research responsibilities are set out in the enabling legislation for federal departments, particularly those which are science-based, including the Natural Resources Act.
Natural Resources Canada (NRCan) plays the leading role in the management of federal activities related to energy RD&D through its Office of Energy Research and Development (OERD) and the national CanmetENERGY laboratories. OERD leads on federal energy RD&D and the allocation of RD&D funding from the government of Canada to stakeholders, including industry. OERD is responsible for federal RD&D programmes such as: the Clean Energy Fund (CEF), the ecoENERGY Innovation Initiative (ecoEII), the ecoENERGY Technology Initiative (ecoETI) and the Program of Energy Research and Development (PERD).
The efforts of other federal departments and agencies, research councils, Crown corporations and foundations play a role in supporting energy RD&D. These include: Environment Canada, Industry Canada, Transport Canada, Western Economic Diversification Canada, the Atlantic Canada Opportunities Agency, the Canada Revenue Agency (CRA), the National Science and Engineering Research Council (NSERC), the National Research Council (NRC), Atomic Energy of Canada Ltd (AECL) and its newly restructured laboratories. Business Development Canada (BDC), Export Development Canada (EDC) and Sustainable Development Technology Canada (SDTC) (see Figure 11.1).
Co-ordination of federal, provincial and territorial RD&D policies is enhanced through the Energy and Mines Ministers’ Conference (EMMC) as well as other collaboration initiatives between the federal and provincial governments, including the Canada-Alberta memorandum of understanding on oil-sands R&D which was signed in 2012 to promote collaboration and alignment of oil-sands and heavy oil research and innovation initiatives.
Basic research activities continue to be within the scope of Canadian universities and partly within the national laboratories, including the CanmetENERGY labs. The Natural Science and Engineering Research Council of Canada (NSERC) and the National Research Council (NRC) are the primary funding bodies for basic research in Canadian universities. Through NRCan, the federal government operates three national CanmetENERGY laboratories which operate in distinct regions and technical areas across the country with 425 staff members. The laboratories in Ottawa (Ontario) focus on clean fossil energy, energy efficiency in buildings and communities, industrial processes, bioenergy, and renewables; those in Varennes (Quebec) work on energy efficiency, energy solutions for northern and remote communities, industrial processes, and integration of renewable and distributed energy resources; and those in Devon (Alberta) specialise in R&D on oil-sands and heavy oil processes, shale resources, and oil spills. CanmetENERGY provides scientific and engineering expertise, generated through foundational science and technology research, to the development of codes, standards, regulations, roadmaps, policies and programmes of NRCan. The CanmetMINING and CanmetMATERIALS laboratories also deliver initiatives with energy technology development elements. Furthermore, the Geological Survey of Canada contributes to work on frontier and unconventional oil and gas resources, for example the Geoscience for New Energy Supplies (GNES) Program, the ESS Environmental Geoscience Program (2009-2014) or the Geo-mapping for Energy and Minerals).
© O
EC
D/IE
A, 2
016
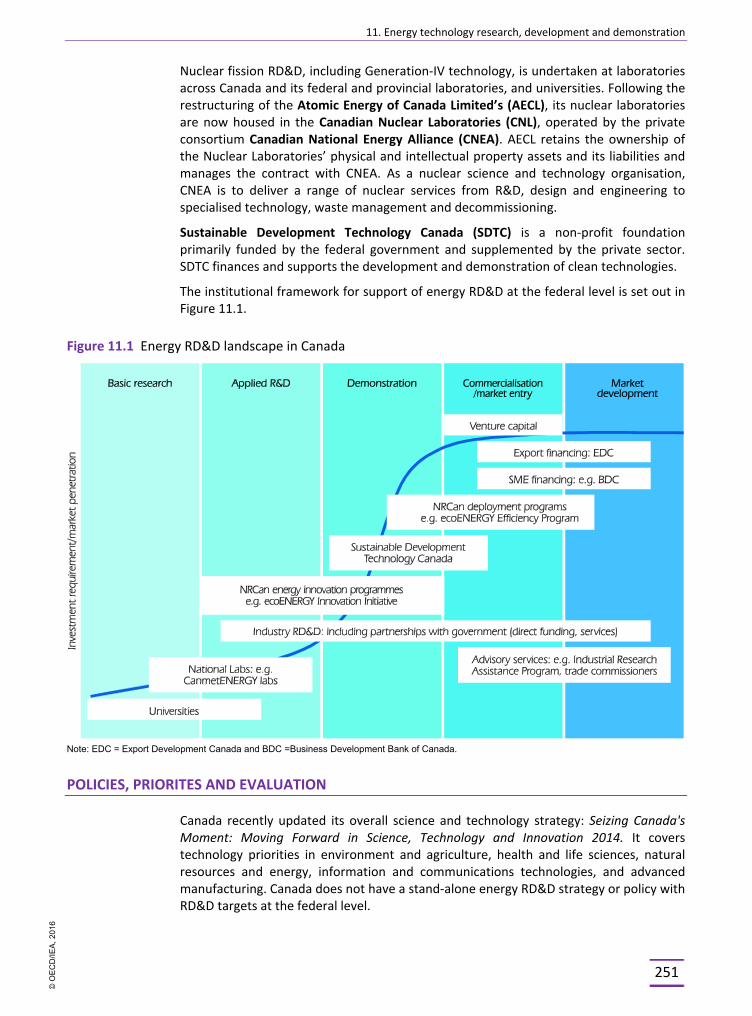
11. Energy technology research, development and demonstration
251
Nuclear fission RD&D, including Generation-IV technology, is undertaken at laboratories across Canada and its federal and provincial laboratories, and universities. Following the restructuring of the Atomic Energy of Canada Limited’s (AECL), its nuclear laboratories are now housed in the Canadian Nuclear Laboratories (CNL), operated by the private consortium Canadian National Energy Alliance (CNEA). AECL retains the ownership of the Nuclear Laboratories’ physical and intellectual property assets and its liabilities and manages the contract with CNEA. As a nuclear science and technology organisation, CNEA is to deliver a range of nuclear services from R&D, design and engineering to specialised technology, waste management and decommissioning.
Sustainable Development Technology Canada (SDTC) is a non-profit foundation primarily funded by the federal government and supplemented by the private sector. SDTC finances and supports the development and demonstration of clean technologies.
The institutional framework for support of energy RD&D at the federal level is set out in Figure 11.1.
Figure 11.1 Energy RD&D landscape in Canada
Note: EDC = Export Development Canada and BDC =Business Development Bank of Canada.
POLICIES, PRIORITES AND EVALUATION
Canada recently updated its overall science and technology strategy: Seizing Canada's Moment: Moving Forward in Science, Technology and Innovation 2014. It covers technology priorities in environment and agriculture, health and life sciences, natural resources and energy, information and communications technologies, and advanced manufacturing. Canada does not have a stand-alone energy RD&D strategy or policy with RD&D targets at the federal level.
© O
EC
D/IE
A, 2
016
11. Energy technology research, development and demonstration
252
Energy RD&D is supported with a view to improve environmental performance, increase productivity and competitiveness and to diversify markets for energy products, technologies and services, and to improve energy security and availability in northern, remote and Aboriginal communities.
Based on a collaborative approach with industry and provinces/territories, NRCan’s funding activities related to energy technology RD&D focus on three portfolio areas:
§ Cleaner fossil fuels (including unconventional oil and gas, carbon capture and storage)
§ Clean electricity (including renewable energy, smart grid, bioenergy, nuclear energy); End use (including buildings and communities, transportation, industry).
The government regularly reviews its funding priorities through several initiatives. The core PERD research programme updates its priorities and funding allocations every four years through its strategic planning process. This process sets out the broad direction and position of the portfolio in the overall federal energy goals and priorities. It identifies policy drivers, challenges and opportunities as well as technology and knowledge gaps. The process is interdepartmental and engages with relevant stakeholders, including industries, and other levels of government. To validate priorities, NRCan engages stakeholders across Canada, for example through Energy Innovation Roundtables. The annual Energy and Mines Ministers’ Conference is also an opportunity to discuss technology innovation and shared priorities for collaborative action.
The government of Canada announced in May 2015 its commitment to reduce Canada’s greenhouse gas (GHG) emissions by 30% below 2005 levels by 2030, and identified investments in clean energy technologies as an integral component in the roadmap to meeting its target. In light of this announcement, NRCan is reviewing its approach to energy technology innovation programming so as to maximise its contribution to Canada’s climate change and environmental goals. Further, targeted support for energy RD&D activities can generate important economic benefits, such as through improved industry productivity and the growth of Canada’s clean technology sector. Current work is also being informed by a 2012 study by McKinsey & Co., commissioned by NRCan, which identified key technology areas where Canada has a competitive edge for capturing growing global export opportunities.
The McKinsey & Co. study assessed Canada’s competitiveness in 24 technology areas and helped identify areas of strength in the near term. The study concluded that Canada has an advantage in unconventional oil and gas, conventional hydropower, uranium mining, and could take a lead in emerging markets, like energy efficiency technologies (buildings, industry), northern and remote energy and off-grid electricity generation, and that Canada can increase global competitiveness with water treatment technologies and next-generation transportation (advanced aircraft and trains) (McKinsey & Co, 2012). Furthermore, Canada has a long-term opportunity for investment in natural gas (compressed and liquefied) in transportation and in the development of carbon capture and storage (CCS) technology, while leveraging the experience of current CCS demonstration projects.
POLICIES AND PROGRAMMES
FEDERAL RD&D PROGRAMMES
The Program of Energy Research and Development (PERD) is a federal, interdepartmental base research programme with an annual budget of approximately
© O
EC
D/IE
A, 2
016
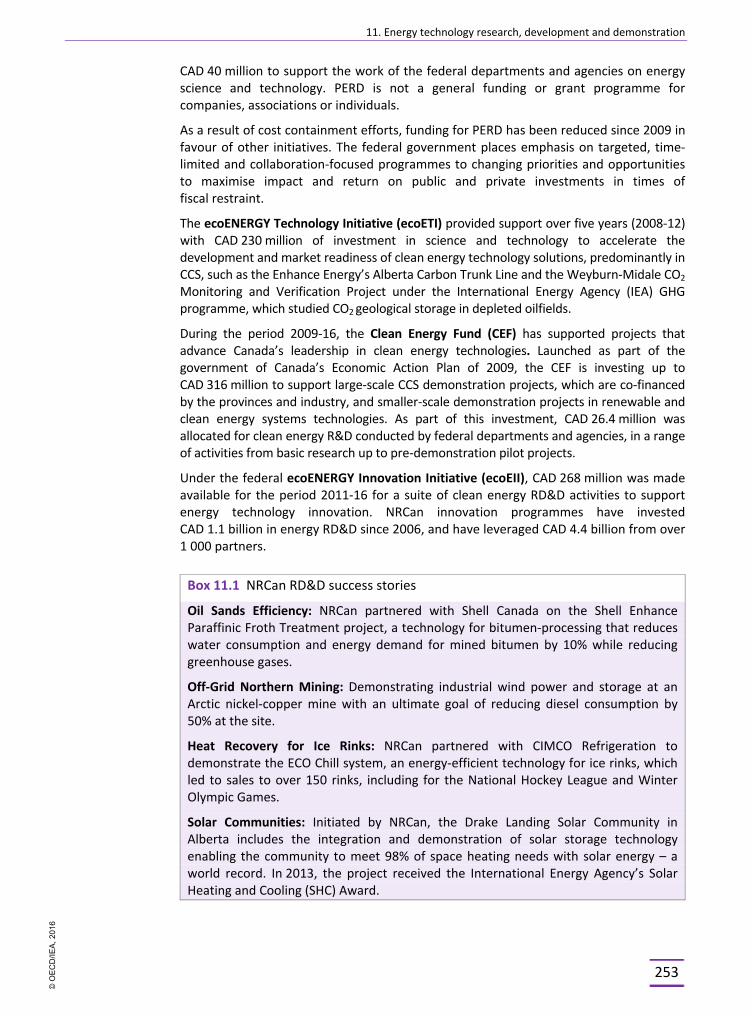
11. Energy technology research, development and demonstration
253
CAD 40 million to support the work of the federal departments and agencies on energy science and technology. PERD is not a general funding or grant programme for companies, associations or individuals.
As a result of cost containment efforts, funding for PERD has been reduced since 2009 in favour of other initiatives. The federal government places emphasis on targeted, time-limited and collaboration-focused programmes to changing priorities and opportunities to maximise impact and return on public and private investments in times of fiscal restraint.
The ecoENERGY Technology Initiative (ecoETI) provided support over five years (2008-12) with CAD 230 million of investment in science and technology to accelerate the development and market readiness of clean energy technology solutions, predominantly in CCS, such as the Enhance Energy’s Alberta Carbon Trunk Line and the Weyburn-Midale CO2 Monitoring and Verification Project under the International Energy Agency (IEA) GHG programme, which studied CO2 geological storage in depleted oilfields.
During the period 2009-16, the Clean Energy Fund (CEF) has supported projects that advance Canada’s leadership in clean energy technologies. Launched as part of the government of Canada’s Economic Action Plan of 2009, the CEF is investing up to CAD 316 million to support large-scale CCS demonstration projects, which are co-financed by the provinces and industry, and smaller-scale demonstration projects in renewable and clean energy systems technologies. As part of this investment, CAD 26.4 million was allocated for clean energy R&D conducted by federal departments and agencies, in a range of activities from basic research up to pre-demonstration pilot projects.
Under the federal ecoENERGY Innovation Initiative (ecoEII), CAD 268 million was made available for the period 2011-16 for a suite of clean energy RD&D activities to support energy technology innovation. NRCan innovation programmes have invested CAD 1.1 billion in energy RD&D since 2006, and have leveraged CAD 4.4 billion from over 1 000 partners.
Box 11.1 NRCan RD&D success stories
Oil Sands Efficiency: NRCan partnered with Shell Canada on the Shell Enhance Paraffinic Froth Treatment project, a technology for bitumen-processing that reduces water consumption and energy demand for mined bitumen by 10% while reducing greenhouse gases.
Off-Grid Northern Mining: Demonstrating industrial wind power and storage at an Arctic nickel-copper mine with an ultimate goal of reducing diesel consumption by 50% at the site.
Heat Recovery for Ice Rinks: NRCan partnered with CIMCO Refrigeration to demonstrate the ECO Chill system, an energy-efficient technology for ice rinks, which led to sales to over 150 rinks, including for the National Hockey League and Winter Olympic Games.
Solar Communities: Initiated by NRCan, the Drake Landing Solar Community in Alberta includes the integration and demonstration of solar storage technology enabling the community to meet 98% of space heating needs with solar energy – a world record. In 2013, the project received the International Energy Agency’s Solar Heating and Cooling (SHC) Award.
© O
EC
D/IE
A, 2
016
11. Energy technology research, development and demonstration
254
The Automotive Innovation Fund (AIF) provided CAD 250 million during 2008-12 to support large-scale R&D projects in the car industry aimed at producing more innovative, greener, more fuel-efficient vehicles. In 2013, the AIF was extended with the same budget for another five years, followed by an increase of CAD 500 million for the period 2014–16. The AIF is managed by Industry Canada.
In contrast to the PERD, federal demonstration programmes are based on the principle of public-private collaboration. The private sector plays a critical role in bringing innovative technologies to the market place to generate economic activity, create employment, and bring forward real-world solutions to environmental challenges. Co-financing is thus an important policy tool to increase private-sector participation.
Sustainable Development Technology Canada (SDTC) supports the development and demonstration of innovative, pre-commercial clean energy technologies, including energy exploration and production, power generation, energy utilisation, transportation, agriculture, forestry and wood products, and waste management.
SDTC operates the SD Tech Fund™ (since 2002) for projects that create efficiencies for businesses and contribute to sustainable economic development, including addressing climate change, air quality, clean water, and clean soil; the NextGen Biofuels Fund™ for first-of-a-kind large-scale demonstration facilities for next-generation renewable fuel production; and the SD Natural Gas Fund™ for projects targeting the downstream natural gas sector, including transport and renewable natural gas. The SD Tech Fund™ is primarily funded by the federal government, the NextGen Biofuels Fund™ is fully funded by the federal government, whereas the SD Natural Gas Fund™ is co-financed by SDTC through its SD Tech Fund (CAD 15 million) and by the private sector through the Canadian Gas Association (CAD 15 million). As of the end of 2014, SDTC had a federal budget contribution of CAD 740 million and leveraged CAD 2 billion, of which 81% came from industry (90% led by small and medium-sized enterprises SMEs) and 19% from other federal programmes, provincial governments and academia.
The SDTC Virtual Incubator™ guides cleantech entrepreneurs who intend to develop their technology with guidance on business planning, partnership development or funding. In partnership with Export Development Canada (EDC), SDTC supports cleantech SMEs to access export opportunities through EDC’s credit enhancement, risk-mitigation and export finance instruments, market expertise and corporate networks.
The National Research Council also works towards commercialisation through initiatives such as the Industrial Research Assistance Program (IRAP), which supports SMEs in Canada with a budget of CAD 84 million to boost innovation and commercialisation of advanced technologies in the global marketplace. The IRAP provides direct financing support for R&D in SMEs, offers advice through a national network of Industrial Technology Advisors, and links up to national and international innovation networks.
FUNDING
INDIRECT ASSISTANCE VIA TAX INCENTIVES
At the federal level, the Scientific Research and Experimental Development (SR&ED) tax incentive programme provides support for innovation by businesses in all
© O
EC
D/IE
A, 2
016
11. Energy technology research, development and demonstration
255
sectors, including the energy sector. It is the largest single source of federal government support for industrial R&D, providing an estimated CAD 3.1 billion of support in 2014. This programme provides an immediate tax deduction and an investment tax credit in respect of eligible R&D expenses. While the general rate of the tax credit is 15% of eligible expenses, small and medium sized firms are eligible for an enhanced credit at a rate of 35%, which is refundable for firms that are not in a taxable position. The enhanced credit for SMEs represented about 45% of total SR&ED support in 2014.
Compared to other countries, Canada has placed stronger emphasis on indirect support instead of direct investment, the latter being the favoured approach of several OECD countries, including the United States. Canada allocated only 12% of its RD&D spending towards direct assistance, as opposed to the top ten innovative countries in the OECD which allocate on average 70% of their spending (OECD, 2012a). In 2011, the Review of Federal Support to Research and Development (RD Review, 2011) recommended that Canada rebalance its direct versus indirect funding. Since 2012, the government of Canada has shifted its overall RD&D support away from tax incentives towards short-term direct funding through grants which are limited in time and scope.
DIRECT FUNDING
Within the total federal RD&D spending of CAD 6.864 billion in 2013-14 across all economic sectors, energy RD&D accounted for only 6.5%.1 Federal energy RD&D spending is allocated to funding programmes of key federal government organisations and national laboratories: NRCan, AECL (CNL), NSERC, SDTC and others.
Canada’s government energy RD&D budget (including federal and provincial governments) amounted to CAD 941.9 million in 2014/15 and is expected to be around CAD 931 million in 2015/16. In comparison with other IEA member countries, Canada’s public RD&D intensity, measured as a ratio of GDP, is relatively high. In 2013/14, it stood at 0.8 units per USD 1 000 PPP of GDP, well above the IEA median (0.5) and ahead of top performers, the United States and Japan, but behind Nordic RD&D leaders Finland, Norway and Denmark (Figure 11.4).
Figures 11.2 and 11.3 show the trends in federal and provincial government energy RD&D expenditure over time (including state-owned enterprises). Setting CCS demonstration programmes aside, there has been a general decline in federal energy RD&D budgets since 2009 while provincial spending on RD&D, including state-owned enterprises, increased up to 2013, followed by a significant decrease. The largest growth in provincial RD&D budget has been in CCS demonstration programmes. The federal RD&D budget has declined primarily as a result of a significant change in nuclear power research, after the sale of AECL’s vendor business, by 70% from 2009/10 to 2013/14. This decline reflects the restructuring of AECL and its nuclear programme (see below).
1. Source: Statistics Canada, Research and Development for 2013/2014 in the Federal Scientific Activities 2014/2015, Table 1 “Federal Expenditures – On science and technology, research and development and related scientific activities in current dollars and in constant 2007 dollars”, page 11.
© O
EC
D/IE
A, 2
016
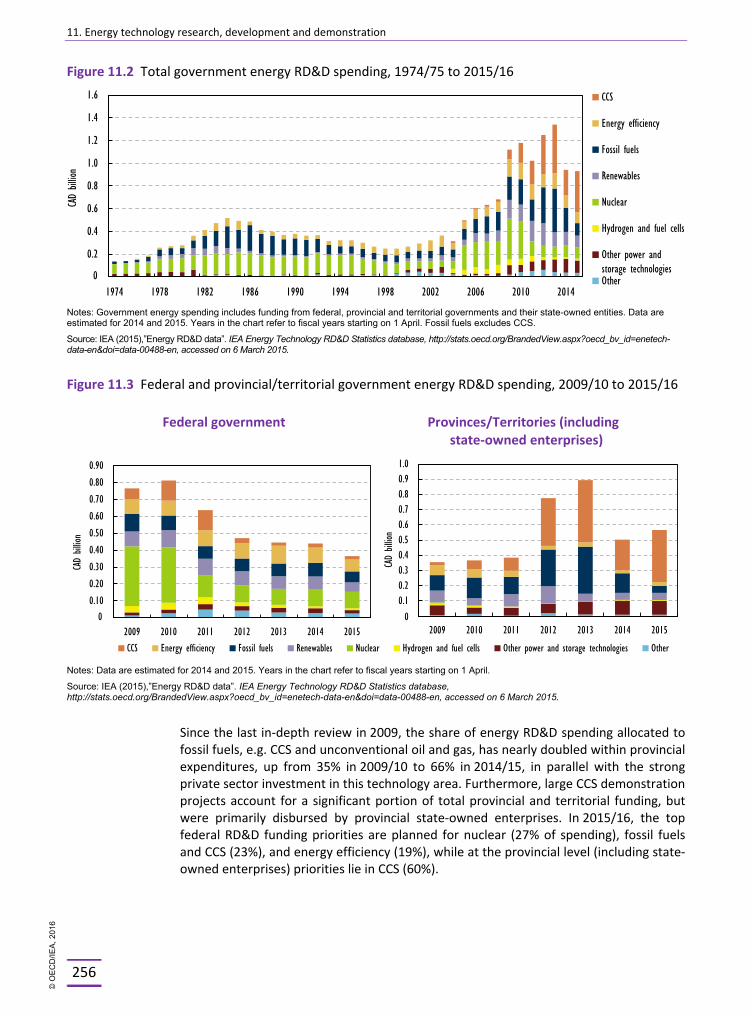
11. Energy technology research, development and demonstration
256
Figure 11.2 Total government energy RD&D spending, 1974/75 to 2015/16
Notes: Government energy spending includes funding from federal, provincial and territorial governments and their state-owned entities. Data are estimated for 2014 and 2015. Years in the chart refer to fiscal years starting on 1 April. Fossil fuels excludes CCS.
Source: IEA (2015),”Energy RD&D data”. IEA Energy Technology RD&D Statistics database, http://stats.oecd.org/BrandedView.aspx?oecd_bv_id=enetech-data-en&doi=data-00488-en, accessed on 6 March 2015.
Figure 11.3 Federal and provincial/territorial government energy RD&D spending, 2009/10 to 2015/16
Federal government Provinces/Territories (including state-owned enterprises)
Notes: Data are estimated for 2014 and 2015. Years in the chart refer to fiscal years starting on 1 April.
Source: IEA (2015),”Energy RD&D data”. IEA Energy Technology RD&D Statistics database, http://stats.oecd.org/BrandedView.aspx?oecd_bv_id=enetech-data-en&doi=data-00488-en, accessed on 6 March 2015.
Since the last in-depth review in 2009, the share of energy RD&D spending allocated to fossil fuels, e.g. CCS and unconventional oil and gas, has nearly doubled within provincial expenditures, up from 35% in 2009/10 to 66% in 2014/15, in parallel with the strong private sector investment in this technology area. Furthermore, large CCS demonstration projects account for a significant portion of total provincial and territorial funding, but were primarily disbursed by provincial state-owned enterprises. In 2015/16, the top federal RD&D funding priorities are planned for nuclear (27% of spending), fossil fuels and CCS (23%), and energy efficiency (19%), while at the provincial level (including state-owned enterprises) priorities lie in CCS (60%).
0.0
0.2
0.4
0.6
0.8
1.0
1.2
1.4
1.6
1974 1978 1982 1986 1990 1994 1998 2002 2006 2010 2014
CAD
billio
n
CCS
Energy efficiency
Fossil fuels
Renewables
Nuclear
Hydrogen and fuel cells
Other power andstorage technologiesOther0
0.00
0.10
0.20
0.30
0.40
0.50
0.60
0.70
0.80
0.90
2009 2010 2011 2012 2013 2014 2015
CAD
billio
n
CCS Energy efficiency Fossil fuels Renewables Nuclear Hydrogen and fuel cells Other power and storage technologies Other
0 0.00.10.20.30.40.50.60.70.80.91.0
2009 2010 2011 2012 2013 2014 2015
CAD
billio
n
0
© O
EC
D/IE
A, 2
016
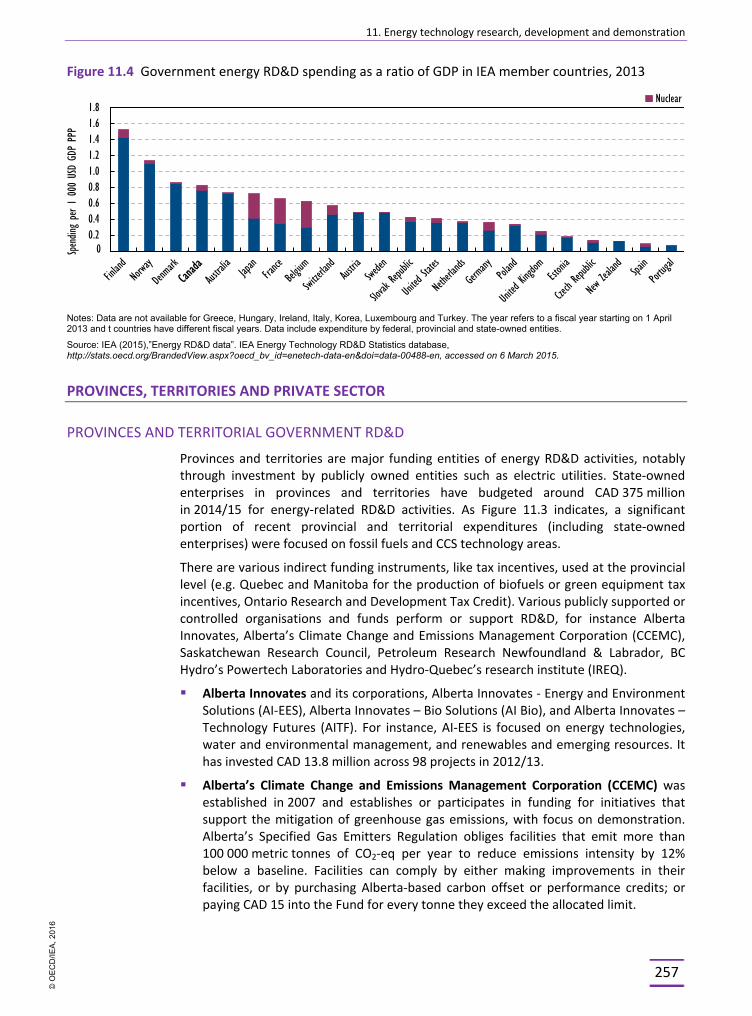
11. Energy technology research, development and demonstration
257
Figure 11.4 Government energy RD&D spending as a ratio of GDP in IEA member countries, 2013
Notes: Data are not available for Greece, Hungary, Ireland, Italy, Korea, Luxembourg and Turkey. The year refers to a fiscal year starting on 1 April 2013 and t countries have different fiscal years. Data include expenditure by federal, provincial and state-owned entities.
Source: IEA (2015),”Energy RD&D data”. IEA Energy Technology RD&D Statistics database, http://stats.oecd.org/BrandedView.aspx?oecd_bv_id=enetech-data-en&doi=data-00488-en, accessed on 6 March 2015.
PROVINCES, TERRITORIES AND PRIVATE SECTOR
PROVINCES AND TERRITORIAL GOVERNMENT RD&D
Provinces and territories are major funding entities of energy RD&D activities, notably through investment by publicly owned entities such as electric utilities. State-owned enterprises in provinces and territories have budgeted around CAD 375 million in 2014/15 for energy-related RD&D activities. As Figure 11.3 indicates, a significant portion of recent provincial and territorial expenditures (including state-owned enterprises) were focused on fossil fuels and CCS technology areas.
There are various indirect funding instruments, like tax incentives, used at the provincial level (e.g. Quebec and Manitoba for the production of biofuels or green equipment tax incentives, Ontario Research and Development Tax Credit). Various publicly supported or controlled organisations and funds perform or support RD&D, for instance Alberta Innovates, Alberta’s Climate Change and Emissions Management Corporation (CCEMC), Saskatchewan Research Council, Petroleum Research Newfoundland & Labrador, BC Hydro’s Powertech Laboratories and Hydro-Quebec’s research institute (IREQ).
§ Alberta Innovates and its corporations, Alberta Innovates - Energy and Environment Solutions (AI-EES), Alberta Innovates – Bio Solutions (AI Bio), and Alberta Innovates – Technology Futures (AITF). For instance, AI-EES is focused on energy technologies, water and environmental management, and renewables and emerging resources. It has invested CAD 13.8 million across 98 projects in 2012/13.
§ Alberta’s Climate Change and Emissions Management Corporation (CCEMC) was established in 2007 and establishes or participates in funding for initiatives that support the mitigation of greenhouse gas emissions, with focus on demonstration. Alberta’s Specified Gas Emitters Regulation obliges facilities that emit more than 100 000 metric tonnes of CO2-eq per year to reduce emissions intensity by 12% below a baseline. Facilities can comply by either making improvements in their facilities, or by purchasing Alberta-based carbon offset or performance credits; or paying CAD 15 into the Fund for every tonne they exceed the allocated limit.
0.00.20.40.60.81.01.21.41.61.8
Spendin
g per 1
000
USD
GDP
PPP
Nuclear
0
© O
EC
D/IE
A, 2
016
11. Energy technology research, development and demonstration
258
§ British Columbia’s Innovative Clean Energy (ICE) Fund: The ICE Fund is a legislated funding tool designed to support British Columbia’s energy and environmental priorities and to advance its clean energy sector. Current fund priorities include clean energy transportation technology and fuels; clean energy infrastructure for the public sector; post-secondary clean energy R&D; and energy efficiency and conservation measures.
§ Newfoundland and Labrador’s Research and Development Corporation (RDC): In 2013/14, the RDC, an arms-length provincial Crown corporation, committed CAD 4.1 million to support 23 R&D projects in the energy sector. Since 2012/13, RDC has announced CAD 15 million in funding available through ArcticTECH – a directed research programme in support of technology development for the Arctic and harsh climate environments.
§ Ontario’s Smart Grid Fund: Launched in 2011, the Fund invests in Ontario-based projects that support the growth and advancement of the province’s electricity grid, in order to help consumers’ conservation efforts, manage energy costs and integrate new beneficial technologies like electric vehicles and storage.
§ Quebec’s Technoclimat: This programme aims to encourage the development of new technologies or innovative processes related to energy efficiency, emerging energies and GHG emissions reduction in Quebec.
§ Saskatchewan: The Saskatchewan Research Council is a provider of applied RD&D and technology commercialisation. Leading projects include combined heat and power, enhanced oil recovery in the Bakken formation, agriculture adaptation, among others. Another noteworthy institution in the Saskatchewan research landscape is the Sylvia Fedoruk Centre for Nuclear Innovation (the Fedoruk Centre), a subsidiary of the University of Saskatchewan that has a nuclear innovation programme with a focus on the fields of nuclear medicine, materials, nuclear energy and safety, and society and environment, by supporting several public-private partnership projects. Although initially funded by the province, the Fedoruk Centre aims at attracting private investments in public-private partnerships.
ENERGY INDUSTRY-SECTOR RD&D
In 2013, the energy sector accounted for 13.4% of Canadian GDP, and capital expenditure in the energy industry has been on the rise since 2009 to reach CAD 109 billion in 2013, out of which CAD 83 billion or 21% came from the oil and gas industries alone (NRCan, 2014a).
In Canada, energy utilities are often owned by the provincial government. In such cases, their energy RD&D expenditures, for instance by SaskPower for Boundary Dam on CCS, are typically counted as public funding by provincial/territorial entities (i.e. state-owned enterprises) and not as industry expenditure, as outlined above.
Energy industry expenditures on energy R&D in Canada stood at CAD 2 billion in 2013, according to the latest data available (Statistics Canada, 2014). Major focus areas within industry were, first, fossil fuels (crude oil and natural gas, oil-sands and heavy crude oil)) with CAD 1.45 billion, secondly, energy efficiency technologies with CAD 128 million and, thirdly, renewable energy resources (including solar, wind, bioenergy, hydro) with CAD 120 million and, fourthly, nuclear (e.g. CANDU Owners Group) with CAD 40 million.
© O
EC
D/IE
A, 2
016
11. Energy technology research, development and demonstration
259
When it comes to general private business expenditure on R&D (BERD) (OECD, 2015), Canada lags behind in comparison with other OECD countries. In 2013, Canada’s BERD accounted for only 0.82% of GDP, rather low in comparison with OECD leaders, such as Korea (3.26%), Japan (2.65%), Finland (2.29%) or the United States (1.96% in 2012).
Conversely, in the Canadian energy sector, the oil and gas industry has grown rapidly and increased R&D spending in parallel at an annual rate of 15% between 2001 and 2012. The R&D intensity in the mining and quarrying sector, which includes oil and gas, has almost doubled during 2000 and 2009, and this mainly from unconventional oil and gas (CCA, 2013). Furthermore, the forest and paper/pulp industry has benefitted from advances in process innovation thanks to private-public partnerships and industry investment in energy-efficient process and higher-value product chains (see 4.1 in Chapter4 on Energy Efficiency). The number of patent registrations in the energy sector is growing, notably in the drilling and well services sectors of unconventional oil and gas production. Canada is ranked above the OECD median of patent registrations in environmental technologies. For clean energy technologies, the Canadian Intellectual Property Office (CIPO) supports the fast processing of all patent applications (CCA,2013; OECD, 2012).
Box 11.2 Energy innovation in the Canadian oil industry
Canada’s oil industry has stepped up collaboration on technology and research under Canada’s Oil Sands Innovation Alliance (COSIA). In March 2012, thirteen oil-sands companies, representing 90% of oil-sands production, joined under the Canadian Oil Sands Innovation Alliance (COSIA) to share innovation and intellectual property so as to eliminate duplicative efforts and accelerate the development of technologies and processes. COSIA focuses on several environmental priority areas: tailings, water, land (i.e. reclamation); greenhouse gas emissions; and public reports on environmental performance goals. As of January 2015, member companies have shared 777 distinct technologies and innovations worth CAD 950 million – an approach that is unparalleled in the world. This industry-led alliance of 13 oil-sands producers is focused on accelerating the pace of improvements in environmental performance in Canada’s oil-sands through collaborative action and innovation.
New technologies are also being developed by government, industry and universities to reduce land impacts, water use and GHG emissions from oil-sands development. Technologies that reduce steam requirements for in-situ oil-sands extraction are being developed and piloted to bring down water use and improve energy efficiency. These technologies use solvents in conjunction with steam or employ radically new techniques such as heating the bitumen through electricity to move the bitumen towards the wells.
Oil-sands mining research includes processes to separate the bitumen from the sand more efficiently and to reduce energy and water requirements as well as processes that will lower the need for, and speed up the reclamation of, large tailings ponds. Furthermore, advances in upgrader technologies include innovative combustion techniques, such as gasification, which could reduce the industry’s reliance on natural gas while enabling the use of other transformative technologies, such as CCS.
NUCLEAR RESEARCH AND DEVELOPMENT
During 2009-13, nuclear energy RD&D received the largest share of the federal RD&D budget. In the past, nuclear fission R&D (including Generation IV technology) has been
© O
EC
D/IE
A, 2
016
11. Energy technology research, development and demonstration
260
conducted by the Crown corporation AECL. The organisation and funding of the nuclear RD&D in Canada underwent significant changes following the restructuring of AECL, which started in May 2009. After the divestiture of its CANDU Reactor Division, whose assets were sold to Candu Energy Inc. in October 2011, the restructuring of the AECL’s nuclear laboratories was started in 2013. The government has been pursuing a government-owned, contractor-operated (GoCo) model for the management of AECL’s Nuclear Laboratories with a view to i) managing radioactive waste and decommissioning responsibilities; ii) performing science and technology activities to meet core federal responsibilities; and iii) supporting Canada’s nuclear industry through access to science and technology facilities and expertise on a commercial basis. In November 2014, AECL created a wholly-owned subsidiary Canadian Nuclear Laboratories (CNL). Subsequently the federal government organised a procurement process to select the GoCo contractor.
The Canadian Nuclear Energy Alliance (CNEA), bringing together CH2M Hill, EnergySolutions, Fluor, SNC-Lavalin Inc, and Rolls-Royce, responded to the government’s procurement for the management and operation of AECL’s Nuclear Laboratories. After its selection, in September 2015, the CNL shares were transferred to CNEA. CNL now operates as a private-sector entity, while AECL remains the Crown corporation focused on the management and oversight of this contract and the performance of the contractual obligations of the contractor. AECL will also continue to retain ownership of the Nuclear Laboratories’ physical and intellectual property assets and its liabilities. The government will continue to support nuclear science and technology to meet federal roles and responsibilities. The Canadian Nuclear Safety Commission will continue to regulate the nuclear laboratories after the restructuring.
In February 2015, the federal government announced that it was supporting the continued operation of the National Research Universal (NRU) reactor from October 2016 until March 2018 (subject to the approval of the Canadian Nuclear Safety Commission). This is designed to help support global medical isotope demand between 2016 and 2018 in the unexpected circumstances of shortages.
Going forward, energy RD&D funding should focus on technology areas where there is a compelling Canadian resource or technology advantage. In the area of nuclear, the competitive advantage for Canada is uranium mining and the fuel flexibility of CANDU nuclear technology compared to other nuclear technologies (see McKinsey & Co, 2012).
CARBON CAPTURE AND STORAGE RD&D
Carbon capture and storage (CCS) is recognised by the IEA as an important technology in the portfolio of options to address climate change. As part of the country’s commitment to responsible resource development, Canada is developing CCS technology as one component of a broad suite of measures to reduce GHG emissions in key sectors of the Canadian economy, including coal-fired power generation and the oil-sands. Canada is recognised as a world leader in advancing CCS projects, and hosts four large-scale projects that are either in operation or under construction, three of which have been announced since 2008:
§ The SaskPower Boundary Dam Integrated CCS Demonstration Project that is able to capture and store up to 1 MtCO2 per year from the Boundary Dam coal-fired power station in Saskatchewan; with the federal government contributing CAD 240 million and SaskPower, a provincially owned utility, contributing CAD 1.16 billion. This project is the world’s first commercial-scale CCS project at a coal-fired power plant and began operation in 2014.
© O
EC
D/IE
A, 2
016
11. Energy technology research, development and demonstration
261
§ The Shell Quest Project that will capture and store more than 1 MtCO2 per year from an oil-sands bitumen upgrader; with the federal government contributing CAD 120 million and the government of Alberta, CAD 745 million. The project was launched in November 2015.
§ The Alberta Carbon Trunk Line that is scheduled to transport up to 1.8 MtCO2 per year captured from a fertiliser plant and a bitumen refinery, when fully operational in 2017, with the federal government contributing CAD 63.2 million and the government of Alberta, CAD 495 million.
§ In operation since 2000, the commercial-scale CO2 enhanced oil recovery operation at the Weyburn-Midale fields in Saskatchewan injects and stores up to 2.9 MtCO2 per year. CO2 is captured and transported from a chemical plant in North Dakota, with additional volumes coming from SaskPower’s Boundary Dam Project.
In addition, the federal government, in collaboration with provincial governments, the private sector and academia, is involved in co-funding a variety of R&D projects to advance knowledge, particularly in the area of new capture processes, storage site characterisation, and CO2 monitoring. Examples include:
§ a pilot project on CO2-flood enhanced oil recovery for heavy oil in partnership with Husky Oil Operations Ltd.
§ the Aquistore Project, in collaboration with the government of Saskatchewan and the Petroleum Technology Research Center, which seeks to demonstrate that captured CO2 can be safely stored in deep saline formations in Saskatchewan
§ a project to assess onshore geological storage of CO2 in the province of Nova Scotia in partnership with the Carbon Capture and Storage Research Consortium of Nova Scotia
§ a project for surface monitoring, verification and accounting (MVA) for CCS in partnership with St. Francis Xavier University
§ SaskPower’s Carbon Capture Test Facility (CCTF), in partnership with Hitachi.
Canada is also home to a strong network of innovative Canadian CCS technology developers such as CO2 Solutions Inc., Inventys Thermal Technologies, HTC CO2 Systems Corporation, and CarbonCure Technologies which are all advancing next-generation technologies related to CCS.
These achievements in CCS are the direct result of government funding at the federal and provincial levels. Since 2008, the federal government has invested over CAD 580 million in CCS research, development and demonstration projects through Canada’s Economic Action Plan and a range of funding initiatives such as the ecoENERGY Technology Initiative, the ecoENERGY Innovation Initiative and the Clean Energy Fund. In total, the government of Canada and the provincial governments of Alberta, Saskatchewan and British Columbia have invested over CAD 1.8 billion in CCS with the potential to leverage up to CAD 4.5 billion in total public-private investment.
Private-sector interest in CCS has been partly driven by federal regulations that effectively prohibit the construction of new coal-fired generation without CCS and the expectation of future regulations on emissions from the oil and gas sectors. Under the Canadian federal GHG regulations, which were published in 2012 and come into effect in 2015, new coal-fired units and those reaching the end of their economic life and that wish to continue operation will need to incorporate CCS so as to meet a stringent
© O
EC
D/IE
A, 2
016
11. Energy technology research, development and demonstration
262
emissions performance standard of 420 tCO2 per GWh starting in 2025. The regulations also contain provisions that give recognition to units that implement CCS before they are subject to the performance standard. The Canadian success in demonstrating CCS is also due, in part, to work to provide regulatory oversight, especially by the province of Alberta which adopted and refined its regulatory framework for CO2 storage since the last IEA in-depth review (IEA, 2014).
Canada remains active on CCS and participates in a number of bilateral and multilateral initiatives such as the Canada-US Clean Energy Dialogue, collaboration under the 2014 Canada-UK Joint Statement on CCS, the Carbon Sequestration Leadership Forum (CSLF), the IEA, the Clean Energy Ministerial, and others. Under the Canada-U.S. Clean Energy Dialogue, the sharing of best practices and lessons learned and collaborative research have been performed between national government laboratories (CanmetENERGY-Ottawa Laboratory and the US National Energy Technology Laboratory) to reduce the costs associated with carbon capture and advance CO2 storage. The CanmetENERGY-Ottawa lab is pursuing collaboration with the US and other international partners in relevant CCS areas, i.e. next-generation carbon capture technologies.
These are also a key focus of Canada’s engagement in the Carbon Sequestration Leadership Forum, as the co-leader of a Task Force, along with Norway, to facilitate the global uptake of these technologies. This builds on previous collaborations such as the North American Carbon Storage Atlas that was created in 2012 between Canada, Mexico and the United States. The Atlas identifies major stationary sources of CO2 emissions and potential geological storage reservoirs for CO2 in all three countries and estimates Canada’s geological storage potential for CO2 to be over 130 gigatonnes.2
INTERNATIONAL COOPERATION
Canada has a strong track record in international energy R&D policy collaboration. The country participates in a number of multilateral and bilateral energy R&D activities, for example in 23 out of 39 International Energy Agency Implementing Agreements (IAs now called Technology Collaboration Programmes (TCPs)), in the International Partnership on Energy Efficiency Cooperation (IPEEC), the Asia-Pacific Economic Cooperation’s Energy Working Group (APEC EWG), the Clean Energy Ministerial, the Canada-US Clean Energy Dialogue, the Carbon Sequestration Leadership Forum (CSLF), the International Partnership for a Hydrogen Economy (IPHE), the Global Bio-Energy Partnership (GBEP), and the Generation-IV International Forum (Gen IV). In addition, the government of Canada has also developed memoranda of understanding on areas of interest with countries such as the US, Mexico, South Korea and China. In the context of the COP21, in November 2015, Canada was one of 20 countries that signed on to the Mission Innovation initiative – a global partnership aimed at doubling government investment in clean energy innovation over five years.
Canada participates in ten IAs focusing on energy efficiency for buildings (buildings and communities, district heating and cooling, energy storage, energy-efficient end-use equipment, and heat pumping technologies); on electricity (high-temperature superconductivity, smart grids); and on transport (advanced motor fuels, advanced transport materials, and hybrid and electric vehicles). Canada also participates in three
2. The North American Carbon Storage Atlas is available online at: www.netl.doe.gov/File%20Library/Research/Carbon-Storage/NACSA2012.pdf
© O
EC
D/IE
A, 2
016
11. Energy technology research, development and demonstration
263
IAs examining cleaner use of fossil fuels (enhanced oil recovery, fluidised bed conversion, IEA GHG programme), six IAs in renewable energies (bioenergy, ocean, photovoltaics, deployment, solar heating and cooling, wind), three IAs/TCPs in nuclear fusion (environment safety, economy of fusion power, nuclear technology reactors and fusion materials), and one IA focusing on technology transfer and project financing.
Given the high degree of market integration and policy alignment within North America and on a bilateral level, Canada has a long-standing international co-operation on energy with the United States. The Canada-US Clean Energy Dialogue also focuses on the exchange of experience on technology and research through the working groups on CCS, electricity grid, and clean energy R&D and energy efficiency. The clean energy R&D and energy efficiency working group aims to facilitate cross-border collaboration in priority areas, including marine energy, advanced biofuels, transportation, buildings and communities, and energy efficiency.
NRCan’s CanmetENERGY laboratories are actively pursuing international partnerships, particularly in oil-sands, unconventional oil and gas resources, clean coal, including CCS, and renewables as well as energy efficiency. NRCan encourages collaborative opportunities through federal funding programmes that allow its partners to effectively deliver efficient and clean technologies in these areas.
ASSESSMENT
Annual combined federal and provincial/territorial public spending on energy RD&D continues to fluctuate because of short-term and targeted programmes in support of large-scale demonstration projects.
Since the last IEA in-depth review in 2009, setting aside funding directed to CCS demonstration projects, there is a general downward trend in energy RD&D spending. Combined federal, provincial, territorial public energy RD&D expenditures marked a peak in 2012/13 and 2013/14 with CAD 1.25 billion and 1.34 billion respectively, but are expected to decline for the 2014/15 budget to CAD 942 million. Core funding for basic research and applied R&D at NRCan comes from the Program on Energy Research and Development (PERD), the funding for which has been declining as focus has shifted towards time-limited programmes. In recent years, public energy RD&D funding continues to depend on special programmes, such as the contributions from the Clean Energy Fund (CAD 316 million over seven years), the ecoENERGY Innovation Initiative (CAD 268 million over five years) and the Automotive Innovation Fund (CAD 1 billion over ten years), the first two of which are set to expire in 2016. Canada has tended to encourage business RD&D via indirect support mechanisms such as tax incentives, with higher incentives for SMEs, rather than via direct programme funding.
While it is sensible to have targeted, time-limited programmes – particularly where they are focused on technology demonstration – maintaining R&D capacity in the national laboratories and other institutions requires funding over time, thus enabling longer-term transformative technology development.
Federal energy RD&D priorities are aligned with Canada’s role as energy producer and exporter in support of its economic, environmental and industrial objectives. In 2015/16, the top federal RD&D funding priorities are planned for nuclear (27% of spending), fossil fuels and CCS (23%), and energy efficiency (19%), while at the provincial level (including state-owned enterprises) priorities lie in CCS (60%).
© O
EC
D/IE
A, 2
016
11. Energy technology research, development and demonstration
264
Since the last in-depth review in 2009, the share of energy RD&D spending allocated to fossil fuels, e.g. CCS and unconventional oil and gas, has nearly doubled within provincial expenditures, up from 35% in 2009/10 to 66% in 2014/15, in parallel with the strong private-sector investment in this technology area. The federal government continues to maintain a significant support to nuclear RD&D. From 2006 to 2010, the single largest area of federal funding was nuclear research. Since 2011, the nuclear RD&D budget has decreased, amid the restructuring of the AECL.
The 2009 in-depth review called upon the government to continue to assess its energy RD&D priorities and adjust the RD&D portfolio. The federal government has reviewed its priorities, and science and technology strategy. The government reviewed the potential export markets for Canadian technology and concluded that Canada has a good potential to develop its industries in clean energy technologies for emerging domestic and export markets, which also supports its GHG reduction targets.
Canada has emerged as technology innovator for the production of unconventional oil (oil-sands, drilling and well services), enhanced recovery, and CCS. This is the result of industry’s capacity to invest and innovate; of funding by the provinces and territories and state-owned entities, supported by federal tax incentives; of energy RD&D programmes and national laboratories which co-ordinate and facilitate RD&D collaboration with all stakeholders and complement the efforts of the provinces, industry and academia.
Looking into the future, the IEA believes that Canada has a strong basis to foster R&D activities focused on the integration of CCS with non-power generation processes, such as oil and gas upgrading and steam generation, in addition to advanced gas- and coal-fired power generation cycles. Given the energy intensity of the Canadian economy, RD&D funding for energy efficiency in industry is another potential economic opportunity. For this to happen, however, it is important to develop not only demonstration capabilities but develop and maintain the whole innovation chain, from basic research to commercialisation.
Commercialisation is still an emerging area in Canada’s innovation landscape. The federal government assists Canadian energy technologies towards commercialisation through the work of the Industrial Research Assistance Program (IRAP) which helps bring products developed by Canadian SMEs to the market, including cleantech. In addition, Canada launched the Venture Capital Action Plan in 2013 in order to increase private-sector investment in innovative businesses. As part of this Action Plan, the Kensington Venture Fund has an emphasis on investment opportunities in clean technology and energy technology, and includes a federal contribution of CAD 53 million alongside CAD 107 million in investments from Canada’s private sector.
Compared to its IEA peers, Canada is above the average in terms of public energy RD&D intensity and in terms of total spending in 2015. Overall business expenditure on RD&D in Canada is low, however, in comparison with other IEA member countries. Substantial RD&D is also performed and funded by the stated-owned enterprises, for instance large-scale demonstration of CCS technologies by the large electric utilities in the provinces/territories.
The federal government drives RD&D objectives primarily through targeted RD&D funding and collaboration under various programmes, rather than implementing a shared vision. Canada does not have a stand-alone energy RD&D strategy at the federal level. The government relies on the collaboration with provinces and territories under the Energy
© O
EC
D/IE
A, 2
016
11. Energy technology research, development and demonstration
265
and Mines Ministers’ Conference, on discussions at energy innovation roundtables and on strategic planning reviews of its funding. The IEA sees an opportunity for a federal energy RD&D strategy that would bring together energy industry RD&D, provincial/territorial and federal efforts, notably for the sharing of best practices across Canada and economic sectors. The formulation of such a strategy should be based on the review of the federal RD&D programmes and priorities, complemented by an evaluation of investment data and innovation and technology leadership in energy industries.
Strong co-operation with business and industry for priority-setting and programme implementation, in particular in the national laboratories, is an important success factor of any effective RD&D programme. To leverage Canadian export expertise across the market and to the international level, the IEA believes that the federal government, through the national energy laboratories, could play a stronger role as convenor and co-ordinator by developing networks of excellence together with provinces, territories, industry, academia and the financial sector. The role of the national energy laboratories could be expanded in this regard.
Commendably, Canada has been and continues to be very active in international technology-focused forums, such as IEA Implementing Agreements, and has been working to develop memoranda of understanding with other countries such as the United States, China, South Korea and Mexico in areas of interest.
Of particular note since the last review in 2009 is the change in the organisation of nuclear research both in terms of governance and funding. The restructuring of AECL has been completed in the fall of 2015 after the creation of the CNL and the selection of CNEA as the contractor in the GoCo (government-owned, contractor-operated) model, similar to that of the US national labs. By opting for such a model, the government aims to attract private-sector investment and management, and industry funding while maintaining important R&D capabilities and skills, in particular in the areas of decommissioning and waste management.
Going forward, the IEA believes the federal government should ensure that nuclear laboratories can leverage existing capabilities and develop a nuclear research agenda that meets the long-term needs of Canada in the areas of decommissioning and waste management, and technology innovation beyond the planned shut-down of the NRU reactor in March 2018. The government of Canada will need to adjust nuclear RD&D funding levels and priorities, in line with the new roles of AECL, CNL and CNEA.
RECOMMENDATIONS
The government of Canada should:
o Work with provinces and territories, their research entities and industry towards a co-ordinated approach to identifying priorities and collaborative actions so as to advance a shared vision under a Canadian energy RD&D strategy.
o Increase funding for Canada’s core Program of Energy Research and Development to a level commensurate with Canada’s long-term R&D goals (while continuing to fund focused energy RD&D programmes) in order to maintain and strengthen Canada's R&D capacity and boost commercialisation and innovation.
© O
EC
D/IE
A, 2
016
11. Energy technology research, development and demonstration
266
o Promote a stronger role for NRCan and its laboratories in co-ordinating energy research among provincial and federal entities by encouraging the formation of research networks to share access to essential research facilities.
o Further encourage initiatives enabling collaboration with industry and between industry, academia and government laboratories in Canada (e.g. COSIA, CIPEC) such as public-private partnerships and networks with industry in order to collect and expose energy investment experience, innovation and best practices.
o Ensure that Canada’s R&D capabilities are maintained to address long-term issues in the nuclear sector, including waste management, decommissioning, technological innovations, and the development of advanced nuclear energy systems.
References CCA (Council of Canadian Academies), (2013), The State of Industrial R&D In Canada, The Expert Panel on the State of Industrial R&D in Canada, Ottawa.
IEA (International Energy Agency) (2015), IEA Energy Technology RD&D Statistics (database), http://stats.oecd.org/BrandedView.aspx?oecd_bv_id=enetech-data-en&doi=data-00488-en, accessed on 6 March 2015.
IEA (2014), Carbon Capture and Storage: Legal and Regulatory Review, Edition 4, OECD/IEA, Paris.
McKinsey & Co (2012), Opportunities for Canadian energy technologies in global markets, commissioned by Natural Resources Canada.
NRCan (2014), Clean Energy Fund, Summary Report, Federal R&D, Office of Energy Research and Development, at: www.nrcan.gc.ca/sites/www.nrcan.gc.ca/files/energy/files/pdf/CLEAN-ENERGY-FUND-ENG-FINAL-may-29.pdf.
NRCan (2014a), Energy Markets, Fact Book 2014-2015, Ottawa.
OECD (2015), Main Science and Technology Indicators MSTI database, at: http://stats.oecd.org/Index.aspx?DataSetCode=MSTI_PUB, accessed on 2 March 2015.
OECD (2012a), Science, Technology and Innovation Outlook, OECD, Paris.
OECD (2012b), Science and Innovation: Canada, OECD, Paris.
RD Review (2011), Innovation Canada: A Call to Action, Review of Federal Support to Research and Development – Expert Panel Report (“Jenkins Report”).
Statistics Canada (2014), Industrial Research and Development: Intentions 2014 www.statcan.gc.ca/pub/88-202-x/2014000/t111-eng.htm.
© O
EC
D/IE
A, 2
016

PART IV ANNEXES
© O
EC
D/IE
A, 2
016

©
OE
CD
/IEA
, 201
6
Annexes
269
ANNEX A: ORGANISATION OF THE REVIEW
REVIEW CRITERIA
The Shared Goals, which were adopted by the IEA Ministers at their 4 June 1993 meeting in Paris, provide the evaluation criteria for the in-depth reviews conducted by the IEA. The Shared Goals are presented in Annex C.
REVIEW TEAM
The IEA in-depth review team visited Canada from 22 to 29 September 2014. Over the course of the week, the team met with government officials, regulators, stakeholders in the public and private sectors as well as other organisations and interest groups, and discussed the key challenges and opportunities facing energy policy makers in Canada both for the government of Canada and its provinces and territories.
IEA member countries
Mr. Odd Sverre Haraldsen, Norway
Mr. Matthew Redrup, United Kingdom
Mr. Eamonn Confrey, Ireland
Mr. Wim R.J.L. van’t Hof, Netherlands
Mr. Gareth Wilson, New Zealand
Mr. Eric Rollison, United States
Dr. Michael Kilpper, Germany
OECD Nuclear Energy Agency
Dr. Henri Paillere
International Energy Agency
Mr. Didier Houssin
Mr. Andrew Robertson
Mr. Sean McCoy
Ms Sylvia Beyer
Observer
Ms Jiaru Chen, China.
© O
EC
D/IE
A, 2
016

Annexes
270
The review has benefited from the co-operation, assistance and information provided by the many people involved throughout the review visit and process. The review team wishes to express its gratitude to Mr. Terence Hubbard, Director-General, Oil and Gas Branch, Mr. Drew Leyburne, Director-General, Energy Policy Branch, and staff, notably Ms Kristi Varangu, Director of the International Energy Division, for their input and support. The team is especially thankful to Mr. Charles Pagé and Ms Viktoryia Leipi, Ms Anna Nowak for organising the team visit, and providing input and comments throughout the entire review process. The IEA is grateful for the constructive and solid co-operation on energy data with the Canadian energy data authorities, notably Statistics Canada, the National Energy Board and Natural Resources Canada.
The review team thanks the government of Quebec and the government of Alberta and their staff for hosting meetings in Montreal, in Calgary and in Fort McMurray, and providing the team with a detailed overview of the policies of these provinces. The team thanks the governments of British Columbia, New Brunswick, Newfoundland and Labrador, Ontario, Prince Edward Island, Saskatchewan and Yukon, for presenting their policies during the review week and being in close co-operation during the entire review.
Sylvia Beyer (IEA) managed the review and drafted Chapters 2 on General Energy Policy, 4 on Energy Efficiency, 7 on Coal, 8 on Electricity, 9 on Renewable Energy and 11 on Energy Technology RD&D. Mr. Henri Pailliere (OECD/NEA) contributed Chapter 10 on Nuclear Energy. Mr. Andrew Robertson (IEA) completed Chapters 5 on Natural Gas and 6 on Oil. Mr. Sean McCoy (IEA) prepared Chapter 3 on Climate Change, with contributions from Ms Ellina Levina on climate change adaptation.
The report would not have been concluded without the fruitful discussions, comments and input provided by the review team members cited above and many IEA and NEA colleagues. The report has benefited from the valuable comments from Ms Carry Pottinger, Mr. Carlos Fernandez, Mr. Kijune Kim, Mr. Bryant Tyler, Ms Toril Bosoni, Mr. Paolo Frankl, Ms Araceli Fernandez Pales, Ms Costanza Jacazio, Mr. Heymi Bahar, Mr. Laszlo Varro and Mr. Paolo Frankl.
Special thanks go to the IEA Secretariat with regard to the data, publication and editing. Importantly, the report has received valuable support with timely and comprehensive data from Ms Roberta Quadrelli, Ms Sonja Lekovic, Ms Zakia Adam, Ms Erica Robin and Mr Taejin Park on the IEA statistics and energy balances, including the RD&D and the Energy Efficiency Indicators Databases.
Ms Sonja Lekovic and Mr. Bertrand Sadin ensured the preparation and design of the figures, maps and tables. The IEA Communication and Information Office (CIO), in particular Ms Rebecca Gaghen, Mr. Greg Frost, Ms Astrid Dumond, Mr. Bertrand Sadin and Ms. Madgalena Sanocka, provided essential support towards the report’s production and launch. The author thanks in particular Ms Viviane Consoli, Ms Therese Walsh, Ms Katie Russell and Ms Rebecca Gaghen who ensured the editorial finalisation.
ORGANISATIONS VISITED
During the visit to Canada, the review team met with the following organisations:
§ Natural Resources Canada (NRCan)
§ Environment Canada (EC)
© O
EC
D/IE
A, 2
016
Annexes
271
§ Finance Canada (FC)
§ Statistics Canada (StatsCan)
§ National Energy Board (NEB)
§ Major Projects Management Office (MPMO)
§ Aboriginal Affairs and Northern Development Canada (AANDC)
§ Sustainable Development Technology Canada (SDTC)
§ Canadian Wind Energy Association (CANWEA)
§ Canadian Solar Industries Association (CANSIA)
§ Canadian Electricity Association (CEA)
§ Canadian Nuclear Association (CNA)
§ Canadian Hydropower Association (CHA)
§ Canadian Fuels Association (CFA)
§ Canadian Gas Association (CGA)
§ Canadian Natural Gas Vehicle Alliance (CNGVA)
§ Canadian Renewable Fuels Association (CRFA)
§ Canadian Association of Petroleum Producers (CAPP)
§ Canada’s Oil Sands Innovation Alliance (COSIA)
§ Canadian Energy Pipeline Association (CEPA)
§ Canadian Society for Unconventional Resources (CSUR)
§ Explorers and Producers Association of Canada (EPAC)
§ Hydro-Quebec
§ Gouverment de Québec, ministère de l’Énergie et des Ressources naturelles (MERN)
§ Gouvernment de Québec, ministère des Relations internationales et de la Francophonie (MRIF)
§ Government of British Columbia, Ministry of Natural Gas Development
§ BC Oil and Gas Commission (BCOGC)
§ Saskatchewan government, Ministry of the Economy
§ SaskPower
§ Alberta Energy Regulator
§ Alberta Environmental Monitoring, Evaluation and Reporting Agency (AEMERA)
§ Alberta Energy
§ Alberta Innovates Energy and Environment Solutions
§ Pembina Institute
§ Environmental Law Centre
© O
EC
D/IE
A, 2
016

Annexes
272
© O
EC
D/IE
A, 2
016

ANNEX B: ENERGY BALANCES
AND KEY STATISTICAL DATA
© O
EC
D/IE
A, 2
016
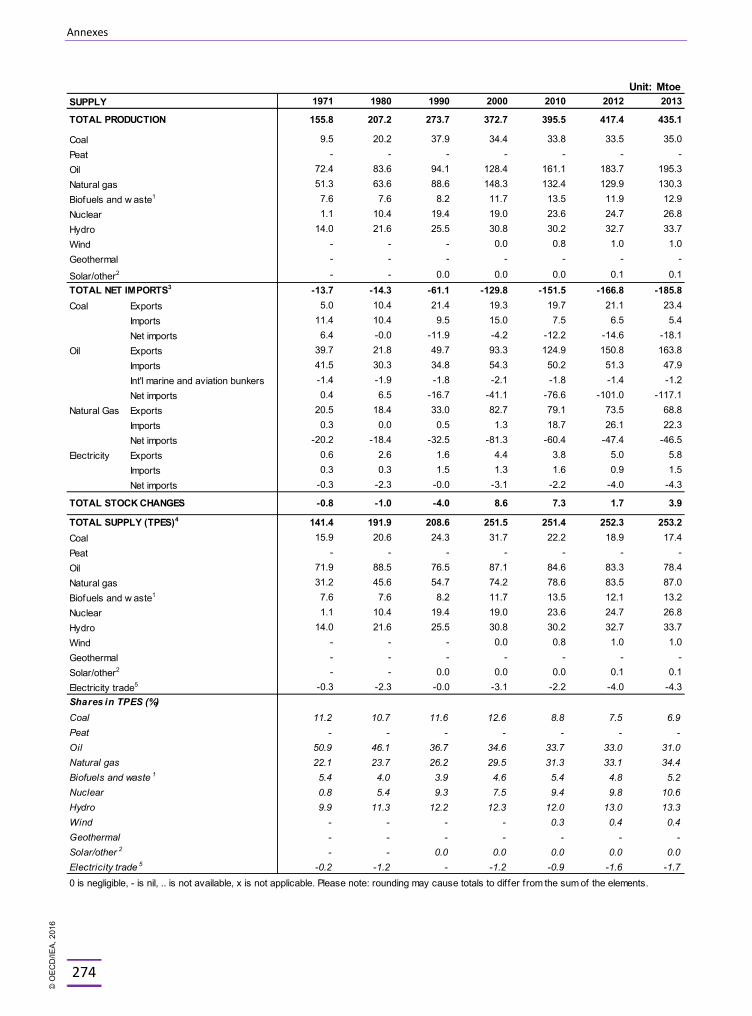
Annexes
274
Unit: MtoeSUPPLY 1971 1980 1990 2000 2010 2012 2013
TOTAL PRODUCTION 155.8 207.2 273.7 372.7 395.5 417.4 435.1
Coal 9.5 20.2 37.9 34.4 33.8 33.5 35.0Peat - - - - - - -Oil 72.4 83.6 94.1 128.4 161.1 183.7 195.3Natural gas 51.3 63.6 88.6 148.3 132.4 129.9 130.3Biofuels and w aste1 7.6 7.6 8.2 11.7 13.5 11.9 12.9Nuclear 1.1 10.4 19.4 19.0 23.6 24.7 26.8Hydro 14.0 21.6 25.5 30.8 30.2 32.7 33.7Wind - - - 0.0 0.8 1.0 1.0Geothermal - - - - - - -
Solar/other2 - - 0.0 0.0 0.0 0.1 0.1TOTAL NET IMPORTS3 -13.7 -14.3 -61.1 -129.8 -151.5 -166.8 -185.8Coal Exports 5.0 10.4 21.4 19.3 19.7 21.1 23.4
Imports 11.4 10.4 9.5 15.0 7.5 6.5 5.4Net imports 6.4 -0.0 -11.9 -4.2 -12.2 -14.6 -18.1
Oil Exports 39.7 21.8 49.7 93.3 124.9 150.8 163.8Imports 41.5 30.3 34.8 54.3 50.2 51.3 47.9Int'l marine and aviation bunkers -1.4 -1.9 -1.8 -2.1 -1.8 -1.4 -1.2Net imports 0.4 6.5 -16.7 -41.1 -76.6 -101.0 -117.1
Natural Gas Exports 20.5 18.4 33.0 82.7 79.1 73.5 68.8Imports 0.3 0.0 0.5 1.3 18.7 26.1 22.3Net imports -20.2 -18.4 -32.5 -81.3 -60.4 -47.4 -46.5
Electricity Exports 0.6 2.6 1.6 4.4 3.8 5.0 5.8Imports 0.3 0.3 1.5 1.3 1.6 0.9 1.5Net imports -0.3 -2.3 -0.0 -3.1 -2.2 -4.0 -4.3
TOTAL STOCK CHANGES -0.8 -1.0 -4.0 8.6 7.3 1.7 3.9
TOTAL SUPPLY (TPES)4 141.4 191.9 208.6 251.5 251.4 252.3 253.2Coal 15.9 20.6 24.3 31.7 22.2 18.9 17.4Peat - - - - - - -Oil 71.9 88.5 76.5 87.1 84.6 83.3 78.4Natural gas 31.2 45.6 54.7 74.2 78.6 83.5 87.0Biofuels and w aste1 7.6 7.6 8.2 11.7 13.5 12.1 13.2Nuclear 1.1 10.4 19.4 19.0 23.6 24.7 26.8Hydro 14.0 21.6 25.5 30.8 30.2 32.7 33.7Wind - - - 0.0 0.8 1.0 1.0Geothermal - - - - - - -Solar/other2 - - 0.0 0.0 0.0 0.1 0.1Electricity trade5 -0.3 -2.3 -0.0 -3.1 -2.2 -4.0 -4.3Shares in TPES (%)Coal 11.2 10.7 11.6 12.6 8.8 7.5 6.9Peat - - - - - - -Oil 50.9 46.1 36.7 34.6 33.7 33.0 31.0Natural gas 22.1 23.7 26.2 29.5 31.3 33.1 34.4Biofuels and waste 1 5.4 4.0 3.9 4.6 5.4 4.8 5.2Nuclear 0.8 5.4 9.3 7.5 9.4 9.8 10.6Hydro 9.9 11.3 12.2 12.3 12.0 13.0 13.3Wind - - - - 0.3 0.4 0.4Geothermal - - - - - - -Solar/other 2 - - 0.0 0.0 0.0 0.0 0.0Electricity trade 5 -0.2 -1.2 - -1.2 -0.9 -1.6 -1.70 is negligible, - is nil, .. is not available, x is not applicable. Please note: rounding may cause totals to differ from the sum of the elements.
© O
EC
D/IE
A, 2
016
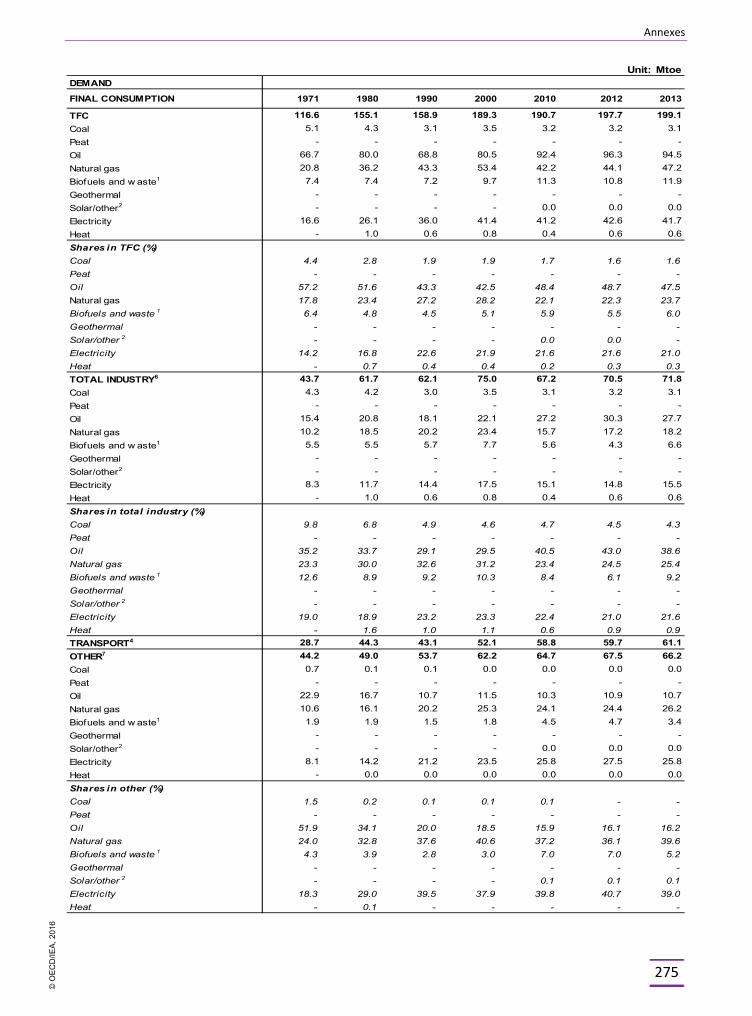
Annexes
275
Unit: MtoeDEMAND
FINAL CONSUMPTION 1971 1980 1990 2000 2010 2012 2013
TFC 116.6 155.1 158.9 189.3 190.7 197.7 199.1Coal 5.1 4.3 3.1 3.5 3.2 3.2 3.1Peat - - - - - - -Oil 66.7 80.0 68.8 80.5 92.4 96.3 94.5Natural gas 20.8 36.2 43.3 53.4 42.2 44.1 47.2Biofuels and w aste1 7.4 7.4 7.2 9.7 11.3 10.8 11.9Geothermal - - - - - - -Solar/other2 - - - - 0.0 0.0 0.0Electricity 16.6 26.1 36.0 41.4 41.2 42.6 41.7Heat - 1.0 0.6 0.8 0.4 0.6 0.6Shares in TFC (%) Coal 4.4 2.8 1.9 1.9 1.7 1.6 1.6Peat - - - - - - -Oil 57.2 51.6 43.3 42.5 48.4 48.7 47.5Natural gas 17.8 23.4 27.2 28.2 22.1 22.3 23.7Biofuels and waste 1 6.4 4.8 4.5 5.1 5.9 5.5 6.0Geothermal - - - - - - -Solar/other 2 - - - - 0.0 0.0 -Electricity 14.2 16.8 22.6 21.9 21.6 21.6 21.0Heat - 0.7 0.4 0.4 0.2 0.3 0.3TOTAL INDUSTRY6 43.7 61.7 62.1 75.0 67.2 70.5 71.8Coal 4.3 4.2 3.0 3.5 3.1 3.2 3.1Peat - - - - - - -Oil 15.4 20.8 18.1 22.1 27.2 30.3 27.7Natural gas 10.2 18.5 20.2 23.4 15.7 17.2 18.2Biofuels and w aste1 5.5 5.5 5.7 7.7 5.6 4.3 6.6Geothermal - - - - - - -Solar/other2 - - - - - - -Electricity 8.3 11.7 14.4 17.5 15.1 14.8 15.5Heat - 1.0 0.6 0.8 0.4 0.6 0.6Shares in total industry (%) Coal 9.8 6.8 4.9 4.6 4.7 4.5 4.3Peat - - - - - - -Oil 35.2 33.7 29.1 29.5 40.5 43.0 38.6Natural gas 23.3 30.0 32.6 31.2 23.4 24.5 25.4Biofuels and waste 1 12.6 8.9 9.2 10.3 8.4 6.1 9.2Geothermal - - - - - - -Solar/other 2 - - - - - - -Electricity 19.0 18.9 23.2 23.3 22.4 21.0 21.6Heat - 1.6 1.0 1.1 0.6 0.9 0.9TRANSPORT4 28.7 44.3 43.1 52.1 58.8 59.7 61.1OTHER7 44.2 49.0 53.7 62.2 64.7 67.5 66.2Coal 0.7 0.1 0.1 0.0 0.0 0.0 0.0Peat - - - - - - -Oil 22.9 16.7 10.7 11.5 10.3 10.9 10.7Natural gas 10.6 16.1 20.2 25.3 24.1 24.4 26.2Biofuels and w aste1 1.9 1.9 1.5 1.8 4.5 4.7 3.4Geothermal - - - - - - -Solar/other2 - - - - 0.0 0.0 0.0Electricity 8.1 14.2 21.2 23.5 25.8 27.5 25.8Heat - 0.0 0.0 0.0 0.0 0.0 0.0Shares in other (%) Coal 1.5 0.2 0.1 0.1 0.1 - -Peat - - - - - - -Oil 51.9 34.1 20.0 18.5 15.9 16.1 16.2Natural gas 24.0 32.8 37.6 40.6 37.2 36.1 39.6Biofuels and waste 1 4.3 3.9 2.8 3.0 7.0 7.0 5.2Geothermal - - - - - - -Solar/other 2 - - - - 0.1 0.1 0.1Electricity 18.3 29.0 39.5 37.9 39.8 40.7 39.0Heat - 0.1 - - - - -
© O
EC
D/IE
A, 2
016
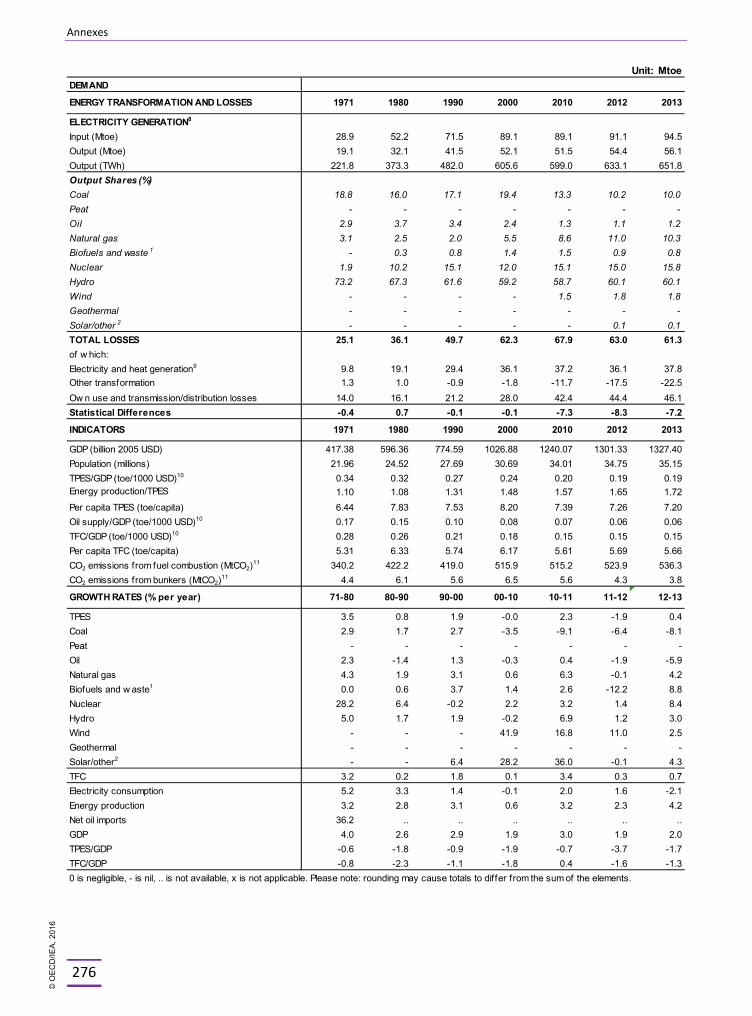
Annexes
276
Unit: MtoeDEMAND
ENERGY TRANSFORMATION AND LOSSES 1971 1980 1990 2000 2010 2012 2013
ELECTRICITY GENERATION8
Input (Mtoe) 28.9 52.2 71.5 89.1 89.1 91.1 94.5Output (Mtoe) 19.1 32.1 41.5 52.1 51.5 54.4 56.1Output (TWh) 221.8 373.3 482.0 605.6 599.0 633.1 651.8Output Shares (%)Coal 18.8 16.0 17.1 19.4 13.3 10.2 10.0Peat - - - - - - -Oil 2.9 3.7 3.4 2.4 1.3 1.1 1.2Natural gas 3.1 2.5 2.0 5.5 8.6 11.0 10.3Biofuels and waste 1 - 0.3 0.8 1.4 1.5 0.9 0.8Nuclear 1.9 10.2 15.1 12.0 15.1 15.0 15.8Hydro 73.2 67.3 61.6 59.2 58.7 60.1 60.1Wind - - - - 1.5 1.8 1.8Geothermal - - - - - - -Solar/other 2 - - - - - 0.1 0.1TOTAL LOSSES 25.1 36.1 49.7 62.3 67.9 63.0 61.3of w hich:Electricity and heat generation9 9.8 19.1 29.4 36.1 37.2 36.1 37.8Other transformation 1.3 1.0 -0.9 -1.8 -11.7 -17.5 -22.5Ow n use and transmission/distribution losses 14.0 16.1 21.2 28.0 42.4 44.4 46.1Statistical Differences -0.4 0.7 -0.1 -0.1 -7.3 -8.3 -7.2
INDICATORS 1971 1980 1990 2000 2010 2012 2013
GDP (billion 2005 USD) 417.38 596.36 774.59 1026.88 1240.07 1301.33 1327.40Population (millions) 21.96 24.52 27.69 30.69 34.01 34.75 35.15TPES/GDP (toe/1000 USD)10 0.34 0.32 0.27 0.24 0.20 0.19 0.19Energy production/TPES 1.10 1.08 1.31 1.48 1.57 1.65 1.72Per capita TPES (toe/capita) 6.44 7.83 7.53 8.20 7.39 7.26 7.20Oil supply/GDP (toe/1000 USD)10 0.17 0.15 0.10 0.08 0.07 0.06 0.06TFC/GDP (toe/1000 USD)10 0.28 0.26 0.21 0.18 0.15 0.15 0.15Per capita TFC (toe/capita) 5.31 6.33 5.74 6.17 5.61 5.69 5.66CO2 emissions from fuel combustion (MtCO2)11 340.2 422.2 419.0 515.9 515.2 523.9 536.3CO2 emissions from bunkers (MtCO2)11 4.4 6.1 5.6 6.5 5.6 4.3 3.8
GROWTH RATES (% per year) 71-80 80-90 90-00 00-10 10-11 11-12 12-13
TPES 3.5 0.8 1.9 -0.0 2.3 -1.9 0.4Coal 2.9 1.7 2.7 -3.5 -9.1 -6.4 -8.1Peat - - - - - - -Oil 2.3 -1.4 1.3 -0.3 0.4 -1.9 -5.9Natural gas 4.3 1.9 3.1 0.6 6.3 -0.1 4.2Biofuels and w aste1 0.0 0.6 3.7 1.4 2.6 -12.2 8.8Nuclear 28.2 6.4 -0.2 2.2 3.2 1.4 8.4Hydro 5.0 1.7 1.9 -0.2 6.9 1.2 3.0Wind - - - 41.9 16.8 11.0 2.5Geothermal - - - - - - -Solar/other2 - - 6.4 28.2 36.0 -0.1 4.3TFC 3.2 0.2 1.8 0.1 3.4 0.3 0.7Electricity consumption 5.2 3.3 1.4 -0.1 2.0 1.6 -2.1Energy production 3.2 2.8 3.1 0.6 3.2 2.3 4.2Net oil imports 36.2 .. .. .. .. .. ..GDP 4.0 2.6 2.9 1.9 3.0 1.9 2.0TPES/GDP -0.6 -1.8 -0.9 -1.9 -0.7 -3.7 -1.7TFC/GDP -0.8 -2.3 -1.1 -1.8 0.4 -1.6 -1.30 is negligible, - is nil, .. is not available, x is not applicable. Please note: rounding may cause totals to differ from the sum of the elements.
© O
EC
D/IE
A, 2
016
Annexes
277
Footnotes to energy balances and key statistical data
1. Biofuels and waste comprises solid biofuels, liquid biofuels, biogases, industrial waste and municipal waste. Data are often based on partial surveys and may not be comparable between countries.
2. In addition to coal, oil, natural gas and electricity, total net imports also include biofuels and waste.
3. Excludes international marine bunkers and international aviation bunkers.
4. Total supply of electricity represents net trade. A negative number in the share of TPES indicates that exports are greater than imports.
5. Industry includes non-energy use.
6. Other includes residential, commercial and public services, agriculture/forestry, fishing and other non-specified.
7. Inputs to electricity generation include inputs to electricity and CHP plants. Output refers only to electricity generation.
8. Losses arising in the production of electricity and heat at main activity producer utilities and autoproducers. For non-fossil-fuel electricity generation, theoretical losses are shown based on plant efficiencies of approximately 33% for nuclear and solar thermal, and 100% for hydro, wind and solar photovoltaic.
9. Data on “losses” for forecast years often include large statistical differences covering differences between expected supply and demand and mostly do not reflect real expectations on transformation gains and losses.
10. Toe per thousand US dollars at 2005 prices and exchange rates.
11. “CO2 emissions from fuel combustion” have been estimated using the IPCC Tier I Sectoral Approach from the 2006 IPCC Guidelines. In accordance with the IPCC methodology, emissions from international marine and aviation bunkers are not included in national totals. Projected emissions for oil and gas are derived by calculating the ratio of emissions to energy use for 2013 and applying this factor to forecast energy supply. Projected emissions for coal are based on product-specific supply projections and are calculated using the IPCC/OECD emission factors and methodology.
© O
EC
D/IE
A, 2
016

©
OE
CD
/IEA
, 201
6
Annexes
279
ANNEX C: INTERNATIONAL ENERGY AGENCY “SHARED GOALS”
The member countries* of the International Energy Agency (IEA) seek to create conditions in which the energy sectors of their economies can make the fullest possible contribution to sustainable economic development and to the well-being of their people and of the environment. In formulating energy policies, the establishment of free and open markets is a fundamental point of departure, though energy security and environmental protection need to be given particular emphasis by governments. IEA countries recognise the significance of increasing global interdependence in energy. They therefore seek to promote the effective operation of international energy markets and encourage dialogue with all participants. In order to secure their objectives, member countries therefore aim to create a policy framework consistent with the following goals:
1. Diversity, efficiency and flexibility within the energy sector are basic conditions for longer-term energy security: the fuels used within and across sectors and the sources of those fuels should be as diverse as practicable. Non-fossil fuels, particularly nuclear and hydro power, make a substantial contribution to the energy supply diversity of IEA countries as a group.
2. Energy systems should have the ability to respond promptly and flexibly to energy emergencies. In some cases this requires collective mechanisms and action: IEA countries co-operate through the Agency in responding jointly to oil supply emergencies.
3. The environmentally sustainable provision and use of energy are central to the achievement of these shared goals. Decision-makers should seek to minimise the adverse environmental impacts of energy activities, just as environmental decisions should take account of the energy consequences. Government interventions should respect the Polluter Pays Principle where practicable.
4. More environmentally acceptable energy sources need to be encouraged and developed. Clean and efficient use of fossil fuels is essential. The development of economic non-fossil sources is also a priority. A number of IEA member countries wish to retain and improve the nuclear option for the future, at the highest available safety standards, because nuclear energy does not emit carbon dioxide. Renewable sources will also have an increasingly important contribution to make.
5. Improved energy efficiency can promote both environmental protection and energy security in a cost-effective manner. There are significant opportunities for greater energy efficiency at all stages of the energy cycle from production to consumption. Strong efforts by governments and all energy users are needed to realise these opportunities.
6. Continued research, development and market deployment of new and improved energy technologies make a critical contribution to achieving the objectives outlined above. Energy technology policies should complement broader energy policies. International co-operation in the development and dissemination of energy technologies, including industry participation and co-operation with non-member countries, should be encouraged.
© O
EC
D/IE
A, 2
016

Annexes
280
7. Undistorted energy prices enable markets to work efficiently. Energy prices should not be held artificially below the costs of supply to promote social or industrial goals. To the extent necessary and practicable, the environmental costs of energy production and use should be reflected in prices.
8. Free and open trade and a secure framework for investment contribute to efficient energy markets and energy security. Distortions to energy trade and investment should be avoided.
9. Co-operation among all energy market participants helps to improve information and understanding, and encourages the development of efficient, environmentally accepand flexible energy systems and markets worldwide. These are needed to help promote the investment, trade and confidence necessary to achieve global energy security and environmental objectives.
(The Shared Goals were adopted by IEA Ministers at the meeting of 4 June 1993 Paris, France.)
* Australia, Austria, Belgium, Canada, the Czech Republic, Denmark, Estonia, Finland, France, Germany, Greece, Hungary, Ireland, Italy, Japan, Korea, Luxembourg, the Netherlands, New Zealand, Norway, Poland, Portugal, the Slovak Republic, Canada, Sweden, Switzerland, Turkey, the United Kingdom, the United States.
© O
EC
D/IE
A, 2
016
Annexes
281
ANNEX D: GLOSSARY AND LIST OF ABBREVIATIONS
In this report, abbreviations and acronyms are substituted for a number of terms used within the International Energy Agency. While these terms generally have been written out on first mention, this glossary provides a quick and central reference for the abbreviations used.
AANDC Aboriginal Affairs and Northern Development Canada AECL Atomic Energy Canada Limited AER Alberta Energy Regulator ABWR advanced boiling water reactor APR advanced pressurised reactor b/d barrels per day bcm billion cubic metres BCOGC British Columbia Oil and Gas Commission CAD Canadian dollars CANDU Canadian Deuterium Uranium Reactor CCA capital cost allowance CCGT combined-cycle gas turbine CDM clean development mechanism (under the Kyoto Protocol) CCME Canadian Council of Ministers of the Environment CED Clean Energy Dialogue CES Canadian Energy Strategy CCS carbon capture and storage CHP combined production of heat and power CNEA Canadian National Energy Alliance CNL Canadian Nuclear Laboratories CNSC Canadian Nuclear Safety Commission CoF Council of the Federation COP21 21st Conference of the Parties COSIA Canada’s Oil Sands Innovation Alliance DSO distribution system operator DHC district heating and cooling EA environmental assessment EC Environment Canada EIA environmental impact assessment EMMC Energy and Mines’ Ministers Conference EPA Environmental Protection Agency (US) FERC Federal Energy Regulatory Commission
© O
EC
D/IE
A, 2
016
Annexes
282
FiT feed-in tariff GiC Governor in Council GHG greenhouse gas GoCo government-owned, contractor-operated GW gigawatt HDV heavy-duty vehicle HWR heavy water reactor IAs implementing agreements (IEA Technology Collaboration Programmes) IAEA International Atomic Energy Agency (in Vienna) INDC Intended Nationally Determined Contribution IMO International Maritime Organisation IPCC Intergovernmental Panel on Climate Change kb/d thousand barrels per day kWh kilowatt hour LNG liquefied natural gas LWR light water reactor LPG liquefied petroleum gas LULUCF land use, land-use change, and forestry LWGR light water-moderated graphite reactor MPMO Major Projects Management Office MEPS minimum energy performance standards mb million barrels MBtu million British thermal units mcm million cubic metres Mt million tonnes MtCO2-eq million tonnes of carbon dioxide-equivalent Mtoe million tonnes of oil-equivalent MW megawatt NAFTA North American Free Trade Agreement NEB National Energy Board NERC North American Electric Reliability Corporation NPMO Northern Projects Management Office NPP nuclear power plant NRCan Natural Resources Canada NWMO Nuclear Waste Management Organisation PHWR pressurised heavy water reactor PPP purchasing power parity: the rate of currency conversion that equalises the
purchasing power of different currencies, i.e. PPP estimates the differences in price levels between countries
PV photovoltaics PWR pressurised water reactor
© O
EC
D/IE
A, 2
016
Annexes
283
RRD Responsible Resource Development R&D research and development RD&D research, development and demonstration StatsCan Statistics Canada TC Transport Canada toe tonne of oil-equivalent TPA third-party access TPES total primary energy supply TSO transmission system operator TWh terawatt hour UNFCCC United Nations Framework Convention on Climate Change VRE variable renewable energy
© O
EC
D/IE
A, 2
016

Onl
in
e bookshopPDF versions at 20% discount
ww
w.i
ea.o
rg/booksIn
tern
atio
nal
Energy Agency
Secure Sustain
able T
oget
her
World Energy Outlook series
Energy Statistics series
Energy Policiesof IEA
Countriesseries
Energy Technology
Perspectives series
E-mail: books@
iea.org
Medium-Term Market
Reports series
Oil
Coal
Gas
RenewableEnergy
EnergyPolicies
Beyond IEA Countries
series
EnergyEfficiency
Market Report

This publication reflects the views of the IEA Secretariat but does not necessarily reflect those of individual IEA member countries. The IEA makes no representation or warranty, express or implied, in respect of the
publication’s contents (including its completeness or accuracy) and shall not be responsible for any use of, or reliance on, the publication.
This publication and any map included herein are without prejudice to the status of or sovereignty over any territory, to the delimitation of international frontiers and boundaries and to the name of any territory, city
or area.
IEA PUBLICATIONS, 9 rue de la Fédération, 75739 PARIS CEDEX 15 Layout in France by Jouve, February 2016
Cover design: IEA, photo credits: GraphicObsession

CanadaEnergy Policies of IEA Countries
Canada has continued to harvest its vast natural resources and witnessed a shale revolution alongside rising oil sands production and investment in the energy sector over the past five years. The
medium-term outlook for gas/oil production and exports, however, is challenging amid uncertainties around pipeline developments and an era of low prices, abundant global supplies and surging production in
the United States, Canada’s main export market.
Canada maintains the highest energy supply per capita among IEA member countries. Emissions from the oil and gas sectors increased by
14% in 2005-13, despite Canada’s low-carbon electricity mix (largely hydro and nuclear). The federal government, with the provinces, has
put forward stringent energy efficiency and emission standards in the buildings, power and transport sectors, but not in industry. To
strengthen its position as responsible energy supplier and user, Canada must take action to mitigate emissions and energy intensity. It can
continue to develop its resources in a sustainable and cost-effective manner while balancing its economic and sustainability goals.
Canada remains at the forefront of technological and regulatory innovation in unconventional oil and gas production and carbon
capture and storage (CCS) with four large-scale CCS projects under way in 2015. The country has adopted ambitious climate targets at
provincial and federal levels, but the federation is far from meeting its targets for 2020 and 2030. In July 2015, the Premiers of the provinces and territories agreed a Canadian Energy Strategy. The IEA urges the
federal government to seize this opportunity for collective action to meet its 2030 goals and bring certainty to investment in clean-energy
technologies and renewables.
This in-depth review analyses the energy policy challenges facing Canada and provides recommendations for each energy sector, including advice
for the implementation of the Canadian Energy Strategy.
(61 2015 26 1E1)
978-92-64-24364-4 €60
9HSTCQE*cedgee+