energy neighbourhoods big day out! cardiff bay 15 june 2013
TRANSCRIPT
Energy Neighbourhoods Big Day Out!Cardiff Bay15 June 2013
Energy Neighbourhoods
Karen Robinson
Severn Wye Energy Agency
www.energyneighbourhoods.org.uk

Plan for the day
11.45 – 12.15: Presentation
12.15 -12.30: Prizes
12.30 : LUNCH!
13.00: Free to tour Cardiff Bay
16:00: Return to Coach (please don’t be late!)

Thank you
What have you learned?
Which age category emits the most carbon dioxide
Under 30’s
50-64
Over 70’s
EN logo placeholder
In a house with no insulation, where is most of the heat lost?
Through the floor?
Through the walls?
Through the roof?
EN logo placeholder

Through the walls – if possible, always insulate.
EN logo placeholder
How much energy consumed by the average washing machine is used to heat the water?
Almost 90%
Almost 70%
Almost 60%
EN logo placeholder

Which of these generates the least carbon emissions?
6 minute electric shower
6 minute shower from a gas fired combi boiler
6 minute bath
EN logo placeholder
Turning the thermostat down by 1º can cut how much from the average heating bill?
5%
10%
15%
EN logo placeholder

Is a kWh the same as a unit of gas?
EN logo placeholder

How did the UK do?
Overall, we made an energy saving of
5.62%
And we saved…..
17.4 tonnes of CO²EN logo placeholder
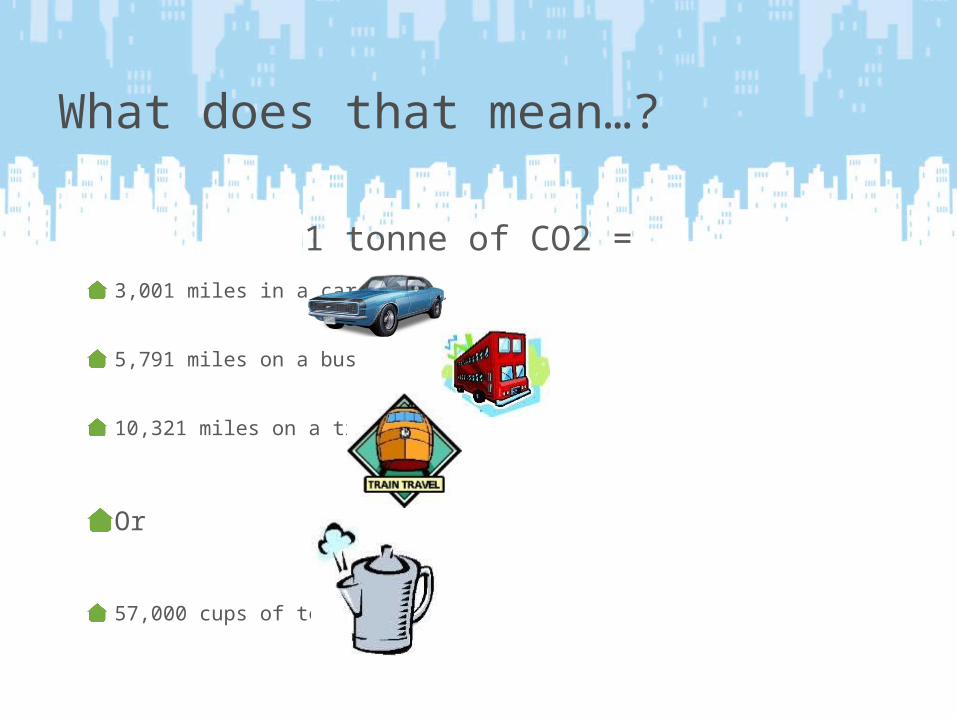
What does that mean…?
1 tonne of CO2 = 3,001 miles in a car
5,791 miles on a bus
10,321 miles on a train
Or
57,000 cups of tea

EN logo placeholder
2010 – 496 million tonnes of CO2
30% from home energy use
Average carbon footprint of someone in UK is 15 tonnes of CO2
Energy use in home accounts for 3.2 tonnes of CO2

EN logo placeholder
1 broadleaf tree left to grow for 100 years will absorb in the region of 1 tonne of CO2

European results – Year 2
Country Tonnes of C02
Belgium 96
Bulgaria 89
Hungary 70
Greece 62
Spain 45
Austria 44
Romania 41
Ireland 38
Country Tonnes of CO2
France 36
UK 17
Slovenia 17
Italy 14
Poland 6
Germany 5
Latvia 4
Sweden 1
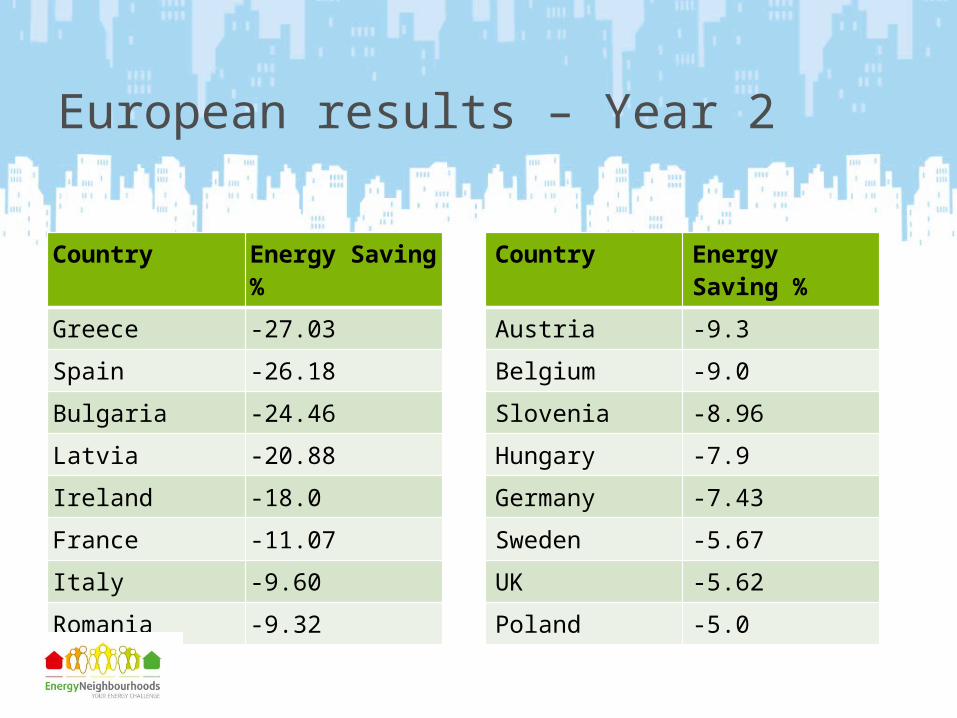
European results – Year 2
Country Energy Saving %
Greece -27.03
Spain -26.18
Bulgaria -24.46
Latvia -20.88
Ireland -18.0
France -11.07
Italy -9.60
Romania -9.32
Country Energy Saving %
Austria -9.3
Belgium -9.0
Slovenia -8.96
Hungary -7.9
Germany -7.43
Sweden -5.67
UK -5.62
Poland -5.0

What has made the savings….
Most people just wanted to save money
Surprising increase in interest in environment
Substantial increase in number of people who now always: turn lights off when they leave the room;
Turn the TV off at the wall;
only boil the amount of water needed; and
Set the thermostat lower.
Has been significant increase in number who feel more informed about energy efficiency in their home and their appliances.
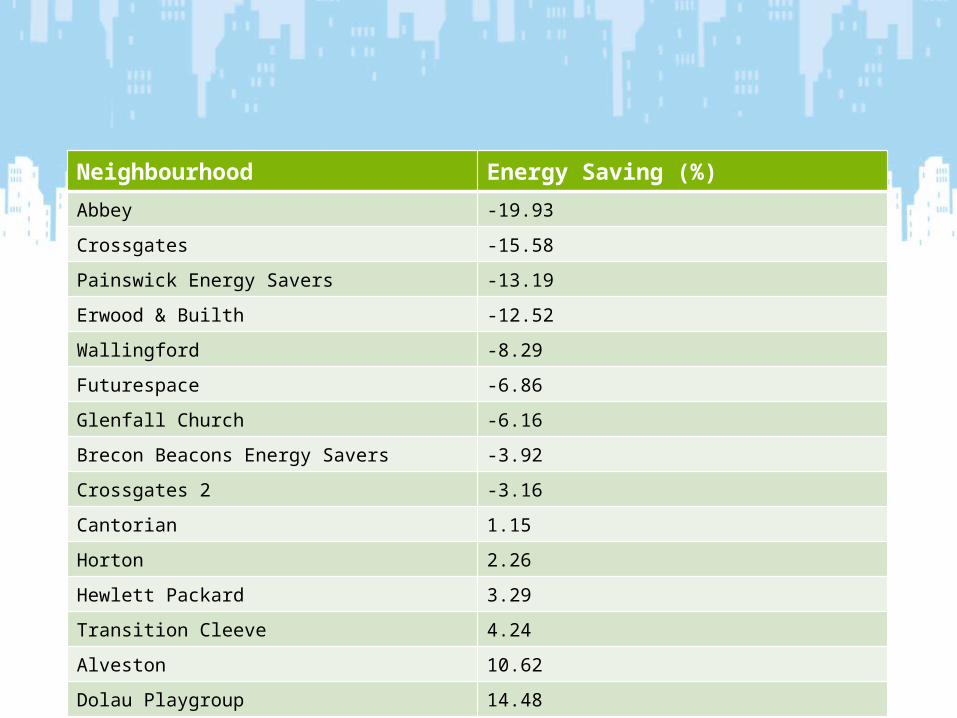
Neighbourhood Energy Saving (%)
Abbey -19.93
Crossgates -15.58
Painswick Energy Savers -13.19
Erwood & Builth -12.52
Wallingford -8.29
Futurespace -6.86
Glenfall Church -6.16
Brecon Beacons Energy Savers -3.92
Crossgates 2 -3.16
Cantorian 1.15
Horton 2.26
Hewlett Packard 3.29
Transition Cleeve 4.24
Alveston 10.62
Dolau Playgroup 14.48
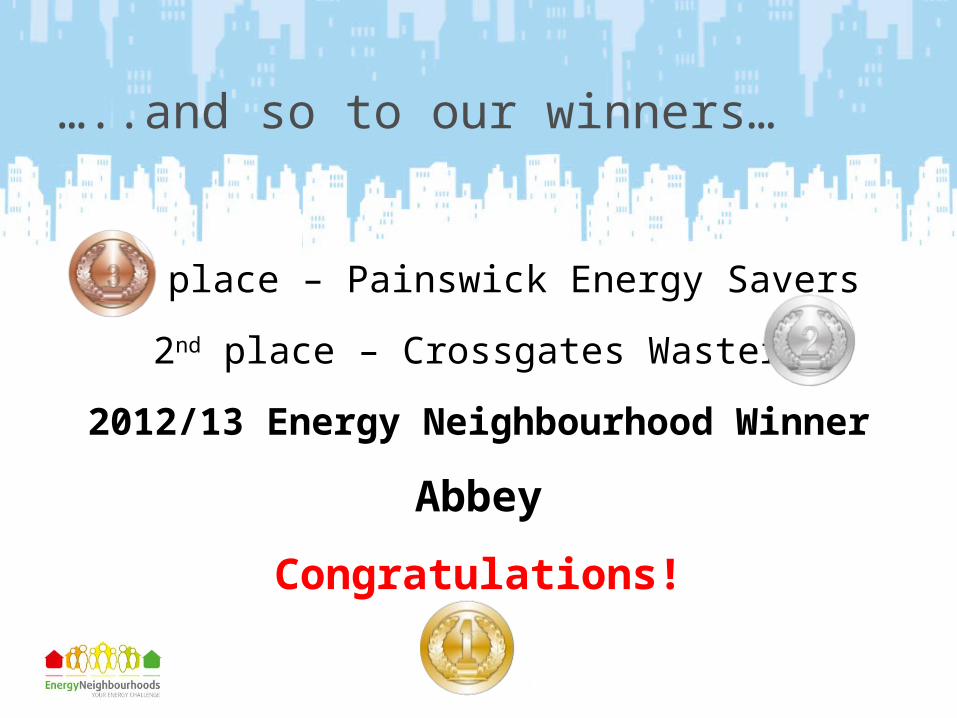
…..and so to our winners…
3rd place – Painswick Energy Savers
2nd place – Crossgates Wasters
2012/13 Energy Neighbourhood Winner
Abbey
Congratulations!EN logo placeholder