the effect of the cardiff bay barrage on waterbird
TRANSCRIPT

BTO Research Report No. 254
The Effect of the Cardiff Bay Barrage on Waterbird Populations
11. Distribution and Movement Studies August 1999-May 2000
Authors
N.H.K. Burton, M.J.S. Armitage, M.J. Raven, M.M. Rehfisch & N.A. Clark
Report of work carried out by The British Trust for Ornithology
under contract to Cardiff Bay Development Corporation (up to 31 March 2000)
and The County Council of the City and County of Cardiff (from 1 April 2000)
January 2001
� British Trust for Ornithology
and The County Council of the City and County of Cardiff
The National Centre for Ornithology, The Nunnery, Thetford, Norfolk IP24 2PU Registered Charity No. 216652


CONTENTS
Page No. List of Tables ......................................................................................................................................3 List of Figures ......................................................................................................................................5 List of Appendices.................................................................................................................................7 EXECUTIVE SUMMARY ..................................................................................................................9 GENERAL INTRODUCTION..........................................................................................................11 PART 1: DISTRIBUTION STUDIES...............................................................................................13 1. INTRODUCTION..................................................................................................................13 2. METHODS.............................................................................................................................15 2.1 All-day Counts........................................................................................................................15 2.2 Low Tide Counts....................................................................................................................15 2.3 Data Analysis and Presentation of Results ..........................................................................15 3. RESULTS ...............................................................................................................................17 3.1 Shelduck Tadorna tadorna.....................................................................................................17 3.2 Dunlin Calidris alpina ............................................................................................................18 3.3 Curlew Numenius arquata .....................................................................................................18 3.4 Redshank Tringa tetanus .......................................................................................................19 3.5 Other Species..........................................................................................................................20 3.5.1 Mallard Anas platyrhynchos.....................................................................................20 3.5.2 Teal Anas crecca........................................................................................................20 3.5.3 Pintail Anas acuta......................................................................................................21 3.5.4 Pochard Aythya farina ..............................................................................................21 3.5.5 Oystercatcher Haematopus ostralegus.....................................................................21 3.5.6 Ringed Plover Charadrius hiaticula.........................................................................21 3.5.7 Grey Plover Pluvialis squatarola..............................................................................21 3.5.8 Lapwing Vanellus vanellus .......................................................................................21 3.5.9 Knot Calidris canutus................................................................................................21 3.5.10 Turnstone Arenaria interpres ...................................................................................22 3.6 Occasional Species .................................................................................................................22 4. DISCUSSION.........................................................................................................................23 PART 2: REDSHANK STUDIES......................................................................................................25 5. INTRODUCTION..................................................................................................................25 6. METHODS.............................................................................................................................27 6.1 Colour-ringing........................................................................................................................27 6.2 Radio-tagging .........................................................................................................................27 6.3 Data Analysis and Presentation of Results ..........................................................................27 6.3.1 Movements of Redshank Before and After Barrage-Closure...............................27 6.3.1.1 Data from Colour-ringed Birds.........................................................................27 6.3.1.2 Data from Radio-tagged Birds ..........................................................................28
BTO Research Report No. 254 January 2001
1

Page No. 6.3.2 Survival Analysis.......................................................................................................28 7. RESULTS ...............................................................................................................................31 7.1 Movements of Redshank Before and After Barrage-Closure............................................31 7.1.1 Colour-ringing Studies .............................................................................................31 7.1.2 Radio-tracking ..........................................................................................................31 7.2 Survival Analysis....................................................................................................................32 8. DISCUSSION.........................................................................................................................33 Acknowledgements .............................................................................................................................35 References............................................................................................................................................37 Tables ...................................................................................................................................................41 Figures..................................................................................................................................................55 Appendices...........................................................................................................................................89
BTO Research Report No. 254 January 2001
2

List of Tables Page No. Table 2.3.1 The importance of the Severn Estuary and Cardiff Bay for waterbirds in a British and international context. .........................................................................41 Table 3.1.1 Likelihood ratio statistics and associated probabilities for month, state of tide, mudflat, state of tide*mudflat and year in generalized linear models describing densities of feeding Shelduck at Cardiff Bay from 1989/90 to 1998/99 and Orchard Ledges and Rhymney from 1989/90 to 1999/2000..................42 Table 3.1.2 Likelihood ratio statistics and associated probabilities for month, mudflat and year in a generalized linear model describing densities of feeding Shelduck at low tide on eight mudflats at Peterstone and St. Brides from 1992/93 to 1999/2000........43 Table 3.2.1 Likelihood ratio statistics and associated probabilities for month, state of tide, mudflat, state of tide*mudflat and year in generalized linear models describing densities of feeding Dunlin at Cardiff Bay from 1989/90 to 1998/99 and Orchard Ledges and Rhymney from 1989/90 to 1999/2000.......................................44 Table 3.2.2 Likelihood ratio statistics and associated probabilities for month, mudflat and year in a generalized linear model describing densities of feeding Dunlin at low tide on eight mudflats at Peterstone and St. Brides from 1992/93 to 1999/2000........45 Table 3.3.1 Likelihood ratio statistics and associated probabilities for month, state of tide, mudflat, state of tide*mudflat and year in generalized linear models describing densities of feeding Curlew at Cardiff Bay from 1989/90 to 1998/99 and Orchard Ledges and Rhymney from 1989/90 to 1999/2000.......................................46 Table 3.3.2 Likelihood ratio statistics and associated probabilities for month, mudflat and year in a generalized linear model describing densities of feeding Curlew at low tide on eight mudflats at Peterstone and St. Brides from 1992/93 to 1999/2000........47 Table 3.4.1 Likelihood ratio statistics and associated probabilities for month, state of tide, mudflat, state of tide*mudflat and year in generalized linear models describing densities of feeding Redshank at Cardiff Bay from 1989/90 to 1998/99 and Rhymney from 1989/90 to 1999/2000........................................................................48 Table 3.4.2 Likelihood ratio statistics and associated probabilities for month, mudflat and year in a generalized linear model describing densities of feeding Redshank at low tide on eight mudflats at Peterstone and St. Brides from 1992/93 to 1999/2000...............49 Table 3.5.5.1 Likelihood ratio statistics and associated probabilities for month, state of tide, mudflat, state of tide*mudflat and year in generalized linear models describing densities of feeding Oystercatcher at Cardiff Bay from 1989/90 to 1998/99 and Orchard Ledges and Rhymney from 1989/90 to 1999/2000................................50 Table 3.5.5.2 Likelihood ratio statistics and associated probabilities for month, mudflat and year in a generalized linear model describing densities of feeding Oystercatcher at low tide on eight mudflats at Peterstone and St. Brides from 1992/93 to 1999/2000........51 Table 3.6.1 Species of wildfowl and wader seen only occasionally on the three all-day sites during 1999/2000 and not included in the separate species accounts.................52
BTO Research Report No. 254 January 2001
3

Page No. Table 7.1.1.1 The furthest distances that Redshank colour-ringed at Cardiff Bay were seen away from the bay in the winter after barrage-closure in relation to their age ...........53 Table 7.1.2.1 The number of Redshank with still active radio-tags that were recorded in Cardiff Bay during periods of temporary drainage.................................................54
BTO Research Report No. 254 January 2001
4

List of Figures Page No. Figure 2.1.1 The Cardiff Bay study site showing mudflat areas counted in autumn 1999, prior to barrage-closure...............................................................................................55 Figure 2.1.2 The Rhymney and Orchard Ledges study sites showing mudflat count areas............56 Figure 2.2.1 The low tide count areas on the northwest Severn......................................................57 Figure 3.1 Mean numbers of Shelduck, Dunlin, Curlew and Redshank recorded roosting and feeding in Cardiff Bay at high tide and low tide in the winter of 1999/2000 following barrage-closure ...........................................................................................58 Figure 3.1.1 Estimates for ‘year’ and the mean number of bird hours per tidal cycle derived from models relating the number of feeding Shelduck at a. Cardiff Bay, b. Orchard Ledges and c. Rhymney to year, month, mudflat and state of tide...........59 Figure 3.1.2 The distribution of feeding Shelduck on the Rhymney and Orchard Ledges all-day sites during winter...........................................................................................60 Figure 3.1.3 The total number of Shelduck present (solid line) and the percentage feeding during each hour of the tidal cycle at a. Orchard Ledges and b. Rhymney during the winter of 1999/2000..............................................................................................61 Figure 3.1.4 The low tide distribution of feeding Shelduck on the northwest Severn during the winter of 1999/2000. .............................................................................................62 Figure 3.1.5 Estimates for ‘year’ in a model relating the densities of feeding Shelduck at low tide at Peterstone and St. Brides to year, month and mudflat ..............................63 Figure 3.2.1 Estimates for ‘year’ and the mean number of bird hours per tidal cycle derived from models relating the number of feeding Dunlin at a. Cardiff Bay b. Orchard Ledges and c. Rhymney to year, month, mudflat and state of tide.............................64 Figure 3.2.2 The distribution of feeding Dunlin on the Rhymney and Orchard Ledges all-day sites during winter.......................................................................................................65 Figure 3.2.3 The total number of Dunlin present and the percentage feeding during each hour of the tidal cycle at a. Orchard Ledges and b. Rhymney during winter 1999/2000 ...66 Figure 3.2.4 The low tide distribution of feeding Dunlin on the northwest Severn during the winter of 1999/2000....................................................................................................67 Figure 3.2.5 Estimates for ‘year’ in a model relating the densities of feeding Dunlin at low tide at Peterstone and St. Brides to year, month and mudflat ..........................68 Figure 3.3.1 Estimates for ‘year’ and the mean number of bird hours per tidal cycle derived from models relating the number of feeding Curlew at a. Cardiff Bay b. Orchard Ledges and c. Rhymney to year, month, mudflat and state of tide.............................69 Figure 3.3.2 The distribution of feeding Curlew on the Rhymney and Orchard Ledges all-day sites during winter...........................................................................................70 Figure 3.3.3 The total number of Curlew present and the percentage feeding during each hour of the tidal cycle at a. Orchard Ledges and b. Rhymney during winter 1999/2000 ...71
BTO Research Report No. 254 January 2001
5

Page No. Figure 3.3.4 The low tide distribution of feeding Curlew on the northwest Severn during the winter of 1999/2000...................................................................................72 Figure 3.3.5 Estimates for ‘year’ in a model relating the densities of feeding Curlew at low tide at Peterstone and St. Brides to year, month and mudflat ..........................73 Figure 3.4.1 Estimates for ‘year’ and the mean number of bird hours per tidal cycle derived from models relating the number of feeding Redshank at a. Cardiff Bay and b. Rhymney to year, month, mudflat and state of tide .........................................74 Figure 3.4.2 The distribution of feeding Redshank on the Rhymney and Orchard Ledges all-day sites during winter...........................................................................................75 Figure 3.4.3 The total number of Redshank present and the percentage feeding during each hour of the tidal cycle at Rhymney during the winter of 1999/2000 ..................................76 Figure 3.4.4 The low tide distribution of feeding Redshank on the northwest Severn during the winter of 1999/2000..............................................................................................77 Figure 3.4.5 Estimates for ‘year’ in a model relating the densities of feeding Redshank at low tide at Peterstone and St. Brides to year, month and mudflat ..........................78 Figure 3.5.5.1 Estimates for ‘year’ and the mean number of bird hours per tidal cycle derived from models relating the number of feeding Oystercatcher at a. Cardiff Bay, b. Orchard Ledges and c. Rhymney to year, month, mudflat and state of tide...............79 Figure 3.5.5.2 Estimates for ‘year’ in a model relating the densities of feeding Oystercatcher at low tide at Peterstone and St. Brides to year, month and mudflat ..........................80 Figure 7.1.1.1 Proportions of colour-ringed individuals in flocks of Redshank in a. October 1999, prior to the closure of the Cardiff Bay barrage, b. November 1999, immediately post-closure and c. December 1999 to February 2000...........................81 Figure 7.1.2.1 The proportion of radio-tagged Redshank recorded at each site diurnally and nocturnally in October 1999, immediately prior to barrage-closure and November 1999, immediately post-closure .........................................................82 Fig 7.1.2.2 Numbers of Redshank originally radio-tagged at Cardiff Bay in October that were recorded in the bay at high and low tide in the fortnight after closure...............83 Figure 7.1.2.3 Radio-locations of Redshank No. 5 in October 1999, immediately prior to barrage-closure............................................................................................................84 Figure 7.1.2.4 Radio-locations of Redshank No. 5 in November 1999, immediately after barrage-closure ...................................................................................................85 Figure 7.1.2.5 Radio-locations of Redshank No. 11 in October 1999, immediately prior to barrage-closure...............................................................................................86 Figure 7.1.2.6 Radio-locations of Redshank No. 11 in November 1999, immediately after barrage-closure ................................................................................................................87
BTO Research Report No. 254 January 2001
6

List of Appendices
Page No. Appendix 1 Wildfowl and wader species recorded on all-day counts at Cardiff Bay between 1989 and 2000. Species highlighted in bold have been recorded in the bay since barrage-closure..................................................................................89 Appendix 2 Sites on the Severn estuary surveyed for colour-ringed Redshank in October 1999, immediately prior to barrage-closure and November 1999 to February 2000, post-closure ...................................................................................90
BTO Research Report No. 254 January 2001
7

BTO Research Report No. 254 January 2001
8
EXECUTIVE SUMMARY 1. This report presents the results of the eleventh year of intensive monitoring of the wildfowl
and waders of Cardiff Bay and adjacent areas. The report concentrates upon results from the winter of 1999/2000, the period immediately after the Cardiff Bay barrage was closed. The programme of monitoring followed that used over the previous 10 years, thus allowing direct comparisons to be made between results from each year.
2. The Cardiff Bay barrage was closed on the morning of 4 November 1999, impounding the bay with seawater. The bay has been drained overnight approximately once every week since in order to maintain water quality, but will be permanently impounded with freshwater in 2001.
3. The numbers of birds using Cardiff Bay in the winter following barrage-closure were greatly reduced. A few individuals of the four key species - Shelduck, Dunlin, Curlew and Redshank - continued to use the bay as a high tide roost site, but no Dunlin or Curlew were recorded at low tide. Only 14 species of wildfowl and wader were recorded at the site following barrage-closure in comparison to an annual median of 23 and a total of 41 in the 10 years before. Only Pochard, Mute Swan and Tufted Duck were recorded in increased numbers.
4. Although numbers of Shelduck and Curlew rose at Orchard Ledges in the winter following barrage-closure, neither increase matched the loss of birds from the bay. Numbers of Shelduck were particularly high on the mudflat immediately adjacent to the bay. Neither species showed any change in number at Rhymney.
5. Numbers of both Dunlin and Redshank had declined on the main study sites in the 10 years prior to barrage-closure. Following closure, Dunlin numbers fell further at Rhymney whilst those of Redshank rose. No substantial changes were apparent in the numbers of the four key species recorded at low tide at Peterstone and St. Brides.
6. Information from colour-ringing and radio-tracking confirmed that the increase in Redshank numbers at Rhymney was due to an influx of birds from Cardiff Bay. In the winter following closure, colour-ringed and radio-tagged Redshank were recorded as far east as the River Usk in Newport and three individuals were seen in Somerset. However, the majority of birds were seen only on the Rhymney estuary and on the area of mudflats by Cardiff Heliport. Radio-tracking had shown that the latter area was formerly used only at night, probably due to disturbance. After closure, however, up to 79 birds were recorded there in the daytime. In spite of the difficulties faced by Redshank following their displacement from the bay, preliminary analysis suggested little evidence of increased mortality in the Cardiff Bay population immediately after closure.
7. Further monitoring at Cardiff over the winter of 2000/2001 will show whether Shelduck, Curlew and Redshank numbers can be maintained at their increased levels at Orchard Ledges and Rhymney. Observations of colour-ringed birds will show whether Redshank from Cardiff Bay continue to use the Heliport area or whether they are able settle elsewhere and will also be used to determine a survival estimate for the year following closure.
BTO Research Report No. 254 January 2001
9

BTO Research Report No. 254 January 2001
10

GENERAL INTRODUCTION This report looks at the distribution and movements of waterbirds (waterfowl and waders) in the winter of 1999/2000 following the closure of the Cardiff Bay barrage. The barrage was closed early on the morning of 4 November 1999, impounding the bay with seawater. The bay has been drained overnight approximately once every week since then in order to maintain water quality, but will be permanently impounded with freshwater in 2001. The report is in two parts. The first describes how the densities and distributions of feeding waterbirds have changed following the closure of the Cardiff Bay barrage and over the preceding 10 years. The second reports the study of the movements and survival of Redshank Tringa totanus following barrage-closure. Previous work has shown that individual Redshank were formerly highly faithful to the bay both within and between winters (Burton 2000a). The results of the previous 10 years of monitoring of the wildfowl and wader populations of Cardiff Bay and nearby areas were reported by Evans et al. (1990), Donald and Clark (1991a), Toomer and Clark (1992a), Toomer et al. (1993, 1994, 1995) and Burton et al. (1997a, 1997b, 1998, 1999). Data from the Wetland Bird Survey (WeBS) are used to show the importance of Cardiff Bay and the Severn Estuary for waterfowl in a British and a European context. Data for Cardiff Bay are given for the winters of 1998/99 and 1999/2000. As information concerning the Severn Estuary was not available for the 1999/2000 winter at the time of writing, its importance will be referred to using data from the 1997/98 winter (Cranswick et al. 1999).
BTO Research Report No. 254 January 2001
11

BTO Research Report No. 254 January 2001
12

PART 1: DISTRIBUTION STUDIES 1 INTRODUCTION The first part of this report describes how the densities and distributions of feeding waterbirds have changed following the closure of the Cardiff Bay barrage. Changes are discussed in the light of long-term trends evident from the 10 years of study prior to barrage-closure, known regional trends in waterbird populations (Austin et al. 2000) and previous studies of habitat loss. Relative annual densities of four key species – Shelduck Tadorna tadorna, Dunlin Calidris alpina, Curlew Numenius arquata and Redshank - are presented graphically for Cardiff Bay and the two neighbouring sites, Orchard Ledges and Rhymney. The report concentrates on the winter period following barrage-closure, i.e. November 1999 to March 2000. Maps indicate the distribution of the four key species on the Orchard Ledges and Rhymney study sites during this period. Distribution maps for the autumn (August to October 1999) immediately prior to barrage-closure and spring (April and May 2000) are not presented in this report.
BTO Research Report No. 254 January 2001
13

BTO Research Report No. 254 January 2001
14

2 METHODS Survey methods used in this year of study were the same as those used in the ten previous years. Two types of counts were carried out: all-day counts and low tide counts. 2.1 All-day Counts All-day counts were carried out at three sites: Cardiff Bay (Figure 2.1.1), Orchard Ledges and Rhymney (Figure 2.1.2). Each site was divided into several mudflat count areas to allow detailed analyses. The Cardiff Bay site was divided into 19 count areas, Orchard Ledges into two count areas and Rhymney into 17 count areas. The boundaries of the count areas were those laid down in the first year of monitoring (Evans et al. 1990). The sizes of the mudflats at Cardiff Bay in the autumn of 1999 were similar to those in the previous year. After the closure of the barrage, Cardiff Bay was counted as one unit (excluding, as before, areas of saltmarsh). Fieldwork was divided into three seasons: autumn (August - October 1999), i.e. pre-barrage closure and winter (November 1999 - March 2000) and spring (April - May 2000) post-closure. With the exception of Cardiff Bay, birds at each site were counted at hourly intervals through two complete tidal cycles per month (with the exception of April, when only a single count took place). Thus each month there were two counts every hour from six hours before to five hours after low tide. Cardiff Bay was surveyed in this way in the autumn, but after barrage-closure was only surveyed at low tide and high tide (i.e. 6 hours before low tide). Feeding and roosting birds were counted separately and any disturbance to count areas or impaired visibility noted. All birds present on the exposed mudflats were counted. Wildfowl feeding on invertebrates or plants in the shallow water offshore were included in the counts for the respective count areas. Wildfowl roosting offshore on open water were excluded, however. Observations on the roosting behaviour of birds in Cardiff Bay have been covered in separate reports (Donald & Clark 1991a, Toomer & Clark 1992a, 1993, 1994). 2.2 Low Tide Counts The distribution and numbers of waterbirds on the wider north-west Severn, east from Cardiff to the mouth of the River Usk, were monitored during winter (November to March) by counts made during the low tide period (i.e. from two hours before to two hours after low tide). As with the all-day counts, this study area was broken down into several smaller count areas (Figure 2.2.1). 2.3 Data Analysis and Presentation of Results The previous ten years of study were reported in Evans et al. (1990), Donald & Clark (1991b), Toomer & Clark (1992b), Toomer et al. (1993, 1994, 1995) and Burton et al. (1997a, 1997b, 1998, 1999). Some figures from the latter report are reproduced here for comparison with this year’s results. Detailed analysis was carried out for four key species: Shelduck, Dunlin, Curlew and Redshank, all of which occurred on the Severn estuary in internationally important numbers during the 11 year study period (Cranswick et al. 1999; Table 2.3.1). For these species, analysis of all-day count data was undertaken to determine how densities of feeding birds at the three sites had changed over the 10 years prior to barrage closure and whether densities at Rhymney and Orchard Ledges increased following the displacement of birds from the bay. Oystercatcher Haematopus ostralegus were also included in these analyses, as, although they do not occur on the Severn estuary in nationally important number, they were numerous in the bay prior to barrage-closure. For each of the three sites, generalized linear models (GLMs: McCullagh & Nelder 1989; SAS Institute Inc. 1996) were used to relate the density of feeding birds on each count
BTO Research Report No. 254 January 2001
15

(birds/ha) to the year, month (August to May), state of tide (hour relative to low water at which the count was undertaken) and the mudflat count area, represented respectively by estimable factors �, �, � and �, and the interaction between state of tide and mudflat, represented by �, i.e. ln(countijkl) = � + �i + �j + �k + �l + �kl Models assumed a Poisson distribution for the number of feeding birds, specified a log link function and treated the natural logarithm of mudflat area (ha) as an offset. Month, state of tide, mudflat and year were treated as class variables. The problem of overdispersion caused by a combination of a large number of zero counts with several very high counts, typical of flocking species, was addressed by the application of a scale factor estimated from the square root of the Pearson’s Chi-squared statistic divided by its degrees of freedom. Only those variables which were significant in explaining the variation in densities were retained in the final models. Two model estimates were calculated for 1999/2000, one for the months prior to barrage-closure, i.e. August to October 1999, and one for the months afterwards, i.e. November 1999 to May 2000. For Rhymney and Orchard Ledges, the estimated values of the model parameters �i indicate the densities of feeding birds each year relative to that for November 1999 to May 2000. For Cardiff Bay, these estimates indicate densities for each year relative to that for August to October 1999. These estimates are plotted in a series of graphs, for each species and site, to enable bird densities to be compared across years. The fitted models were also used to calculate, for each species and site, the average number of feeding ‘bird hours’ per tidal cycle (i.e. the sum of the average number of feeding birds each hour) each winter (i.e. November to March). These figures are plotted on the same graphs as the model estimates so as to understand better how the actual numbers of each species changed over the study period and following barrage-closure. For the four key species, maps are also presented indicating the average number of feeding bird hours on each of the mudflat count areas at the Orchard Ledges and Rhymney sites for the winter of 1999/2000. A comparison map is given for the previous winter - 1998/99 - so as to indicate which areas were important for the species both before and after barrage-closure. In addition, for each species, graphs indicate the average number of birds and the proportion feeding at each hour through the tidal cycle at each of these sites in the winter of 1999/2000. Low tide counts of these five species along the shore of the north-west Severn to the east of Rhymney, i.e. on the eight mudflats of Peterstone and St. Brides (see Figure 2.2.1), were also analysed using GLMs. Models related the densities of feeding birds to the year, month and the mudflat count area, represented respectively by estimable factors �, � and �, i.e. ln(countijl) = � + �i + �j + �l Again, models assumed a Poisson distribution for the number of feeding birds, specified a log link function and treated the natural logarithm of mudflat area (ha) as an offset. Likewise, the problem of overdispersion was again addressed by the application of a scale factor estimated from the square root of the Pearson’s Chi-squared statistic divided by its degrees of freedom. Month, mudflat and year were each treated as class variables and always included in the models. The model parameters �i indicate the densities of feeding birds each winter relative to that for 1999/2000, i.e. after barrage closure. These estimates are plotted in a series of graphs, for each species and site, to enable bird densities to be compared across years. Maps showing the mean number of feeding birds on each of the mudflats along the whole northwest Severn are also shown for each of these species. For other wader and wildfowl species, the main feeding areas are described, any trends in numbers noted and the peak numbers present during the year also given. Those species recorded on the study sites only infrequently or in very small numbers are detailed in a table.
BTO Research Report No. 254 January 2001
16

3 RESULTS Appendix 1 lists all waterfowl and wader species seen at Cardiff Bay during counts from 1989 to 2000 and highlights those that have been recorded in the bay since barrage-closure. An annual mean of 23 species and a total of 41 were seen prior to closure, of which 14 have been recorded since. 3.1 Shelduck Tadorna tadorna Shelduck breed in Britain at many coastal locations, but increasingly, at inland sites (Gibbons et al. 1993). Following breeding, most adult Shelduck move to moulting grounds on the German Wadden Sea and start to return to their wintering areas from September onwards. There is a small but important moulting population at Bridgewater Bay on the south side of the Severn. The British wintering population has remained relatively steady in recent winters and was estimated at 74,000 in 1997/98 (Cranswick et al. 1999). The Severn Estuary is of international importance for Shelduck in winter. Figure 3.1 shows that in the winter of 1999/2000, post-closure, only a few Shelduck used Cardiff Bay. Averages of just 12.0 and 3.4 occurred at high tide and low tide respectively. In previous winters, an average of 150-200 used the bay during the exposure period (Burton et al. 1999). Densities of feeding Shelduck in Cardiff Bay prior to closure were significantly related to all factors considered in the GLM (Table 3.1.1). Annual estimates given by this model are shown in Figure 3.1.1a. Treating year as a continuous (rather than a class) variable in the model showed that there had been no significant long-term change in the densities of feeding Shelduck at Cardiff Bay over the 10 years prior to barrage closure (F1,31833 = 0.00, ns). Densities at Orchard Ledges were significantly related to year, month, state of tide and mudflat (Table 3.1.1). Figure 3.1.1b indicates that densities at this site in the winter of 1999/2000 were slightly higher than those in the 1998/1999 winter (F1,1740 = 6.666, P < 0.01) and were also higher than densities in the preceding two. This was primarily due to an increase in birds feeding on the mudflat immediately adjacent to Cardiff Bay (Figure 3.1.2). A peak mean of 18.5 Shelduck was recorded at Orchard Ledges an hour after low tide in 1999/2000 (Figure 3.1.3a). Treating year as a continuous variable in the model showed that densities of feeding Shelduck at Orchard Ledges had significantly decreased over the 10 years prior to barrage closure (F1,1569 = 44.12, P < 0.0001). At Rhymney, densities of feeding Shelduck were significantly related to all factors considered in the GLM (Table 3.1.1). Densities found at Rhymney in the winter of 1999/2000 post-closure were similar to those found in the preceding autumn, having controlled for month (F1,23955 = 0.059, ns) and those in the previous winter (F1,23955 = 2.718, ns) (Figure 3.1.1c). As in the previous winter, Shelduck were most numerous on mudflats to the east of the Rhymney river (Figure 3.1.2). A peak mean of 644 Shelduck was recorded at Rhymney in the winter of 1999/2000 (Figure 3.1.3b). In contrast to the situation at the other sites, treating year as a continuous variable indicated that densities of feeding Shelduck had significantly increased at Rhymney over the 10 years prior to barrage closure (F1,21702 = 4.74, P < 0.05). Overall, therefore, the loss of birds from Cardiff Bay was not matched by an increase at the Orchard Ledges and Rhymney sites. There was a mean of 1022 bird hours per tidal cycle in the bay in the winter of 1998/99, but an increase of only 12 bird hours at Orchard Ledges in the winter of 1999/2000 and a decrease of 349 at Rhymney (Figures 3.1.1a-c). Feeding Shelduck were found on all but one of the eight low tide count sections to the east of Rhymney in the winter of 1999/2000 (Figure 3.1.4). Densities of feeding birds in this area were significantly related to mudflat, year and month (Table 3.1.2). No significant difference was apparent between the densities found in 1999/2000 and those in the previous winter, however (Figure 3.1.5).
BTO Research Report No. 254 January 2001
17

3.2 Dunlin Calidris alpina Almost 10,000 pairs of Dunlin breed in Britain (Reed 1985, Stone et al.1997), mainly in the flows of northern Scotland and on peaty bogs in the English and Scottish uplands (Stroud et al. 1987). In winter, these birds move south to Africa, whilst others that have bred in Scandinavia and Siberia, migrate to Britain. A total of 462,000 Dunlin wintered in Britain in 1997/98 (Cranswick et al. 1999). The Severn Estuary holds internationally important numbers of Dunlin during the winter. No Dunlin were recorded in Cardiff Bay at low tide in the winter after barrage-closure and there was a mean of only 2.6 at high tide (Figure 3.1). In the previous winter 150-170 Dunlin occurred in the bay on the ebb and flood tides (Burton et al. 1999). Densities of feeding Dunlin in the bay prior to closure were significantly related to year, month, mudflat and state of tide (Table 3.2.1). The model did not converge if the interaction between the latter two terms was included. Annual estimates are given in Figure 3.2.1a and as this shows there was a significant decline in feeding densities in the 10 years prior to barrage-closure (F1,31484 = 238.99, P < 0.0001). Densities of feeding Dunlin at Orchard Ledges were also related to year, month, mudflat and state of tide, but not the interaction between the latter two variables (Table 3.2.1). Figure 3.2.1b shows that the densities of feeding Dunlin recorded at this site in the winter of 1999/2000 were similar to those found in the preceding winter (F1,1610 = 1.406, ns). A peak mean of 34 Dunlin was recorded at Orchard Ledges at low tide (Figure 3.2.3a). Treating year as a continuous (rather than a class) variable in the model showed that there had been a significant decrease in the densities of feeding Dunlin at this site over the 10 years prior to barrage closure (F1,1452 = 57.27, P < 0.0001). At Rhymney, densities of Dunlin were also related to year, month, mudflat and state of tide (Table 3.2.1). The model did not converge if the interaction between the latter two terms was included. Densities found at Rhymney in the winter of 1999/2000 post-closure were similar to those found in the preceding autumn, having controlled for month (F1,20622 = 0.338, ns) but less than those in the previous winter (F1,20622 = 15.553, P < 0.001) (Figure 3.2.1c). Figure 3.2.2 shows this decline and also that Dunlin were most numerous in both winters on mudflats to the east of the Rhymney river. A peak mean of 551 Dunlin was recorded at Rhymney in the winter of 1999/2000 (Figure 3.2.3b). As at the other two sites, treating year as a continuous variable indicated that densities of Dunlin decreased significantly over the 10 years prior to barrage closure (F1,18592 = 30.42, P < 0.0001). The continuing decline in Dunlin numbers meant that it was not possible to discern where birds displaced from the bay settled in the winter of 1999/2000. There was a mean of 454 bird hours per tidal cycle in Cardiff Bay in the winter of 1998/99, but an increase of only 49 bird hours at Orchard Ledges in the winter of 1999/2000 and a decrease of 3314 at Rhymney (Figures 3.2.1a-c). Feeding Dunlin were found on all but one of the eight low tide count sections to the east of Rhymney in the winter of 1999/2000 (Figure 3.2.4). Densities of feeding birds in this area were significantly related to mudflat, year and month (Table 3.2.2). Figure 3.2.5 indicates that densities of Dunlin have also declined in this area, but also that there was no significant difference between the densities found in 1999/2000 and those in the previous winter. 3.3 Curlew Numenius arquata The Curlew characteristically breeds on damp upland moorlands, but this century has colonised many lowland regions, including agricultural habitats (Gibbons et al. 1993). The breeding population of Britain has been estimated at 33,000-38,000 pairs (Reed 1985). Some of this population winters in France, but many other Curlew from continental Europe, notably Scandinavia, migrate to Britain to winter (Prater 1981). A total of 91,000 wintered on the estuaries and shores of Britain in 1997/98, an
BTO Research Report No. 254 January 2001
18

increase on the previous year (Cranswick et al. 1999). The Severn Estuary holds nationally important numbers of Curlew during winter. No Curlew were recorded in Cardiff Bay at low tide in the winter after barrage-closure and there was a mean of only 1.6 at high tide. In the previous winter 60-70 Curlew occurred in the bay on flood tide (Burton et al. 1999). Densities of feeding Curlew in Cardiff Bay prior to closure were significantly related to all factors considered in the GLM (Table 3.3.1). Annual estimates given by this model are shown in Figure 3.3.1a. Treating year as a continuous (rather than a class) variable in the model showed that there had been no significant long-term change in the densities of feeding Curlew at Cardiff Bay over the 10 years prior to barrage closure (F1,34559 = 0.17, ns). Densities of feeding Curlew at Orchard Ledges were related to year, month, mudflat and state of tide, but not the interaction between the latter two variables (Table 3.3.1). Figure 3.3.1b shows that the densities of feeding Curlew recorded at this site in the winter of 1999/2000 were greater than those found in both the preceding autumn (controlling for month; F1,2525 = 5.553, P < 0.05) and previous winter (F1,2525 = 5.039, P < 0.05). A peak mean of 46 Curlew was recorded at Orchard Ledges on the flood tide (Figure 3.3.3a). Treating year as a continuous variable in the model showed that there had been no significant change in the densities of feeding Curlew at this site over the 10 years prior to barrage closure (F1,2271 = 2.28, ns) At Rhymney, densities of Curlew were also related to year, month, mudflat and state of tide, but again not the interaction between the latter two variables (Table 3.3.1). Densities in the winter of 1999/2000 post-closure were similar to those found in the preceding autumn, having controlled for month (F1,26748 = 2.576, ns) and those in the previous winter (F1,26748 = 0.038, ns) (Figure 3.3.1c). Figure 3.3.2 shows that Curlew were most numerous on this site on mudflats adjacent to the Rhymney river and close to Orchard Ledges. A peak mean of 41 Curlew was recorded at Rhymney in the winter of 1999/2000 (Figure 3.3.3b). Treating year as a continuous variable indicated a slight decrease in the densities of Curlew over the 10 years prior to barrage closure (F1,24041 = 6.23, P < 0.05) The change in the number of Curlew at Orchard Ledges only went some way to matching the loss of birds from the bay. There was a mean of 186 bird hours per tidal cycle in the bay in the winter of 1998/99, but an increase of only 38 bird hours at Orchard Ledges in the winter of 1999/2000 and a negligible increase at Rhymney (Figures 3.3.1a-c). Feeding Curlew were found on all but one of the eight low tide count sections to the east of Rhymney in the winter of 1999/2000 (Figure 3.3.4). Densities of feeding birds in this area were significantly related to mudflat, year and month (Table 3.3.2). No significant difference was apparent between the densities found in 1999/2000 and those in the previous winter, however (Figure 3.3.5). 3.4 Redshank Tringa totanus A total of 30,000-34,000 pairs of Redshank were estimated to breed in Britain in the mid-1980s, mainly on wet grasslands and on coastal saltmarshes (Reed 1985; Gibbons et al. 1993; Stone et al. 1997). The British wintering population is formed of birds from both Britain and Iceland (Summers et al. 1988). A total of 84,000 wintered on Britain’s estuaries and shores in 1997/98 (Cranswick et al. 1999). The Severn Estuary is internationally important for Redshank in winter. Only a few Redshank were recorded in Cardiff Bay in the winter of 1999/2000, post-closure (Figure 3.1). Averages of just 2.4 and 2.3 occurred at high tide and low tide respectively. In previous winters, an average of 200-230 used the bay during the exposure period (Burton et al. 1999). Densities of feeding Redshank in Cardiff Bay prior to closure were significantly related to all factors considered in the GLM (Table 3.4.1). Annual estimates given by this model are shown in Figure
BTO Research Report No. 254 January 2001
19

3.4.1a. Treating year as a continuous (rather than a class) variable in the model showed that there had been a highly significant decline in the densities of feeding Redshank at Cardiff Bay over the 10 years prior to barrage closure (F1,32085 = 58.65, P < 0.0001). Only one Redshank was observed at Orchard Ledges in the winter of 1999/2000 and only occasional birds have been seen there previously. At Rhymney, densities of feeding Redshank were related to year, month, mudflat and state of tide, but not the interaction between the latter two variables (Table 3.4.1). Densities in the winter of 1999/2000 post-closure were much higher than those found in the preceding autumn, having controlled for month (F1,20094 = 17.797, P < 0.001) but only slightly greater than those in the previous winter (F1,20094 = 3.353, P < 0.10) (Figure 3.4.1b). Densities were though significantly higher than the average of those in the preceding three winters (F1,20096 = 8.642, P < 0.01). Figure 3.4.2 shows that Redshank were most numerous in the winter of 1999/2000 on mudflats adjacent to the Rhymney river, but that they had also increased on mudflats adjacent to Cardiff Heliport. A peak mean of 250 Redshank was recorded at Rhymney in the winter of 1999/2000 (Figure 3.4.3). Treating year as a continuous variable indicated that, as at Cardiff Bay, there had been a highly significant decline in the densities of feeding Redshank at Rhymney over the 10 years prior to barrage closure (F1,18045 = 134.73, P < 0.0001). The increase in the number of Redshank at Rhymney only went some way to matching the loss of birds from the bay. There was a mean of 1050 bird hours per tidal cycle in the bay in the winter of 1998/99, but an increase of only 341 bird hours at Rhymney in the winter of 1999/2000 (Figures 3.4.1a-b). The increase recorded may have been tempered by a continuing fall in the existing Redshank population at Rhymney. It probably also underestimates the true change in numbers, as the population at Rhymney is itself usually underestimated by the all-day counts and to a greater extent than was the population in the bay. This is because as the tide falls many birds move out of sight into creeks and onto the lower river banks (Figure 3.4.3). It is also probable that, at times, much of the population at Rhymney frequented the upper tidal stretches of the river and thus did not appear on the study site (as defined in Figure 2.1.2). Feeding Redshank were found just three of the eight low tide count sections to the east of Rhymney in the winter of 1999/2000 (Figure 3.4.4). Densities of feeding birds in this area were significantly related to mudflat and year, but not month (Table 3.4.2). No significant difference was apparent between the densities found in 1999/2000 and those in the previous winter (Figure 3.4.5). 3.5 Other Species 3.5.1 Mallard Anas platyrhynchos Mallard continued to use Cardiff Bay after barrage-closure, although in reduced numbers. A peak of 51 was recorded on 27 November, less than half that in the previous winter. Only occasional Mallard were recorded at Orchard Ledges. The peak of 79 at Rhymney in January was similar to that of the previous winter. Further large concentrations were present at low tide at St. Brides. 3.5.2 Teal Anas crecca Teal numbers were much reduced after barrage-closure. Peaks of 20 were recorded in November and January, compared to a peak of 121 the previous winter. Maxima of only two were recorded at Rhymney, although many more used the upper tidal stretches of the Rhymney river and thus did not appear on the study site. Further concentrations were present at low tide at St. Brides.
BTO Research Report No. 254 January 2001
20

3.5.3 Pintail Anas acuta As in previous years no Pintail were recorded either at Cardiff Bay or Orchard Ledges. Numbers at Rhymney were slightly lower than in the previous winter, peaking at 323 on 7 December. Large concentrations also occurred along the shoreline at Peterstone and St. Brides. 3.5.4 Pochard Aythya ferina Pochard numbers have increased at Cardiff Bay over the past three winters and the post-barrage peak of 69 in February was almost 50% greater than that in the winter of 1998/99. Likewise the peak of 216 at Rhymney in November was over 40 greater than that in the last winter. Small numbers were also present on adjacent areas of Peterstone at low tide. 3.5.5 Oystercatcher Haematopus ostralegus Oystercatcher, although not present on the Severn in nationally important numbers, were one of the most numerous species in Cardiff Bay prior to barrage-closure. Figure 3.5.5.1 indicates the results of the modelling of densities at Cardiff Bay, Orchard Ledges and Rhymney. All factors considered in the models were significant in explaining densities (Table 3.5.5.1). Densities at all three sites had increased over the 10 years prior to barrage-closure (Cardiff Bay: F1,31972 = 262.65, P < 0.0001; Orchard Ledges: F1,2265 = 231.04, P < 0.0001; Rhymney: F1,24082 = 82.38, P < 0.0001). Densities at Orchard Ledges post-closure were greater than those found in the preceding autumn, having controlled for month (F1,2519 = 4.670, P < 0.05) but similar to those in the previous winter (F1,2519 = 0.743, ns). Densities at Rhymney were considerably greater than both those in the preceding autumn, again having controlled for month (F1,26806 = 48.856, P < 0.0001) and previous winter (F1,26806 = 27.381, P < 0.0001). No significant difference was apparent between the densities of Oystercatchers found on low tide counts at Peterstone and St. Brides in 1999/2000 and those in the previous winter (Figure 3.5.5.2). 3.5.6 Ringed Plover Charadrius hiaticula No Ringed Plover were recorded in Cardiff Bay after barrage-closure. In the two preceding years, peak numbers over 40 had occurred in the autumn. Numbers at Orchard Ledges and Rhymney were greater than in the previous winter, peaking at 64 and 46 in January and November respectively. Only occasional Ringed Plover were observed at St. Brides, but none were recorded at Peterstone. 3.5.7 Grey Plover Pluvialis squatarola Numbers of Grey Plover have declined sharply on the study sites in recent years and none were recorded either in Cardiff Bay or at Orchard Ledges or Rhymney in the winter of 1999/2000. Occasional large flocks were found at low tide at Peterstone and St. Brides, however, numbers peaking at 88 on 26 January. This figure was less than that for the previous winter. 3.5.8 Lapwing Vanellus vanellus No Lapwing were recorded on the three main study sites in the winter of 1999/2000. In the previous winter, up to 73 were found at Cardiff Bay and 96 at Rhymney. A maximum of 39 was recorded at low tide at Peterstone and St. Brides on 25 January. 3.5.9 Knot Calidris canutus Numbers of Knot too have declined greatly at all sites in recent years and only one individual was recorded at Rhymney in the winter of 1999/2000 and none either Orchard Ledges or Cardiff Bay. A
BTO Research Report No. 254 January 2001
21

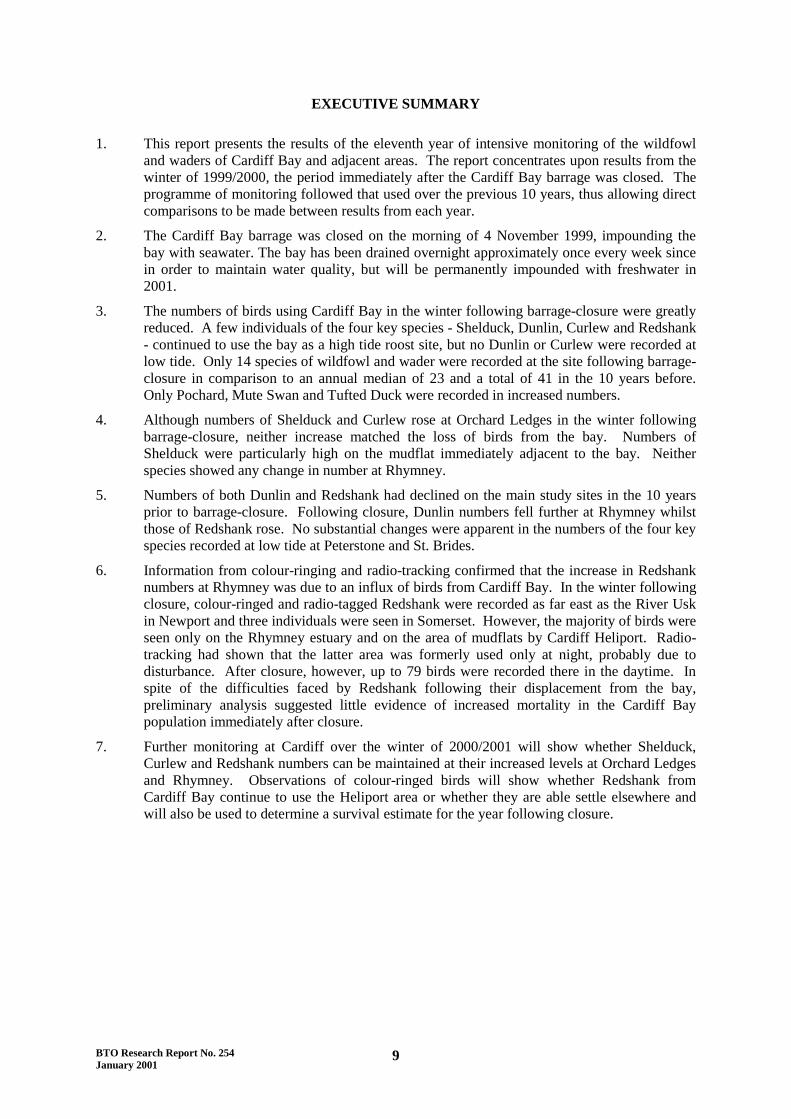
total of 1421 was recorded at low tide at St. Brides and Peterstone on 26 January, but none on any other date. 3.5.10 Turnstone Arenaria interpres Turnstone formerly used Cardiff Bay primarily as a high tide roost site and continued to do so in small numbers post-closure. A peak of 18 was recorded on 12 February, a similar number to that in the previous winter. Peaks of 79 and 4 were recorded at Orchard Ledges and Rhymney respectively, both less than those in 1998/99. No Turnstone were recorded at low tide at St. Brides or Peterstone. 3.6 Occasional Species Several other species of waterbird were observed at Cardiff Bay, Orchard Ledges and Rhymney in 1999/2000 but in numbers too small to be included in the separate species accounts. These are shown in Table 3.6.1. Goosander Mergus merganser continued to use the bay in small numbers post-closure and occasional Whimbrel Numenius phaeopus were also present in the spring. Mute Swan Cygnus olor and Tufted Duck Aythya fuligula, which had only occasionally used the bay prior to closure, were present in small numbers afterwards.
BTO Research Report No. 254 January 2001
22

4. DISCUSSION Only a few species were recorded in Cardiff Bay in the winter following barrage-closure and all but Pochard, Mute Swan and Tufted Duck in much reduced numbers. A few Shelduck, Dunlin, Curlew and Redshank continued to use the bay as a high tide roost site, but no Dunlin or Curlew were recorded at low tide. Schekkerman et al. (1994) similarly reported a decrease in dabbling ducks and waders, but an increase in species that feed on open water in a study looking at the effects of the construction of a storm-surge barrier and two dams in The Netherlands. The increase in Redshank densities at Rhymney in the winter of 1999/2000 followed a long-term decline at this site. With the addition of evidence from colour-ringing and radio-tracking studies (see Part 2), it is clear that this change was primarily due to the influx of birds from Cardiff Bay. The highest densities of Redshank following barrage-closure were noted along the Rhymney river and by Cardiff Heliport, a disturbed site that in past winters was normally used only at night. In a similar study of habitat loss on the Forth estuary, McLusky et al. (1992) also found that Redshank remained faithful to a neighbouring but formerly less favoured area. Further fieldwork at Cardiff over the winter of 2000/2001 will show whether Redshank continue to use the Heliport area or whether they are able settle elsewhere. Dunlin had been in decline at all three sites over the 10 years prior to barrage-closure and densities fell further at Rhymney in the winter of 1999/2000. Austin et al. (2000) reported that numbers of both Dunlin and Redshank have been in decline not just in this area but across south Wales and southwest England. It is possible that warmer winter weather over recent winters has made it less essential for birds to winter on the milder west coast of Britain and as a result fewer first-winter birds have settled in these areas. Alternatively wintering populations may be falling due to declines in breeding populations. Breeding populations of Redshank in the UK, for example, are in decline due to habitat drainage and loss and increased nest predation rates (e.g. Fuller & Jackson 1999, Jackson & Green 2000). If, however, the populations of these species on the northwest Severn have been in decline due to reduced local food resources, there would be limited spare capacity for any birds displaced from Cardiff Bay. In the longer term this could be a particular problem for those Redshank displaced to Rhymney. A study in The Netherlands (Schekkerman et al. 1994), found that waders displaced by coastal engineering works were not able to settle in adjacent intertidal areas as these sites were close to their carrying capacity. This and severe winter weather led to an increase in mortality rates. Oystercatcher densities at Rhymney were greater in the winter following barrage-closure than in the previous year. Although this increase may in part have been due to the displacement of birds from the bay, it may also just have been the continuation of a long-term upward trend. Densities at this (and the other two sites) had increased in the 10 years prior to closure. The causes of these increases are unclear, but suggest either that food supplies have increased or that the local populations were below carrying capacity in previous years. A previous study, which found that an increase in Oystercatcher numbers on part of the Exe was not linked to an increase in food supply, indicated that Oystercatcher populations do sometimes occur below local carrying capacity (Goss-Custard et al. 1998). Densities of both Curlew and Shelduck increased at Orchard Ledges following barrage-closure. Those of Shelduck showed a large increase on the mudflat immediately adjacent to Cardiff Bay and it is reasonable to suppose that this was solely a result of birds being displaced from the bay. Until the full programme of work has been completed, these conclusions should be treated with caution. Future monitoring will enable changes associated with the closure of the barrage to be distinguished from other underlying fluctuations in species’ populations.
BTO Research Report No. 254 January 2001
23

BTO Research Report No. 254 January 2001
24

PART 2: REDSHANK STUDIES 5. INTRODUCTION The impact of habitat loss on local bird populations is largely dependent upon the availability of suitable habitat elsewhere, how close these alternative sites are to their carrying capacity and whether displaced birds are able to learn about the spatial characteristics of the new sites in periods when they are not under food stress (Goss-Custard 1985). The effects may also vary between species due to their site-faithfulness. Wader species, such as Knot, Dunlin and Sanderling Calidris alba, which may regularly move between sites to exploit varying food resources (Evans 1981, Myers 1984, Symonds & Langslow 1986, Symonds et al. 1984, Roberts 1991, Rehfisch et al. 1996), may be less affected by the loss of any one site. However, more site-faithful species, such as Redshank, Turnstone and Purple Sandpiper C. maritima (Metcalfe & Furness 1985, Symonds & Langslow 1986, Symonds et al. 1984, Rehfisch et al. 1996, Burton & Evans 1997, Dierschke 1998) could be at greater risk. A previous study (McLusky et al. 1992) suggested that the effects of habitat loss on a local Redshank population were initially delayed, as birds remained faithful to neighbouring (though formerly less favoured) areas. In the longer term, such a population would be greatly threatened, unless these alternative sites were below their carrying capacity for the species and thus were able to support additional birds. This chapter reports on the movements and survival rates of Redshank following the closure of the Cardiff Bay barrage. Burton (2000a) found that Redshank were previously highly faithful to Cardiff Bay, both within and between winters and concluded that the species was among the most at risk from its loss. Survival rates calculated for two years prior to barrage-closure were similar to those found in a number of previous studies (Jackson 1988; Thompson & Hale 1993; Insley et al. 1997). Survival, however, may vary between years and sites according to weather conditions and predation pressure (Cresswell & Whitfield 1994; Insley et al. 1997). Redshank are known to suffer particularly high mortality in cold winters (Davidson 1982; Davidson & Evans 1982; Clark et al. 1993, Insley & Swann 1996). The results presented, although preliminary, will help to determine whether the loss of the bay has resulted in increased mortality in the Redshank population from Cardiff Bay or whether the displaced birds have been able to successfully settle elsewhere.
BTO Research Report No. 254 January 2001
25

BTO Research Report No. 254 January 2001
26

6. METHODS 6.1 Colour-Ringing Redshank were colour-ringed to study both their movements and survival. Birds were caught by cannon- or mist-netting at high tide roosts at Cardiff Bay and at the Rhymney estuary from November 1994 to October 1999. Each bird was aged according to its plumage characteristics (Prater et al. 1977) as either adult or first-year. The majority of adults caught at Cardiff Bay and those originally metal-ringed at Cardiff Bay and subsequently retrapped at Rhymney were then given unique combinations of Darvic plastic colour-rings for subsequent field identification. On the first colour-ringing scheme used (from November 1994 to February 1995), three colours had to be determined on the left tibia and tarsus for an individual to be identified (two constant scheme colours of yellow over white additionally being placed on the right tibia). In contrast, on the second (used from October 1995), colours only had to be determined on the tibias (the constant scheme colours being placed on the right tarsus). Subsequent analysis revealed that birds of the first scheme were identified less frequently, as rings on the tarsus were often covered with mud or water (Burton 2000b). To avoid any bias, it was decided that these individuals should not be used in survival analyses. 6.2 Radio-tagging The movements of a sample of Redshank before and after barrage-closure were also monitored by radio-tagging. Twenty individuals (19 adults and one first-winter bird) were caught and tagged in catches in Cardiff Bay on 15 and 21 October 1999. Ten additional adults were caught and tagged on the Rhymney estuary on 13 October, so as to determine if their movements would have been affected by any increase in the Redshank population on the estuary following the loss of the bay. Transmitters (model TW-4, Biotrack Ltd, 52 Furzebrook Road, Wareham, Dorset, BH20 5AX) were 2.5 g in weight and were fitted with a small piece of gauze to aid attachment. They were glued to the lower backs of the birds using a cyanoacrylate glue (Loctite� Super Glue), following the methods of Warnock and Warnock (1993). The birds weighed between 125 and 168 g and thus transmitters were between 1.5 and 2.0% of their body mass. The transmitters’ signals could be detected up to 1.5 km away and their batteries had a life expectancy of up to three months. Following the failure of batteries on these tags, a further 10 adult Redshank were fitted with transmitters at the Rhymney estuary between 20 and 24 January 2000. Seven of these birds had originally been caught and ringed at Cardiff Bay, whilst the other three had first been metal-ringed at Rhymney. These birds weighed between 134 and 173 g and transmitters were thus between 1.4 and 1.9% of their body mass. All 40 birds tagged were also individually colour-ringed. 6.3 Data Analysis and Presentation of Results 6.3.1 Movements of Redshank Before and After Barrage-Closure 6.3.1.1 Data from Colour-ringed Birds Both in October 1999 and in the winter after barrage-closure, i.e. November 1999 to February 2000, Cardiff Bay and other parts of the Severn estuary previously known to support wintering Redshank were surveyed for colour-ringed birds. Sites surveyed are listed in Appendix 2; no sites were surveyed on the coast immediately west of Cardiff as the narrow, rocky shore in this area supports few Redshank. Mudflats by the Rhymney river and Cardiff Heliport, both counted as part of the larger Rhymney all-day site, are here treated as separate areas. In addition to details of any colour-ringed birds sighted, the proportions of colour-ringed birds in flocks of Redshank were also recorded. No other studies have colour-ringed Redshank on the Severn estuary and thus those colour-ringed birds seen would either have been from Cardiff or been birds ringed on breeding grounds. Three
BTO Research Report No. 254 January 2001
27

Redshank colour-ringed on breeding grounds in the Outer Hebrides have previously been seen in the Cardiff area in winter (Burton et al. 1999, Jackson 1999). The results of these surveys are shown in three figures which indicate the proportion of colour-ringed birds in flocks of Redshank in October 1999, prior to the closure of the Cardiff Bay barrage, November 1999, immediately post-closure and December 1999 to February 2000. Differences in the proportions of colour-ringed Redshank (p) seen in flocks in different periods were tested for using GLMs, e.g. logit (p) = � + periodi A binomial error distribution was assumed in these models, with a logit link function used to ensure valid proportion estimates in the range (0,1). Differences in the proportions of colour-ringed Redshank seen between periods were tested for using likelihood ratio tests (see Wetherill 1981, pp. 350-353). 6.3.1.2 Data from Radio-tagged Birds Radio-tagged individuals were monitored using a three element hand-held Yagi antenna and either a Mariner 57 receiver or a Titley Electronics Australis 26K Scanning receiver. For those birds tagged in October 1999, data were collected during three periods: 1. 15-31 October, i.e. pre-barrage closure 2. 5-18 November, immediately post-closure 3. 26 November –20 December. During these periods, triangulation was used to record the location of each bird three times, diurnally and nocturnally, each hour from four hours before low tide to four hours after (a total of 27 data points for each bird both day and night). The locations recorded indicate the extent of the areas that the birds used for feeding. In this interim report, data are only presented for the period in October, immediately prior to barrage-closure and that in November immediately post-closure. For these two periods, graphs indicate the proportion of birds tagged at either Cardiff Bay or Rhymney that used different sites, both during the daytime and at night. Data are only presented for those individuals for which 27 points were obtained. Data points for period 2, i.e. immediately post-closure, were only collected once individuals were first recorded away from the bay during daylight hours. The above analyses excluded data collected during ‘drawdowns’, i.e. periods when the bay was temporary drained to maintain water quality. The use of the bay by radio-tagged Redshank was recorded during six such periods between December 1999 and 2000. This analysis used data only from those birds originally ringed in Cardiff Bay (i.e. the 20 caught and tagged there in October 1999 and the seven tagged at Rhymney in January 2000 that had originally been ringed in the bay). Drawdowns were usually timed to occur outside of daylight hours. 6.3.2 Survival Analyses Estimates of survival and return rates of adult Redshank are calculated using mark-recapture methods. Cardiff Bay and other areas used by wintering Redshank were searched extensively for colour-ringed birds (originally caught and ringed in the bay) twice a year, in February and October, from February 1996 to February 2000. Burton (2000a) used a Cormack-Jolly-Seber (CJS) model (Lebreton et al. 1982, Seber 1982) to estimate local winter survival (�wt) (1 October to 31 January) and the over-summer return rate to the study site (�st) (1 February to 30 September, covering migrations from and back to the study area and the breeding season), as well as resighting probabilities (pt) in each survey period ‘t’. Annual survival was calculated as the product of �wt and �st in each of two years (1996/97 and 1997/98). The estimates of winter survival from this study are compared to a preliminary
BTO Research Report No. 254 January 2001
28

estimate for the winter following barrage closure. This estimate is calculated as the proportion of Redshank seen in October 1999 that were again seen alive in February 2000. Without data from subsequent survey periods, it was not possible to calculate a resighting probability for February 2000, i.e. to calculate how many birds may have been missed at this time. This initial estimate is thus likely to underestimate actual survival.
BTO Research Report No. 254 January 2001
29

BTO Research Report No. 254 January 2001
30

7. RESULTS 7.1 Movements of Redshank Before and After Barrage-Closure 7.1.1 Colour-ringing Studies Figure 7.1.1.1 shows the proportions of colour-ringed individuals in flocks of Redshank on the lower Severn estuary in October 1999, prior to barrage-closure, in November 1999, immediately after closure, and over the rest of the winter from December 1999 to February 2000. Prior to closure, a mean of 49% of Redshank at Cardiff Bay were colour-ringed and at Rhymney, a mean of 10%. The comparatively low proportion of marked birds in the population at Rhymney emphasises individuals’ fidelity to the bay - birds were only colour-ringed when caught at Cardiff Bay or if they had been previously metal-ringed there. No Redshank were recorded on the area of mudflats adjacent to Cardiff Heliport during daylight hours during October. No colour-ringed birds were seen to the east of Rhymney and only one individual on the English side of the estuary. After barrage-closure, colour-ringed Redshank were seen as far east as the River Usk at Newport (18 individuals) and as far south as the River Brue in Somerset (1 individual). Only three colour-ringed individuals were seen on the English side of the River Severn (at two sites), two of which were probably colour-ringed at Cardiff on autumn passage to these sites. No colour-ringed birds were seen further up the Severn than the River Usk, in spite of good coverage of this area. The majority of colour-ringed birds were sighted immediately east of Cardiff Bay, at the area of mudflats adjacent to Cardiff Heliport and at the Rhymney estuary. The relatively disturbed area near the Heliport was used both during the day and night after barrage-closure, whereas before it was practically only used nocturnally. Approximately 45% of the Redshank that used this area between November and February were colour-ringed, a similar percentage to that which was recorded in the bay prior to closure (�2 = 0.74, ns). The percentage of colour-ringed birds in flocks of Redshank at Rhymney increased significantly to 21% in the months after barrage-closure (�2 = 28.97, P < 0.001). Colour-ringed Redshank were also recorded post-closure at Sluice House Farm and Peterstone, immediately to the east of Rhymney. There was an inverse relationship between the ages of individually colour-ringed Redshank and the maximum distances that they were recorded away from Cardiff Bay in the winter following closure (Table 7.1.1.1; Jonckheere Test z = 2.12, P = 0.017 – see Siegel & Castellan 1988 for methods). Of 42 individuals of known age (i.e. those that had originally been caught and ringed as first-winter birds), those that only moved as far as the Heliport mudflats were on average the oldest, whilst those that moved as far as Newport were the youngest. Only young birds were recorded at sites more than 4 km away from Cardiff Bay. 7.1.2 Radio-tracking In October 1999, prior to barrage-closure, radio-tagged Redshank showed a high degree of fidelity to the sites where they were caught (Figure 7.1.2.1). Only two of 17 birds (18%) caught at Cardiff Bay were recorded at the Rhymney estuary in the daytime and none anywhere else. At night, individuals were more mobile, with 10 of 13 birds (77%) recorded on the mudflats by Cardiff Heliport and five (46%) at Rhymney. Only two of the eight Redshank radio-tagged at Rhymney were recorded away from that site in the daytime. Three (38%) were recorded by the Heliport and one (13%) in the bay at night. Post-closure, radio-tagged Redshank continued to be recorded in the bay at both high and low tide for at least eight days (Figure 7.1.2.2). Thereafter the bay was primarily used by Redshank as a high tide roost site. During the month post-closure, Cardiff Bay tagged Redshank were recorded between the bay and the River Usk at Newport (Figure 7.1.2.1). Twelve of 17 (71%) were recorded in the bay at least once during the day in November, nine (53%) by Cardiff Heliport, fourteen (82%) at Rhymney,
BTO Research Report No. 254 January 2001
31

one (6%) at Peterstone and five on the River Usk (29%). All these sites were also used at night, with the area by the Heliport being especially favoured. Those Redshank radio-tagged at Rhymney were recorded only there during the day in this period, but also at the Heliport and Peterstone at night – a similar pattern to that recorded prior to closure. Examples of the radio-locations of two Redshank tagged at Cardiff Bay are shown in Figures 7.1.2.3-7.1.2.6. Prior to closure the first, ‘Bird 5’, was recorded primarily in the bay during the daytime and only occasionally at Rhymney. At night this bird was recorded at these two sites and also by Cardiff Heliport (Figure 7.1.2.3). In November, after barrage-closure, this bird was recorded only at Rhymney (Figure 7.1.2.4). The second individual, ‘Bird 11’, was never recorded away from the bay during daylight hours in the period prior to closure, but was found to use the mudflats by the Heliport at night (Figure 7.1.2.5). In the month after closure, this bird was recorded almost exclusively by the Heliport, with only occasional observations at Rhymney and back in the bay in the daytime (Figure 7.1.2.6). The above analyses excluded data collected during ‘drawdowns’, i.e. periods when the bay was temporarily drained to maintain water quality. During six such periods between December 1999 and February 2000, an average of 14% of radio-tagged Redshank was found to use the bay (Table 7.1.2.1). Only those birds originally ringed in Cardiff Bay and with still active tags were included in this analysis. 7.2 Survival Analyses Of 194 individually colour-ringed adult Redshank seen in October 1999, the month immediately prior to barrage-closure, 159 were seen again in February 2000, giving a minimum winter survival estimate of 0.82. This figure underestimates true survival (i.e. �wt), as not all birds alive would have been seen during the February survey period. A better estimate will be obtained after further surveying in October 2000 and February 2001.
BTO Research Report No. 254 January 2001
32

8. DISCUSSION Both colour-ring and radio-tracking data indicated that following barrage-closure the majority of Redshank from Cardiff Bay were displaced to the Rhymney estuary and the mudflats by Cardiff Heliport. As shown earlier, numbers of Redshank in these areas increased in the winter of 1999/2000. The proportion of colour-ringed birds recorded in flocks at Rhymney approximately doubled following barrage-closure. Only occasional Redshank used the mudflats by the Heliport diurnally prior to barrage-closure, but flocks of up to 79 were recorded there afterwards. Approximately 45% of these birds were colour-ringed, a similar percentage to that recorded in the bay prior to closure, and it thus seems probable that most were from the bay. The mudflats by the Heliport are situated by a sewage outfall pipe and are thus likely rich in invertebrates (Pearson & Rosenberg 1978). In spite of this, disturbance from landing helicopters probably previously discouraged Redshank from using the site, at least during the day – the heliport’s usual operating hours are from 0900 to 1700. Previous studies have indicated that helicopters typically cause more disturbance than any other type aircraft (Smit & Visser 1993). Birds did use the site at night, however, when no helicopters took off or landed. In view of this disturbance factor, the mudflats by the Heliport were probably sub-optimal for Redshank. Those that did use the site during the day after barrage-closure included a number of individuals that also continued to use the bay, usually at high tide, but also to feed during ‘drawdowns’. Radio-tracking indicated that some of these birds also roosted at night near the bay at Roath Dock. A previous study (Evans 1978/79) found that, following the loss of an area of intertidal mudflats, Redshank were forced to use supratidal feeding areas over high tide in order to meet their daily food requirements. In the present study, some Redshank did feed at high tide in peripheral areas of Cardiff Bay, but the mild winter weather probably reduced the need for this. The birds that were found by the Heliport were on average older than those that moved further away and perhaps therefore had developed a higher degree of fidelity to the bay. Younger birds were probably less attached to the site and may also have been forced to move further by competition. The increased densities found at Rhymney, in particular, may have forced some birds to move on to Peterstone and the River Usk at Newport. Those that moved as far as Newport included two of three first-winter birds. Only three colour-ringed individuals were seen on the English side of the River Severn, two of which were probably colour-ringed at Cardiff on autumn passage to these sites. The third individual, which had been seen in Cardiff Bay in October 1999, was present on the River Axe in Somerset in November and December and was then seen at Rhymney from January 2000. This individual had previously been reported as a breeding bird on the Somerset Levels in April 1996. Another individual, which was seen in the bay several times before barrage-closure, but not at all in the winter afterwards, may also have wintered in Somerset as it was reported to have been breeding there this spring. In spite of the difficulties faced by Redshank following their displacement from the bay, preliminary analysis suggests little evidence of increased mortality in the ‘Cardiff Bay’ population. A minimum survival estimate of 0.82 was provisionally calculated for adult Redshank for the winter of 1999/2000, although as noted earlier this figure underestimates true survival, as not all birds alive would have been seen in the February survey period. Burton (2000a) reported survival rates for Redshank of 0.91 and 1.00 over two previous winters at Cardiff and it is possible that further surveying in October 2000 and February 2001 will indicate a similar survival rate for 1999/2000. That study indicated that between 0.64 and 0.91 of colour-ringed birds were seen in the survey periods. Survival over the winter of 1999/2000 following barrage-closure was probably aided by the relatively mild winter weather.
BTO Research Report No. 254 January 2001
33

Further survey work in the 2000/2001 winter will also enable an annual survival rate to be calculated for the post-closure period from October 1999 to September 2000. Burton (2000a) reported annual survival rates of 0.81 and 0.83 for adult Redshank at Cardiff. Similar rates have been reported in several other previous studies (Boyd 1962, Großkopf 1959, 1964, Jackson 1988, Thompson & Hale 1993, Insley et al. 1997). Future work will also establish whether the displaced Redshank continue to use the mudflats by the Heliport during the day, or whether they slowly move to other more traditional Redshank sites on the Severn.
BTO Research Report No. 254 January 2001
34

Acknowledgements Thanks are due to Steve Dodd, Graham Couchman, Peter Ferns and other members of local ringing groups for their help in the catching, ringing and colour-marking of waders. Paul Bowerman, Dave Chown, Rupert Higgins, Chris Jones, John Martin, Andrew Middleton, Geoff Moyser, Brian Slade, Nick Wall and John Wilson all provided information on the distribution of colour-ringed Redshank on the Severn estuary. The discussion of parts of this project with other members of the BTO staff was of considerable value. Heidi Mellan and Nicki Read helped to finalise the report and Sophie Foulger helped with the project administration. Data from the Wetland Bird Survey (WeBS) were used to show the importance of Cardiff Bay and the Severn Estuary for waterfowl in a British and a European context. WeBS is a partnership between the BTO, the Wildfowl and Wetlands Trust, the Royal Society for the Protection of Birds and the Joint Nature Conservation Committee (the latter on behalf of English Nature, Scottish Natural Heritage, the Countryside Council for Wales and the Environment and Heritage Service in Northern Ireland). The continuing study of the waterbirds of Cardiff Bay was funded until March 2000 by Cardiff Bay Development Corporation and from April 2000 by The County Council of the City and county of Cardiff.
BTO Research Report No. 254 January 2001
35

BTO Research Report No. 254 January 2001
36

References Austin, G.E., Peachel, I. & Rehfisch, M.M. (2000) Regional trends in coastal wintering waders in Britain. Bird Study, 47, 352-371. Boyd, H. (1962) Mortality and fertility of European Charadrii. Ibis, 104, 368-387. Burton, N.H.K. (2000a) Winter site-fidelity and survival of Redshank Tringa totanus at Cardiff, south Wales. Bird Study, 47, 102-112. Burton, N.H.K. (2000b) Variation in sighting frequencies of colour-ringed Redshanks Tringa totanus according to ringing scheme and ring colour. Wader Study Group Bulletin, 91, 21-24. Burton, N.H.K. & Evans, P.R. (1997) Survival and winter site-fidelity of Turnstones Arenaria interpres and Purple Sandpipers Calidris maritima in north-east England. Bird Study, 44, 35-44. Burton, N.H.K., Toomer, D.K., Balmer, D.E., Rehfisch, M.M. & Clark, N.A. (1997a) The Effect of the Cardiff Bay Barrage on Waterfowl Populations: 7. Distribution and Movement Studies, August 1995 - May 1996. BTO Research Report No. 174 to Cardiff Bay Development Corporation. Burton, N.H.K., Armitage, M.J.S, Rehfisch, M.M. & Clark, N.A. (1997b) The Effect of the Cardiff Bay Barrage on Waterfowl Populations: 8. Distribution and Movement Studies, August 1996 - May 1997. BTO Research Report No. 183 to Cardiff Bay Development Corporation. Burton, N.H.K., Rehfisch, M.M. & Clark, N.A. (1998) The Effect of the Cardiff Bay Barrage on Waterfowl Populations: 9. Distribution and Movement Studies, August 1997 - May 1998. BTO Research Report No. 205 to Cardiff Bay Development Corporation. Burton, N.H.K., Rehfisch, M.M. & Clark, N.A. (1999) The Effect of the Cardiff Bay Barrage on Waterfowl Populations: 10. Distribution and Movement Studies, August 1998 - May 1999. BTO Research Report No. 233 to Cardiff Bay Development Corporation. Clark, J.A., Baillie, S.R., Clark, N.A. & Langston, R.H.W. (1993) Estuary Wader Capacity following Severe Weather Mortality. BTO Report No. 103 to the Department of Trade and Industry’s Renewable Energy Research and Development Programme (ETSU TID 4113). Cranswick, P.A., Pollitt, M.S., Musgrove, A.J. & Hughes, R.C. (1999) The Wetland Bird Survey 1997-1998: Wildfowl and Wader Counts. BTO/WWT/RSPB/JNCC, Slimbridge. Cresswell, W. & Whitfield, DP (1994) The effects of raptor predation on wintering wader populations at the Tyninghame estuary, southeast Scotland. Ibis, 136, 223-232. Davidson, N.C. (1982) Changes in the body condition of Redshanks during mild winters: an inability to regulate reserves? Ringing & Migration, 4, 51-63. Davidson, N.C. & Evans, P.R. (1982) Mortality of Redshank and Oystercatcher from starvation during severe weather. Bird Study, 29, 183-188. Dierschke, V. (1998) Site fidelity and survival of Purple Sandpipers Calidris maritima at Helgoland (SE North Sea). Ringing & Migration, 19, 41-48. Donald, P.F., & Clark, N.A. (1991a) The Roosting Behaviour of Waders and Wildfowl in Cardiff Bay. BTO Research Report No. 74 to Cardiff Bay Development Corporation.
BTO Research Report No. 254 January 2001
37

Donald, P.F., & Clark, N.A. (1991b) The Effect of the Cardiff Bay Barrage on Waterfowl Populations: 2. Distribution and Movement Studies, August 1990 - May 1991. BTO Research Report No. 83 to Cardiff Bay Development Corporation. Evans, J., Clark, N.A., & Donald, P.F. (1990) The Effect of the Cardiff Bay Barrage on Waterfowl Populations: 1. Distribution and Movement Studies, November 1989 - May 1990. BTO Research Report No. 69 to Cardiff Bay Development Corporation. Evans, P.R. (1978/79) Reclamation of intertidal land: some effects on Shelduck and wader populations in the Tees estuary. Vern. Orn. Ges. Bayern, 23, 147-168. Evans, P.R. (1981) Migration and dispersal of shorebirds as a survival strategy. In: Feeding and Survival Strategies of Estuarine Organisms (eds. N.V. Jones & W.J. Wolff), pp. 275-290. Plenum Press, New York. Fuller, R.J. & Jackson, D.B. (1999) Changes in populations of breeding waders on the machair of North Uist, Scotland, 1983-1998. Wader Study Group Bulletin, 90, 47-55 Gibbons, D.W., Reid, J.B. and Chapman, R.A. (1993) The New Atlas of Breeding Birds in Britain and Ireland: 1988-1991. T & AD Poyser, London. Goss-Custard, J.D. (1985) Foraging behaviour of wading birds and the carrying capacity of estuaries. In: Behavioural Ecology: Ecological Consequences of Adaptive Behaviour (eds. R.M. Sibly & R.H. Smith). Blackwell Scientific Publications, Oxford. Goss-Custard, J.D., Ross, J., McGrorty, S., Durell, S.E.A. le V. dit, Caldow, R.W.G. & West, A.D. (1998) Locally stable wintering numbers in the Oystercatcher Haematopus ostralegus where carrying capacity has not been reached. Ibis, 140, 104-112. Großkopf, G. (1959) Zur biologie des Rotschenkels (Tringa t. totanus) II. J. Orn., 100, 210-236. Großkopf, G. (1964) Sterblichkeit und durchschnittsalter einiger küstenvögel. J. Orn., 105, 427-449. Insley, H., Peach, W., Swann, B. & Etheridge, B. (1997) Survival rates of Redshank Tringa totanus wintering on the Moray Firth. Bird Study, 44, 277-289. Insley, H. & Swann, R. (1996) Moray Firth Redshank crash as Dunlin survive the cold spell. BTO News, 203, 8. Jackson, D.B. (1988) Habitat selection and breeding ecology of three species of waders in the Western Isles of Scotland. Unpubl. DPhil. thesis, University of Durham. Jackson, D. (1999) The winter range of Redshank breeding in the Outer Hebrides. Outer Hebrides Bird Report 1998, 104-106. Jackson, D.B. & Green, R.E. (2000) The importance of the introduced Hedgehog (Erinaceus europaeus) as a predator of the eggs of waders (Charadrii) on machair in South Uist, Scotland. Biological Conservation, 93, 333-348. Lebreton, J-D., Burnham, K.P., Clobert, J. & Anderson, D.R. (1982) Modeling survival and testing biological hypotheses using marked animals: a unified approach with case studies. Ecol. Monogr., 62, 67-118. McCullagh, P. & Nelder, J.A. (1989) Generalized Linear Models. Second edition. Chapman & Hall, London.
BTO Research Report No. 254 January 2001
38

McLusky, D.S., Bryant, D.M. & Elliott, M. (1992) The impact of land-claim on macrobenthos, fish and shorebirds on the Forth Estuary, eastern Scotland. Aquatic Cons.: Marine & Freshwater Ecosystems, 2, 211-222. Metcalfe, N.B. & Furness, R.W. (1985) Survival, winter population stability and site fidelity of the Turnstone Arenaria interpres. Bird Study, 32, 207-214. Myers, J.P. (1984) Spacing behaviour of non-breeding shorebirds. In: Behaviour of Marine Animals, Vol. 6: Shorebirds: Migration and Foraging Behaviour (eds. J. Burger & B.L. Olla), pp. 271-322. Plenum Press, New York. Pearson, T.H. & Rosenberg, R. (1978) Macrobenthic succession in relation to organic enrichment and pollution of the marine environment. Oceanographic Marine Biology Annual Review, 16, 229-311. Pirot, J.Y., Laursen, K., Madsen, J. & Monval, J-Y. (1989) Population estimates of swans, geese, ducks and Eurasian Coot Fulica atra in the Western Palearctic and Sahelian Africa. In: Flyways and Reserve Networks for Water Birds (eds. H. Boyd & J.Y. Pirot). International Waterfowl and Wetlands Research Bureau Special Publication 9, Slimbridge. Prater, A.J. (1981). Estuary Birds of Britain and Ireland. T & AD Poyser, Calton. Prater, A.J., Marchant, J.H. & Vuorinen, J. (1977) Guide to the Identification and Ageing of Holarctic Waders. BTO, Tring. Reed, T. (1985) Estimates of British breeding wader populations. Wader Study Group Bulletin, 45, 11-12. Rehfisch, M.M., Clark, N.A., Langston, R.H.W. & Greenwood, J.J.D. (1996) A guide to the provision of refuges for waders: an analysis of 30 years of ringing data from the Wash, England. J. Appl. Ecol., 33, 673-687. Roberts, G. (1991) Winter movements of Sanderlings Calidris alba between feeding sites. Acta Oecol., 12, 281-294. SAS Institute Inc. (1996) The SAS System for Windows Release 6.12. Cary, NC 27513, U.S.A. Schekkerman, H., Meininger, P.L. & Meire, P.M. (1994) Changes in the waterbird populations of the Oosterschelde (SW Netherlands) as a result of large-scale coastal engineering works. Hydrobiologia, 282/283, 509-524. Seber, G.A.F. (1982) The Estimation of Animal Abundance and Related Parameters. Second edition. MacMillan, New York. Siegel, S. & Castellan Jr., N.J. (1988) Nonparametric Statistics for the Behavioural Sciences. McGraw Hill, New York. Smit, C.J. & Piersma, T. (1989) Numbers, midwinter distribution and migration of wader populations using the East Atlantic flyway. In: Flyways and Reserve Networks for Water Birds (eds. H. Boyd & J.Y. Pirot). International Waterfowl and Wetlands Research Bureau Special Publication 9, Slimbridge. Smit, C.J. & Visser, G.J.M. (1993) Effects of disturbance on shorebirds: a summary of existing knowledge from the Dutch Wadden Sea and Delta area. Wader Study Group Bulletin, 68, 6-19.
BTO Research Report No. 254 January 2001
39

Stone, B.H., Sears, J., Cranswick, P.A., Gregory, R.D., Gibbons, D.W., Rehfisch, M.M., Aebischer, N.J. and Reid, J.B. (1997) Population estimates of birds in Britain and in the United Kingdom. British Birds, 90, 1-22. Stroud, D.A., Reed, T.M., Pienkowski, M.W. & Lindsay, R.A. (1987) Birds, Bogs and Forestry. The Peatlands of Caithness and Sutherland. NCC, Peterborough. Summers, R.W., Nicoll, M., Underhill, L.G., & Petersen, A. (1988) Methods for estimating the proportions of Icelandic and British Redshanks Tringa totanus in mixed populations wintering on British coasts. Bird Study, 35, 169-180. Symonds, F.L. & Langslow, D.R. (1986) The distribution and local movements of shorebirds within the Moray Firth. Proc. Royal Soc. Edin., 91B, 143-168. Symonds, F.L., Langslow, D.R. & Pienkowski, M.W. (1984) Movements of wintering shorebirds within the Firth of Forth: species differences in usage of an intertidal complex. Biological Conservation, 28, 187-215. Thompson, P.S. & Hale, W.G. (1993) Adult survival and numbers in a coastal breeding population of Redshank Tringa totanus in north-west England. Ibis, 135, 61-69. Toomer, D.K., Balmer, D.E., Rehfisch, M.M. & Clark, N.A. (1995) The Effect of the Cardiff Bay Barrage on Waterfowl Populations: 6. Distribution and Movement Studies, August 1994 - May 1995. BTO Research Report No. 161 to Cardiff Bay Development Corporation. Toomer, D.K., Browne, S.J. & Clark, N.A. (1993) The Effect of the Cardiff Bay Barrage on Waterfowl Populations: 4. Distribution and Movement Studies, August 1992 - May 1993. BTO Research Report No. 126 to Cardiff Bay Development Corporation. Toomer, D.K., Browne, S.J. & Clark, N.A. (1994) The Effect of the Cardiff Bay Barrage on Waterfowl Populations: 5. Distribution and Movement Studies, August 1993 - May 1994. BTO Research Report No. 146 to Cardiff Bay Development Corporation. Toomer, D.K., & Clark, N.A. (1992a) The Roosting Behaviour of Waders and Wildfowl in Cardiff Bay. BTO Research Report No. 89 to Cardiff Bay Development Corporation. Toomer, D.K., & Clark, N.A. (1992b) The Effect of the Cardiff Bay Barrage on Waterfowl Populations: 3. Distribution and Movement Studies, September 1991 - May 1992. BTO Research Report No. 104 to Cardiff Bay Development Corporation. Toomer, D.K., & Clark, N.A. (1993) The Roosting Behaviour of Waders and Wildfowl in Cardiff Bay. BTO Research Report No. 116 to Cardiff Bay Development Corporation. Toomer, D.K., & Clark, N.A. (1994) The Roosting Behaviour of Waders and Wildfowl in Cardiff Bay. BTO Research Report No. 137 to Cardiff Bay Development Corporation. Warnock, N. & Warnock, S. (1993) Attachment of radio-transmitters to sandpipers: review and methods. Wader Study Group Bull., 70, 28-30. Wetherill, G.B. (1981) Intermediate Statistical Methods. Chapman & Hall, London.
BTO Research Report No. 254 January 2001
40

Species Level for
International Importance
Level for National
Importance
Importance of Severn Estuary
(winter 1997/98)
Maximum WeBS count at Cardiff Bay
- winter 1998/99
Maximum WeBS count at Cardiff Bay - winter 1999/2000
Shelduck Tadorna tadorna
2500 750 International 177 14
Teal Anas crecca
4000 1400 National 70 12
Mallard Anas platyrhynchos
20000 5000 - 155 37
Pintail Anas acuta
700 280 International 0 0
Pochard Aythya ferina
3500 440 National 33 2
Oystercatcher Haematopus ostralegus
9000 3600 - 60 0
Ringed Plover Charadrius hiaticula
500 290 - 5 0
Grey Plover Pluvialis squatarola
1500 430 National 0 0
Lapwing Vanellus vanellus
20000 20000 National 17 1
Knot Calidris canutus
3500 2900 - 0 0
Dunlin Calidris alpina
14000 5300 International 4500 0
Curlew Numenius arquata
3500 1200 National 137 8
Redshank Tringa totanus
1500 1100 International 352 0
Turnstone Arenaria interpres
700 640 - 48 21
Table 2.3.1 The importance of the Severn Estuary and Cardiff Bay for waterbirds in a British and
international context. A wetland site is considered internationally important for a species if it regularly holds at least 1% of the individuals in a population of that species. Britain’s wildfowl belong to the northwest European population (Pirot et al. 1989), and the waders to the east Atlantic flyway population (Smit & Piersma 1989). A wetland site in Britain is considered nationally important for a species if it regularly holds 1% or more of the estimated British population of that species. The Severn Estuary also holds internationally important numbers of Bewick’s Swan Cygnus columbianus bewickii and nationally important numbers of European White-fronted Goose Anser albifrons albifrons, Wigeon Anas penelope, Gadwall Anas strepera, Shoveler Anas clypeata, Tufted Duck Aythya fuligula and Black-tailed Godwit Limosa limosa (Cranswick et al. 1999). WeBS data for Cardiff Bay are from the winters (November to March) of 1998/99 and 1999/2000.
BTO Research Report No. 254 January 2001
41

Month State of Tide Mudflat State of Tide *
Mudflat Year
Cardiff Bay F8,32624 = 918.4
P < 0.0001 F11,32624 = 10.6
P < 0.0001 F17,32624 = 107.4
P < 0.0001 F171,32624 = 6.7
P < 0.0001 F10,32624 = 27.4
P < 0.0001 Orchard Ledges
F6,1740 = 26.5 P < 0.0001
F6,1740 = 5.1 P < 0.0001
F1,1740 = 4.9 P < 0.05
ns F10,1740 = 9.6 P < 0.0001
Rhymney F8,23955 = 606.1 P < 0.0001
F11,23955 = 4.7 P < 0.0001
F16,23955 = 85.8 P < 0.0001
F114,23955 = 7.7 P < 0.0001
F11,23955 = 32.8 P < 0.0001
Table 3.1.1 Likelihood ratio statistics and associated probabilities for month, state of tide,
mudflat, state of tide*mudflat and year in generalized linear models describing densities of feeding Shelduck at Cardiff Bay from 1989/90 to 1998/99 and Orchard Ledges and Rhymney from 1989/90 to 1999/2000. All models excluded data from August and that for Orchard Ledges data from September and October too, as few birds were present on the study sites at these times.
BTO Research Report No. 254 January 2001
42

Month Mudflat Year
F4,361 = 4.0 P < 0.01
F7,361 = 20.9 P < 0.0001
F7,361 = 2.8 P < 0.01
Table 3.1.2 Likelihood ratio statistics and associated probabilities for month, mudflat and year in
a generalized linear model describing densities of feeding Shelduck at low tide on eight mudflats at Peterstone and St. Brides from 1992/93 to 1999/2000.
BTO Research Report No. 254 January 2001
43

Month State of Tide Mudflat State of Tide *
Mudflat Year
Cardiff Bay F8,32263 = 112.1
P < 0.0001 F11,32263 = 65.2
P < 0.0001 F18,32263 = 35.4
P < 0.0001 - F10,32263 = 51.1
P < 0.0001 Orchard Ledges
F6,1610 = 23.5 P < 0.0001
F6,1610 = 9.2 P < 0.0001
F1,1610 = 155.3 P < 0.0001
ns F10,1610 = 14.2 P < 0.0001
Rhymney F8,20622 = 305.8 P < 0.0001
F11,20622 = 29.7 P < 0.0001
F16,20622 = 143.3 P < 0.0001
- F11,20622 = 68.1 P < 0.0001
Table 3.2.1 Likelihood ratio statistics and associated probabilities for month, state of tide,
mudflat, state of tide*mudflat and year in generalized linear models describing densities of feeding Dunlin at Cardiff Bay from 1989/90 to 1998/99 and Orchard Ledges and Rhymney from 1989/90 to 1999/2000. All models excluded data from August and that for Orchard Ledges data from September and October too, as few birds were present on the study sites at these times.
BTO Research Report No. 254 January 2001
44

Month Mudflat Year
F4,361 = 15.4 P < 0.0001
F7,361 = 16.3 P < 0.0001
F7,361 = 15.3 P < 0.0001
Table 3.2.2 Likelihood ratio statistics and associated probabilities for month, mudflat and year in
a generalized linear model describing densities of feeding Dunlin at low tide on eight mudflats at Peterstone and St. Brides from 1992/93 to 1999/2000.
BTO Research Report No. 254 January 2001
45

Month State of Tide Mudflat State of Tide *
Mudflat Year
Cardiff Bay F9,35750 = 285.8
P < 0.0001 F11,35750 = 7.5 P < 0.0001
F18,35750 = 143.0 P < 0.0001
F170,35750 = 4.5 P < 0.0001
F10,35750 = 31.3 P < 0.0001
Orchard Ledges
F9,2525 = 112.4 P < 0.0001
F6,2525 = 41.3 P < 0.0001
F1,2525 = 87.3 P < 0.0001
ns F11,2525 = 4.4 P < 0.0001
Rhymney F9,26748 = 84.0 P < 0.0001
F11,26748 = 11.4 P < 0.0001
F16,26748 = 152.2 P < 0.0001
ns F11,26748 = 33.1 P < 0.0001
Table 3.3.1 Likelihood ratio statistics and associated probabilities for month, state of tide,
mudflat, state of tide*mudflat and year in generalized linear models describing densities of feeding Curlew at Cardiff Bay from 1989/90 to 1998/99 and Orchard Ledges and Rhymney from 1989/90 to 1999/2000.
BTO Research Report No. 254 January 2001
46

Month Mudflat Year
F4,361 = 3.8 P < 0.01
F7,361 = 35.0 P < 0.0001
F7,361 = 4.0 P < 0.001
Table 3.3.2 Likelihood ratio statistics and associated probabilities for month, mudflat and year in
a generalized linear model describing densities of feeding Curlew at low tide on eight mudflats at Peterstone and St. Brides from 1992/93 to 1999/2000.
BTO Research Report No. 254 January 2001
47

Month State of Tide Mudflat State of Tide *
Mudflat Year
Cardiff Bay F8,33330 = 56.4
P < 0.0001 F11,33330 = 2.8
P < 0.01 F18,33330 = 44.4
P < 0.0001 F179,33330 = 4.6
P < 0.0001 F10,33330 = 10.6
P < 0.0001 Rhymney F8,20094 = 92.9
P < 0.0001 F11,20094 = 5.4 P < 0.0001
F16,20094 = 97.3 P < 0.0001
ns F11,20094 = 24.4 P < 0.0001
Table 3.4.1 Likelihood ratio statistics and associated probabilities for month, state of tide,
mudflat, state of tide*mudflat and year in generalized linear models describing densities of feeding Redshank at Cardiff Bay from 1989/90 to 1998/99 and Rhymney from 1989/90 to 1999/2000. Both models excluded data from May, as few birds were present on the study sites at this time.
BTO Research Report No. 254 January 2001
48

Month Mudflat Year
F4,313 = 1.0
ns F6,313 = 7.5 P < 0.0001
F7,313 = 2.2 P < 0.05
Table 3.4.2 Likelihood ratio statistics and associated probabilities for month, mudflat and year in
a generalized linear model describing densities of feeding Redshank at low tide on eight mudflats at Peterstone and St. Brides from 1992/93 to 1999/2000.
BTO Research Report No. 254 January 2001
49

Month State of Tide Mudflat State of Tide *
Mudflat Year
Cardiff Bay F9,33073 = 36.1
P < 0.0001 F11,33073 = 7.5 P < 0.0001
F18,33073 = 44.7 P < 0.0001
F155,33073 = 5.0 P < 0.0001
F10, 33073 = 62.2 P < 0.0001
Orchard Ledges
F9,2519 = 82.3 P < 0.0001
F6,2519 = 35.9 P < 0.0001
F1,2519 = 73.8 P < 0.0001
F6,2519 = 17.2 P < 0.0001
F11,2519 = 34.1 P < 0.0001
Rhymney F9,26806 = 75.9 P < 0.0001
F11,26806 = 19.5 P < 0.0001
F16,26806 = 67.1 P < 0.0001
F118,26806 = 11.5 P < 0.0001
F11,26806 = 39.6 P < 0.0001
Table 3.5.5.1 Likelihood ratio statistics and associated probabilities for month, state of tide,
mudflat, state of tide*mudflat and year in generalized linear models describing densities of feeding Oystercatcher at Cardiff Bay from 1989/90 to 1998/99 and Orchard Ledges and Rhymney from 1989/90 to 1999/2000.
BTO Research Report No. 254 January 2001
50

Month Mudflat Year
F4,361 = 0.4
ns F7,361 = 28.7 P < 0.0001
F7,361 = 2.3 P < 0.05
Table 3.5.5.2 Likelihood ratio statistics and associated probabilities for month, mudflat and year in
a generalized linear model describing densities of feeding Oystercatcher at low tide on eight mudflats at Peterstone and St. Brides from 1992/93 to 1999/2000.
BTO Research Report No. 254 January 2001
51
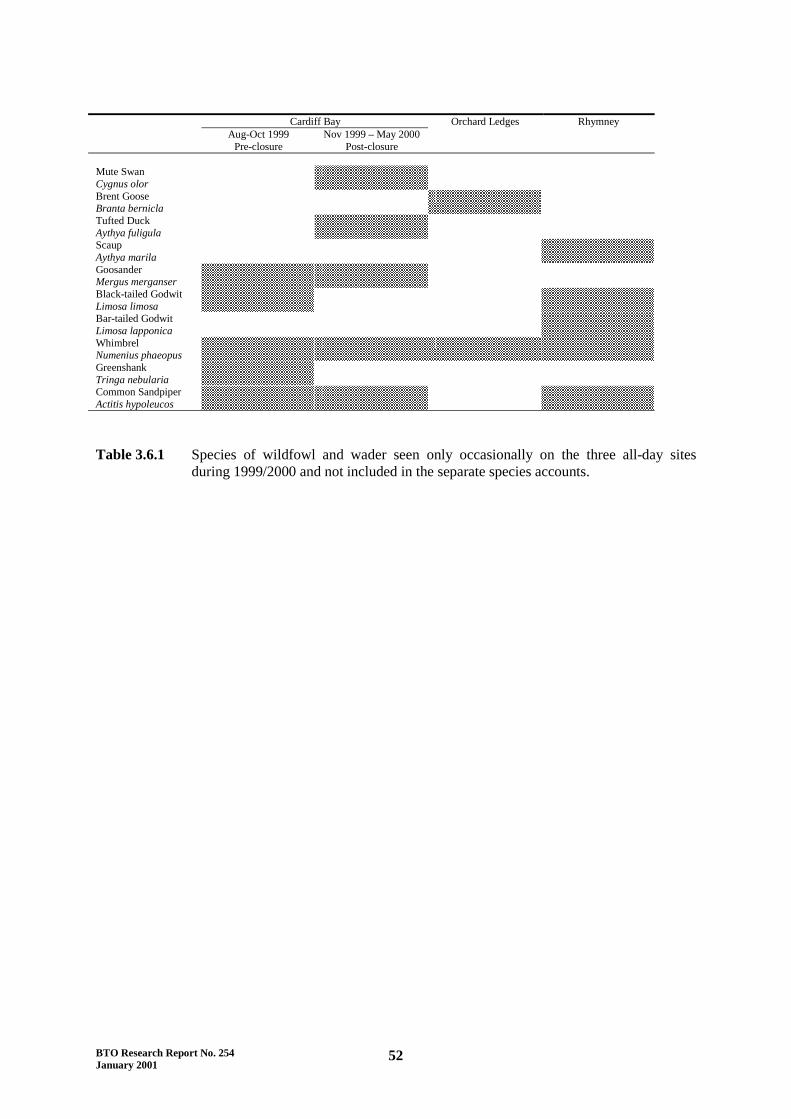
Cardiff Bay Orchard Ledges Rhymney Aug-Oct 1999
Pre-closure Nov 1999 – May 2000
Post-closure
Mute Swan Cygnus olor
Brent Goose Branta bernicla
Tufted Duck Aythya fuligula
Scaup Aythya marila
Goosander Mergus merganser
Black-tailed Godwit Limosa limosa
Bar-tailed Godwit Limosa lapponica
Whimbrel Numenius phaeopus
Greenshank Tringa nebularia
Common Sandpiper Actitis hypoleucos
Table 3.6.1 Species of wildfowl and wader seen only occasionally on the three all-day sites
during 1999/2000 and not included in the separate species accounts.
BTO Research Report No. 254 January 2001
52

Site Distance from
Cardiff Bay (km) Age (years) Mean
Age Median
Age n
1 2 3 4 5 6 7 Heliport 2.5 0 2 1 0 0 0 1 3.50 2.5 4 Rhymney 4 1 22 0 0 3 3 1 2.83 2.0 30 Peterstone 11 0 4 0 0 0 0 0 2.00 2.0 4 Newport 18 2 2 0 0 0 0 0 1.50 1.5 4
Total 3 30 1 0 3 3 2 42 Table 7.1.1.1 The furthest distances that Redshank colour-ringed at Cardiff Bay were seen away
from the bay in the winter after barrage-closure (November 1999 to February 2000) in relation to their age (in winters).
BTO Research Report No. 254 January 2001
53

Date Birds with active Tags Number in bay Percentage in bay 19.12.99 14 8 57.1 12.01.00 8 0 0.0 26.01.00 7 0 0.0 03.02.00 7 2 28.6 10.02.00 7 0 0.0 25.02.00 7 0 0.0 Table 7.1.2.1 The number of Redshank with still active radio-tags that were recorded in Cardiff Bay
during periods of temporary drainage.
BTO Research Report No. 254 January 2001
54

Figure 2.1.1 The Cardiff Bay study site showing mudflat areas counted in autumn 1999, prior to
barrage-closure.
BTO Research Report No 254 January 2001
55

Orchard Ledges
Rhymney
Figure 2.1.2 The Rhymney and Orchard Ledges study sites showing mudflat count areas.
BTO Research Report No 254 January 2001
56

Cardiff Bay
Orchard Ledges
Rhymney
Peterstone
St. B B
TO
Research R
eport No. 254
57
January 2001
Figure 2.2.1 The low tide count areas on the northwest Severn.
rides

BT
O R
esearch Report N
o. 254
58
January 2001
0
2
4
6
8
10
12
14
High Low High Low High Low High Low
Num
ber o
f Bird
s
Shelduck Dunlin Curlew Redshank
Figure 3.1 Mean numbers of Shelduck, Dunlin, Curlew and Redshank recorded roosting (black sections of columns) and feeding
(white sections) in Cardiff Bay at high tide and low tide in the winter of 1999/2000 following barrage-closure.

0
200
400
600
800
1000
1200
1400
1600
1989/90 1991/92 1993/94 1995/96 1997/98 AUT1999
Year
Bird
hou
rs p
er ti
dal c
ycle
0
0.5
1
1.5
2
2.5
3
3.5
Mod
el e
stim
ate
a
0
10
20
30
40
50
60
70
1989/90 1991/92 1993/94 1995/96 1997/98 AUT1999
1999/00
Year
Bird
hou
rs p
er ti
dal c
ycle
-4
-3
-2
-1
0
1
Mod
el e
stim
ate
b
0
1000
2000
3000
4000
5000
6000
1989/90 1991/92 1993/94 1995/96 1997/98 AUT1999
1999/00
Year
Bird
hou
rs p
er ti
dal c
ycle
-1
-0.8
-0.6
-0.4
-0.2
0
0.2
0.4
Mod
el e
stim
ate
c Figure 3.1.1 Estimates for ‘year’ (� 1 SE) and the mean number of bird hours per tidal cycle
derived from models relating the number of feeding Shelduck at a. Cardiff Bay b. Orchard Ledges and c. Rhymney to year, month, mudflat and state of tide. The dotted line indicates the date of barrage-closure; points immediately before and after are estimates for autumn 1999 and for the winter of 1999/2000 together with spring 2000 respectively.
Bto Research Report No. 254 January 2001
59

BT
O R
esearch Report N
o. 254
60
January 2001
a b Figure 3.1.2 The distribution of feeding Shelduck on the Rhymney and Orchard Ledges all-day sites during winter. The average number of bird hours per
tidal cycle is depicted. a = 1998/99; b = 1999/2000. 1-24 25-99 100-249 250-499 500-999 >1000

a
0
5
10
15
20
25
30
35
-6 -5 -4 -3 -2 -1 0 1 2 3 4 5
Hours from Low Tide
Num
ber o
f Bird
s
0
10
20
30
40
50
60
70
80
90
100
Perc
enta
ge F
eedi
ng
b
0
100
200
300
400
500
600
700
800
-6 -5 -4 -3 -2 -1 0 1 2 3 4 5
Hours from Low Tide
Num
ber o
f Bird
s
0
10
20
30
40
50
60
70
80
90
100
Perc
enta
ge F
eedi
ng
Figure 3.1.3 The total number of Shelduck present (solid line) and the percentage feeding (dashed
line) during each hour of the tidal cycle at a. Orchard Ledges and b. Rhymney during the winter of 1999/2000.
BTO Research Report No. 254 January 2001
61

BT
O R
esearch Report N
o. 254
62
January 2001
Figure 3.1.4 The low tide distribution of feeding Shelduck on the northwest Severn during the winter of 1999/2000. 1-9 10-24 25-49 50-99 100-199 >200

BT
O R
esearch Report N
o. 254
63
Januar y 2001
-1
0
1
1992/93 1993/94 1994/95 1995/96 1996/97 1997/98 1998/99 1999/2000
Year
Mod
el E
stim
ate
Figure 3.1.5 Estimates for ‘year’ (� 1 SE) in a model relating the densities of feeding Shelduck at low tide at Peterstone and St. Brides to year, month and
mudflat.

0
1000
2000
3000
4000
5000
6000
7000
8000
1989/90 1991/92 1993/94 1995/96 1997/98 AUT1999
Year
Bird
hou
rs p
er ti
dal c
ycle
-2
-1
0
1
2
3
4
5
6
7
Mod
el e
stim
ate
a
0
200
400
600
800
1000
1200
1989/90 1991/92 1993/94 1995/96 1997/98 AUT1999
1999/00
Year
Bird
hou
rs p
er ti
dal c
ycle
-5
-4
-3
-2
-1
0
1
2
3
4
5
Mod
el e
stim
ate
b
0
5000
10000
15000
20000
25000
30000
35000
40000
1989/90 1991/92 1993/94 1995/96 1997/98 AUT1999
1999/00
Year
Bird
hou
rs p
er ti
dal c
ycle
-4
-3
-2
-1
0
1
2
3
4
Mod
el e
stim
ate
c Figure 3.2.1 Estimates for ‘year’ (� 1 SE) and the mean number of bird hours per tidal cycle
derived from models relating the number of feeding Dunlin at a. Cardiff Bay b. Orchard Ledges and c. Rhymney to year, month, mudflat and state of tide. The dotted line indicates the date of barrage-closure; points immediately before and after are estimates for autumn 1999 and for the winter of 1999/2000 together with spring 2000 respectively.
BTO Research Report No. 254 January 2001
64
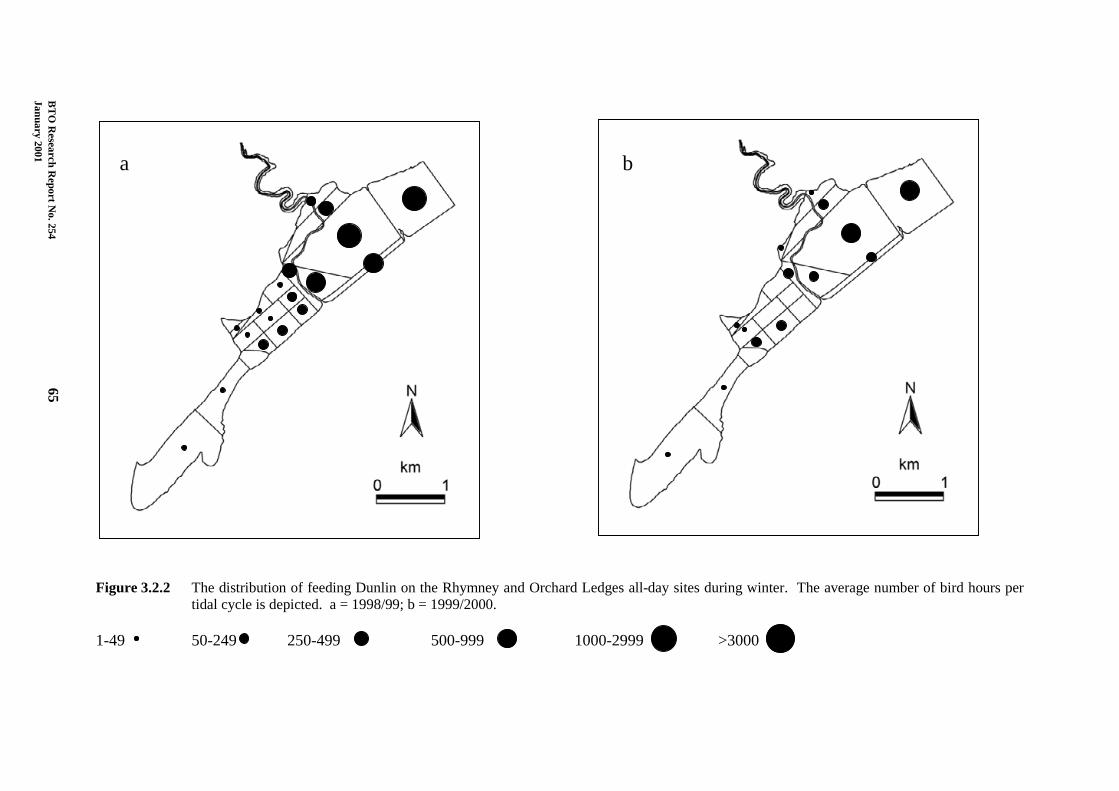
BT
O R
esearch Report N
o. 254
65
January 2001
a b Figure 3.2.2 The distribution of feeding Dunlin on the Rhymney and Orchard Ledges all-day sites during winter. The average number of bird hours per
tidal cycle is depicted. a = 1998/99; b = 1999/2000. 1-49 50-249 250-499 500-999 1000-2999 >3000

a
0
10
20
30
40
50
60
70
-6 -5 -4 -3 -2 -1 0 1 2 3 4 5
Hours from Low Tide
Num
ber o
f Bird
s
0
10
20
30
40
50
60
70
80
90
100
Perc
enta
ge F
eedi
ng
b
0
100
200
300
400
500
600
700
800
900
-6 -5 -4 -3 -2 -1 0 1 2 3 4 5
Hours from Low Tide
Num
ber o
f Bird
s
0
10
20
30
40
50
60
70
80
90
100
Perc
enta
ge F
eedi
ng
Figure 3.2.3 The total number of Dunlin present (solid line) and the percentage feeding (dashed
line) during each hour of the tidal cycle at a. Orchard Ledges and b. Rhymney during the winter of 1999/2000.
BTO Research Report No. 254 January 2001
66

BT
O R
esearch Report N
o. 254
67
Januar y 2001
Figure 3.2.4 The low tide distribution of feeding Dunlin on the northwest Severn during the winter of 1999/2000. 1-9 10-49 50-249 250-749

BT
O R
esearch Report N
o. 254
68
Januar y 2001
-3
0
3
1992/93 1993/94 1994/95 1995/96 1996/97 1997/98 1998/99 1999/2000
Year
Mod
el E
stim
ate
Figure 3.2.5 Estimates for ‘year’ (� 1 SE) in a model relating the densities of feeding Dunlin at low tide at Peterstone and St. Brides to year, month and
mudflat.

0
50
100
150
200
250
300
350
1989/90 1991/92 1993/94 1995/96 1997/98 AUT1999
Year
Bird
hou
rs p
er ti
dal c
ycle
0
0.2
0.4
0.6
0.8
1
1.2
1.4
1.6
Mod
el e
stim
ate
a
0
50
100
150
200
250
300
350
1989/90 1991/92 1993/94 1995/96 1997/98 AUT1999
1999/00
Year
Bird
hou
rs p
er ti
dal c
ycle
-0.8
-0.6
-0.4
-0.2
0
0.2
0.4
0.6
Mod
el e
stim
ate
b
0
100
200
300
400
500
600
1989/90 1991/92 1993/94 1995/96 1997/98 AUT1999
1999/00
Year
Bird
hou
rs p
er ti
dal c
ycle
-0.8
-0.6
-0.4
-0.2
0
0.2
0.4
0.6
0.8
Mod
el e
stim
ate
c Figure 3.3.1 Estimates for ‘year’ (� 1 SE) and the mean number of bird hours per tidal cycle
derived from models relating the number of feeding Curlew at a. Cardiff Bay b. Orchard Ledges and c. Rhymney to year, month, mudflat and state of tide. The dotted line indicates the date of barrage-closure; points immediately before and after are estimates for autumn 1999 and for the winter of 1999/2000 together with spring 2000 respectively.
BTO Research Report No. 254 January 2001
69

BT
O R
esearch Report N
o. 254
70
January 2001
a b Figure 3.3.2 The distribution of feeding Curlew on the Rhymney and Orchard Ledges all-day sites during winter. The average number of bird hours per
tidal cycle is depicted. a = 1998/99; b = 1999/2000. 1-4 5-9 10-24 25-49 50-99 >100

a
0
10
20
30
40
50
60
70
-6 -5 -4 -3 -2 -1 0 1 2 3 4 5
Hours from Low Tide
Num
ber o
f Bird
s
0
10
20
30
40
50
60
70
80
90
100
Perc
enta
ge F
eedi
ng
b
0
10
20
30
40
50
60
-6 -5 -4 -3 -2 -1 0 1 2 3 4 5
Hours from Low Tide
Num
ber o
f Bird
s
0
10
20
30
40
50
60
70
80
90
100
Perc
enta
ge F
eedi
ng
Figure 3.3.3 The total number of Curlew present (solid line) and the percentage feeding (dashed
line) during each hour of the tidal cycle at a. Orchard Ledges and b. Rhymney during the winter of 1999/2000.
BTO Research Report No. 254 January 2001
71

BT
O R
esearch Report N
o. 254
72
January 2001
Figure 3.3.4 The low tide distribution of feeding Curlew on the northwest Severn during the winter of 1999/2000. 1-9 10-24 25-49

-1
0
1
1992/93 1993/94 1994/95 1995/96 1996/97 1997/98 1998/99 1999/2000
Year
Mod
el E
stim
ate
BT
O R
esearch Report N
o. 254
73
Januar y 2001
Figure 3.3.5 Estimates for ‘year’ (� 1 SE) in a model relating the densities of feeding Curlew at low tide at Peterstone and St. Brides to year, month and
mudflat.

a
0
200
400
600
800
1000
1200
1400
1600
1800
2000
1989/90 1991/92 1993/94 1995/96 1997/98 AUT1999
Year
Bird
hou
rs p
er ti
dal c
ycle
-0.7
-0.6
-0.5
-0.4
-0.3
-0.2
-0.1
0
0.1
0.2
0.3
Mod
el e
stim
ate
b
0
500
1000
1500
2000
2500
3000
3500
4000
1989/90 1991/92 1993/94 1995/96 1997/98 AUT1999
1999/00
Year
Bird
hou
rs p
er ti
dal c
ycle
-1.4
-1.2
-1
-0.8
-0.6
-0.4
-0.2
0
0.2
0.4
0.6
0.8
1
Mod
el e
stim
ate
Figure 3.4.1 Estimates for ‘year’ (� 1 SE) and the mean number of bird hours per tidal cycle
derived from models relating the number of feeding Redshank at a. Cardiff Bay and b. Rhymney to year, month, mudflat and state of tide. The dotted line indicates the date of barrage-closure; points immediately before and after are estimates for autumn 1999 and for the winter of 1999/2000 together with spring 2000 respectively.
BTO Research Report No. 254 January 2001
74

BT
O R
esearch Report N
o. 254
75
Januar y 2001
a b Figure 3.4.2 The distribution of feeding Redshank on the Rhymney and Orchard Ledges all-day sites during winter. The average number of bird hours per
tidal cycle is depicted. a = 1998/99; b = 1999/2000. 1-24 25-99 100-249 250-499 500-999 >1000

0
50
100
150
200
250
300
350
-6 -5 -4 -3 -2 -1 0 1 2 3 4 5
Hours from Low Tide
Num
ber o
f Bird
s
0
10
20
30
40
50
60
70
80
90
100
Perc
enta
ge F
eedi
ng
BT
O R
esearch Report N
o. 254
76
Januar y 2001
Figure 3.4.3 The total number of Redshank present (solid line) and the percentage feeding (dashed line) during each hour of the tidal cycle at Rhymney
during the winter of 1999/2000.

BT
O R
esearch Report N
o. 254
77
January 2001
Figure 3.4.4 The low tide distribution of feeding Redshank on the northwest Severn during the winter of 1999/2000. 1-9 10-24 25-49

-10
0
1992/93 1993/94 1994/95 1995/96 1996/97 1997/98 1998/99 1999/2000
Year
Mod
el E
stim
ate
BT
O R
esearch Report N
o. 254
78
Januar y 2001
Figure 3.4.5 Estimates for ‘year’ (� 1 SE) in a model relating the densities of feeding Redshank at low tide at Peterstone and St. Brides to year, month and
mudflat.

0
50
100
150
200
250
300
1989/90 1991/92 1993/94 1995/96 1997/98 AUT1999
Year
Bird
hou
rs p
er ti
dal c
ycle
-1.5
-1
-0.5
0
0.5
1
1.5
Mod
el e
stim
ate
a
0
100
200
300
400
500
600
1989/90 1991/92 1993/94 1995/96 1997/98 AUT1999
1999/00
Year
Bird
hou
rs p
er ti
dal c
ycle
-1.8
-1.6
-1.4
-1.2
-1
-0.8
-0.6
-0.4
-0.2
0
0.2
0.4
Mod
el e
stim
ate
b
0
300
600
900
1200
1500
1800
2100
1989/90 1991/92 1993/94 1995/96 1997/98 AUT1999
1999/00
Year
Bird
hou
rs p
er ti
dal c
ycle
-1.6
-1.4
-1.2
-1
-0.8
-0.6
-0.4
-0.2
0
Mod
el e
stim
ate
c Figure 3.5.5.1 Estimates for ‘year’ (� 1 SE) and the mean number of bird hours per tidal cycle
derived from models relating the number of feeding Oystercatcher at a. Cardiff Bay b. Orchard Ledges and c. Rhymney to year, month, mudflat and state of tide. The dotted line indicates the date of barrage-closure; points immediately before and after are estimates for autumn 1999 and for the winter of 1999/2000 together with spring 2000 respectively.
BTO Research Report No. 254 January 2001
79

-1
0
1
1992/93 1993/94 1994/95 1995/96 1996/97 1997/98 1998/99 1999/2000
Year
Mod
el E
stim
ate
BT
O R
esearch Report N
o. 254
80
January 2001
Figure 3.5.5.2 Estimates for ‘year’ (� 1 SE) in a model relating the densities of feeding Oystercatcher at low tide at Peterstone and St. Brides to year, month
and mudflat.

a cb
BT
O R
esearch Report N
o. 254
81
January 2001
10 birds 100 birds Figure 7.1.1.1 Proportions of colour-ringed individuals in flocks of Redshank in a. October 1999, prior to the closure of the Cardiff Bay barrage, b.
November 1999, immediately post-closure and c. December 1999 to February 2000. Proportions are indicated by the black segments. Circle size reflects the mean size of flocks surveyed. Figures in parentheses indicate the number of individuals identified at a site and the number of surveys undertaken. * - site not surveyed. No colour-ringed Redshank were seen east of the area shown during these periods.

BT
O R
esearch Report N
o. 254
82
January 2001
a c
0.00
0.10
0.20
0.30
0.40
0.50
0.60
0.70
0.80
0.90
1.00
Cardiff Bay Heliport Rhymney Peterstone River Usk
Site
Prop
ortio
n of
Bird
s
0.00
0.10
0.20
0.30
0.40
0.50
0.60
0.70
0.80
0.90
1.00
Cardiff Bay Heliport Rhymney Peterstone River Usk
Site
Prop
ortio
n of
Bird
s
b d
0.00
0.10
0.20
0.30
0.40
0.50
0.60
0.70
0.80
0.90
1.00
Cardiff Bay Heliport Rhymney Peterstone River Usk
Site
Prop
ortio
n of
Bird
s
0.00
0.10
0.20
0.30
0.40
0.50
0.60
0.70
0.80
0.90
1.00
Cardiff Bay Heliport Rhymney Peterstone River Usk
Site
Prop
ortio
n of
Bird
s
Figure 7.1.2.1 The proportion of radio-tagged Redshank recorded at each site diurnally and nocturnally in October 1999, immediately prior to barrage-
closure (black columns) and November 1999, immediately post-closure (white columns). a. Diurnal observations of individuals radio-tagged at Cardiff Bay (nOCT = 17; nNOV = 17). b. Nocturnal observations of individuals radio-tagged at Cardiff Bay (nOCT = 13; nNOV = 12). c. Diurnal observations of individuals radio-tagged at Rhymney (nOCT = 8; nNOV = 8). d. Nocturnal observations of individuals radio-tagged at Rhymney (nOCT = 8; nNOV = 6).

0
2
4
6
8
10
12
14
16
18
4-Nov 5-Nov 6-Nov 7-Nov 8-Nov 9-Nov 10-Nov 11-Nov 12-Nov 13-Nov 14-Nov 15-Nov 16-Nov 17-Nov 18-Nov
Date
Num
ber o
f tag
ged
bird
sHigh TideLow Tide
? ? ? ? ? ? ? ? ? ? ? ? ? ? ?
BT
O R
esearch Report N
o. 254
83
January 2001
Fig 7.1.2.2 Numbers of Redshank originally radio-tagged at Cardiff Bay in October that were recorded in the bay at high and low tide in the fortnight after closure.

Figure 7.1.2.3 Radio-locations of Redshank No. 5 in October 1999, immediately prior to barrage-
closure. Open circles = day-time; closed circles = night-time.
BTO Research Report No. 254 January 2001
84

Figure 7.1.2.4 Radio-locations of Redshank No. 5 in November 1999, immediately after barrage-
closure. Open circles = day-time; closed circles = night-time.
BTO Research Report No. 254 January 2001
85

Figure 7.1.2.5 Radio-locations of Redshank No. 11 in October 1999, immediately prior to barrage-
closure. Open circles = day-time; closed circles = night-time.
BTO Research Report No. 254 January 2001
86

Figure 7.1.2.6 Radio-locations of Redshank No. 11 in November 1999, immediately after barrage-
closure. Open circles = day-time; closed circles = night-time.
BTO Research Report No. 254 January 2001
87

BTO Research Report No. 254 January 2001
88

Mute Swan Cygnus olor Canada Goose Branta canadensis Barnacle Goose Branta leucopsis Dark-bellied Brent Goose Branta bernicla bernicla Shelduck Tadorna tadorna Wigeon Anas penelope Gadwall Anas strepera Teal Anas crecca Mallard Anas platyrhynchos Pintail Anas acuta Shoveler Anas clypeata Pochard Aythya ferina Tufted Duck Aythya fuligula Scaup Aythya marila Eider Somateria mollissima Common Scoter Melanitta nigra Goldeneye Bucephala clangula Red-breasted Merganser Mergus serrator Goosander Mergus merganser Ruddy Duck Oxyura jamaicensis Oystercatcher Haematopus ostralegus Avocet Recurvirostra avosetta Ringed Plover Charadrius hiaticula Golden Plover Pluvialis apricaria Grey Plover Pluvialis squatarola Lapwing Vanellus vanellus Knot Calidris canutus Curlew Sandpiper Calidris ferruginea Dunlin Calidris alpina Ruff Philomachus pugnax Snipe Gallinago gallinago Black-tailed Godwit Limosa limosa Bar-tailed Godwit Limosa lapponica Whimbrel Numenius phaeopus Curlew Numenius arquata Spotted Redshank Tringa erythropus Redshank Tringa totanus Greenshank Tringa nebularia Green Sandpiper Tringa ochropus Common Sandpiper Actitis hypoleucos Turnstone Arenaria interpres Appendix 1 Wildfowl and wader species recorded on all-day counts at Cardiff Bay between 1989
and 2000. Species highlighted in bold have been recorded in the bay since barrage-closure.
BTO Research Report No. 254 January 2001
89

Site National Grid Reference Cardiff Bay, South Glamorgan ST1873 Cardiff Heliport, South Glamorgan ST2175 Rhymney estuary, South Glamorgan ST2277 Sluice House Farm, Gwent ST2578 Peterstone Gout, Gwent ST2780 River Usk, Newport, Gwent ST3285 Goldcliff Pill & Reserve, Gwent ST3682 Nedern flood, Gwent ST4889 River Wye, Chepstow, Gwent/Gloucestershire ST5492 Berkeley Pill, Gloucestershire SO6600 Oldbury, S Gloucestershire ST5992 New Passage / Severn Beach, S Gloucestershire ST5486 River Avon / Portbury Docks ST5078 Clevedon, N Somerset ST3970 River Yeo, N Somerset ST3666 River Banwell, N Somerset ST3566 River Axe, Somerset ST3058 River Brue, Somerset ST3047 River Parrett at Steart, Somerset ST2846 Appendix 2 Sites on the Severn estuary surveyed for colour-ringed Redshank in October 1999,
immediately prior to barrage-closure and November 1999 to February 2000, post-closure.
BTO Research Report No. 254 January 2001
90