energy management and onmental pr conservation programu.s. environmental protection agency energy...
TRANSCRIPT
U.S
. En
viro
nmen
tal P
rote
ctio
n A
genc
y
Energy Management and Conservation Program
Fiscal Year 2006 Annual Report


U.S. Environmental Protection Agency
Energy Management and Conservation Program
Fiscal Year 2006 Annual Report
December 18, 2006
For questions, please contact the Sustainable Facilities Practices Branch at 202/564-6371.
TABLE OF CONTENTS
EXECUTIVE SUMMARY 3
I. ENERGY POLICY 6
II. ENERGY EFFICIENCY PROJECTS AND FACILITY IMPROVEMENTS 11
III. GREEN BUILDINGS – POLICY & PRACTICE 18
IV. EPA REACHES 100 PERCENT GREEN POWER 20
V. WATER CONSERVATION AND MANAGEMENT PLANS 24
VI. STORMWATER MANAGEMENT 26
VII. IMPROVING THE FACILITY DELIVERY PROCESS 26
VIII. POLLUTION PREVENTION 29
IX. MANAGEMENT, ADMINISTRATION, AND EDUCATION 31
2
EXECUTIVE SUMMARY
The Energy Policy Act of 2005 (EPAct 2005) imposed tougher, more rigid energy use reduction goals on all federal agencies. EPAct 2005 also set fiscal year (FY) 2003 as the new baseline year to measure energy conservation progress. In response, the U.S. Environmental Protection Agency (EPA) not only continued its long-term commitment to energy conservation, but also made extraordinary efforts to capture short-term savings within its portfolio of buildings. EPA is pleased to report a significant decline in both energy intensity and emissions associated with its energy use in FY 2006. EPA greatly exceeded EPAct 2005’s FY 2006 energy use reduction goals. This reduction was achieved through a combination of recommissioning, facility upgrades, operations and maintenance improvements, and green power purchases.
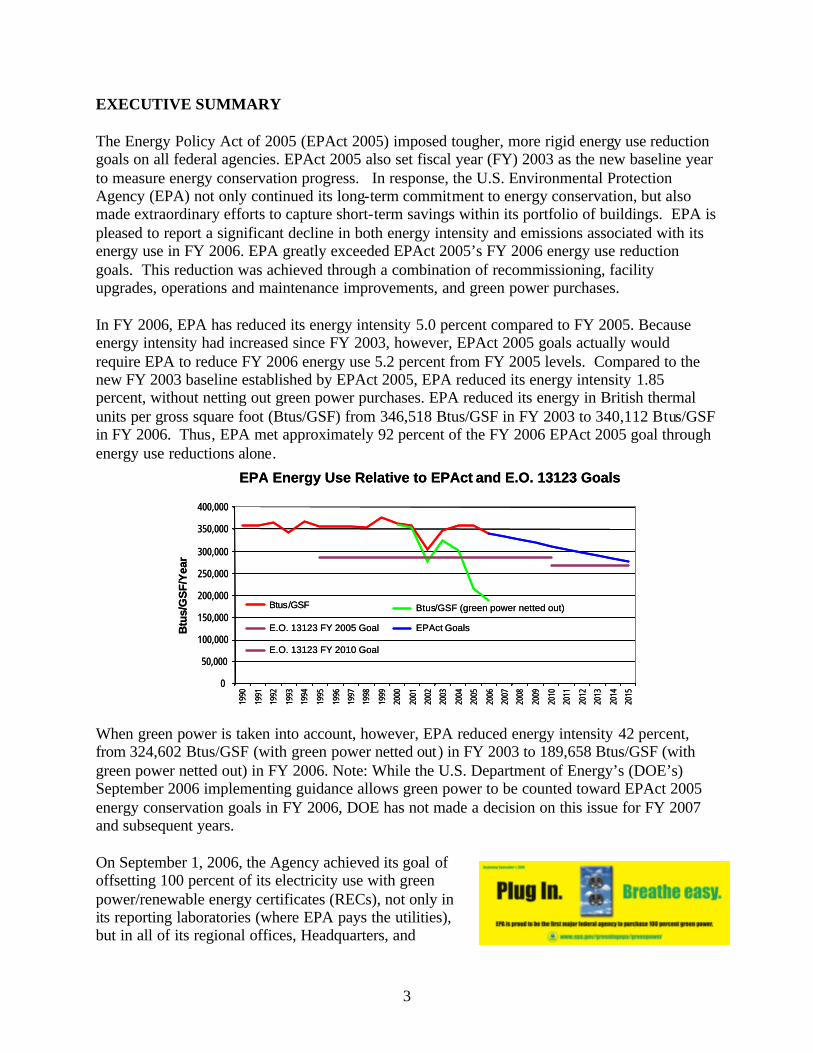
In FY 2006, EPA has reduced its energy intensity 5.0 percent compared to FY 2005. Because energy intensity had increased since FY 2003, however, EPAct 2005 goals actually would require EPA to reduce FY 2006 energy use 5.2 percent from FY 2005 levels. Compared to the new FY 2003 baseline established by EPAct 2005, EPA reduced its energy intensity 1.85 percent, without netting out green power purchases. EPA reduced its energy in British thermal units per gross square foot (Btus/GSF) from 346,518 Btus/GSF in FY 2003 to 340,112 Btus/GSF in FY 2006. Thus, EPA met approximately 92 percent of the FY 2006 EPAct 2005 goal through energy use reductions alone.
EPA Energy Use Relative to EPActEPA Energy Use Relative to and E.O. 13123 GoalsEPAct and E.O. 13123 Goals
0
50,000
100,000
150,000
200,000
250,000
300,000
350,000
400,000
Btu
s/G
SF
/Yea
r
Btus/GSF Btus/GSF (green power netted out)
EPAct GoalsE.O. 13123 FY 2005 Goal
E.O. 13123 FY 2010 Goal
0
50,000
100,000
150,000
200,000
250,000
300,000
350,000
400,000
Btu
s/G
SF
/Yea
r
Btus/GSF Btus/GSF (green power netted out)
EPAct GoalsE.O. 13123 FY 2005 Goal
E.O. 13123 FY 2010 Goal
1990
1990
1991
1991
1992
1992
1993
1993
1994
1994
1995
1995
1996
1996
1997
1997
1998
1998
1999
1999
2000
2000
2001
2001
2002
2002
2003
2003
2004
2004
2005
2005
2006
2006
2007
2007
2008
2008
2009
2009
2010
2010
2011
2011
2012
2012
2013
2013
2014
2014
2015
2015
When green power is taken into account, however, EPA reduced energy intensity 42 percent, from 324,602 Btus/GSF (with green power netted out) in FY 2003 to 189,658 Btus/GSF (with green power netted out) in FY 2006. Note: While the U.S. Department of Energy’s (DOE’s) September 2006 implementing guidance allows green power to be counted toward EPAct 2005 energy conservation goals in FY 2006, DOE has not made a decision on this issue for FY 2007 and subsequent years.
On September 1, 2006, the Agency achieved its goal of offsetting 100 percent of its electricity use with green power/renewable energy certificates (RECs), not only in its reporting laboratories (where EPA pays the utilities), but in all of its regional offices, Headquarters, and
3

satellite buildings as well (where electricity is covered by the U.S. General Services Administration [GSA] or private building owners). This achievement is the result of a seven-year effort to continually increase the number of EPA facilities with green power. EPA was the first federal agency to have a facility meet 100 percent of its electricity needs with green power (the Region 9 laboratory in Richmond, California, starting in 1999), and is the first major federal agency to offset 100 percent of its electricity use with green power/RECs.
Most importantly, EPA continued making progress in reducing energy use at its largest facility, the New Main building in Research Triangle Park (RTP), North Carolina. This facility represents more than 28 percent of EPA’s laboratory space. It came online in FY 2003, and its energy performance has never achieved the levels projected in design estimates. Significant strides were made in FY 2006, including the completion of laboratory recommissioning, vivarium recommissioning, replacement of the building’s humidification systems (with heat recovery in the vivarium wing), stabilization and improvement of the building control system, installation of a Web-based utility metering system, replacement of cooling coils, and other projects. This work produced a 3.6 percent reduction in energy use in FY 2006 and a total 10.3 percent reduction in energy use at this facility from FY 2004, when implementation of these recommissioning and energy projects started.
Four other large EPA laboratories achieved significant energy use reductions in FY 2006:
• The Human Studies laboratory in Chapel Hill, North Carolina, reduced its energy use by 12.5 percent, primarily by adding operations and maintenance (O&M) staff and improving facility maintenance.
• EPA’s Research Toxicology Facility in RTP also showed a 6.2 percent reduction based on a resetting of laboratory air flow levels to Agency standards (they had been operating at higher flows) and replacement of the building cooling towers.
• The Fort Meade, Maryland, Environmental Science Center also reduced energy use by 13 percent in FY 2006 as a result of attentive facility management by the facility manager and other measures.
• EPA’s National Vehicle Fuel Emissions Laboratory (NVFEL) in Ann Arbor, Michigan, achieved a remarkable 24 percent reduction, again through the efforts of the laboratory’s facility manager, partnering with its energy savings performance contractor. This team took advantage of energy savings opportunities not addressed in the laboratory’s original Energy Savings Performance Contract or created as NVFEL added new facilities and changed research operations.
EPA also required all reporting facilities to complete and report back on a group of Top 10 O&M practices, to capture short-term energy savings available throughout the portfolio.
Because of groundwork on major projects laid in previous years, an extra effort to capture short-term savings, individual initiatives, and good teamwork, EPA realized an unusually large energy reduction in FY 2006, ending the year 5.0 percent lower than FY 2005, when energy intensity
4
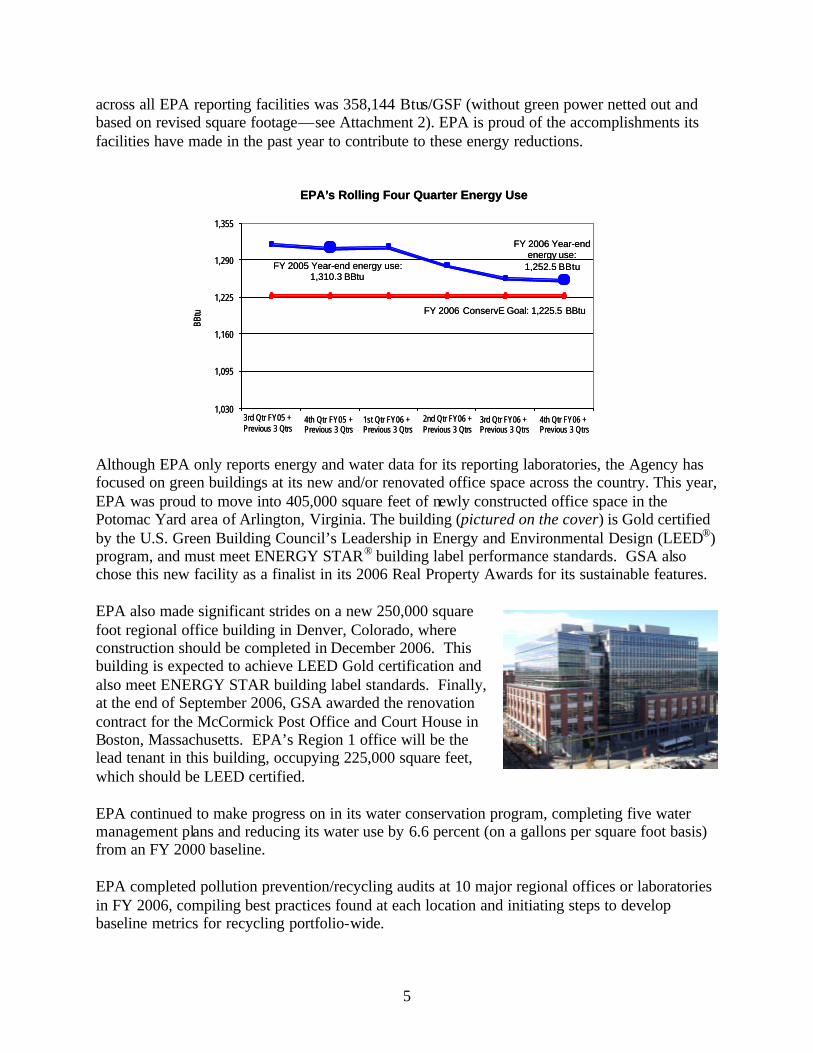
across all EPA reporting facilities was 358,144 Btus/GSF (without green power netted out and based on revised square footage—see Attachment 2). EPA is proud of the accomplishments its facilities have made in the past year to contribute to these energy reductions.
EPA’EPA s Rolling Four Quarter Energy Use’s Rolling Four Quarter Energy Use
1,1601,160
1,0951,095
1,0301,0303rd Qtr FY05 + Previous 3 Qtrs
4th Qtr FY05 + 1st Qtr FY06 + 2nd Qtr FY06 + 3rd Qtr FY06 + 4th Qtr FY06 +
FY 2006 ConservE Goal: 1,225.5 BBtu
FY 2005 Year-end energy use: 1,310.3 BBtu
FY 2006 Year-end energy use:
1,252.5 BBtu
3rd Qtr FY05 + Previous 3 Qtrs
4th Qtr FY05 + 1st Qtr FY06 + 2nd Qtr FY06 + 3rd Qtr FY06 + 4th Qtr FY06 +
FY 2006 ConservE Goal: 1,225.5 BBtu
FY 2005 Year-end energy use: 1,310.3 BBtu
FY 2006 Year-end energy use:
1,252.5 BBtu
Previous 3 Qtrs Previous 3 Qtrs Previous 3 Qtrs Previous 3 Qtrs Previous 3 QtrsPrevious 3 Qtrs Previous 3 Qtrs Previous 3 Qtrs Previous 3 Qtrs Previous 3 Qtrs
Although EPA only reports energy and water data for its reporting laboratories, the Agency has focused on green buildings at its new and/or renovated office space across the country. This year, EPA was proud to move into 405,000 square feet of newly constructed office space in the Potomac Yard area of Arlington, Virginia. The building (pictured on the cover) is Gold certified by the U.S. Green Building Council’s Leadership in Energy and Environmental Design (LEED®) program, and must meet ENERGY STAR® building label performance standards. GSA also chose this new facility as a finalist in its 2006 Real Property Awards for its sustainable features.
EPA also made significant strides on a new 250,000 square foot regional office building in Denver, Colorado, where construction should be completed in December 2006. This building is expected to achieve LEED Gold certification and also meet ENERGY STAR building label standards. Finally, at the end of September 2006, GSA awarded the renovation contract for the McCormick Post Office and Court House in Boston, Massachusetts. EPA’s Region 1 office will be the lead tenant in this building, occupying 225,000 square feet,
1,3551,355
1,2901,290
1,2251,225
BBtu
BBtu
which should be LEED certified.
EPA continued to make progress on in its water conservation program, completing five water management plans and reducing its water use by 6.6 percent (on a gallons per square foot basis) from an FY 2000 baseline.
EPA completed pollution prevention/recycling audits at 10 major regional offices or laboratories in FY 2006, compiling best practices found at each location and initiating steps to develop baseline metrics for recycling portfolio-wide.
5
EPA worked to improve its facility delivery process in FY 2006 by awarding a nationwide sustainable master planning contract that will incorporate energy efficiency, site security, stormwater management and landscaping issues into its traditional master planning approach, which has been focused on space need and building location. EPA also hired new architecture and engineering firms nationwide and, for the first time, required that each firm hired have significant green building, energy conservation, and commissioning experience. EPA also initiated a “Green Check” system, where EPA facility staff and EPA tenant organizations establish discrete environmental goals for each major facility project.
Laboratories for the 21st Century (Labs21), EPA’s voluntary partnership program for sustainable federal and private sector laboratories, also prospered in FY 2006. Milestones include the award of a co-sponsorship agreement to I2SL, a nonprofit organization dedicated to sustainable laboratories, in the second quarter of FY 2006, to help the program grow technically and increase its environmental benefits and reach. The most recent Labs21 conference again saw a growth in attendance and featured a greatly expanded trade fair/vendor exhibition.
I. ENERGY POLICY
Energy Policy Act of 2005—A New Challenge, A New Paradigm
EPAct 2005, signed into law on August 8, 2005, introduced a new and stricter framework for federal energy use reduction, requiring a 20 percent cut in energy use by FY 2015 and mandating a 2 percent reduction in energy intensity each year starting in FY 2006 through FY 2015 (compared to an FY 2003 baseline).
With this new requirement, EPA is faced with a new set of energy conservation challenges.
Beginning in FY 2003—the new baseline year specified in EPAct 2005—EPA began reporting energy use at the Agency’s newly constructed New Main Laboratory and National Computer Center (NCC) located in RTP, North Carolina. Unfortunately, both facilities (which account for nearly 40 percent of EPA’s reportable energy consumption) have significantly exceeded their energy use design estimates. As a result, on an Agencywide basis, EPA’s energy intensity was higher in both FY 2004 and FY 2005 compared to FY 2003. Because EPA finished FY 2005 with its energy intensity more than 3 percent higher than its FY 2003 baseline1, the Agency would be required to reduce its energy intensity by 5.2 percent2 below its year-end FY 2005 reported energy intensity in order to meet its FY 2006 goal contained in EPAct 2005.
1 EPA’s revised FY 2003 baseline energy intensity is 346,518 Btu/Ft2 (see Attachment 2). EPA’s revised FY 2005 energy intensity is 358,144 Btu/FT2, which represents a 3.36 percent increase over the FY 2003 baseline: [(358,144 Btu/FT2 – 346,518 Btu/FT2) ÷ 346,518 Btu/FT2] = 3.36 percent. 2 EPA’s FY 2006 EPAct goal is 339,588 Btu/GSF (2 percent below 346,518 Btu/GSF). EPA’s required decrease from its FY 2005 energy intensity to the FY 2006 goal is: 358,144 Btu/GSF – 339,588 Btu/GSF = 18,556 Btu/GSF, which represents 5.18 percent (18,556 Btu/GSF )358,144 Btu/GSF x 100 = 5.18 percent).
6

Through most of FY 2006, it was unclear under EPAct 2005 if green power would be credited towards the energy conservation targets, as was historically done under Executive Order (E.O.) 13123, Greening the Government through Efficient Energy Management. EPA adopted a conservative approach and planned, through the “ConservE” program described below, to meet EPAct 2005 goals for FY 2006 through energy conservation alone.
As a result, in FY 2006, EPA decreased its energy intensity by 5.0 percent from FY 2005 (from 358,144 Btus/GSF to 340,112 Btus/GSF), just shy of the 5.2 percent required for EPA to meet its EPAct 2005 goals for FY 2006.
However, with the issuance of DOE guidance in mid-September 2006, which allowed crediting green power purchases against EPAct 2005 energy use reduction goals, EPA far exceeded the EPAct 2005 requirements. Including both actual energy conservation and green power, EPA achieved a 42 percent total reduction in energy intensity, greatly exceeding the requirements of EPAct 2005. DOE guidance about green power credits counting toward EPAct 2005 energy conservation goals covers FY 2006 only. This allowance may not be permitted in subsequent reporting years.
Under E.O. 13123, EPA is required to reduce energy intensity at its reporting laboratories (which are categorized as “industrial” facilities) by 25 percent by the end of FY 2010 compared to the same FY 1990 baseline. While this Executive Order is still in force, it is expected to be rescinded. Therefore, DOE and the InterAgency Energy Management Workgroup focus on EPAct 2005 goals.
“ConservE” Program Takes Shape
With the passage of EPAct 2005 and its stricter energy conservation requirements, and faced with the uncertainty of the green power credit, in December 2005 EPA’s Office of Administration and Resources Management (OARM) initiated the ConservE Program, a comprehensive energy reduction strategy. This new Agencywide effort, which represents a new paradigm for reducing energy at EPA, is designed to identify opportunities for short-, intermediate-, and long-term energy savings and shift from voluntary efforts to assigned targets.
For example, as part of EPA’s strategy for short-term energy savings, OARM required all reporting facilities to perform and report progress on 30 different O&M actions by the end of March 2006. These actions were categorized into the “Top 10” target areas, which included: boilers, air handling units, steam traps, chillers, cooling towers, building automation systems, pumps, fans, air compressors, and lighting. EPA’s Sustainable Facilities Practices Branch (SFPB) anticipated that the Agencywide completion of these action items would contribute to a 2 percent savings in energy consumption by the end of FY 2006, compared to FY 2005.
In July 2006, SFPB completed a report summarizing the progress made on these O&M actions and found that EPA’s reporting facilities completed 67 percent of all possible O&M actions; 27 percent of all possible O&M actions did not apply to certain facilities (e.g., several of the boiler O&M actions did not apply to facilities having hot water, low-pressure boilers). Only four
7

percent of all possible O&M actions were not performed, and the remaining two percent of all possible O&M actions were reported as “pending.”
In addition to the mandatory “Top 10” O&M action items, OARM also assigned all reporting facilities to develop and submit facility-specific energy reduction plans by the end of June 2006 that provide additional specific action items for short-, intermediate-, and long-term energy savings. In these plans, each facility was asked to report on:
• Short-term energy reduction efforts in direct response to the September 6, 2005, “Presidential Memorandum on Federal Energy Use.”
• Planned intermediate-term actions to reduce facility energy use (planned projects for FY 2007 and FY 2008).
• Planned long-term actions to reduce facility energy use (planned projects for FY 2009 and beyond).
Of the reported short-term actions in response to the Presidential Memorandum on Federal Energy Use, the most prevalent actions taken were O&M efforts, actions to reduce lighting loads, and adjustment of building automation system (BAS) set points. In addition, a number of facilities reported increasing outreach to employees to raise awareness of energy efficiency and banning the use of personal heaters.
A majority of the reported planned intermediate actions focused on: construction and renovation projects to improve energy efficiency of existing facilities; upgrades to heating, ventilation, and air conditioning (HVAC) systems and chillers; upgrades and increased use of BAS controls; and further reduction of lighting loads.
Reported actions planned for the long-term focused primarily on HVAC and BAS upgrades, initiation of onsite renewable energy projects, and the development and implementation of sustainable master plans.
ConservE Targets Mandatory Reductions
To further encourage significant energy reductions throughout FY 2006, EPA’s ConservE team assigned each reporting facility an “FY 2006 Btu reduction target.” While in previous years SFPB relied on voluntary actions by individual sites to reduce energy, this shift to mandatory energy reduction targets represents a fundamental change in EPA’s energy management program. The team began by assigning a 2 percent reduction in energy consumption to all facilities, which the ConservE team assumed could be accomplished by the timely completion of the Top 10 O&M actions. To achieve the additional 3.2 percent savings necessary to meet EPA’s FY 2006 energy reduction goal, the team reviewed recently completed energy savings projects or those underway and applied the estimated energy savings associated with each project to the respective facility’s required FY 2006 Btu reduction target.
To track ConservE progress and communicate with facility management, SFPB developed a quarterly ConservE update for all facility managers and upper management. With a red/yellow/green rating system—similar to the one used in the Office of Management and
8

Budget (OMB) Energy Management Scorecard—SFPB assigned each facility a progress rating to communicate year-to-date progress achieved relative to the site-specific FY 2006 energy reduction target.
EPAct prompted EPA to evaluate its energy conservation strategy and compare the current strategy’s results with the new annual EPAct energy reduction goals. This effort began in late Fall 2005. Under this exercise, the ConservE team updated the list of all known energy savings projects currently underway and planned at EPA’s reporting facilities. For each identified project, the team confirmed or adjusted estimates of completion dates and energy savings. The team developed a new forecasted net energy consumption profile for all reporting facilities compared to EPA’s annual EPAct targets to gain a better perspective of EPA’s projected energy use and determine if additional projects and funding would be necessary. While the first phase of this effort confirmed the basic approach EPA has been pursuing to meet energy reduction goals, it did show a significant shortfall in available funding.
In May 2006, EPA initiated Phase II of the energy master planning exercise. During this second stage, EPA examined each planned energy savings project to refine estimates of energy savings. In addition to reviewing engineering drawings and reports, contractors also performed site visits to key sites to meet with onsite facility managers and identify additional opportunities for energy savings. As part of this closer review of project plans, contractors determined that several of the original energy savings estimates were too high. As a result, EPA will need to identify additional energy savings projects when refining its FY 2007 master planning strategy.
Assessing O&M at Key Facilities
In an attempt to realize intermediate-term energy savings in its ConservE program, EPA also conducted O&M assessments at five of its highest energy consuming facilities in FY 2006: RTP’s New Main laboratory and NCC; the A.W. Breidenbach Environmental Research Center in Cincinnati, Ohio; the National Vehicle Fuel Emissions Laboratory in Ann Arbor, Michigan; and the Environmental Science Center in Fort Meade, Maryland. EPA also conducted an O&M assessment at its laboratory in Montgomery, Alabama. Contractors visited the sites and identified actions that could lead to energy savings, including national O&M guidelines, contract language, and increasing preventative maintenance. Following evaluation of these initial pilot assessments, EPA intends to institutionalize the assessment process as a component of the Agency’s national energy management program and place increased emphasis on O&M across the Agency.
Advanced Metering Helps Measure Progress
In addition to new, more stringent energy reduction goals, EPAct also requires that federal agencies install advanced metering in all federal facilities, where feasible, by October 1, 2012. While EPAct only requires agencies to install advanced metering for electricity, EPA plans to meet or exceed EPAct requirements for advanced metering.
Additionally, EPA plans to integrate all metered energy data from different facilities into a single, Web-based “clearinghouse” of EPA’s Agencywide energy consumption data. EPA anticipates that this new integrated nationwide metering system will replace the Agency’s
9

existing practice of manually tracking and entering energy consumption data, thus improving accuracy and saving time. The system will also provide facility staff and senior management instant access to valuable data at the click of a mouse, which will ultimately help EPA reduce energy use across its inventory of facilities.
In spring 2006, EPA conducted extensive research on potential vendors fo r both advanced metering hardware and software products. After refining its list containing the most qualified vendors, EPA conducted in-person interviews with representatives from three different vendors to better evaluate the available products and services and obtain cost estimates.
In April 2006, EPA developed an initial inventory of existing utility meters at all reporting facilities, based on a review of utility invoices, and reviewed and prioritized its planned capital projects to incorporate advanced metering installation into the scope of work. In FY 2007, EPA will: develop individual site metering plans; evaluate costs, funding sources, and expected savings; and finalize an Agencywide implementation plan. Installation of advanced metering systems, beyond the existing system at RTP New Main and NCC, should begin in FY 2008.
Following DOE’s Guidance for Electric Metering in Federal Buildings issued in February 2006, all federal agencies were required to submit an Agencywide advanced metering strategy to DOE by August 3, 2006. EPA met this requirement by submitting its advanced metering strategy on July 31, 2006. EPA’s advanced metering strategy contains 19 distinct milestones in three different sections: 1) information gathering/defining program structure; 2) policy guidance and technical assistance; and 3) metering implementation and evaluation. By the end of FY 2006, EPA successfully completed three of the four milestones with deadlines in FY 2006. Finally, after completing its Agencywide advanced metering strategy, EPA awarded contracts for the development of performance specifications for both the hardware and software components in August 2006 to ensure communications compatibility.
Procurement of Energy-Efficient Equipment
EPAct 2005 also requires that, when procuring energy-consuming products, all federal agencies must procure ENERGY STAR or Federal Energy Management Program (FEMP) designated products. To ensure EPA’s Agencywide adoption of this requirement, SFPB worked with EPA’s Architecture, Engineering, and Asset Management Branch (AEAMB) to develop an addendum to the Agency’s existing Architecture and Engineering Guidelines. This 38-page document provides FEMP’s energy efficiency requirements for 45 specific products in seven categories and a link to both the FEMP Energy-Efficient Products page and the ENERGY STAR Web site.
OMB Energy Management and Environmental Stewardship Scorecards
Following the January 2006 White House Summit on Sustainability, OMB issued initial drafts of proposed new scorecards to assess federal agencies’ performance in implementing statutory and executive order requirements in three areas: 1) energy management, 2) transportation/fleet management, and 3) environmental stewardship. Through these new scorecards, OMB will
10
evaluate and report both year-end status (in January) and mid-year progress (in July) relative to each performance measure.
In OMB’s June 2006 evaluation of agencies’ Energy Management Scorecards, which retroactively assessed performance as of January 1, 2006, EPA received a “green” for current status and a “green” for progress. Metrics on the scorecard that apply to EPA include: percent of green power acquired, EPAct reductions in energy use met, appropriate progress on advanced metering, and percent of new building designed to a 30 percent better than ASHRAE 90.1-2004 standard.
On all three of the OMB scorecards, agencies are also required to list actions taken over the previous six months and actions planned over the next six months. On the OMB Energy Management Scorecard, in its July 2006 mid-year progress evaluation, EPA reported its progress in completing planned actions over the first six months of calendar year (CY) 2006. In addition to the six originally planned actions (reported in EPA’s initial Energy Management Scorecard), EPA also completed two additional actions to reduce energy use. As a result of this progress, OMB awarded EPA with a “green” mid-year progress rating. EPA listed seven planned actions to complete over the last six months of CY 2006, which OMB will evaluate during the next yearend assessment of the scorecards.
OMB’s Environmental Management Scorecard also includes new metrics on green building policies and procedures. The first requirements in this area are due December 31, 2006.
II. ENERGY EFFICIENCY PROJECTS AND FACILITY IMPROVEMENTS
EPA continues to focus its energy conservation work on its largest energy using facilities. The four major laboratories in RTP use approximately 50 percent of EPA’s reported energy. AWBERC uses approximately 10 percent of EPA’s reported energy, and NVFEL in Ann Arbor, Michigan, and the Environmental Science Center in Fort Meade, Maryland, use approximately 5.6 percent and 4.9 percent of EPA’s reported energy, respectively.
EPA does not report on energy use in its office buildings, which are reported by DOE regulations by GSA. Also note, these figures are not normalized (adjusted for changes in heating and cooling degree day differences from year to year), which can typically cause portfoliowide changes of plus or minus 5 percent in energy usage.
RTP NEW MAIN ACTIVITIES
Recommissioning
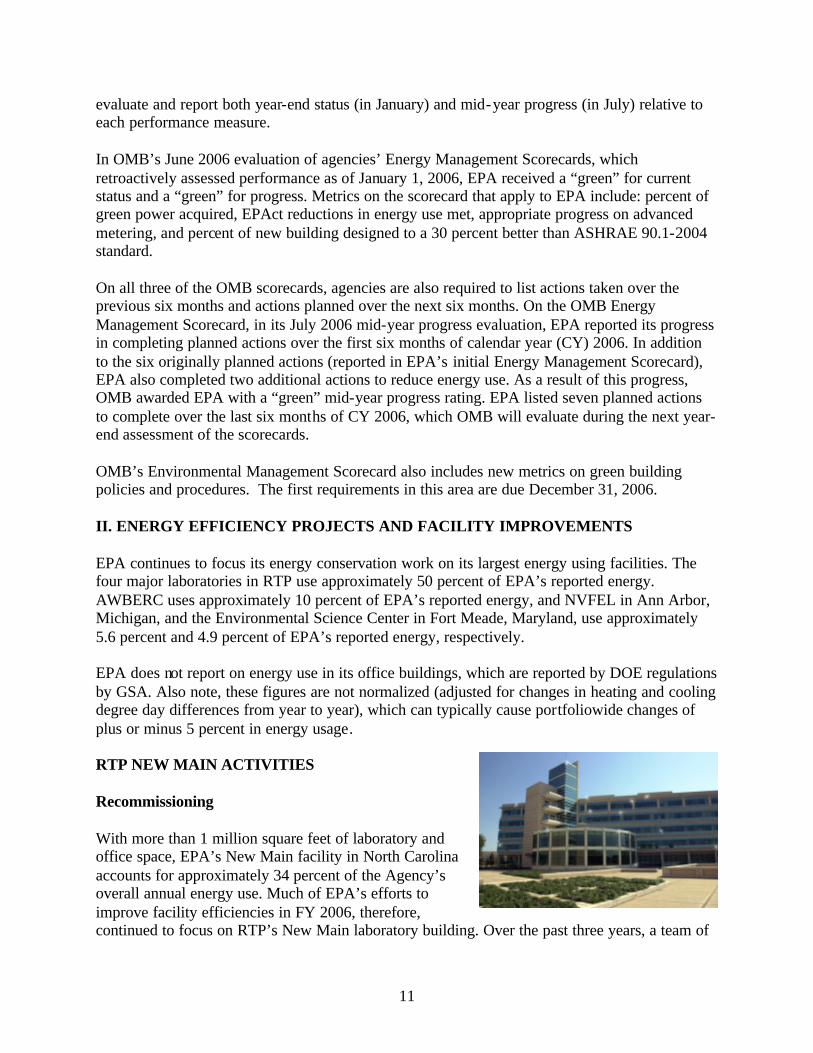
With more than 1 million square feet of laboratory and office space, EPA’s New Main facility in North Carolina accounts for approximately 34 percent of the Agency’s overall annual energy use. Much of EPA’s efforts to improve facility efficiencies in FY 2006, therefore, continued to focus on RTP’s New Main laboratory building. Over the past three years, a team of
11
EPA employees from RTP and Headquarters has been developing and implementing extensive recommissioning projects to improve the performance and efficiency of critical building heating, cooling, ventilation and controls systems.
At New Main, the team completed two major projects for RTP’s laboratory space and vivariums (animal research wing): the Laboratory Controls Optimization Project (LCOP) and the Vivarium Controls Optimization Project (VCOP). These projects calculated and reconfirmed safe nighttime and daytime (occupied and unoccupied) supply and exhaust requirements for each laboratory module based on the fume hood sash position (open or closed), tested the ability of the control systems to reliably and consistently adjust to fume hood sash position and occupancy changes, replaced or repair ed defective sensors and controllers, verified congruency of BAS reported flows and performance against actual flows and performance. Both these projects were completed by March 2006.
The results of the adjustments made during LCOP and VCOP created an opportunity for additional energy savings. By safely reducing the air flow demands for laboratories and animal research areas from 773,167 CFM to 503,220 CFM, the team was also able to modify the operation of the air handling units (AHUs) and reduce static pressure throughout the system. To ensure a dependable air supply, AHUs maintain a minimum “static pressure” for each laboratory unit, which originally required constant operation of five AHUs. Following LCOP and VCOP, the team implemented a Static Pressure Optimization and Reduction Test (SPORT) and determined that only two to three AHUs would typically be needed to maintain static pressure in the laboratories and ensure safe ventilation.
EPA also completed a pilot to develop a recommissioning strategy for the AHUs on the office wings of the New Main facility and will implement recommissioning of the office side AHUs in FY 2007.
EPA completed implementation of the first year of a multi-year controls master plan. The focus this fiscal year was to improve the data transmission, data retention, and overall data quality of the BAS system by reducing data overloads and data transit times on various sections of the building control system. The system backbone has been significantly strengthened, enhanced, and improved from the BAS control room out to the routers in the various building wings.
In January 2006, EPA completed the installation of the Agency’s first Web-based advanced metering system at the Agency’s New Main facility and NCC in RTP. This new system provides onsite staff online access to real-time metered energy and water data, allowing for more effective monitoring and management of energy and water consumption, as well as savings from the above-mentioned projects. EPA hopes that its experience in designing, procuring, installing, and maintaining this system will help prepare the Agency for installing similar metering capabilities at its other reporting facilities across the country as EPA works to meet federal advanced metering requirements established by EPAct.
12

Humidification and Heat Recovery
In January 2006, EPA completed a series of mechanical upgrades in the vivarium (or animal holding area) of RTP’s New Main facility, highlighted by a new humidification and heat recovery system. To more effectively meet specific indoor humidification needs in the vivarium, EPA first upgraded its existing humidification system to include a new reverse osmosis water treatment system, two clean steam generators, and a steam humidifier. The new humidification system disperses steam into circulated air in varying amounts, depending on outdoor weather conditions. On extremely cold and dry days, the facility’s new humidification system can operate in tandem with the old unit, allowing EPA to provide sufficient humidification even during extreme weather conditions.
EPA also installed a new exhaust heat recovery system to reduce the energy use associated with heating and cooling the incoming outdoor air. By utilizing the otherwise wasted exhaust energy, EPA is able to more efficiently cool and heat incoming outdoor air using considerably less energy. Together with the improved humidification system, EPA expects these upgrades to help the facility more effectively attain the required conditions for the building’s supply air and simultaneously reduce annual energy consumption by approximately 2 percent.
With the completion of these projects in FY 2006, EPA reduced annual energy use at RTP by 3.6 percent, or 16,185 MMBtus from FY 2005, in addition to reductions in FY 2005 from FY 2004 of 6.9 percent, or 33,220 MMBtus. This represents a total reduction of 10.3 percent, or 49,405 MMBtus from FY 2004. These efforts produced avoided energy costs equal to $829,257 based on FY 2006 average utility costs. LCOP, VCOP and SPORT were the primary contributors to the energy savings achieved in FY 2005 and FY 2006, providing EPA substantial energy use reductions, with in a payback period of approximately two years.
In FY 2007, recommissioning work at RTP New Main will concentrate on water side issues such as better coordination of output between the central utility plant (CUP) and New Main heating and cooling needs and evaluation of the New Main chilled water bypass system. Improving the operating efficiencies at the CUP is also an important goal for FY 2007. In FY 2006, EPA initiated the contract for this work with its regional architecture and engineering firm.
Human Studies Facility, Chapel Hill, North Carolina
Human Studies uses approximately 8.7 percent of EPA’s reportable energy use. In FY 2006, EPA Headquarters provided supplemental funding to RTP to provide one additional O&M staff member to address a backlog of HVAC maintenance issues. This additional staffer supplemented the existing one O&M staff person, who had focused on tenant comfort and maintenance issues more visible to tenants. This additional O&M staffing proved successful. Energy use dropped 12.5 percent, or 14,234 MMBtus in FY 2006, representing $232,517 in avoided utility costs based on FY 2006 average utility costs at this facility. Payback for this additional O&M staff was 0.6 years.
13
In addition, the RTP energy team continued design work on AHU #1 and AHU #2. These are the two largest air handling systems in the building. In FY 2007, EPA expects to complete design on these two systems, put them out to bid, and begin their replacement/reconstruction, including control upgrades. Energy savings of 15 percent or approximately 15,000 to 17,000 MMBtus is expected when this project is completed, representing an annual savings of $245,000 to $278,000 based on FY 2006 average energy prices for this facility.
During FY 2006, the RTP energy team also completed upgrades to AHUs #3, #4, and #5. In addition to performing exhaustive preventative maintenance on all three units, the energy team also initiated a nighttime setback and occupied and unoccupied settings and adjusted the settings on the variable air volume boxes to further reduce energy.
NHEERL Research Toxicology Facility
EPA’s National Health and Environmental Effects Research Laboratory (NHEERL) in RTP uses approximately 4.3 percent of EPA’s reported energy. In February 2006, during the Office of Research and Development’s (ORD’s) annual recertification of fume hoods at this facility, air flows at the fume hood facilities were set back from 100 feet per minute to 80 feet per minute with the fume hood fully open. This reflects current EPA Safety and Health Requirements, is a direct result of experience gained by ORD’s Health and Safety Office during the New Main laboratory recommissioning project, and will be a key component of integrating various EPA organizations into the “continuous commissioning” program that EPA is working to institutionalize at RTP. Flow reductions of 8,250 cubic feet per minute (CFM) were achieved, for an estimated annual savings of approximately $25,000 to $30,000 annually in utility costs.
The owners of the NHEERL Research Toxicology Facility completed the replacement of the building cooling towers and packing media in April 2006, which contributed to energy savings at this facility. RTF has shown a 6.2 percent reduction in energy use from FY 2005 levels, a reduction of 3,502 MMBtus, and avoided utility costs of $46,925, based on FY 2006 average utility costs at this facility.
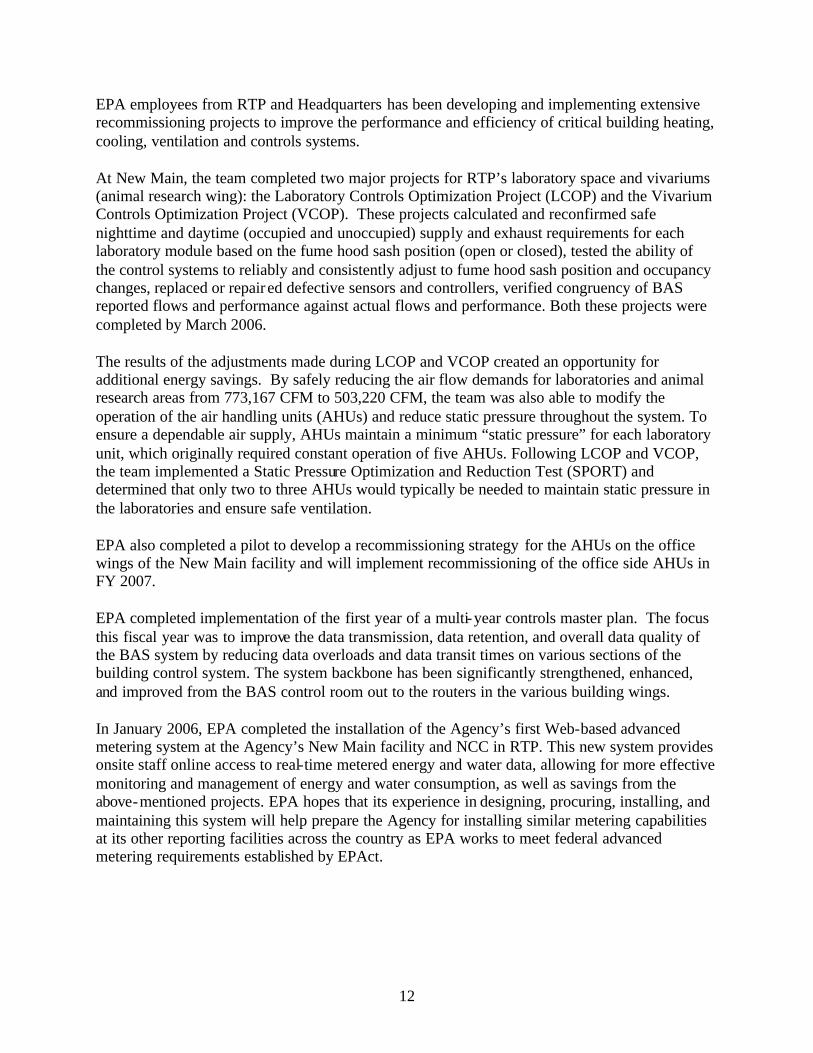
NCC Energy Audit
NCC uses approximately 3.5 percent of EPA’s reportable energy. In FY 2006, EPA performed a preliminary energy audit of the mechanical systems at the New Main, after energy reporting data showed a significant increase in energy use the first two quarters of the fiscal year. While some of this increase was due to an increase in computer center use, EPA recommissioned the office side air handlers, implemented a nighttime setback in the office areas, and recommissioned the BAS. Opportunities identified in the core computing center include rearranging equipment and heat loads and subsequent optimization of cooling. EPA hopes to follow up on these opportunities in FY 2007. Despite energy use increasing 3.2 percent at the end of the second quarter, the NCC finished FY 2006 using 0.5 percent, or 253 MMBtus, less energy than in FY 2005.
14

Cincinnati Designs Infrastructure Replacement
EPA’s Andrew W. Breidenbach Environmental Research Center (AWBERC) in Cincinnati, Ohio, is the Agency’s second largest research facility and the second largest energy user. EPA devised an energy master plan for the 30year-old AWBERC facility during FY 2003 and later initiated a seven-year, multimillion dollar infrastructure replacement project to upgrade the building’s HVAC systems, which is expected to significantly reduce energy consumption.
In June 2006, EPA awarded a contract for the Phase 1 design, which will cover mechanical upgrades for exhaust systems, AHUs, and piping/ductwork, as well as complete renovatio n of 12 laboratory modules. EPA will be installing high-performance variable air volume (VAV) fume hoods in laboratories and replacing single-pass air supply for the administration wing, with a more traditional and appropriate combination of return air and outside air. EPA will also be installing new building controls with nighttime setbacks, as one more means of improving energy efficiency, employee comfort, and maintenance capabilities.
Designs are expected to be completed in July 2007, with construction scheduled to begin at the beginning of FY 2008.
OTHER MAJOR ENERGY CONSERVATION PROJECTS
Revisiting Ann Arbor’s ESPC
EPA’s National Vehicle Fuel Emissions Laboratory (NVFEL) in Ann Arbor, Michigan, is home to the Agency’s flagship energy savings performance contract (ESPC), with savings exceeding 40 percent from baseline energy use in the 2002 (the first full year of operation following the completion of the ESPC upgrades). Changes in research operations and the construction of facility additions reduced system performance, and increased energy use 27 percent between FY 2002 and FY 2005. In FY 2006, the facility began supplementing its existing ESPC with new energy conversation measures. Examples of these measures include shifting the peak load on the facility’s 400-kilowatt cogeneration plant and reducing the laboratory air exchange rates. Both changes are expected to each save $60,000 per year in utility demand charges In addition, the ESPC contractor is currently providing daily reports on NVFEL’s building automation system providing snapshots of the facility’s evening energy use. Facility staff follows up with personnel to reduce unnecessary energy use. These efforts resulted in a savings of 24.1 percent, or 17,945 MMBtus in FY 2006 from FY 2005 levels, restoring the labs energy performance to previous levels. These efforts result in a recovery of previous avoided utility costs equivalent to $255,914 based on FY 2006 average utility costs at this facility.
EPA has also studied ESPC modifications to address EPA’s need for additional cooling capacity, poor performance of the fuel cell, simplification of the Measurement and Verification Plan, and other issues. Initial estimates indicate potential energy savings of $184,000 annually. At the close of FY 2006, the ESPC contractor was not significantly engaged or motivated to negotiate on these desirable changes.
15
Optimizing Controls in Fort Meade
In FY 2006, EPA completed Phase I of a laboratory controls optimization project (LCOP) at the Agency’s Environmental Science Center (ESC) in Ft. Meade, Maryland. During this initial phase of the project, a contractor performed an extensive audit of the facility’s ventilation system and laboratory and non- laboratory space and collected baseline airflow data. Following the audit, the contractor developed a comprehensive report, which documented all existing exhaust devices in the laboratory, as well as a list of those devices that laboratory staff were either not using or using inappropriately. This Phase I report also identified potential air flow reductions, as well as opportunities to further segregate laboratory and non- laboratory activities to reduce operational requirements and further save energy.
Preliminary results from Phase I of this project indicated that EPA is utilizing its ventilation system quite efficiently; however, the results also identified several problems with the calibration and accuracy of the HVAC controls.
During Phase II of this project, which EPA hopes to complete in FY 2007, EPA will develop a revised ventilation plan (based on the results of Phase I) that establishes new set points to meet the reduced air flow demand. In Phase III, EPA will implement the ventilation plan and recommission the HVAC system and controls to ensure optimum efficiency and continued employee safety and comfort. EPA expects the implementation of LCOP to reduce annual energy consumption at ESC by an additional 8 to 10 percent below its FY 2006 consumption.
Energy savings initiatives spearheaded by Fort Meade resulted in a decrease in energy use of 13.1 percent from FY 2005 levels, or 8,428 MMBtus, the equivalent of $147,691 in avoided utility costs based on FY 2006 average utility costs at this facility.
Switching to VAV
After completing construction of a new wing with VAV fume hoods at its Region 10 laboratory in Manchester, Washington, EPA implemented a multi-stage renovation project focusing on VAV upgrades for existing wings. The goal is to replace most of the laboratory’s constant volume systems with high-performance fume hoods. During the initial stage of renovation, in FY 2004 and FY 2005, EPA focused on the design, construction, and commissioning of six new high-performance fume hoods, which are designed to use 30 to 40 percent less energy than conventional, constant volume systems. In FY 2006, EPA moved into the next stage of renovation and in February completed designs for similar upgrades in additional laboratory wings at the facility. EPA negotiated and awarded a construction contract in late FY 2006 and expects renovations will be completed in Summer 2007. When complete, the Agency expects these high-performance fume hood upgrades to reduce overall energy use at the Region 10 laboratory by approximately 15 percent compared to a FY 2005 baseline.
In FY 2006, EPA continued plans for a variety of AHU upgrades at its Mid-Continent Ecology Division Laboratory in Duluth, Minnesota. These upgrades will involve replacing the facility’s existing constant volume AHUs with a more energy-efficient VAV unit, as well as installing
16
more current AHU technology overall. Designs for the project were completed in FY 2006. If funding can be found, EPA hopes to start construction of the project in 2007. Once completed, the upgrades should reduce the laboratory’s energy use 20 percent from FY 2007 to FY 2012. Two VAV projects are also ready for procurement in FY 2007, including a VAV pilot on one third of the systems and new VAV systems to be incorporated as part of an infrastructure upgrade. EPA plans to design the remaining VAV systems upgrades in FY 2007.
Cogeneration Project in Richmond
In October 2005, EPA’s Region 9 Laboratory in Richmond, California, completed installation and formally began operation of a new, 60-kilowatt (kW) cogeneration unit, which was begun in Fall 2004. Using a separate dedicated natural gas line, this new cogeneration unit generates electricity onsite for use by the facility and captures the associated waste heat for use by the laboratory’s boilers. In theory, this captured waste heat reduces the need for natural gas to generate hot water, thus reducing site energy consumption. As part of a package of other mechanical upgrades, EPA had anticipated that the natural gas-fired cogeneration unit would contribute to annual energy savings of approximately 21 percent.
In FY 2006, however, the laboratory experienced a number of setbacks, which led to a 15.9 percent, or 2,320 MMBtu, increase in energy use in FY 2006 compared to FY 2005. EPA observed trends of increased energy using beginning in the first and second quarters of FY 2006, EPA initiated a joint study with DOE’s Lawrence Berkeley National Laboratory (LBNL) to investigate possible reasons for the trend. After eliminating weather as a principal contributor to the increase in energy consumption, LBNL conducted a more in-depth investigation and discovered that the performance of the cogeneration unit during the first two quarters of FY 2006 was not representative of the unit’s capabilities. Due to gas regulator problems experienced by the facility’s natural gas utility provider, the facility’s cogeneration unit was limited to about 85 percent of its rated output until March 2006. The unit also experienced several service outages totaling more than a month and a half throughout fall and winter 2005 due to coupling and engine failures. As a result, the unit was only operational about 70 percent of the time from early November through the end of June, and during most of this period, the unit was not able to operate at full output. Energy data for the last two quarters of FY 2006 showed some improvement in energy performance. EPA hopes that, after additional investigation and adjustments, the full energy savings potential of the cogeneration unit will be realized in FY 2007.
Chelmsford Cons ervation Efforts Lead to Savings
Beginning in FY 2004, several energy-saving projects have reduced energy use 28 percent at EPA’s New England Regional Laboratory (NERL) in Chelmsford, Massachusetts, by improving the efficiency of the building’s HVAC system. NERL worked with the building owner to design and install 23 fan-powered perimeter air terminals to enhance heat distribution in the perimeter offices, improving both temperature control and energy efficiency. During this upgrade, NERL also connected the primary office HVAC system to several rooms that were previously heated and cooled by less-efficient individual HVAC units. NERL later identified and addressed other system inefficiencies, including malfunctioning sensors that hampered efficient operation of the facility’s gas-fired boilers. Through an effort started in FY 2005 and continuing through FY
17

2006, NERL has adjusted building automation system set points each day based on outdoor air temperatures—actions that continue to improve efficiency and save energy. Overall, these efforts helped reduce annual energy consumption from 22,339 MMBtus in FY 2005 to 18,107 MMBtus in FY 2006, a reduction of 18.9 percent, representing $112,586 in avoided utility costs based on FY 2006 average utility costs at this facility.
Though the Athens Science and Ecosystem Support Division (SESD) laboratory is reasonably efficient, EPA had identified several opportunities to save energy. In late FY 2006, EPA finalized designs for several projects that are expected to reduce annual energy consumption up to 15 percent and have an estimate payback of less than five years. Modifications to building controls, such as nighttime setbacks and adjustments to the sequence of operations, are expected to reduce energy demands. EPA will also install an independent HVAC unit for the computer room and transition from constant volume to variable frequency drive AHUs.
EPA also completed mechanical upgrades for the heating system at its Pacific Coastal Ecology Branch laboratory in Newport, Oregon. EPA replaced the facility’s heat pumps with new high-performance, high-efficiency boilers, which are better suited to meet the facility’s heating needs and reduce the facility’s demand for fossil fuels.
III. GREEN BUILDINGS – POLICY & PRACTICE
Beyond upgrades to its existing facilities, EPA looks ahead to new and renovated buildings that demonstrate sustainable design and operation.
Showing the Agency’s commitment to sustainable building, Luis A. Luna, EPA's Assistant Administrator for the Office of Administration and Resources Management, along with representatives from 16 other federal agencies, signed a memorandum of understanding (MOU) entitled “Federal Leadership in High Performance and Sustainable Buildings” at the White House Summit on Federal Sustainable Buildings on January 24, 2006. The MOU commits these federal agencies to energy-efficient and sustainable design, construction, and facility operation.
Also in FY 2006, EPA furthered its commitment to green buildings by changing its requirements for all newly initiated major building construction projects. Instead of achieving the U.S. Green Building Council’s LEED® (Leadership in Energy and Environmental Design) Silver level certification, the Agency now requires that all facilities me et the stricter Gold standards. In addition, EPA requires other sustainable features for its major new building acquisitions, including achieving an ENERGY STAR building label (for office buildings); 30 percent better energy performance than ASHRAE 90.1-2004 requirements3; specific water conservation measures; resource conservation, recycling, and use of sustainable building materials; and measures to protect indoor air quality.
3 While the EPAct 2005 now requires federal agencies to design buildings to be 30 percent more efficient than ASHRAE 90.1-2004, EPA used a 30 percent better than ASHRAE 90.1-1999 goal before EPAct 2005 became law. In addition, ASHRAE 90.1-2004 is a tighter performance standard to meet for EPA-related building types than is ASHRAE 90.1-1999, because ASHRAE tightened up allowable energy use for lighting.
18

Putting Green Building Into Practice: Potomac Yard
In July 2006, after more than two years of intensive planning, design, and construction, EPA completed its move into newly leased sustainable office space in the Potomac Yard section of Arlington, Virginia. Potomac Yard consists of two connecting office towers containing 650,000 square feet of office space and 6,000 square feet of retail and public space. EPA occupies 405,000 square feet of office space in the project.
Because the Potomac Yard facility was already designed when the lease was signed by GSA, the developer had to modify the original design of its speculative office building to meet EPA’s minimum requirements—LEED Silver certification, the ENERGY STAR building label, and other environmental performance standards. After the lease was awarded, EPA and GSA, continued to negotiate additional environmental performance upgrades to the facility. The facility achieved LEED Gold certification in June 2006.
To achieve the ENERGY STAR building label, Potomac Yard must perform in the top 25 percent of similar office facilities. EPA required extensive commissioning and upgraded the mechanical system controls and ventilation monitoring systems after the lease was signed. The facility also features two ENERGY STAR-rated rooftops, which reduce building cooling loads and could trim peak cooling demand by 15 percent. The
office areas feature natural daylighting, efficient ENERGY STAR lighting fixtures and appliances, automatic daylight dimming, and occupancy sensors.
Potomac Yard also features recycled aluminum and wheatboard counter tops, recycled-content carpet, corn-based fabrics, and systems furniture that is Green Guard certified. During construction, low-volatile organic compound interior adhesives, paints, caulks, and sealants were used to ensure superior indoor air quality.
To promote water conservation, Potomac Yard features water-efficient urinals in men’s restrooms; water-conserving, dual- flush toilets in the women’s restrooms; and high-efficiency showerheads and faucets with electronic shutoff. Regional and drought-resistant landscaping plants on facility grounds eliminate the need for extra watering or irrigation systems. The grounds also contain sand filters to treat stormwater runoff, and between the two towers of the facility, a small “green” roof helps minimize runoff.
Putting Green Building Into Practice: Denver Regional Office
EPA’s new 250,000 square foot Region 8 headquarters building in Denver, Colorado, is expected to be completed in January 2007. The building features an extensive green roof, a 10 kW photovoltaic (PV) installation on the roof. The building will be the first EPA occupied building with underfloor air supply, which reduces HVAC loads. The mechanical system also includes air side economizers. Energy modeling shows that the building is anticipated to perform 36 percent better than ASHRAE 90.1-1999 standards and 32 percent better than ASHRAE 90.12004 standards. The building must achieve a LEED Silver certification, but it is expected to
19
receive a LEED Gold certification in the first half of 2007. EPA and GSA worked jointly on this project. Tough minimum environmental performance standards were included in the building’s Solicitation for Offers. A design competition process was used to award the lease with the environmental performance of the proposed building as a key evaluation factor.
Putting Green Building Into Practice: Boston Regional Office
In September 2006, GSA awarded a renovation contract for the McCormick Post Office and Courthouse in Boston, Massachusetts, for EPA’s Region 1 office. This historic 1930s structure will be converted into office space, and EPA, occupying approximately 225,000 square feet, will be the largest tenant. EPA and GSA worked together to “green” the building as much as possible given GSA’s limited budget. The project should achieve LEED certification.
Two other EPA green building projects progressed in FY 2006. In November 2005, the First Environments Early Learning Center (FEELC) opened on EPA’s campus in RTP. The state-ofthe art, 25,400 square foot childcare facility includes 20 classrooms, a large multipurpose room, a commercial-grade kitchen, infant care rooms, and a playground. The facility was designed and built to meet the LEED Silver certification for new construction, though it has not yet been certified. It features an ENERGY STAR-rated roof and high albedo concrete paving, which decreases heat absorption and reduces the amount of energy required for cooling. Energy-efficient lighting includes occupancy sensors and daylighting dimmers.
Construction continues on EPA’s new 42,400 square foot Research Support Annex #2, at the AWBERC facility. Scheduled for completion in April 2007, the Annex was designed to provide additional office space, freeing up office space in AWBERC facility that can be converted to accommodate new laboratories. The facility, which is expected to achieve LEED Gold certification, will feature a green roof and a plaza designed and constructed using sustainable materials and landscaping that enhances security.
IV. EPA REACHES 100 PERCENT GREEN POWER
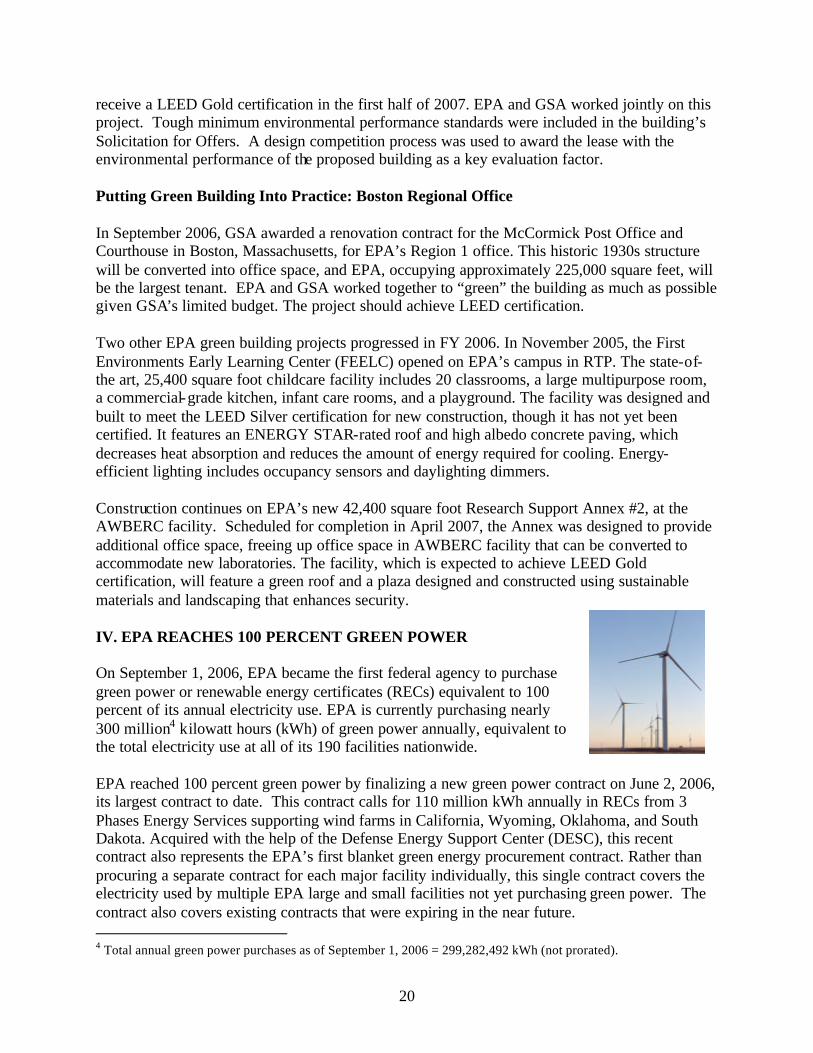
On September 1, 2006, EPA became the first federal agency to purchase green power or renewable energy certificates (RECs) equivalent to 100 percent of its annual electricity use. EPA is currently purchasing nearly 300 million4 kilowatt hours (kWh) of green power annually, equivalent to the total electricity use at all of its 190 facilities nationwide.
EPA reached 100 percent green power by finalizing a new green power contract on June 2, 2006, its largest contract to date. This contract calls for 110 million kWh annually in RECs from 3 Phases Energy Services supporting wind farms in California, Wyoming, Oklahoma, and South Dakota. Acquired with the help of the Defense Energy Support Center (DESC), this recent contract also represents the EPA’s first blanket green energy procurement contract. Rather than procuring a separate contract for each major facility individually, this single contract covers the electricity used by multiple EPA large and small facilities not yet purchasing green power. The contract also covers existing contracts that were expiring in the near future.
4 Total annual green power purchases as of September 1, 2006 = 299,282,492 kWh (not prorated).
20
New major facilities with green power from this contract include: o Denver, Colorado – National Enforcement Investigations Center (NEIC) o Gulf Breeze, Florida – Gulf Ecology Division Laboratory o Athens, Georgia - Office of Research and Development (ORD) o Ann Arbor, Michigan – National Vehicle and Fuel Emissions Laboratory (NVFEL) o Boston, Massachusetts Regional Office o Newport, Oregon – Pacific Coastal Ecology Branch Laboratory o Philadelphia, Pennsylvania Regional Office o Dallas, Texas Regional Office o Seattle, Washington Regional Office o About 100 two to 20-person field offices and specialty operations.
Major facilities whose expiring green power contracts were recompeted and extended include: o Chicago, Illinois - Region 5 Laboratory o Fort Meade, Maryland – Environmental Science Center (ESC) o Houston, Texas – Environmental Services Branch Laboratory
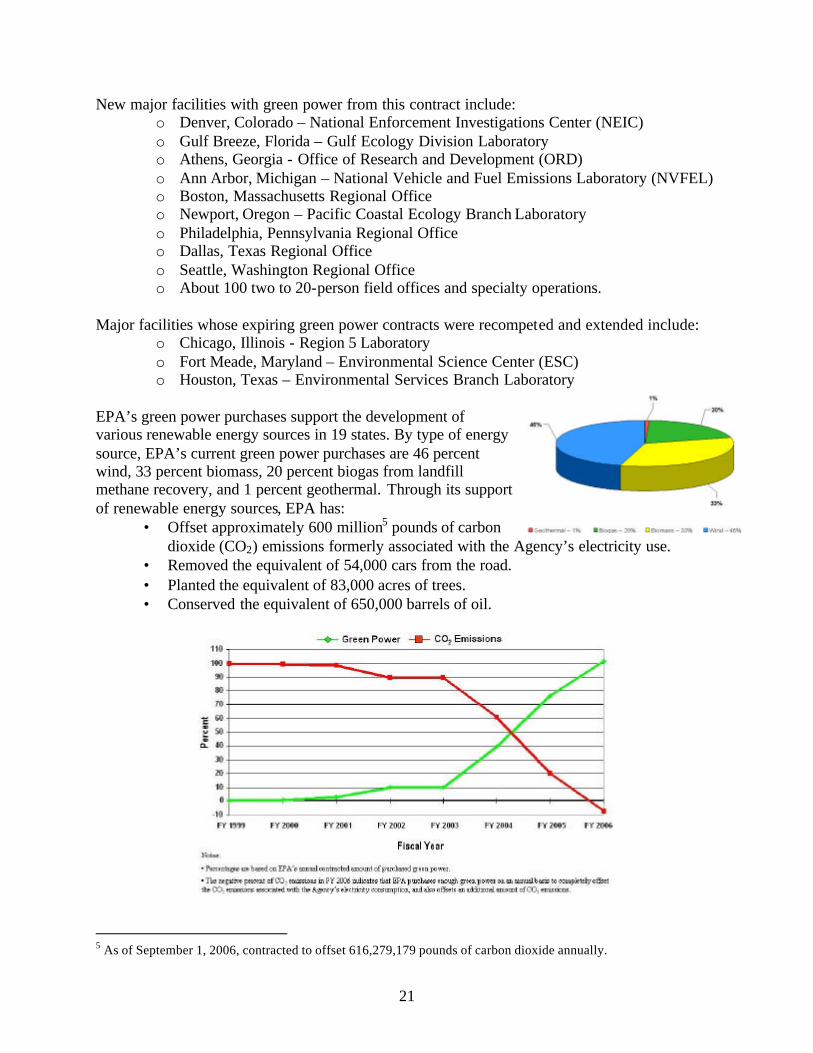
EPA’s green power purchases support the development of various renewable energy sources in 19 states. By type of energy source, EPA’s current green power purchases are 46 percent wind, 33 percent biomass, 20 percent biogas from landfill methane recovery, and 1 percent geothermal. Through its support of renewable energy sources, EPA has:
• Offset approximately 600 million5 pounds of carbon dioxide (CO2) emissions formerly associated with the Agency’s electricity use.
• Removed the equivalent of 54,000 cars from the road. • Planted the equivalent of 83,000 acres of trees. • Conserved the equivalent of 650,000 barrels of oil.
5 As of September 1, 2006, contracted to offset 616,279,179 pounds of carbon dioxide annually.
21
EPA’s consistent commitment to green power has also helped to improve green power markets. In 2006, the cost of RECs is 10 to 20 times less than when EPA first began purchasing green power in 1999.
In addition to the blanket purchase, in FY 2006 EPA procured two contracts and replaced a defaulted contract at the following locations:
� Arlington, Virginia: In December 2005, EPA finalized a green power contract to offset 100 percent of the annual electricity use at the new EPA Headquarters satellite complex in the Potomac Yard Buildings.. The three-year contract with 3 Phases Energy Services, procured with the help of the DESC, provides 4.2 million kWh of RECs per year to support wind farms in Nebraska, Minnesota, Oklahoma, and Wyoming.
� 1310 L Street, Washington, D.C.: In April 2006, EPA replaced the green power contract, which was in default, at this EPA Headquarters satellite office. The new three-year contract with Sterling Planet provides 4.5 million kWh per year of RECs that support several wind farms in Pennsylvania and West Virginia.
� Headquarters Satellite Sites, Washington, D.C.: In December 2005, with the help of DESC, EPA agreed to a contract to procure 8.25 million kWh of RECs per year. The three-year agreement with 3 Phases Energy Services will offset 100 percent of the annual electricity consumption at 12 other smaller EPA Headquarters locations by supporting wind farms in Nebraska, Minnesota, Oklahoma, and Wyoming.
SFPB has also entered into a partnership with ORD’s Air Pollution Prevention and Control Division in RTP to:
� Calculate 1990 EPA carbon emissions and EPA’s 2005 carbon emissions. � Determine the life cycle emissions of the various types of green power. � Determine areas of the country/electricity control areas where EPA should be buying
green power (to displace the most CO2 intensive conventional generation).
Through this research partnership, EPA hopes to improve the environmental results of its green power procurement program and assist other federal agencies with scientific information to support their green power procurement programs.
OARM continues to be a strong supporter of EPA Office of Air and Radiation’s (OAR’s) Green Power Partnership. Though EPA is a small agency, as of September 22, 2006, EPA was number two on the list of Top 10 Federal Green Power Partners based on kilowatt hours purchased annually, and number four on the list of Top 25 Federal, Private, and other Public Organization Purchases based on kilowatt hours purchased annually.
Self-Generated Renewable Energy
EPA continued to operate numerous renewable energy self-generation technologies in FY 2006:
22
� Solar Arrays: The Agency continued to operate a 100-kW PV array installed in April 2002 on the roof of the NCC in RTP and a 10 kW solar array installed on the roof of its Region 5 office in Chicago’s Metcalfe Federal Building in 2000. EPA’s Region 10 laboratory also continued operation of 28 solar panels with a combined 2 kW capacity.
� PV Lighting: EPA’s campus in RTP includes solar streetlights that have served the entrance road and parking lot facilities since FY 2002. The Agency believes this is the largest solar road lighting project in the United States.
� Solar Water-Heating Systems: In FY 2004, the Agency installed a solar water-heating system at its Region 9 Child Care and Fitness Center in San Francisco, California. EPA’s Region 2 laboratory in Edison, New Jersey, utilizes three solar water-heating systems that have been the primary source of hot water in their respective facilities since 1998. Each system helps augment its facility’s energy use by reducing the need for electricity and natural gas.
� Solar Power Awnings: EPA’s New England Regional Laboratory in Chelmsford, Massachusetts, has operated a PV awning system since September 2001. The 2-kW capacity awnings feed the regional electric grid and reduce cooling needs by providing shade for the facility’s office windows.
� Solar Wall: EPA’s Region 8 laboratory’s transpired solar collector has augmented the facility’s heating and cooling system since March 2002, generating approximately 1.38 MMBtus of solar power annually at the Golden, Colorado, facility.
� Ground-Source Heat Pump: A geothermal heat pump (GHP) was installed as part of the Robert S. Kerr Environmental Research Station’s ESPC upgrade in Ada, Oklahoma, in June 2004. This GHP generates approximately 7,800 MMBtus annually and reduces EPA’s need for primary fuels (electric and gas) accordingly.
� Lake Cooling Water: EPA’s Mid-Continent Ecology Division Laboratory in Duluth, Minnesota, uses water from nearby Lake Superior as non-contact cooling water for building air conditioning and other mechanical equipment, reducing energy and water costs. In FY 2006 the facility used about 76 million gallons of lake water for cooling.
EPA also completed a PV study for its Fort Meade Environmental Science Center. The proposed 20.4 kW system, with an estimated cost of at least $102,000 and estimated payback of 36 years, did not meet EPA’s economic viability criteria.
Currently EPA is:
� Completing the installation of a 10 kW PV system on the roof of its new Denver Region 8 office. Construction of the new Denver office should be completed in January 2007, with full occupancy in March 2007.
� Studying the feasibility of a 10 to 20 kW PV systems at the proposed Las Vegas, Nevada, Western Emergency Response Center.
23
� In the final stages of analysis of a 16 kW PV roof at its Gulf Breeze, Florida, Gulf Ecology Division laboratory.
� Initiating a feasibility study on building integrated photovoltaics associated with the renovation of one of the Manchester, Washington, Region 10 laboratory’s wings.
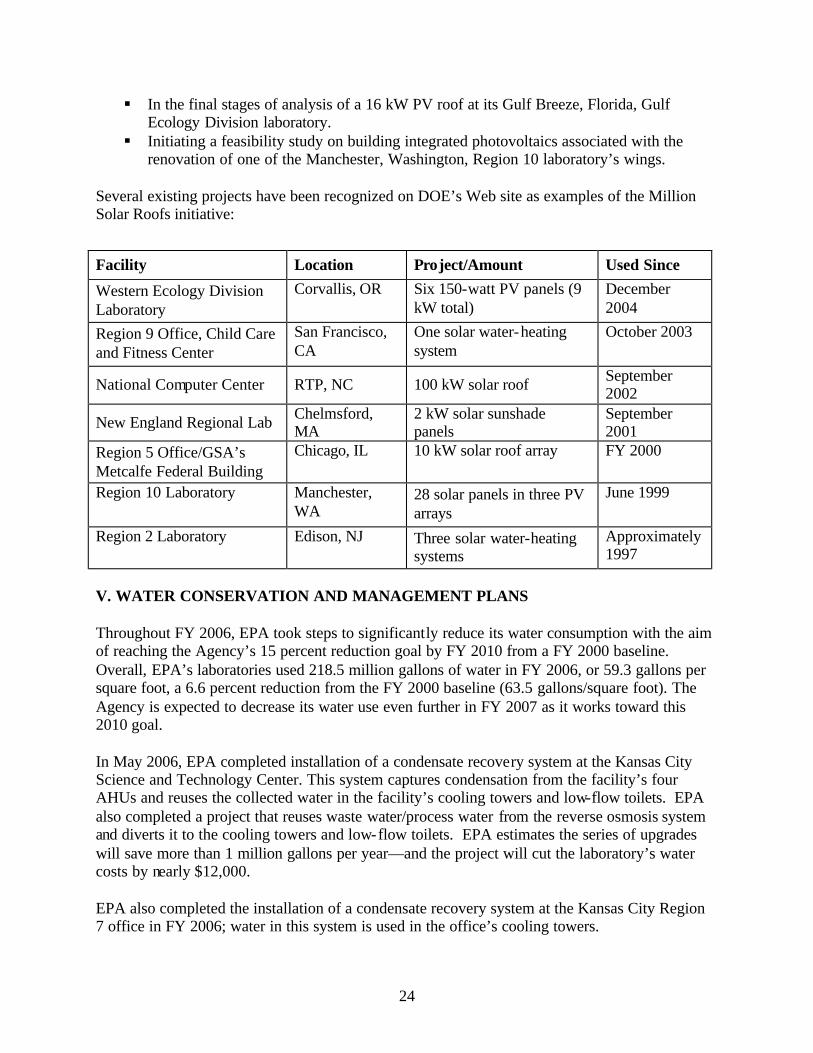
Several existing projects have been recognized on DOE’s Web site as examples of the Million Solar Roofs initiative:
Facility Location Project/Amount Used Since
Western Ecology Division Laboratory
Corvallis, OR Six 150-watt PV panels (9 kW total)
December 2004
Region 9 Office, Child Care and Fitness Center
San Francisco, CA
One solar water-heating system
October 2003
National Computer Center RTP, NC 100 kW solar roof September 2002
New England Regional Lab Chelmsford, MA
2 kW solar sunshade panels
September 2001
Region 5 Office/GSA’s Metcalfe Federal Building
Chicago, IL 10 kW solar roof array FY 2000
Region 10 Laboratory Manchester, WA
28 solar panels in three PV arrays
June 1999
Region 2 Laboratory Edison, NJ Three solar water-heating systems
Approximately 1997
V. WATER CONSERVATION AND MANAGEMENT PLANS
Throughout FY 2006, EPA took steps to significantly reduce its water consumption with the aim of reaching the Agency’s 15 percent reduction goal by FY 2010 from a FY 2000 baseline. Overall, EPA’s laboratories used 218.5 million gallons of water in FY 2006, or 59.3 gallons per square foot, a 6.6 percent reduction from the FY 2000 baseline (63.5 gallons/square foot). The Agency is expected to decrease its water use even further in FY 2007 as it works toward this 2010 goal.
In May 2006, EPA completed installation of a condensate recovery system at the Kansas City Science and Technology Center. This system captures condensation from the facility’s four AHUs and reuses the collected water in the facility’s cooling towers and low-flow toilets. EPA also completed a project that reuses waste water/process water from the reverse osmosis system and diverts it to the cooling towers and low-flow toilets. EPA estimates the series of upgrades will save more than 1 million gallons per year—and the project will cut the laboratory’s water costs by nearly $12,000.
EPA also completed the installation of a condensate recovery system at the Kansas City Region 7 office in FY 2006; water in this system is used in the office’s cooling towers.
24
In FY 2006, the Region 8 Laboratory in Golden, Colorado, continued plans for a xeriscaping project that would improve the facility’s stormwater runoff and replace all or part of the facility's currently irrigated turf with a sustainable landscape. If implemented, this project could save the facility about 750,000 gallons of water per year, or 17 percent of the laboratory’s total water consumption.
In September 2006, EPA completed an air compressor conversion project at the Atlantic Ecology Division Laboratory in Narragansett, Rhode Island. The project, which began in February 2006, replaced the laboratory’s existing air compressor unit with a more efficient system—one that cools with air instead of water. EPA estimates that the new system should reduce the facility’s annual water consumption by nearly 1 million gallons, and should save approximately $2,000 per year.
During FY 2006, as part of its ongoing commitment to efficient water management, EPA completed water assessments and signed water management plans at five of its laboratories, bringing the Agency’s total number of signed water management plans to 62 percent. EPA is well ahead of its requirements under E.O. 13123 to complete water management plans at 30 percent of its 29 reporting facilities. A water management plan was completed for EPA’s Region 2 laboratory in Edison, New Jersey, in April 2006. The facility will explore several methods to reduce water usage, including upgrading laboratory equipment, minimizing unnecessary usage from laboratory activities, and incorporating native vegetation into the facility’s landscape. Already, the Region 2 laboratory has largely eliminated irrigation water use; irrigated turf accounts for only 0.1 percent of the facility’s grounds.
EPA completed a water management plan for the Science and Ecosystem Support Division (SESD) Laboratory in Athens, Georgia, in July 2006. Building on existing water conservation efforts, the plan outlines strategies for reducing water consumption and improving water efficiency at the laboratory. For starters, EPA is evaluating the feasibility of installing faucet aerators, which would save an estimated 50,000 gallons of water and $250 per year. Additionally, EPA hopes to install an air handler condensate recovery system and a weather-based controller or soil moisture sensor, which should reduce water use by 15 to 20 percent by limiting irrigation when existing moisture levels are adequate. SESD will also evaluate its fish preparation area water usage—approximately 2 gallons per minute of well water—to see if the flow rate can be reduced without compromising performance.
EPA also finalized a water management plan for the Ecosystem Research Division (ERD) of the National Exposure Research Laboratory (NERL) in Athens, Georgia, in July 2006. This plan highlights the facility’s current methods for conserving water, which include the installation of a closed- loop heating system that captures and reuses 90 percent of the building’s steam water, as well as the replacement of single-pass cooling with air-cooled chiller units. In FY 2006, EPA replaced the building’s operational cooling tower and installed a second cooling tower to increase cooling capacity. This project should eliminate the need for supplemental cooling water added to the cooling tower. To further improve water efficiency, facility managers at NERL will evaluate the feasibility of installing an air handler condensate recovery system, as well as upgrades to the building’s sanitary fixtures that could save nearly 500,000 gallons of water and more than $7,000 per year.
25
EPA completed a water management plan for the Region 9 laboratory in Richmond, California, in August 2006. Under the environmental management system set forth in the plan, the laboratory will take steps to maintain water consumption at a FY 2003 baseline level of 418,132 gallons. To this end, EPA replaced all of the facility’s sanitary fixtures with water efficient models, and also switched from single-pass cooling to air-cooled chilling units. In addition, the Region 9 Laboratory will continue to promote water conservation among its employees through awareness campaigns and information postings.
VI. STORMWATER MANAGEMENT
In FY 2006 EPA continued to address the most common type of water pollution—stormwater runoff—through various stormwater management projects. Better management of stormwater through strategic site design, controlling the sources of runoff, and thoughtful landscape planning will help the Agency decrease stormwater runoff at various facilities.
In collaboration with the U.S. General Services Administration (GSA), EPA is demonstrating sustainable stormwater management practices and low-impact development (LID) in a landscape renovation project at its 25-acre Federal Triangle Headquarters campus in Washington, D.C. As a result of this multi-year, multi-phased program, the Agency will not only reduce the volume and pollution levels of its stormwater runoff, but also demonstrate that sustainable design and LID can be used in high profile, urban sites with rigorous aesthetic design requirements.
In 2005, EPA began construction on two phases of the stormwater management projects at Federal Triangle. The first phase includes construction of rain gardens and new plantings. The second phase, which was completed in Fall 2006, involves porous paving, native species planting, bio-retention cells, and a cistern to capture rainwater runoff. The third phase of the project involves installation of large cisterns to collect water from building roofs. The collected water will supply a high-efficiency irrigation system for the lawn and existing planting beds and will feature rain sensors and timers.
As part of a sustainability master plan at EPA’s National Exposure Research Laboratory in Athens, Georgia, a storm water detention pond is has been designed to meet current county standards for stormwater management. The pond will reduce sediment and pollution, leaving the site and improve aquifer recharge. The project will also slow release of stormwater to near pre-development conditions to reduce stream bank erosion downstream. EPA expects to let the construction contract for this pond and other improvements in FY 2007. The laboratory was built before stormwater management was considered an environmental concern and prior to local storm water management regulations. This is a pilot of a proposed stormwater management retrofit program, since most of EPA facilities were built before the current concepts of stormwater management had evolved.
VII. IMPROVING THE FACILITY DELIVERY PROCESS
Green buildings and sustainability are synergistic. Green buildings incorporate the principles of sustainable design; sustainability depends upon buildings’ environmental performance. EPA has
26
recently concentrated on this synergistic relationship in its ongoing effort to improve its facility delivery process. The Agency’s latest initiatives to modify the facility delivery process include tougher environmental performance experience and qualifications for architectural and engineering (A/E) service providers, sustainable master planning, and a “Green Check” process where project stakeholders collaboratively and formally develop and set down environmental performance goals for each major infrastructure project.
Effective in FY 2006, EPA hires only A/E providers with energy conservation, green building, and sustainability experience, as well as commissioning capabilities. In August 2006, EPA converted all national A/E contracts to five-year Indefinite Delivery/Indefinite Quality (ID/IQ) contracts. The Agency also awarded multiple A/E contracts, which encourage competing A/E providers to supply the highest level quality service. A/E firms submit a contractual proposal— which includes resumes of key personnel, team qualifications, and example projects—to EPA for review. While evaluating proposals, EPA looks for firms with a high number of LEED-accredited professionals and those with extensive experience in sustainable design.
EPA’s traditional long-term master planning process focused primarily on space and architectural needs, and the optimal location of ne w facilities on sites. As part of its efforts to improve the facility delivery process, EPA is expanding the scope of its master planning process to increase the consideration of environmental issues. The new master planning regime has already added a new, longer-term focus on mechanical systems. This will allow EPA to rationally migrate from older, energy- inefficient systems such as constant volume fume hood systems to more energy-efficient systems such as VAV fume hood systems over time. In addition, consideration of physical security issues has been added. The next areas to be institutionalized include enhanced evaluations of existing stormwater management impacts to assist with the Agency’s stormwater management retrofit program, and more in-depth landscape analysis to assist in EPA’s transition to native/low water/low management landscaping throughout its facility portfolio.
The sustainable master plan is also a cultural change in facility acquisition and delivery; it encourages service providers and project team members to collaborate and share ideas. Service providers examine their project tasks in relation to other providers’ tasks. By collaborating with others, team members may view the project holistically—actively observing how their roles and contributions fit into the project as a whole. As a result, the building process becomes streamlined, which in turn reduces cost, eliminates waste, and lessens unnecessary work. The Agencywide sustainable master planning contract was awarded in August 2006.
The purpose of Green Check is to encourage facility delivery team members to explore the option available to improve the environmental performance of a project and formally set environmental and energy goals for each project. Green Check consists of two steps. First, EPA branch chiefs and project team members meet to discuss a project’s procurement strategy, standard practice environmental goals, and new environmental goals. Then, once appropriate goals are agreed upon, each project team member signs a goals statement. The goals statement serves as a permanent record and target for the project, so that team members will have a clear understanding of the project’s environmental performance criteria. The environmental goals and specifications set by Green Check are tailored to each individual project. Given the diverse
27
locations and purposes of EPA buildings and the varied scope of projects, it is not possible to define a single set of goals that applies to all projects. Four pilot Green Check goals statements were completed or in process in FY 2006. All will be completed by December 31, 2006.
Sustainable Master Planning in Practice
As part of its overall architectural and engineering master planning conducted for its two lab Athens, Georgia, research campus in FY 2005, the Agency decided to incorporate long-term security and sustainability planning into the master planning process, which has given EPA the opportunity to consider numerous efficiency opportunities. The ORD laboratory consists primarily of older buildings with outdated, inefficient mechanical systems, and while the SESD laboratory operates relatively efficiently, both facilities stand to gain from planned measures.
In May 2006, EPA completed the master plan for the Athens ORD facility, EPA’s first holistic plan integrating safety, security, stormwater management considerations, and architecture and engineering.
Based on this Master Plan, at the end of FY 2006, EPA awarded a contract for the first phase designs, which will include the following:
• Construction of an emergency generator for the ORD laboratory to provide critical power in the case of a power outage. The planned emergency generator will be powered with diesel fuel, but the possibility exists for the construction of a clean burning natural gas microturbine instead, should EPA receive DOE funding.
• Construction of a stormwater detention pond to improve ORD’s stormwater management and sediment control (the SESD laboratory currently possesses a storm water detention pond).
• Upgrade of all of the HVAC equipment at the ORD laboratory to provide proper cooling and dehumidification in the summer.
• Campus-wide security upgrade, including the construction of a guard facility that serves the entire campus and a security barrier that incorporates architectural landscaping.
• Consolidation of laboratories and offices into fewer laboratory modules to create greater work and energy efficiencies.
• Replacement of the roof on the main ORD laboratory with a more energy-efficient roof.
The second phase designs are expected to be awarded in FY 2007 and will include the construction of a stand-alone central power plant and transition from constant volume to VAV systems.
At the end of FY 2006, EPA awarded a design contract for a master plan at its National Air and Radiation Environmental Laboratory, in Montgomery, Alabama, following the holistic planning model established at its laboratories in Athens, Georgia. The plan will incorporate safety, security, sustainability, and architecture and engineering as part of plans to renovate the existing laboratory and build a new emergency response center. EPA will upgrade primary building systems at the existing laboratory with new chillers, cooling towers, motors, pumps, and building controls. Additionally, the plan calls for creation of a central power plant at the existing facility
28
with enough capacity to also carry the load of the new emergency response center, which will save a substantial amount in terms of both energy consumption and utility costs.
In September 2006, EPA completed an architecture and engineering sustainable master plan for its Western Ecology Division (WED) Laboratory in Corvallis, Oregon. The overall goal of the master plan is to upgrade aging HVAC systems, renovate laboratory facilities, and consolidate diffuse operations into available space at its main laboratory complex. EPA will replace constant volume fume hoods with new state-of-the-art VAV systems and will improve ventilation controls to maintain pressure differentials and reduce cross-contamination risks. Other upgrades to temperature controls in administration/office areas and new double-glazed windows will enhance comfort, efficiency, and security at the facility. These renovations will allow EPA to consolidate 124 existing laboratory modules (some located at other nearby facilities) into 80 modules at the WED main laboratory and will allow EPA greater flexibility in expanding capacity at the main laboratory complex instead of relying on rented space at nearby locations. While stormwater management and landscape considerations were not included in the scope of this master plan, it did represent a significant step forward in making EPA’s master planning process more comprehensive.
VIII. POLLUTION PREVENTION
In FY 2006, EPA continued its effort to reduce its environmental impact by conducting recycling assessments at 10 facilities, in order to understand the recycling efforts already in place, begin to quantify the proportion of material recycled, and offer suggestions to further increase recycling at each facility.
• Region 4 office, Atlanta, Georgia • SESD laboratory, Athens, Georgia • ERD laboratory, Athens, Georgia • Region 6 office, Dallas, Texas • Region 7 office, Kansas City, Kansas • Science and Technology Center laboratory, Kansas City, Kansas • RTP New Main laboratory • Mid-Continent Ecology Division laboratory, Duluth, Minnesota • Region 10 office, Seattle, Washington • Region 10 laboratory, Manchester, Washington
Highlights from assessments at some of the following locations are presented below:
The Region 4 Office in Atlanta, Georgia, for example, has a strong recycling program in place that includes recycling batteries and filing cabinets through GSA. With a focus on office equipment, Region 4 also recycles cell phones, pagers, and toner cartridges; reuses office supplies; and continues to recycle electronic equipment through EPA’s Recycling Electronics and Asset Disposition contract (READ, see below) or donate it to Computers for Learning (CFL).
29
Recycling assessments were conducted at both the SESD and ERD facilities in Athens, Georgia. SESD entered into a new waste disposal and recycling contract in May 2006 that has greatly improved its recycling capabilities and also utilized a READ contract for the first time in November. With similar recycling capabilities already in place at ERD, the facility is planning to utilize the READ contract to recycle computers and continue to donate office supplies to be reused by local teachers. Spent solvents (such as methanol, acetone, hexane, methyl chloride, and isopropyl alcohol) are also collected, distilled, and reused by SESD employees.
Through its green team’s motto to recycle “anything that rips,” the Region 6 office in Dallas, Texas, has had excellent success in recycling all types of paper. The office collects reusable items to donate to local charities: unused hotel soap and shampoo are donated to a homeless shelter; pagers and eyeglasses to the Lion’s Club; and cassette tapes to Books for the Blind for recoding recipes on tape.
The recycling team is particularly vigilant at EPA’s Region 10 office in Seattle, Washington, with volunteer recycling monitors on each floor. The team carries out various initiatives to collect materials for recycling or reuse, including participating in the GreenDisk program to recycle “technotrash,” collecting sneakers for Nike’s Reuse-a-Shoe program, and donating other reusable materials to the YWCA Angeline’s Center for Homeless Women.
RTP’s New Main laboratory has implemented a chemical adoption program that redistributes unwanted supplies such as glassware, laboratory supplies, and chemicals. As part of the chemical adoption program, information about excess materials is entered into a database, and EPA employees can access these materials during the first two weeks, after which time materials are made available to schools and nonprofit organizations.
EPA Accepts the (Federal Electronics) Challenge
Through FY 2006, EPA offices and laboratories continued to expand its participation in the Federal Electronics Challenge (FEC), a program designed to reduce the environmental impact of computers and other electronics. Five new EPA facilities became FEC Partners, increasing the total number of participating EPA facilities to 21. In 2006, nearly all of the facilities previously participating were recognized with an award. EPA facilities received six gold, two silver, and six bronze awards for their success in reducing the environmental impacts of electronics during three, two, or one life-cycle phase(s), respectively. In addition, 23 EPA employees were recognized as FEC Champions for their dedication to the program, while 17 were recognized with Leadership Awards for their contributions to the development of the FEC Annual Reporting Form. The Agency plans to establish an inter- facility mentoring program to bring all EPA facilities closer to the gold level for FEC.
To further increase the environmental performance of electronics acquisitions, EPA, through its Office of Pollution Prevention and Toxic Substances, funded the development of the Electronic Products Environmental Assessment Tool (EPEAT), which was launched in July 2006. The aim of EPEAT is to identify high-performance, environmentally friendly computer equipment. Equipment is rated bronze, silver, or gold, as it meets increasingly stringent environmental performance criteria. As part of EPA’s effort to prevent electronic pollution, the Agency plans to
30

incorporate EPEAT language in to all new IT acquisitions. Such language has already been added to the contract for IT support services for the Office of Pesticides Program (OPP). EPEAT language will also be included in the blanket purchase agreement (BPA) for desktop and laptop computers. The BPA will help to ensure increased environmental performance in all of EPA’s electronics purchases.
During FY 2006, EPA also continued to reduce the environmental impact of electronic equipment at the final phase of its life cycle. The Recycling Electronics and Asset Disposition Services (READ) and Computers for Learning Program (CFL) continue to be effective methods for EPA to properly recycle electronics.
IX. MANAGEMENT, ADMINISTRATION, AND EDUCATION
Led by Assistant Administrator for Administration and Resources Management and Agency Environmental Executive Luis Luna, EPA works to encourage its employees’ commitment to improving energy efficiency. EPA’s SFPB under its Office of Administration and Resources Management (OARM) serves as an advocate, coordination point, and technical advisor on sustainable practices, policies, and project implementation to all of EPA’s facility-related organizations and personnel for both E.O. 13123 and EPAct 2005. EPA’s energy management team, consisting of the SFPB branch chief, two mechanical engineers, a water conservation/ green power coordinator, and a Laboratories for the 21st Century coordinator, uses awards, incentives, and performance evaluations, as well as continuing education and training programs, to support individual and team efforts in energy efficiency.
EPA actively participates in the Closing the Circle Awards, DOE’s Energy Management and Water Conservation Recognition program, the Presidential Energy Management Awards, and other opportunities for professional recognition where appropriate. EPA also presents annual “BTU Buster,” “H2OverAchiever,” Pollution Prevention, and other leadership awards to facility staff who demonstrate a commitment to achieving the Agency’s energy reduction and sustainability goals.
Laboratories for the 21st Century
Laboratories for the 21st Century (Labs21) is a voluntary partnership program dedicated to improving the environmental performance of U.S. laboratories. Co-sponsored by EPA and DOE, Labs21 is committed to the philosophy of building sustainable, high performance, and low-energy laboratories. More than 3,700 industry professionals are involved in the program through the Labs21 Network, which provides monthly updates on the various program components, including an annual conference, partnership and supporter programs, and a tool kit of technical resources.
Labs21 held its largest and greenest conference to date in FY 2006. From October 18 to 20, 2005, 545 architects, engineers, federal employees, facility managers, and other laboratory professionals convened in Portland, Oregon, to discuss the latest trends in sustainable laboratory design and construction. Eagleson Institute was the first nonprofit co-sponsor for the Labs21
31

conference. If co-sponsorship proves successful over the long run, EPA can focus its efforts to enhance the technical robustness of the Labs21 program.
In January 2006, EPA and DOE welcomed a new conference co-sponsor, the International Institute for Sustainable Laboratories (I2SL), which coordinated major segments of the Labs21 2006 Annual Conference, held October 17-19, 2006, in San Antonio, Texas. Together with EPA and DOE, I2SL will help to promote the goals of Labs21 and build a foundation on which to secure the future success of the program.
In addition to the annual conference, Labs21 introductory and advanced training courses trained nearly 500 people in seven different locations throughout the country in FY 2006. Labs21 completed two new case studies and two best practices guides as part of its tool kit of resources that supports the design, construction, and operation of high-performance laboratories.
The success of the Labs21 program is tracked through energy (Btus per square foot) and dollar savings achieved from Labs21 Partner projects, use of the Labs21 Environmental Performance Criteria—a rating system developed specifically for laboratories, use of the Labs21 benchmarking tool—a Web-based database tool that allows users to compare the energy performance of their laboratory facilities to similar facilities, and attendance at the Labs21 Annual Conference and training courses. With nine new Partners joining the program in FY 2006, there are now 40 federal and private sector organizations committed to support sustainable laboratory design and operations. EPA calculates that the 19 active Labs21 Partner projects have saved more than 533 billion Btus. The Labs21 Web site (www.labs21century.gov) provides additional information on the program, including regularly updated conference details, opportunities to join the program as a Partner or Supporter, and the online Tool Kit.
Education and Outreach
In other efforts to educate employees on the importance of environmental performance, Energizing EPA is an internal newsletter that highlights the Agency’s efforts to improve overall sustainability, including energy and water efficiency, at its facilities. The newsletter is produced on a quarterly basis and distributed electronically to all EPA employees to educate them about such issues as energy efficiency, green power, green buildings, alternative energy, recycling programs, water conservation, and low-impact development/stormwater management.
EPA’s Office of Administrative Services also continues to maintain and enhance its public Web site on sustainability at the Agency (www.epa.gov/greeningepa). The Web site is a central source of information about energy efficiency approaches and projects, renewable energy procurement, and green buildings developed by and for the EPA. The site also provides information on facility gross square footage, energy and water consumption data, facility manager contact information, and green building highlights for each major facility EPA occupies. In FY 2006, the Web site received more than one million “hits” from interested viewers, or an average of more than 83,000 visits to the site per month.
32
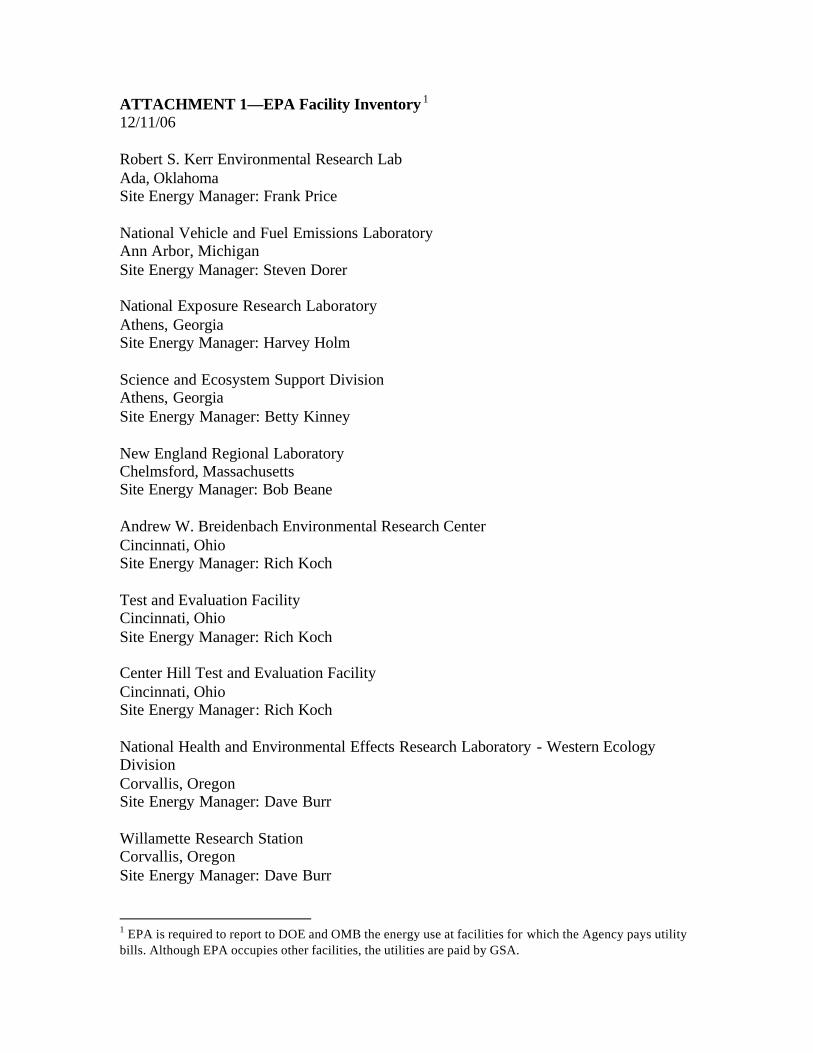
ATTACHMENT 1—EPA Facility Inventory 1
12/11/06
Robert S. Kerr Environmental Research Lab Ada, Oklahoma Site Energy Manager: Frank Price
National Vehicle and Fuel Emissions Laboratory Ann Arbor, Michigan Site Energy Manager: Steven Dorer
National Exposure Research Laboratory Athens, Georgia Site Energy Manager: Harvey Holm
Science and Ecosystem Support Division Athens, Georgia Site Energy Manager: Betty Kinney
New England Regional Laboratory Chelmsford, Massachusetts Site Energy Manager: Bob Beane
Andrew W. Breidenbach Environmental Research Center Cincinnati, Ohio Site Energy Manager: Rich Koch
Test and Evaluation Facility Cincinnati, Ohio Site Energy Manager: Rich Koch
Center Hill Test and Evaluation Facility Cincinnati, Ohio Site Energy Manager: Rich Koch
National Health and Environmental Effects Research Laboratory - Western Ecology Division Corvallis, Oregon Site Energy Manager: Dave Burr
Willamette Research Station Corvallis, Oregon Site Energy Manager: Dave Burr
1 EPA is required to report to DOE and OMB the energy use at facilities for which the Agency pays utility bills. Although EPA occupies other facilities, the utilities are paid by GSA.
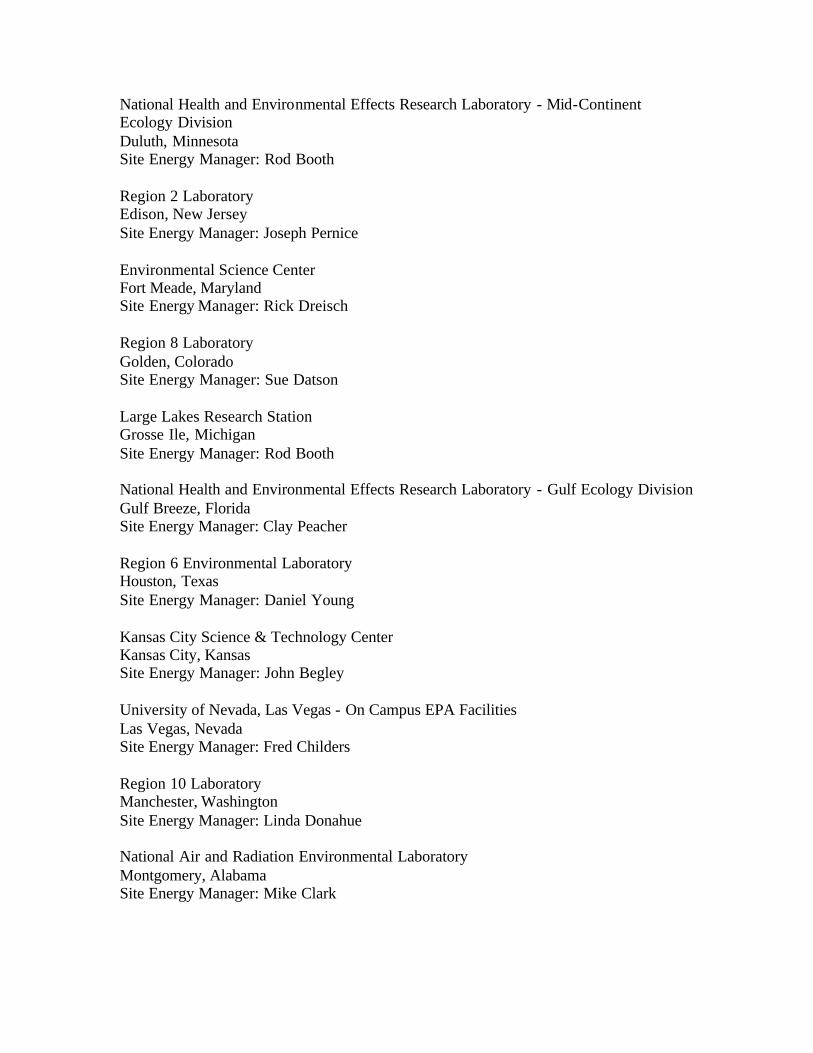
National Health and Environmental Effects Research Laboratory - Mid-Continent Ecology Division Duluth, Minnesota Site Energy Manager: Rod Booth
Region 2 Laboratory Edison, New Jersey Site Energy Manager: Joseph Pernice
Environmental Science Center Fort Meade, Maryland Site Energy Manager: Rick Dreisch
Region 8 Laboratory Golden, Colorado Site Energy Manager: Sue Datson
Large Lakes Research Station Grosse Ile, Michigan Site Energy Manager: Rod Booth
National Health and Environmental Effects Research Laboratory - Gulf Ecology Division Gulf Breeze, Florida Site Energy Manager: Clay Peacher
Region 6 Environmental Laboratory Houston, Texas Site Energy Manager: Daniel Young
Kansas City Science & Technology Center Kansas City, Kansas Site Energy Manager: John Begley
University of Nevada, Las Vegas - On Campus EPA Facilities Las Vegas, Nevada Site Energy Manager: Fred Childers
Region 10 Laboratory Manchester, Washington Site Energy Manager: Linda Donahue
National Air and Radiation Environmental Laboratory Montgomery, Alabama Site Energy Manager: Mike Clark

National Health and Environmental Effects Research Laboratory - Atlantic Ecology Division Narragansett, Rhode Island Site Energy Manager: Russ Ahlgren
National Health and Environmental Effects Research Laboratory - Western Ecology Division Newport, Oregon Site Energy Manager: Dave Burr
New Consolidated Facility Research Triangle Park, North Carolina Site Energy Manager: Alex Montilla
New Computer Center Research Triangle Park, North Carolina Site Energy Manager: Alex Montilla
National Health and Environmental Effects Research Laboratory Research Triangle Park, North Carolina Site Energy Manager: Alex Montilla
Human Studies Facility Research Triangle Park (Chapel Hill), North Carolina Site Energy Manager: Alex Montilla
New Page Road Research Triangle Park, North Carolina Site Energy Manager: Alex Montilla
Central Regional Laboratory Richmond, California Site Energy Manager: Jennifer Mann

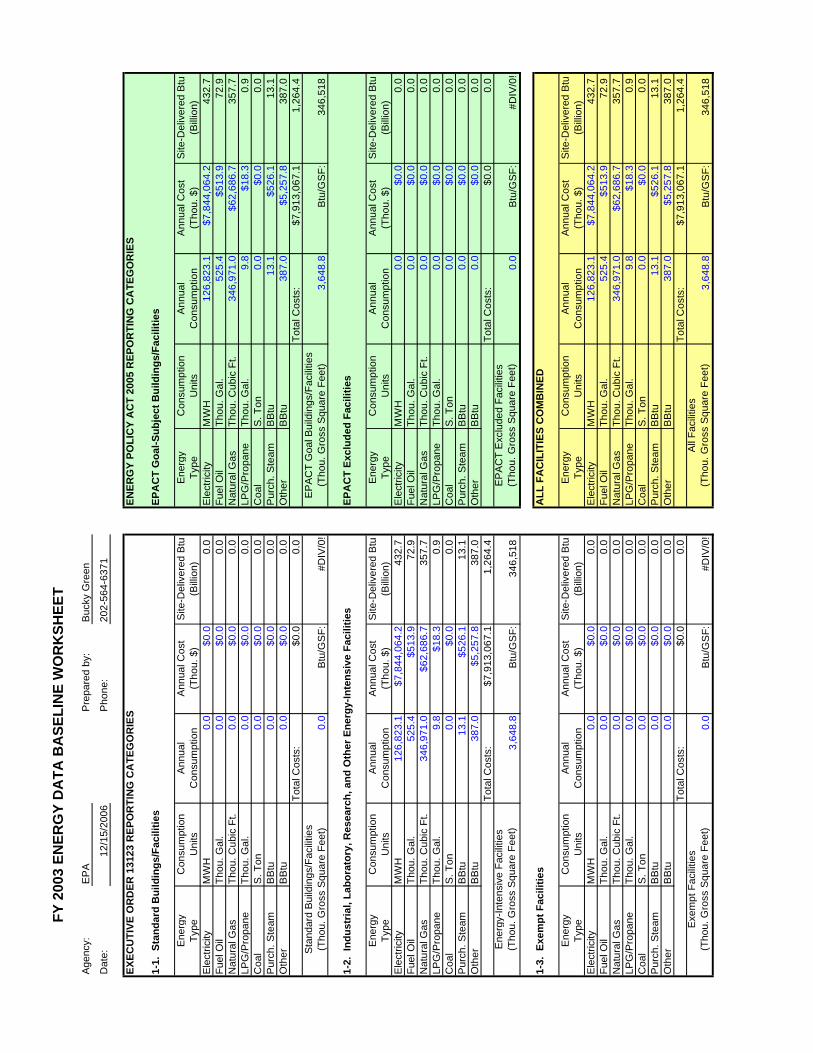
FY
200
3 E
NE
RG
Y D
AT
A B
AS
EL
INE
WO
RK
SH
EE
T
Age
ncy:
E
PA
P
repa
red
by:
Buc
ky G
reen
Dat
e:
12/1
5/20
06
Pho
ne:
202-
564-
6371
EX
EC
UT
IVE
OR
DE
R 1
3123
RE
PO
RT
ING
CA
TE
GO
RIE
S
1-1.
Sta
nd
ard
Bu
ildin
gs/
Fac
iliti
es
Ene
rgy
Typ
e C
onsu
mpt
ion
Uni
ts
Ann
ual
Con
sum
ptio
n A
nnua
l Cos
t (T
hou.
$)
Site
-Del
iver
ed B
tu
(Bill
ion)
E
lect
ricity
M
WH
0.
0 $0
.0
0.0
Fue
l Oil
Tho
u. G
al.
0.0
$0.0
0.
0 N
atur
al G
as
Tho
u. C
ubic
Ft.
0.0
$0.0
0.
0 LP
G/P
ropa
ne
Tho
u. G
al.
0.0
$0.0
0.
0 C
oal
S. T
on
0.0
$0.0
0.
0 P
urch
. Ste
am
BB
tu
0.0
$0.0
0.
0 O
ther
B
Btu
0.
0 $0
.0
0.0
Tot
al C
osts
: $0
.0
0.0
Sta
ndar
d B
uild
ings
/Fac
ilitie
s (T
hou.
Gro
ss S
quar
e F
eet)
0.
0 B
tu/G
SF
: #D
IV/0
!
1-2.
In
du
stri
al, L
abo
rato
ry, R
esea
rch
, an
d O
ther
En
erg
y-In
ten
sive
Fac
iliti
es
Ene
rgy
Typ
e C
onsu
mpt
ion
Uni
ts
Ann
ual
Con
sum
ptio
n A
nnua
l Cos
t (T
hou.
$)
Site
-Del
iver
ed B
tu
(Bill
ion)
E
lect
ricity
M
WH
12
6,82
3.1
$7,8
44,0
64.2
43
2.7
Fue
l Oil
Tho
u. G
al.
525.
4 $5
13.9
72
.9
Nat
ural
Gas
T
hou.
Cub
ic F
t. 34
6,97
1.0
$62,
686.
7 35
7.7
LPG
/Pro
pane
T
hou.
Gal
. 9.
8 $1
8.3
0.9
Coa
l S
. Ton
0.
0 $0
.0
0.0
Pur
ch. S
team
B
Btu
13
.1
$526
.1
13.1
O
ther
B
Btu
38
7.0
$5,2
57.8
38
7.0
Tot
al C
osts
: $7
,913
,067
.1
1,26
4.4
Ene
rgy-
Inte
nsiv
e F
acili
ties
(Tho
u. G
ross
Squ
are
Fee
t)
3,64
8.8
Btu
/GS
F:
346,
518
1-3.
Exe
mp
t F
acili
ties
Ene
rgy
Typ
e C
onsu
mpt
ion
Uni
ts
Ann
ual
Con
sum
ptio
n A
nnua
l Cos
t (T
hou.
$)
Site
-Del
iver
ed B
tu
(Bill
ion)
E
lect
ricity
M
WH
0.
0 $0
.0
0.0
Fue
l Oil
Tho
u. G
al.
0.0
$0.0
0.
0 N
atur
al G
as
Tho
u. C
ubic
Ft.
0.0
$0.0
0.
0 LP
G/P
ropa
ne
Tho
u. G
al.
0.0
$0.0
0.
0 C
oal
S. T
on
0.0
$0.0
0.
0 P
urch
. Ste
am
BB
tu
0.0
$0.0
0.
0 O
ther
B
Btu
0.
0 $0
.0
0.0
Tot
al C
osts
: $0
.0
0.0
Exe
mpt
Fac
ilitie
s (T
hou.
Gro
ss S
quar
e F
eet)
0.
0 B
tu/G
SF
: #D
IV/0
!
EN
ER
GY
PO
LIC
Y A
CT
200
5 R
EP
OR
TIN
G C
AT
EG
OR
IES
EP
AC
T G
oal
-Su
bje
ct B
uild
ing
s/F
acili
ties
Ene
rgy
Typ
e C
onsu
mpt
ion
Uni
ts
Ann
ual
Con
sum
ptio
n A
nnua
l Cos
t (T
hou.
$)
Site
-Del
iver
ed B
tu
(Bill
ion)
E
lect
ricity
M
WH
12
6,82
3.1
$7,8
44,0
64.2
43
2.7
Fue
l Oil
Tho
u. G
al.
525.
4 $5
13.9
72
.9
Nat
ural
Gas
T
hou.
Cub
ic F
t. 34
6,97
1.0
$62,
686.
7 35
7.7
LPG
/Pro
pane
T
hou.
Gal
. 9.
8 $1
8.3
0.9
Coa
l S
. Ton
0.
0 $0
.0
0.0
Pur
ch. S
team
B
Btu
13
.1
$526
.1
13.1
O
ther
B
Btu
38
7.0
$5,2
57.8
38
7.0
Tot
al C
osts
: $7
,913
,067
.1
1,26
4.4
EP
AC
T G
oal B
uild
ings
/Fac
ilitie
s (T
hou.
Gro
ss S
quar
e F
eet)
3,
648.
8 B
tu/G
SF
: 34
6,51
8
EP
AC
T E
xclu
ded
Fac
iliti
es
Ene
rgy
Typ
e C
onsu
mpt
ion
Uni
ts
Ann
ual
Con
sum
ptio
n A
nnua
l Cos
t (T
hou.
$)
Site
-Del
iver
ed B
tu
(Bill
ion)
E
lect
ricity
M
WH
0.
0 $0
.0
0.0
Fue
l Oil
Tho
u. G
al.
0.0
$0.0
0.
0 N
atur
al G
as
Tho
u. C
ubic
Ft.
0.0
$0.0
0.
0 LP
G/P
ropa
ne
Tho
u. G
al.
0.0
$0.0
0.
0 C
oal
S. T
on
0.0
$0.0
0.
0 P
urch
. Ste
am
BB
tu
0.0
$0.0
0.
0 O
ther
B
Btu
0.
0 $0
.0
0.0
Tot
al C
osts
: $0
.0
0.0
EP
AC
T E
xclu
ded
Fac
ilitie
s (T
hou.
Gro
ss S
quar
e F
eet)
0.
0 B
tu/G
SF
: #D
IV/0
!
AL
L F
AC
ILIT
IES
CO
MB
INE
D
Ene
rgy
Typ
e C
onsu
mpt
ion
Uni
ts
Ann
ual
Con
sum
ptio
n A
nnua
l Cos
t (T
hou.
$)
Site
-Del
iver
ed B
tu
(Bill
ion)
E
lect
ricity
M
WH
12
6,82
3.1
$7,8
44,0
64.2
43
2.7
Fue
l Oil
Tho
u. G
al.
525.
4 $5
13.9
72
.9
Nat
ural
Gas
T
hou.
Cub
ic F
t. 34
6,97
1.0
$62,
686.
7 35
7.7
LPG
/Pro
pane
T
hou.
Gal
. 9.
8 $1
8.3
0.9
Coa
l S
. Ton
0.
0 $0
.0
0.0
Pur
ch. S
team
B
Btu
13
.1
$526
.1
13.1
O
ther
B
Btu
38
7.0
$5,2
57.8
38
7.0
Tot
al C
osts
: $7
,913
,067
.1
1,26
4.4
All
Fac
ilitie
s (T
hou.
Gro
ss S
quar
e F
eet)
3,
648.
8 B
tu/G
SF
: 34
6,51
8


FY 2
006
EN
ER
GY
MA
NA
GE
ME
NT
DA
TA R
EP
OR
T
Age
ncy:
E
nviro
nmen
tal P
rote
ctio
n A
genc
y P
repa
red
by:
Buc
ky G
reen
Dat
e:
12/1
5/20
06
Pho
ne:
202-
564-
6371
PA
RT
1: E
NE
RG
Y C
ON
SU
MP
TIO
N A
ND
CO
ST
DA
TA
1-1.
EP
AC
T G
oal
Su
bje
ct B
uild
ing
s
Ene
rgy
Typ
e C
onsu
mpt
ion
Uni
ts
Ann
ual
Con
sum
ptio
n A
nnua
l Cos
t (T
hou.
$)
Uni
t Cos
t ($)
S
ite-D
eliv
ered
B
tu (
Bill
ion)
E
st. S
ourc
e B
tu
(Bill
ion)
Est
. Car
bon
Em
issi
ons
(Met
ric
Ton
s)
Ele
ctric
ity
MW
H
134,
447.
6 9,
626.
8 $0
.07
/kW
h 45
8.7
1,59
3.2
22,9
55
Fue
l Oil
Tho
u. G
al.
231.
1 43
4.2
1.87
8378
448
/gal
lon
32.1
32
.1
640
Nat
ural
Gas
T
hou.
Cub
ic F
t. 36
0,49
8.4
4,30
3.9
$11.
94
/Tho
u C
u F
t 37
1.7
371.
7 5,
378
LPG
/Pro
pane
T
hou.
Gal
. 7.
6 17
.2
$2.2
6 /g
allo
n 0.
7 0.
7 12
C
oal
S. T
on
0.0
0.0
#DIV
/0!
/S. T
on
0.0
0.0
0 P
urch
. Ste
am
BB
tu
28.4
79
8.9
$28.
11
/MM
Btu
28
.4
39.5
1,
017
Oth
er
BB
tu
360.
9 6,
115.
7 $1
6.95
/M
MB
tu
360.
9 36
0.9
Tot
al C
osts
: 21
,296
.6
Tot
al:
1,25
2.5
2,39
8.1
30,0
02
Goa
l Sub
ject
Bui
ldin
gs
(Tho
u. G
ross
Squ
are
Fee
t)
3,68
2.6
Btu
/GS
F:
340,
112
651,
184
Btu
/GS
F w
/ RE
P
urch
ase
Cre
dit:
189,
658
128,
779
Btu
/GS
F w
/ RE
&
Sec
. 502
(e)
Cre
dit:
189,
658
128,
779
1-2.
EP
AC
T G
oal
Exc
lud
ed F
acili
ties
E
st. C
arbo
n E
nerg
y C
onsu
mpt
ion
Ann
ual
Ann
ual C
ost
Site
-Del
iver
ed
Est
. Sou
rce
Btu
E
mis
sion
s (M
etric
T
ype
Uni
ts
Con
sum
ptio
n (T
hou.
$)
Btu
(B
illio
n)
(Bill
ion)
T
ons)
E
lect
ricity
U
nit C
ost (
$)
MW
H
0.0
$0.0
#D
IV/0
! /k
Wh
0.0
0.0
0 F
uel O
il T
hou.
Gal
. 0.
0 $0
.0
#DIV
/0!
/gal
lon
0.0
0.0
0 N
atur
al G
as
Tho
u. C
ubic
Ft.
0.0
$0.0
#D
IV/0
! /T
hou
Cu
Ft
0.0
0.0
0 LP
G/P
ropa
ne
Tho
u. G
al.
0.0
$0.0
#D
IV/0
! /g
allo
n 0.
0 0.
0 0
Coa
l S
. Ton
0.
0 $0
.0
#DIV
/0!
/S. T
on
0.0
0.0
0 P
urch
. Ste
am
BB
tu
0.0
$0.0
#D
IV/0
! /M
MB
tu
0.0
0.0
0 O
ther
B
Btu
0.
0 $0
.0
#DIV
/0!
/MM
Btu
0.
0 0.
0 T
otal
Cos
ts:
$0.0
T
otal
: 0.
0 0.
0 0
Goa
l Exc
lude
d F
acili
ties
(Tho
u. G
ross
Squ
are
Fee
t)
0.0
Btu
/GS
F:
#DIV
/0!
#DIV
/0!
Btu
/GS
F w
/ RE
P
urch
ase
Cre
dit:
#DIV
/0!
#DIV
/0!
Btu
/GS
F w
/ RE
&
Sec
. 502
(e)
Cre
dit:
#DIV
/0!
#DIV
/0!

1-3.
No
n-F
leet
Veh
icle
s an
d O
ther
Eq
uip
men
t
Con
sum
ptio
n U
nits
A
nnua
l C
onsu
mpt
ion
Ann
ual C
ost
(Tho
u. $
) U
nit C
ost (
$)
Btu
(B
illio
n)
Est
. Car
bon
Em
issi
ons
(Met
ric
Ton
s)
Aut
o G
asol
ine
Tho
u. G
al.
7.0
$21.
0 $3
.00
/gal
lon
0.9
17
Die
sel-D
istil
late
T
hou.
Gal
. 37
2.0
$775
.0
$2.0
8 /g
allo
n 51
.6
1,02
9 LP
G/P
ropa
ne
Tho
u. G
al.
0.0
$0.0
#D
IV/0
! /g
allo
n 0.
0 0
Avi
atio
n G
asol
ine
Tho
u. G
al.
0.0
$0.0
#D
IV/0
! /g
allo
n 0.
0 0
Jet F
uel
Tho
u. G
al.
0.0
$0.0
#D
IV/0
! /g
allo
n 0.
0 0
Nav
y S
peci
al
Tho
u. G
al.
0.0
$0.0
#D
IV/0
! /g
allo
n 0.
0 0
Oth
er
BB
tu
0.0
$0.0
#D
IV/0
! /M
MB
tu
0.0
Tot
al C
osts
$7
96.0
52
.5
1,04
6
1-4.
WA
TE
R C
ON
SU
MP
TIO
N, C
OS
T A
ND
EF
FIC
IEN
CY
ME
AS
UR
ES
Con
sum
ptio
n U
nits
A
nnua
l C
onsu
mpt
ion
Ann
ual C
ost
(Tho
u. $
) W
ater
M
illio
n G
al.
218.
5 $1
,247
.9
Bes
t Man
agem
ent P
ract
ice
Impl
emen
tatio
n T
rack
ing
Dat
a
Num
ber
of fa
cilit
ies*
in a
genc
y in
vent
ory
29
Num
ber
of fa
cilit
ies
with
com
plet
ed w
ater
man
agem
ent
plan
s 18
N
umbe
r of
faci
litie
s w
ith a
t lea
st fo
ur (
4) B
MP
s fu
lly
impl
emen
ted
18
*num
ber
in th
e ag
ency
inve
ntor
y, c
an b
e bu
ildin
gs, b
ases
, or
cam
puse
s
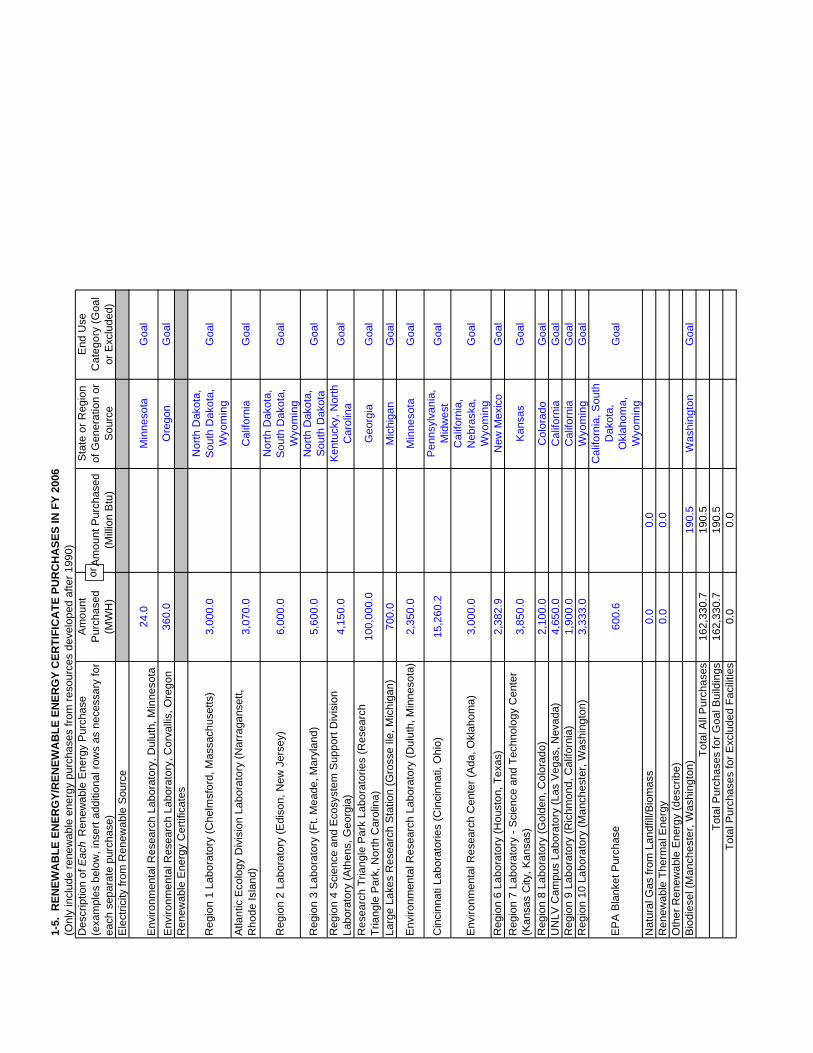
1-5.
RE
NE
WA
BL
E E
NE
RG
Y/R
EN
EW
AB
LE
EN
ER
GY
CE
RT
IFIC
AT
E P
UR
CH
AS
ES
IN F
Y 2
006
(Onl
y in
clud
e re
new
able
ene
rgy
purc
hase
s fr
om r
esou
rces
dev
elop
ed a
fter
1990
) A
mou
nt
Sta
te o
r R
egio
n E
nd U
se
(exa
mpl
es b
elow
, ins
ert a
dditi
onal
row
s as
nec
essa
ry fo
r D
escr
iptio
n of
Eac
h R
enew
able
Ene
rgy
Pur
chas
e P
urch
ased
or
Am
ount
Pur
chas
ed
of G
ener
atio
n or
C
ateg
ory
(Goa
l ea
ch s
epar
ate
purc
hase
) (M
WH
) (M
illio
n B
tu)
Sou
rce
or E
xclu
ded)
E
lect
ricity
from
Ren
ewab
le S
ourc
e
24.0
M
inne
sota
G
oal
Env
ironm
enta
l Res
earc
h La
bora
tory
, Dul
uth,
Min
neso
ta
Env
ironm
enta
l Res
earc
h La
bora
tory
, Cor
valli
s, O
rego
n 36
0.0
Ore
gon
Goa
l R
enew
able
Ene
rgy
Cer
tific
ates
N
orth
Dak
ota,
R
egio
n 1
Labo
rato
ry (
Che
lmsf
ord,
Mas
sach
uset
ts)
3,00
0.0
Sou
th D
akot
a,
Goa
l W
yom
ing
Atla
ntic
Eco
logy
Div
isio
n La
bora
tory
(N
arra
gans
ett,
3,07
0.0
Cal
iforn
ia
Goa
lR
hode
Isla
nd)
Nor
th D
akot
a,
Reg
ion
2 La
bora
tory
(E
diso
n, N
ew J
erse
y)
6,00
0.0
Sou
th D
akot
a,
Goa
l W
yom
ing
Nor
th D
akot
a,R
egio
n 3
Labo
rato
ry (
Ft.
Mea
de, M
aryl
and)
5,
600.
0 G
oal
Sou
th D
akot
a R
egio
n 4
Sci
ence
and
Eco
syst
em S
uppo
rt D
ivis
ion
Ken
tuck
y, N
orth
4,15
0.0
Goa
lLa
bora
tory
(A
then
s, G
eorg
ia)
Car
olin
a R
esea
rch
Tria
ngle
Par
k La
bora
torie
s (R
esea
rch
100,
000.
0 G
eorg
ia
Goa
lT
riang
le P
ark,
Nor
th C
arol
ina)
La
rge
Lake
s R
esea
rch
Sta
tion
(Gro
sse
Ile, M
ichi
gan)
70
0.0
Mic
higa
n G
oal
Env
ironm
enta
l Res
earc
h La
bora
tory
(D
ulut
h, M
inne
sota
) 2,
350.
0 M
inne
sota
G
oal
Pen
nsyl
vani
a,C
inci
nnat
i Lab
orat
orie
s (C
inci
nnat
i, O
hio)
15
,260
.2
Goa
lM
idw
est
Cal
iforn
ia,
Env
ironm
enta
l Res
earc
h C
ente
r (A
da, O
klah
oma)
3,
000.
0 N
ebra
ska,
G
oal
Wyo
min
g R
egio
n 6
Labo
rato
ry (
Hou
ston
, Tex
as)
2,38
2.9
New
Mex
ico
Goa
l R
egio
n 7
Labo
rato
ry -
Sci
ence
and
Tec
hnol
ogy
Cen
ter
3,85
0.0
Kan
sas
Goa
l(K
ansa
s C
ity, K
ansa
s)
Reg
ion
8 La
bora
tory
(G
olde
n, C
olor
ado)
2,
100.
0 C
olor
ado
Goa
l U
NLV
Cam
pus
Labo
rato
ry (
Las
Veg
as, N
evad
a)
4,65
0.0
Cal
iforn
ia
Goa
l R
egio
n 9
Labo
rato
ry (
Ric
hmon
d, C
alifo
rnia
) 1,
900.
0 C
alifo
rnia
G
oal
Reg
ion
10 L
abor
ator
y (M
anch
este
r, W
ashi
ngto
n)
3,33
3.0
Wyo
min
g G
oal
Cal
iforn
ia, S
outh
D
akot
a,E
PA
Bla
nket
Pur
chas
e 60
0.6
Goa
lO
klah
oma,
W
yom
ing
Nat
ural
Gas
from
Lan
dfill
/Bio
mas
s 0.
0 0.
0 R
enew
able
The
rmal
Ene
rgy
0.0
0.0
Oth
er R
enew
able
Ene
rgy
(des
crib
e)
Bio
dies
el (
Man
ches
ter,
Was
hing
ton)
19
0.5
Was
hing
ton
Goa
l T
otal
All
Pur
chas
es
162,
330.
7 19
0.5
Tot
al P
urch
ases
for
Goa
l Bui
ldin
gs
162,
330.
7 19
0.5
Tot
al P
urch
ases
for
Exc
lude
d F
acili
ties
0.0
0.0

1-6.
SE
LF
-GE
NE
RA
TE
D R
EN
EW
AB
LE
EN
ER
GY
INS
TA
LL
ED
AF
TE
R 1
990
1-7.
TO
TAL
RE
NE
WA
BLE
EN
ER
GY
US
E A
S A
PE
RC
EN
TAG
E
OF
FA
CIL
ITY
EL
EC
TR
ICIT
Y U
SE
Ele
ctric
ity fr
om
Ren
ewab
les
Nat
ural
Gas
from
La
ndfil
l/Bio
mas
sR
enew
able
T
herm
al E
nerg
y**
Oth
er R
enew
able
E
nerg
y___
____
***
Con
sum
ptio
n U
nits
MW
H
MM
Btu
MM
Btu
MM
Btu
Tot
al A
nnua
l E
nerg
y 115.
8
0.0
8,26
2.4
0.0
Ene
rgy
Use
d by
A
genc
y* 11
5.8
0.0
8,26
2.4
0.0
Ren
ewab
le
Ene
rgy
Use
(B
Btu
) 562.
7
Fac
ility
Ele
ctric
ity
Use
(B
Btu
)
458.
7
RE
as
a
Per
cent
age
of
Ele
ctric
ity U
se
122.
7%
*Ene
rgy
used
by
agen
cy e
qual
s to
tal a
nnua
l gen
erat
ion
unle
ss a
pro
ject
sel
ls a
por
tion
of th
e en
ergy
it p
rodu
ces
to
anot
her
agen
cy o
r th
e pr
ivat
e se
ctor
. It c
an e
qual
zer
o in
the
case
of n
on-F
eder
al e
nerg
y pr
ojec
ts d
evel
oped
on
Fed
eral
land
. **
Exa
mpl
es a
re g
eoth
erm
al, s
olar
ther
mal
, and
geo
ther
mal
hea
t pum
ps, a
nd th
e th
erm
al p
ortio
n of
com
bine
d he
at
and
pow
er p
roje
cts.
Ene
rgy
savi
ngs
from
geo
ther
mal
hea
t pum
ps s
houl
d be
bas
ed o
n en
ergy
sav
ings
com
pare
d to
con
vent
iona
l alte
rnat
ives
like
air-
to-a
ir he
at p
umps
. If o
nly
elec
tric
ity s
avin
gs a
re k
now
n, m
ultip
ly k
Wh
savi
ngs
by
3,41
2 to
est
imat
e re
new
able
ene
rgy
BT
Us.
**
*For
oth
er r
enew
able
ene
rgy
that
doe
s no
t fit
any
cate
gory
, fill
in th
e ty
pe, u
nits
use
d, a
nnua
l con
sum
ptio
n an
d co
st, a
nd in
clud
e an
y ad
ditio
nal i
nfor
mat
ion
in y
our
narr
ativ
e su
bmis
sion
. F
or e
xam
ple,
tid
al, w
ave,
cur
rent
and
th
erm
al o
cean
ene
rgy,
incr
emen
tal h
ydro
pow
er, o
r en
ergy
dis
plac
ed b
y da
ylig
htin
g te
chno
logy
or
pass
ive
sola
r de
sign
.

PA
RT
2:
EN
ER
GY
EF
FIC
IEN
CY
IMP
RO
VE
ME
NT
S
2-1.
DIR
EC
T A
GE
NC
Y O
BL
IGA
TIO
NS
(Age
ncie
s m
ay a
ttach
thei
r fin
al O
MB
Circ
ular
A-1
1 E
nerg
y an
d T
rans
port
atio
n E
ffici
ency
Man
agem
ent E
xhib
it in
F
Y 2
006
Pro
ject
ed F
Y 2
007
(MM
BT
U)
(Tho
u. $
) (
MM
BT
U)
(Tho
u. $
)
Dire
ct o
blig
atio
ns fo
r fa
cilit
y en
ergy
ef
ficie
ncy
impr
ovem
ents
, inc
ludi
ng
faci
lity
surv
eys/
audi
ts
$2,9
50.0
$6
,418
.0
Est
imat
ed a
nnua
l sav
ings
ant
icip
ated
60
,291
.0
$1,0
67.0
45
,153
.0
$691
.0
2-2.
EN
ER
GY
SA
VIN
GS
PE
RF
OR
MA
NC
E C
ON
TR
AC
TS
(E
SP
C)
Ann
ual s
avin
gs
(MM
BT
U)
(num
ber/
Tho
u. $
)
Num
ber
of E
SP
C T
ask/
Del
iver
y O
rder
s aw
arde
d in
fisc
al y
ear
&
annu
al e
nerg
y (M
MB
TU
) sa
ving
s.
0.0
0
Inve
stm
ent v
alue
of E
SP
C T
ask/
Del
iver
y O
rder
s aw
arde
d in
fisc
al y
ear.
$0
.0
Am
ount
priv
atel
y fin
ance
d un
der
ES
PC
Tas
k/D
eliv
ery
Ord
ers
awar
ded
in fi
scal
yea
r.
$0.0
Cum
ulat
ive
guar
ante
ed c
ost s
avin
gs o
f ES
PC
s aw
arde
d in
fisc
al y
ear
rela
tive
to th
e ba
selin
e sp
endi
ng.
$0.0
T
otal
con
trac
t aw
ard
valu
e of
ES
PC
s aw
arde
d in
fisc
al
year
(su
m o
f con
trac
tor
paym
ents
for
debt
rep
aym
ent,
M&
V, a
nd o
ther
neg
otia
ted
perf
orm
ance
per
iod
serv
ices
).
$0.0
Tot
al p
aym
ents
mad
e to
all
ES
P c
ontr
acto
rs in
fisc
al
year
. $1
,504
.8
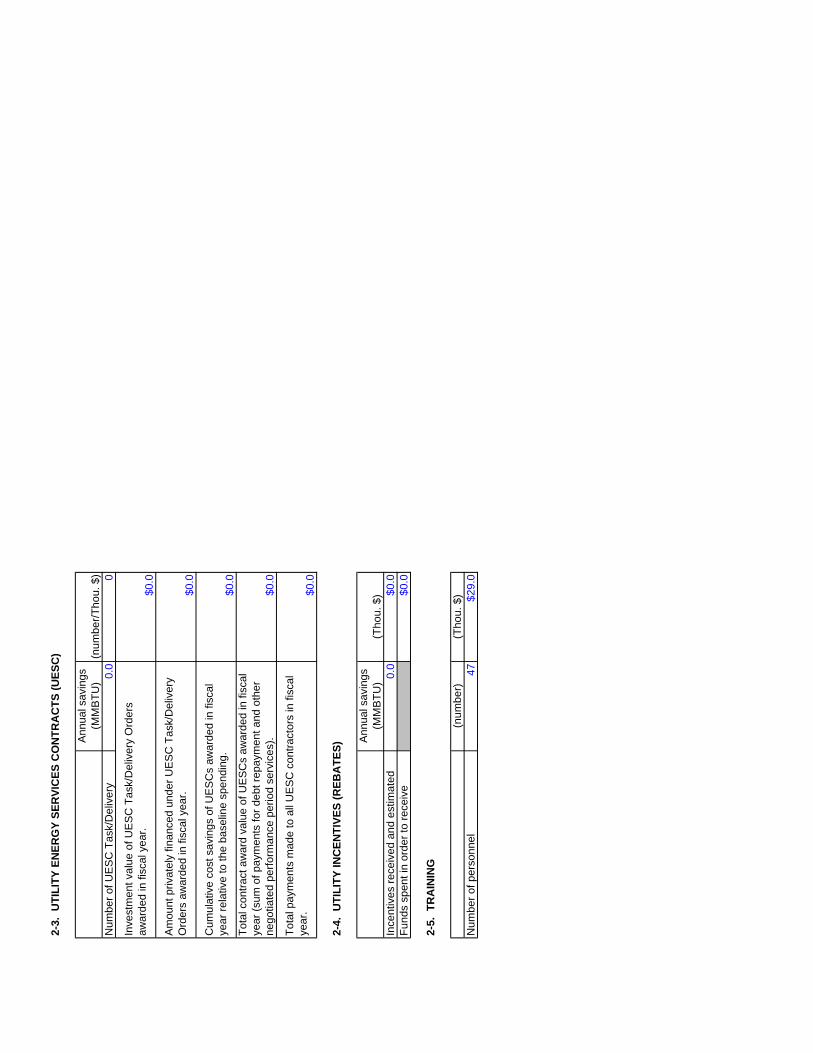
2-3.
UT
ILIT
Y E
NE
RG
Y S
ER
VIC
ES
CO
NT
RA
CT
S (
UE
SC
)
Ann
ual s
avin
gs
(MM
BT
U)
(num
ber/
Tho
u. $
) N
umbe
r of
UE
SC
Tas
k/D
eliv
ery
0.0
0
Inve
stm
ent v
alue
of U
ES
C T
ask/
Del
iver
y O
rder
s aw
arde
d in
fisc
al y
ear.
$0
.0
Am
ount
priv
atel
y fin
ance
d un
der
UE
SC
Tas
k/D
eliv
ery
Ord
ers
awar
ded
in fi
scal
yea
r.
$0.0
Cum
ulat
ive
cost
sav
ings
of U
ES
Cs
awar
ded
in fi
scal
ye
ar r
elat
ive
to th
e ba
selin
e sp
endi
ng.
$0.0
T
otal
con
trac
t aw
ard
valu
e of
UE
SC
s aw
arde
d in
fisc
al
year
(su
m o
f pay
men
ts fo
r de
bt r
epay
men
t and
oth
er
nego
tiate
d pe
rfor
man
ce p
erio
d se
rvic
es).
$0
.0
Tot
al p
aym
ents
mad
e to
all
UE
SC
con
trac
tors
in fi
scal
ye
ar.
$0.0
2-4.
UTI
LITY
INC
EN
TIV
ES
(R
EB
ATE
S) A
nnua
l sav
ings
(M
MB
TU
) (T
hou.
$)
Ince
ntiv
es r
ecei
ved
and
estim
ated
0.
0 $0
.0
Fun
ds s
pent
in o
rder
to r
ecei
ve
$0.0
2-5.
TR
AIN
ING
(num
ber)
(T
hou.
$)
47
$29.
0N
umbe
r of
per
sonn
el

M M
MM
M M
FY 2006 Federal Agency Energy Scorecard v12 15 06
Department/Agency Name Contact Name and Phone
U.S. Environmental Protection Agency Bucky Green, 202-564-6371
Name of Senior Energy Official Signature of Senior Energy Official
Luis A. Luna, Assistant Administrator for Administration and Resource Management (For)
Did your agency . . . Yes No Anticipated Submittal Date
1. Submit its FY 2006 energy report to OMB and DOE by January 1, 2007 (Sec. 303)?
X January 1, 2007
2. Submit a FY 2007 Implementation Plan by January 1, 2007 (Sec. 302)?
X January 1, 2007
Did your agency . . . Yes No Comments
3. Implement or continue to use renewable energy projects at Federal installations or facilitate the siting of renewable generation on Federal land in FY 2006 (Sec. 204)? (Report all self-generated renewable energy from projects installed after 1990; refer to Table 1-7 on the Energy Management Data Report)
X
See
Note
If yes, how many projects and how much energy generated? (Specify unit: MWH or MMBtu)
# Projects Energy Unit
Solar 5 115.8 MWH Wind Thermal1 3 8,262.4 MMBtu Biomass
Other RE
4. Purchase energy generated from new renewable energy sources in FY 2006 (Sec. 204)? 2 (Refer to Table 1-6 on the Energy Management Data Report)
X
See Note
If yes, how much: 162,330.7 MWH (Delivered green power and Renewable Energy Certificates);
or 190.5 MMBtu (Biodiesel)
5. Invest direct FY 2006 appropriations in projects contributing to the goals of the Order (Sec. 301)?
X If yes, how much: $2,950,000
6. Specifically request funding necessary to achieve the goals of the Order in its FY 2008 budget request to OMB (Sec. 301)? (Refer to OMB Circular A-11, Section 25.5, Table 2)
X If yes, how much: $2,950,000
7. Perform energy audits of 10% of its facility space during the fiscal year (Sec. 402)?
X What percentage of facility space was audited during the FY? 11 % How much facility space has been audited since 1992?3 83 %
8. Issue to private-sector energy service companies (ESCOs) any energy savings performance contract (ESPC) delivery orders (Sec. 403(a))? (Refer to
X
See
How many? Annual savings (MMBtu): Total investment value4: $
1 Examples are geothermal, solar thermal, and geothermal heat pumps. Thermal energy from geothermal heat pumps should be determined as follows: Thermal energy = Total geothermal heat transferred – electrical energy used. 2 “New” renewable energy means sources developed after 1990.3 Should be greater than 100% if all facility space has been audited at least once since 1992.4 Investment value includes design, materials, labor, overhead, and profit but excludes contractor’s financing costs and government’s administration costs. Using investment value allows comparison with other traditional execution methods such as

Table 2-2 on the Energy Management Data Report) Note Cumulative guaranteed cost savings: $ Award value: $
appropriated and working capital funded projects.
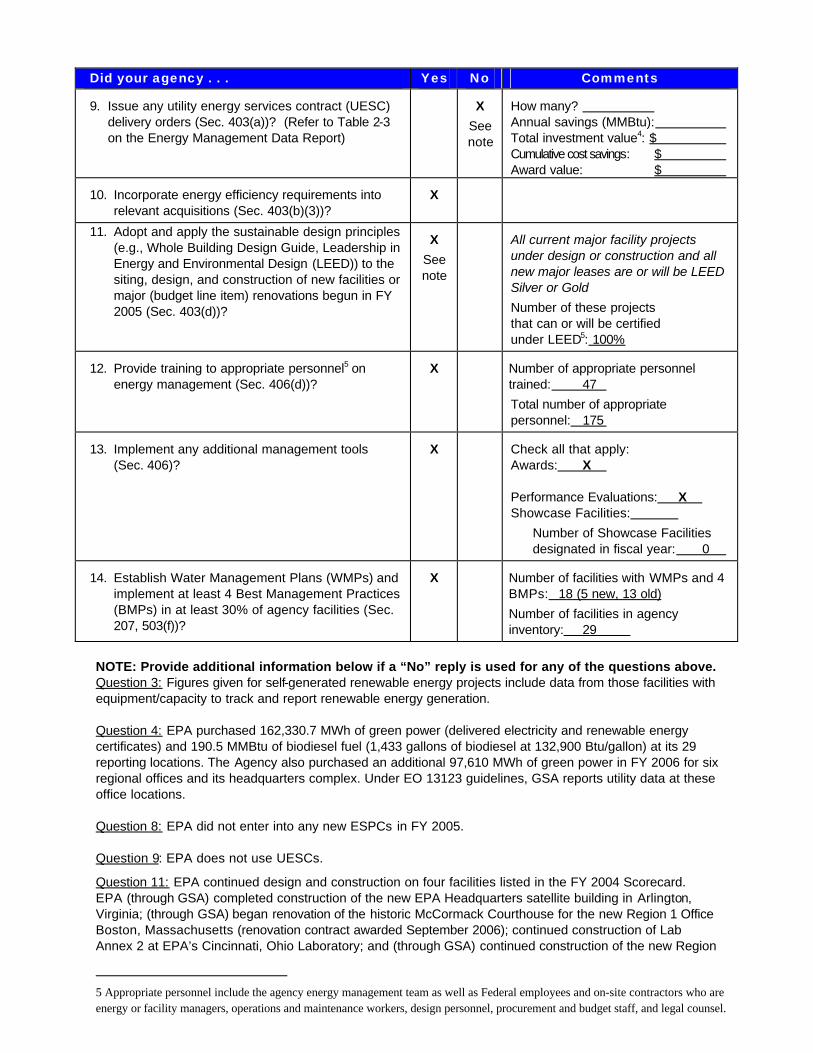
Did your agency . . . Yes No Comments
9. Issue any utility energy services contract (UESC) delivery orders (Sec. 403(a))? (Refer to Table 2-3 on the Energy Management Data Report)
X
See note
How many? Annual savings (MMBtu): Total investment value4: $ Cumulative cost savings: $ Award value: $
10. Incorporate energy efficiency requirements into relevant acquisitions (Sec. 403(b)(3))?
X
11. Adopt and apply the sustainable design principles (e.g., Whole Building Design Guide, Leadership in Energy and Environmental Design (LEED)) to the siting, design, and construction of new facilities or major (budget line item) renovations begun in FY 2005 (Sec. 403(d))?
X
See note
All current major facility projects under design or construction and all new major leases are or will be LEED Silver or Gold
Number of these projects that can or will be certified under LEED5: 100%
12. Provide training to appropriate personnel5 on energy management (Sec. 406(d))?
X Number of appropriate personnel trained: 47
Total number of appropriate personnel: 175
13. Implement any additional management tools (Sec. 406)?
X Check all that apply: Awards: X
Performance Evaluations: X Showcase Facilities:
Number of Showcase Facilities designated in fiscal year: 0
14. Establish Water Management Plans (WMPs) and implement at least 4 Best Management Practices (BMPs) in at least 30% of agency facilities (Sec. 207, 503(f))?
X Number of facilities with WMPs and 4 BMPs: 18 (5 new, 13 old)
Number of facilities in agency inventory: 29
NOTE: Provide additional information below if a “No” reply is used for any of the questions above. Question 3: Figures given for self-generated renewable energy projects include data from those facilities with equipment/capacity to track and report renewable energy generation.
Question 4: EPA purchased 162,330.7 MWh of green power (delivered electricity and renewable energy certificates) and 190.5 MMBtu of biodiesel fuel (1,433 gallons of biodiesel at 132,900 Btu/gallon) at its 29 reporting locations. The Agency also purchased an additional 97,610 MWh of green power in FY 2006 for six regional offices and its headquarters complex. Under EO 13123 guidelines, GSA reports utility data at these office locations.
Question 8: EPA did not enter into any new ESPCs in FY 2005.
Question 9: EPA does not use UESCs.
Question 11: EPA continued design and construction on four facilities listed in the FY 2004 Scorecard. EPA (through GSA) completed construction of the new EPA Headquarters satellite building in Arlington, Virginia; (through GSA) began renovation of the historic McCormack Courthouse for the new Region 1 Office Boston, Massachusetts (renovation contract awarded September 2006); continued construction of Lab Annex 2 at EPA’s Cincinnati, Ohio Laboratory; and (through GSA) continued construction of the new Region
5 Appropriate personnel include the agency energy management team as well as Federal employees and on-site contractors who are energy or facility managers, operations and maintenance workers, design personnel, procurement and budget staff, and legal counsel.

8 Office in Denver, Colorado.
Please enter data from annual energy report pertinent to performance toward the goals of Executive Order 13123/EPACT 2005
Base Year (2003)
Previous Year (2005)
Current Year (2006)
% Change (Current vs.
Base)
15. Site Energy Efficiency Improvement Goals (EPACT). Based on Revised GSF.
15a. Green Power Netted Out.
346,518 Btu/Ft2
324,602 Btu/Ft2
358,144 Btu/Ft2
216,695 Btu/Ft2
340,112 Btu/Ft2
189,658 Btu/Ft2
- 1.85%
- 41.57%
16. Sec. 205. Petroleum-Based Fuel Use in Facilities (E.O. Sec. 205). 73.81 BBtu 30.02 BBtu 32.98 BBtu - 55.32%
17. Source Energy Use (E.O. Sec. 206). N/A BBtu N/A BBtu N/A BBtu N/A %
18. Water Consumption (E.O. Sec. 207). 2000 Base Year
Gallons per gross square feet
187.3 MGal
63.5 Gal/Ft2
176.0 MGal
48.1 Gal/Ft2
218.5 MGal
59.3 Gal/Ft2
16.7%
- 6.6%
19. Renewable Energy from self-generation and RE purchases (E.O. Sec. 204)
93.3 BBtu 525.0 BBtu 554.3 BBtu 494.11%
Abbreviation Key: Btu/Ft2 = British thermal units per gross square foot MGal = Million gallons MMBtu = Million British Thermal Units BBtu = Billion British Thermal Units RE = Renewable energy N/A = Not applicable
Notes:
16: Energy intensity figures reflect revised and adjusted gross square footage and intensity baseline information for EPA facilities.
18: EPA has added space to its building inventory since FY 2000, so for the purposes of measuring progress in promoting water conservation at its facilities, EPA also measures performance based on water intensity (gallons used per gross square foot). The increase in absolute water consumption in FY 2006 compared to FY 2005 was related to new data for the Montgomery, Alabama laboratory, which installed a water meter at the end of FY 2005, and improved consistency in the reporting of makeup water used at the New Main Research Triangle Park, North Carolina facility.
U.S. Environmental Protection Agency
FY 2007 Energy and Water Implementation Plan
December 18, 2006
For information call: Sustainable Facilities Practices Branch, 202 564-6371
1

Section I: Management and Administra tion
The U.S. Environmental Protection Agency (EPA) recognizes that efficient energy and
water management must involve all facility management employees as well as senior
management. This section describes EPA’s energy management infrastructure and the
management tools it has been using to implement the Energy Policy Act of 2005 (EPAct 2005)
and Executive Order (EO) 13123.
ENERGY MANAGEMENT INFRASTRUCTURE
EPA’s Sustainable Facilities Practices Branch (SFPB) under its Office of Administration
and Resources Management (OARM) will continue to serve as an advocate, coordination point,
and technical advisor on sustainable practices, policies, and project implementation to all of
EPA’s facility-related organizations and personnel for both E.O. 13123 and EPAct 2005. Key
staff in SFPB’s energy team include the branch chief, two mechanical engineers, and a water
conservation/green power coordinator, and a Laboratories for the 21st Century coordinator.
Additional technical staff will be added in FY 2007.
EPA’s Assistant Administrator for Administration and Resources Management (currently
Luis Luna) will continue to serve as the Agency Energy and Environmental Executive, supported
by SFPB’s national energy team described above. The energy team will continue to be
supplemented by architects and engineers from EPA’s Architecture, Engineering, and Asset
Management Branch, by members of EPA’s Safety, Health, and Environmental Management
Division, and by the U.S. Department of Energy’s (DOE) National Renewable Energy
Laboratory on a project-specific basis. Site energy managers for each of the Agency’s 29
reporting facilities are listed in Appendix D of the annual report.
In FY 2007, SFPB will continue to advise and provide technical assistance to the
Agency’s Environmental Executive, EPA senior managers, program managers, and facility
managers to capture short and longer term energy savings available at EPA’s priority facilities in
the effort to achieve the energy conservation requirements of EPAct 2005.
2

MANAGEMENT TOOLS
EPA will continue to encourage its employees’ commitment to improving energy
efficiency. EPA’s management team will continue to use awards, incentives, and performance
evaluations, as well as continuing education and training programs, to support individual and
team efforts in energy efficiency.
EPA will continue the BTU Buster, H2OverAchiever, and Pollution Prevention awards
program for facility staff. EPA will actively participate in the Closing the Circle Awards,
DOE’s Energy Management and Water Conservation Recognition program, the Presidential
Energy Management Awards, and other opportunities for professional recognition where
appropriate. EPA will continue to highlight successful energy and water conservation projects
and the people who worked on them in its quarterly Energizing EPA newsletter.
Headquarters employees who have energy management responsibilities will also continue
to be evaluated annually under the personnel appraisal system against energy conservation goals.
Training and Education
Using several education and training programs, EPA will continue to ensure that
employees are aware of the latest technologies and opportunities to achieve energy efficiency.
• Laboratories for the 21st Century: SFPB’s Laboratories for the 21st Century (Labs21) program, a joint partnership between EPA and DOE dedicated to improving the environmental performance of U.S. laboratories, will continue to support a Web site, workshops, e-mail network, and annual conference in FY 2007. Approximately 40 EPA employees attended the conference annually, along with 500 conference from private, public, and non profit organizations, and more than exhibiting organizations. The 2008 conference will be held in Charleston, South Carolina, October 2-4, 2007 Labs21 will also continue to hold its one-day workshops on energy-efficient laboratory design and operations throughout FY 2007.
• Green Online Ordering System: EPA’s on- line “green” credit card ordering system under a blanket purchase agreement (BPA) is mandatory for all EPA offices, so that employees can make purchasing decisions consistent with EPA’s Environmentally Preferable
3
Purchasing Program’s (EPP) guidelines. The BPA, which launched in FY 2004 at EPA Headquarters, consists only on non-electronic office products that meet or exceed EPA recycled content and other EPP standards. EPA also conducts training to make green purchasing easier for Agency personnel and increase such purchases throughout the Agency. Credit card purchasing guidelines on EPA’s EPP Web site also provide easy access for credit card holders to ensure their purchases comply with environmental laws and EPA policies. The guidelines identify specific environmental attributes to look for when selecting products, including the ENERGY STAR® label or other energy efficiency designations.
• Electronic Products Environmental Assessment Tool: To further increase the environmental performance of electronics, EPA funded the development of the July 2006 Electronic Products Environmental Assessment Tool (EPEAT). EPEAT identifies high-performance, environmentally friendly computer equipment. EPA incorporated EPEAT language into the Office of Pesticides Program (OPP) information technology (IT) support services contract and is planning to incorporate EPEAT language into all new acquisitions. In addition, EPEAT language will be included in EPA’s BPA for desktop and laptop computers.
• Energizing EPA Newsletter: EPA will continue to distribute this quarterly newsletter to all EPA senior, program, and facility managers and other employees to keep them up to date on energy and water conservation at new and existing laboratories, green power purchases and projects, and energy and water efficiency activities in EPA facilities, as well as offer tips on how to conserve ene rgy in their own jobs and lives.
• Office of Administrative Services Web Site: The Office of Administrative Services Web site <www.epa.gov/greeningepa> provides the latest information on energy and water performance at EPA facilities, “how to” instructions, lessons learned, and basic conservation principals, energy efficient project explanations, green power procurement information, green fleet updates, and details on other efforts that make EPA more efficient. In FY 2007 EPA will continue to update the site on a quarterly basis.
• Federal Electronics Challenge. EPA will expand its participation in the Federal Electronics Challenge (FEC) throughout FY 2007. More than 20 EPA facilities are FEC partners, dedicated to reducing the environmental impacts of electronics used in the Agency. The agency will work towards establishing an inter- facility mentoring program to bring all EPA facilities closer to the gold level for FEC.
Showcase Facilities
EPA anticipates nominating Potomac Yard, its new 405,000 square foot Headquarters
satellite office in Arlington, Virginia, occupied in July 2006, and the new Denver Regional
Office, to be occupied in January 2007, as showcase facilities in FY 2007.
4

Section II: Implementation Strategies
EPA is committed to continuing to use a variety of strategies to reduce energy
consumption and improve energy and water efficiency in its facilities, including: sustainable and
energy-efficient new building design; focusing on large energy users; commissioning, re
commissioning, and retro-commissioning; operations and maintenance (O&M) assessments;
heating, ventilation, and air conditioning (HVAC) system upgrades; green power and renewable
energy certificate purchases; and water conservation efforts.
OVERALL STRATEGY
EPA will continue to implement its five-part energy conservation strategy in FY 2007:
• Promoting sustainable and energy-efficient design in its new buildings and leases so that the new buildings entering the inventory are better than the ones they replace. EPA will continue its program of mandatory commissioning of new buildings, initiated in FY 2004.
• Improving the operation of existing buildings in the near term through re- and retrocommissioning and O&M program assessments at the most energy-intensive facilities.
• Designing and constructing physical mechanical system changes to achieve energy savings in the long run. EPA will also implement mandatory commissioning of major mechanical system projects.
• Concentrating efforts where the most opportunities are, at the Agenc y’s largest energy consuming facilities. Regardless of size, however, EPA will also implement energy conservation projects at smaller laboratories where funding, local management, and local staff support exist.
• Purchasing green power, which will always serve as an important component of EPA’s balanced effort to reduce its environmental footprint.
In addition, in FY 2007, EPA will:
• Continue its new “ConservE” program of identifying energy reduction targets for each major facility on an annual basis.
• Complete all site visits, and software and hardware specifications for the advanced metering systems called for in EPACT 2005. Installation starts at high priority sites in FY 2008.
5

• Refine its high performance fume hood policy. EPA in July 2006 completed a prepurchase performance testing procedure and acceptance process, along with a list of approved fume hoods to operate at 60 feet/minute. The Agency is working on a policy to ensure that these fume hoods are actually operating at that flow rate.
• If resources permit, continue development of a comprehensive nationwide operations and maintenance (O&M) program that includes: professional training requirements for existing facility managers; professional, educational, and work experience requirements for new facility managers; final templates for model O&M contracts that contain tougher minimum performance requirements for contractors; O&M contractor assessments to support EPA staff and facility managers in managing their O&M contractors; and metrics to measure the energy use reductions improved O&M has on EPA energy use.
TRACKING FACILITY-SPECIFIC ENERGY REDUCTION
In January 2006, in response to EPAct 2005, EPA’s launched “ConservE” a portfolio-
wide energy reduction program to identify and implement short-, intermediate-, and long-term
energy savings. In FY 2006, under ConservE:
1) EPA initiated mandatory energy reduction targets for each reporting facility instead of relying on voluntary cooperation at individual sites to reduce energy consumption. While this did not change EPA’s basic energy conservation strategy—pursuing the largest energy conservation opportunities first—it did ensure that all facilities, no matter how large or small, contribute to EPA’s energy conservation efforts.
2) All appropriate EPA facilities reported on the status of 30 simple but important O&M actions that affect energy efficiency. These actions were clustered in 10 major areas, and consisted of activities and actions that should be performed in all facilities on a routine basis. This “Top 10 O&M” list was designed to identify good performing facilities and capture short-term energy savings from facilities in the EPA portfolio that were not up to speed on O&M best practices.
3) ConservE required all facilities to submit facility-specific energy reduction plans by the end of June 2006. This was an effort to ensure each facility was actively engaged on energy conservation issues, and to identify field-generated conservation projects not previously identified through previous Headquarters/field interactions.
4) Similar to the OMB Scorecards described in the annual report, each facility received a green, yellow, or red ConservE rating, which was distributed to senior program and facility managers. These ratings are made quarterly. EPA also plans to work towards institutionalizing O&M assessments as a component of its national energy management program.
6

EPA will continue this program in FY 2007 to keep all facilities engaged and
contributing to energy conservation efforts.
INTEGRATION OF ADVANCED ELECTRICITY METERING
EPAct 2005 requires that all federal agencies install advanced electricity metering in all
federal facilities where feasible by October 1, 2012. To fulfill this EPAct requirement, EPA will
work on integrating all metered energy data across all facilities into a single Web-based
clearinghouse of Agencywide energy consumption data. EPA also intends to use this system to
eventually replace EPA’s existing practice of manually tracking and entering energy
consumption data and provide facility and energy managers with instant access to such data.
In FY 2006, EPA developed an initial inventory of existing utility meters at all reporting
facilities. In addition, EPA completed the installation of a Web-based utility metering system at
its New Main and NCC in RTP, North Carolina. These two facilities represent 40 percent of
EPA’s annual energy use; the metering system is providing EPA with on-the-ground experience
with advanced metering systems. In FY 2007, the Agency will refine the metering inventory and
complete metering plans for each of its reporting facilities. EPA plans to implement metering at
its reporting facilities by FY 2008.
HEATING, VENTILATION, AND AIR CONDITIONING UPGRADES
In FY 2007, EPA will continue heating, ventilation, and air conditioning (HVAC)
upgrades at several facilities to help attain the buildings’ required conditions for supply air while
reducing annual energy consumption. HVAC improvements will include:
• Research Triangle Park, North Carolina. The research complex at RTP, NC represents approximately 50 percent of EPA’s “reportable” energy use nationwide.
• In FY 2007, EPA will focus on improving the operations of the Central Utility Plant (CUP) that serves the New Main, operation of the chilled water and high temperature hot water loops that feed the New Main, coordination of supply and demand between
7
the CUP and the New Main, and office side air handling unit re-commissioning at New Main.
• Design and award construction for reconstruction and upgrading of the Air Handling Unit #1 and Air Handling Unit #2 systems will be completed in FY 2007 at the Human Studies Facility in Chapel Hill, North Carolina.
• EPA will optimize the location of Computer Operations Center components in the National Computer Centers to better match heat loads and cooling capacity.
• Cincinnati. Ohio. The Andrew W. Breidenbach Environmental Research Center (AWBERC), EPA’s second largest research facility and second largest energy user facility, uses approximately 10 percent of EPA’s annual reported energy. AWBERC will continue a series of mechanical upgrades for exhaust systems, air handling units, piping/ductwork, and the renovation of 12 laboratory modules. EPA will also install high-performance VAV fume hoods, which use 30 to 40 percent less energy than conventional fume hoods, and replace single-pass supply air with a combination of return air and required outside air, as well as install new building controls with nighttime setbacks. Designs are expected to be completed in May 2007, while construction will start at the beginning of FY 2008.
Other Facilities
• Fort Meade, Maryland. If resources become available in FY 2007, EPA hopes to continue Phase II of a laboratory controls optimization project (LCOP) at the Environmental Science Center (ESC), in which the Agency will develop a revised ventilation plan and establish new set points to meet the reduced air flow demand. During Phase III, EPA will implement the ventilation plan and recommission the HVAC system and controls. EPA is anticipating that the LCOP will reduce ESC’s annual energy consumption by 8 to 10 percent below its FY 2005 baseline consumption.
• Manchester, Washington. EPA completed the construction of a new wing with VAV fume hoods at the Region 10 laboratory in May 2003, then implemented a multi-stage renovation project for VAV upgrades for existing wings. A construction contract was awarded in September 2006 for Phase II Stage 2 of the project, and renovations are expected to be completed in summer 2007. When all phases of the laboratory renovations are completed, EPA expects to reduce the facility’s overall energy use by approximately 15 percent compared to a FY 2005 baseline.
• Duluth, Minnesota. As part of a variety of upgrades at the Mid-Continent Ecology Division Laboratory, EPA plans to install a VAV pilot on one third of the facility’s systems. Although this project is currently on hold, EPA plans to install new VAV systems as part of an infrastructure upgrade, which is expected to be completed in FY 2008.
8

• Athens, Georgia. The Science and Ecosystems Support Division (SESD) laboratory will undergo modifications to building controls, the installation of an isolated HVAC unit, and the transition from constant volume to variable frequency drive AHUs as part of its sustainable design. The plan is expected to reduce the facility’s energy annual consumption by up to 15 percent, with an estimated payback of less than five years.
COGENERATION UNIT ANNUAL ENERGY SAVINGS
After the installation of a new 60-kilowatt cogeneration unit in October 2005, the Region
9 Laboratory in Richmond, California experienced a number of setbacks during FY 2006,
leading to an increase in energy consumption over the first two quarters of FY 2006. After a
thorough investigation, EPA determined that due to gas regulator problems experienced by the
facility’s natural gas utility provider, the cogeneration unit was limited to about 85 percent of its
rated output. After identifying and resolving this problem, the energy data for the last two
quarters of FY 2006 showed a marked improvement in energy performance. EPA predicts that
the full energy savings potential of the cogeneration unit, which is estimated at 21 percent of
annual energy savings, will be realized in FY 2007.
WATER CONSERVATION AND STORMWATER MANAGEMENT
As part of the Agency’s goal to reduce water consumption by 15 percent in FY 2010,
EPA is focusing on water assessments, conservation, and stormwater management, most notably:
• Golden, Colorado. EPA’s Region 8 Laboratory is continuing its plans for a xeriscaping project to improve its stormwater runoff and replace all or part of its currently irrigated turf with a sustainable landscape. The project could save the facility about 750,000 gallons of water per year, totaling 17 percent of its total water consumption.
• Athens, Georgia. A water management plan for the SESD laboratory completed in July 2006 outlines strategies for reducing water consumption and improving water efficiency, including the installation of faucet aerators—saving the laboratory an estimated 50,0000 gallons of water per year—and the combination of an air handler condensate recovery system and a weather-based controller or soil moisture sensor, which would reduce water use by 15 to 20 percent. SESD will also evaluate its fish preparation area water usage to see if its flow rate can be reduced. Also in Athens, as part its National Exposure Research Laboratory (NERL) sustainability master plan, EPA is creating a stormwater detention pond for the NERL facility. The pond will improve the laboratory’s stormwater management and sediment control.
9
• Washington, D.C. As part of the multi-year, multi-phase low-impact development (LID) project to demonstrate stormwater management techniques in the urban environment surrounding EPA Headquarters, the Agency in FY 2007 will complete Phase II of the LID project, including permeable paving, sustainable landscaping, bioretention cells, and a cistern to capture rainwater runoff in an interior courtyard. Garage cisterns will be installed in another section of the Headquarters complex as part of Phase III of the project in FY 2007 or FY 2008.
SUSTAINABLE DESIGN AND SUSTAINABLE MASTER PLANNING
As part of its Green Buildings Vision and Policy Statement, EPA incorporates sustainable
design principles into the siting, design, and construction of new facilities, as well as the
renovation and maintenance of existing facilities. The Agency signed the MOU on High
Performance Buildings in January 2006. The Agency currently requires that all major newly
constructed or renovated buildings achieve at least a minimum Gold rating from the Leadership
in Energy and Environmental Design (LEED®) New Construction (NC) of the U.S. Green
Buildings Council; benchmark energy use and achieve the ENERGY STAR building label within
a fixed post-occupancy time period; and achieve 30 percent better than the ASHRAE 90.1-2004
energy performance standard per EPAct 2005. (Before EPAct 2005, EPA’s standards included
30 percent better than ASHRAE 90.1-1999.) In FY 2007, EPA will continue to focus on
EPAct’s tightening of the ASHRAE standards and will work on numerous sustainable design and
building projects, most notably:
• Cincinnati, Ohio. EPA is planning an April 2007 completion of its new 42,00 square foot Research Support Annex. The completion of the annex will provide additional office space and free up office space in the AWBERC, which will then be converted to laboratory space. The Research Support Annex is expected to achieve LEED Gold certification.
• Denver, Colorado Regional Office. The Agency’s new 250,000 square foot Region 8 headquarters building, slated for a January 2007 completion and LEED Gold certification, is anticipated to perform 36 percent better than ASHRAE 90.1-1999 standards. The facility will include a centralized mechanical system.
• Boston Massachusetts Regional Office. GSA awarded a renovation contract for the historic McCormick Post Office and Courthouse in downtown Boston. EPA will occupy 225,000 square feet in the building and be the lead tenant in the building. Completion of the renovation is expected in FY 2009. Though GSA faces budget constraints EPA will
10
work to improve the energy efficiency and the LEED Certified level projected for the project.
Moving Towards Sustainable Master Planning
EPA continues to work to expand the scope of its master planning process from its
traditional focus on space needs and building locations to consider long term mechanical system
migrations, storm water management, landscaping, security and other sustainable issues and
develop multi year plans to reduce the environmental impact of these facilities.
• Corvallis, Oregon. Completed in September 2006, EPA’s sustainable master plan for the Western Ecology Division (WED) Laboratory sets a path for a multi-ear upgrade of aging HVAC systems and renovation of existing laboratory facilities to more energy-fficient systems.
• Athens, Georgia. EPA completed a facility master plan in May 2006 for the ORD laboratory in Athens, Georgia. The plan represents a major step forward in the Agency’s move towards holistic master planning, integrating space planning, building location planning, long-term migration of existing mechanical systems to more energy-efficient systems, site security and some stormwater management issues. Phase I designs include construction of perimeter security measures and a stormwater detention pond, HVAC upgrades, and an energy-efficient roof. EPA expects to award the second phase design contract in FY 2007. Phase II projects will include the construction of a stand-alone central power plant and allow transition from constant volume to VAV laboratory ventilation systems.
• Montgomery, Alabama. EPA will award a design contract for a master plan at the National Air and Radiation Environmental Laboratory. The plan will review perimeter security, mechanical systems, space needs, and analysis the status of current stormwater management and landscape conditions.
11
Energy Reductions
Green Power for 100% of Electricty
Successful Conferencesand Programs
Avoided Energy Costs
Green Buildings
Water Savings