by thomas w. watson - georgia · georgia department of natural resources envir onmental protection...
TRANSCRIPT

GEOHYDROLOGY OF THE DOUGHERTY PLAIN AND ADJACENT AREA, SOUTHWEST GEORGIA
Prepared as part of the Accelerated Ground-Water Program in cooperation with the Department of the Interior United States Geological Survey
35
By
Thomas W. Watson
ss· 84" 83" ' ---~~~----1----- 35"
\ ' I \Rom~ I
34· r I I
\
31
---~ .... o
@ATLANTA
I oConunOu•
l ,..,1
STUDY
- .v. ·~:,.
"';:. "%-... _
- -:' 34°
------840 -- - - - - ~ 1
83"
0 20 40 60 60 MILES 1 II I I I I I
Atlanta 1981
82"
Georgia Department of Natural Resources Joe D. Tanner, Commissioner
Environmental Protection Division J. Leonard Ledbetter, Director
Georgia Geologic Survey William H. Mclemore, State Geologist
HYDROLOGIC ATLAS 5
The Department of Natural Resources is an equal opportunity employer and offers all persons the opportunity to compete and participate in each area of DNR employment regardless of race. color, religion. sex. national origin. age handicap, or other non merit factors

GEORGIA DEPARTMENT OF NATURAL RESOURCES ENVIRONMENTAL PROTECTION DIVISION
. GEORGIA GEOLOGIC SURVEY
' I ,..
0
u
(
.,. '
FIGURE 1. LOCATION OF STUDY AREA
PREPARED IN COOPERATION WITH THE DEPARTMENT OF THE INTERIOR
UNITED STATES GEOLOGICAL SURVEY
Geohydrology Of The Dougherty Plain And Adjacent Area, Southwest Georgia
By Thomas W. Watson
INTRODUCTION GEOLOGY
Ground-water use in the Dougherty Plain physiographic district of southwest Georgia (fig. 1) has received considerable attention in recent years. A mild climate, an abundant supply of good-quality ground water, a flat to gently rolling terrain, and the introduction of center pivot irrigation systems have spurred a remarkable increase in agricultural irrigation . Irrigated acreage in southwest Georgia increased 60 percent between 1970 and 1971, and by approximately 100 percent from 1976 through the fall of 1977. Ground-water use for irrigation between 1977 and 1980 increased from about 47 to 76 billion gallons per year (H.E. Gill. US. Geological Survey, written commun., 1981). an increase of 62 percent.
The availability of large quantities of ground water is partly a function of the same physical processes which
produced the topographic features of the Dougherty Plain. Gradua I dissolution of the Ocala Limestone, which lies at or near the land surface, has produced a cavernous limestone aquifer that serves as a reservoir for 4 to 8 inches of the 52 inches of rainfall that can be expected in an average year.
The purpose of this report is to define the hydrogeology of the principal artesian aquifer in the Dougherty Plain . Since ground water will be a significant aspect in the future development of the area, i1 is important to know how much water production t he aquifer is capable of sustaining, and how to manage this important resource. The aquifer boundaries, thickness, and other physical characteristics are illustrated as an important first step to more advanced hydrologic modeling techniques. which. will be used as aids in determining water management alternatives.
Residuum . - The surficial geology of the Dougherty Plain consists of a residual layer of sand and clay, derived from solution weathering of the Ocala Limestone. The ratio of sand and clay in the res iduum varies throughout the study area. Test drilling data indicate that the residuum usually is clayey sand to slightly sandy clay. Clay content ranges from approximately 10 to 70 percent. and samples from 45 of 50 test wells consisted of more than 25 percent clay.
The thickness of the residual layer varies from just a few feet to slightly more than 100 feet, and has an average thickness of approximately 50 feet (fig. 2).
EXPlAriATION
-50- LINE OF EQUAL TH ICKNESS OF THE OCAlA LIMESTONE RESIDUUM · Dashed where approximately located. Interval 25 feet.
e DATA POINT
45
' _.....1__
0 R
\
~ \ -~ I -;r-A
30'
0 5 10 15
ILLA I I
y!__\ \ '
\ \\ I ~-
--T--• a4"oo'
~ I " \, ' 31"oo·
\~ \
' ' j ?
I
' -r --- __ '___l__ 15'
20 25 30 MILES
HYDROLOGIC ATLAS 5 PLATE
Cartography by JeaneS. Barrett and Willls G. Hester

GEORGIA DEPARTMENT OF NATURAL RESOURCES ENVIR ONM ENTAL PROTECTION DIVISION GEORGIA GEOLOG IC SURVEY
EXPLANATION
-2 5 - APPROXIMATE LINE OF EQUAL THICKNESS OF THE OCALA LIMESTONE - Interval 25 feet. National Geodetic Vertical Datum of 1929
e DATA POINT
1--F . L
45 0 R
I
, 84"oo'
I '- 3 1"oo '
' -r------L
15 '
0 5 10 15 20 25 30 MILES
LL~~--~--~-~--_L __ j
FIGURE 3. APPROXIMATE THICKNESS OF THE OCALA LIMESTONE
' L, . I I
_j
PREPARED IN COOPERATION WITH THE DEPARTMENT OF THE INTERIOR
UNITED STATES GEOLOGICAL SURVEY
Ocala Limestone. - The Oca Ia is a light-colored, fossiliferous limestone of late Eocene age. The top of the limestone is a transitional zone where t he sandy clay of the residuum grades into limestone. Thi s t ransitional zone can be abrupt, or it may include seve ral tens of feet of alternating weathered limestone and sandy clay. The parent limestone is exposed along sect ions of major st reams such as the Chatta hoochee River, Flint River, and Spring Creek, where erosion has removed the residuum. The Ocala is a wedgeshaped limestone formation trending from northeast to southwest across Georgia , thickening to the southeast. The Ocala varies in thickness from a few feet at the updip limitto 350 feet in the southeastern part of the Dougherty Plain {f ig . 3)
The upper surface of the Oca la Lim eston e is highly irregular because of differential weathering {fig. 4). However, the approximate depth from land surface to the top of the Ocala Limestone in a given area can be estimated by subtracting the altitude of the limestone surface from the land surface altitude.
EXPLANATION
- 3 00- STRUCTURE CONTOUR- Shows altitude ofthetop of the Ocala Limestone. Dashed where approximately located. Contour interval 25 feet. Nationa l Geodetic Vertical Datum of 1929
e DATA POINT
')7 ---:~DONALSONVILLE.\J 3!
000'
~
0 R
0 5
HYDROLOGIC ATLAS 5 PLATE 2
' r:-------L 15
10 15 20 25 30 MILES
FIGURE 4 . STRUCTURE CONTOUR OF THE TOP OF THE OCALA LIMESTONE
Ca rtograph y by Jeane S . Barrett and Willis G. Heste r

GEORGIA DEPARTMENT OF NATURAL RESOURCES ENVIRONMENTAL PROTECTION DIVISION GEORGIA GEOLOG IC SURVEY
--300--
EXPLANATION
STRUCTURE CONTOUR- Showsapproxomate altitude of the top of the Lisbon Formation. Contour interval 50 feet . National Geodetic Vertica I Datum of 1929
A------ A' Line of geologic section (see figure 6)
• DATA POINT
I I
\ \ I ~ · 1f------T--~
\_ , 84"oo'
\I \
\0\ <:1 \ (
1 ,~>Y rf r
0 R -.:...__1__\ r---- __ _j_
15'
0 5 10 15 20 25 30 MILES
FIGURE 5. GENERALIZED STRUCTURE OF THE TOP OF THE LISBON FORMATION
lisbon Formation . - The Ocala is underlain by the Lisbon Formation of middle Eocene age. The Lisbon occurs at altitudes ranging from 300 feet above sea level in the northwestern part of the report area to 300 below in the so utheastern part of the report area (fig . 5). In the report area, the top of the Lisbon is considered the lower boundary of the princ ipal artesian aquifer because the Lisbon cons ists of hard, sandy, clayey limestone and has distinctly lower water-yielding characteristics than the Ocala Limestone.
A detailed description of the lithostrat igraphy throughout the study area is given by Herrick ( 1961). Herrick and Vorhis (1963). and Stringfield (1966). An extensive listing of hydrogeolog ic data for the Dougherty Plain is presented by Mitchell ( 1981 ).
50 [32°00'
10 '-50 -100
L15o
PREPARED IN COOPERATION W ITH THE DEPARTMENT OF THE INTERIOR
UN ITED STATES GEOLOGICAL SURVEY
Maximum Mean Minimum Number of Samples
TABLE 1 - SUMMARY OF WATER QUALITY ANALYSES 1, PRIN CIPAL ARTESIAN AQUIFER
Q) u
"' c 0 "' - u u "'
rfJ :::J- u :2 -o en -c 0 en
~ 0 o.r: "' (f) E I E u E en "' - -o :::J
0 en c (") Q) E :::J Q) U L Q) oo N en E_ <D~ -o ;,;:: u > Q) -c -2u coQ - :::J - OJ)
~0 -~ ~ -o 0 Q) ·- "' c CJ) " "' "'- o== L COI Ofl . ~ (f) c u.. _!:! U rn2 'O Z "':>.::: ::: (f) _u c.- I "' u- Ofl o - co- "' - 0 -- c; - :::J- .r: -(f) c. I co 0 (f) L u 2 (f) 0.. (f) u
293 8. 1 185 167 184 39.0 0 130 56.0 130 13.0 I 3.8 11.0 7.4 196 7.3 106 120 11 7 9.0 0.027 39.0 1.0 2.0 0.5 2. 0 3 .1 54 5.9 4 5 16 4.7 0000 0.4 0 .0 0.8 0 . 1 00 1.0
42 39 42 39 4 2 42 '1 2 42 42 42 4 2 42 42
VERTICAL SCALE GREATLY EXAGGERATED
0 2 4 6 8 10 12 MLES 1 Values in milligrams per liter except pH NATIONAL GEO) ETI C VERTICAL DATUM O" 1929
EXPLANATION
2 Exceeds EPA Drinking Water Standards -- WATER TABL E: ---- POTENTIOM E TRIC SURFACE • DIRECTION OF WATFR MOVEMENT
FIGURE 6. HYDROGEOLOGIC SECTION A-A'
HYDROGEOLOGY
The principal artesian aquifer beneath the Dougherty Plain consists pr ima rily of the Ocala Limestone, which is the chief source of ground water for domest ic and agricu ltural use. Municipal and industria l use of the principal artesian aqu ifer depends on geographic location, the amount of water desired, and the thickness of the Ocala at that location.
Hydraulic connection of the Ocala with any of the underlying aquifers is not well understood at present. Current data, however, ind icate that the Ocala responds as a separate hydrologic unit.
Rainfall not lost as surface runoff or t hrough evapotranspiration is the pr imary so urce of recharge to the principal artesian aquifer Recharge of the aquifer depends upon the following: (1 )the amount, distribut ion. and timing of rain fall, (2) t he vertical permeability, or ease with which water can percolate downward through the residuum, and (3)the thickness of the residuum Vertical hydraulic conductivity ranges between 0.001 and 0.005 feet per day throughout most of the study area and is the primary factor controlling recharge to the Ocala aqu ifer.
An ideali zed hydrogeologic cross section ofthe Dougherty Plain along the line from A to A' (trace shown in fig. 5) shows the relative positions and thicknesses of the geologic un its (fig. 6). Direction of water movement is shown by arrows representing ground-water flow.
The capacity of the principal artesian aqui fer to store and transmit large quantities of water is due largely to the cavernous nature of the Ocala Limestone. Water moving through sma l l fractures or cracks in the limestone has slowly en larged these features , t hrough solution. forming a cavernous, highly porous labyrinth of subterranean channels. In many areas, ground water moves through t h e aqu1fer almost as if in a conduit or culvert.
Aquifer transmissivity is the rate at wh ich water is transmitted through a unit width of the aquifer under a hydraulic gradient and is determined by measunng waterlevel declines in wells adjacent to pumping wells. Transm issivity of the pri nc ipa I artes ian aquifer ranges from less than 25,000 tt2/day to more than 75.000 ft2/day (f ig 7) Transmissivity is lowest in the northwestern part of the report area where t he aquife r is relatively thin, and increas.es to the southeast wh ere the aquifer is thicker. Transmissiviity also increases near the Chattahoochee River, Flint River, and Spring Creek because water moving between the surface-water system and the ground-water system adjacent to these major drainages has accelerated the erosion of ground-water conduits. In general, we ll yield is direct ly proport ional to transmiss ivity . Other factors being equal (such as well diameter and pumping level). wells constructed within high transmiss ivity zones can be expected to yie ld more water than wells constructed within low transmissivity zones (fig . 7).
WATER QUALITY
Di sso lved minerals in ground w ater can affect its usefulness for var iou s purposes . Tabl e 1 shows the le vels of some of the more co m mon constituent s di sso lved in water f rom wells open only to the principal artes ian aquifer. Water quality is generally suitable for domestic and agricultural use.
EXPLANATION
TRAN SMISSIVITY LESS THAN 25. 000 tt2/d EXPECTED WELL ~ IELD LESS THAN 500 gal /mi n
TRAN SMISSIVITY 25,000 to 75.000 ft2/d EXPECTED WELL ~IE LD 500to 1000 ga l / m in
TRAN SMISSIVITY GREATER THAN 75.000 tt2/d EXPECTED WE LL YIE LD GREATER THAN 1000 gal /min
' ) /
0 5 n I ~ ~(l ?~ '<'H .. II F< L1.........1 . ..1.i.. __ L I
Q)
-o 0[L " --
LL..
2.32
0. 1 0 .0
42
FIGURE 7. POTENTIAL WELL YIELDS BASED ON TRANSM ISSIVITY
HYDROLOGIC ATLAS 5 PLATE 3
Q) (Y)
- o ~ z :!:::-z
34.02 4 .0 0.0
38
Cartography by JeaneS. Bmra:t and Willis G. Heste r
GEORG IA DEPARTMENT OF NATURAL RESOURCES ENVIRONMENTAL PROTECTION DIV ISION GEORG IA GEOLOG IC SURVEY
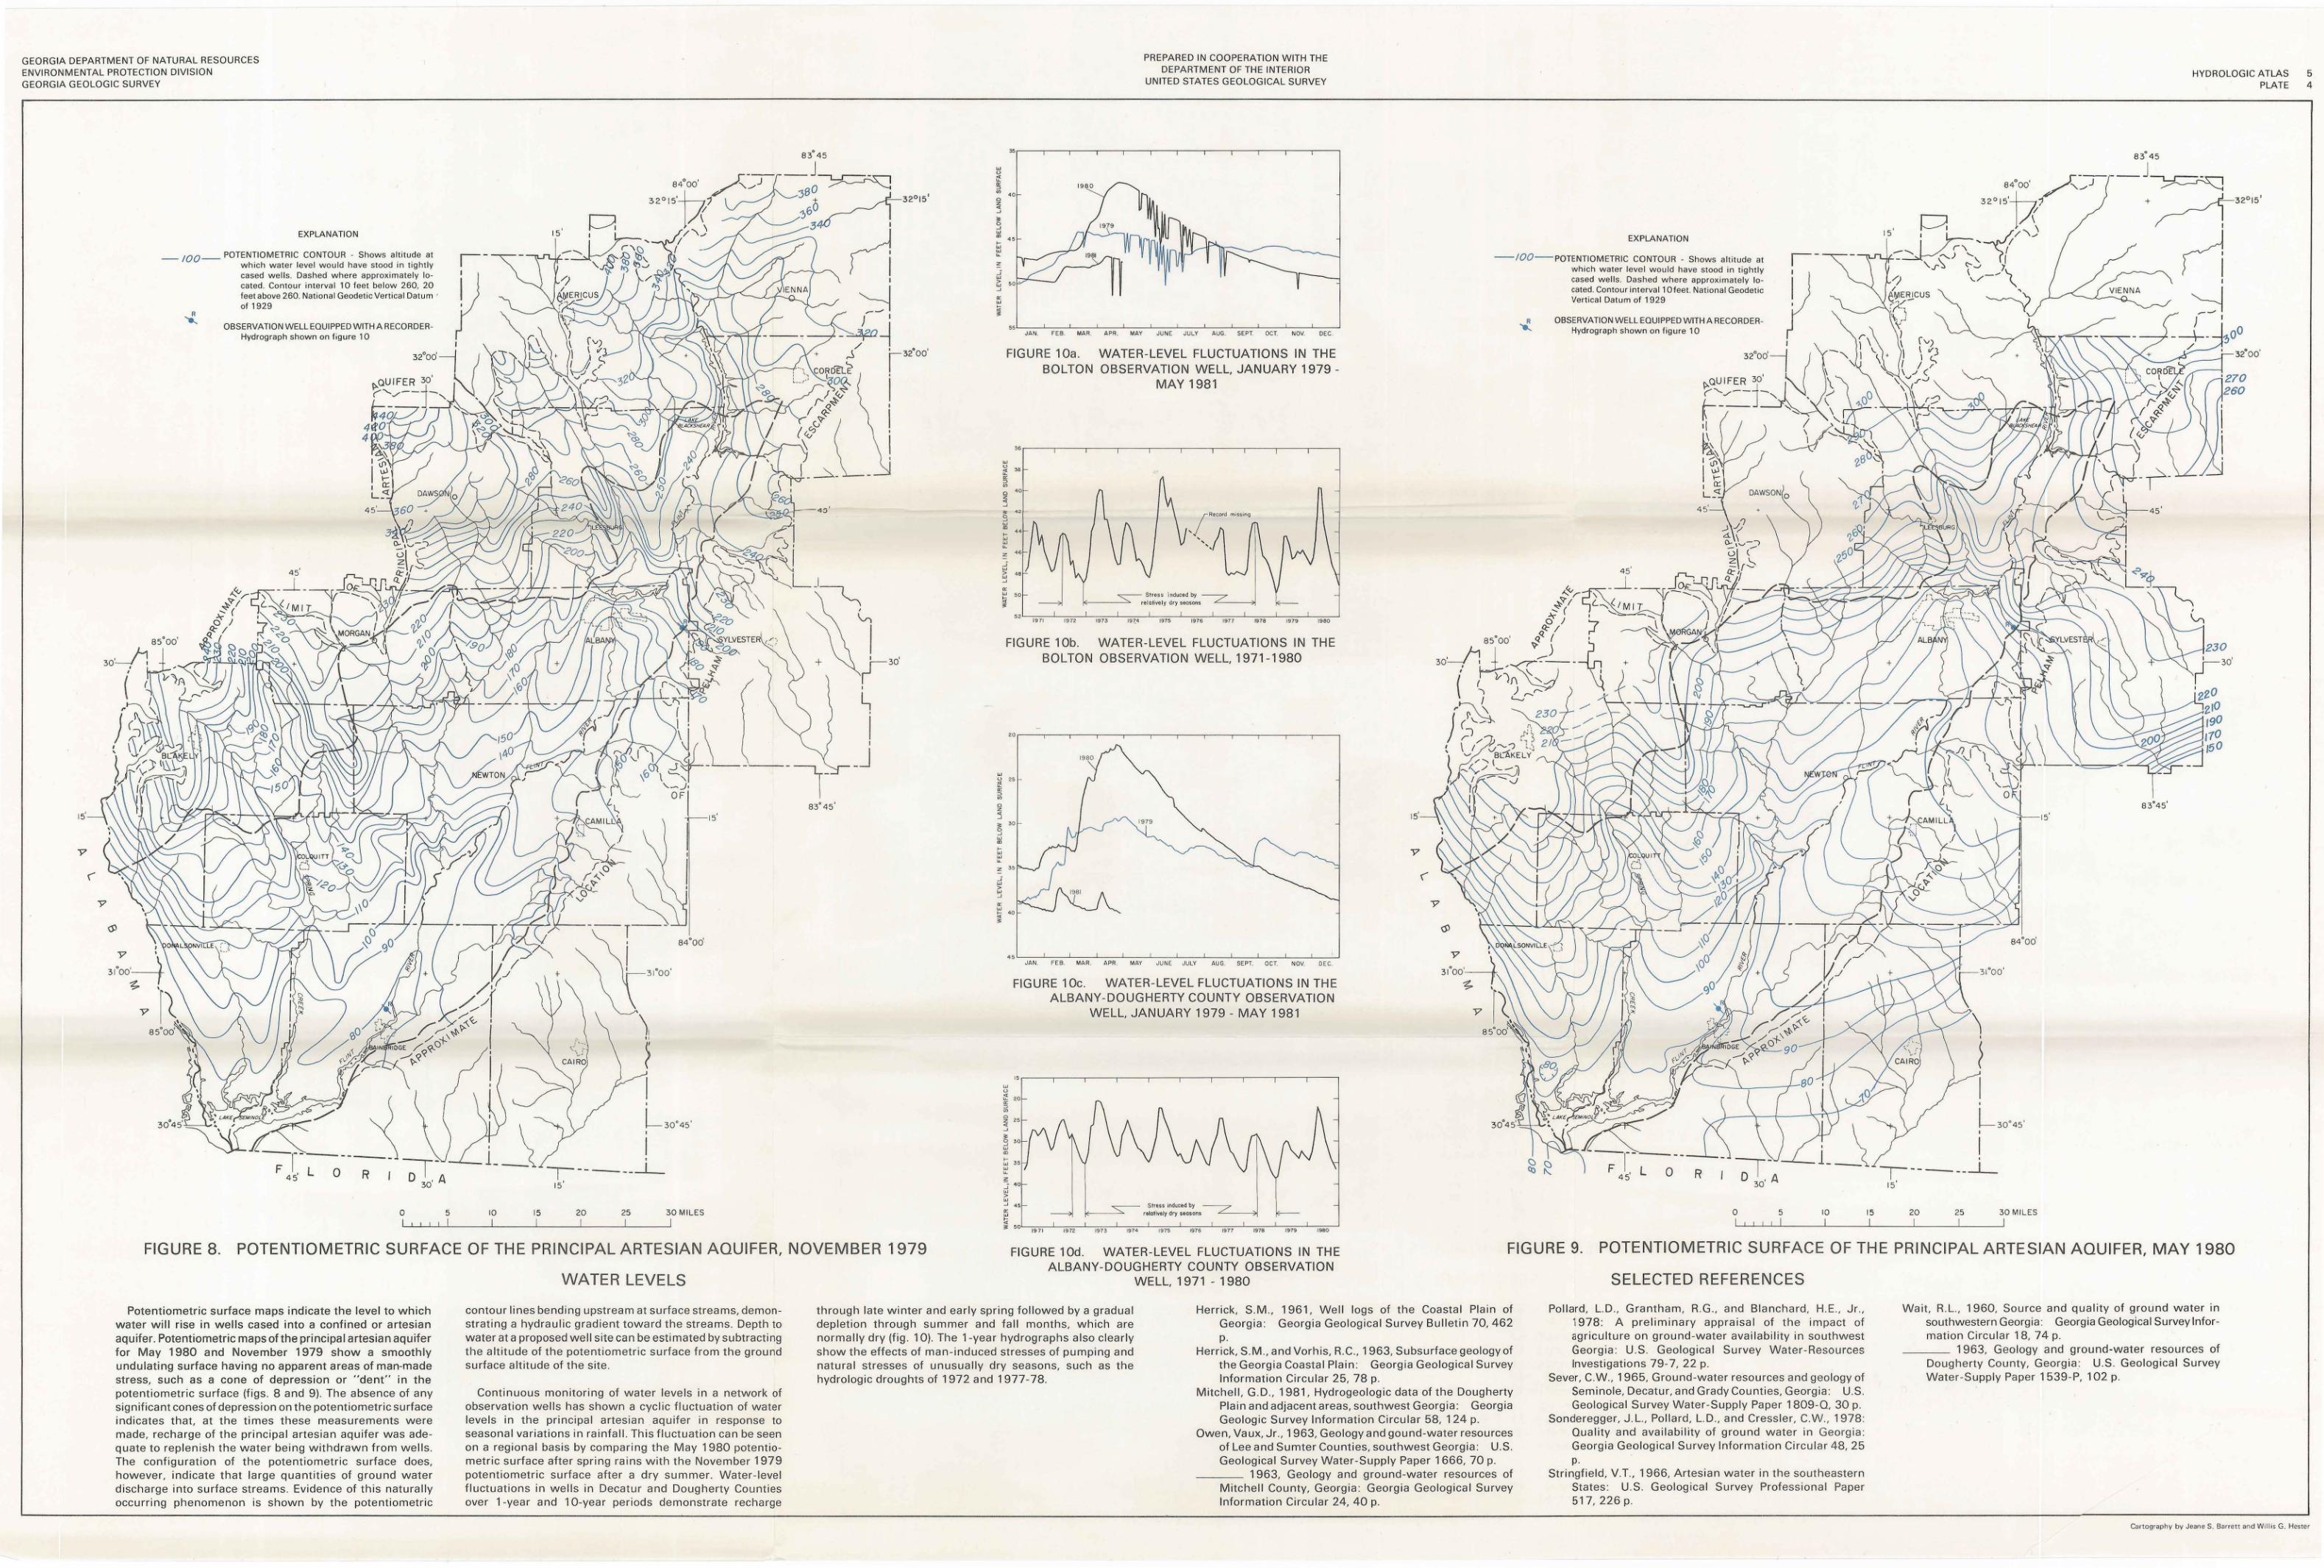
EXPLANATION
_ IOO- POTENTIOMETRIC CONTOUR - Shows alti tude at which water level wou ld have stood 1n t ight ly cased wells. Dashed where approximately located . Contour interval 10 feet below 260, 20 feet above 260_ National Geodetic Vertica l Datum ' of 1929
OBSERVATION WELL EQUIPPED WITH A RECORDERHydrograph shown on figu re 10
4 5'
_ _l_ _
0 R
0 5 10
w u ~ ~ ~ 00
a z ~ J
" a J w 00
~ w ::' 2
d > w _, ~ w ~
"
-~- w u ~ ~ ~ 00
83° 45 ' a z ~ J
~ 0 J w 00
~ w w ~
~ j w > w ~
~ w ~ ~
84"od
15 20 25 30 MILES
35
'"
" JAN. fE B. MAR APR. MAY
PREPARED IN COOPERATI ON W ITH THE DEPARTMENT OF THE INTERIOR
UNITED STATES GEOLOGICAL SURVEY
JUNE JULY AUG. SE PT. OCT. NOV. DEC
FIGURE 10a. WATER-LEVEL FLUCTUATIONS IN THE BOLTON OBSERVATION WELL, JANUARY 1979-
MAY 1981
" r----.---.----.----,---,----,----,----,----.---.
r Record missinq
'~
Stress induced by relatioe ly dry sensnn~
',,
FIGURE 10b. WATER -LEVEL FLUCTUATIONS IN THE BOLTON OBSERVATION WELL, 1971 - 1980
w
"
" 1979
"
,,~~~~~~~=-~~~~~--~~~~~--~--~~ JAN, FE B. MAR. MPR MAY JUNE JULY AUG. SEPT. OCL NOV. D::C.
w u ;:' ~ ~ 00 a 2 ~ J
~ a J w 00
~ w w ~
" J w > w J
~ w ~ ~
~
FIGURE 10c. WATER-LEVEL FLUCTUATIONS IN THE
"
"
" 30
,
<0
.,
>O 19 11
ALBANY-DOUGHERTY COUNTY OBSERVATION WELL, JANUARY 1979 - MAY 1981
1972 1973 197'1 1975 1976 1977 1979 1979 1980
15'
EXPLANATION
- /00- pOTENTIOMETR IC CONTOUR - Shows altitude at w hich w ater level would have stood in tightly cased welts. Das hed where approximately located. Contour int-erval1 0 feet. Nati onal Geodetic Vertical Datum of 1929
OBSERVATION WELL EQUIPPED WITH A RECORDER Hydrograph shown on figure 10
DAWSON 10
+
\
45'
__l__
\ __.__-\ ---r- --'--- L _ Z
0 R I 0 I . A 30
0 5 10 15
s4'oo'
'
L 30 ' 45 ·
r------_1_ 15'
20 25 30 MILES
HYDROLOGIC ATLAS 5
230
r-30'
'zzO ziO 190 110 150
PLATE 4
32"oo'
FIGURE 8. POTENTIOMETRIC SURFACE OF THE PR INCIPA L A RTE SIAN A QUIFER, NOVEMBER 1979 FIGURE 10d. WATER-LEVEL FLUCTUATIONS IN THE FIGURE 9. POTENTIOMETRIC SURFACE OF THE PRINCIPAL ARTESIAN AQUIFER, MAY 1980
SELECTED REFERENCES
Potentiometric surface maps indicate the level to which water will rise in wells cased into a confined or artesian aquifer. Potentiometric maps ofthe principal artesian aquifer for May 1980 and November 1979 show a smoothly undulating surface having no apparent areas of man-made stress, such as a cone of depression or "dent" in the potentiometr ic surface (figs. 8 and 9). The absence of any significant cones of depression on the potent iometric surface indicates that, at the times these measurements were made, recharge of the principal artesian aquifer was ade quate to replenish the water be ing withdrawn from wel ls. The configurat ion of the potent iometr ic surface does, however, indicate that large quant it ies of ground water discharge into surface streams. Evidence of this naturally occurring pl1enomenon is shown by t he potentiometric
WATER LEVELS
contour lines bending upstream at surface streams, demonstrating a hydraulic gradient toward the streams. Depth to water at a proposed well site can be estimated by subtracting the altitude of the potentiometric surface from the ground surface altitude of the site .
Cont inuous monitori ng of water levels in a network of observation wells has shown a cyclic fluctuation of wa ter levels in the principal artesian aquifer in response to seasonal var iations in rainfall. This fl uctu ation can be seen on a regional basis by comparing the May 1980 potentio metric surface after spring ra ins w ith th e November 1979 potentiometric su rface after a dry summer. Water - level fluctuations in wells in Decatur and Dougherty Counties over 1-year and 1 0-year periods demonstrate rech arge
ALBANY-DOUGHERTY COUNTY OBSERVATION WELL, 1971 - 1980
through late winter and ear ly spring fo llowed by a gradua l depletion through summer and fall months, which are normally dry (fig 1 0). The 1-year hydrographs a lso clearly show the effects of man-induced stresses of pump ing and natural stresses of unusua ll y dry seasons, such as the hydrologic droughts of 1972 and 1977-78.
Herrick, S.M., 1961, We ll logs of the Coastal Pla in of Georgia: Georg ia Geo log ica l Survey Bulletin 70, 462 p.
Herrick, S.M., and Vorhis, R.C., 1963, Subs urface geology of the Georgia Coasta l Plain: Georgia Geological Survey Information Circular 25, 78 p.
Mitchell, G. D., 1981, Hydrogeologic data of the Dougherty Plain and adjacent areas, southwest Georgia: Georg ia Geolog ic Survey Information Circular 58, 124 p.
Owen, Va ux, Jr., 1963, Geo logy and gound-water resources of Lee and Sumter Counties, southwest Georgia: U.S. Geological Survey Water-Supp ly Paper 1666, 70 p.
_______ 1963, Geology and ground-water resources of Mitche ll County, Georgia: Georgia Geo logical Survey Information Circular 24, 40 p.
Pollard, LD, Grantham, R.G., and Blanchard, H.E., Jr, 1978: A prelim inary appra isa l of the impact oi agriculture on ground-water ava il ability in southwest Georgia: U.S. Geological Survey Water-Resources Investigations 79 -7, 22 p.
Sever, C.W., 1965, Ground-water resou rces and geology of Seminole, Decatur, and Grady Coun t ies, Georgia: U.S. Geolog ica l Survey Water -Supply Paper 1809-0, 30 p.
Sonderegger, J. L , Pollard, L.D., and Cressler, C.W., 1978: Qua lity and avai labi l ity of ground water in Georgia : Georg ia Geolog ica l Survey Informat ion Circular 48, 25 p.
Stringf ie ld, V. T., 1966, Artesian water in the southeastern States: U.S. Geological Survey Profess ional Paper 517, 226 p.
Wa it, R.L, 1960, Source and qua l ity of ground water in southwestern Georgia: Georgia Geologica l Survey Information Circular 18, 74 p.
_______ 1963, Geology and ground -water reso urces of Dougherty County, Georgia: U.S. Geo logical Survey Wate r- Supply Paper 1539-P, 102 p.
Cartography by Jeane S. Barrett and Will is G. Hester