energy: it’s not all the same to you! - calrecyclelesson 1 energy sources and resources none...
TRANSCRIPT

Visual AidsCalifornia Education and the Environment Initiative
Energy: It’s Not All the Same to You!
Science Standard 6.6.a.
6

California Education and the Environment InitiativeApproved by the California State Board of Education, 2010
The Education and the Environment Initiative Curriculum is a cooperative endeavor of the following entities:California Environmental Protection Agency
California Natural Resources Agency
California State Board of Education
California Department of Education
Department of Resources Recycling and Recovery (CalRecycle)
Key Partners:Special thanks to Heal the Bay, sponsor of the EEI law, for their partnership
and participation in reviewing portions of the EEI curriculum.
Valuable assistance with maps, photos, videos and design was provided by the
National Geographic Society under a contract with the State of California.
Office of Education and the Environment1001 I Street • Sacramento, California 95814 • (916) 341-6769
http://www.CaliforniaEEI.org
© Copyright 2011 by the California Environmental Protection Agency© 2013 Second Edition
All rights reserved. This publication, or parts thereof, may not be used or reproduced without
permission from the Office of Education and the Environment.
These materials may be reproduced by teachers for educational purposes.

Lesson 1 Energy Sources and Resources
None required for this lesson.
Lesson 2 Converting Energy
1 Inside the Power Plant . . . . . . . . . . . . . . . . . . . . . . . . . . . . . . . . . . . . . . . . . . 2
2 Comparing Energy Sources . . . . . . . . . . . . . . . . . . . . . . . . . . . . . . . . . . . . . . 3
3 Cooling Towers . . . . . . . . . . . . . . . . . . . . . . . . . . . . . . . . . . . . . . . . . . . . . . . 4
Lesson 3 Byproducts of Electrical Production
4 California’s Power Mix . . . . . . . . . . . . . . . . . . . . . . . . . . . . . . . . . . . . . . . . . 5
Lesson 4 Effects of Energy Choices
5 Grinnell Glacier . . . . . . . . . . . . . . . . . . . . . . . . . . . . . . . . . . . . . . . . . . . . . . 6
6 Nuclear Power Plant Cooling Canals . . . . . . . . . . . . . . . . . . . . . . . . . . . . . . 7
7 Electricity Consumption per Capita . . . . . . . . . . . . . . . . . . . . . . . . . . . . . . . 8
8 Total Electricity Consumption . . . . . . . . . . . . . . . . . . . . . . . . . . . . . . . . . . . 9
Lesson 5 Energy Choices—No Free Lunch
None required for this lesson.
Contents

2 CALIFORNIA EDUCATION AND THE ENVIRONMENT INITIATIVE I Unit 6.6.a. I Energy: It’s Not All the Same to You! I Visual Aids
Inside the Power PlantVisual Aid 1
VA #1 Inside the Power Plant
Generator
Shaft
Boilers Transfer Station
Turbine
Steam Transmission wires
Energy sources
Energy conversions
__________________
__________________ ________________ to
________________ to
__________________ ________________ to

CALIFORNIA EDUCATION AND THE ENVIRONMENT INITIATIVE I Unit 6.6.a. I Energy: It’s Not All the Same to You! I Visual Aids 3
VA #2 Comparing Energy Sources
Comparing Energy SourcesVisual Aid 2
BiomassNaturalGas
Coal
NuclearPower

4 CALIFORNIA EDUCATION AND THE ENVIRONMENT INITIATIVE I Unit 6.6.a. I Energy: It’s Not All the Same to You! I Visual Aids
Cooling TowersVisual Aid 3
VA #3 Cooling Towers

CALIFORNIA EDUCATION AND THE ENVIRONMENT INITIATIVE I Unit 6.6.a. I Energy: It’s Not All the Same to You! I Visual Aids 5
VA #4 California’s Power Mix
Energy Source Percent of Total
Natural Gas 45.2%
Coal 16.6%
Nuclear 14.8%
Large Hydro 11.7%
Renewable Sources:
Geothermal 4.5%
Small Hydro 2.8%
Wind 2.3%
Biomass 2.1%
Solar 0.2%
Total 100%
California’s Power MixVisual Aid 4
California Energy Sources—2007Source: California Energy Commission
6 CALIFORNIA EDUCATION AND THE ENVIRONMENT INITIATIVE I Unit 6.6.a. I Energy: It’s Not All the Same to You! I Visual Aids
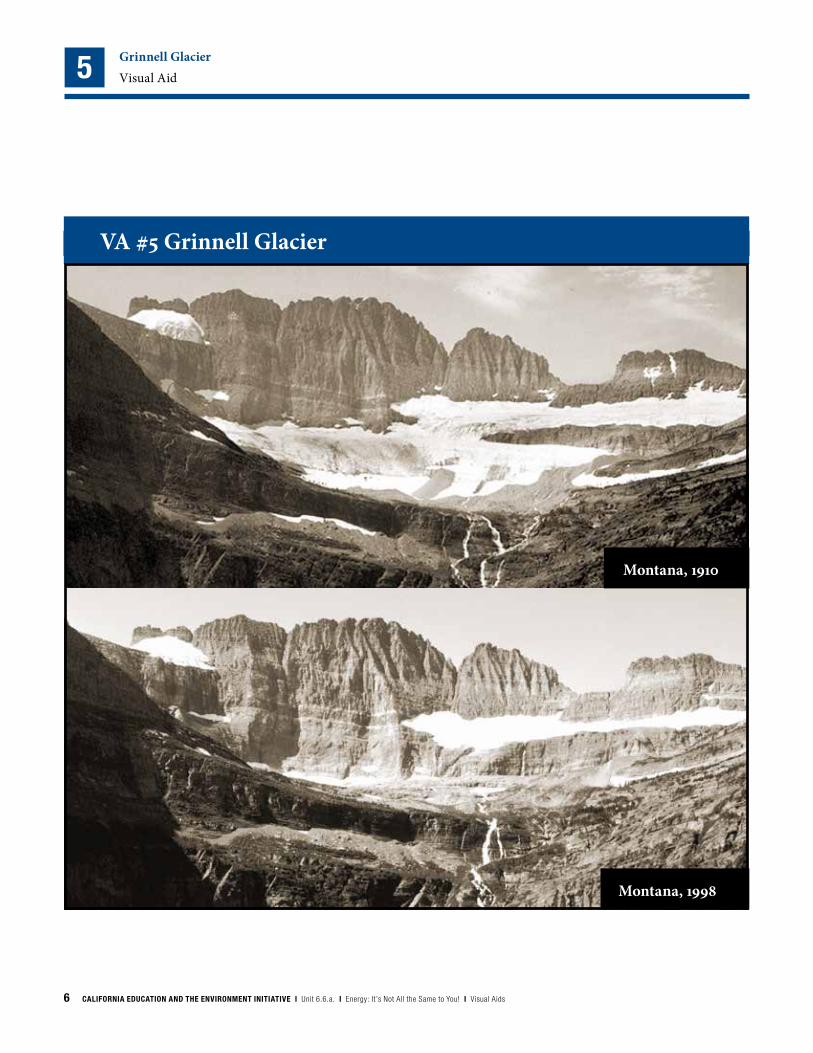
VA #5 Grinnell Glacier
Grinnell GlacierVisual Aid 5
Montana, 1910
Montana, 1998

CALIFORNIA EDUCATION AND THE ENVIRONMENT INITIATIVE I Unit 6.6.a. I Energy: It’s Not All the Same to You! I Visual Aids 7
VA #6 Nuclear Power Plant Cooling Canals
Nuclear Power Plant Cooling CanalsVisual Aid 6

8 CALIFORNIA EDUCATION AND THE ENVIRONMENT INITIATIVE I Unit 6.6.a. I Energy: It’s Not All the Same to You! I Visual Aids
VA #7 Electricity Consumption per Capita
15,000
10,000
0
United States
California
1960 1970 1980 1990 2000 2004
Electricity Consumption per Capita, 1960–2004
Kilo
wat
t-ho
ur (k
Wh)
per
Per
son
Electricity Consumption per CapitaVisual Aid7
Source: California Energy Commission

CALIFORNIA EDUCATION AND THE ENVIRONMENT INITIATIVE I Unit 6.6.a. I Energy: It’s Not All the Same to You! I Visual Aids 9
VA #8 Total Electricity Consumption
Total Electricity ConsumptionVisual Aid 8
0
1981
1983
1985
1987
1989
1991
1993
1995
1997
1999
2001
2003
2005
100,000
50,000
150,000
200,000
250,000
(million kWh)
Total Electricity Consumption in California 1980–2005
Source: U.S. Department of Energy

10 CALIFORNIA EDUCATION AND THE ENVIRONMENT INITIATIVE I Unit 6.6.a. I Energy: It’s Not All the Same to You! I Visual Aids
Energy Sources Used to Produce California’s ElectricitySupplemental Visual Aid 1
SVA #1 Energy Sources Used to Produce California’s Electricity
Energy Source Percent of TotalNatural Gas 45%Coal 17%Nuclear 15%Large Hydro 12%Renewables 12%
California’s Power Mix
Source: California Energy Commission, 2007Note: Total Exceeds 100 percent due to rounding.

CALIFORNIA EDUCATION AND THE ENVIRONMENT INITIATIVE I Unit 6.6.a. I Energy: It’s Not All the Same to You! I Visual Aids 11
Energy End-Use CategoriesSupplemental Visual Aid 2
SVA #2 Energy End-Use Categories
Industrial Commercial
Residential Transportation

12 CALIFORNIA EDUCATION AND THE ENVIRONMENT INITIATIVE I Unit 6.6.a. I Energy: It’s Not All the Same to You! I Visual Aids
California’s Energy End-Uses by Category Supplemental Visual Aid 3
SVA #3 California’s Energy End-Uses by Category
40%Transportation
23%Industrial
18%Residential
19%Commercial
Source: U.S. Department of Energy, Energy Information Administration, 2011 http://www.eia.gov/beta/state/seds/data.cfm?incfile=/state/seds/sep_sum/html/sum_btu_1.html&sid=US

CALIFORNIA EDUCATION AND THE ENVIRONMENT INITIATIVE I Unit 6.6.a. I Energy: It’s Not All the Same to You! I Visual Aids 13
Energy Sources for Cars 1Supplemental Visual Aid 4
SVA #4 Energy Sources for Cars 1Energy Source
Advantages Byproducts Effects on Natural Systems
Limitations
Gasoline and Diesel fuel
Well developed industry exists to produce and distribute fuels. Existing fleet of vehicles can use it.
Releases large amounts of carbon dioxide, other gases, and soot (particulates).
Greenhouse gases can result in global climate change. Extraction, transportation, and processing can disrupt and/or damage natural habitat.
More expensive to buy than natural gas.
Nonrenewable sources.
Natural gas Produces fewer emissions than using gasoline and diesel fuel.
Releases carbon dioxide, hydrogen sulfide, and soot (particulates).
Greenhouse gases can result in global climate change. Drilling and transporting disrupt and/or damage natural habitat.
Few fuel stations and limited driving range without refueling.
Nonrenewable sources.
Biofuels Some are made from waste materials and save space in landfills. Can collect and use methane from decaying materials rather than releasing it into the atmosphere.
Renewable sources.
Releases carbon dioxide, other gases, and smoke (particulates).
Greenhouse gases can result in global climate change. May use farmland which then can not be used to produce food. Land for growing fuel can consume natural habitat and affect wildlife populations. Fertilizers may have additional impacts.
Large amounts of energy needed to produce biofuels.
Few fuel stations.
A relatively new technology that is not fully developed.

14 CALIFORNIA EDUCATION AND THE ENVIRONMENT INITIATIVE I Unit 6.6.a. I Energy: It’s Not All the Same to You! I Visual Aids
Energy Sources for Cars 2Supplemental Visual Aid 5
SVA #5 Energy Sources for Cars 2Energy Source Advantages Byproducts Effects on Natural
SystemsLimitations
Battery Electric Zero emissions from the vehicles. Electricity may be generated from renewable sources.
No air pollution from the vehicles.
No direct effects from the vehicles, but the power plants that supply the electricity may affect natural systems (for example, releases of particulate matter and/or greenhouse gases that can result in climate change).
Few charging stations.
Most vehicles take many hours to charge.
Some sources of electricity are nonrenewable.
Hydrogen Fuel Cell Electric
Zero emissions from the vehicle. Can be made from renewable sources such as biomethane and electricity from solar or wind-power. Can be refueled in the same time as a gasoline vehicle.
Hydrogen fuel cell vehicles emit only water.
Depends on the source of energy used to make the hydrogen. For example, greenhouse gas emissions can be associated with making hydrogen from natural gas or using nonrenewable electricity.
Few refueling stations, but more are in development and will likely be available in the next few years.
Some sources of hydrogen are nonrenewable.

California Education and the Environment InitiativePrinted on post-consumer recycled paper66aVA