energy efficient modernisation of housing: a uk case study
TRANSCRIPT

Ž .Energy and Buildings 32 2000 267–280www.elsevier.comrlocaterenbuild
Energy efficient modernisation of housing: a UK case study
Malcolm Bell), Robert LoweFaculty of Health and EnÕironment, Leeds Metropolitan UniÕersity, CalÕerley Street, Leeds, LS1 3HE, UK
Received 24 November 1999; accepted 21 March 2000
Abstract
This paper sets out the results of the York Energy Demonstration Project and discusses its implications for the modernisation of lowrise housing in the UK. The project consisted of three schemes, which were carried out in the early to mid 1990s and monitored over a2-year period. Results indicate that modernisation schemes have a very important part to play in reducing CO emissions and that2
Ž .improvements in the region of 50% can be achieved at modest cost using well proven early 1980s technology. The possibility ofadditional improvements are also identified which could see emissions fall by a further 30–40%. In addition, the project identifiesdifficulties posed by, often small, variations in dwelling construction, which can have a disproportionate impact on costs, and by thedesign and use of mixed heating systems which can reduce overall heating efficiencies. The paper also discusses the impact of thedemonstration project on the dissemination of good energy efficient practice within the Local Authority and highlights the lessons learnedfor implementation in future modernisation schemes. q 2000 Elsevier Science S.A. All rights reserved.
Keywords: Existing housing; Energy efficiency; Retrofit; York
1. Introduction
In the last 10–15 years, the majority of governmentsaround the world have come to accept the importance ofreducing greenhouse gases and since the Kyoto protocol,signed in December 1997, have intensified their search forways of making large reductions in emissions. At the heartof many policies is the quest for more efficient use ofenergy in all economic sectors. In most countries, housingis a major consumer of energy and is responsible for a
Ž .large fraction of national carbon dioxide CO emissions.2
Figures for 1996 show that, in the UK, housing accountedfor 28% of national CO emissions and was the largest2
single contributor, followed by industry at 27% and trans-w xport at 25% 1 . Although the majority of research into
energy efficiency improvements in housing has been con-ducted in the context of new dwellings, it is clear thatimprovements in the design of the new stock will onlyhave marginal effect in the short to medium term. In theUK, demolition rates are low with new construction addingto, rather than replacing, the dwelling stock. Figures for
) Corresponding author. Tel.: q44-1-113-283-1704; fax: q44-113-283-3190.
Ž .E-mail address: [email protected] M. Bell .
Great Britain indicate a net gain of almost 200,000dwellings per annum and a simple linear projection of thistrend suggests that by the year 2050, the dwelling stockmay have risen by over 9.5 million dwellings of which the
w xpost 2000 stock would constitute only 30% 2 . Although itis likely that replacement rates may increase, the improve-ment of the energy efficiency of existing housing providesan important opportunity to achieve significant reductionsin CO emissions over a much shorter time scale than can2
be achieved by the construction of new dwellings. Inaddition, if such improvements are carried out at the sametime as more general modernisation and repair works,there are important cost advantages to be gained.
In the early to mid 1990s, the UK government funded aseries of demonstration projects in local authority housingdesigned to implement a wide range of energy savingmeasures which could be incorporated into modernisation
Žprogrammes. This programme the Greenhouse Pro-.gramme ran from 1991 to 1994 and funded some 183Ž .schemes over 50,000 dwellings of which the York pro-
w xject was one 3,4 .In common with many energy demonstration projects
over the last 10 years, the York Project had two mainaims. The first was to confirm that the application ofreadily available technology could deliver significant en-ergy benefits within the context of a routine local authority
0378-7788r00r$ - see front matter q 2000 Elsevier Science S.A. All rights reserved.Ž .PII: S0378-7788 00 00053-0

( )M. Bell, R. LowerEnergy and Buildings 32 2000 267–280268
housing modernisation programme. The second was toextract lessons for the operation of future energy consciousmodernisation schemes. This paper sets out to report theresults of the project both in terms of the measured energyand CO reductions and the lessons which were learned,2
together with their impact on future modernisation policy.
2. Project description
Housing in the City of York is predominantly low-riseŽ .two and three storey single family houses of terraced,semi-detached, or detached types and is typical of a largeproportion of housing in the UK. The York area has about
Ž .75,000 dwellings, the vast majority of which 73% areowner occupied. Some 9500 are owned by the Local
Ž .Authority 15% and the remainder rented either fromprivate landlords or from a housing association. Thedemonstration project involved around 230 local authoritydwellings, which were in need of modernisation. Theconstruction of the houses was typical of about 75% of thelocal authority stock and about 60% of the stock in Yorkas a whole. Fig. 1 shows a house which is representative ofthose used in the project. The general form of constructionis summarised in Table 1.
The project was made up of three related schemes withdifferent standards of energy efficiency and monitoringarrangements. All houses were taken from the Authority’smodernisation programme, which included an internal refitof kitchens and bathrooms together with internal repairs asnecessary. All external fabric was in good condition andno external replacement works were necessary. The energyefficiency works and monitoring arrangements for eachscheme are summarised in Table 2.
The 4-house scheme was designed to modernise a smallnumber of properties to as high a standard as possiblewithin a number of practical and financial constraints andto contrast the use of four different heating arrangements;two based on gas and two on electricity. Although it was
Fig. 1. Typical house type.
recognised at the time that the inclusion of electricitywould result in higher CO emissions in the electric2
houses, the Authority were keen to explore the steps whichcould be taken to minimise emissions where tenants wishedto have electric systems installed. The small number ofhouses enabled a more detailed monitoring regime to beadopted than was possible in the other schemes. The fabricinsulation standard achieved was some 25% higher than
Žthe Building Regulations for England and Wales 1990 the.standard in force at the time and overall energy perfor-
mance was similar to the regulations currently in forceŽ w x.Building Regulations for England and Wales 1995 5 .
The 30-house scheme sought to improve the energyefficiency of 30 houses as part of a larger modernisationscheme in an attempt to demonstrate the impact of energyefficiency works when compared with ‘‘normal’’ moderni-sation work. In order to make the comparison, monitoring
Ž .was carried out in both the energy efficient experimentalgroup and a control group of houses from the rest of thescheme. The principal difference in overall energy stan-dard between this scheme and the 4-house scheme was thatwindows were not replaced and therefore glazing U-valueswere not improved. This resulted in an envelope standardsome 25–30 % below that achieved in the 4-house scheme.Condensing gas boilers were installed in all dwellingstogether with a gas fire in the main living room. Thisarrangement resulted in an overall heating efficiency, which
Ž .was potentially lower depending on gas fire usage thanthat in the condensing boiler house in the 4-house schemeŽ .see discussion in Section 4.3 below .
The 200-house scheme was carried out some 12 monthsafter the other two schemes and sought to apply the4-house standard to a full modernisation scheme. Thisscheme was monitored using a sample of 10 houses over a12-month period.
Monitoring data for the 4-house scheme was recordedŽwith the exception of electricity consumption in the two
.gas houses which was read manually using data loggerswith data downloaded at monthly intervals. Sub-metersenabled energy inputs to be disaggregated and in GasHouse A, the heat output form the condensing boiler wasmetered to enable its efficiency to be established. Internaltemperatures in all schemes were logged at three pointsŽ .living room, kitchen, and main bedroom using 2 kV
thermistors in conventional room thermostat housings.Monitoring in the 30- and 200-house schemes was doneusing four channel temperature loggers and energy utility
Ž .meters read manually at approximately monthly intervals .Energy consumption was also cross-referenced with en-ergy utility billing data. Further details are contained in
w xRef. 9 .Part of the function of a demonstration project is to look
at the processes involved in implementation as well as thetechnology. A decision was taken very early in the projectto seek to employ as much of the Authority’s existingmodernisation contracting procedures as possible. This was

( )M. Bell, R. LowerEnergy and Buildings 32 2000 267–280 269
Table 1General construction of dwellings
Characteristic Description
House type Three and two bedroom, semidetached and terraced houses the majority constructed in the 1930s or 1950s.Construction Load-bearing cavity brickwork with a pitched tile roof. Ground floor constructions — a mixture of solid and
2suspended timber. Floor area range; 75–95 m .Condition Sound structural condition and good general repair; internal fixtures, fittings and heating systems in need of replacement;
electric wiring in good condition; roof renewals previously carried out in the 4-house and 200-house schemesŽ .see Table 2 for scheme descriptions .
Existing insulation Existing thickness of loft insulation varied from 25 to 100 mm fitted in the early 1970s. No other added insulation.Heating and hot water Most houses were heated by a gas fire in the main living room and hot water provided by an immersion heater
Ž .fitted to a lagged cylinder. A small number of houses had electric storage heaters installed in the 1970sand an electric fire in the main living room. Hot water was provided from an insulated storage cylinderand heated by an immersion heater designed to operate on an off-peak electricity tariff.
done partly for pragmatic reasons and partly to assess theireffectiveness in delivering energy efficient improvements.In York, these procedures involved small contractors work-ing closely with the authority and the tenant in order toprovide a considerable element of choice over such thingsas bathroom and kitchen fittings and a secondary room
Ž .heater usually a gas fire in the main living room . Thehouses chosen for the 4-house scheme were vacant at thetime of modernisation and all fixtures, fittings and heatingsystems were specified by the project team with no tenantinvolvement. In the 30-house scheme, all tenants wererequired to accept a condensing boiler but had a freechoice as to a secondary gas fire. The 200-house schemeprovided a wider choice of heating system, and although a
majority of tenants chose to have a condensing boiler, thiswas not always the case and particularly where tenants
Žrequested a gas fire with an integral heating boiler for.which condensing versions where not available , a non
condensing boiler with optimiser was fitted. As in the30-house scheme, a free choice of secondary heating wasavailable to all tenants. The results from each scheme arepresented below.
3. The 4-house scheme
The results from the short term monitoring on thisscheme demonstrated considerable improvement in air-
Table 2Energy efficiency works and monitoring arrangements
Scheme Energy efficiency works Monitoringa b4-House scheme Fabric improvements. 200 mm loft insulation, cavity wall insulation , 20 mm low Short term. Co-heating and pressurisation
emissivity double glazing — new timber window and door frames with draught tests before and after improvements.proofing.Heating systems. 4 systems: Gas systems — condensing boiler central system and Long term. Internal temperatures and en-gas unit heater system. Electric systems — off-peak electric boiler system and ergy consumption — May 1992–May 1993.air–air heat pump with resistance heating back-up. Energy flows disaggregated. Measured val
ŽVentilation systems. Gas schemes; intermittent mechanical extract fan in kitchen ues compared with estimates of ‘‘before’’c.and bathroom with trickle vents in new window frames. consumption.
Electric schemes. Balanced MVHR which, in Electric House B, was integrated withthe heat pump and resistance duct heaters to provide whole housing heating.
d30-House scheme 200 mm loft insulation, blown fibre cavity wall insulation , draught-proofing to Internal temperatures and gross energy con-existing windows and doors. Central heating system with gas condensing boiler sumption for the period Nov. 1992–March
Ž .and a gas fire tenant choice as a secondary heat source. Ventilation, as 4-House 1994.scheme — gas houses.
200-House scheme Fabric improvements as the 4-house scheme; most houses were fitted with gas Internal temperatures and gross energy con-Ž . Žboilers a mixture of condensing and non-condensing boilers and a gas fire tenant sumption were monitored in a sample of 10.choice . Some houses had one non-cavity wall which was not insulated. houses — April 1993–March 1995.
Ventilation, as 4-House scheme — gas houses.
a Blown fibre in gas houses, polyurethane foam in electric houses.b w xCo-heating tests give an estimate of the heat loss coefficient of a dwelling — see Refs. 6,7 .c Ž .Energy modeling calculations throughout the project were done using a computer programme NHER evaluator which incorporates the UK Building
w xResearch Establishment’s Domestic Energy Model 8 .d Dwellings in this scheme had a complex mix of cavity, solid and timber frame walls, each requiring different treatment.
( )M. Bell, R. LowerEnergy and Buildings 32 2000 267–280270
Table 3Air-tightness before and after improvements
Dwelling tested Air leakage rates from Percentageblower door tests reductionŽ . Ž .acrh at 50 Pa %
Before After
Gas House B 19.3"1 7.5"0.4 61Electric House A 16.9"1 4.9"0.3 71Electric House B – 6.8"0.3 –
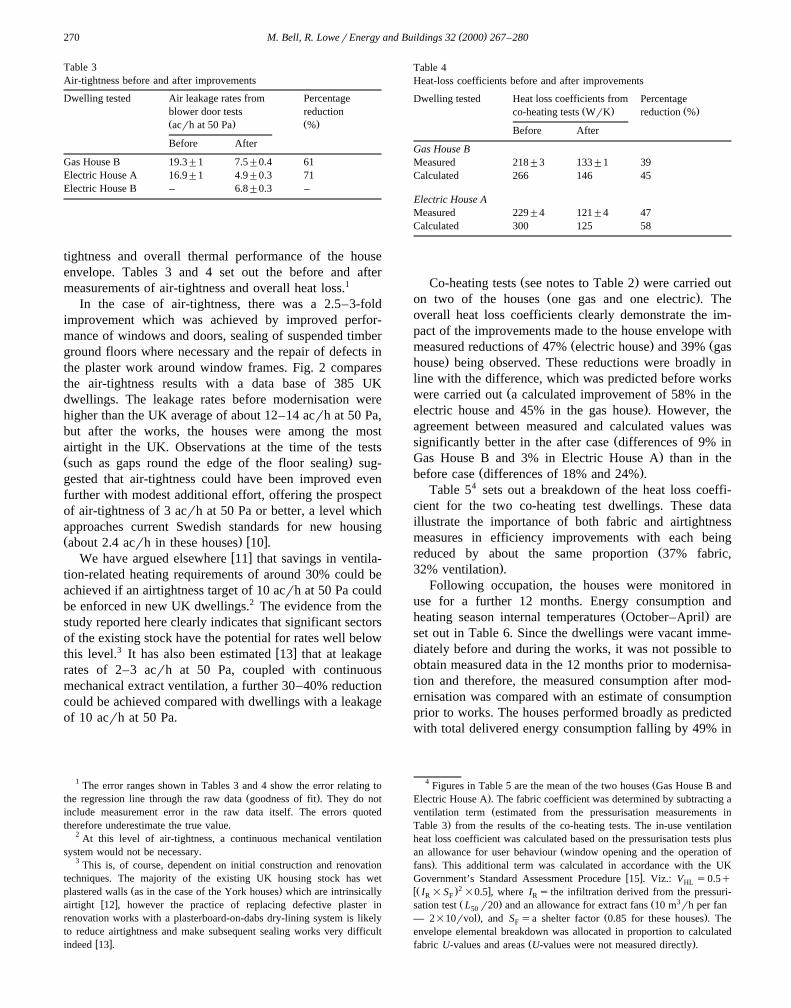
tightness and overall thermal performance of the houseenvelope. Tables 3 and 4 set out the before and aftermeasurements of air-tightness and overall heat loss.1
In the case of air-tightness, there was a 2.5–3-foldimprovement which was achieved by improved perfor-mance of windows and doors, sealing of suspended timberground floors where necessary and the repair of defects inthe plaster work around window frames. Fig. 2 comparesthe air-tightness results with a data base of 385 UKdwellings. The leakage rates before modernisation werehigher than the UK average of about 12–14 acrh at 50 Pa,but after the works, the houses were among the mostairtight in the UK. Observations at the time of the testsŽ .such as gaps round the edge of the floor sealing sug-gested that air-tightness could have been improved evenfurther with modest additional effort, offering the prospectof air-tightness of 3 acrh at 50 Pa or better, a level whichapproaches current Swedish standards for new housingŽ . w xabout 2.4 acrh in these houses 10 .
w xWe have argued elsewhere 11 that savings in ventila-tion-related heating requirements of around 30% could beachieved if an airtightness target of 10 acrh at 50 Pa couldbe enforced in new UK dwellings.2 The evidence from thestudy reported here clearly indicates that significant sectorsof the existing stock have the potential for rates well below
3 w xthis level. It has also been estimated 13 that at leakagerates of 2–3 acrh at 50 Pa, coupled with continuousmechanical extract ventilation, a further 30–40% reductioncould be achieved compared with dwellings with a leakageof 10 acrh at 50 Pa.
1 The error ranges shown in Tables 3 and 4 show the error relating toŽ .the regression line through the raw data goodness of fit . They do not
include measurement error in the raw data itself. The errors quotedtherefore underestimate the true value.
2 At this level of air-tightness, a continuous mechanical ventilationsystem would not be necessary.
3 This is, of course, dependent on initial construction and renovationtechniques. The majority of the existing UK housing stock has wet
Ž .plastered walls as in the case of the York houses which are intrinsicallyw xairtight 12 , however the practice of replacing defective plaster in
renovation works with a plasterboard-on-dabs dry-lining system is likelyto reduce airtightness and make subsequent sealing works very difficult
w xindeed 13 .
Table 4Heat-loss coefficients before and after improvements
Dwelling tested Heat loss coefficients from PercentageŽ . Ž .co-heating tests WrK reduction %
Before After
Gas House BMeasured 218"3 133"1 39Calculated 266 146 45
Electric House AMeasured 229"4 121"4 47Calculated 300 125 58
Ž .Co-heating tests see notes to Table 2 were carried outŽ .on two of the houses one gas and one electric . The
overall heat loss coefficients clearly demonstrate the im-pact of the improvements made to the house envelope with
Ž . Žmeasured reductions of 47% electric house and 39% gas.house being observed. These reductions were broadly in
line with the difference, which was predicted before worksŽwere carried out a calculated improvement of 58% in the
.electric house and 45% in the gas house . However, theagreement between measured and calculated values was
Žsignificantly better in the after case differences of 9% in.Gas House B and 3% in Electric House A than in the
Ž .before case differences of 18% and 24% .Table 54 sets out a breakdown of the heat loss coeffi-
cient for the two co-heating test dwellings. These dataillustrate the importance of both fabric and airtightnessmeasures in efficiency improvements with each being
Žreduced by about the same proportion 37% fabric,.32% ventilation .
Following occupation, the houses were monitored inuse for a further 12 months. Energy consumption and
Ž .heating season internal temperatures October–April areset out in Table 6. Since the dwellings were vacant imme-diately before and during the works, it was not possible toobtain measured data in the 12 months prior to modernisa-tion and therefore, the measured consumption after mod-ernisation was compared with an estimate of consumptionprior to works. The houses performed broadly as predictedwith total delivered energy consumption falling by 49% in
4 ŽFigures in Table 5 are the mean of the two houses Gas House B and.Electric House A . The fabric coefficient was determined by subtracting aŽventilation term estimated from the pressurisation measurements in
.Table 3 from the results of the co-heating tests. The in-use ventilationheat loss coefficient was calculated based on the pressurisation tests plus
Žan allowance for user behaviour window opening and the operation of.fans . This additional term was calculated in accordance with the UK
w xGovernment’s Standard Assessment Procedure 15 . Viz.: V s0.5qHLwŽ .2 xI =S =0.5 , where I s the infiltration derived from the pressuri-R F R
Ž . Ž 3sation test L r20 and an allowance for extract fans 10 m rh per fan50. Ž .— 2=10rvol , and S sa shelter factor 0.85 for these houses . TheF
envelope elemental breakdown was allocated in proportion to calculatedŽ .fabric U-values and areas U-values were not measured directly .

( )M. Bell, R. LowerEnergy and Buildings 32 2000 267–280 271
Ž w x.Fig. 2. UK Pressurisation test data after Ref. 14 .
Gas House A, 54% in Gas House B, and 51% in ElectricHouse A. The exception was Electric House B where,although delivered energy was reduced in line with the
Ž .other houses 50% , the expected reductions associatedwith the application of the heat pump did not to materi-alise. The measured consumption of almost 12,300kWhryear in Electric House B compares with a predicted
Žvalue of just under 9900 kWhryear some 24% greater.than predicted . This was principally because significant
problems with the heat pump installation were experiencedboth in design and use. As a result, the majority of heatingwas provided by backup electric resistance heaters.
Reliable internal temperature data was available for thetwo gas houses and Electric House A. Average tempera-
Ž .tures in the gas houses 17.38C in A and 16.98C in B werebroadly in line with temperatures observed on other
Žschemes in the project 17.68C, 30-house scheme; 18.88C,.200-house scheme with other UK energy modernisation
Ž w x.schemes see for example Refs. 16,17 and with a UKŽ .average 1990–1996 of 17.28C for centrally heatedw x 5dwellings 18 . The average temperature in Electric House
Ž .A 19.68C was high by UK standards and compares with18.48C in the Pennyland new build scheme at approxi-
w xmately the same level of insulation 21 .As would be expected, the reductions in CO were of2
the same order of magnitude as energy reductions. How-ever, reductions in the gas houses were influenced by anelement of fuel switching from electric to gas water heat-
5 We are grateful to one of the referees for reminding us that the UKw xaverage in the Domestic Energy Fact File 18 is not measured directly
but inferred from energy calculations on the stock. The only source ofmeasured data on the stock as a whole comes from the English House
w xCondition Survey 19 . This survey recorded average spot temperatures of19.58C and 18.38C in living room and hall, respectively. Although there issome evidence that the hall temperature may be a good guide to whole
w xhouse temperature at the time of measurement 20 , these data are spotŽ .measurements taken in daytime, in mild weather and do not provide a
reliable guide to whole house average heating season temperatures.
Table 5Ž .Heat loss coefficient WrK broken down by element
Element Before After
Mean % Mean %
Floor 25 11 25 17Wall 83 37 37 25Windows and doors 47 21 40 28Roof 20 9 9 6Fabric heat loss coefficient 175 78 111 77Ventilation heat loss coefficient 50 22 34 23Total heat loss coefficient 225 100 145 100
ing. Overall, CO from the electric houses remains much2
larger than the gas houses, reflecting the current largediscrepancy between the carbon intensity of the two fuelsŽ .see coefficients in the notes to Table 6 .
Of particular interest in the 4-house scheme was theperformance of the different heating systems and the waythey were understood and operated by the occupants andlocal authority staff. Prior to the demonstration project, thevast majority of tenants chose hydronic gas central heatingsystems. A few electric storage systems were installedwhere a tenant expressed a particular preference for elec-tricity. Not surprisingly, the systems which presented thefewest problems for installers and tenants were the conven-tional gas-fired hydronic and storage electric heating sys-tems. Generally, these systems performed as expected andtenants were clear as to their mode of operation. In thecase of Gas House A, the mean annual boiler efficiencywas 89% with very little variation regardless of mean dailyload. From the tenant’s point of view, the system was littledifferent from any other gas central heating system andoperation was easy to understand. In Gas House B, the unitheater system was capable of central timing control butthis was never used by the tenant, whose previous experi-
Ž .ence a single solid fuel fire and general uncertainty aboutheating costs, led her to switch heaters on and off individu-ally. Although the house was designed to be heated withthree heaters, the tenant, as a matter of convenience, chose
Žto use only two one on the ground floor and one on the.first floor landing . Some discomfort problems were expe-
rienced by the tenant, which appeared to have been causedby an uneven heat distribution resulting from the place-ment of individual heaters. The main difficulty was theinability of the system to provide enough heat to theentrance hall and stairway, a problem which could besolved by the siting of an additional heater in the entrancehall, and by improving the airtightness and U-value of the
Žexternal door external doors were a significant source of2 .air leakage, and had U-values between 3 and 4 Wrm K .
Despite these design problems, the scheme demonstrated apotential, at least in small dwelling modernisation, for unitheater schemes at a cost considerably less than that of afull hydronic central heating system.

( )M. Bell, R. LowerEnergy and Buildings 32 2000 267–280272
Table 6Long term monitoring results — 4-house scheme
Scheme Heating system Before Aftera b bŽ . Ž . Ž . Ž . Ž . Ž . Ž .Gas kWh Electric kWh CO te Gas kWh Electric kWh CO te Int. temp. 8C2 2
Gas House A Condensing boiler 23,900 4300 6.73 13,160 1209 3.12 17.3Gas House B Gas unit heaters 11,535 1524 2.97 16.9Electric House A Off-peak electricity – 24,800 12.64 – 12,225 6.23 19.6Electric House B Air-to-air heat pump – – 12,296 6.27 –
a Electricity consumption before improvements included on-peak water heating which after improvement was heated by the gas in the gas houses andoff-peak electricity in the electric houses.
b w xThe carbon coefficients used in this table are taken from the UK Standard Assessment Procedure for the energy assessment of dwellings 15 : GasŽ . Ž . Ž .0.19 kg CO rkWh, Electricity UK 0.51 kg CO rkWh.2 2
The systems in the electric houses presented muchgreater problems. In common with the gas systems, theelectric storage boiler system in Electric House A was easyto understand and presented few problems for the tenant.However, the use of the mechanical ventilation with heat
Ž .recovery MVHR system was less than optimal. Thishouse was the most airtight of the four houses and wassufficiently air-tight to require continuous mechanical ven-tilation. Although the monitoring data are not conclusive,it would appear that use of the system was very intermit-tent. This suggests that the introduction of unfamiliarsystems requires considerable attention to tenant adviceand the training of local authority managers. Evidence
w xfrom elsewhere 13 indicates, however, that the effectiveuse of MVHR systems by occupants is achievable throughappropriate design and occupant advice. The study by
w xLowe and Johnston 13 also demonstrated the potentialCO benefits of efficient MVHR systems over continuous2
mechanical extract at all levels of air-leakage but particu-larly at levels below 3 acrh at 50 Pa.
Monitoring of the air-to-air heat pump system in Elec-tric House B indicated that it contributed only a very smallfraction of the space heating requirement. Problems in-cluded the frequent cutting out of the heat pump condenser
Ždue to excessive condensing temperatures suggesting in-.adequate air flow , an inability of the system to maintain
adequate temperatures, particularly in the first floor areaand difficulties experienced by the occupant in understand-ing the rather complex control system. It is difficult to becertain about the precise nature of all of the technicalproblems, but it is clear that the system was not well suitedto the needs of the tenants, and that it would have required
a further 2–3-fold reduction in design heat load to operatesatisfactorily. This is not to say that the various problemscannot be overcome but more research and trial activitywould be required in order to build up the necessaryexperience in the conditions encountered in modernisationwork in the UK.
4. The 30-house scheme
This scheme presented an opportunity to monitor en-ergy efficiency improvements against a control group ofdwellings in the same modernisation scheme but with noadditional energy efficiency works. Good monitoring datawas available for 21 experimental houses and 11 control
Žhouses and the monitoring period from the autumn of.1992 to the summer of 1994 included data from two
heating seasons. Table 7 sets out the energy characteristicsof the two groups, under standard occupancy conditions,both before modernisation and on the assumption that theywere improved to the authority’s normal modernisationstandard. The two groups were remarkably well matchedin terms of their energy characteristics, with the expectedtotal energy consumption varying by only 2% before mod-ernisation and less than 1% if both groups were mod-ernised to the normal standard. This analysis would sug-gest that physical differences in the dwellings are notlikely to have had a significant influence on the monitoringresults. It was not possible to control directly for occu-pancy or user behaviour, however a simple occupancycomparison indicates a broadly similar profile in bothgroups with an average of 3.1 persons per household in the
Table 7Energy characteristics of 30-house study groups
Group Before improvement Improvement to normal modernisation standard
Ž . Ž . Ž . Ž . Ž . Ž .Gas kWh Electric kWh Total kWh Gas kWh Electric kWh Total kWh
Experimental 26,946 7944 34,890 27,864 3246 31,110Control 26,290 7818 34,109 27,851 3081 30,932Difference 656 126 781 13 165 178

( )M. Bell, R. LowerEnergy and Buildings 32 2000 267–280 273
Fig. 3. Internal temperatures.
Ž .experimental group 1.86 adults and 1.24 children andŽ .3.36 in the control group 2.0 adults and 1.36 children .
Despite the similarity, occupancy and user behaviour arelikely to be an important source of extraneous variability.
4.1. Internal temperatures and energy consumption
Continuous monitoring of internal temperatures andenergy consumption was carried out in both groups of
Ž .houses see Table 2 and the results compared. Fig. 3shows average internal temperatures against external tem-peratures for both groups over the whole of the monitoringperiod. Despite the difference in levels of insulation, bothgroups maintained similar internal temperatures. As exter-nal temperatures rise into the summer period, the amountof scatter is reduced as internal temperatures become morea function of external temperature and incidental gainsrather than levels of heating. Average heating season inter-nal temperatures of 17.98C in the experimental group and17.48C in the control group were recorded. In energyterms, the half degree difference would amount to some-thing in the region of 1360 kWh over a full heating season.The small temperature difference suggests that the major-ity of the benefits of the energy efficiency measures weretaken in real energy savings rather than in higher tempera-tures.
The results of the energy monitoring together withenergy modeling predictions are set out in Table 8. Sincethe houses were heated by gas, the impact of the insulationand efficiency measures would be expected to result in asignificant difference in the gas consumption of the twogroups. As can be seen from Table 8, such a differencewas observed which was statistically significant.6 Theprobability of this difference occurring by chance is less
Ž .than 3% Ps0.022 . The difference in electricity con-Ž .sumption is not significant Ps0.201 . Although a signif-
icant difference in gas consumption exists, it is consider-
6 A one tailed t-test was used to test the significance of difference inmean energy consumption between the two groups.
Table 8Energy consumption — 30-house scheme
Ž . Ž .Gas kWh Electric kWh TotalŽ .kWh
Measured annual consumptionExperimental 19,313 3138 22,451
Ž . Ž .SDs4367 SDs1375Control 23,092 3529 26,621
Ž . Ž .SDs5565 SDs893Difference 3779 391 4170Temperature Adjusted 5145 391 5536Difference
Predicted annual consumptionExperimental 16,671 3104 19,775Control 27,851 3081 30,932Difference 11,180 y24 11,157
ably smaller than that predicted by energy modeling. Thissuggests that there are important variations in use whichobscure the effects of the energy efficiency measures.Some of these issues are discussed in Section 4.3 below.
4.2. Cost and pay-back issues
The marginal cost of the energy efficiency works aver-aged some £1450, at the time the works were carried out in1992, giving a simple pay-back time of around 17 yearsbased on measured consumption or about 8 years if pre-dicted consumption is used. This contrasts with marginal
Ž .costs for Gas House A condensing boiler system in the4-house scheme of about £1000 and energy cost savings of£174 over those measured in the control group with asimple pay-back period of between 5 and 6 years. Thiswide variation in pay-back was largely a function ofconstructional differences in the house types. Fig. 4 illus-
Ž .trates the most expensive house type house type C whichhad three types of wall construction, cavity masonry formain walls, a timber frame mansard wallrroof, and solidmasonry below bay windows and to separating walls be-
Fig. 4. House type C.
( )M. Bell, R. LowerEnergy and Buildings 32 2000 267–280274
Ž .tween the main house and attached unheated outhouses.Although the solid and timber walls covered only 13% of
Žthe total wall area the costs of insulation mainly dry-lin-.ing work constituted just over 85% of the costs of wallŽ .insulation £920 out of a total of £1070 . Some of this
extra cost could be reduced in future schemes with in-creased volumes and familiarisation with the techniques onthe part of contractors but costs are unlikely to fall toanywhere near the £150 for blown fibre cavity fill. Thisexperience highlights the potential benefits of identifyingpotential upgrade paths at the design stage, particularly inthe light of an increasing need to continually reduce theenvironmental impact of buildings in general.
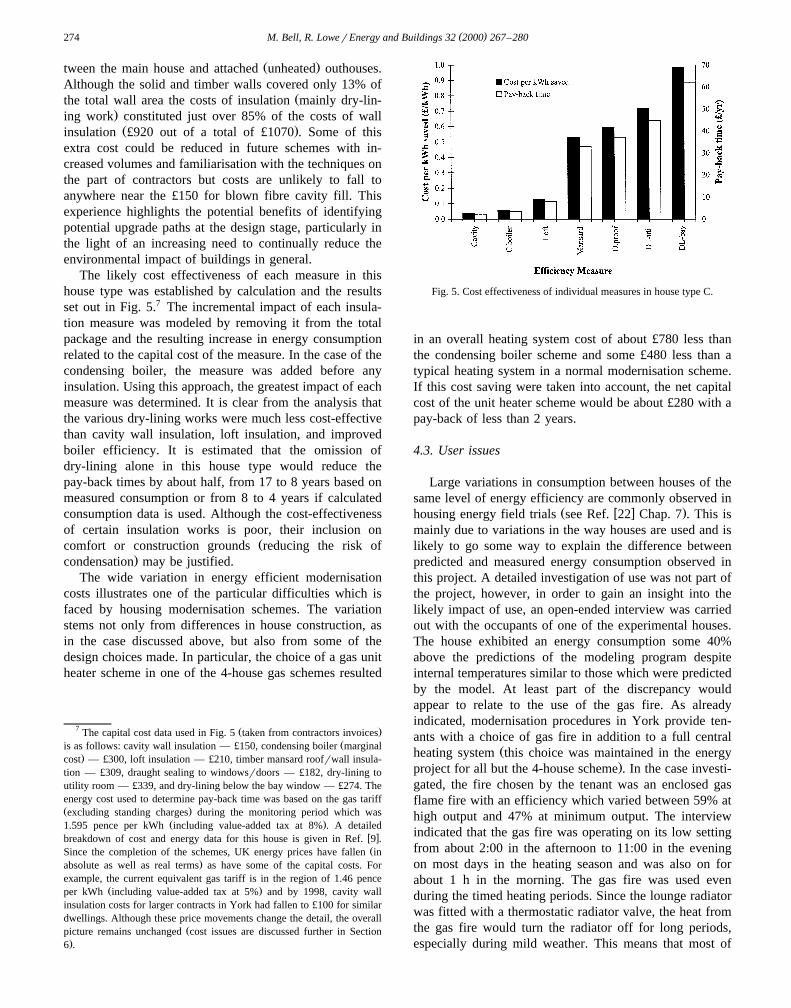
The likely cost effectiveness of each measure in thishouse type was established by calculation and the resultsset out in Fig. 5.7 The incremental impact of each insula-tion measure was modeled by removing it from the totalpackage and the resulting increase in energy consumptionrelated to the capital cost of the measure. In the case of thecondensing boiler, the measure was added before anyinsulation. Using this approach, the greatest impact of eachmeasure was determined. It is clear from the analysis thatthe various dry-lining works were much less cost-effectivethan cavity wall insulation, loft insulation, and improvedboiler efficiency. It is estimated that the omission ofdry-lining alone in this house type would reduce thepay-back times by about half, from 17 to 8 years based onmeasured consumption or from 8 to 4 years if calculatedconsumption data is used. Although the cost-effectivenessof certain insulation works is poor, their inclusion on
Žcomfort or construction grounds reducing the risk of.condensation may be justified.
The wide variation in energy efficient modernisationcosts illustrates one of the particular difficulties which isfaced by housing modernisation schemes. The variationstems not only from differences in house construction, asin the case discussed above, but also from some of thedesign choices made. In particular, the choice of a gas unitheater scheme in one of the 4-house gas schemes resulted
7 Ž .The capital cost data used in Fig. 5 taken from contractors invoicesŽis as follows: cavity wall insulation — £150, condensing boiler marginal
.cost — £300, loft insulation — £210, timber mansard roofrwall insula-tion — £309, draught sealing to windowsrdoors — £182, dry-lining toutility room — £339, and dry-lining below the bay window — £274. Theenergy cost used to determine pay-back time was based on the gas tariffŽ .excluding standing charges during the monitoring period which was
Ž .1.595 pence per kWh including value-added tax at 8% . A detailedw xbreakdown of cost and energy data for this house is given in Ref. 9 .ŽSince the completion of the schemes, UK energy prices have fallen in
.absolute as well as real terms as have some of the capital costs. Forexample, the current equivalent gas tariff is in the region of 1.46 pence
Ž .per kWh including value-added tax at 5% and by 1998, cavity wallinsulation costs for larger contracts in York had fallen to £100 for similardwellings. Although these price movements change the detail, the overall
Žpicture remains unchanged cost issues are discussed further in Section.6 .
Fig. 5. Cost effectiveness of individual measures in house type C.
in an overall heating system cost of about £780 less thanthe condensing boiler scheme and some £480 less than atypical heating system in a normal modernisation scheme.If this cost saving were taken into account, the net capitalcost of the unit heater scheme would be about £280 with apay-back of less than 2 years.
4.3. User issues
Large variations in consumption between houses of thesame level of energy efficiency are commonly observed in
Ž w x .housing energy field trials see Ref. 22 Chap. 7 . This ismainly due to variations in the way houses are used and islikely to go some way to explain the difference betweenpredicted and measured energy consumption observed inthis project. A detailed investigation of use was not part ofthe project, however, in order to gain an insight into thelikely impact of use, an open-ended interview was carriedout with the occupants of one of the experimental houses.The house exhibited an energy consumption some 40%above the predictions of the modeling program despiteinternal temperatures similar to those which were predictedby the model. At least part of the discrepancy wouldappear to relate to the use of the gas fire. As alreadyindicated, modernisation procedures in York provide ten-ants with a choice of gas fire in addition to a full central
Žheating system this choice was maintained in the energy.project for all but the 4-house scheme . In the case investi-
gated, the fire chosen by the tenant was an enclosed gasflame fire with an efficiency which varied between 59% athigh output and 47% at minimum output. The interviewindicated that the gas fire was operating on its low settingfrom about 2:00 in the afternoon to 11:00 in the eveningon most days in the heating season and was also on forabout 1 h in the morning. The gas fire was used evenduring the timed heating periods. Since the lounge radiatorwas fitted with a thermostatic radiator valve, the heat fromthe gas fire would turn the radiator off for long periods,especially during mild weather. This means that most of

( )M. Bell, R. LowerEnergy and Buildings 32 2000 267–280 275
the lounge heat would be provided by the fire running atabout 47% efficiency, compared with the condensing boilerat an efficiency between 85% and 90%. A crude assess-ment of this effect would suggest that the operation of thefire could account for just under half the difference be-tween measured and predicted levels of consumption. Abroader analysis of gas fire choices in the experimentaland control houses indicates choices of fire, which aresimilar to that in the above example.
Given the larger efficiency differential between primaryand secondary systems in the experimental group, gas fireusage would have a much greater impact in this group thanthe control group. If, for example, a gas fire was providing20% of the heating, the increase in consumption would be14% in the experimental group but only 4% in the controlgroup.
The issue of gas fire choice and use has been discussedin some detail in order to illustrate the potential impact ofuse on consumption and also to highlight the need for theprovision of guidance to tenants and social landlords on
Ž .both the choice of fire if any and its use, particularly inhouses fitted with condensing boilers. This need for adviceis further reinforced by the findings of a satisfactionsurvey in both groups, which showed that a very high
Ž .proportion of tenants 80% used some combination of gasŽfire and central heating. One particular fire choice a
.decorative open gas flame type presents a particular prob-lem, not only because it is only 42% efficient at all settingsbut also because the open chimney increases ventilationlosses even when the fire is not in use.8 In contrast, the gashouses from the 4-house scheme, on the advice of themonitoring team, did not include focal point fires and amuch closer match between predicted and measured en-ergy consumption was observed. Other aspects of use inthe case investigated related to the opening of windows inbed rooms, hot water consumption, and thermostat set-tings, most of which would tend to increase consumptionin this particular case.
The variation could be further explained by the difficul-Ž .ties of estimating heat losses both fabric and ventilation .
Ž .Since unlike the 4-house scheme the properties were notpressure tested, it is not possible to assess the likelyvariation in ventilation heat losses between the two groups.In the case of fabric heat loss, difficulties in estimating theimpacts of thermal bridging in existing properties mayhave contributed to the discrepancy between calculatedand observed performance. Evidence from the 4-housescheme, where it was possible to extract a reasonable
8 It would be a considerable achievement on the part of the manufac-turers to produce natural gas-fired heating systems that emit more carbondioxide than electric resistance heating in a fossil fuel fired grid. Never-theless, against the background of generation efficiencies of modern,combined cycle gas-fired power stations, these fires probably succeed!
Ž .estimate of the fabric heat loss coefficient see Table 5from co-heating and pressurisation tests on two of thehouses, gives some support to this possibility. A compari-son of this estimate with that from the modeling softwareindicates that in the before case, the calculations over-estimated fabric heat loss by 27% but after improvements,the corresponding figure was a 9% under-estimate.
The U-value calculator in the Evaluator program usesw xthe proportional areas method 23 and ignores thermal
bridging around windows and at other junctions. Given theŽ .difference in insulation levels particularly in walls be-
tween the two groups, it is possible that the thermalbridges would have a more marked effect in the experi-
Žmental group than the control group as is indicated by the.data from the 4-house scheme . We have argued else-
w xwhere, in the context of building regulation 24 , thatU-value calculation methods used in the UK need to takemuch greater account of thermal bridging and that suitablemethods are needed for the design of new dwellings.However, although it would be possible to apply methodsdesigned for new construction to existing dwellings, thereare likely to be significant practical problems in establish-ing construction details with sufficient precision. Internaltemperature assumptions are another possible source ofdiscrepancy. The worse the dwelling insulation, the largerthe spatial variation in internal temperature. Temperaturesbased on the average of three point values may thereforenot have been a good guide to actual mean whole housetemperature in any of the 30-house group, but particularlyin the houses before improvement.
5. The 200-house scheme
This scheme sought to achieve a standard of energyefficiency similar to that of the 4-house scheme. Howeverbudgetary priorities and tenant choices meant that thestandard achieved was somewhere between that of the30-house and 4-house schemes. The main differences in-cluded non-condensing boilers in a number of houses, poor
Ž 2 .efficiency focal point fires, small areas about 12 m ofsolid wall adjacent to covered passage ways betweenhouses which were not insulated and no attempt to im-prove air-tightness by sealing suspended ground floors.
Good monitoring data was available from 10 houses,one of which was heated electrically. The mean deliveredenergy consumption in the gas-heated houses was 18,600
Ž .kWh 16,700 kWh gas, 1900 kWh electricity . However,internal temperatures were, on average, higher in the 200-house scheme than any of the other schemes. The averagetemperature in the houses monitored was 18.88C. Thiscompares with 17.18C in the 4-house gas houses, 17.98C in
Ž .the experimental group 30-house scheme and 17.48C inthe 30-house scheme control group. Normalising energyconsumption against the average temperature observed inthe 30-house scheme experimental group, the equivalent
( )M. Bell, R. LowerEnergy and Buildings 32 2000 267–280276
Žconsumption would be in the region of 17,200 kWh 15,300.kWh gas, 1900 kWh electricity .
6. Discussion
The objective of the demonstration project was to showthe extent to which the application of readily available andwell understood technology, as part of housing modernisa-tion, could reduce energy consumption and CO . The data2
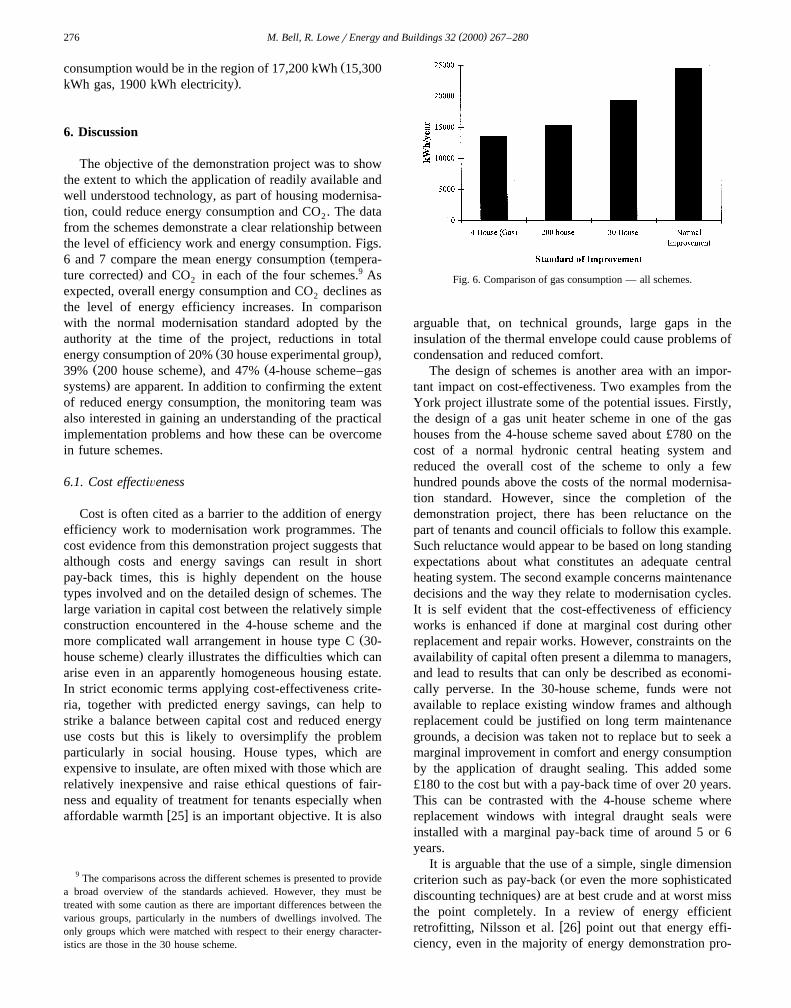
from the schemes demonstrate a clear relationship betweenthe level of efficiency work and energy consumption. Figs.
Ž6 and 7 compare the mean energy consumption tempera-. 9ture corrected and CO in each of the four schemes. As2
expected, overall energy consumption and CO declines as2
the level of energy efficiency increases. In comparisonwith the normal modernisation standard adopted by theauthority at the time of the project, reductions in total
Ž .energy consumption of 20% 30 house experimental group ,Ž . Ž39% 200 house scheme , and 47% 4-house scheme–gas.systems are apparent. In addition to confirming the extent
of reduced energy consumption, the monitoring team wasalso interested in gaining an understanding of the practicalimplementation problems and how these can be overcomein future schemes.
6.1. Cost effectiÕeness
Cost is often cited as a barrier to the addition of energyefficiency work to modernisation work programmes. Thecost evidence from this demonstration project suggests thatalthough costs and energy savings can result in shortpay-back times, this is highly dependent on the housetypes involved and on the detailed design of schemes. Thelarge variation in capital cost between the relatively simpleconstruction encountered in the 4-house scheme and the
Žmore complicated wall arrangement in house type C 30-.house scheme clearly illustrates the difficulties which can
arise even in an apparently homogeneous housing estate.In strict economic terms applying cost-effectiveness crite-ria, together with predicted energy savings, can help tostrike a balance between capital cost and reduced energyuse costs but this is likely to oversimplify the problemparticularly in social housing. House types, which areexpensive to insulate, are often mixed with those which arerelatively inexpensive and raise ethical questions of fair-ness and equality of treatment for tenants especially when
w xaffordable warmth 25 is an important objective. It is also
9 The comparisons across the different schemes is presented to providea broad overview of the standards achieved. However, they must betreated with some caution as there are important differences between thevarious groups, particularly in the numbers of dwellings involved. Theonly groups which were matched with respect to their energy character-istics are those in the 30 house scheme.
Fig. 6. Comparison of gas consumption — all schemes.
arguable that, on technical grounds, large gaps in theinsulation of the thermal envelope could cause problems ofcondensation and reduced comfort.
The design of schemes is another area with an impor-tant impact on cost-effectiveness. Two examples from theYork project illustrate some of the potential issues. Firstly,the design of a gas unit heater scheme in one of the gashouses from the 4-house scheme saved about £780 on thecost of a normal hydronic central heating system andreduced the overall cost of the scheme to only a fewhundred pounds above the costs of the normal modernisa-tion standard. However, since the completion of thedemonstration project, there has been reluctance on thepart of tenants and council officials to follow this example.Such reluctance would appear to be based on long standingexpectations about what constitutes an adequate centralheating system. The second example concerns maintenancedecisions and the way they relate to modernisation cycles.It is self evident that the cost-effectiveness of efficiencyworks is enhanced if done at marginal cost during otherreplacement and repair works. However, constraints on theavailability of capital often present a dilemma to managers,and lead to results that can only be described as economi-cally perverse. In the 30-house scheme, funds were notavailable to replace existing window frames and althoughreplacement could be justified on long term maintenancegrounds, a decision was taken not to replace but to seek amarginal improvement in comfort and energy consumptionby the application of draught sealing. This added some£180 to the cost but with a pay-back time of over 20 years.This can be contrasted with the 4-house scheme wherereplacement windows with integral draught seals wereinstalled with a marginal pay-back time of around 5 or 6years.
It is arguable that the use of a simple, single dimensionŽcriterion such as pay-back or even the more sophisticated
.discounting techniques are at best crude and at worst missthe point completely. In a review of energy efficient
w xretrofitting, Nilsson et al. 26 point out that energy effi-ciency, even in the majority of energy demonstration pro-

( )M. Bell, R. LowerEnergy and Buildings 32 2000 267–280 277
Ž .Fig. 7. CO emissions measured gas consumption — all schemes.2
jects, is not the prime objective of housing modernisationschemes. In most cases, the concerns are about the creationof a high quality internal environment, which fulfills theneeds of tenants or prospective purchasers, a situationwhich also pertained to the York schemes. The vast bulkof modernisation expenditure is not spent on energy effi-ciency measures but on new kitchens, new bathrooms, theinstallation of a central heating system, and general repairsand replacements. All of these items are carried out fortheir amenity value not for reasons of cost-effective pay-back. The critical point in the context of the need to createa sustainable housing stock is that the required level ofamenity and comfort can be achieved in an energy effi-cient way or an energy profligate way. As was demon-strated in the 30-house scheme, the control group main-tained similar internal temperatures to the experimentalgroup because their heating systems had a heat outputwhich was able to counteract the greater heat loss andtenants were able to afford the energy costs involved. Fewwould argue that the creation of a high standard of comfortshould not remain an important target but it is certainlyarguable that any extra cost incurred in achieving it in anefficient way should be seen as providing benefits whichare wider than the annual fuel bill savings. In order toachieve a more sustainable housing stock, policy makersneed to embrace these wider issues. In any case, it is likelythat many of the additional capital costs will fall in thelonger term as energy efficient technology becomes main-stream.
6.2. Design and buildability issues
In broad terms, the additional energy efficiency workspresented few problems for contractors and modernisationmanagement processes. However, the discussion of usefactors emerging from the 30-house scheme suggest thatconsiderable care should be taken in the specification ofsecondary heating appliances particularly when a highefficiency main system is installed. In the context of the
provision of choice for tenants, this would suggest a strongcase for restricting system choice to ensure that overallefficiencies are not jeopardised. This is also an example ofwhere expenditure has been incurred which, although satis-
Ž .fying a perceived tenant ‘‘need’’ largely an aesthetic one ,may well have acted to increase energy consumption ratherthan reduce it. Advice to tenants may also help to reducethe problem but given the difficulties of providing such
w xadvice, it is likely to have only marginal impact 27 .The design of heating systems generally was a matter of
some concern in the early stages of the project, with atendency for individual designers, used to poorly insulateddwellings, to consistently oversize condensing boilers. Al-though the impact of oversizing on boiler efficiency was
Ž w x .very small see Ref. 9 p. 25 the impact on capital costwas considerable. This indicates a need for industry widetraining and education, which would enable designers andinstallers in the domestic sector to respond to the require-ments of a more highly insulated housing stock. Detailed
Žanalysis of the heating system in Gas House A 4-house.scheme indicated that mean daily boiler load did not rise
above 4 kW with a boiler rated at 9.1 kW and that theboiler was operating at full capacity for only a few days
w xper year 9 . Continuous operation of the boiler in verycold weather could have enabled a significantly lowerboiler rating with the potential for significant cost savings.The difficulty with this however, is that there are nocondensing boilers available on the UK market with a
w xrating lower than 9 kW 28 . If there is to be a morerigorous approach to the sizing of boilers in moderniseddwellings and in new dwellings, where the opportunitiesfor higher insulation standards are much greater, manufac-turers need to bring to the market systems which are muchbetter matched to actual design heat loads in typical newand refurbished dwellings. But, perhaps more importantly,the artificial price premium for condensing over non-con-densing boilers should be sharply reduced.
6.3. Impact of the demonstration project
The objective of demonstration projects is to encouragethe widespread adoption of the technologies being demon-strated and given adequate follow up and disseminationwork, they can have an important impact on subsequent
w xpractice 29 . At a national level, the York project hasplayed its part along with other schemes in the Greenhouse
w xProgramme 3,4 in raising the profile of energy efficientmodernisation in social housing. However, its greatestimpact has been within the host local authority. The posi-tive impacts have included the instigation by the localauthority of a mass cavity wall insulation programmewhich began even before monitoring work had been com-pleted and saw all cavity walled dwellings owned by theAuthority insulated by the middle of 1997. The impact onlocal authority policy making also resulted in the establish-ment of a 5-year strategy to improve the efficiency of the

( )M. Bell, R. LowerEnergy and Buildings 32 2000 267–280278
local authority stock overall. Modernisation options werewidened to include the addition of condensing boilers,additional roof insulation, and window replacements withlow emissivity double glazing. Although the demonstrationproject has been successful in influencing modernisationpolicy, barriers remain to the whole-hearted adoption ofcondensing boilers. Problems include budgetary arrange-ments which militate against the choice of a condensing
Žboiler by the tenant each dwelling has a small budget for‘‘extras’’ which can be chosen by the tenant and theadditional cost of a condensing boiler is taken from this
.budget and a residual scepticism on the part of somesurveyors and installers as to their cost-effectiveness andlong term performance and reliability. In addition, theaesthetic requirement for a secondary heating applianceŽ .usually a gas fire has been maintained and very fewsystems are installed which do not include this element. Asalready discussed, this adds to capital cost and energy
w xconsumption and may have adverse health effects 30 .However, the findings of the project have persuaded theAuthority to restrict the choice of fire types so as toeliminate those with very low efficiencies.
The project was also very successful in developingŽ .from a low base the energy expertise of the technical andmanagement staff in the Authority and also of the contrac-tors involved in carrying out the work. Given that themodernisation team at York is typical of many localauthorities in the UK, the incorporation of energy effi-ciency into the modernisation of social housing requiresthe maintenance of a high level of training and staffdevelopment. Without such a development programme,many opportunities to reduce emissions from existinghousing will be lost.
7. The project in context — a conclusion
The York project has clearly demonstrated that there isconsiderable scope for the improvement of single family
Žhousing through the application of well established early.1980s technology and that existing modernisation proce-
dures are capable of delivering these improvements. Thishas been demonstrated through the monitoring results andthrough the subsequent experience of the authority inimplementing the lessons learned. However, if the contri-bution of this type of modernisation work to the develop-ment of a sustainable housing stock is to be understood, itis also important to place the results into the context ofother schemes. Fig. 810 shows how the highest standard
10 The source of the data for Fig. 8 is as follows: GB average —w xcompiled from 2,18 ; Building regulations — BREDEM calculation
based on the application of The Building Regulations 1995 for Englandw xand Wales Approved Document L 5 to the York dwellings; Østerbro —
w x w x w x31 Pennyland — 21 ; Longwood — Lowe and Curwell 32 ; Kranich-w xstein — 33 .
Ž)Fig. 8. The York Energy Demonstration Project in context data on.lighting and appliance consumption, not available .
achieved in York compares with the energy efficiency ofŽBritish housing overall existing and the current new-build
.standard implied by the Building Regulations , a EuropeanŽ .retrofit project Østerbro and three low energy new-build
w xhousing projects. The Østerbro scheme 31 is one of themost efficient of recent large scale improvement projects,
w xthe Pennyland houses 21 represent the best of the UKlow energy projects of the 1970s and 1980s, the Longwood
w xHouse 32 represents one of the most energy efficient UKschemes of the 1990s, and the Passivhaus project atKranichstein in Germany represents the best of the low
w xenergy housing projects undertaken in Europe to date 33 .Pennyland and Longwood addressed the concerns of the1970s, which were the exhaustion of fossil fuels andsecurity of supply, with the technology of the 1970s andearly 1980s. Kranichstein addresses the much more de-manding agenda of the 1990s, the stabilisation of atmo-spheric CO concentration, with the technology of the2
1990s. As can be seen, the best of the houses at Yorkoutperform the British average by over 30%, are compara-ble with the current standard for new UK housing andapproach the level achieved in the Pennyland scheme.They do, however, fall some way short of the level set byLongwood and the energy retrofit scheme at Østerbro anddo not begin to achieve the performance of the PassiveHouses at Kranichstein.
The agenda at York was to implement an energy effi-ciency programme at modest cost, that could be under-taken by a Local Authority acting alone within theconstraints imposed by existing housing modernisationprogrammes, concentrating on space heating and to alesser extent water heating, and using readily availabletechnology. Although significant improvements were madein York, it is possible to identify a number of furtherimprovements in space and water heating which could becarried out. The likely effect of these further improvements
Ž .is shown in Fig. 8 York potential .

( )M. Bell, R. LowerEnergy and Buildings 32 2000 267–280 279
It has been argued that the development of buildingregulations in England and Wales, within the first decadeof the next millennium, could see fabric U-values reducedconsiderably in new housing. For example, U-values of 0.2for walls and ground floors, 1.3 for windows, 0.6 for soliddoors, and 0.15 for roofs are achievable at reasonable costw x24 . The houses in York lend themselves to further im-provements to roofs, windows, and doors without majorstructural modifications and there is no fundamental im-pediment to the achievement of radically reduced U-valuesfor these elements in most of the existing stock, especially
Žif carried out during replacement works roof replacementalso provides an ideal opportunity to eliminate thermalbridging particularly if insulation is placed at rafter level to
.create a warm roof construction . Recent developments inthe efficiency of condensing boilers have seen seasonal
w xefficiencies rise to around 90% 28 . In addition to theseimprovements with respect to space heating, savings inwater heating could be achieved by the application ofactive solar systems, improvements in storage tank insula-tion and pipe insulation, and the adoption of water savingmeasures such as aerating taps and showers. Improvementsin domestic appliances also offer the prospect of savings inthe consumption of electricity for lights and appliances.The net effect of such improvements would be to reduceoverall consumption in houses similar to those in York toaround 110 kWhrm2ra, an overall reduction of 60% withrespect to the British average and a level which has beensurpassed by only a small number of new houses in the
w xUK to date 34 . The difference between the actual andpotential performance of the 4-house retrofit at York hasimplications for policy, since significant opportunity costsare incurred by applying readily available technologywhich, almost by definition, is below the performance ofthe best. It is for example, unlikely that the windowsactually installed at York, whose U-value exceeds thecurrent state-of-the-art by a factor of at least 2, will bereplaced for another four decades. It is reasonable tosuppose that if such opportunity costs were considered,alongside initial capital cost the adoption of higher perfor-mance technology would be more widespread.
Ž .The Østerbro scheme Fig. 8 illustrates the impact of amore technologically innovative approach to retrofit. Thisscheme of improvement to a five storey apartment blockin, Copenhagen was able to achieve a consumption of 61kWhrm2 for space and water heating in a retrofit whichincluded a range of passive solar measures such as an
Ž .innovative solar wall incorporation transparent insulationand active solar water heating as well as insulation and
w xwindow improvements 31 . This is considerably lowerŽ . Ž57% than that actually achieved in York 143
2 .kWhrm ra . However, our assessment of the potential forŽ 2further improvement in the York houses 83 kWhrm ra
.for space and water heating suggests that the achievementat Østerbro could be emulated in dwellings similar to thoseencountered in York. The economics are, of course vastly
different with a 33-year pay-back time in the ØsterbroŽ .scheme caused mainly by the solar wall compared with
around 5 years in the 4-house scheme in York.11
Although this project has been able to demonstrate thatthe technology can be successfully applied and that it iswell within the capacity of existing technology and con-struction practice, the major problem facing the UK andmany other countries is the transfer of such improvementsinto the housing stock as a whole. In the UK, the existence
Žof a high proportion of owner occupied dwellings some.67% of all tenures make this a particularly difficult task,
for it will require policies which encourage and enablemillions of individuals to make the required investment.This is a problem which goes far beyond the demonstra-tion of appropriate energy efficient technology.
Acknowledgements
We are grateful for the support of the City of YorkCouncil and the Department of the Environment Transportand the Regions in carrying out this project. In particular,we would like to thank the staff of the York maintenancesection and the tenants for their invaluable assistance. Wewould also like to acknowledge the contribution of thereferees who made some very detailed and useful com-ments. Any remaining errors or omissions are the responsi-bility of the authors.
References
w x1 Department of the Environment Transport and the Regions, Digestof Environmental Statistics 20 The Stationery Office, London, 1998.
w x2 Department of the Environment Transport and the Regions, Housingand Construction Statistics 1986–1996: Great Britain, The Sta-tionery Office, London, 1998.
w x3 Department of the Environment, Energy efficiency in council hous-ing exemplary project guide: green house programme, in: EnergyEfficiency in Council Housing, Department of the Environment,London, 1994.
w x4 Department of the Environment, Green House: Final Report 1995,Department of the Environment, London, 1995.
w x5 Department of the Environment and Welsh Office, Building Regula-Ž .tions Approved Document L 1995 : Conservation of Fuel and
Power. London, HMSO, 1994.w x6 R. Everett, Rapid Thermal Calibration of Houses, Open University
Energy Research Group ERG 055, Milton Keynes, UK, 1985.w x7 R.J. Lowe, C.J. Gibbons, Passive solar houses: availability of weather
suitable for calibration in the UK, Building Services EngineeringŽ . Ž .Research and Technology 9 3 1988 .
w x8 B.R. Anderson, A.J. Clark, R. Baldwin, N.O. Milbank, BREDEM-BRE Domestic Energy Model: Background, Phliosophy and De-scription. Building Research Establishment Report BR 66, BuildingResearch Establishment, Watford, UK, 1985.
11 w xSee Ref. 26 for details of a wide range of energy efficient renova-tion schemes in Sweden, the Netherlands, the UK and the USA.

( )M. Bell, R. LowerEnergy and Buildings 32 2000 267–280280
w x9 M. Bell, R.J. Lowe, The York Energy Demonstration Project: FinalReport. CeBE report no. 3. Centre for the Built Environment, LeedsMetropolitan University, Leeds, UK, 1998.
w x10 Swedish Board for Housing, Building and Planning, Building Regu-lations BBR 94, BFS 1993:57 with amendments BFS 1995:17 andBFS 1995: 65, Stockholm, 1995.
w x11 R.J. Lowe, D.K. Johnston, M. Bell, A review of possible implica-tions of an airtightness standard for new dwellings in the UK.
Ž .Building Services Engineering Research and Technology BSERT ,in press.
w x12 R.J. Lowe, S.R. Curwell, M. Bell, A. Ahmad, Airtightness inmasonry dwellings: laboratory and field experience, Building Ser-
Ž . Ž . Ž .vices Engineering Research and Technology BSERT 15 3 1994 .w x13 R.J. Lowe, D.K. Johnston, Mechanical ventilation with heat recov-
ery in local authority, low rise housing: Final report on the Der-wentside field trial. CeBE Report no.6 Centre for the Built Environ-ment, Leeds Metropolitan University, Leeds, UK, 1997.
w x14 E. Perera, L. Parkins, Airtightness of UK buildings: status and futureŽ . Ž .possibilities, Environmental Policy and Practice 2 2 1992 .
w x15 BRECSU, The Government’s Standard Assessment Procedure forEnergy rating of Dwellings, 1998 edn., Department of the Environ-ment Transport and the Regions, London, 1998.
w x16 BRECSU, Cardonaldmill, Glasgow — Good Practice Case Study65, Energy Efficiency in Housing, Best Practice Programme, Jan-uary 1993, Watford, UK, Building Research Establishment, 1993.
w x17 BRECSU, Lauder, Kirkcaldy — Good Practice Case Study 168,Energy Efficiency in Housing, Best Practice Programme, January1993, Watford, UK, Building Research Establishment, 1993b.
w x18 L.D. Shorrock, G.A. Walters, Domestic Energy Fact File. BREReport 354, Garston, Watford, Building Research Establishment,1998.
w x19 Department of the Environment, English House Condition Survey:Energy Report, London, The Stationery Office, 1996.
w x20 Hunt, M.I. Gidman, A national field survey of house temperatures,Ž . Ž .Building and Environment 17 2 1982 .
w x21 R.J. Lowe, J. Chapman, R.C. Everett, The Pennyland Project. Open
University Energy Research Group, ERG 053rETSU-S-1046, Mil-ton Keynes, UK, 1985.
w x22 M. Bell, R.J. Lowe, P. Roberts, Energy Efficiency in Housing,Avebury, Aldershot, UK, 1996.
w x23 CIBSE, CIBSE Guide A — Section A3 Thermal properties ofbuilding structures, Chartered Institution of Building Services Engi-neers, London, 1980.
w x24 R.J. Lowe, M. Bell, Towards sustainable housing: building regula-tion for the 21st century. A report for the Joseph Rowntree Founda-tion, York. Leeds, Leeds Metropolitan University, 1998.
w x25 B. Boardman, Fuel Poverty, Belhaven Press, London, 1991.w x26 P.-E. Nilsson, S. Aronsson, J. Gusten, Learning form Experiences´
With Energy Efficient Retrofitting of Residential Buildings, CAD-DET Analysis series No. 18, Sittard, The Netherlands, Centre for theAnalysis and Dissemination of Demonstrated Technologies, 1996.
w x27 J. Walker, N. Oseland, Energy Advice to Tenants — Does it Work?,Institute of Housing, London, 1997.
w x28 SEDBUK, Seasonal Efficiency of Domestic Boilers in the UKŽ . w xSEDBUK , Internet Available from http:rrwww.sedbuk.
w xcom, accessed 18 October 1999 .w x29 A. Buijs, S. Silvester, Demonstration projects and sustainable hous-
Ž . Ž .ing, Building Research and Information 24 4 1996 .w x30 E. Walker, A. Hay, Carbon monoxide poisoning is still an under-
Ž .recognised problem, British Medical Journal 319 1999 1082–1083.w x31 CADDET, Building Retrofit saves 51% of district heating consump-
tion, Result 333, DK 99.503r3A.R03, Sittard, The Netherlands,Centre for the Analysis and Dissemination of Demonstrated EnergyTechnologies, 1999.
w x32 R.J. Lowe, S.R. Curwell, Case study 2: the Longwood low energyŽ .house, in: M. Bell, R.J. Lowe, P. Roberts Eds. , Energy Efficiency
in Housing, Avebury, Aldershot, UK, 1996.w x33 W. Feist, 95% Heizenergieeinsparung im Passivhaus. das Bauzen-
trum, 4r94, 1994.w x34 D. Olivier, J. Willoughby, Review of ultra-low-energy homes: ten
UK profiles in detail. BRECSU, General Information Report 39.Watford, UK, Building Research Establishment, 1996.