energy efficiency and energy savings in japanese residential buildings—research methodology and...
TRANSCRIPT

Energy efficiency and energy savings in Japanese residential
buildings—research methodology and surveyed results
Luis Lopes a,*, Shuichi Hokoi a, Hisashi Miura a, Kondo Shuhei b
a Department of Architecture and Environmental Design, Faculty of Engineering, Kyoto University,
Yoshida-Honmachi, Sakyo-ku, 606-8501 Kyoto, Japanb Energy Use R&D Center, Kansai Electric Power Company Inc., 661-0974 Amagasaki, Japan
Received 15 June 2004; received in revised form 15 September 2004; accepted 15 September 2004
Abstract
Worldwide energy consumption has risen 30% in the last 25 years. Fossil fuels exploitation is causing depletion of resources and serious
environmental problems. Energy efficiency improvement and energy savings are important targets to be achieved on every society as a whole
and in residential buildings in particular. In this article, results of a survey and questionnaire on energy consumption and thermal environment
held in Kansai area, Japan are reported. Energy savings potential was analyzed for the surveyed 13 houses focusing on certain electrical
appliances e.g. TV, rice cooker and refrigerator. Residents’ environmental awareness towards energy consumption was clarified through
questionnaire. An energy information session towards residents was held, and the resulting changes in lifestyle and their implications on
energy consumption were evaluated.
# 2004 Elsevier B.V. All rights reserved.
Keywords: Energy savings; Energy efficiency; Residential buildings; Lifestyle
www.elsevier.com/locate/enbuild
Energy and Buildings 37 (2005) 698–706
1. Introduction
1.1. Energy consumption
Worldwide energy consumption has risen 30% in the last
25 years. Industrialized countries consume ca. four times
more than the world average. As economic growth is being
pursued in countries such as China, India and Brazil, the
energy consumption is expected to increase further. In this
scenario, improvements in energy efficiency are regarded
as the guarantor of economic growth, without increasing the
energy consumption further.
In that context, the Japanese economy is the most energy
efficient in the industrialized world as can be seen in Fig. 1.
It has faced an urgent need for the improvement of its overall
efficiency at the time of oil shocks in 1970s. Energy savings
regulations for the industry were extremely important to
achieve that aim, which enabled the Japanese industry to
* Corresponding author. Tel.: +81 75 7534796.
E-mail addresses: [email protected] (L. Lopes),
[email protected] (S. Hokoi).
0378-7788/$ – see front matter # 2004 Elsevier B.V. All rights reserved.
doi:10.1016/j.enbuild.2004.09.019
increase its output 40% by spending the same energy in 2001
as in 1973 [2].
On the other hand, the residential sector has shown an
opposite trend, thus, energy savings achieved at industry
level may be surpassed by the households spending.
Therefore, energy efficiency/savings in the residential sector
is strongly required in Japan. Moreover, a specific approach
will be necessary since it has specific problems, namely the
willingness of residents to achieve energy savings or not,
their environmental consciousness and their ability to
understand the close relationship between energy and
environmental issues.
1.2. Energy conservation programs and energy labeling
Since the first oil shock in 1973, several measures like
improving the building/equipment standards or marketing
solutions with higher energy efficiency have been taken
worldwide. In order to promote energy conservation and to
provide consumers with information about energy effi-
ciency, energy labels have been proposed. There are two

L. Lopes et al. / Energy and Buildings 37 (2005) 698–706 699
Fig. 1. GDP vs. energy consumption per capita [1].
Fig. 2. Japanese Energy savings label.
Fig. 3. Environment, Residents and Technology interrelationship: ‘3-star’
concept.
main types: endorsement labels, which simply identify
appliances that are particularly energy efficient (e.g. ‘Energy
Star’), and comparison labels, which provide information
that enables consumers to compare the energy efficiency of a
specific product with the rest of appliances within the same
category. Some examples of comparison labels are the
Australian ‘Energy Rating’, the US ‘Energy Guide’ and the
European ‘Energy label’. ‘Energy label’ is conceived for a
variety of electrical appliances, like refrigerators/freezers,
washing machines, dish washers and lamps.
In Japan, a specific energy conservation program was
introduced, the ‘Top-Runner Program’ [3]. Parallel to the
program, a voluntary energy-saving labeling system has also
been developed for five household appliances categories:
refrigerators, freezers, AC, TV and fluorescent lamps. The
label specifies the equipment’s energy-saving standard
achievement ratio as a percentage (e.g. refrigerator;
Fig. 2) thus helping consumers select products with high-
energy conservation performance.
1.3. Global environmental issues and awareness of
residents
In the 1970s, CFCs emitted to the atmosphere were found
to be destructing the ozone layer at an accelerated rate. After
years of research, an international agreement on the phase
out of substances that deplete the ozone layer, known as
‘Montreal Protocol’, was adopted in September 1987. After
implementation, CFCs production was reduced to one-tenth
in 10 years. In 1997, climatic changes related to the
emissions of the so-called greenhouse gases, led to a new
agreement on the reduction in emissions of greenhouse
gases, the Kyoto Protocol. Electricity production, mainly if
generated in thermal power plants, presents a significant
environmental burden. However, residents do not necessa-
rily associate the use of electricity to the pollution it stands
for, since there are no perceptible emissions when using
electricity in opposition to the emissions of their private cars.
Hence, awareness to the close link between environmental
problems and energy issues should be raised among
dwellers.
2. Research approach
When analyzing energy consumption in housing, several
factors are interrelated. In this research, a graphical way, the
‘3-star’ concept is proposed (Fig. 3). It presents three main
axes, representing the surrounding environment, resident’s
action and technology matters.
Axis 1 corresponds to the environment where a house is
built. The surrounding environment is very important since it
is possible to design a house that interacts better with its
surroundings by taking into account the natural air, water
and energy flows. The focus is put on achieving a suitable
thermal environment by using local resources, e.g. use of
locally available building materials, implementation of
heating and cooling passive strategies, hence reducing the
energy input needs. Axis 2 corresponds to occupants’
interaction with housing. The way people use the house can
have a significant influence on its energy consumption. Just
to mention a few examples: use of curtains to reduce heat
load, making use of natural ventilation, appliance usage
among others. The usage depends on the number of
dwellers, their income, age and even on their culture.
Economic issues and regulations regarding energy con-
sumption are aspects included in axis 2 since they influence
directly the residents’ way of spending energy at home.
Axis 3 corresponds to the technical features, that is, the
characteristics of the housing materials and of the equipment
installed. Improved characteristics mean that the input of
external work/energy will be smaller for the same service
L. Lopes et al. / Energy and Buildings 37 (2005) 698–706700
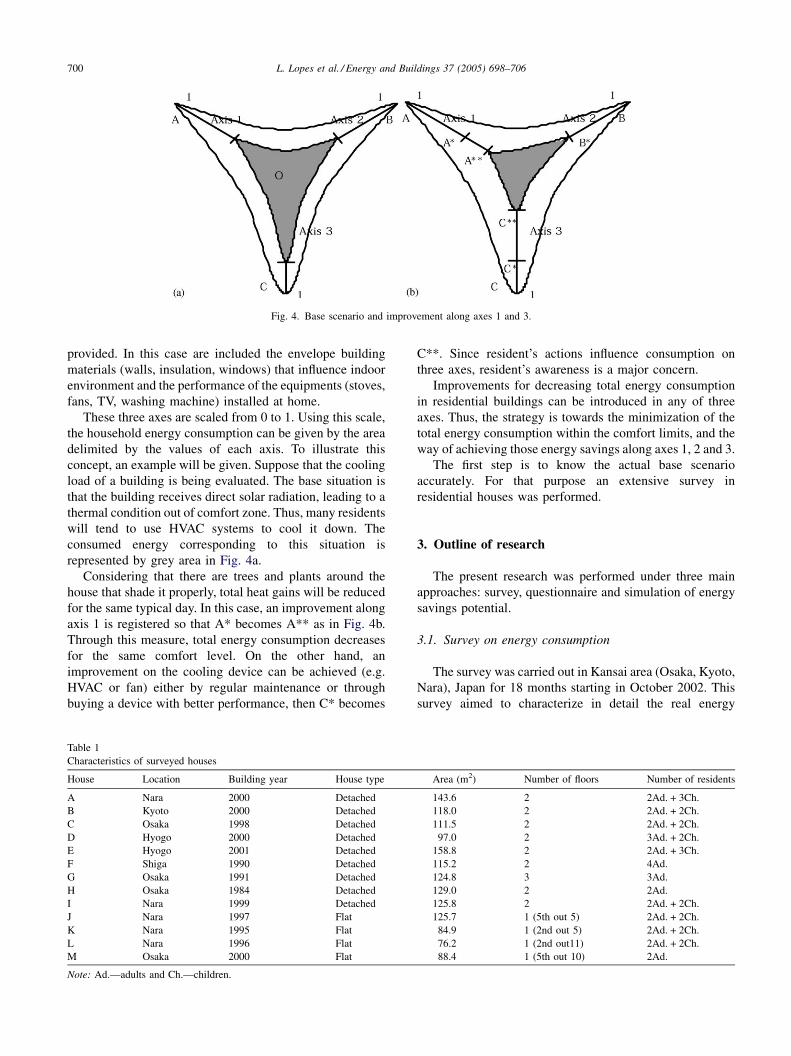
Fig. 4. Base scenario and improvement along axes 1 and 3.
provided. In this case are included the envelope building
materials (walls, insulation, windows) that influence indoor
environment and the performance of the equipments (stoves,
fans, TV, washing machine) installed at home.
These three axes are scaled from 0 to 1. Using this scale,
the household energy consumption can be given by the area
delimited by the values of each axis. To illustrate this
concept, an example will be given. Suppose that the cooling
load of a building is being evaluated. The base situation is
that the building receives direct solar radiation, leading to a
thermal condition out of comfort zone. Thus, many residents
will tend to use HVAC systems to cool it down. The
consumed energy corresponding to this situation is
represented by grey area in Fig. 4a.
Considering that there are trees and plants around the
house that shade it properly, total heat gains will be reduced
for the same typical day. In this case, an improvement along
axis 1 is registered so that A* becomes A** as in Fig. 4b.
Through this measure, total energy consumption decreases
for the same comfort level. On the other hand, an
improvement on the cooling device can be achieved (e.g.
HVAC or fan) either by regular maintenance or through
buying a device with better performance, then C* becomes
Table 1
Characteristics of surveyed houses
House Location Building year House type
A Nara 2000 Detached
B Kyoto 2000 Detached
C Osaka 1998 Detached
D Hyogo 2000 Detached
E Hyogo 2001 Detached
F Shiga 1990 Detached
G Osaka 1991 Detached
H Osaka 1984 Detached
I Nara 1999 Detached
J Nara 1997 Flat
K Nara 1995 Flat
L Nara 1996 Flat
M Osaka 2000 Flat
Note: Ad.—adults and Ch.—children.
C**. Since resident’s actions influence consumption on
three axes, resident’s awareness is a major concern.
Improvements for decreasing total energy consumption
in residential buildings can be introduced in any of three
axes. Thus, the strategy is towards the minimization of the
total energy consumption within the comfort limits, and the
way of achieving those energy savings along axes 1, 2 and 3.
The first step is to know the actual base scenario
accurately. For that purpose an extensive survey in
residential houses was performed.
3. Outline of research
The present research was performed under three main
approaches: survey, questionnaire and simulation of energy
savings potential.
3.1. Survey on energy consumption
The survey was carried out in Kansai area (Osaka, Kyoto,
Nara), Japan for 18 months starting in October 2002. This
survey aimed to characterize in detail the real energy
Area (m2) Number of floors Number of residents
143.6 2 2Ad. + 3Ch.
118.0 2 2Ad. + 2Ch.
111.5 2 2Ad. + 2Ch.
97.0 2 3Ad. + 2Ch.
158.8 2 2Ad. + 3Ch.
115.2 2 4Ad.
124.8 3 3Ad.
129.0 2 2Ad.
125.8 2 2Ad. + 2Ch.
125.7 1 (5th out 5) 2Ad. + 2Ch.
84.9 1 (2nd out 5) 2Ad. + 2Ch.
76.2 1 (2nd out11) 2Ad. + 2Ch.
88.4 1 (5th out 10) 2Ad.
L. Lopes et al. / Energy and Buildings 37 (2005) 698–706 701
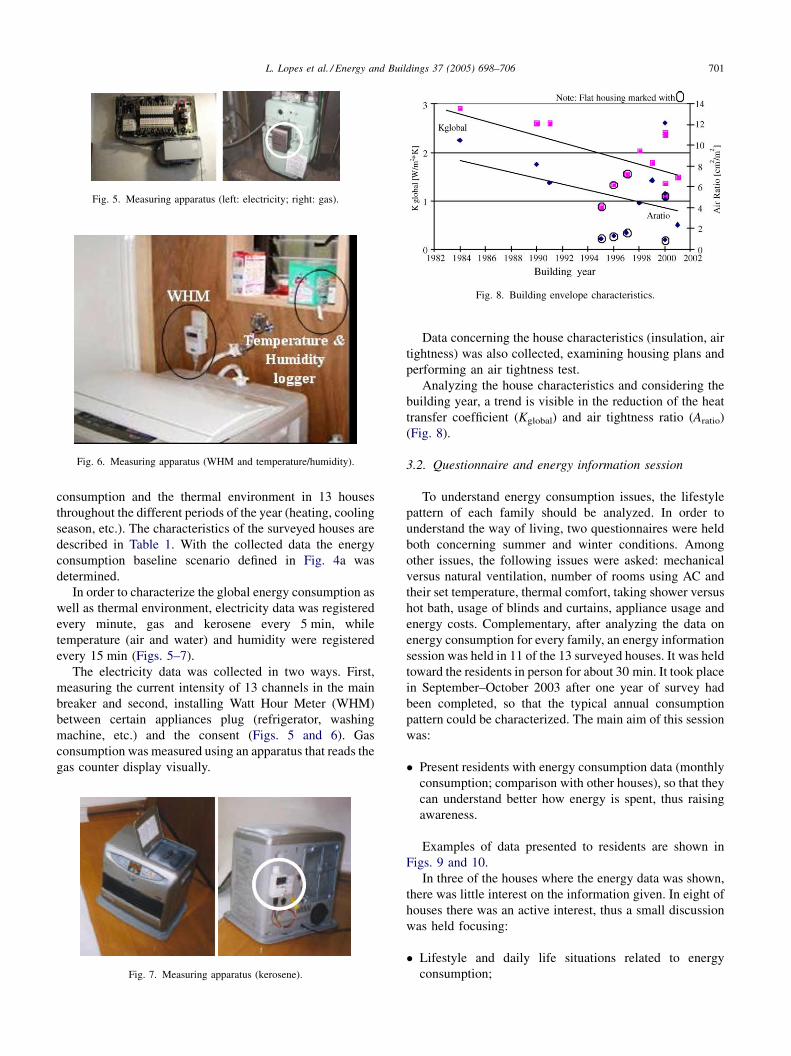
Fig. 5. Measuring apparatus (left: electricity; right: gas).
Fig. 6. Measuring apparatus (WHM and temperature/humidity).
Fig. 8. Building envelope characteristics.
consumption and the thermal environment in 13 houses
throughout the different periods of the year (heating, cooling
season, etc.). The characteristics of the surveyed houses are
described in Table 1. With the collected data the energy
consumption baseline scenario defined in Fig. 4a was
determined.
In order to characterize the global energy consumption as
well as thermal environment, electricity data was registered
every minute, gas and kerosene every 5 min, while
temperature (air and water) and humidity were registered
every 15 min (Figs. 5–7).
The electricity data was collected in two ways. First,
measuring the current intensity of 13 channels in the main
breaker and second, installing Watt Hour Meter (WHM)
between certain appliances plug (refrigerator, washing
machine, etc.) and the consent (Figs. 5 and 6). Gas
consumption was measured using an apparatus that reads the
gas counter display visually.
Fig. 7. Measuring apparatus (kerosene).
Data concerning the house characteristics (insulation, air
tightness) was also collected, examining housing plans and
performing an air tightness test.
Analyzing the house characteristics and considering the
building year, a trend is visible in the reduction of the heat
transfer coefficient (Kglobal) and air tightness ratio (Aratio)
(Fig. 8).
3.2. Questionnaire and energy information session
To understand energy consumption issues, the lifestyle
pattern of each family should be analyzed. In order to
understand the way of living, two questionnaires were held
both concerning summer and winter conditions. Among
other issues, the following issues were asked: mechanical
versus natural ventilation, number of rooms using AC and
their set temperature, thermal comfort, taking shower versus
hot bath, usage of blinds and curtains, appliance usage and
energy costs. Complementary, after analyzing the data on
energy consumption for every family, an energy information
session was held in 11 of the 13 surveyed houses. It was held
toward the residents in person for about 30 min. It took place
in September–October 2003 after one year of survey had
been completed, so that the typical annual consumption
pattern could be characterized. The main aim of this session
was:
� P
resent residents with energy consumption data (monthlyconsumption; comparison with other houses), so that they
can understand better how energy is spent, thus raising
awareness.
Examples of data presented to residents are shown in
Figs. 9 and 10.
In three of the houses where the energy data was shown,
there was little interest on the information given. In eight of
houses there was an active interest, thus a small discussion
was held focusing:
� L
ifestyle and daily life situations related to energyconsumption;

L. Lopes et al. / Energy and Buildings 37 (2005) 698–706702
Fig. 9. Energy consumption data shown to residents (e.g. House A).
Fig. 10. Data shown to residents (comparison between houses).
� I
nformation where possible energy savings could beachieved was provided to residents.
Analyzing the surveyed data, some appliances were id-
entified to be consuming more than the average, and thus
were selected to have potential for energy savings. That
information was shown to residents in the session held.
Details of changes occurred after energy sessions are rep-
orted elsewhere [4].
Fig. 11. Data ana
3.3. Simulation of energy savings potential
An evaluation of the energy savings potential corre-
sponding to an hypothetical improvement along axis 3 and
axis 2 of Fig. 3 was made, that is, energy savings either by
improving equipment efficiency (e.g. reduction in the power
input for the same output) or by simulating changes in the
way that residents use appliances (e.g. reduction in stand-by
time) [4].
4. Data analysis
Energy consumption, especially in heating and cooling is
closely related to the weather conditions. Furthermore, other
relevant information concerning energy use and resident’s
lifestyle pattern e.g. bathing habits, gas end use, was
obtained by analyzing thermal environmental data. The
tasks performed are shown in Fig. 11.
4.1. Electricity and gas data; end use categories
Concerning the electricity data, the power consumption
per minute was analyzed in detail. Knowing the rated power
lysis tasks.

L. Lopes et al. / Energy and Buildings 37 (2005) 698–706 703
Table 2
End use categories in data analysis
End use category Detailed
Air conditioning Cooling
Heating
Ventilation
Hot water Hot water (bath)
Hot water (cooking)
Other
Illumination Illumination
Cooking Cooking
Cooking related
Information/leisure Information
Leisure
Security
Household/Hygiene Household
Hygiene
Unknown Unknown
Fig. 13. Electricity data divided into end use categories (House K).
Table 3
Characteristics of rice cooker (example: House H)
Characteristics Characteristic value
Power used during normal functioning period (W) 550
Power used out of normal functioning period (W) 18
Average usage length (min) 35
Total power consumed per usage (Wh) 170
and the power consumption characteristics of different
appliances, it was possible to divide the total consumption of
living room, kitchen, etc. into end use categories described
in Table 2, as shown in example of Fig. 12.
With the data processed for every division in the house, it
was compiled per end use categories, and then plotted
minute by minute, as in Fig. 13. Then, the gas data was
analyzed together with thermal environmental data and
finally, the daily energy consumption per end use was plotted
as in Fig. 14. In the example shown, hot water represents
36% of total consumption, which is a quite significant figure.
Fig. 12. Power consumption in dining room (House K).
4.2. Main program for data analysis
Analyzing the electricity data, the characteristics of
different appliances were studied in order to built up a
program that could handle any household appliance data.
The important characteristics identified were:
� P
ower used during normal functioning period;� P
ower used out of normal functioning period (e.g. stand-by power);
� A
verage length of usage; frequency of usage;� T
otal power consumed per usage.With the main characteristics identified for every appl-
iance as shown in Table 3 for the case of one rice cooker, a
program that divides energy consumption data into different
modes depending on the use given, was made (e.g. Figs. 15
and 16). Mode 1 corresponds to the period when device is
used in full. Mode 2 corresponds to some secondary use,
common in devices that have the function ‘keep warm’.
Mode 3 corresponds to a marginal consumption usually
associated with ‘stand-by’ power. Mode 4 means zero co-
nsumption. Depending on device, the meaning of the modes
changes as in Table 4.
To implement this task, border values that make the
division into different operation modes were estimated. For
Fig. 14. Daily energy consumption per end use (House E, 2003).

L. Lopes et al. / Energy and Buildings 37 (2005) 698–706704
Fig. 15. Data handling program (e.g. heat pump).
Fig. 17. Yearly energy consumption (November 2002–October 2003).Table 4
Modes defined for each appliance
Rice cooker;
hot pot
Microwave;
toaster
TV Refrigerator
Mode1 Boiling Cook; warm up On Compressor
on cycle
Mode 2 Keeping
warm
– – Defrost
Mode 3 Stand-by Stand-by Stand-by Off cycle
Mode 4 Off Off Off Off
some appliances, ‘mode 2’ was not defined, hence, just one
border value was used as an input by the program. Since
electrical appliances do not have a constant consumption
even within one functioning mode, one extra variable was
necessary to be defined, ‘hold time’, which holds the
consumption for a certain time whenever there is a transition
between modes, checking if the transition is temporary or
not.
The output values of the program are the modes, the
initial and final use times, time used, energy consumption,
frequency of use, and the initial and final temperature/
humidity in the case of heating/cooling devices.
The yearly energy consumption is shown in Fig. 17. Total
consumption ranged between 30 GJ in a two-residents flat
(House M), to 84 GJ for a five-residents house (House A)
Fig. 16. Data handling program (e.g. rice cooker).
that has a gas heat pump used both for cooling/heating.
House K, a flat, had the highest consumption per square
meter (0.73 GJ/m2). Concerning electricity consumption,
House I, where more energy savings measures are
implemented, consumed the lowest electricity (7.8 GJ) of
all.
After processing the surveyed data, yearly electricity
consumption per appliance was obtained as shown in
Fig. 18. As expected, refrigerator consumption represents
the biggest share in all surveyed houses, representing a share
of 10% in House E and 25% in House I. TV and video
consumption varied from 100 to 500 kWh/year from house
to house. The highest consumption was registered in Houses
C, H, K and L where residents are usually at home the whole
day. The hot pot consumption varied between 150 and
400 kWh/year, while washing machine consumed 20–
50 kWh/year.
‘Washlet and warmlet’ used to heat up the toilet seat, used
ca. 150–200 kWh/year/unit, with the maximum consump-
tion of 450 kWh registered in House D, corresponding to
2 unit, which were turned off just for 3 days during
the summer period. It represented a significant average
monthly consumption of 38.7 kWh more than the 20.6 kWh
consumed by TV. On the other hand, in House A the
Fig. 18. Yearly energy consumption per appliance.

L. Lopes et al. / Energy and Buildings 37 (2005) 698–706 705
Table 5
Yearly energy consumption (kWh/month) per appliance/mode (monthly average)
House TV ‘Washlet/Warmlet’ Rice cooker Hot pot
Mode1 Mode3 Total Mode1 Mode 2 + 3 Mode1 Mode 2 + 3
A 9.7 5.4 25.2b 6.7 2.6 5.1 22.9
B 25.5 6.9 19.6 5.1 8.9 – –
C 24.5 2.8 – 8.5 1.2 – –
D 14.8 5.8 38.7a 3.0 1.0
E 31.2 0.1 9.0 7.5 3.1 – –
F 18.1 2.1 16.9 4.4 3.3 – –
G 13.4 4.8 12.0 – – 3.5 9.5
H 18.2 6.2 10.8 1.6 0.1 13.2 19.0
I 6.7 0.1 1.3 5.8 0.9 – –
J 4.0 2.7 12.9 5.4 0.7 – –
K 45.1 3.0 – – – 3.9 31.6
L 18.5 1.1 – – – – –
M 17.3 0.4 0.7 1.2 0.4 – –
a 2 ‘Washlet’ units used.b 1 ‘Washlet’ unit + 1 ‘warmlet’ unit used.
‘washlet’ was disconnected for 7 weeks (25.2 kWh) while in
House B (19.6 kWh) it was off for 15 weeks.
With the output of the data analysis program, the yearly
frequency of usage, using the set on time throughout the day
was plotted as in Fig. 19. The frequency of watching TV
during the day in Houses G and J is quite low since in
daytime there is no one at home. Analyzing similar graphs
for other appliances, like rice cooker, washing machine,
‘washlet’, the lifestyle pattern was characterized for each
family.
Processing the surveyed data with the program described
in the previous section, the electricity consumption per mode
per month was obtained as shown in Table 5.
Several valuable information is presented in Table 5.
Concerning the TV, Houses like E, I, L and M usually do not
let it in ‘stand-by’ mode, thus, consumption is low compared
with 6.9 kWh of House B or 6.2 kWh of House H. This
corresponds to ca. 80 kWh/year. Some houses use multi-
type switch consent to reduce ‘stand-by’ consumption.
Concerning the rice cooker, in Houses A, B, E and F, the
‘keep warm’ mode is very frequently used, even during the
whole night in the case of House B. This means that more
Fig. 19. Yearly frequency usage throughout day (TV).
energy is spent in that function than in cooking the rice itself.
Also the hot pot spends a significant amount of energy in the
‘keep warm’ mode, being the case of houses A, H and K that
have it often switched on the whole day.
Performing this kind of analysis, targets for energy
savings were identified and information was given to
residents in an energy information session [4]. The main
issue concerning its implementation is the intrinsic value
residents give to secondary functions. Some residents
consider it to be convenient and almost indispensable,
others are able to cut that consumption share.
5. Conclusions
In order to understand energy consumption issues in
residential sector, a detailed survey was held. Analyzing the
data from our survey, the following conclusions were made:
� E
nergy consumption is closely related to the resident’slife style, thus energy savings can be implemented or not
depending on the resident’s receptivity.
� S
econdary modes like ‘keep warm’ function represent asignificant consumption (up to 8.9 kWh/month for the rice
cooker) sometimes surpassing the consumption of the
main function.
� F
rom the surveyed data, some appliances were identifiedto have a high-energy savings potential, namely the
‘washlet/warmlet’ (up to 200 kWh/year), hot pot (up to
240 kWh/year) and rice cooker (up to100 kWh/year).
� ‘
Stand-by’ power consumption was identified torepresent a significant share of total consumption (8–
10%). Awareness of residents is normally just towards
long absent periods. Easy to implement solutions like
multi-type switch consent are popular, however, their
effectiveness depends much on the use given by
residents.

L. Lopes et al. / Energy and Buildings 37 (2005) 698–706706
� E
nergy cost is the main priority even for residentsenthusiastic about energy savings. In second place comes
the concern on environmental issues and only afterwards
energy efficiency/savings issues.
� A
wareness should be raised, towards a closer associationbetween electricity production and its environmental
burden. Nowadays, since energy cost is the main factor
affecting energy consumption, any successful energy
savings policy should consider raising energy cost, which
currently represents 2–4% of the income.
Showing detailed energy consumption by appliance to
dwellers is one possible approach to raise awareness towards
energy issues, leading to energy savings especially with
residents already motivated.
Acknowledgements
This research is a part of the survey by the special
research committee on ‘‘Energy consumption of residen-
tial buildings’’ working group (Chairman: Prof. Shuzo
Murakami, Faculty of Science and Technology, Keio
University) belonging to the scientific committee of the
Architectural Institute of Japan. This special committee is
supported by the Ministry of Land, Infrastructure and
Transport, as well as Tokyo Electric Power Co., Kansai
Electric Power Co., Chubu Electric Power Co. and Kyushu
Electric Power Co.
References
[1] J. Browne et al., BP Review of World Energy 2002, June 2003.
[2] Agency for Natural Resources and Energy, January 2004, http://www.
enecho.meti.go.jp.
[3] Japanese Energy Conservation Center, January 2004, http://www.eccj.
or.jp.
[4] L. Lopes, Energy Efficiency, Energy Savings and Thermal Environment
in Residential Buildings. Master Thesis. Kyoto University, 2004.