energy conservation study at white house utility district...white house utility district energy...
TRANSCRIPT

ENERGY CONSERVATION STUDY
at
White House Utility District
Hendersonville, TN
by
Larry W. Moore, Ph.D., P.E. The University of Memphis
Civil Engineering Department
September, 2010

IMPORTANT NOTICE
The contents of this report are for general guidance only and are not intended to be a
standard of the State of Tennessee. No reference in this report to any specific method,
product, process, or service constitutes or implies an endorsement or warranty by the
University of Memphis, the University of Tennessee Center for Industrial Services
(UTCIS), or the State of Tennessee. This report reflects the best judgment of the author,
but the University of Memphis, UTCIS, and the State of Tennessee assume no liability
for implementation of the information contained herein. Anyone using this information
assumes all liability arising from such use, including but not limited to infringement of
any patent or patents.
I. INTRODUCTION
The White House Utility District operates two water treatment plants
(conventional plant and membrane plant) at one location in Hendersonville, Tennessee.
The water source for this facility is Old Hickory Lake, located on the Cumberland River.
Water is withdrawn from the lake and pumped about 0.3 mile to the water treatment
plant. The original water treatment plant (conventional surface water treatment) began
operations in 1965. The original treatment plant has had four major additions, and the
membrane plant began operations in 2004. The conventional water treatment plant can
produce up to 16 mgd, and the membrane plant can produce up to 4 mgd.
Finished water produced by the two water treatment processes is pumped into the
distribution system, supplying approximately 90,000 people in Robertson County,
Sumner County, and part of Davidson County in Tennessee and part of Simpson County,
Kentucky. On an average day, this water treatment plant produces 11.3 million gallons
per day (mgd) of drinking water. The peak day production of 17.6 mgd occurred on
August 6, 2007. This finished water is pumped into a water distribution system consisting
of about 1000 miles of distribution lines. Moreover, there are thirteen (13) booster pump
stations in the distribution system.
The purpose of this study is to develop an energy audit for the White House
Utility District water treatment plant and distribution system. During the energy audit, a
Pumping System Assessment Tool (PSAT) was performed by Mitchell Technical
Services to evaluate the efficiency of major pumps at the treatment plant and in the
distribution system. Using the energy audit and the PSAT results, the author, in
conjunction with White House Utility District (WHUD) engineer and treatment plant
White House Utility District Energy Conservation Study September 2010
2
personnel, developed process energy conservation measure (ECM) ideas. These ideas
were then evaluated with respect to technical feasibility and cost-effectiveness. Based on
this detailed evaluation, specific ECMs were recommended for the WHUD.
II. DESCRIPTION OF WATER TREATMENT PROCESSES
A. Conventional Surface Water Treatment
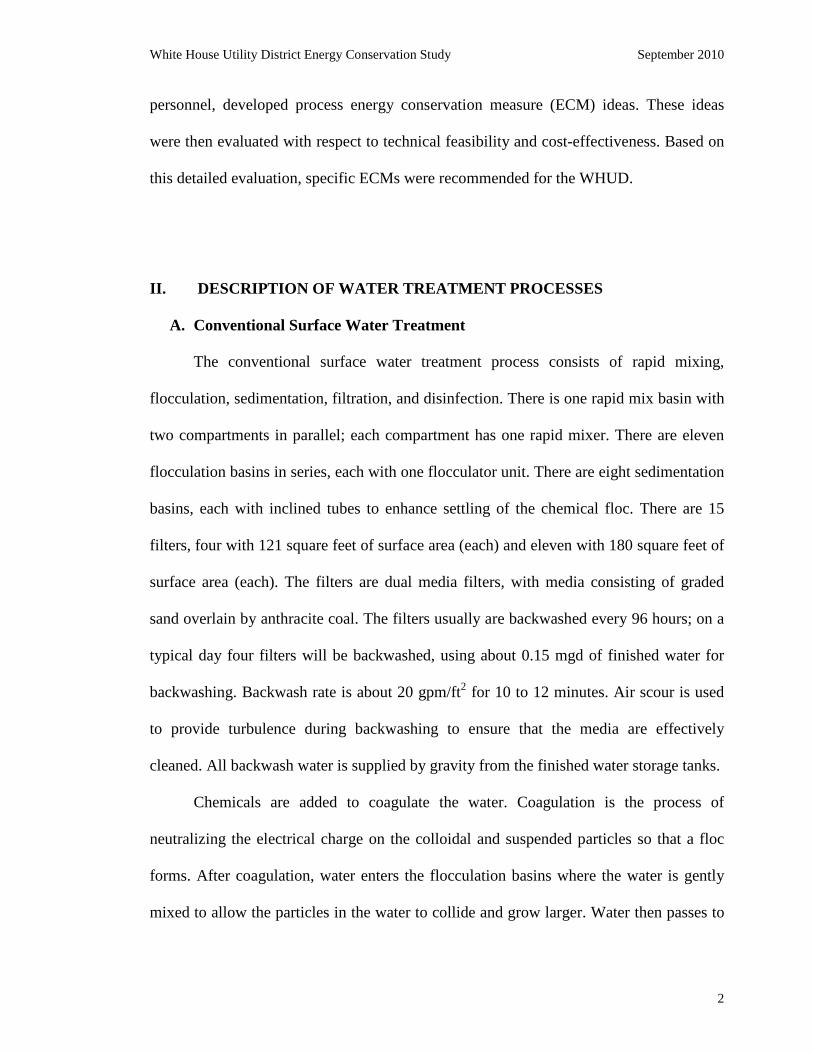
The conventional surface water treatment process consists of rapid mixing,
flocculation, sedimentation, filtration, and disinfection. There is one rapid mix basin with
two compartments in parallel; each compartment has one rapid mixer. There are eleven
flocculation basins in series, each with one flocculator unit. There are eight sedimentation
basins, each with inclined tubes to enhance settling of the chemical floc. There are 15
filters, four with 121 square feet of surface area (each) and eleven with 180 square feet of
surface area (each). The filters are dual media filters, with media consisting of graded
sand overlain by anthracite coal. The filters usually are backwashed every 96 hours; on a
typical day four filters will be backwashed, using about 0.15 mgd of finished water for
backwashing. Backwash rate is about 20 gpm/ft2 for 10 to 12 minutes. Air scour is used
to provide turbulence during backwashing to ensure that the media are effectively
cleaned. All backwash water is supplied by gravity from the finished water storage tanks.
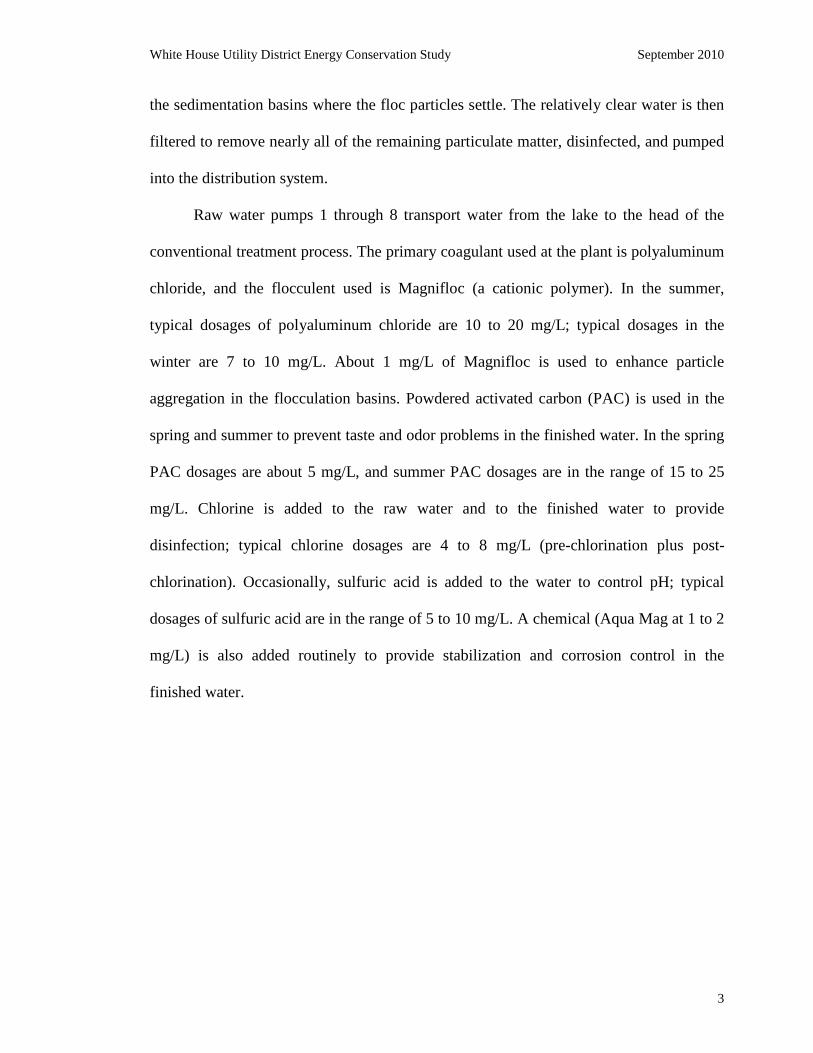
Chemicals are added to coagulate the water. Coagulation is the process of
neutralizing the electrical charge on the colloidal and suspended particles so that a floc
forms. After coagulation, water enters the flocculation basins where the water is gently
mixed to allow the particles in the water to collide and grow larger. Water then passes to
White House Utility District Energy Conservation Study September 2010
3
the sedimentation basins where the floc particles settle. The relatively clear water is then
filtered to remove nearly all of the remaining particulate matter, disinfected, and pumped
into the distribution system.
Raw water pumps 1 through 8 transport water from the lake to the head of the
conventional treatment process. The primary coagulant used at the plant is polyaluminum
chloride, and the flocculent used is Magnifloc (a cationic polymer). In the summer,
typical dosages of polyaluminum chloride are 10 to 20 mg/L; typical dosages in the
winter are 7 to 10 mg/L. About 1 mg/L of Magnifloc is used to enhance particle
aggregation in the flocculation basins. Powdered activated carbon (PAC) is used in the
spring and summer to prevent taste and odor problems in the finished water. In the spring
PAC dosages are about 5 mg/L, and summer PAC dosages are in the range of 15 to 25
mg/L. Chlorine is added to the raw water and to the finished water to provide
disinfection; typical chlorine dosages are 4 to 8 mg/L (pre-chlorination plus post-
chlorination). Occasionally, sulfuric acid is added to the water to control pH; typical
dosages of sulfuric acid are in the range of 5 to 10 mg/L. A chemical (Aqua Mag at 1 to 2
mg/L) is also added routinely to provide stabilization and corrosion control in the
finished water.

White House Utility District Energy Conservation Study September 2010
4
B. Membrane Filtration Plant
The membrane plant consists of coagulant addition in the pipes going to the
Membrane Tanks. The membrane modules are located in the Membrane Tanks. Each
membrane module consists of numerous spaghetti-like membranes through which the
flocculated water flows. The membranes are ultrafiltration membranes manufactured by
Zenon Corporation. Permeate pumps are used to draw a vacuum, which pulls the
flocculated water through the membranes. Ultrafiltration (UF) deals with the separation
of large molecules, such as natural polymers like proteins and colloidally dispersed
compounds such as clay which are present in the raw water. This UF system uses fairly
low pressures (5 to 15 psi) to achieve particle separation. UF is usually applicable for
separation of constituents above a molecular weight (MW) of 500, which have very small
osmotic pressures at moderate concentrations. The predominant mechanism in membrane
UF is selective sieving through pores. Rejection of a membrane for a certain substance
depends on its molecular shape, size, and flexibility and on operating conditions. There
are two Membrane Tanks, each containing numerous membrane modules.
Each Membrane Tank can produce up to 2 mgd of treated water, for a total water
production capacity of 4 mgd. Raw water is pumped to the membrane plant by raw water
pumps 9 and 10. Each of these pumps is 100 horsepower (hp) and can pump 3500 gallons
per minute (gpm) to the membrane process. Each of these raw water pumps runs 20% to
35% of the time. Typical water production rates for the membrane plant are 2.0 mgd to
3.5 mgd.
White House Utility District Energy Conservation Study September 2010
5
III. PLANT OPERATIONAL DATA FOR 2007 - 2010
A. Water Production Rates
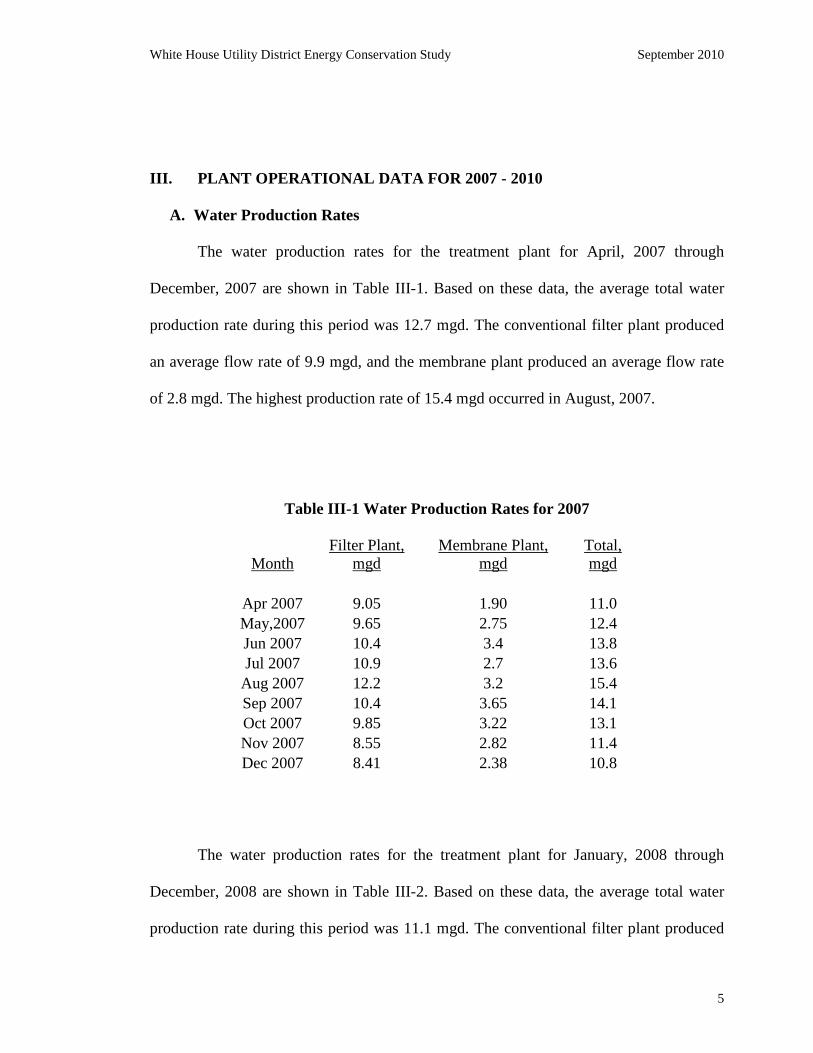
The water production rates for the treatment plant for April, 2007 through
December, 2007 are shown in Table III-1. Based on these data, the average total water
production rate during this period was 12.7 mgd. The conventional filter plant produced
an average flow rate of 9.9 mgd, and the membrane plant produced an average flow rate
of 2.8 mgd. The highest production rate of 15.4 mgd occurred in August, 2007.
Table III-1 Water Production Rates for 2007
Month Filter Plant,
mgd Membrane Plant,
mgd Total, mgd
Apr 2007 9.05 1.90 11.0 May,2007 9.65 2.75 12.4 Jun 2007 10.4 3.4 13.8 Jul 2007 10.9 2.7 13.6
Aug 2007 12.2 3.2 15.4 Sep 2007 10.4 3.65 14.1 Oct 2007 9.85 3.22 13.1 Nov 2007 8.55 2.82 11.4 Dec 2007 8.41 2.38 10.8
The water production rates for the treatment plant for January, 2008 through
December, 2008 are shown in Table III-2. Based on these data, the average total water
production rate during this period was 11.1 mgd. The conventional filter plant produced

White House Utility District Energy Conservation Study September 2010
6
an average flow rate of 8.5 mgd, and the membrane plant produced an average flow rate
of 2.6 mgd. The highest production rate of 13.2 mgd occurred in July, 2008.
Table III-2 Water Production Rates for 2008
Month Filter Plant,
mgd Membrane Plant,
mgd Total, mgd
Jan 2008 8.57 2.27 10.8 Feb 2008 8.49 1.88 10.4 Mar 2008 7.85 2.19 10.0 Apr 2008 7.77 2.61 10.4 May,2008 7.45 3.43 10.9 Jun 2008 9.17 3.73 12.9 Jul 2008 9.45 3.75 13.2
Aug 2008 9.15 3.64 12.8 Sep 2008 8.90 3.0 11.9 Oct 2008 8.66 2.11 10.8 Nov 2008 8.08 1.53 9.6 Dec 2008 8.10 1.31 9.4
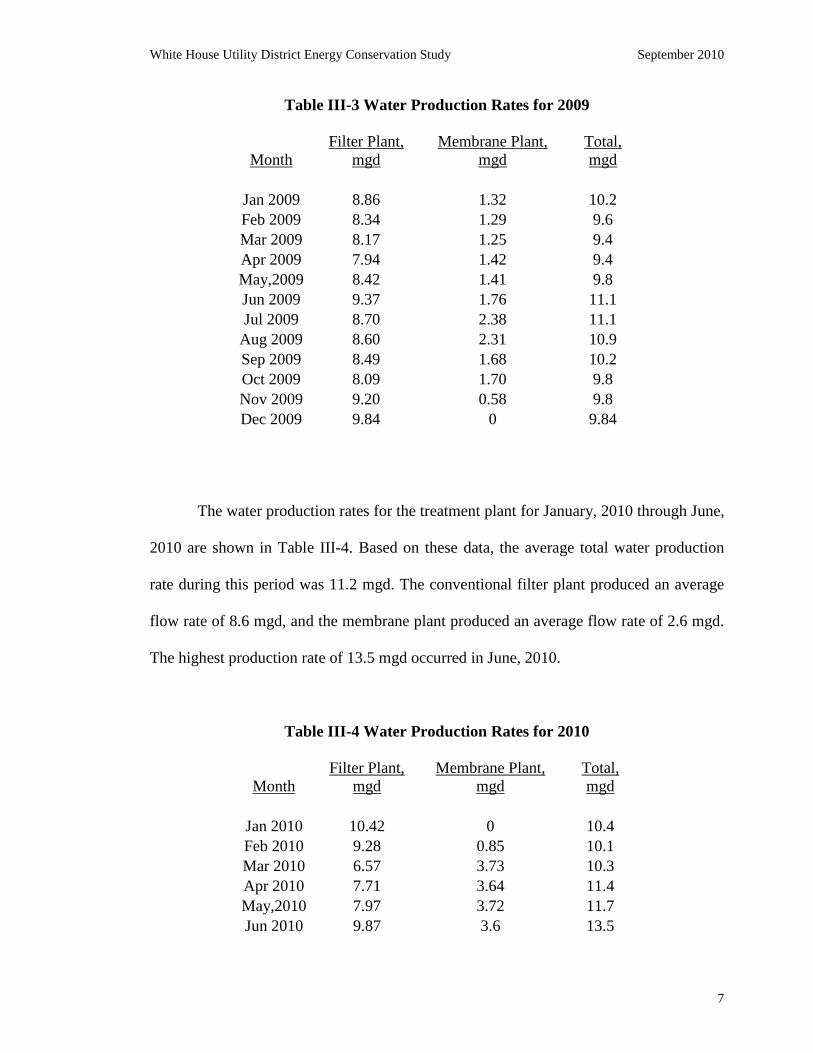
The water production rates for the treatment plant for January, 2009 through
December, 2009 are shown in Table III-3. Based on these data, the average total water
production rate during this period was 10.1 mgd. The conventional filter plant produced
an average flow rate of 8.7 mgd, and the membrane plant produced an average flow rate
of 1.4 mgd. The highest production rate of 11.1 mgd occurred in July, 2009.
White House Utility District Energy Conservation Study September 2010
7
Table III-3 Water Production Rates for 2009
Month Filter Plant,
mgd Membrane Plant,
mgd Total, mgd
Jan 2009 8.86 1.32 10.2 Feb 2009 8.34 1.29 9.6 Mar 2009 8.17 1.25 9.4 Apr 2009 7.94 1.42 9.4 May,2009 8.42 1.41 9.8 Jun 2009 9.37 1.76 11.1 Jul 2009 8.70 2.38 11.1
Aug 2009 8.60 2.31 10.9 Sep 2009 8.49 1.68 10.2 Oct 2009 8.09 1.70 9.8 Nov 2009 9.20 0.58 9.8 Dec 2009 9.84 0 9.84
The water production rates for the treatment plant for January, 2010 through June,
2010 are shown in Table III-4. Based on these data, the average total water production
rate during this period was 11.2 mgd. The conventional filter plant produced an average
flow rate of 8.6 mgd, and the membrane plant produced an average flow rate of 2.6 mgd.
The highest production rate of 13.5 mgd occurred in June, 2010.
Table III-4 Water Production Rates for 2010
Month Filter Plant,
mgd Membrane Plant,
mgd Total, mgd
Jan 2010 10.42 0 10.4 Feb 2010 9.28 0.85 10.1 Mar 2010 6.57 3.73 10.3 Apr 2010 7.71 3.64 11.4 May,2010 7.97 3.72 11.7 Jun 2010 9.87 3.6 13.5

White House Utility District Energy Conservation Study September 2010
8
B. Water Quality
The raw water taken from the lake has relatively good quality. Temperatures vary
from 5̊ C to 10˚C in January to 25˚C to 30˚C in August. The pH of the raw water is
usually from 7.5 to 9.1. Turbidity of the lake water is usually in the range of 3 to 10 ntu.
The alkalinity of the raw water is normally 70 mg/L to 100 mg/L. Hardness typically
varies from 75 to 95 mg/L, with 90% to 100% of the hardness being carbonate hardness
(associated with alkalinity species); as much as 10% of the hardness is non-carbonate
hardness (associated primarily with sulfate and chloride ions). Iron and manganese in the
raw water usually is in the range of 0.04 to 0.10 mg/L, and the fluoride concentration is
about 0.1 mg/L.
An analysis of the finished water is shown in the table below.
Table III-5 WHUD Finished Water Characteristics
Parameter Concentration (mg/l)
Alkalinity 70 Hardness (total) (non-carbonate)
80 10
Calcium -- Magnesium -- Conductivity 200
Total Dissolved Solids 150 Temperature 15˚C to 25˚C
pH, standard units 7.2 to 7.4 Turbidity, ntu 0.04
Iron 0.01 Manganese 0.01
Orthophosphate P 0.2 Fluoride 1.0
Total Organic Carbon 1.5 Total Trihalomethanes 0.063
Haloacetic Acids 0.043
White House Utility District Energy Conservation Study September 2010
9
The finished water is slightly hard, but otherwise the water quality is extremely
good for domestic and commercial uses. The water is primarily a calcium bicarbonate
type of water. There seems to be nothing in this water that would cause significant
problems with respect to water uses in the service area. In fact, the water meets all the
federal primary and secondary drinking water standards. The only parameter that is of
some concern is trihalomethanes (THMs), which occasionally get relatively close to the
drinking water standard of 0.08 mg/L.
IV. EQUIPMENT INVENTORY AND ENERGY DEMAND
A. Raw Water Pumping
The raw water pumping facility actually consists of three separate pump buildings
located adjacent to Old Hickory Lake, approximately 0.3 mile from the water treatment
plant. Pumps one through four are housed in one of the buildings; each of these pumps is
40 hp and pumps against a total dynamic head (TDH) of 50 feet (according to the pump
curves). The TDH of 50 feet approximately consists of 40 feet of static head and 10 feet
of friction head. Pump 1 is 32 years old; pump 2 is 16 years old; pump 3 is 15 years old;
and pump 4 is 14 years old (actually these ages represent the last time the pumps were
rebuilt). These pumps are vertical turbine pumps, and each has an across-the-line starter.
According to the pump curves for each of these 40-hp pumps, they pump 1650 gpm with
an efficiency of about 84 percent. Based on information provided by WHUD staff, pumps
1, 2, 3, and 4 run approximately 2%, 20%, 36%, and 24% of the time, respectively.
Raw water pumps 5 through 8 are housed in another building adjacent to the
building containing pumps 1 through 4. Pumps 5 and 6 are 75 hp each and each pumps

White House Utility District Energy Conservation Study September 2010
10
against a total dynamic head (TDH) of 62 feet (according to the pump curves). The TDH
of 62 feet approximately consists of 40 feet of static head and 22 feet of friction head.
According to the pump curves for these two 75-hp pumps, they each pump 3600 gpm
with an efficiency of about 85 percent. Pumps 7 and 8 are 100 hp each and each pumps
against a total dynamic head (TDH) of 76 feet (according to the pump curves). The TDH
of 76 feet approximately consists of 15 feet of static head and 61 feet of friction head.
According to the pump curves for these two 100-hp pumps, they each pump 3500 gpm
with an efficiency of about 85 percent. Pump 5 is 13 years old; pump 6 is 24 years old;
pump 7 is 24 years old; and pump 8 is 1 year old (actually these ages represent the last
time the pumps were rebuilt). These four pumps are vertical turbine pumps; pumps 5 and
6 each has a reduced voltage starter; pumps 7 and 8 each has a variable frequency drive.
Based on information provided by WHUD staff, pumps 5, 6, 7, and 8 run approximately
0%, 51%, 44%, and 55% of the time, respectively. It should be noted that pumps 1
through 8 pump raw water to the conventional filter plant.
Pumps 9 and 10 are 100 hp each and each pumps against a total dynamic head
(TDH) of 86 feet (according to the pump curves). The TDH of 86 feet approximately
consists of 40 feet of static head and 46 feet of friction head. According to the pump
curves for these two 100-hp pumps, they each pump 3500 gpm with an efficiency of
about 82 percent. Pump 9 is 6 years old; pump 10 is 6 years old. These two pumps are
vertical turbine pumps; pumps 9 and 10 each has a variable frequency drive. Based on
information provided by WHUD staff, pumps 9 and 10 each run approximately 20% of
the time. It should be noted that pumps 9 and 10 pump raw water to the membrane filter
plant.

White House Utility District Energy Conservation Study September 2010
11
The three raw water intake buildings are on one electric meter, with electrical
service provided by Nashville Electric Service. Over the last 3 years, the monthly electric
bill for the raw water pumping facilities has averaged about $8500 or about 8.5% of the
total electrical costs of the WHUD water treatment plant and distribution system. In
2007, the raw water pumping facilities used an average of 132,000 kWh/month of
electricity (kWh is kilowatt hours). In 2008, the raw water pumping facilities used an
average of 120,800 kWh/month of electricity. In 2009, the raw water pumping facilities
used an average of 109,600 kWh/month of electricity. Thus, on average the raw water
pumping facilities use about 121,000 kWh/month of electricity. Of the monthly electric
bill of $8500, approximately 26% is the demand charge or about $2200/month.
B. Conventional Filter Plant
The conventional filter plant has two electric meters, with electricity supplied by
Nashville Electric Service. The following equipment is part of Filter Plant Meter 1:
High service pumps 5, 6, and 7
Rapid mixers
Flocculators
All sedimentation Clar-track units
Chlorine feed system
Filters 1 through 9
Effluent pumps 1 through 8
One-half of lab, administration, and maintenance building

White House Utility District Energy Conservation Study September 2010
12
Over the last 3 years, the monthly electric bill for Filter Plant Meter 1 has averaged about
$11,600 or about 11.5% of the total electrical costs of the WHUD water treatment plant
and distribution system. In 2007, Filter Plant Meter 1 used an average of 170,000
kWh/month of electricity. In 2008, Filter Plant Meter 1 used an average of 143,000
kWh/month of electricity. In 2009, Filter Plant Meter 1 used an average of 106,000
kWh/month of electricity. Thus, on average Filter Plant Meter 1 uses about 140,000
kWh/month of electricity. Of the monthly electric bill of $11,600, approximately 43% is
the demand charge or about $5000/month.
The following equipment is part of Filter Plant Meter 2:
High service pumps 8, 9, and 10
Blowers for air scour during filter backwashing
Air compressors for Clar-Track units and filter controls
Coagulant feed pumps
Polymer feed pumps
Carbon feed pumps
Filters 10 through 15
Effluent pumps 9 through 17
One-half of lab, administration, and maintenance building
White House Utility District Energy Conservation Study September 2010
13
Over the last 3 years, the monthly electric bill for Filter Plant Meter 2 has
averaged about $20,600 or about 20.4% of the total electrical costs of the WHUD water
treatment plant and distribution system. In 2007, Filter Plant Meter 2 used an average of
266,000 kWh/month of electricity. In 2008, Filter Plant Meter 2 used an average of
235,000 kWh/month of electricity. In 2009, Filter Plant Meter 2 used an average of
228,000 kWh/month of electricity. Thus, on average Filter Plant Meter 2 uses about
243,000 kWh/month of electricity. Of the monthly electric bill of $20,600, approximately
40% is the demand charge or about $8200/month.
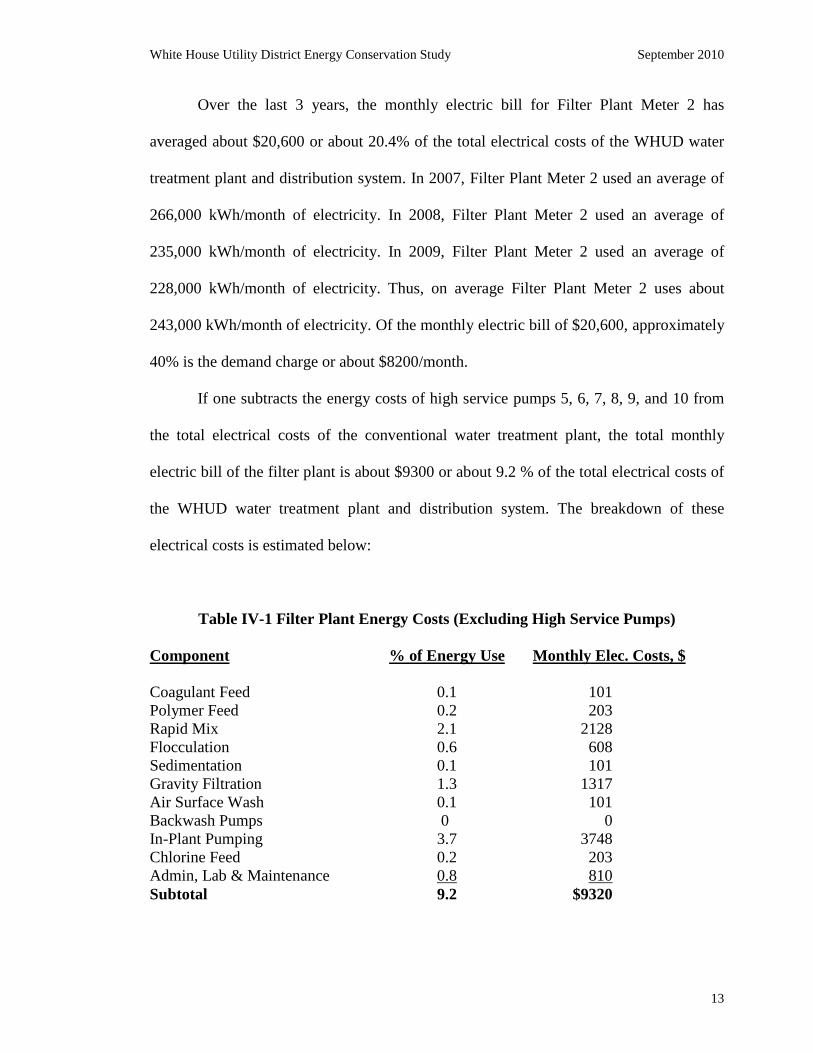
If one subtracts the energy costs of high service pumps 5, 6, 7, 8, 9, and 10 from
the total electrical costs of the conventional water treatment plant, the total monthly
electric bill of the filter plant is about $9300 or about 9.2 % of the total electrical costs of
the WHUD water treatment plant and distribution system. The breakdown of these
electrical costs is estimated below:
Table IV-1 Filter Plant Energy Costs (Excluding High Service Pumps)
Component % of Energy Use Monthly Elec. Costs, $
Coagulant Feed 0.1 101 Polymer Feed 0.2 203 Rapid Mix 2.1 2128 Flocculation 0.6 608 Sedimentation 0.1 101 Gravity Filtration 1.3 1317 Air Surface Wash 0.1 101 Backwash Pumps 0 0 In-Plant Pumping 3.7 3748 Chlorine Feed 0.2 203 Admin, Lab & Maintenance 0.8 810 Subtotal 9.2 $9320
White House Utility District Energy Conservation Study September 2010
14
C. Membrane Plant
As discussed previously, the membrane plant consists of two Membrane Tanks,
each of which contains numerous modules of ultrafiltration (UF) membranes. The raw
water is pumped to the Membrane Tanks by raw water pumps 9 and 10. Coagulant and
flocculent chemicals are added to the raw water prior to entering the Membrane Tanks to
convert colloidal and suspended solids into flocculent particles. Permeate pumps are used
to draw a vacuum, which pulls the water through the membranes; the floc particles are
rejected by the membrane by a sieving mechanism. The water passing through the
membranes is then sent to the treated water storage tanks.
Over the last 3 years, the monthly electric bill for the Membrane Plant has
averaged about $6400 or about 6.3% of the total electrical costs of the WHUD water
treatment plant and distribution system. In 2007, the Membrane Plant used an average of
56,000 kWh/month of electricity. In 2008, the Membrane Plant used an average of
83,000 kWh/month of electricity. In 2009, the Membrane Plant used an average of
91,000 kWh/month of electricity. Thus, on average the Membrane Plant uses about
77,000 kWh/month of electricity. Of the monthly electric bill of $6400, approximately
38% is the demand charge or about $2400/month.
D. High Service Pumps
The finished water is stored in two above-ground storage tanks, one concrete and
one steel. Each storage tank has a capacity of about 1.0 million gallons. High service
pumps 5 through 10 are located on the west side of the lab, administration, and
maintenance building. Pumps 5 through 10 draw water from the finished water storage
White House Utility District Energy Conservation Study September 2010
15
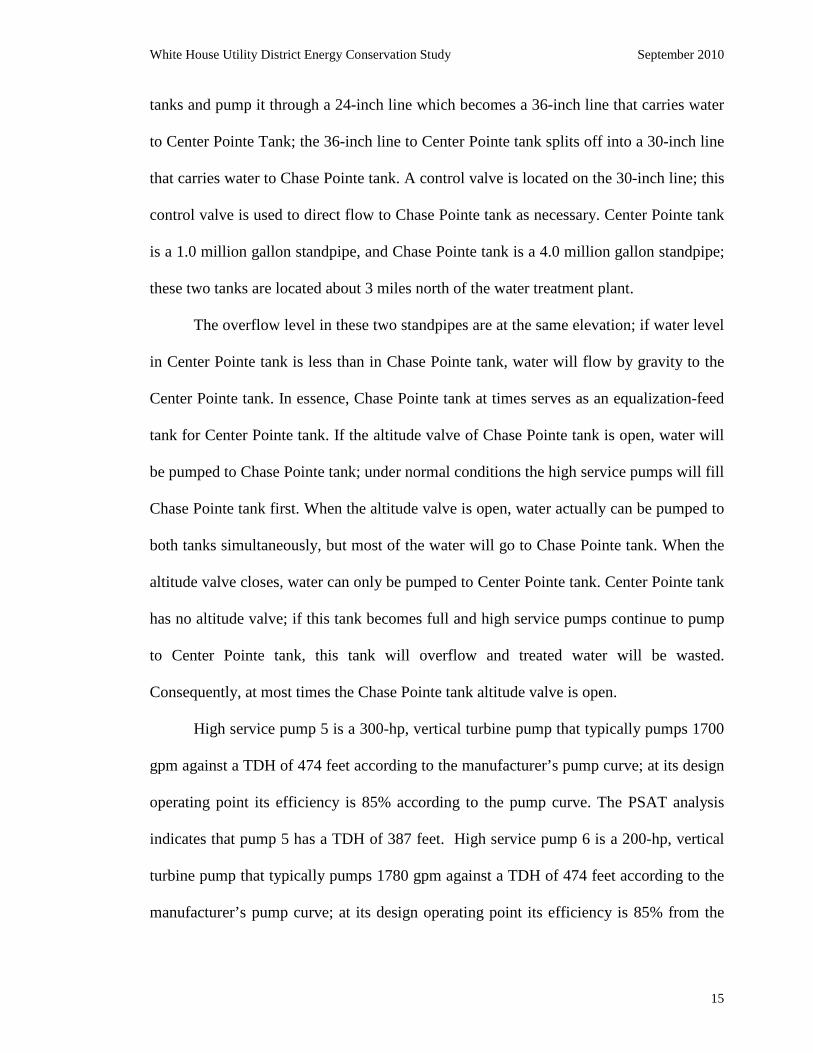
tanks and pump it through a 24-inch line which becomes a 36-inch line that carries water
to Center Pointe Tank; the 36-inch line to Center Pointe tank splits off into a 30-inch line
that carries water to Chase Pointe tank. A control valve is located on the 30-inch line; this
control valve is used to direct flow to Chase Pointe tank as necessary. Center Pointe tank
is a 1.0 million gallon standpipe, and Chase Pointe tank is a 4.0 million gallon standpipe;
these two tanks are located about 3 miles north of the water treatment plant.
The overflow level in these two standpipes are at the same elevation; if water level
in Center Pointe tank is less than in Chase Pointe tank, water will flow by gravity to the
Center Pointe tank. In essence, Chase Pointe tank at times serves as an equalization-feed
tank for Center Pointe tank. If the altitude valve of Chase Pointe tank is open, water will
be pumped to Chase Pointe tank; under normal conditions the high service pumps will fill
Chase Pointe tank first. When the altitude valve is open, water actually can be pumped to
both tanks simultaneously, but most of the water will go to Chase Pointe tank. When the
altitude valve closes, water can only be pumped to Center Pointe tank. Center Pointe tank
has no altitude valve; if this tank becomes full and high service pumps continue to pump
to Center Pointe tank, this tank will overflow and treated water will be wasted.
Consequently, at most times the Chase Pointe tank altitude valve is open.
High service pump 5 is a 300-hp, vertical turbine pump that typically pumps 1700
gpm against a TDH of 474 feet according to the manufacturer’s pump curve; at its design
operating point its efficiency is 85% according to the pump curve. The PSAT analysis
indicates that pump 5 has a TDH of 387 feet. High service pump 6 is a 200-hp, vertical
turbine pump that typically pumps 1780 gpm against a TDH of 474 feet according to the
manufacturer’s pump curve; at its design operating point its efficiency is 85% from the
White House Utility District Energy Conservation Study September 2010
16
pump curve. High service pump 6 is currently not being used because of a bad valve;
thus, no PSAT analysis was conducted. High service pump 7 is a 250-hp, vertical turbine
pump that typically pumps 1700 gpm against a TDH of 474 feet according to the
manufacturer’s pump curve; at its design operating point its efficiency is 85% according
to the pump curve. No PSAT data were obtained for pump 7 because it was offline. High
service pumps 5 through 7 each has a reduced voltage starter.
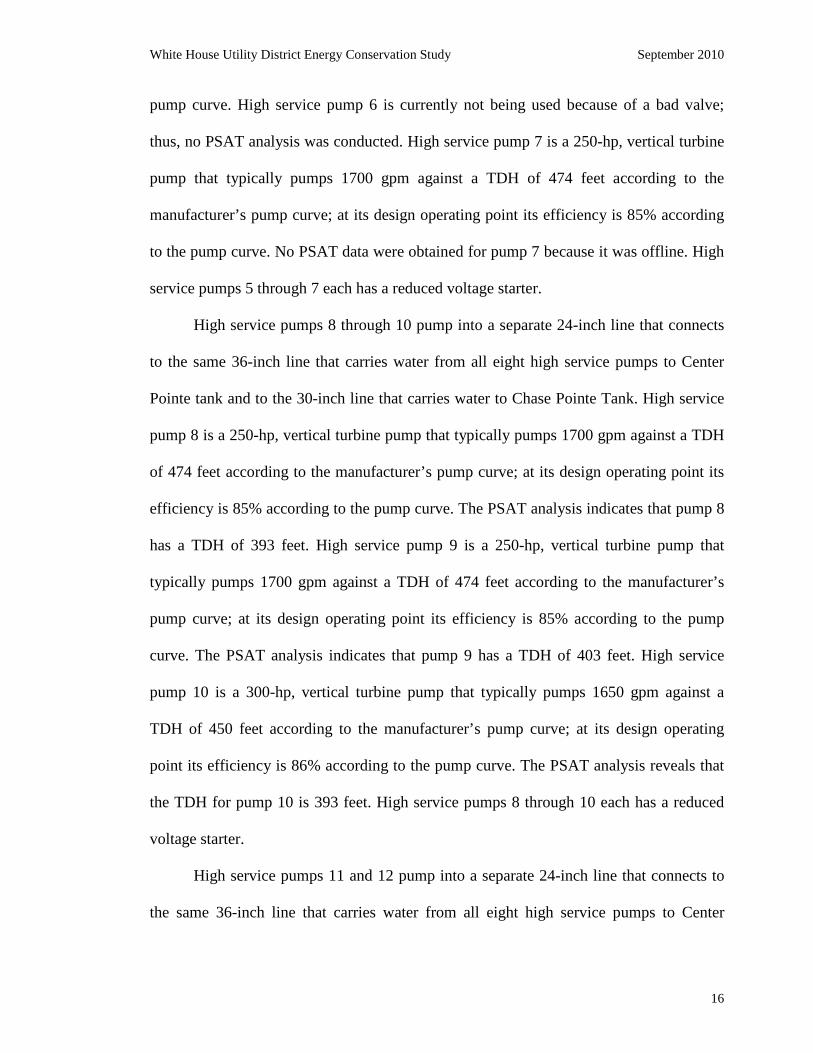
High service pumps 8 through 10 pump into a separate 24-inch line that connects
to the same 36-inch line that carries water from all eight high service pumps to Center
Pointe tank and to the 30-inch line that carries water to Chase Pointe Tank. High service
pump 8 is a 250-hp, vertical turbine pump that typically pumps 1700 gpm against a TDH
of 474 feet according to the manufacturer’s pump curve; at its design operating point its
efficiency is 85% according to the pump curve. The PSAT analysis indicates that pump 8
has a TDH of 393 feet. High service pump 9 is a 250-hp, vertical turbine pump that
typically pumps 1700 gpm against a TDH of 474 feet according to the manufacturer’s
pump curve; at its design operating point its efficiency is 85% according to the pump
curve. The PSAT analysis indicates that pump 9 has a TDH of 403 feet. High service
pump 10 is a 300-hp, vertical turbine pump that typically pumps 1650 gpm against a
TDH of 450 feet according to the manufacturer’s pump curve; at its design operating
point its efficiency is 86% according to the pump curve. The PSAT analysis reveals that
the TDH for pump 10 is 393 feet. High service pumps 8 through 10 each has a reduced
voltage starter.
High service pumps 11 and 12 pump into a separate 24-inch line that connects to
the same 36-inch line that carries water from all eight high service pumps to Center
White House Utility District Energy Conservation Study September 2010
17
Pointe tank and to the 30-inch line that carries water to Chase Pointe Tank. High service
pumps 11 and 12 each is a 600-hp, split-case centrifugal pump that typically pumps 3470
gpm against a TDH of 445 feet according to the manufacturer’s pump curve; at their
design operating point the efficiency of each pump is 83% according to the pump curve.
The PSAT analysis shows that the TDH for these two pumps is 396 feet. High service
pumps 11 and 12 each has a variable frequency drive. Under most conditions, only one of
these two 600-hp pumps is running continuously; one of the pumps will run for about a
week, and then the other pump will run for about a week. The variable frequency drive
(VFD) is primarily used to slowly ramp the pump up to 3470 gpm, where it operates the
majority of the time. Occasionally at night the 600-hp pump will be operated at a slightly
lower pumping rate (using the VFD) to conserve energy. When the 600-hp pump is being
taken off line, the VFD will be used to slowly bring the pump to a stop.
It should be noted that the high service pumps (5 through 12) are pumping against
a TDH of 445 feet to 474 feet according to the pump curves. The PSAT analysis indicates
the TDH at the time the pumps were examined was 380 feet to 400 feet. Based on data
provided by WHUD staff, the approximate static head for high service pumps 5 through
12 is about 350 feet; thus the major portion of the TDH is static head. Based on
information provided by WHUD staff, the eight high service pumps operate
approximately as follows:
White House Utility District Energy Conservation Study September 2010
18
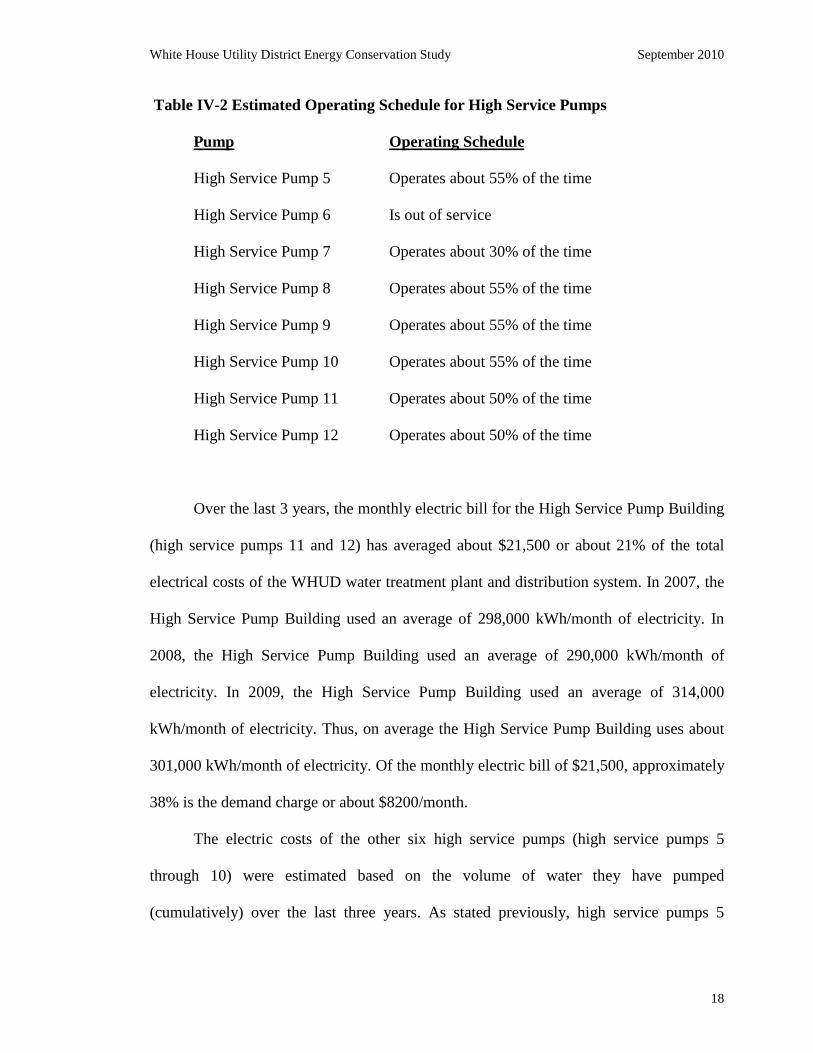
Table IV-2 Estimated Operating Schedule for High Service Pumps
Pump Operating Schedule
High Service Pump 5 Operates about 55% of the time
High Service Pump 6 Is out of service
High Service Pump 7 Operates about 30% of the time
High Service Pump 8 Operates about 55% of the time
High Service Pump 9 Operates about 55% of the time
High Service Pump 10 Operates about 55% of the time
High Service Pump 11 Operates about 50% of the time
High Service Pump 12 Operates about 50% of the time
Over the last 3 years, the monthly electric bill for the High Service Pump Building
(high service pumps 11 and 12) has averaged about $21,500 or about 21% of the total
electrical costs of the WHUD water treatment plant and distribution system. In 2007, the
High Service Pump Building used an average of 298,000 kWh/month of electricity. In
2008, the High Service Pump Building used an average of 290,000 kWh/month of
electricity. In 2009, the High Service Pump Building used an average of 314,000
kWh/month of electricity. Thus, on average the High Service Pump Building uses about
301,000 kWh/month of electricity. Of the monthly electric bill of $21,500, approximately
38% is the demand charge or about $8200/month.
The electric costs of the other six high service pumps (high service pumps 5
through 10) were estimated based on the volume of water they have pumped
(cumulatively) over the last three years. As stated previously, high service pumps 5

White House Utility District Energy Conservation Study September 2010
19
through 7 are included in the electric bill for Filter Plant Meter 1. The estimated monthly
electric cost for these three pumps is $8000 (note that pump 6 is out of service). On
average the two operating pumps use about 120,000 kWh/month of electricity.
As stated previously, high service pumps 8 through 10 are included in the electric
bill for Filter Plant Meter 2. The estimated monthly electric cost for these three pumps is
$15,500. On average these three high service pumps use about 225,000 kWh/month of
electricity.
Based on the foregoing analysis of the eight high service pumps, the estimated
monthly electric cost for all eight pumps is $45,000. On average these eight high service
pumps cumulatively use about 650,000 kWh/month of electricity. This is approximately
45% of the total energy used by the WHUD water treatment plant and distribution
system.
E. Distribution System Pumps
There are 13 distribution system pumping stations. Approximately 64% of the
electric energy used by the distribution system pump stations is used by the Slater’s
Creek Pump Station and the Highway 31 Pump Station. The other 11 pump stations each
only use about 1% (on average) of the total electric energy used by the WHUD water
treatment plant and distribution system. Therefore, most of this discussion will focus on
the energy use of the Slater’s Creek Pump Station and the Highway 31 Pump Station.
The Slater’s Creek Pump Station has four 150-hp vertical turbine pumps which
White House Utility District Energy Conservation Study September 2010
20
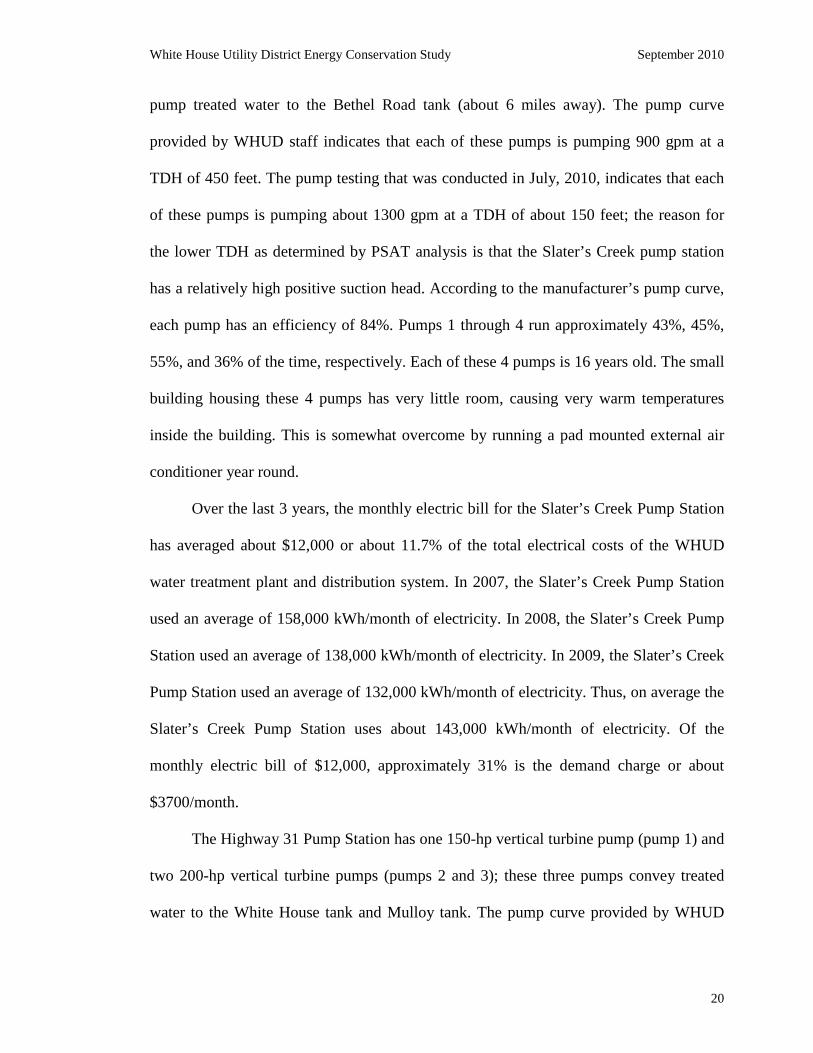
pump treated water to the Bethel Road tank (about 6 miles away). The pump curve
provided by WHUD staff indicates that each of these pumps is pumping 900 gpm at a
TDH of 450 feet. The pump testing that was conducted in July, 2010, indicates that each
of these pumps is pumping about 1300 gpm at a TDH of about 150 feet; the reason for
the lower TDH as determined by PSAT analysis is that the Slater’s Creek pump station
has a relatively high positive suction head. According to the manufacturer’s pump curve,
each pump has an efficiency of 84%. Pumps 1 through 4 run approximately 43%, 45%,
55%, and 36% of the time, respectively. Each of these 4 pumps is 16 years old. The small
building housing these 4 pumps has very little room, causing very warm temperatures
inside the building. This is somewhat overcome by running a pad mounted external air
conditioner year round.
Over the last 3 years, the monthly electric bill for the Slater’s Creek Pump Station
has averaged about $12,000 or about 11.7% of the total electrical costs of the WHUD
water treatment plant and distribution system. In 2007, the Slater’s Creek Pump Station
used an average of 158,000 kWh/month of electricity. In 2008, the Slater’s Creek Pump
Station used an average of 138,000 kWh/month of electricity. In 2009, the Slater’s Creek
Pump Station used an average of 132,000 kWh/month of electricity. Thus, on average the
Slater’s Creek Pump Station uses about 143,000 kWh/month of electricity. Of the
monthly electric bill of $12,000, approximately 31% is the demand charge or about
$3700/month.
The Highway 31 Pump Station has one 150-hp vertical turbine pump (pump 1) and
two 200-hp vertical turbine pumps (pumps 2 and 3); these three pumps convey treated
water to the White House tank and Mulloy tank. The pump curve provided by WHUD

White House Utility District Energy Conservation Study September 2010
21
staff indicates that the 150-hp unit is pumping 2800 gpm at a TDH of 160 feet. According
to the manufacturer’s pump curve, the 150-hp pump has an efficiency of 83%; this pump
has a VFD. The pump curve provided by WHUD staff indicates that each 200-hp unit is
pumping 3100 gpm at a TDH of 160 feet. According to the manufacturer’s pump curve,
each 200-hp pump has an efficiency of 82%. The PSAT analysis indicates that the TDH
for these three pumps is 140 feet to 150 feet. One of the 200-hp pumps has a reduced
voltage starter, and one has a VFD. Pumps 1 through 3 run approximately 30%, 40%, and
19% of the time, respectively. The 150-hp pump is 13 years old, and the 200-hp pumps
are each 17 years old.
Over the last 3 years, the monthly electric bill for the Highway 31 Pump Station
Pump Station has averaged about $8300 or about 8.2% of the total electrical costs of the
WHUD water treatment plant and distribution system. In 2007, the Highway 31 Pump
Station Pump Station used an average of 100,000 kWh/month of electricity. In 2008, the
Highway 31 Pump Station Pump Station used an average of 90,000 kWh/month of
electricity. In 2009, the Highway 31 Pump Station Pump Station used an average of
83,000 kWh/month of electricity. Thus, on average the Highway 31 Pump Station Pump
Station uses about 91,000 kWh/month of electricity. Of the monthly electric bill of
$8300, approximately 33% is the demand charge or about $2700/month.
F. Total Energy Demand and Cost Breakdown
The total energy use (on average) for the entire WHUD water treatment plant and
distribution system is approximately 1,280,000 kWh/month. The average monthly
electric costs for the WHUD water treatment plant and distribution system is about
$101,000. Thus, the average energy cost is about $0.079 per kWh. The detailed
White House Utility District Energy Conservation Study September 2010
22
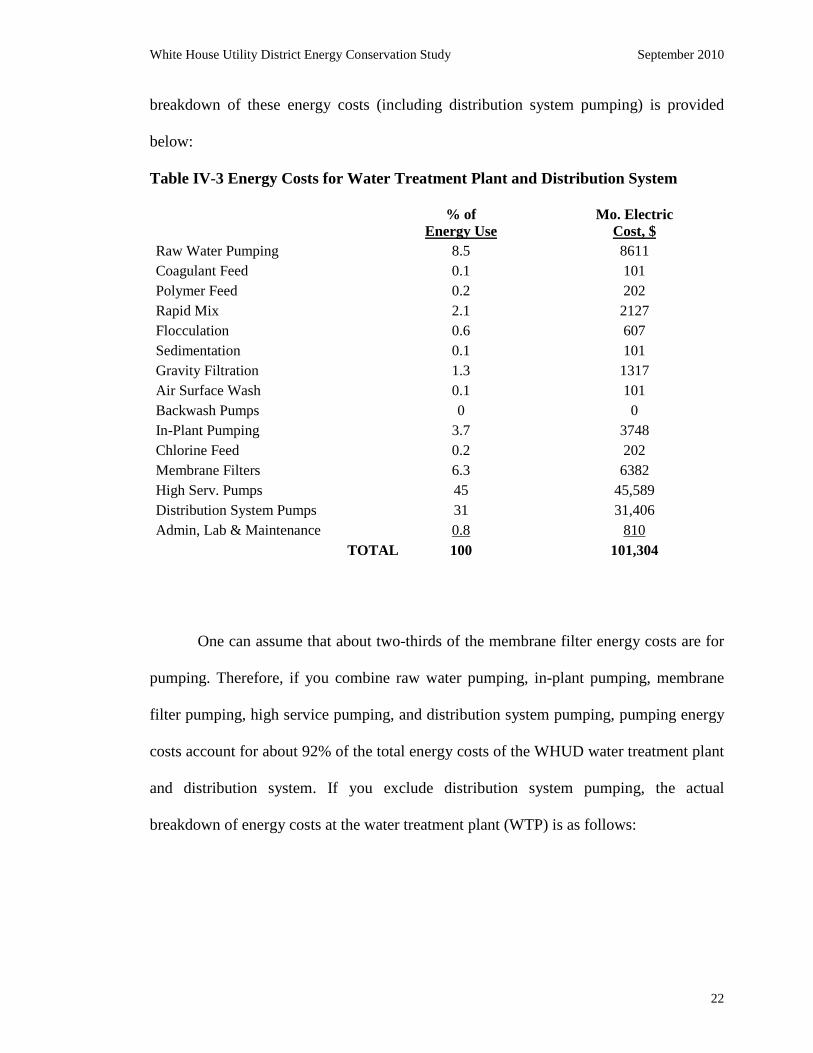
breakdown of these energy costs (including distribution system pumping) is provided
below:
Table IV-3 Energy Costs for Water Treatment Plant and Distribution System
% of Energy Use
Mo. Electric Cost, $
Raw Water Pumping
8.5
8611 Coagulant Feed
0.1
101
Polymer Feed
0.2
202 Rapid Mix
2.1
2127
Flocculation
0.6
607 Sedimentation
0.1
101
Gravity Filtration
1.3
1317 Air Surface Wash
0.1
101
Backwash Pumps
0
0 In-Plant Pumping
3.7
3748
Chlorine Feed
0.2
202 Membrane Filters
6.3
6382
High Serv. Pumps
45
45,589 Distribution System Pumps
31
31,406
Admin, Lab & Maintenance
0.8
810
TOTAL 100
101,304
One can assume that about two-thirds of the membrane filter energy costs are for
pumping. Therefore, if you combine raw water pumping, in-plant pumping, membrane
filter pumping, high service pumping, and distribution system pumping, pumping energy
costs account for about 92% of the total energy costs of the WHUD water treatment plant
and distribution system. If you exclude distribution system pumping, the actual
breakdown of energy costs at the water treatment plant (WTP) is as follows:
White House Utility District Energy Conservation Study September 2010
23
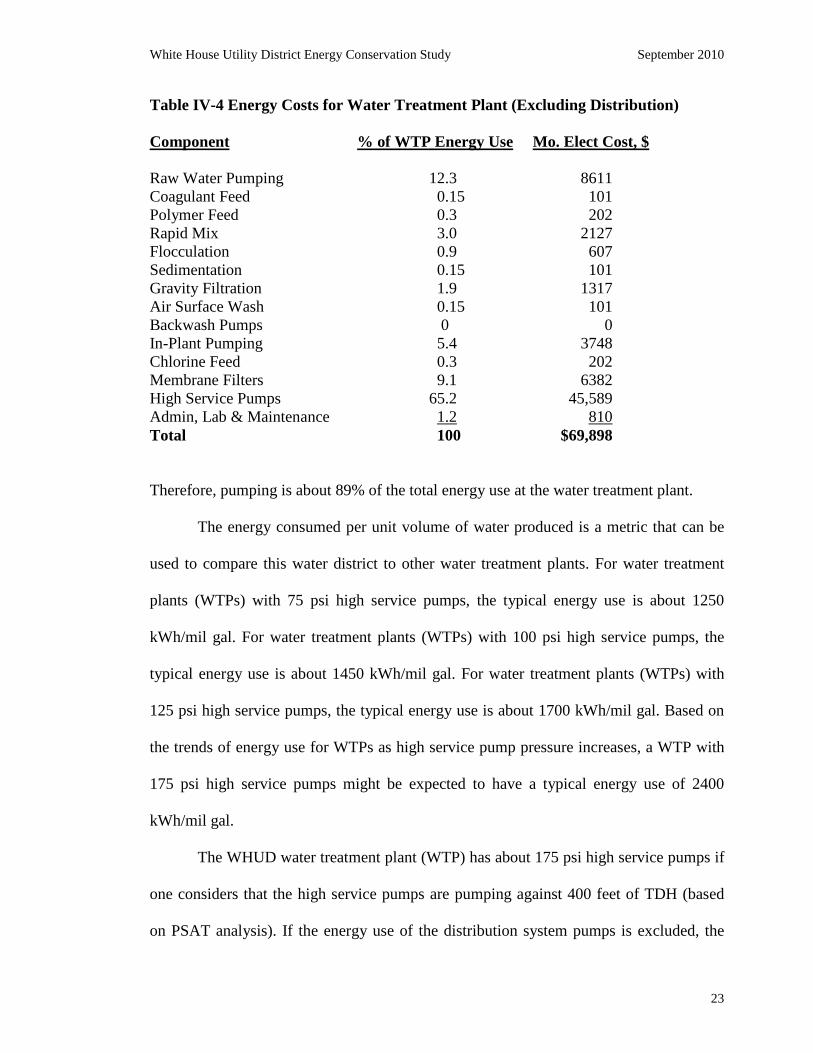
Table IV-4 Energy Costs for Water Treatment Plant (Excluding Distribution)
Component % of WTP Energy Use Mo. Elect Cost, $
Raw Water Pumping 12.3 8611 Coagulant Feed 0.15 101 Polymer Feed 0.3 202 Rapid Mix 3.0 2127 Flocculation 0.9 607 Sedimentation 0.15 101 Gravity Filtration 1.9 1317 Air Surface Wash 0.15 101 Backwash Pumps 0 0 In-Plant Pumping 5.4 3748 Chlorine Feed 0.3 202 Membrane Filters 9.1 6382 High Service Pumps 65.2 45,589 Admin, Lab & Maintenance 1.2 810 Total 100 $69,898
Therefore, pumping is about 89% of the total energy use at the water treatment plant.
The energy consumed per unit volume of water produced is a metric that can be
used to compare this water district to other water treatment plants. For water treatment
plants (WTPs) with 75 psi high service pumps, the typical energy use is about 1250
kWh/mil gal. For water treatment plants (WTPs) with 100 psi high service pumps, the
typical energy use is about 1450 kWh/mil gal. For water treatment plants (WTPs) with
125 psi high service pumps, the typical energy use is about 1700 kWh/mil gal. Based on
the trends of energy use for WTPs as high service pump pressure increases, a WTP with
175 psi high service pumps might be expected to have a typical energy use of 2400
kWh/mil gal.
The WHUD water treatment plant (WTP) has about 175 psi high service pumps if
one considers that the high service pumps are pumping against 400 feet of TDH (based
on PSAT analysis). If the energy use of the distribution system pumps is excluded, the

White House Utility District Energy Conservation Study September 2010
24
energy use of the WHUD WTP is about 2500 kWh/mil gal. For this scenario, the energy
use at the WHUD WTP is about 4% more than the typical WTP with 175 psi high service
pumps. If the energy use of the distribution system pumps is included, the energy use of
the WHUD WTP and distribution system is about 3700 kWh/mil gal. For this second
scenario, the energy use at the WHUD WTP is about 54% more than the typical WTP
with 175 psi high service pumps. Because the WHUD covers such a large area, thereby
requiring significant booster pumping in the distribution system, it seems inappropriate to
include distribution system pumping in this comparative analysis. With that said, it
appears that the WHUD water treatment plant’s current energy usage is similar to
comparable WTPs.
V. RESULTS OF PUMP TESTING
A. Introduction
On-site testing of several pumps at the water treatment plant and in the
distribution system was conducted July 14-16, 2010. Mitchell Technical Services did the
bulk of the pump testing with assistance from Dr. Moore and Jonathan Walker of the
Tennessee Valley Authority (TVA). Pump testing focused primarily on pumps that are at
least 75 hp. Consequently, the pumps that were tested included the raw water pumps,
high service pumps, Slater’s Creek pump station, and Highway 31 pump station.
Cumulatively, these pumps account for about 74% of the energy costs of the water
treatment plant and distribution system. Based on the PSAT analysis, the total potential
energy savings is about $210,000 annually. These savings could be attained if all of the
various pumps that were evaluated were designed or modified and operated at optimum

White House Utility District Energy Conservation Study September 2010
25
conditions.
B. Distribution System Pumps
Slater’s Creek Pump Station
The Slater’s Creek pump station (Figures V-1 & V-1a) is an intermediate pump
station providing potable water from the 4.0 million gallon Chase Pointe standpipe and
the 1.0 million gallon Center Point standpipe to a pair of standpipes on Bethel Road.
Figure V-1 Slater’s Creek Pump Station
Figure V-1a Slater’s Creek Pump Station
White House Utility District Energy Conservation Study September 2010
26
The Slater’s Creek pump station consists of four 150 horsepower, 6 stage vertical
turbine pumps. The pump curves supplied by White House Utility District (WHUD)
indicate that the pumps were rated for 900 GPM at 450 feet Total Dynamic Head (TDH).
WHUD provided Mitchell Technical Service (MTS) staff with historical operating and
power data. MTS staff with the assistance of WHUD, University of Memphis, and TVA
personnel collected instantaneous electrical, flow and pressure measurements from each
pump. Electrical, flow, and pressure measurements were recorded to provide a snapshot
of operating efficiency. The existing electronic pressure gauges and magnetic flow meter
were used to record pressure and flow measurements. The data were analyzed using the
Pumping System Assessment Tool (PSAT) software developed by the US Department of
Energy (USDOE).
Pump optimization rating (%) is a measure of the overall rating of the existing
pumping system efficiency relative to the optimal motor, optimal pump configuration,
expressed as a percentage. A value of 100 means the existing system is equal to the
optimal, while a value of 50 means the existing system is half as efficient as the optimal
system. Mathematically, it is simply the Optimal Motor power divided by the Existing
Motor power, expressed as a percentage. The optimization ratings for the pumps ranged
from 52.6% – 59.5% as indicated in Figure V-2. These ratings would be considered low
and indicate there is significant potential for reduction of energy usage. Data evaluation
indicated that the pumps were producing an average flow of approximately 1354 GPM at
an average of 155 feet TDH.

White House Utility District Energy Conservation Study September 2010
27
Figure V-2 Optimization Ratings for Slater’s Creek Pump Station
The PSAT software uses the calculated fluid power and optimal pump efficiency to
determine the optimal pump input shaft power. The optimal motor rated horsepower for
the existing pumps at this condition would be approximately 60 HP each. PSAT
calculated existing and optimal power consumption for the four pumps. If optimized the
power demand would be reduced by 41.2% - 43.0% as seen in Figure V-3 below.

White House Utility District Energy Conservation Study September 2010
28
Figure V-3 Existing Power Demand versus Optimized Power Demand
A review of the power bills for the period of 1/21/09-2/17/10 indicated a
maximum billed demand of 301 KW and a minimum of 207 KW. The average billed
demand for the period was 287 KW. Based on the PSAT existing power calculation this
would indicate that as many as 4 pumps may currently be required to meet peak flow
requirements. The average daily flow for the same period was 2271 gpm with a
maximum daily flow of 3428 gpm. Run time data was analyzed for the period of 1/10/10
– 6/20/10. Average pump run time was 11.1 hrs per pump with an average total daily run
time of 44.3 hours, confirming the need for multiple pump operation. A more efficient
pump could supply more flow while using less horsepower.
White House Utility District Energy Conservation Study September 2010
29
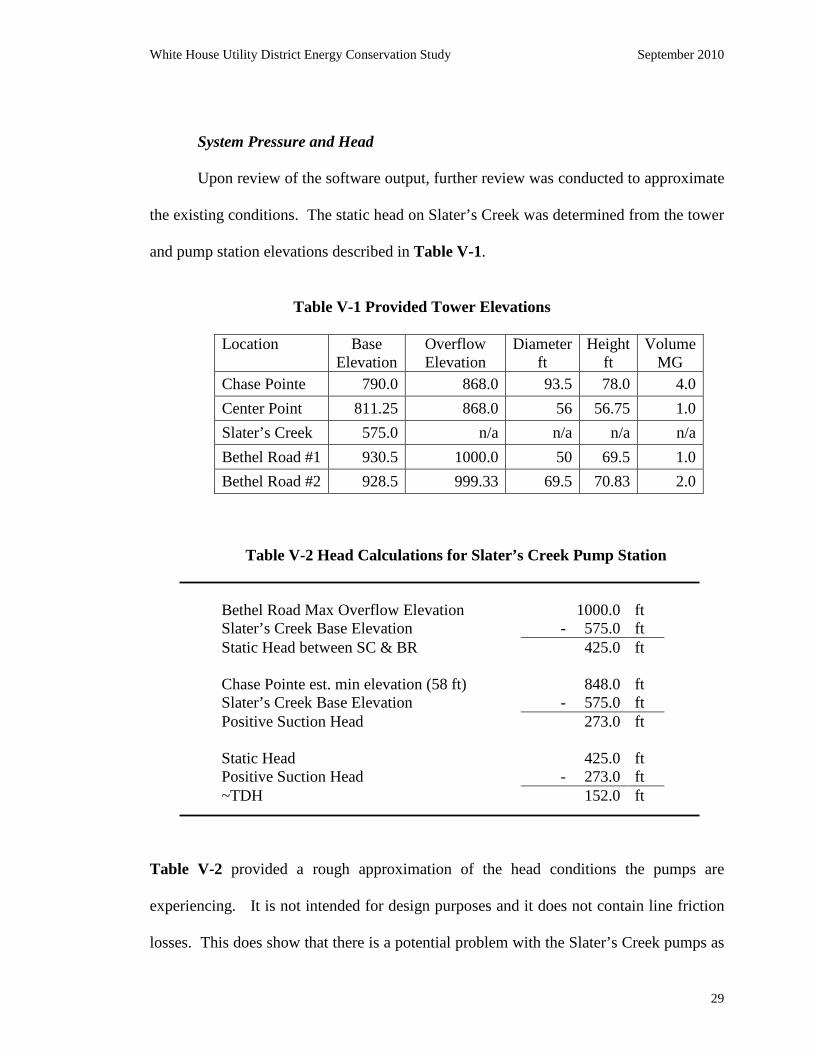
System Pressure and Head
Upon review of the software output, further review was conducted to approximate
the existing conditions. The static head on Slater’s Creek was determined from the tower
and pump station elevations described in Table V-1.
Table V-1 Provided Tower Elevations
Location Base
Elevation Overflow Elevation
Diameter ft
Height ft
Volume MG
Chase Pointe 790.0 868.0 93.5 78.0 4.0 Center Point 811.25 868.0 56 56.75 1.0 Slater’s Creek 575.0 n/a n/a n/a n/a Bethel Road #1 930.5 1000.0 50 69.5 1.0 Bethel Road #2 928.5 999.33 69.5 70.83 2.0
Table V-2 Head Calculations for Slater’s Creek Pump Station
Bethel Road Max Overflow Elevation 1000.0 ft Slater’s Creek Base Elevation - 575.0 ft Static Head between SC & BR 425.0 ft Chase Pointe est. min elevation (58 ft) 848.0 ft Slater’s Creek Base Elevation - 575.0 ft Positive Suction Head 273.0 ft Static Head 425.0 ft Positive Suction Head - 273.0 ft ~TDH 152.0 ft
Table V-2 provided a rough approximation of the head conditions the pumps are
experiencing. It is not intended for design purposes and it does not contain line friction
losses. This does show that there is a potential problem with the Slater’s Creek pumps as

White House Utility District Energy Conservation Study September 2010
30
they are rated at 450 ft TDH when, by this evaluation, approximately half that head
should suffice. This would warrant further review to determine all operating conditions
for this pump station.
Potential Energy Savings
It is estimated that potential energy savings would be about $46,000 annually if
the Slater’s Creek pump station was designed and operated at optimal conditions. These
savings were calculated using the historical data provided by WHUD. A figure of $0.079
per kWh was used. This was derived from the following formula: Gross $ / Gross kWh
for the period of 12/15/06 through 02/17/10. From this analysis it appears that four 60-hp
pumps could be installed to replace the four existing 150-hp pumps. It is suggested that
WHUD staff have consultations with their manufacturer’s representatives and their
engineering consultant(s) for possible changes that might be made with the existing
installation. Changing these four pumps to 60 hp (each) at approximately 180 ft TDH
would limit their ability to pump to the Bethel Road Tanks should both Chase Pointe and
Center Points tanks be taken offline.
Highway 31 Pump Station
The Highway 31 pumps were evaluated in a similar manner using field
measurements and analyzing the data with PSAT software. The efficiency of Highway 31
pumps 1, 2, and 3 were 80.6%, 72.1%, and 70.6%, respectively. If these pumps were
modified to produce optimum efficiency, the potential annual energy savings would be
approximately $22,000 annually for these three Highway 31 pumps.
White House Utility District Energy Conservation Study September 2010
31
C. Raw Water Pumps
The raw water pumps were evaluated in a similar manner using field
measurements and analyzing the data with PSAT software. The efficiency of raw water
pumps 5, 6, 7, and 8 were 47.4%, 66.7%, 74.8%, and 62.6%, respectively. If these pumps
were modified to produce optimum efficiency, the potential annual energy savings would
be approximately $21,000 annually for these four raw water pumps.
D. High Service Pumps
The high service pumps were evaluated in a similar manner using field
measurements and analyzing the data with PSAT software. The efficiency of high service
pumps 5, 8, 9, and 10 were 71.4%, 68.8%, 70%, and 65.7%, respectively. If these pumps
were modified to produce optimum efficiency, the potential annual energy savings would
be approximately $78,000 annually for these four high service pumps.
High service pumps 11 and 12 were also evaluated using field data and PSAT
software. The efficiency of pumps 11 and 12 were 86.3% and 82.7%, respectively. While
it is not likely that these pumps would be modified to improve efficiency, the potential
energy savings for these two pumps is about $40,000 annually. The primary reasons these
two pumps would not be modified is that they are currently operating fairly efficiently
and they are only 9 years old.

White House Utility District Energy Conservation Study September 2010
32
VI. DEVELOPMENT OF ENERGY CONSERVATION MEASURES
A. Distribution System Pumps
Slater’s Creek Pump Station
Option 1: Install Two New 75-hp Pumps and Two New 125-hp Pumps
Based on the PSAT analysis discussed previously, it seems that four new pumps
could be installed to replace the four existing 150-hp pumps. The two 75-hp pumps
would need to pump 1200 gpm against an estimated TDH of about 180 feet, assuming a
positive suction head of about 270 feet. The two 125-hp pumps each would need to pump
750 gpm against an estimated TDH of about 450 feet, assuming the positive suction head
of about 270 feet is lost. The loss of positive suction head would be an emergency
situation that would be very unlikely to occur; if it occurred, the two 125-hp pumps could
deliver about 2.2 mgd to the Bethel Road standpipe. Typically this pump station delivers
about 3.4 mgd (on average) to the Bethel Road standpipe. If the TDH is 180 feet, it is
estimated that each 125-hp pump would pump about 1100 gpm at reduced efficiency. The
estimated energy savings would be about $40,000 annually. The cost of installing four
new vertical turbine pumps (premium efficiency motors) would be approximately
$450,000. Thus, the payback period would be about 11 years.
Option 2: Install Two New 125-hp Pumps
Based on the PSAT analysis discussed previously, it seems that two 125-hp
pumps could be installed to replace two of the four existing 150-hp pumps. By leaving
two of the existing 150-hp pumps, it would be possible for this pump station to produce

White House Utility District Energy Conservation Study September 2010
33
1800 gpm against a TDH of 450 feet if, for some unlikely reason, the positive suction
head on the Slater’s Creek pump station was lost. The two new 125-hp pumps would
need to pump 2000 gpm against an estimated TDH of about 180 feet, assuming a positive
suction head of about 270 feet. The estimated energy savings would be about $60,000
annually. The cost of installing two new 125-hp vertical turbine pumps (premium
efficiency) would be approximately $300,000. Thus, the payback period would be about
5 years.
Option 3: Install an Entirely New Pump Station
Because the existing pump station has very little room and is overheated, a new
pump station may be justified. Moreover, the existing pumps are 16 years old. Three 150-
hp vertical turbine pumps, each with a premium efficiency motor and capable of
delivering 1800 gpm at TDH of 180 feet, would be installed in the new station. This new
pump station would cost approximately $1,500,000. Obviously, this option is very
expensive and probably would only be implemented if the WHUD was able to obtain
some grant money to help justify the expenditure. The estimated annual energy savings
would be about $42,000. Some consideration must be given for the possibility that the
positive suction head provided by Chase Pointe tank and Center Point tank could be lost.
Highway 31 Pump Station
Option 1: Minor Repair of the Existing Pumps
The average PSAT efficiency of the three Highway 31 pumps is 74%. According
to the pump curves for this station, the pumps should have an efficiency of 82%. This
White House Utility District Energy Conservation Study September 2010
34
reduction in efficiency is likely due to the wearing of pump components over the last 16
years. Parts of the pump subject to wear include impellers, wear rings, casings (volutes),
bearings, and seals. Any change in the pump due to worn components, such as increased
power draw, will have an effect on the overall performance of the pumping system.
Reduced efficiency can also be caused by reduced TDH.
In this option the three existing pumps (one repair job at a time) will be
disassembled, blasted and cleaned. The company doing the repairs should document
critical dimensions and clearances for as-is condition of each pump. They should provide
photos and sketches of critical components with statements regarding probable root
causes of abnormal condition. Bearings (bushings), packings, and interstage couplings
should be replaced.
If problems with the shaft are found, the shaft should be replaced or straightened
with documented method of strengthening. Mechanical seals should be replaced, and
clearances between impeller and case liner should be restored. The impeller, bowl, and
piping should be coated with epoxy. The pump should be reassembled, painted, and
delivered back to WHUD.
All instruments and flow-metering devices should be recalibrated, and the pump
should be tested to determine whether proper performance is being obtained. If internal
repairs are made, the pump should again be tested after completion of the repairs. The
estimated cost of performing minor repairs on the existing pumps is $50,000. It will be
assumed that these minor repairs will result in annual energy savings of $17,000. Thus,
the payback period for this option is 2.9 years.

White House Utility District Energy Conservation Study September 2010
35
Option 2: Complete Overhaul of the Existing Pumps
A complete overhaul of these three pumps likely will not be necessary; the need
for a complete overhaul can be determined when the pumps are opened for inspection. If
pump overhaul is deemed necessary, a decision must be made whether to overhaul the
pump on-site or at the pump manufacturer’s plant. All of the steps noted above for a
minor repair will be done plus additional work as discussed below. The stainless steel
liner should be relined, and the impeller vanes should be reworked to match the cone
angle and restore proper clearances. All fits between mating parts should be re-machined
to ensure parallelism and perpendicularity of the entire rotor. The suction bell should be
repaired. A complete report should be provided; the report should state as-found
conditions and final dimensions and all critical clearances. Pre- and post-overhaul
vibration analysis (and flow analysis as an option) should be conducted to assess
effectiveness of the overhaul. Complete overhaul of the three pumps is estimated to cost
about $150,000. It will be assumed that overhauling the pumps will result in annual
energy savings of $20,000. Thus, the payback period for this option is 7.5 years.
B. Raw Water Pumps
Option 1: Minor Repair of the Existing Pumps
The average PSAT efficiency of raw water pumps 5 (75 hp), 6 (75 hp), 7 (100
hp), and 8 (100 hp) is 63%. According to the pump curves for this station, the pumps
should have an efficiency of 85%. This reduction in efficiency is likely due to the
wearing of pump components because the ages of pumps 5, 6, 7, and 8 are 13, 24, 24, and
White House Utility District Energy Conservation Study September 2010
36
1 year, respectively. Although pump 8 was rebuilt only one year ago, it has a PSAT
rating of only 57.6%; this is surprisingly low for a newly rebuilt pump.
In this option pumps 5, 6, and 7 (one repair job at a time) will be disassembled,
blasted and cleaned. The company doing the repairs should document critical dimensions
and clearances for as-found condition of each pump. They should provide photos and
sketches of critical components with statements regarding probable root causes of
abnormal condition. Bearings (bushings), packings, and interstage couplings should be
replaced.
If problems with the shaft are found, the shaft should be replaced or straightened
with documented method of strengthening. Mechanical seals should be replaced, and
clearances between impeller and case liner should be restored. The impeller, bowl, and
piping should be coated with epoxy. The pump should be reassembled, painted, and
delivered back to WHUD.
All instruments and flow-metering devices should be recalibrated, and the pump
should be tested to determine whether proper performance is being obtained. If internal
repairs are made, the pump should again be tested after completion of the repairs. The
estimated cost of performing minor repairs on the existing pumps is $30,000. It will be
assumed that these minor repairs will result in annual energy savings of $12,000. Thus,
the payback period for this option is 2.5 years.
Option 2: Complete Overhaul of the Existing Pumps
A complete overhaul of pumps 5, 6, 7, and 8 may or may not be necessary; the
need for a complete overhaul can be determined when the pumps are opened for

White House Utility District Energy Conservation Study September 2010
37
inspection. If pump overhaul is deemed necessary, a decision must be made whether to
overhaul the pump on-site or at the pump manufacturer’s plant. The overhaul procedures
should be conducted as discussed previously. Complete overhaul of pumps 5, 6, and 7 is
estimated to cost about $90,000. It will be assumed that overhauling the pumps will result
in annual energy savings of $17,000. Thus, the payback period for this option is 4.5
years.
C. High Service Pumps
1. High Service Pumps 5, 8, 9, and 10
Option 1: Minor Repair of the Existing Pumps
The average PSAT efficiency of high service pumps 5 (300 hp), 8 (250 hp), 9
(250 hp), and 10 (300 hp) is 69%. According to the pump curves, the pumps should have
an efficiency of 85%. This reduction in efficiency is likely due to the wearing of pump
components because the ages of pumps 5, 8, 9, and 10 are 18, 24, 13, and 13 years,
respectively.
In this option pumps 5, 8, 9, and 10 will be inspected. Maintenance should be
done as described previously on the impellers, bearings, packing, inter-stage couplings,
shafts, mechanical seals, instruments and flow meters as necessary to restore the pumps
to optimal operating efficiency. If internal repairs are made, the pump should again be
tested after completion of the repairs. The estimated cost of performing minor repairs on
the existing pumps is $100,000. It will be assumed that these minor repairs will result in
annual energy savings of $60,000. Thus, the payback period for this option is 1.7 years.
White House Utility District Energy Conservation Study September 2010
38
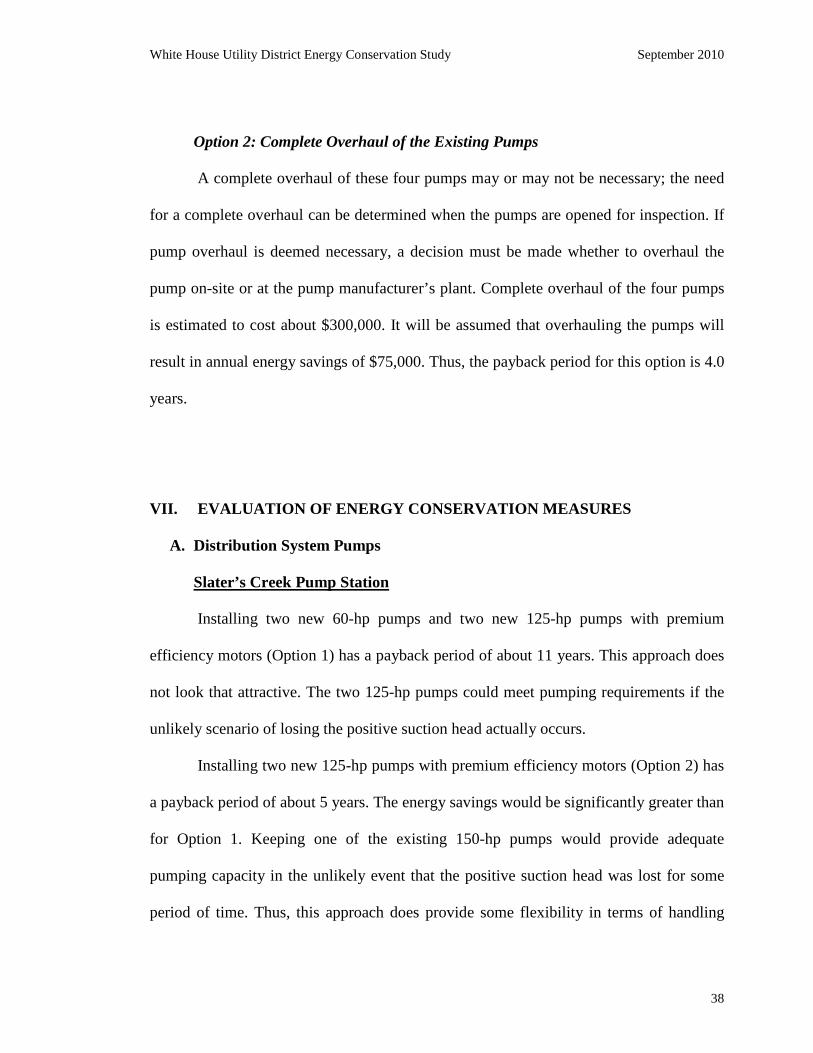
Option 2: Complete Overhaul of the Existing Pumps
A complete overhaul of these four pumps may or may not be necessary; the need
for a complete overhaul can be determined when the pumps are opened for inspection. If
pump overhaul is deemed necessary, a decision must be made whether to overhaul the
pump on-site or at the pump manufacturer’s plant. Complete overhaul of the four pumps
is estimated to cost about $300,000. It will be assumed that overhauling the pumps will
result in annual energy savings of $75,000. Thus, the payback period for this option is 4.0
years.
VII. EVALUATION OF ENERGY CONSERVATION MEASURES
A. Distribution System Pumps
Slater’s Creek Pump Station
Installing two new 60-hp pumps and two new 125-hp pumps with premium
efficiency motors (Option 1) has a payback period of about 11 years. This approach does
not look that attractive. The two 125-hp pumps could meet pumping requirements if the
unlikely scenario of losing the positive suction head actually occurs.
Installing two new 125-hp pumps with premium efficiency motors (Option 2) has
a payback period of about 5 years. The energy savings would be significantly greater than
for Option 1. Keeping one of the existing 150-hp pumps would provide adequate
pumping capacity in the unlikely event that the positive suction head was lost for some
period of time. Thus, this approach does provide some flexibility in terms of handling

White House Utility District Energy Conservation Study September 2010
39
adverse conditions that may occur. The WHUD staff should have discussions with its
engineering consultant and pump manufacturer to determine if the new pumps can indeed
deliver the desired pumping rate at the estimated TDH. Moreover, the estimated TDH
needs to be determined more accurately.
Building a new Slater’s Creek pump station is desirable because of limitations at
the existing pump station. However, the economic attractiveness of this approach will
likely depend on the availability of state and/or federal grants to offset some of the capital
cost of the project.
Highway 31 Pump Station
Performing minor repairs on this pump station has a payback period of 2.9 years.
If the three pumps have to be completely overhauled, the payback period is 7.5 years. If
minor repairs are necessary, taking these steps to improve the efficiency of this pump
station is attractive. If overhaul of the existing pumps is required, the payback period is
not that attractive.
B. Raw Water Pumps
For minor repair of pumps 5, 6, and 7 the annual energy savings will be about
$12,000 with a payback period of 2.5 years. This is attractive and should be considered.
If these three pumps require a complete overhaul, the payback period of 4.5 years
obviously is less attractive.
White House Utility District Energy Conservation Study September 2010
40
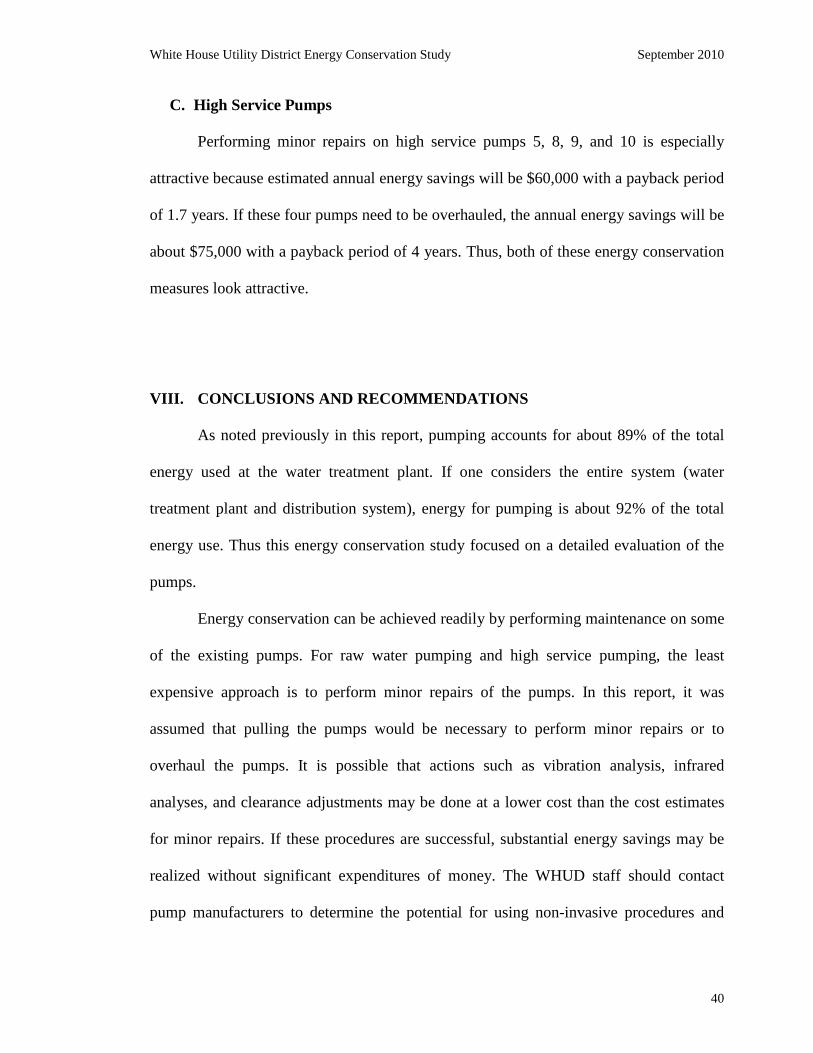
C. High Service Pumps
Performing minor repairs on high service pumps 5, 8, 9, and 10 is especially
attractive because estimated annual energy savings will be $60,000 with a payback period
of 1.7 years. If these four pumps need to be overhauled, the annual energy savings will be
about $75,000 with a payback period of 4 years. Thus, both of these energy conservation
measures look attractive.
VIII. CONCLUSIONS AND RECOMMENDATIONS
As noted previously in this report, pumping accounts for about 89% of the total
energy used at the water treatment plant. If one considers the entire system (water
treatment plant and distribution system), energy for pumping is about 92% of the total
energy use. Thus this energy conservation study focused on a detailed evaluation of the
pumps.
Energy conservation can be achieved readily by performing maintenance on some
of the existing pumps. For raw water pumping and high service pumping, the least
expensive approach is to perform minor repairs of the pumps. In this report, it was
assumed that pulling the pumps would be necessary to perform minor repairs or to
overhaul the pumps. It is possible that actions such as vibration analysis, infrared
analyses, and clearance adjustments may be done at a lower cost than the cost estimates
for minor repairs. If these procedures are successful, substantial energy savings may be
realized without significant expenditures of money. The WHUD staff should contact
pump manufacturers to determine the potential for using non-invasive procedures and

White House Utility District Energy Conservation Study September 2010
41
their associated energy savings.
The cost estimates for new pumps and for pump maintenance have been
developed based on information provided by pump manufacturer representatives; they are
planning level estimates only. Costs are estimated to be ± 25% in terms of accuracy.
Pump manufacturers or their representatives should be asked to make an on-site visit and
conduct a preliminary evaluation to determine the most appropriate procedures for
specific pumps noted previously.
For the distribution system, special attention should be given to Slater’s Creek
pump station because the average efficiency of these pumps at current conditions is 56%.
Installing two new 125-hp vertical turbine pumps appears to be the best approach,
resulting in annual energy savings of $60,000 with a payback period of 5 years. A more
detailed engineering analysis for modifying this pump station should be done. It is
possible that the payback period can be shortened by optimizing this pump station.
Provision should be made for having at least one pump that can pump against the original
TDH of 450 feet in case pressure from Center Point tank and Chase Pointe tank somehow
is lost.
For the Highway 31 pump station, performing minor repairs as discussed
previously may be the best approach for achieving energy savings. A reasonable payback
period of 2.9 years may be realized with associated annual energy savings of $17,000.
If minor repair of Highway 31 pump station, raw water pumps 5, 6, and 7, and
high service pumps 5, 8, 9, and 10 is done in conjunction with adding two new pumps at
the Slater’s Creek pump station, the estimated annual energy savings will be about
$164,000. This represents a reduction of about 14% in energy use at the WHUD water
White House Utility District Energy Conservation Study September 2010
42
treatment plant and distribution system. The total cost of these pump modifications is
about $480,000. The overall payback period will be 2.9 years, which appears to be
attractive.
When a pump is purchased or rebuilt, consideration should be given to building a
pump curve for that pump. This will allow the operator to determine if the new pump is
performing in accordance with the manufacturer’s curve, and allow the operator to
determine if a repaired pump has been brought back up to nominal capacity. This can be
accomplished with an accurate set of pressure gauges and an accurate flow meter. For the
purposes of this curve (on a centrifugal pump) head can be introduced by throttling a
discharge valve. This should not be attempted on a positive displacement pump because
the pump and piping can be damaged.

White House Utility District Energy Conservation Study September 2010
43
APPENDIX A
White House Utility District Pumping
Systems Assessment