energy audit – final report · final ahfc report tkj school athletic facility.docx 1 1.0...
TRANSCRIPT
ENERGY AUDIT – FINAL REPORT
Tok Athletic Facility Jon Summer Way
Tok, Alaska
Prepared for:
Mr. Randy Warren P.O. Box 226 Tok, Alaska
Prepared by:
Douglas S. Dusek CEA
Steven H. Billa EIT, CEAIT
July 11, 2012
Acknowledgment: “This material is based upon work supported by the Department of Energy under Award Number DE-EE0000095”
Managing Office 2400 College Road 3105 Lakeshore Dr. Suite 106A 4402 Thane Road
Fairbanks, Alaska 99709 Anchorage, Alaska 99517 Juneau, Alaska 99801 p. 907.452.5688 p. 907.222.2445 p: 907.586.6813 f. 907.452.5694 f. 907.222.0915 f: 907.586.6819
www.nortechengr.com
ENVIRONMENTAL ENGINEERING, HEALTH & SAFETY
Anch: 3105 Lakeshore Dr. Ste 106A, 99517 907.222.2445 Fax: 222.0915 Fairbanks: 2400 College Road, 99709 907.452.5688 Fax: 452.5694
Juneau: 4402 Thane Road, 99801 907.586.6813 Fax: 586.6819 [email protected] www.nortechengr.com
F:\00-Jobs\2011\2602 F - AHFC Grade Audits\50-300 Doyon Other Region\50-300 Alaska Gateway SD\50-310 Tok School Athletic Facility\Reports\Final\2012.07.11 Final AHFC Report TKJ School Athletic Facility.docx
TABLE OF CONTENTS
1.0 EXECUTIVE SUMMARY .................................................................................................. 1
2.0 INTRODUCTION ............................................................................................................... 3
2.1 Building Description, Use, Occupancy and Schedules.......................................... 3
2.1.1 Building Description and Use ....................................................................... 3
2.1.2 Occupancy and Schedules ........................................................................... 5
2.2 Benchmarking ....................................................................................................... 6
2.2.1 Energy Utilization Index of 2010 ................................................................ 7
3.0 ENERGY CONSUMPTION AND MODELING RESULTS .............................................. 11
3.1 Understanding How AkWarm Models Energy Consumption ............................... 12
3.1.1 AkWarm Calculated Savings for the Tok Athletic Facility ........................ 13
3.1.2 AkWarm Projected Energy Costs after Modifications .............................. 14
3.2 Energy Efficiency Measures Calculated Outside AkWarm .................................. 15
4.0 BUILDING OPERATION AND MAINTENANCE (O & M) .............................................. 16
4.1 Operations and Maintenance .............................................................................. 16
4.2 Building Specific Recommendations ................................................................... 16
Energy Audit – Final Report Tok Athletic Facility
Tok, Alaska
F:\00-Jobs\2011\2602 F - AHFC Grade Audits\50-300 Doyon Other Region\50-300 Alaska Gateway SD\50-310 Tok School Athletic Facility\Reports\Final\2012.07.11 Final AHFC Report TKJ School Athletic Facility.Docx
2
APPENDICES
Appendix A Recommended Energy Efficiency Measures ........................................... 18
Appendix B Energy Efficiency Measures that are NOT Recommended ..................... 24
Appendix C Significant Equipment List ....................................................................... 25
Appendix D Local Utility Rate Structure ...................................................................... 26
Appendix E Analysis Methods .................................................................................... 28
Appendix F Audit Limitations ...................................................................................... 29
Appendix G References .............................................................................................. 30
Appendix H Typical Energy Use and Cost – Fairbanks and Anchorage ..................... 31
Appendix I Typical Energy Use and Cost – Continental U.S. .................................... 32
Appendix L Building Floor Plan .................................................................................. 35
Energy Audit – Final Report Tok Athletic Facility
Tok, Alaska
F:\00-Jobs\2011\2602 F - AHFC Grade Audits\50-300 Doyon Other Region\50-300 Alaska Gateway SD\50-310 Tok School Athletic Facility\Reports\Final\2012.07.11 Final AHFC Report TKJ School Athletic Facility.Docx
1
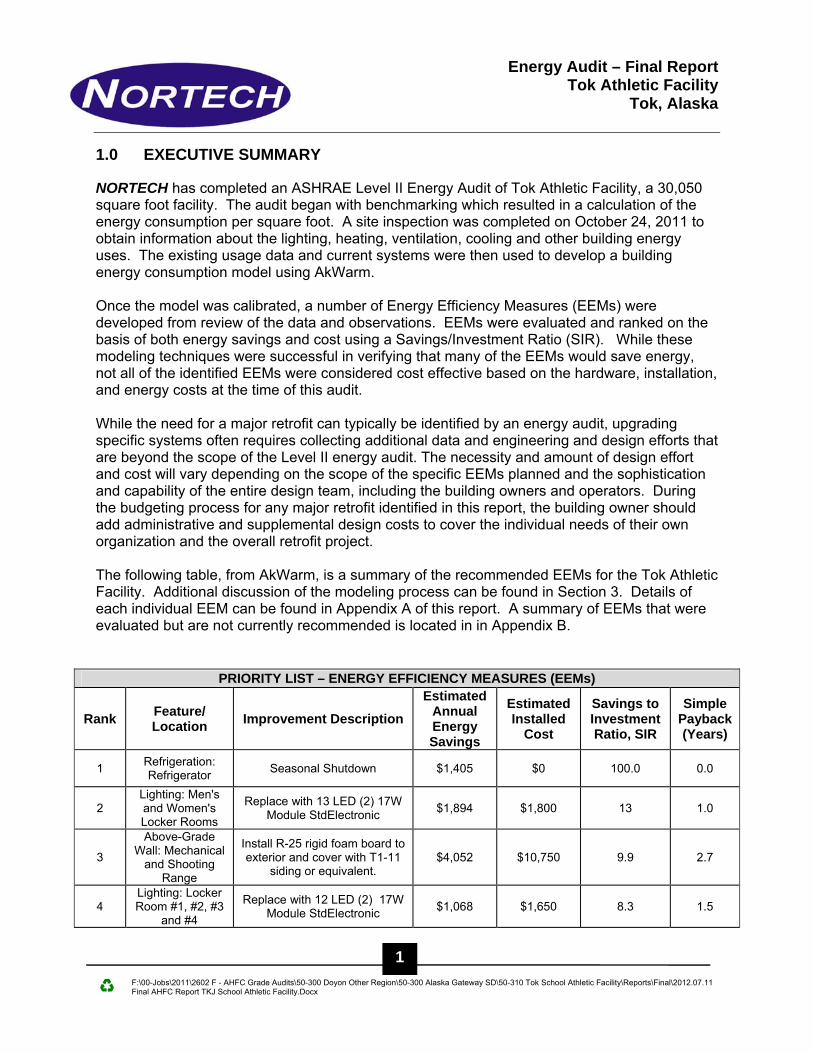
1.0 EXECUTIVE SUMMARY
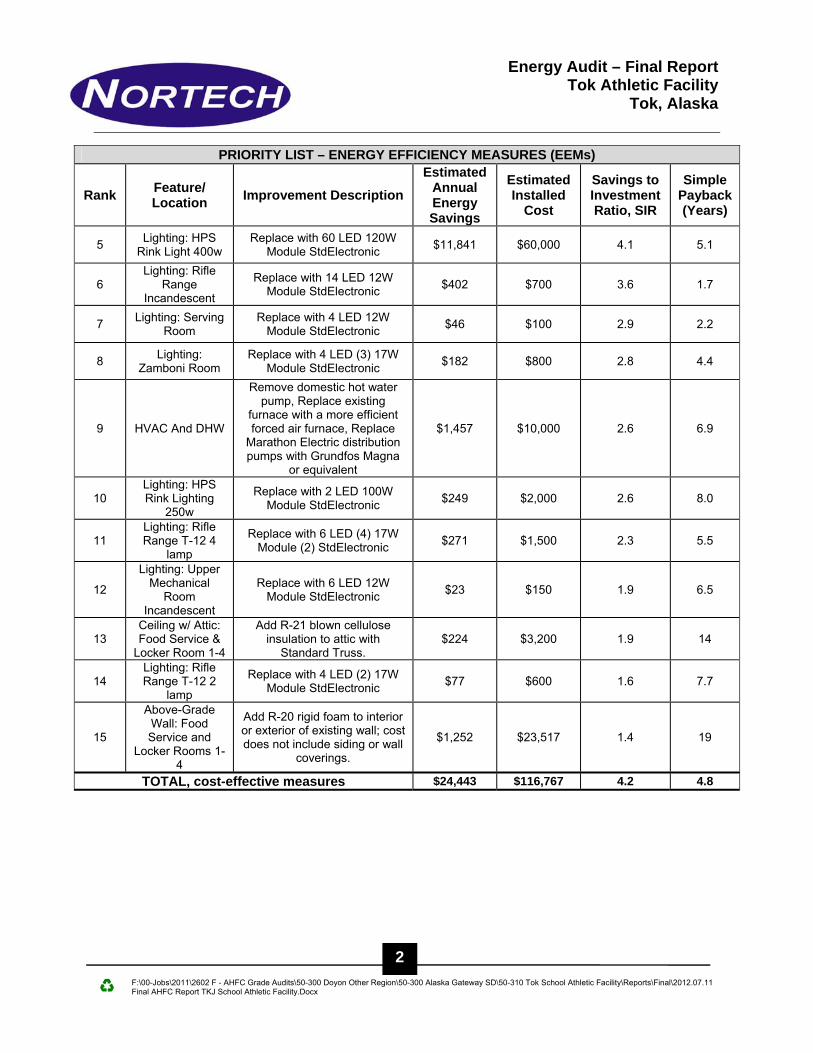
NORTECH has completed an ASHRAE Level II Energy Audit of Tok Athletic Facility, a 30,050 square foot facility. The audit began with benchmarking which resulted in a calculation of the energy consumption per square foot. A site inspection was completed on October 24, 2011 to obtain information about the lighting, heating, ventilation, cooling and other building energy uses. The existing usage data and current systems were then used to develop a building energy consumption model using AkWarm. Once the model was calibrated, a number of Energy Efficiency Measures (EEMs) were developed from review of the data and observations. EEMs were evaluated and ranked on the basis of both energy savings and cost using a Savings/Investment Ratio (SIR). While these modeling techniques were successful in verifying that many of the EEMs would save energy, not all of the identified EEMs were considered cost effective based on the hardware, installation, and energy costs at the time of this audit. While the need for a major retrofit can typically be identified by an energy audit, upgrading specific systems often requires collecting additional data and engineering and design efforts that are beyond the scope of the Level II energy audit. The necessity and amount of design effort and cost will vary depending on the scope of the specific EEMs planned and the sophistication and capability of the entire design team, including the building owners and operators. During the budgeting process for any major retrofit identified in this report, the building owner should add administrative and supplemental design costs to cover the individual needs of their own organization and the overall retrofit project. The following table, from AkWarm, is a summary of the recommended EEMs for the Tok Athletic Facility. Additional discussion of the modeling process can be found in Section 3. Details of each individual EEM can be found in Appendix A of this report. A summary of EEMs that were evaluated but are not currently recommended is located in in Appendix B.
PRIORITY LIST – ENERGY EFFICIENCY MEASURES (EEMs)
Rank Feature/ Location
Improvement Description
Estimated Annual Energy Savings
Estimated Installed
Cost
Savings to Investment Ratio, SIR
Simple Payback (Years)
1 Refrigeration: Refrigerator Seasonal Shutdown $1,405 $0 100.0 0.0
2 Lighting: Men's and Women's Locker Rooms
Replace with 13 LED (2) 17W Module StdElectronic $1,894 $1,800 13 1.0
3
Above-Grade Wall: Mechanical
and Shooting Range
Install R-25 rigid foam board to exterior and cover with T1-11
siding or equivalent. $4,052 $10,750 9.9 2.7
4 Lighting: Locker Room #1, #2, #3
and #4
Replace with 12 LED (2) 17W Module StdElectronic $1,068 $1,650 8.3 1.5
Energy Audit – Final Report Tok Athletic Facility
Tok, Alaska
F:\00-Jobs\2011\2602 F - AHFC Grade Audits\50-300 Doyon Other Region\50-300 Alaska Gateway SD\50-310 Tok School Athletic Facility\Reports\Final\2012.07.11 Final AHFC Report TKJ School Athletic Facility.Docx
2
PRIORITY LIST – ENERGY EFFICIENCY MEASURES (EEMs)
Rank Feature/ Location
Improvement Description
Estimated Annual Energy Savings
Estimated Installed
Cost
Savings to Investment Ratio, SIR
Simple Payback (Years)
5 Lighting: HPS Rink Light 400w
Replace with 60 LED 120W Module StdElectronic $11,841 $60,000 4.1 5.1
6 Lighting: Rifle
Range Incandescent
Replace with 14 LED 12W Module StdElectronic $402 $700 3.6 1.7
7 Lighting: Serving Room
Replace with 4 LED 12W Module StdElectronic $46 $100 2.9 2.2
8 Lighting:
Zamboni Room Replace with 4 LED (3) 17W
Module StdElectronic $182 $800 2.8 4.4
9 HVAC And DHW
Remove domestic hot water pump, Replace existing
furnace with a more efficient forced air furnace, Replace
Marathon Electric distribution pumps with Grundfos Magna
or equivalent
$1,457 $10,000 2.6 6.9
10 Lighting: HPS Rink Lighting
250w
Replace with 2 LED 100W Module StdElectronic
$249 $2,000 2.6 8.0
11 Lighting: Rifle Range T-12 4
lamp
Replace with 6 LED (4) 17W Module (2) StdElectronic
$271 $1,500 2.3 5.5
12
Lighting: Upper Mechanical
Room Incandescent
Replace with 6 LED 12W Module StdElectronic
$23 $150 1.9 6.5
13 Ceiling w/ Attic: Food Service &
Locker Room 1-4
Add R-21 blown cellulose insulation to attic with
Standard Truss. $224 $3,200 1.9 14
14 Lighting: Rifle Range T-12 2
lamp
Replace with 4 LED (2) 17W Module StdElectronic
$77 $600 1.6 7.7
15
Above-Grade Wall: Food Service and
Locker Rooms 1-4
Add R-20 rigid foam to interior or exterior of existing wall; cost does not include siding or wall
coverings.
$1,252 $23,517 1.4 19
TOTAL, cost-effective measures $24,443 $116,767 4.2 4.8
Energy Audit – Final Report Tok Athletic Facility
Tok, Alaska
F:\00-Jobs\2011\2602 F - AHFC Grade Audits\50-300 Doyon Other Region\50-300 Alaska Gateway SD\50-310 Tok School Athletic Facility\Reports\Final\2012.07.11 Final AHFC Report TKJ School Athletic Facility.Docx
3
2.0 INTRODUCTION
NORTECH contracted with the Alaska Housing Finance Corporation to perform ASHRAE Level II Energy Audits for publically owned buildings in Alaska. This report presents the findings of the utility benchmarking, modeling analysis, and the recommended building modifications, and building use changes that are expected to save energy and money. The report is organized into sections covering:
description of the facility, the building’s historic energy usage (benchmarking), estimating energy use through energy use modeling, evaluation of potential energy efficiency or efficiency improvements, and recommendations for energy efficiency with estimates of the costs and savings.
2.1 Building Description, Use, Occupancy and Schedules
2.1.1 Building Description and Use
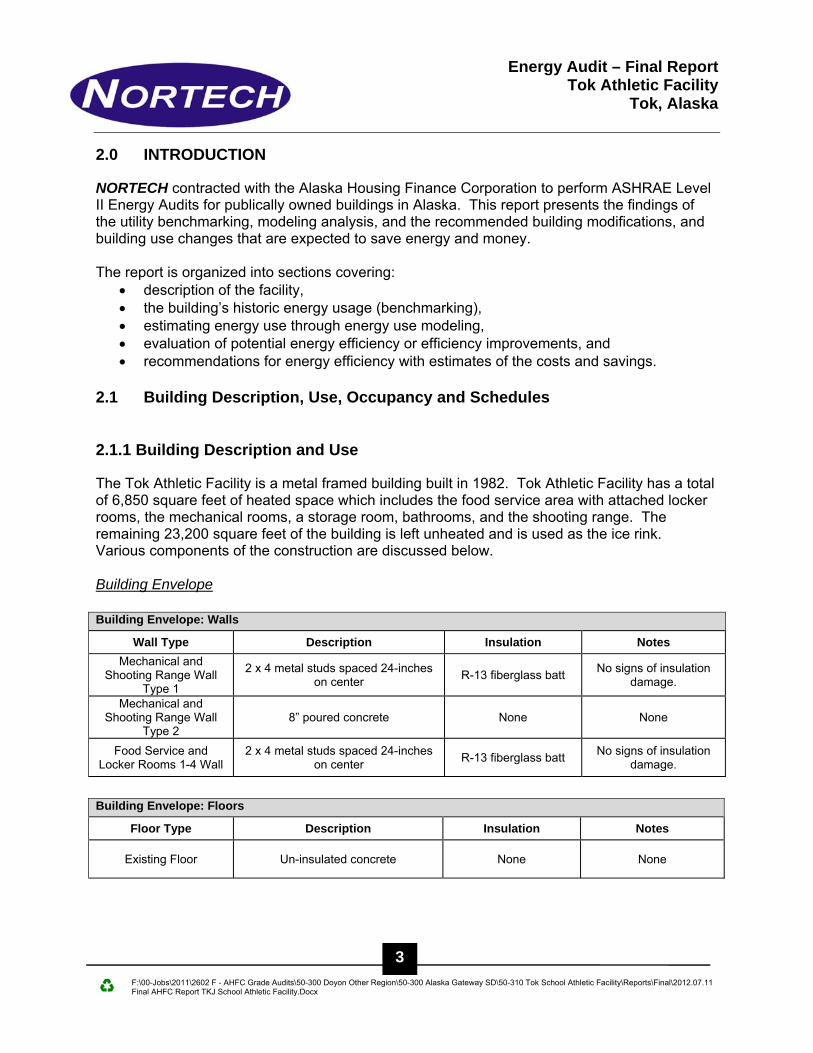
The Tok Athletic Facility is a metal framed building built in 1982. Tok Athletic Facility has a total of 6,850 square feet of heated space which includes the food service area with attached locker rooms, the mechanical rooms, a storage room, bathrooms, and the shooting range. The remaining 23,200 square feet of the building is left unheated and is used as the ice rink. Various components of the construction are discussed below. Building Envelope
Building Envelope: Walls
Wall Type Description Insulation Notes
Mechanical and Shooting Range Wall
Type 1
2 x 4 metal studs spaced 24-inches on center
R-13 fiberglass batt No signs of insulation
damage.
Mechanical and Shooting Range Wall
Type 2 8” poured concrete None None
Food Service and Locker Rooms 1-4 Wall
2 x 4 metal studs spaced 24-inches on center
R-13 fiberglass batt No signs of insulation
damage.
Building Envelope: Floors
Floor Type Description Insulation Notes
Existing Floor Un-insulated concrete None None

Energy Audit – Final Report Tok Athletic Facility
Tok, Alaska
F:\00-Jobs\2011\2602 F - AHFC Grade Audits\50-300 Doyon Other Region\50-300 Alaska Gateway SD\50-310 Tok School Athletic Facility\Reports\Final\2012.07.11 Final AHFC Report TKJ School Athletic Facility.Docx
4
Heating and Ventilation Systems The heated space is composed of two primary zones;
Zone 1- rifle range, upper mechanical room, Zamboni storage, women and men’s lockers
Zone 1 includes two boilers, Boiler-1 and Boiler-2 respectively. Also located in Zone 1 is
a pair of Air Handling Units (AHU’s), AHU-1 and AHU-2 respectively. The two boilers provide heat to the air handling units’ heat coils. Boiler-1 provides heat to AHU-1. Boiler-2 provides heat to AHU-2.
AHU-1 distributes heat to:
o Men’s locker room o Women’s locker room o Zamboni storage o Upper mechanical room
AHU-2 distributes heat to the shooting range.
There is a Modine unit heater, UH-1, located in the boiler room and is set to 65 F. Zone 2- food service and lockers rooms 1-4
Zone 2 includes a forced air furnace which is used as the primary heat source. Heat is controlled in each zone with manual thermostats. During unoccupied hours, the temperature of the building is manually set back in order to reduce energy usage.
Building Envelope: Roof
Roof Type Description Insulation Notes
Mechanical and Shooting Range Roof
2 x Lumber, 24-inches on center Two Layers of R-19
fiberglass batt None
Food Service and Locker Rooms 1-4 Wall
2 x Lumber, 24-inches on center One layer of R-19
fiberglass batt None
Building Envelope: Doors and Windows
Door and Window Type
Description Estimated
R-value Notes
All Doors Flush metal doors with foam
insulation core 5 None
Serving Room Window ¼” Plexiglas with wood frame 1.2 None

Energy Audit – Final Report Tok Athletic Facility
Tok, Alaska
F:\00-Jobs\2011\2602 F - AHFC Grade Audits\50-300 Doyon Other Region\50-300 Alaska Gateway SD\50-310 Tok School Athletic Facility\Reports\Final\2012.07.11 Final AHFC Report TKJ School Athletic Facility.Docx
5
Air Conditioning This facility is not equipped with an air conditioning system. Energy Management Tok Athletic Facility does not utilize any type of programmable energy management in the building. However, heat is turned down during unoccupied use by manually lowering thermostat set points. Lighting Systems Lighting in the ice rink area consists of 400 watt high pressure sodium lamps. The remainder of the building uses fluorescent lighting with T-12 lamps in surface mounted fixtures. Domestic Hot Water A 30 gallon indirect hot water heater is used to provide domestic hot water to the men’s and women’s bathrooms and currently recirculates to ensure that hot water is readily available. 2.1.2 Occupancy and Schedules
The rifle range is used all year round for rifle class by an average of about 5 students. The ice rink area of Tok Athletic Facility is used by an average of 30-40 people during hockey game. An average of one hockey game a week goes on during the period of October 18 – March 31. On the weekends, there is an open skate for the public.

Energy Audit – Final Report Tok Athletic Facility
Tok, Alaska
F:\00-Jobs\2011\2602 F - AHFC Grade Audits\50-300 Doyon Other Region\50-300 Alaska Gateway SD\50-310 Tok School Athletic Facility\Reports\Final\2012.07.11 Final AHFC Report TKJ School Athletic Facility.Docx
6
2.2 Benchmarking
Benchmarking building energy use consists of obtaining and then analyzing two years of energy bills. The original utility bills are necessary to determine the raw usage, and charges as well as to evaluate the utility’s rate structure. The metered usage of electrical and natural gas consumption is measured monthly, but heating oil, propane, wood, and other energy sources are normally billed upon delivery and provide similar information. During benchmarking, information is compiled in a way that standardizes the units of energy and creates energy use and billing rate information statistics for the building on a square foot basis. The objectives of benchmarking are:
to understand patterns of use, to understand building operational characteristics, for comparison with other similar facilities in Alaska and across the country, and to offer insight in to potential energy savings.
The results of the benchmarking, including the energy use statistics and comparisons to other areas, are discussed in the following sections.
Energy Audit – Final Report Tok Athletic Facility
Tok, Alaska
F:\00-Jobs\2011\2602 F - AHFC Grade Audits\50-300 Doyon Other Region\50-300 Alaska Gateway SD\50-310 Tok School Athletic Facility\Reports\Final\2012.07.11 Final AHFC Report TKJ School Athletic Facility.Docx
7
2.2.1 Energy Utilization Index of 2010
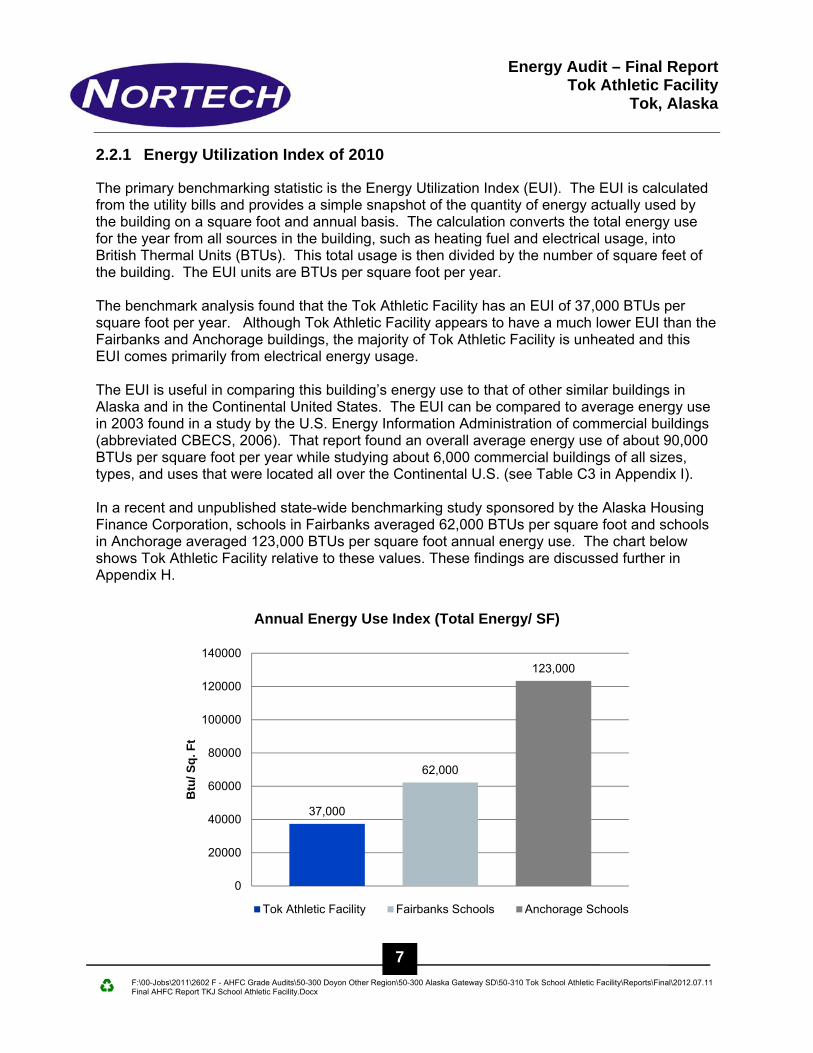
The primary benchmarking statistic is the Energy Utilization Index (EUI). The EUI is calculated from the utility bills and provides a simple snapshot of the quantity of energy actually used by the building on a square foot and annual basis. The calculation converts the total energy use for the year from all sources in the building, such as heating fuel and electrical usage, into British Thermal Units (BTUs). This total usage is then divided by the number of square feet of the building. The EUI units are BTUs per square foot per year. The benchmark analysis found that the Tok Athletic Facility has an EUI of 37,000 BTUs per square foot per year. Although Tok Athletic Facility appears to have a much lower EUI than the Fairbanks and Anchorage buildings, the majority of Tok Athletic Facility is unheated and this EUI comes primarily from electrical energy usage. The EUI is useful in comparing this building’s energy use to that of other similar buildings in Alaska and in the Continental United States. The EUI can be compared to average energy use in 2003 found in a study by the U.S. Energy Information Administration of commercial buildings (abbreviated CBECS, 2006). That report found an overall average energy use of about 90,000 BTUs per square foot per year while studying about 6,000 commercial buildings of all sizes, types, and uses that were located all over the Continental U.S. (see Table C3 in Appendix I). In a recent and unpublished state-wide benchmarking study sponsored by the Alaska Housing Finance Corporation, schools in Fairbanks averaged 62,000 BTUs per square foot and schools in Anchorage averaged 123,000 BTUs per square foot annual energy use. The chart below shows Tok Athletic Facility relative to these values. These findings are discussed further in Appendix H.
37,000
62,000
123,000
0
20000
40000
60000
80000
100000
120000
140000
Btu
/ Sq
. Ft
Annual Energy Use Index (Total Energy/ SF)
Tok Athletic Facility Fairbanks Schools Anchorage Schools

Energy Audit – Final Report Tok Athletic Facility
Tok, Alaska
F:\00-Jobs\2011\2602 F - AHFC Grade Audits\50-300 Doyon Other Region\50-300 Alaska Gateway SD\50-310 Tok School Athletic Facility\Reports\Final\2012.07.11 Final AHFC Report TKJ School Athletic Facility.Docx
8
2.2.2 Cost Utilization Index of 2010 Another benchmarking statistic that is useful is the Cost Utilization Index (CUI), which is the cost for energy used in the building on a square foot basis per year. The CUI is calculated from the cost for utilities for a year period. The CUI permits comparison of buildings on total energy cost even though they may be located in areas with differing energy costs and differing heating and/or cooling climates. The cost of energy, including heating oil, natural gas, and electricity, can vary greatly over time and geographic location and can be higher in Alaska than other parts of the country. The CUI for Tok Athletic Facility is about $1.29. This is based on utility costs from 2010 and the following rates: Electricity at $0.43/ kWh ($12.60 / Therm) # 1 Fuel Oil at $2.75 / gallon ($2.05 / Therm) The Department of Energy Administration study, mentioned in the previous section (CBECS, 2006) found an average cost of $2.52 per square foot in 2003 for 4,400 buildings in the Continental U.S (Tables C4 and C13 of CBDES, 2006). Schools in Fairbanks have an average cost for energy of $2.42 per square foot while Anchorage schools average $2.11 per square foot. The chart below shows Tok Athletic Facility relative to these values. More details are included in Appendix H.
$1.29
$2.42
$2.11
$0.00
$0.50
$1.00
$1.50
$2.00
$2.50
$3.00
Annual Energy Cost Index (Total Cost/ SF)
Tok Athletic Facility Fairbanks Schools Anchorage Schools
Energy Audit – Final Report Tok Athletic Facility
Tok, Alaska
F:\00-Jobs\2011\2602 F - AHFC Grade Audits\50-300 Doyon Other Region\50-300 Alaska Gateway SD\50-310 Tok School Athletic Facility\Reports\Final\2012.07.11 Final AHFC Report TKJ School Athletic Facility.Docx
9
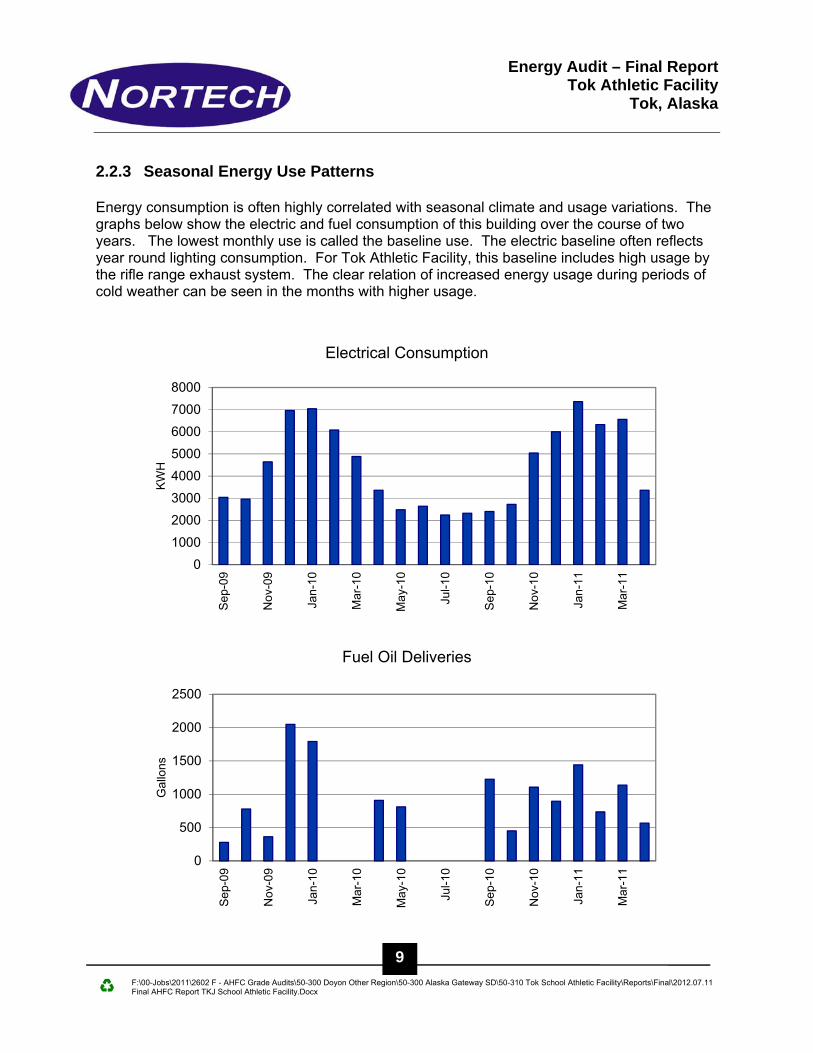
2.2.3 Seasonal Energy Use Patterns Energy consumption is often highly correlated with seasonal climate and usage variations. The graphs below show the electric and fuel consumption of this building over the course of two years. The lowest monthly use is called the baseline use. The electric baseline often reflects year round lighting consumption. For Tok Athletic Facility, this baseline includes high usage by the rifle range exhaust system. The clear relation of increased energy usage during periods of cold weather can be seen in the months with higher usage.
0
1000
2000
3000
4000
5000
6000
7000
8000
Se
p-09
No
v-09
Jan-
10
Mar
-10
May
-10
Jul-1
0
Se
p-10
No
v-10
Jan-
11
Mar
-11
KW
H
Electrical Consumption
0
500
1000
1500
2000
2500
Se
p-09
No
v-09
Jan-
10
Mar
-10
May
-10
Jul-1
0
Se
p-10
No
v-10
Jan-
11
Mar
-11
Gal
lons
Fuel Oil Deliveries

Energy Audit – Final Report Tok Athletic Facility
Tok, Alaska
F:\00-Jobs\2011\2602 F - AHFC Grade Audits\50-300 Doyon Other Region\50-300 Alaska Gateway SD\50-310 Tok School Athletic Facility\Reports\Final\2012.07.11 Final AHFC Report TKJ School Athletic Facility.Docx
10
2.2.4 Future Energy Monitoring Energy accounting is the process of tracking energy consumption and costs. It is important for the building owner or manager to monitor and record both the energy usage and cost each month. Comparing trends over time can assist in pinpointing major sources of energy usage and aid in finding effective energy efficiency measures. There are two basic methods of energy accounting: manual and automatic. Manual tracking of energy usage may already be performed by an administrative assistant: however if the records are not scrutinized for energy use, then the data is merely a financial accounting. Digital energy tracking systems can be installed. They display and record real-time energy usage and accumulated energy use and cost. There are several types which have all of the information accessible via Ethernet browser.

Energy Audit – Final Report Tok Athletic Facility
Tok, Alaska
F:\00-Jobs\2011\2602 F - AHFC Grade Audits\50-300 Doyon Other Region\50-300 Alaska Gateway SD\50-310 Tok School Athletic Facility\Reports\Final\2012.07.11 Final AHFC Report TKJ School Athletic Facility.Docx
11
3.0 ENERGY CONSUMPTION AND MODELING RESULTS
After benchmarking of a building is complete and the site visit has identified the specific systems in the building, a number of different methods are available for quantifying the overall energy consumption and to model the energy use. These range from relatively simple spreadsheets to commercially available modeling software capable of handling complex building systems. NORTECH has used several of these programs and uses the worksheets and software that best matches the complexity of the building and specific energy use that is being evaluated. Modeling of an energy efficiency measure (EEM) requires an estimate of the current energy used by the specific feature, the estimated energy use of the proposed EEM and its installed cost. EEMs can range from a single simple upgrade, such as light bulb type or type of motor, to reprogramming of the controls on more complex systems. While the need for a major retrofit can typically be identified by an energy audit, the specific system upgrades often require collecting additional data and engineering and design efforts that are beyond the scope of the Level II energy audit. Based on the field inspection results and discussions with the building owners/operators, auditors developed potential EEMs for the facility. Common EEMs that could apply to almost every older building include:
Reduce the envelope heat losses through: o increased building insulation, and o better windows and doors
Reduce temperature difference between inside and outside using setback thermostats Upgrade inefficient:
o lights, o motors, o refrigeration units, and o other appliances
Reduce running time of lights/appliances through: o motion sensors, o on/off timers, o light sensors, and o other automatic/programmable systems
The objective of the following sections is to describe how the overall energy use of the building was modeled and the potential for energy savings. The specific EEMs that provide these overall energy savings are detailed in Appendix A of this report. While the energy savings of an EEM is unlikely to change significantly over time, the cost savings of an EEM is highly dependent on the current energy price and can vary significantly over time. An EEM that is not currently recommended based on price may be more attractive at a later date or with higher energy prices.

Energy Audit – Final Report Tok Athletic Facility
Tok, Alaska
F:\00-Jobs\2011\2602 F - AHFC Grade Audits\50-300 Doyon Other Region\50-300 Alaska Gateway SD\50-310 Tok School Athletic Facility\Reports\Final\2012.07.11 Final AHFC Report TKJ School Athletic Facility.Docx
12
3.1 Understanding How AkWarm Models Energy Consumption
NORTECH used the AkWarm model for evaluating the overall energy consumption at Tok Athletic Facility. The AkWarm program was developed by the Alaska Housing Finance Corporation (AHFC) to model residential energy use. The original AkWarm is the modeling engine behind the successful residential energy upgrade program that AHFC has operated for a number of years. In the past few years, AHFC has developed a version of this model for commercial buildings. Energy use in buildings is modeled by calculating energy losses and consumption, such as:
• Heat lost through the building envelope components, including windows, doors, walls, ceilings, crawlspaces, and foundations. These heat losses are computed for each component based on the area, heat resistance (R-value), and the difference between the inside temperature and the outside temperature. AkWarm has a library of temperature profiles for villages and cities in Alaska.
• Window orientation, such as the fact that south facing windows can add heat in the winter but north-facing windows do not.
• Inefficiencies of the heating system, including the imperfect conversion of fuel oil or natural gas due to heat loss in exhaust gases, incomplete combustion, excess air, etc. Some electricity is also consumed in moving the heat around a building through pumping.
• Inefficiencies of the cooling system, if one exists, due to various imperfections in a mechanical system and the required energy to move the heat around.
• Lighting requirements and inefficiencies in the conversion of electricity to light; ultimately all of the power used for lighting is converted to heat. While the heat may be useful in the winter, it often isn’t useful in the summer when cooling may be required to remove the excess heat. Lights are modeled by wattage and operational hours.
• Use and inefficiencies in refrigeration, compressor cooling, and heat pumps. Some units are more efficient than others. Electricity is required to move the heat from inside a compartment to outside it. Again, this is a function of the R-Value and the temperature difference between the inside and outside of the unit.
• Plug loads such as computers, printers, mini-fridges, microwaves, portable heaters, monitors, etc. These can be a significant part of the overall electricity consumption of the building, as well as contributing to heat production.
• The schedule of operation for lights, plug loads, motors, etc. is a critical component of how much energy is used.
AkWarm adds up these heat losses and the internal heat gains based on individual unit usage schedules. These estimated heat and electrical usages are compared to actual use on both a yearly and seasonal basis. If the AkWarm model is within 5 % to 10% of the most recent 12 months usage identified during benchmarking, the model is considered accurate enough to make predictions of energy savings for possible EEMs.
Energy Audit – Final Report Tok Athletic Facility
Tok, Alaska
F:\00-Jobs\2011\2602 F - AHFC Grade Audits\50-300 Doyon Other Region\50-300 Alaska Gateway SD\50-310 Tok School Athletic Facility\Reports\Final\2012.07.11 Final AHFC Report TKJ School Athletic Facility.Docx
13
3.1.1 AkWarm Calculated Savings for the Tok Athletic Facility
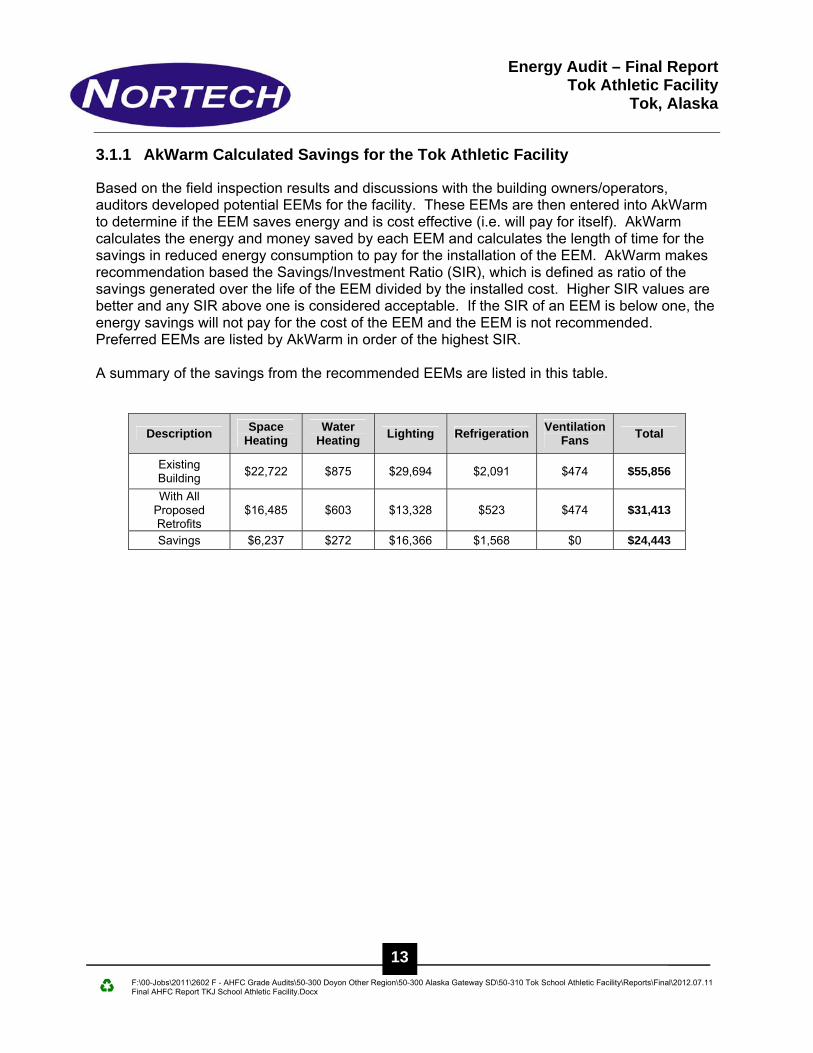
Based on the field inspection results and discussions with the building owners/operators, auditors developed potential EEMs for the facility. These EEMs are then entered into AkWarm to determine if the EEM saves energy and is cost effective (i.e. will pay for itself). AkWarm calculates the energy and money saved by each EEM and calculates the length of time for the savings in reduced energy consumption to pay for the installation of the EEM. AkWarm makes recommendation based the Savings/Investment Ratio (SIR), which is defined as ratio of the savings generated over the life of the EEM divided by the installed cost. Higher SIR values are better and any SIR above one is considered acceptable. If the SIR of an EEM is below one, the energy savings will not pay for the cost of the EEM and the EEM is not recommended. Preferred EEMs are listed by AkWarm in order of the highest SIR. A summary of the savings from the recommended EEMs are listed in this table.
Description Space
Heating Water
Heating Lighting Refrigeration
Ventilation Fans
Total
Existing Building
$22,722 $875 $29,694 $2,091 $474 $55,856
With All Proposed Retrofits
$16,485 $603 $13,328 $523 $474 $31,413
Savings $6,237 $272 $16,366 $1,568 $0 $24,443

Energy Audit – Final Report Tok Athletic Facility
Tok, Alaska
F:\00-Jobs\2011\2602 F - AHFC Grade Audits\50-300 Doyon Other Region\50-300 Alaska Gateway SD\50-310 Tok School Athletic Facility\Reports\Final\2012.07.11 Final AHFC Report TKJ School Athletic Facility.Docx
14
3.1.2 AkWarm Projected Energy Costs after Modifications
The AkWarm recommended EEMs appear to result in significant savings in lighting and refrigeration. The energy cost by end use breakdown was provided by AkWarm based on the field inspection and does not indicate that all individual fixtures and appliances were direct measured. The current energy costs are shown below on the left hand bar of the graph and the projected energy costs, assuming use of the recommended EEMs, are shown on the right. This graphical format allows easy visual comparison of the various energy requirements of the facility. In the event that not all recommended retrofits are desired, the proposal energy savings can be estimated from visual interpretation from this graph.
$0
$20,000
$40,000
$60,000
Existing Retrofit
Ventilation and FansSpace HeatingRefrigerationLightingDomestic Hot Water
Annual Energy Costs by End Use

Energy Audit – Final Report Tok Athletic Facility
Tok, Alaska
F:\00-Jobs\2011\2602 F - AHFC Grade Audits\50-300 Doyon Other Region\50-300 Alaska Gateway SD\50-310 Tok School Athletic Facility\Reports\Final\2012.07.11 Final AHFC Report TKJ School Athletic Facility.Docx
15
3.2 Energy Efficiency Measures Calculated Outside AkWarm
The AkWarm program effectively models wood-framed and other buildings with standard heating systems and relatively simple HVAC systems. AkWarm models of more complicated mechanical systems are sometimes poor due to a number of simplifying assumptions and limited input of some variables. Furthermore, AkWarm is unable to model complex HVAC systems such as variable frequency motors, variable air volume (VAV) systems, those with significant digital or pneumatic controls or significant heat recovery capacity. In addition, some other building methods and occupancies are outside AkWarm capabilities. This report section is included in order to identify benefits from modifications to those more complex systems or changes in occupant behavior that cannot be addressed in AkWarm. The Tok Athletic Facility could be modeled well in AkWarm.

Energy Audit – Final Report Tok Athletic Facility
Tok, Alaska
F:\00-Jobs\2011\2602 F - AHFC Grade Audits\50-300 Doyon Other Region\50-300 Alaska Gateway SD\50-310 Tok School Athletic Facility\Reports\Final\2012.07.11 Final AHFC Report TKJ School Athletic Facility.Docx
16
4.0 BUILDING OPERATION AND MAINTENANCE (O & M)
4.1 Operations and Maintenance
A well-implemented operation and maintenance (O & M) plan is often the driving force behind energy savings. Such a plan includes preserving institutional knowledge, directing preventative maintenance, and scheduling regular inspections of each piece of HVAC equipment within the building. Routine maintenance includes the timely replacement of filters, belts and pulleys, the proper greasing of bearings and other details such as topping off the glycol tanks. Additional benefits to a maintenance plan are decreased down time for malfunctioning equipment, early indications of problems, prevention of exacerbated maintenance issues, and early detection of overloading/overheating issues. A good maintenance person knows the building’s equipment well enough to spot and repair minor malfunctions before they become major retrofits. Commissioning of a building is the verification that the HVAC systems act within the design or usage ranges. This process ideally, though seldom, occurs as the last phase in construction. HVAC system operation parameters degrade from ideal over time due to incorrect maintenance, improper replacement pumps, changes in facility tenants or usage, changes in schedules, and changes in energy costs or loads. Ideally, re-commissioning of a building should occur every five to ten years. This ensures that the HVAC system meets the potentially variable use with the most efficient means. 4.2 Building Specific Recommendations
Savings can continue to be realized by reducing heating loads during unoccupied times. It is important that the occupants continue to manually reduce the temperature setting when they leave the facility. Occupancy during the summer is very minimal, so all loads should be set to a minimum level to maximize summer savings. During the visit, one of the air handlers was not operating due to the drive belt being broken. Therefore, general maintenance and cleaning of the air handlers as well as the boilers should be performed to prevent such occurrences.

Energy Audit – Final Report Tok Athletic Facility
Tok, Alaska
F:\00-Jobs\2011\2602 F - AHFC Grade Audits\50-300 Doyon Other Region\50-300 Alaska Gateway SD\50-310 Tok School Athletic Facility\Reports\Final\2012.07.11 Final AHFC Report TKJ School Athletic Facility.Docx
17
APPENDICES

Energy Audit – Final Report Tok Athletic Facility
Tok, Alaska
F:\00-Jobs\2011\2602 F - AHFC Grade Audits\50-300 Doyon Other Region\50-300 Alaska Gateway SD\50-310 Tok School Athletic Facility\Reports\Final\2012.07.11 Final AHFC Report TKJ School Athletic Facility.Docx
18
Appendix A Recommended Energy Efficiency Measures
A number of Energy Efficiency Measures (EEMs) are available to reduce the energy use and overall operating cost for the facility. The EEMs listed below are those recommended by AkWarm based on the calculated savings/investment ration (SIR) as described in Appendix E. AkWarm also provides a breakeven cost, which is the maximum initial cost of the EEM that will still return a SIR of one or greater. This section describes each recommended EEM and identifies the potential energy savings and installation costs. This also details the calculation of breakeven costs, simple payback, and the SIR for each recommendation. The recommended EEMs are grouped together generally by the overall end use that will be impacted.
A.1 Temperature Control
The occupancy in this building is so variable that it would be difficult to incorporate a programmable thermostat and determine the actual heating needs. The existing manual thermostats should be turned down to a minimum set point to avoid freezing, and turned up whenever occupied.
A.2 Electrical Loads
A.2.1 Lighting
The electricity used by lighting eventually ends up as heat in the building. In areas where electricity is more expensive than other forms of energy, or in areas where the summer temperatures require cooling; this additional heat can be both wasteful and costly. Converting to more efficient lighting reduces cooling loads in the summer and allows the user to control heat input in the winter. The conversion from T12 (one and a half inch fluorescent bulbs) to T8 (one inch), T5 (5/8 inch), Compact Fluorescent Lights (CFL), or LED bulbs provides a significant increase in efficiency. LED bulbs can be directly placed in existing fixtures. The LED bulb bypasses the ballast altogether, which removes the often irritating, “buzzing” noise that magnetic ballasts tend to make. It is recommended that most of the lighting in Tok Athletic Facility should be changed to LED lamps. LED’s tend to perform well in cold temperatures and most of Tok Athletic Facility is left very cold. The existing T12 lamps should be replaced with LED tube lamps. Fluorescent lamps usually have trouble starting in cold temperatures; LED replacement will result in better start up, more light, and a significant reduction in electrical cost. The existing 400 watt high pressure sodium lamps use a considerable amount of energy and should be replaced. LED pendants would be economical as LED’s perform well in cold temperatures. These pendants can utilize the existing pendant hooks, greatly reducing installation costs. Heat output from these lamps would be significantly reduced; however this

Energy Audit – Final Report Tok Athletic Facility
Tok, Alaska
F:\00-Jobs\2011\2602 F - AHFC Grade Audits\50-300 Doyon Other Region\50-300 Alaska Gateway SD\50-310 Tok School Athletic Facility\Reports\Final\2012.07.11 Final AHFC Report TKJ School Athletic Facility.Docx
19
area is unheated so it will not affect building performance in any way. The electrical usage from this light will be significantly reduced. Properly sized LED replacement will produce similar levels of light. However, lighting color will appear whiter than the existing yellow output from the high pressure sodium lamps. One example of an LED pendant light would be the OK LED 120W LED High Bay model OK-HB-120W-S2. High bay T-5 fluorescent fixtures are a very common retrofit due to less energy usage and comparable light output. T-5’s were considered for Tok Athletic Facility and it was determined that fluorescent lighting will not be economical in the cold temperatures presented during building operation due to fluorescent lighting’s inability to operate normally under these conditions. The following tables show an estimated savings by making recommended retrofits.
Rank Location Existing Condition Recommendation
2 Men's and Women's Locker Rooms
13 FLUOR (2) T12 4' F40T12 34W Energy-Saver Magnetic with Manual
Switching
Replace with 13 LED (2) 17W Module StdElectronic
Installation Cost $1,800 Estimated Life of Measure (yrs) 16 Energy Savings (/yr) $1,894
Breakeven Cost $24,196 Savings-to-Investment Ratio 13 Simple Payback yrs 1
Rank Location Existing Condition Recommendation
4 Locker Room #1, #2, #3 and #4
12 FLUOR (2) T12 4' F40T12 34W Energy-Saver StdElectronic with Manual
Switching
Replace with 12 LED (2) 17W Module StdElectronic
Installation Cost $1,650 Estimated Life of Measure (yrs) 16 Energy Savings (/yr) $1,068
Breakeven Cost $13,612 Savings-to-Investment Ratio 8.2 Simple Payback yrs 2
Rank Location Existing Condition Recommendation
5 HPS Rink Light 400w 60 HPS 400 Watt StdElectronic with Manual Switching
Replace with 60 LED 120W Module StdElectronic
Installation Cost $60,000 Estimated Life of Measure (yrs) 30 Energy Savings (/yr) $11,841
Breakeven Cost $245,132 Savings-to-Investment Ratio 4.1 Simple Payback yrs 5
Rank Location Existing Condition Recommendation
6 Rifle Range Incandescent
14 INCAN A Lamp, Halogen 75W with Manual Switching
Replace with 14 LED 12W Module StdElectronic
Installation Cost $700 Estimated Life of Measure (yrs) 7 Energy Savings (/yr) $402
Breakeven Cost $2,535 Savings-to-Investment Ratio 3.6 Simple Payback yrs 2
Energy Audit – Final Report Tok Athletic Facility
Tok, Alaska
F:\00-Jobs\2011\2602 F - AHFC Grade Audits\50-300 Doyon Other Region\50-300 Alaska Gateway SD\50-310 Tok School Athletic Facility\Reports\Final\2012.07.11 Final AHFC Report TKJ School Athletic Facility.Docx
20
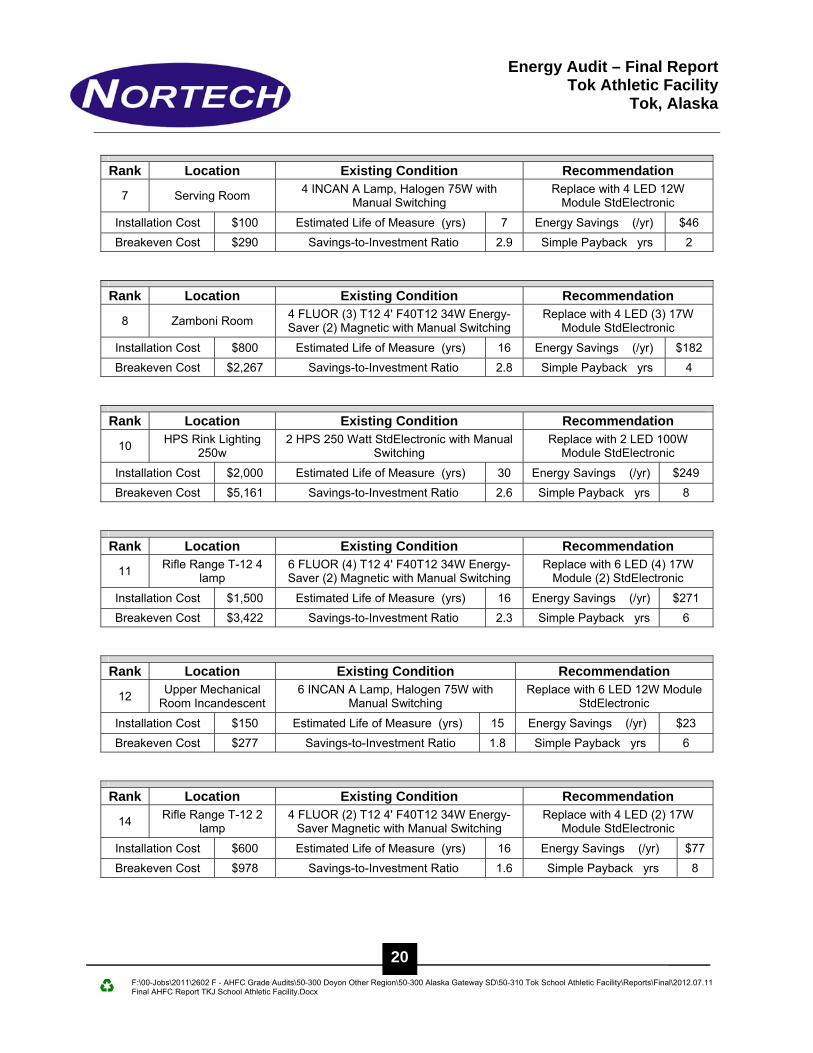
Rank Location Existing Condition Recommendation
7 Serving Room 4 INCAN A Lamp, Halogen 75W with Manual Switching
Replace with 4 LED 12W Module StdElectronic
Installation Cost $100 Estimated Life of Measure (yrs) 7 Energy Savings (/yr) $46
Breakeven Cost $290 Savings-to-Investment Ratio 2.9 Simple Payback yrs 2
Rank Location Existing Condition Recommendation
8 Zamboni Room 4 FLUOR (3) T12 4' F40T12 34W Energy-Saver (2) Magnetic with Manual Switching
Replace with 4 LED (3) 17W Module StdElectronic
Installation Cost $800 Estimated Life of Measure (yrs) 16 Energy Savings (/yr) $182
Breakeven Cost $2,267 Savings-to-Investment Ratio 2.8 Simple Payback yrs 4
Rank Location Existing Condition Recommendation
10 HPS Rink Lighting 250w
2 HPS 250 Watt StdElectronic with Manual Switching
Replace with 2 LED 100W Module StdElectronic
Installation Cost $2,000 Estimated Life of Measure (yrs) 30 Energy Savings (/yr) $249
Breakeven Cost $5,161 Savings-to-Investment Ratio 2.6 Simple Payback yrs 8
Rank Location Existing Condition Recommendation
11 Rifle Range T-12 4 lamp
6 FLUOR (4) T12 4' F40T12 34W Energy-Saver (2) Magnetic with Manual Switching
Replace with 6 LED (4) 17W Module (2) StdElectronic
Installation Cost $1,500 Estimated Life of Measure (yrs) 16 Energy Savings (/yr) $271
Breakeven Cost $3,422 Savings-to-Investment Ratio 2.3 Simple Payback yrs 6
Rank Location Existing Condition Recommendation
12 Upper Mechanical Room Incandescent
6 INCAN A Lamp, Halogen 75W with Manual Switching
Replace with 6 LED 12W Module StdElectronic
Installation Cost $150 Estimated Life of Measure (yrs) 15 Energy Savings (/yr) $23
Breakeven Cost $277 Savings-to-Investment Ratio 1.8 Simple Payback yrs 6
Rank Location Existing Condition Recommendation
14 Rifle Range T-12 2 lamp
4 FLUOR (2) T12 4' F40T12 34W Energy-Saver Magnetic with Manual Switching
Replace with 4 LED (2) 17W Module StdElectronic
Installation Cost $600 Estimated Life of Measure (yrs) 16 Energy Savings (/yr) $77
Breakeven Cost $978 Savings-to-Investment Ratio 1.6 Simple Payback yrs 8

Energy Audit – Final Report Tok Athletic Facility
Tok, Alaska
F:\00-Jobs\2011\2602 F - AHFC Grade Audits\50-300 Doyon Other Region\50-300 Alaska Gateway SD\50-310 Tok School Athletic Facility\Reports\Final\2012.07.11 Final AHFC Report TKJ School Athletic Facility.Docx
21
A.2.2 Other Electrical Loads There is a refrigerator with no contents inside located in the serving room that was plugged in during the audit. This style of refrigerator is a large electrical load and should be unplugged when not in use.
A.3 Building Envelope: Recommendations for change
A.3.1 Exterior Walls
Adding insulation to the existing concrete wall of the shooting range would produce significant savings from heat loss. Previous installation of foam board on the interior walls was removed as it did not meet fire code. The installation of foam insulation on the exterior is economic.
Additional insulation can be added to the wall insulation in the food service and locker rooms area to save on heating costs. Foam insulation can be added to the walls and re-covered with the existing metal siding.
Rank Location Existing Condition Recommendation
1 Refrigerator ADM-49PE57132 Add new Seasonal Shutdown
Installation Cost $0 Estimated Life of Measure (yrs) 25 Energy Savings (/yr) $1,405
Breakeven Cost $24,822 Savings-to-Investment Ratio 100 Simple Payback yrs 0
Rank Location Existing Condition Recommendation
3 Above-Grade Wall:
Mechanical and Shooting Range
Wall Type: Other Wall Construction: 8" Poured Concrete
Modeled R-Value: 0.9
Install R-30 rigid foam board to exterior and cover with T1-11
siding or equivalent.
Installation Cost $10,750 Estimated Life of Measure (yrs) 30 Energy Savings (/yr) $4,052
Breakeven Cost $106,906 Savings-to-Investment Ratio 9.9 Simple Payback yrs 3
Rank Location Existing Condition Recommendation
15 Above-Grade Wall: Food Service and Locker Rooms 1-4
Wall Type: Other Wall Construction: 2x4" Metal Stud Wall, R-
13, 24" o.c. Modeled R-Value: 9.2
Add R-20 rigid foam to interior or exterior of existing wall; reinstall
existing metal siding to exterior of rigid foam.
Installation Cost $23,517 Estimated Life of Measure (yrs) 30 Energy Savings (/yr) $1,252
Breakeven Cost $33,078 Savings-to-Investment Ratio 1.4 Simple Payback yrs 19

Energy Audit – Final Report Tok Athletic Facility
Tok, Alaska
F:\00-Jobs\2011\2602 F - AHFC Grade Audits\50-300 Doyon Other Region\50-300 Alaska Gateway SD\50-310 Tok School Athletic Facility\Reports\Final\2012.07.11 Final AHFC Report TKJ School Athletic Facility.Docx
22
A.3.2 Foundation
No EEMs are recommended in this area as the majority of the foundation is left unheated. For the small sections that are heated, the addition of insulation as listed in A.3.1. would produce savings in this area.
A.3.3 Roofing and Ceiling
Upgrading the roof over food service and locker rooms would help to keep it heated more efficiently. Adding R-21 of blown cellulose to existing insulation is economic.
A.3.4 Windows
No EEMs are recommended in this are as there are no windows in heated areas in Tok Athletic Facility.
A.3.5 Doors
No EEMs are recommended in this area. The existing doors are well insulated and all rated as exterior doors. Weather stripping could be replaced on some of the leaky doors in order to reduce heat loss.
A.4 Building Heating System / Air Conditioning
A.4.1 Heating and Heat Distribution
The existing furnace is relatively inefficient and should be replaced. Some new furnaces can have efficiencies upwards of 86%, The existing boiler distribution pumps should be replaced with more efficient variable speed pumps comparable to Grundfos Magnas. These pumps have been shown to save a minimum of 50% of electrical energy over conventional pumps due to the motor design. Variable speed pumps work well in systems that experience flow variation, as the pumps are capable of changing speeds and reduced speeds save energy.
Rank Location Existing Condition Recommendation
13 Ceiling w/ Attic: Food Service &
Locker Room 1-4
Framing Type: Standard Framing Spacing: 24 inches Insulated Sheathing: None
Bottom Insulation Layer: R-19 Batt: FG or RW, 6 inches
Top Insulation Layer: None Modeled R-Value: 21.1
Add R-21 blown cellulose insulation to attic with Standard
Truss.
Installation Cost $3,200 Estimated Life of Measure (yrs) 30 Energy Savings (/yr) $224
Breakeven Cost $5,910 Savings-to-Investment Ratio 1.8 Simple Payback yrs 14
Energy Audit – Final Report Tok Athletic Facility
Tok, Alaska
F:\00-Jobs\2011\2602 F - AHFC Grade Audits\50-300 Doyon Other Region\50-300 Alaska Gateway SD\50-310 Tok School Athletic Facility\Reports\Final\2012.07.11 Final AHFC Report TKJ School Athletic Facility.Docx
23
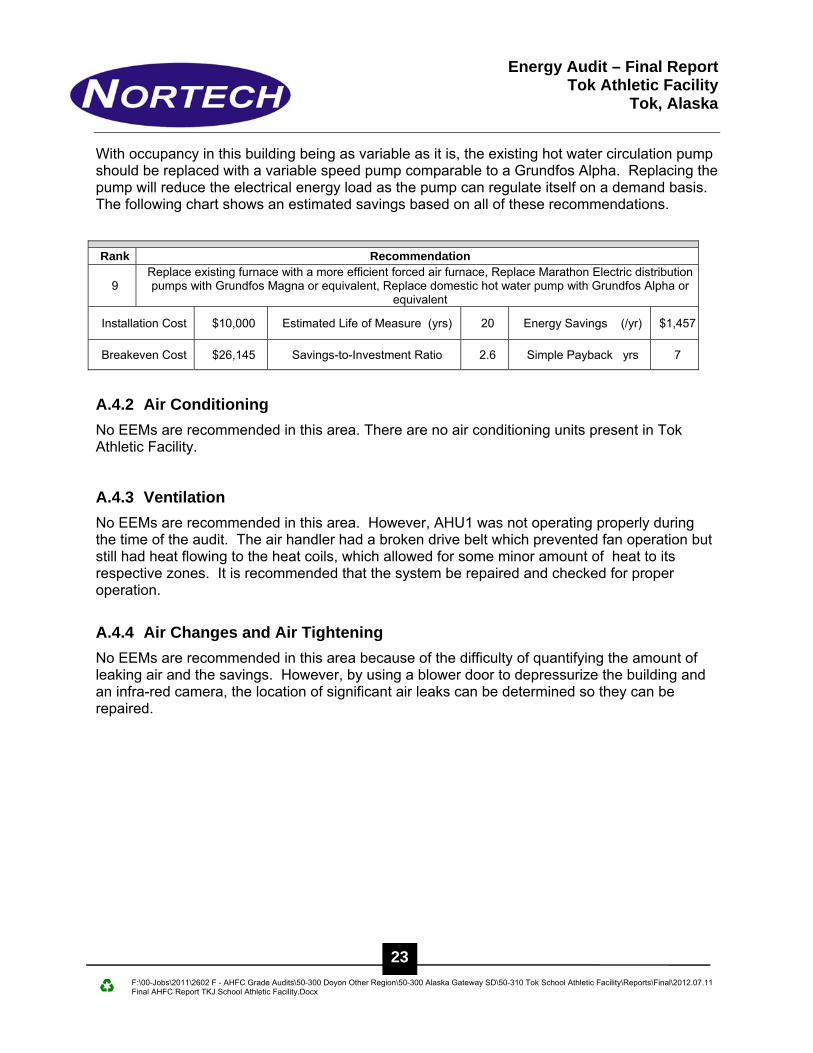
With occupancy in this building being as variable as it is, the existing hot water circulation pump should be replaced with a variable speed pump comparable to a Grundfos Alpha. Replacing the pump will reduce the electrical energy load as the pump can regulate itself on a demand basis. The following chart shows an estimated savings based on all of these recommendations.
A.4.2 Air Conditioning
No EEMs are recommended in this area. There are no air conditioning units present in Tok Athletic Facility.
A.4.3 Ventilation
No EEMs are recommended in this area. However, AHU1 was not operating properly during the time of the audit. The air handler had a broken drive belt which prevented fan operation but still had heat flowing to the heat coils, which allowed for some minor amount of heat to its respective zones. It is recommended that the system be repaired and checked for proper operation.
A.4.4 Air Changes and Air Tightening
No EEMs are recommended in this area because of the difficulty of quantifying the amount of leaking air and the savings. However, by using a blower door to depressurize the building and an infra-red camera, the location of significant air leaks can be determined so they can be repaired.
Rank Recommendation
9 Replace existing furnace with a more efficient forced air furnace, Replace Marathon Electric distribution pumps with Grundfos Magna or equivalent, Replace domestic hot water pump with Grundfos Alpha or
equivalent
Installation Cost $10,000 Estimated Life of Measure (yrs) 20 Energy Savings (/yr) $1,457
Breakeven Cost $26,145 Savings-to-Investment Ratio 2.6 Simple Payback yrs 7

Energy Audit – Final Report Tok Athletic Facility
Tok, Alaska
F:\00-Jobs\2011\2602 F - AHFC Grade Audits\50-300 Doyon Other Region\50-300 Alaska Gateway SD\50-310 Tok School Athletic Facility\Reports\Final\2012.07.11 Final AHFC Report TKJ School Athletic Facility.Docx
24
Appendix B Energy Efficiency Measures that are NOT Recommended
As indicated in other sections of the report, a number of potential EEMs were identified that were determined to be NOT cost effective by the AkWarm model. These EEMs are not currently recommended on the basis of energy savings alone because each may only save a small amount of energy, have a high capital cost, or be expensive to install. While each of these EEMs is not cost effective at this time, future changes in building use such as longer operating hours, higher energy prices, new fixtures or hardware on the market, and decreases in installation effort may make any of these EEMs cost effective in the future. These potential EEMs should be reviewed periodically to identify any changes to these factors that would warrant re-evaluation. Although these upgrades are not currently cost effective on an energy cost basis, the fixtures, hardware, controls, or operational changes described these EEMs should be considered when replacing an existing fixture or unit for other reasons. For example, replacing an existing window with a triple-pane window may not be cost effective based only on energy use, but the if a window is going to be replaced for some other reason, then the basis for a decision is only the incremental cost of upgrading from a less efficient replacement window to a more efficient replacement window. That incremental cost difference will have a significantly shorter payback, especially since the installation costs are likely to be the same for both units.
The following measures were not found to be cost-effective:
Rank Feature/Location Improvement Description
Annual Energy Savings
Installed Cost
Savings to Investment Ratio, SIR
Simple Payback (Years)
15 Lighting: Mechanical
Room Replace with 2 LED 12W
Module StdElectronic $4 $50 0.93 13
16 Lighting: Upper
Mechanical Room T-12 3 Lamp
Replace with 3 LED (3) 17W Module (2)
StdElectronic $15 $600 0.31 40
17 Lighting: Upper
Mechanical Room T-12 2 Lamp Fixtures
Replace with 5 LED (2) 17W Module StdElectronic
$15 $675 0.28 44

Energy Audit – Final Report Tok Athletic Facility
Tok, Alaska
F:\00-Jobs\2011\2602 F - AHFC Grade Audits\50-300 Doyon Other Region\50-300 Alaska Gateway SD\50-310 Tok School Athletic Facility\Reports\Final\2012.07.11 Final AHFC Report TKJ School Athletic Facility.Docx
25
Appendix C Significant Equipment List
HVAC Equipment
Equipment Manufacturer Model No. Fuel Type
Estimated Efficiency
Notes
Boiler 1 Burnham Model V90A #1 Oil 85% Input Rating
346,000 BTU/hr
Boiler 2 Burnham Model V910A #1 Oil 85% Input Rating
1,528,000 BTU/hr
Forced Air Furnace Metzger
Machine Corp WLBO-245T-
7920-2K #1 Oil 73%
Input Rating 245,000 BTU/hr
Distribution Pump for Boiler 1
Marathon AQA56 Electric n/a 1/2 HP, 18 gpm
Distribution Pump for Boiler 2
Marathon AUN56T Electric n/a 2 HP
Air Handling Unit 1 Motor- SP-1
Super E EM3157T-8 Electric 87% 2 HP, 1725 RPM
Air Handling Unit 2 Motor- SP-2
Super E EFM3311T-8 Electric 91% 7.5 HP, 1760 RPM
Exhaust Fan Motor Dayton US F-6137C-08-
111 Electric 82% 3 HP, 1740 RPM
Lighting
Location Type Quantity KWH/yr Cost/yr.
Sports Arena High Pressure Sodium Pendant 400w 60 23,475 $ 10,094
Exterior HPS 150 Watt 11 7,685 3,305
Men's and Women's Locker Rooms
Fluorescent (2) T12 4' F40T12 34w 13 5,028 2,162
Locker Rooms 1-4 Fluorescent (2) T12 4' F40T12 34w 12 3,762 1,618
Rifle Range Incandescent A Lamp, 75w 14 822 353
Rifle Range Fluorescent (4) T12 4' F40T12 34w 6 757 326
Sports Arena High Pressure Sodium Pendant 250w 2 537 321
Energy Consumption calculated by AkWarm based on wattage, schedule, and an electricity rate of $0.43/kWh Plug Loads
Equipment Type Quantity KWH/yr Cost/yr.
True Refrigerator ADM-49PE57132 1 3,030 $ 1,303
Energy Consumption calculated by AkWarm based on wattage, schedule, and an electricity rate of $0.43/kWh

Energy Audit – Final Report Tok Athletic Facility
Tok, Alaska
F:\00-Jobs\2011\2602 F - AHFC Grade Audits\50-300 Doyon Other Region\50-300 Alaska Gateway SD\50-310 Tok School Athletic Facility\Reports\Final\2012.07.11 Final AHFC Report TKJ School Athletic Facility.Docx
26
Appendix D Local Utility Rate Structure
The information in this section was provided directly from the local utility or gathered from the local utility’s publicly available information at the time of the audit. All language used in this section was provided by the local utility and believed to be current at the time of the audit. Energy use terms, specific fees, and other specific information are subject to change. Updated rate structure information should be gathered from the utility during future discussion of rates, rate structures and utility pricing agreements. Tok Athletic Facility classifies under Alaska Power Company’s A-1 General Service.
Alaska Power Company Rate Structure:
A-1 General Service
Base Rate $0.3391 / KWH
Customer Charge $12.46
Utility Charge $0.08712 / KWH
Energy Charge $0.3529 / KWH
RCC (Regulatory Charge) $0.000492 / KWH
Overall Rate $0.6925 / KWH Alaska Power Company offers their customers in a series of different rates, depending on the classification of the service provided. The rates start at the lowest level, A-1 and work up to A-5. A-1 is the only classification that does not get charged for demand. General Service rates break down as follows: A-1 Service Services under 75,000 kilowatts (KW) of demand per billing cycle A-2 – A-5 Services Services 75,000 KW and higher of demand per billing cycle Customer Charge A flat fee that covers costs for meter reading, billing and customer service. Utility Charge (kWh charge) This charge is multiplied by the number of kilowatt-hours (kWh) used in a monthly billing period. It covers the costs to maintain power plants and substations, interest on loans as well as wires, power poles and transformers.

Energy Audit – Final Report Tok Athletic Facility
Tok, Alaska
F:\00-Jobs\2011\2602 F - AHFC Grade Audits\50-300 Doyon Other Region\50-300 Alaska Gateway SD\50-310 Tok School Athletic Facility\Reports\Final\2012.07.11 Final AHFC Report TKJ School Athletic Facility.Docx
27
Regulatory Charge This charge of .000492 per kWh is set by the Regulatory Commission of Alaska (RCA). Since November 1, 1992, the Regulatory Commission of Alaska has been funded by a Regulatory Charge to the utilities it regulates rather than through the State general fund. The charge, labeled "Regulatory Cost Charge." on your bill, is set by the RCA, and applies to all retail kilowatt-hours sold by regulated electric utilities in Alaska.
Energy Audit – Final Report Tok Athletic Facility
Tok, Alaska
F:\00-Jobs\2011\2602 F - AHFC Grade Audits\50-300 Doyon Other Region\50-300 Alaska Gateway SD\50-310 Tok School Athletic Facility\Reports\Final\2012.07.11 Final AHFC Report TKJ School Athletic Facility.Docx
28
Appendix E Analysis Methods
Analysis Methodology Data collected was processed using AkWarm energy use software to estimate current energy consumption by end usage and calculate energy savings for each of the proposed energy efficiency measures (EEMs). In addition, separate analysis may have been conducted to evaluate EEMs that AkWarm cannot effectively model to evaluate potential reductions in annual energy consumption. Analyses were conducted under the direct supervision of a Certified Energy Auditor, Certified Energy Manager, or a Professional Engineer. EEMs are evaluated based on building use, maintenance and processes, local climate conditions, building construction type, function, operational schedule and existing conditions. Energy savings are calculated based on industry standard methods and engineering estimations. Each model created in AkWarm is carefully compared to existing utility usage obtained from utility bills. The AkWarm analysis provides a number of tools for assessing the cost effectiveness of various improvement options. The primary assessment value used in this audit report is the Savings/Investment Ratio (SIR). The SIR is a method of cost analysis that compares the total cost savings through reduced energy consumption to the total cost of a project over its assumed lifespan, including both the construction cost and ongoing maintenance and operating costs. Other measurement methods include Simple Payback, which is defined as the length of time it takes for the savings to equal the total installed cost and Breakeven Cost, which is defined as the highest cost that would yield a Savings/Investment Ratio of one. EEMs are recommended by AkWarm in order of cost-effectiveness. AkWarm first calculates individual SIRs for each EEM, and then ranks the EEMs by SIR, with higher SIRs at the top of the list. An individual EEM must have a SIR greater than or equal to one in order to be recommended by AkWarm. Next AkWarm modifies the building model to include the installation of the first EEM and then re-simulates the energy use. Then the remaining EEMs are re-evaluated and ranked again. AkWarm goes through this iterative process until all suggested EEMs have been evaluated. Under this iterative review process, the savings for each recommended EEM is calculated based on the implementation of the other, more cost effective EEMs first. Therefore, the implementation of one EEM affects the savings of other EEMs that are recommended later. The savings from any one individual EEM may be relatively higher if the individual EEM is implemented without the other recommended EEMs. For example, implementing a reduced operating schedule for inefficient lighting may result in relatively higher savings than implementing the same reduced operating schedule for newly installed lighting that is more efficient. If multiple EEMs are recommended, AkWarm calculates a combined savings. Inclusion of recommendations for energy savings outside the capability of AkWarm will impact the actual savings from the AkWarm projections. This will almost certainly result in lower energy savings and monetary savings from AkWarm recommendations. The reality is that only so much energy is consumed in a building. Energy savings from one EEM reduces the amount of energy that can be saved from additional EEMs. For example, installation of a lower wattage light bulb does not save energy or money if the bulb is never turned on because of a schedule or operational change at the facility.

Energy Audit – Final Report Tok Athletic Facility
Tok, Alaska
F:\00-Jobs\2011\2602 F - AHFC Grade Audits\50-300 Doyon Other Region\50-300 Alaska Gateway SD\50-310 Tok School Athletic Facility\Reports\Final\2012.07.11 Final AHFC Report TKJ School Athletic Facility.Docx
29
Appendix F Audit Limitations
The results of this audit are dependent on the input data provided and can only act as an approximation. In some instances, several EEMs or installation methods may achieve the identified potential savings. Actual savings will depend on the EEM selected, the price of energy, and the final installation and implementation methodology. Competent tradesmen and professional engineers may be required to design, install, or otherwise implement some of the recommended EEMs. This document is an energy use audit report and is not intended as a final design document, operation, and maintenance manual, or to take the place of any document provided by a manufacturer or installer of any device described in this report. Cost savings are calculated based on estimated initial costs for each EEM. Estimated costs include labor and equipment for the full up-front investment required to implement the EEM. The listed installation costs within the report are conceptual budgetary estimates and should not be used as design estimates. The estimated costs are derived from Means Cost Data, industry publications, local contractors and equipment suppliers, and the professional judgment of the CEA writing the report and based on the conditions at the time of the audit. Cost and energy savings are approximations and are not guaranteed. Additional significant energy savings can usually be found with more detailed auditing techniques that include actual measurements of electrical use, temperatures in the building and HVAC ductwork, intake and exhaust temperatures, motor runtime and scheduling, and infrared, air leakage to name just a few. Implementation of these techniques is the difference between a Level III Energy Audit and the Level II Audit that has been conducted. Disclaimer: "This report was prepared as an account of work sponsored by an agency of the United States Government. Neither the United States Government nor any agency thereof, nor any of their employees, makes any warranty, express or implied, or assumes any legal liability or responsibility for the accuracy, completeness, or usefulness of any information, apparatus, product, or process disclosed, or represents that its use would not infringe privately owned rights. Reference herein to any specific commercial product, process, or service by trade name, trademark, manufacturer, or otherwise does not necessarily constitute or imply its endorsement, recommendation, or favoring by the United States Government or any agency thereof. The views and opinions of authors expressed herein do not necessarily state or reflect those of the United States Government or any agency thereof."
Energy Audit – Final Report Tok Athletic Facility
Tok, Alaska
F:\00-Jobs\2011\2602 F - AHFC Grade Audits\50-300 Doyon Other Region\50-300 Alaska Gateway SD\50-310 Tok School Athletic Facility\Reports\Final\2012.07.11 Final AHFC Report TKJ School Athletic Facility.Docx
30
Appendix G References
Although not all documents listed below are specifically referenced in this report, each contains information and insights considered valuable to most buildings.
Alaska Department of Education and Early Development; Education Support Services/Facilities. (1999). Alaska School Facilities Preventative Maintenance Handbook. Juneau, AK: Alaska Department of Education and Early Development.
Alaska Housing Finance Corportation. (2010). Retrofit Energy Assessment for Loans. AHFC.
ASHRAE. (1997). 1997 ASHRAE Handbook: Fundamentals. Atlanta, GA: ASHRAE.
ASHRAE. (2007). ASHRAE Standard 105-2007 Expressing and Comparing Building Energy Performance. Retrieved from ASHRAE: www.ashrae.org
ASHRAE. (2007). ASHRAE Standard 90.1-2007 Energy Standards for buildings Except Low-Rise Residential Buildings. Retrieved from ASHRAE: www.ashrae.org
ASHRAE. (2010). ASHRAE Standard 62.1-2010 Ventilaton for Acceptable Indoor Air Quality. Retrieved from ASHRAE: www.ashrae.org
ASHRAE. (2010). ASHRAE Standard 62.2-2010 Ventilation and Acceptable Indoor Air Quality in Low Rise Residential Buildings. Retrieved from ASHRAE: www.ashrae.org
ASHRAE RP-669 and SP-56. (2004). Procedures for Commercial Building Energy Audits. Atlanta, GA: ASHRAE.
Coad, W. J. (1982). Energy Engineering and Management for Building Systems. Scarborough, Ontario, Canada: Van Nostrand Reinhold Company.
Daley, D. T. (2008). The Little Black Book of Reliability Management. New York, NY: Industrial Press, Inc.
Federal Energy Management Program. (2004, March 3). Demand Controlled Ventilation Using CO2 Sensors. Retrieved 2011, from US DOE Energy Efficiency and Renewable Energy: http://www.eere.energy.gov/femp/pdfs/fta_co2.pdf
Federal Energy Management Program. (2006, April 26). Low-Energy Building Design Guidelines. Retrieved 2011, from Department of Energy; Federal Energy Management Program: http://www.eren.doe.gov/femp/
Institute, E. a. (2004). Variable Speed Pumping: A Guide to Successful Applications. Oxford, UK: Elsevier Advanced Technology.
International Code Council. (2009). International Energy Efficiency Code. Country Club Hills, IL: International Code Council, Inc.
Leach, M., Lobato, C., Hirsch, A., Pless, S., & Torcellini, P. (2010, September). Technical Support Document: Strategies for 50% Energy Savings in Large Office Buildings. Retrieved 2011, from National Renewable Energy Laboratory: http://www.nrel.gov/docs/fy10osti/49213.pdf
Thumann, P.E., C.E.M., A., Younger, C.E.M., W. J., & Niehus, P.E., C.E.M., T. (2010). Handbook of Energy Audits Eighth Edition. Lilburn, GA: The Fairmont Press, Inc.
U.S. Energy Information Administration. (2006). Commercial Building Energy Consumption Survey (CBECS). Retrieved 2011, from Energy Information Administration: http://www.eia.gov/emeu/cbecs/

Energy Audit – Final Report Tok Athletic Facility
Tok, Alaska
F:\00-Jobs\2011\2602 F - AHFC Grade Audits\50-300 Doyon Other Region\50-300 Alaska Gateway SD\50-310 Tok School Athletic Facility\Reports\Final\2012.07.11 Final AHFC Report TKJ School Athletic Facility.Docx
31
Appendix H Typical Energy Use and Cost – Fairbanks and Anchorage
This report provides data on typical energy costs and use on selected building in Fairbanks and Anchorage, Alaska for comparative purposes only. The values provided by the US Energy Information Administration CBECS study included a broader range of building types for the Continental U.S. are not necessarily good comparatives for buildings and conditions in Alaska. An assortment of values from CBECS may be found in Appendix I. The Alaska data described in this report came from a benchmarking study NORTECH and other Technical Services Providers (TSPs) completed on publicly owned buildings in Alaska under contract with AHFC. This study acquired actual utility data for municipal buildings and schools in Alaska for the two recent full years. The utility data included costs and quantities including fuel oil, electricity, propane, wood, steam, and all other energy source usage. This resulted in a database of approximately 900 buildings. During the course of the benchmarking study, the comparisons made to the CBECS data appeared to be inappropriate for various reasons. Therefore, this energy use audit report references the average energy use and energy cost of Anchorage and Fairbanks buildings as described below. The Alaska benchmarking data was evaluated in order to find valid comparison data. Buildings with major energy use information missing were eliminated from the data pool. After detailed scrutiny of the data, the most complete information was provided to NORTECH by the Fairbanks North Star Borough School District (FNSBSD) and the Anchorage School District (ASD). The data sets from these two sources included both the actual educational facilities as well as the district administrative buildings and these are grouped together in this report as Fairbanks and Anchorage schools. These two sources of information, being the most complete and reasonable in-state information, have been used to identify an average annual energy usage for Fairbanks and for Anchorage in order to provide a comparison for other facilities in Alaska. Several factors may limit the comparison of a specific facility to these regional indicators. In Fairbanks, the FNSBSD generally uses number two fuel oil for heating needs and electricity is provided by Golden Valley Electric Association (GVEA). GVEA produces electricity from a coal fired generation plant with additional oil generation upon demand. A few of the FNSBSD buildings in this selection utilize district steam and hot water. The FNSBSD has recently (the last ten years) invested significantly in envelope and other efficiency upgrades to reduce their operating costs. Therefore a reader should be aware that this selection of Fairbanks buildings has energy use at or below average for the entire Alaska benchmarking database. Heating in Anchorage is through natural gas from the nearby natural gas fields. Electricity is also provided using natural gas. As the source is nearby and the infrastructure for delivery is in place, energy costs are relatively low in the area. As a result, the ASD buildings have lower energy costs, but higher energy use, than the average for the entire benchmarking database. These special circumstances should be considered when comparing the typical annual energy use for particular buildings.
Energy Audit – Final Report Tok Athletic Facility
Tok, Alaska
F:\00-Jobs\2011\2602 F - AHFC Grade Audits\50-300 Doyon Other Region\50-300 Alaska Gateway SD\50-310 Tok School Athletic Facility\Reports\Final\2012.07.11 Final AHFC Report TKJ School Athletic Facility.Docx
32
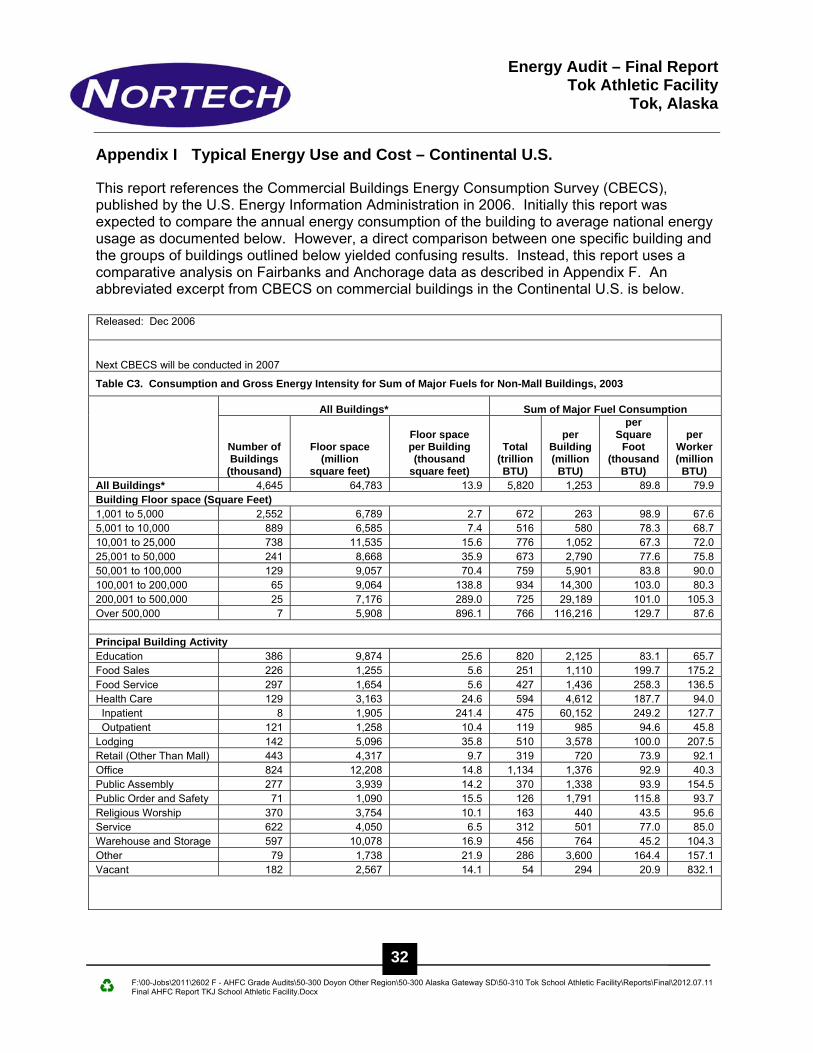
Appendix I Typical Energy Use and Cost – Continental U.S.
This report references the Commercial Buildings Energy Consumption Survey (CBECS), published by the U.S. Energy Information Administration in 2006. Initially this report was expected to compare the annual energy consumption of the building to average national energy usage as documented below. However, a direct comparison between one specific building and the groups of buildings outlined below yielded confusing results. Instead, this report uses a comparative analysis on Fairbanks and Anchorage data as described in Appendix F. An abbreviated excerpt from CBECS on commercial buildings in the Continental U.S. is below. Released: Dec 2006
Next CBECS will be conducted in 2007
Table C3. Consumption and Gross Energy Intensity for Sum of Major Fuels for Non-Mall Buildings, 2003
All Buildings* Sum of Major Fuel Consumption
Number of Buildings
(thousand)
Floor space (million
square feet)
Floor space per Building (thousand
square feet)
Total (trillion BTU)
per Building (million
BTU)
per Square
Foot (thousand
BTU)
per Worker (million
BTU) All Buildings* 4,645 64,783 13.9 5,820 1,253 89.8 79.9 Building Floor space (Square Feet) 1,001 to 5,000 2,552 6,789 2.7 672 263 98.9 67.6 5,001 to 10,000 889 6,585 7.4 516 580 78.3 68.7 10,001 to 25,000 738 11,535 15.6 776 1,052 67.3 72.0 25,001 to 50,000 241 8,668 35.9 673 2,790 77.6 75.8 50,001 to 100,000 129 9,057 70.4 759 5,901 83.8 90.0 100,001 to 200,000 65 9,064 138.8 934 14,300 103.0 80.3 200,001 to 500,000 25 7,176 289.0 725 29,189 101.0 105.3 Over 500,000 7 5,908 896.1 766 116,216 129.7 87.6
Principal Building Activity Education 386 9,874 25.6 820 2,125 83.1 65.7 Food Sales 226 1,255 5.6 251 1,110 199.7 175.2 Food Service 297 1,654 5.6 427 1,436 258.3 136.5 Health Care 129 3,163 24.6 594 4,612 187.7 94.0 Inpatient 8 1,905 241.4 475 60,152 249.2 127.7 Outpatient 121 1,258 10.4 119 985 94.6 45.8 Lodging 142 5,096 35.8 510 3,578 100.0 207.5 Retail (Other Than Mall) 443 4,317 9.7 319 720 73.9 92.1 Office 824 12,208 14.8 1,134 1,376 92.9 40.3 Public Assembly 277 3,939 14.2 370 1,338 93.9 154.5 Public Order and Safety 71 1,090 15.5 126 1,791 115.8 93.7 Religious Worship 370 3,754 10.1 163 440 43.5 95.6 Service 622 4,050 6.5 312 501 77.0 85.0 Warehouse and Storage 597 10,078 16.9 456 764 45.2 104.3 Other 79 1,738 21.9 286 3,600 164.4 157.1 Vacant 182 2,567 14.1 54 294 20.9 832.1

Energy Audit – Final Report Tok Athletic Facility
Tok, Alaska
F:\00-Jobs\2011\2602 F - AHFC Grade Audits\50-300 Doyon Other Region\50-300 Alaska Gateway SD\50-310 Tok School Athletic Facility\Reports\Final\2012.07.11 Final AHFC Report TKJ School Athletic Facility.Docx
33
Appendix J List of Conversion Factors and Energy Units
1 British Thermal Unit is the energy required to raise one pound of water one degree F° 1 Watt is approximately 3.412 BTU/hr. 1 horsepower is approximately 2,544 BTU/hr. 1 horsepower is approximately 746 Watts 1 "ton of cooling” is approximately 12,000 BTU/hr., the amount of power required
to melt one short ton of ice in 24 hours 1 Therm = 100,000 BTU 1 KBTU = 1,000 BTU 1 KWH = 3413 BTU 1 KW = 3413 BTU/Hr. 1 Boiler HP = 33,400 BTU/Hr. 1 Pound Steam = approximately 1000 BTU 1 CCF of natural gas = approximately 1 Therm 1 inch H2O = 250 Pascal (Pa) = 0.443 pounds/square inch (psi) 1 atmosphere (atm) = 10,1000 Pascal (Pa) BTU British Thermal Unit CCF 100 Cubic Feet CFM Cubic Feet per Minute GPM Gallons per minute HP Horsepower Hz Hertz kg Kilogram (1,000 grams) kV Kilovolt (1,000 volts) kVA Kilovolt-Amp kVAR Kilovolt-Amp Reactive KW Kilowatt (1,000 watts) KWH Kilowatt Hour V Volt W Watt

Energy Audit – Final Report Tok Athletic Facility
Tok, Alaska
F:\00-Jobs\2011\2602 F - AHFC Grade Audits\50-300 Doyon Other Region\50-300 Alaska Gateway SD\50-310 Tok School Athletic Facility\Reports\Final\2012.07.11 Final AHFC Report TKJ School Athletic Facility.Docx
34
Appendix K List of Acronyms, Abbreviations, and Definitions
ACH Air Changes per Hour AFUE Annual Fuel Utilization Efficiency Air Economizer A duct, damper, and automatic control system that
allows a cooling system to supply outside air to reduce or eliminate the need for mechanical cooling.
Ambient Temperature Average temperature of the surrounding air Ballast A device used with an electric discharge lamp to cause
the lamp to start and operate under the proper circuit conditions of voltage, current, electrode heat, etc.
CO2 Carbon Dioxide CUI Cost Utilization Index CDD Cooling Degree Days DDC Direct Digital Control EEM Energy Efficiency Measure EER Energy Efficient Ratio EUI Energy Utilization Index FLUOR Fluorescent Grade The finished ground level adjoining a building at the
exterior walls HDD Heating Degree Days HVAC Heating, Ventilation, and Air-Conditioning INCAN Incandescent NPV Net Present Value R-value Thermal resistance measured in BTU/Hr.-SF- ̊F (Higher
value means better insulation) SCFM Standard Cubic Feet per Minute Savings to Investment Ratio (SIR) Savings over the life of the EEM divided by Investment
capital cost. Savings includes the total discounted dollar savings considered over the life of the improvement. Investment in the SIR calculation includes the labor and materials required to install the measure.
Set Point Target temperature that a control system operates the heating and cooling system
Simple payback A cost analysis method whereby the investment cost of an EEM is divided by the first year’s savings of the EEM to give the number of years required to recover the cost of the investment.
Energy Audit – Final Report Tok Athletic Facility
Tok, Alaska
F:\00-Jobs\2011\2602 F - AHFC Grade Audits\50-300 Doyon Other Region\50-300 Alaska Gateway SD\50-310 Tok School Athletic Facility\Reports\Final\2012.07.11 Final AHFC Report TKJ School Athletic Facility.Docx
35
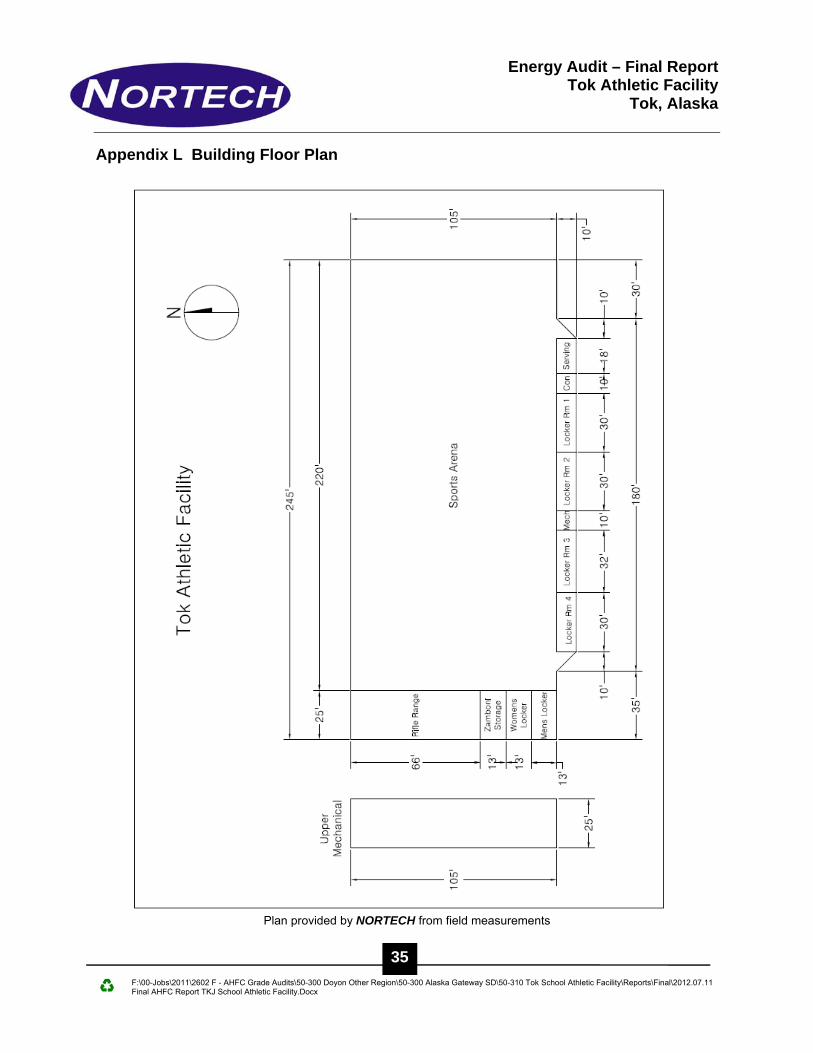
Appendix L Building Floor Plan
Plan provided by NORTECH from field measurements