energy & environmental science - bus
TRANSCRIPT

Energy &Environmental Science
ANALYSIS
Department of Chemical and Biological
Madison, WI 53706, USA. E-mail: maravelia
+1 608 265 9026
† Electronic supplementary informa10.1039/c3ee24243a
Cite this: Energy Environ. Sci., 2013, 6,1093
Received 26th September 2012Accepted 31st January 2013
DOI: 10.1039/c3ee24243a
www.rsc.org/ees
This journal is ª The Royal Society of
An optimization-based assessment framework forbiomass-to-fuel conversion strategies†
Jiyong Kim, S. Murat Sen and Christos T. Maravelias*
We develop a framework for the identification and evaluation of biomass-to-fuel production strategies.
We generate a technology superstructure that consists of a wide range of conversion technologies along
with the corresponding feedstocks, intermediates, and final products. The superstructure includes both
known technologies as well as technologies that can be developed based on results available in the
literature. Technical (yields and energy requirements) and economic (production cost) parameters, for
both existing and potential new technologies, are calculated from the literature or estimated using a
systematic approach. The superstructure along with the associated data is used to develop optimization
models which allow us to identify and evaluate new and existing biofuel strategies as well as to
perform sensitivity analyses and identify the major cost drivers of these strategies. The proposed
framework can be used to study a range of interesting questions: What is the best strategy for the
production of a specific fuel? What is the best utilization strategy for a specific feedstock? We illustrate
our methodology using the production of ethanol from hard woody biomass as a case study.
Broader context
While advances in fundamental research have resulted in the development of large number of biomass-to-fuel processing and conversion technologies, it is stillunclear what mix of products would make biofuel production economically viable; and even for a given set of nal products, it is unknown which chemistriesand what types of conversion technologies should be integrated and how. Accordingly, to speed the development of a competitive, integrated biorenery, wedevelop a system-level methodology for the synthesis and evaluation of a wide range of biomass-to-fuel strategies. In particular, we generate a biomass utilization
superstructure (BUS) which consists of a wide range of conversion technologies along with the corresponding feedstocks, intermediates, and nal products; andwe develop optimization models for the evaluation of the embedded strategies using alternative criteria. Our framework establishes a methodology and suite oftools for the systematic comparison of biofuel strategies, the identication of the major technology gaps and cost drivers, and the assessment of the impact oftechnology uncertainty.
1 Introduction
Currently, most chemicals and energy carriers are derived fromfossil fuels.1 The demand for transportation fuels, whichaccounts for nearly 25% of the total net primary energy and 70%of the energy provided by petroleum,2 is expected to increase,while oil prices are also expected to remain high due to strongdemand in the developing world. To meet this challenge, it isnecessary to increase energy supplies through the developmentof renewable and alternative energy sources. Biomass, the onlyrenewable source of carbon-based fuels, offers promisingalternatives to satisfy energy demand while reducing the envi-ronmental impact.3,4 Furthermore, biomass resources arewidely abundant.5 In the last few decades, many technologies
Engineering, University of Wisconsin,
[email protected]; Fax: +1 608 262 5494; Tel:
tion (ESI) available. See DOI:
Chemistry 2013
have been developed to produce biomass-derived chemicals6–8
and fuels9–15 through the formation of platform chemicals16,17
(see Huber et al.18 for a review).A large number of studies focuses on the economic assess-
ment of biomass-to-fuel strategies that rely on biochemical,19–24
catalytic25,26 or thermochemical (pyrolysis27,28 and gasica-tion29–32) technologies utilizing a range of biomass alternatives33
including energy crops34 and biomass wastes.35–38 Also,researchers have explored improvements via the optimizationof energy39 and water consumption,40 and waste treatmentsystems,41 as well as the integration of new strategies withexisting infrastructure.42,43 It is envisioned that the conversionof biomass to fuels, chemicals and power will take place in anintegrated facility, the biorenery.44–46 Several review papers onthe design and analysis of bioreneries are available in theliterature.1,47,48 Finally, a number of studies, primarily in theeld of industrial ecology, focus on the analysis of the environ-mental impact of biofuel strategies.49–53
Despite the large number of system-level analyses in theliterature, there are limited methods available for (i) the
Energy Environ. Sci., 2013, 6, 1093–1104 | 1093

Fig. 2 (a) Breakdown of a production system into a series of technologies and(b) systematic generation of new technologies and compounds utilizing differentfeedstocks.
Table 1 Major technology groups in each category; number of technologies ineach group in parentheses
Category Technology groupa
Mechanical/physical
Handling and drying (9), milling andshredding (6), liquefaction (2), syngas,conditioning (4), distillation (22),pervaporation (18), residue separation (12),residue treating (2), residue upgrading (1),
Energy & Environmental Science Analysis
identication (and assessment) of new biofuel productionstrategies, and (ii) the simultaneous assessment and compar-ison of alternative strategies. Most technology assessmentstudies in the literature focus on specic systems, i.e., systemswith a specied feedstock, series of conversions, and nalproducts. Accordingly, the goal of this paper is the developmentof a systematic framework for the identication and assessmentof biofuel strategies, which can be used to study a wide range ofquestions. In developing this framework, we rst generate abiomass utilization superstructure (BUS), which includes morethan 170 technologies and 120 compounds (Section 2). Second,we evaluate technical and economic parameters for the tech-nologies; parameters for existing technologies are obtainedfrom the literature, whereas those for new technologies areestimated based on similar existing technologies (Section 3).Third, we develop network optimization (linear programmingand mixed-integer programming) models for the underlyingsuperstructure (Section 4). Based on these models, we discussmethods to generate alternative strategies, identify bottlenecksand technology gaps, and perform sensitivity analyses (Section5). Finally, in Section 6, we use our framework to study theproduction of ethanol from hard woody biomass.
2 Biomass utilization superstructure2.1 Technologies
Biomass can be converted to fuels, fuel additives, and chemicalsvia multiple production strategies, where each strategy startsfrom a biomass feedstock and through a series of conversiontechnologies leads to the production of one or more targetedfuel(s). We develop a technology superstructure that consists ofall major conversion technologies and the correspondingcompounds, thus embedding all potential strategies. Tosimplify the representation, we group similar technologies intotechnology groups, as shown in Fig. 1.
To generate the superstructure, we performed an extensivereview of the literature. In some cases, research papersdescribing a single conversion technology were used while inother cases we studied papers that describe integratedproduction systems. In the latter case, we divided the knownsystems into a series of technologies. For instance, theproduction of ethanol from corn stover is decomposed into threetechnologies, dilute acid pretreatment, enzymatic simultaneoussaccharication and fermentation (SSF), and distillation with two
Fig. 1 Technology groups (for superstructure representation) and technologies.
1094 | Energy Environ. Sci., 2013, 6, 1093–1104
corresponding intermediates, hydrolyzate and broth as shownin Fig. 2a.
It is important to stress here that each technology does notcorrespond to a single operation. For example, dilute acidpretreatment (DAPcs) includes four operations: (i) shreddingand washing, (ii) prehydrolysis, (iii) S/L separation, and (iv)overliming and neutralization (see Fig. 2a). Thus, althougheach technology is treated as a block, the calculation ofits technical and economic parameters is based, as wediscuss in Section 3, on detailed modeling of the individualoperations comprising a technology, the intra-technologystreams, and the corresponding operational costs (including
hydrolyzate conditioning (12), extraction (1)Biochemical Acidic fermentation (10), SSF (12)Chemical Dilute acid pretreatment (5), hot water
pretreatment (5), AFEX pretreatment (5),hydrolysis (10), acidic treatment (6),syngas production (4), MeOH synthesis (2),acetic acid production (1), MTG process (1),hydrogenation (1), glycerol upgrading (1),FT synthesis (1), hydrogen production (3),hydrocracking (1), esterication (1)
Thermochemical Gasication (10), pyrolysis (5),power generation (14)
a AFEX: ammonia ber expansion, FT: Fischer–Tropsch, MeOH:methanol, MTG: methanol to gasoline, SSF: simultaneoussaccharication and fermentation.
This journal is ª The Royal Society of Chemistry 2013

Table 2 Major compound groups in each compound category; number ofcompounds in each group in parentheses
Category Compound groupa
Feedstock(biomass)
Soybean (1), corn (1), sugarcane (1), bagasse (1),corn stover (1), hard wood (1), so wood (1),switch grass (1)
Intermediate Chopped particle (5), slurry (24), hydrolyzate (12),triglycerides (1), broth (24), glycerol (1), choppeddry corn (1), steeped wet corn (1), glycerol (1),cane juice (1), levulinic acid (1), syngas (2),methanol (1), GVL (1), raw acetic acid (1),bio-oil (7), butene (1), solid (16)
Final product(biofuels)
Gasoline (1), diesel (1), bio-diesel (1), FT-fuels (1),ethanol (1), butanol (1), DBK (1), SNG (1),hydrogen (1), ethyl levulinate (1), fuel additives (1),mixed alcohol (1)
By-product Electricity (1), DDGS (1), gluten (1), xylose (1),formic acid (1), acetic acid (1)
a DBK: 5-nonanone; DDGS: dried grains with soluble; FT: Fischer–Tropsch; GVL: g-valerolactone; SNG: synthesized natural gas.
Fig. 3 Biomass utilization superstructure; representation based on technology and cpretreatment, APR: aqueous phase reforming, CAT: catalytic conversion technologdilute acid, D&F: drying and filtering, FT: Fischer–Tropsch, HW: hot water, HYDRO: hhandling and milling, H&S: handling and steeping, ID indirect, LIQ and SACC: liqoligomerization, SEP: separation, SR: steam reforming, SSF: simultaneous saccharifiacetic acid, AL: alkanes, B: butanol, BM: biomass, BN: butene, BO: bio-oil, C: corn, CB:ethanol, EL: ethyl levulinate, FA: fuel additives, GVL: g-valerolactone, LA: levulinic acbutanol and pentanol), RS: raw syngas, SB: soybean, SC: sugarcane, SNG: synthesize
This journal is ª The Royal Society of Chemistry 2013
Analysis Energy & Environmental Science
utility, wastewater, and material costs). An example illus-trating the development of technology models is presented inthe ESI.†
If alternative feedstocks are used, then the composition ofthe compounds and the yields will be different, so new tech-nologies and compounds should be introduced. For example,we generate two alternative technologies, DAPhw and DAPsg,which utilize hard wood and switch grass feedstocks, respec-tively, based on the existing technology utilizing corn stover. Inthis case, intermediate compounds Hydrohw and Hydrosg arealso generated for the new technologies (see Fig. 2b).
We classify technologies into four categories according totheir processing characteristics:54
� Mechanical/physical: a compound is separated or its size isreduced without changes in its chemical structure.
� Biochemical: microorganisms or enzymes are used for theconversion.
� Chemical: a compound is transformed at mild pressure andtemperature.
ompound groups. Technologies. AC: acidic, AFEX: ammonia fiber expansion basedy, CHP: combined heat and power generation, CON: conditioning, D: direct, DA:ydrogenation, H&C: handling and chopping, H&E: handling and extraction, H&M:uefaction and saccharification, MTG: methanol to gasoline technology, OLIGO:cation and fermentation, SYN: chemical synthesis technology. Compounds. AA:crude bio-oil, DBK: dibutyl ketone, DC: dry corn, DDGS: dried grains with soluble, E:id, LH: lignin and humans, M: methanol, MA: mixed alcohols (ethanol, propanol,d natural gas, TAR: tar residue, WC: wet corn.
Energy Environ. Sci., 2013, 6, 1093–1104 | 1095

Energy & Environmental Science Analysis
� Thermochemical: extreme temperature and pressureconditions are used for the conversion.
Table 1 shows the major technology groups of each categoryand the number of technologies included in each technologygroup.
2.2 Compounds
Compounds are classied into four categories; biomass feed-stocks, intermediates, nal products (fuels or fuel additives)and by-products. Feedstock composition varies regionally, whilethe composition of intermediates and nal products dependson the technology they are produced from and the compositionof the input compound. Compounds are also grouped intocompound groups, as shown in Table 2. The BUS includes 8feedstocks, 18 compound groups for intermediates, 6 by-prod-ucts, and 12 nal products. Note that we also considercompounds which can be upgraded (blended) to value-addedfuels such as ethyl levulinate.
Fig. 4 Procedure for evaluation of technical and economic parameters for (a)existing and (b) new technologies; dark boxes denote evaluation tasks, lightboxes represent parameters.
2.3 Biomass utilization superstructure generation
Based on an extensive search of the literature and the systematicgeneration of alternative technologies described in subsection2.1, we formulated a superstructure that consists of 172 tech-nologies and 125 compounds. A complete technology list isgiven in the ESI,† along with the references that were used toevaluate the associated parameters. Fig. 3 shows the samesuperstructure represented using technology and compoundgroups. Note that feedstocks can be converted to fuels inmultiple ways and, in general, a fuel can be produced bymultiple feedstocks. For example, the compound group hydro-lyzate (which can be produced from different feedstocksthrough different pretreatment technologies) can be used toproduce ethanol through a combination of hydrolysis andfermentation or it can be used to produce liquid hydrocarbonfuels through catalytic conversion technologies.
3 Parameter evaluation
The methodology for evaluating technical and economicparameters for existing and new technologies is outlined inFig. 4.
3.1 Existing technologies
3.1.1 Technical parameters. As discussed in subsection 2.1,a detailed process model was developed for each technology inorder to calculate two key parameters, the product yield(s) (themass ratio of product over primary reactant) and energyrequirement (kW per unit processing rate), which are then usedto develop a simple block technology model in the superstruc-ture. The detailed models used for the calculation of theseparameters consider the consumption of auxiliary inputs, suchas makeup water, enzymes, solvents and catalysts, as well as theconsumption of utilities. However, since auxiliary inputs do notappear as compounds in the nal superstructure, they are notincluded in the calculation of yields. The generation of detailed
1096 | Energy Environ. Sci., 2013, 6, 1093–1104
technology models based on the literature is illustrated in theESI† through an example.
3.1.2 Economic parameters. The main economic param-eter is the unit production cost, which has capital and operatingcost components. The capital cost consists of direct costs,which include equipment, installation, piping and instrumen-tation costs, and indirect costs, which include engineering andconstruction costs, fees and tax, and project contingency costs.Based on sizing and costing data, direct costs are estimatedusing the installation factors given in Table S7 of the ESI† andthe total capital cost is estimated using the project investmentfactors given in Table S8.† To compare the economics ofdifferent strategies accurately, we adjust the capacity of alltechnologies. Specically, we consider capacities that would besuitable for a plant that processes 2000 dry tons of biomass perday based on benchmark reports in the literature.55 In otherwords, the rst technology in a strategy utilizes 2000 dry tons ofbiomass per day as input and the capacities of the followingtechnologies are modied accordingly. The capacity-adjustedcapital cost, Cp, is estimated using a power-law expression,
Cp ¼ Cpo(Q/Qo)a (1)
This journal is ª The Royal Society of Chemistry 2013

Fig. 5 Yield estimation of a new technology from component-based conversion coefficients of an existing technology.
Analysis Energy & Environmental Science
where Cpo is the capital cost of the baseline design, Q is theadjusted capacity, Qo is the capacity of the baseline design and ais the scaling exponent, which is assumed to be 0.67.22
Table 3 Technical and economic parameter ranges for the major technology grou
Reactant Product
Mechanical/physicalHandling and drying Lignocellulosic Dried BMMilling and shredder Lignocellulosic Shredded BLiquefaction Corn powder, slurry Liqueed mSyngas conditioning Raw syngas SyngasDistillation Broth, fermented mash EthanolPervaporation Broth, fermented mash EthanolResidue separation Residue LigninResidue treating Residue DDGSResidue upgrading Residue Raw bio-oiHydrolyzate conditioning Hydrolyzate Treated soExtraction Soybean Triglycerid
BiochemicalFermentation Liqueed mash BrothEnzymatic SSF Hydrolyzate Broth
ThermochemicalGasication Dried biomass Raw syngaPyrolysis Dried biomass Raw bio-oiPower generationb Residue Electricity
ChemicalDilute acid pretreatment Lignocellulosic HydrolyzatHot water pretreatment Lignocellulosic HydrolyzatAFEX pretreatment Lignocellulosic HydrolyzatLA-hydrolysis Lignocellulosic Levulinic aAcidic treatment Hydrolyzate Acidic slurSyngas production Raw syngas SyngasMeOH synthesis Syngas MethanolAA production Methanol Acetic acidMTG processc Methanol Gasoline
DieselHydrogenation Acetic acid EthanolGlycerol upgradingc Glycerol Gasoline
DieselFT synthesisc Syngas Gasoline
DieselH2 production Syngas, bio-oil HydrogenHydrocrackingc Bio-oil Gasoline
DieselEsterication Triglyceride Crude biod
a Abbreviations given in Fig. 3. b The units of yield and production cost ac The costs are calculated based on the main product (e.g., gasoline).
This journal is ª The Royal Society of Chemistry 2013
The amortized capital cost, ACC, is then calculated withtime-value adjustment,
ACC ¼ 3 � CCF � Cp (2)
psa
YieldProduction cost($ per kg)
Energy requirement(kW h kg�1)
0.54–0.80 0.01–0.03 <0.01M 0.67–1.16 <0.01 0.02–11.98ash 1.59–2.67 0.01 <0.01
0.55–0.63 0.05–0.07 0.01–0.070.01–0.11 0.09–0.36 <0.010.02–0.05 0.20–0.46 656.7–983.30.63–0.71 <0.01 <0.010.04–0.14 0.14–0.44 8.87–21.40
l 0.25–0.27 0.15 944.20lid 0.98–1.02 <0.01 1.01–1.24e 1.05 0.01 <0.01
0.56–1.11 <0.01 0.01–0.020.95–1.03 <0.01 12.05–37.48
s 0.84–1.19 0.02–0.03 0.06–0.08l 0.75–0.77 0.02–0.03 1.74–1.83
0.25–1.93 0.05–0.09 144.6–245.4
e 3.12–3.24 0.01–0.02 61.52–94.84e 4.08–4.24 0.01 89.11–109.33e 3.39–3.41 0.01 52.39–68.02cid 0.12–0.15 0.01 0.08–0.10ry 0.98–1.02 <0.01 1.01–1.25
0.54–0.63 0.05–11.22 0.02–0.070.86–0.93 0.04–0.07 0.02–0.061.81 0.19 0.0150.32 0.25 0.210.120.76 0.26 <0.010.20 0.01 0.270.060.13 0.46 0.670.050.02–0.07 0.53–8.97 0.59–21.400.41 0.16 132.800.18
iesel 1.1 0.02 <0.01
re given in terms of kW h kg�1 of reactant and $ per kW h, respectively.
Energy Environ. Sci., 2013, 6, 1093–1104 | 1097
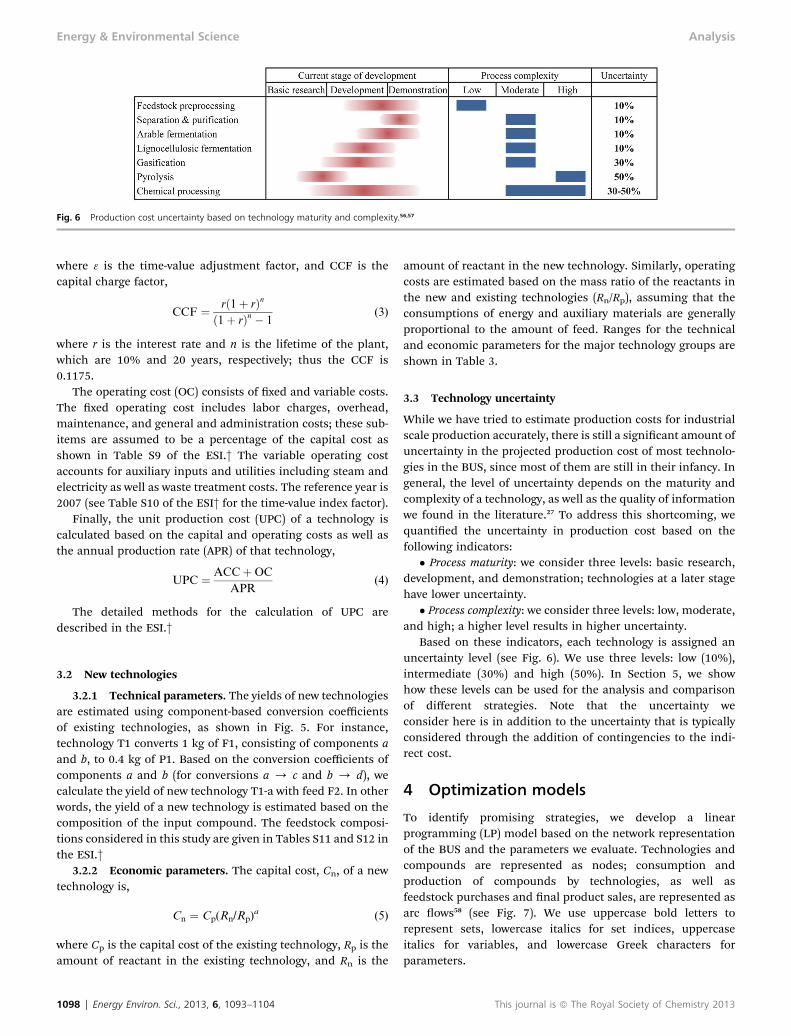
Fig. 6 Production cost uncertainty based on technology maturity and complexity.56,57
Energy & Environmental Science Analysis
where 3 is the time-value adjustment factor, and CCF is thecapital charge factor,
CCF ¼ rð1þ rÞnð1þ rÞn � 1
(3)
where r is the interest rate and n is the lifetime of the plant,which are 10% and 20 years, respectively; thus the CCF is0.1175.
The operating cost (OC) consists of xed and variable costs.The xed operating cost includes labor charges, overhead,maintenance, and general and administration costs; these sub-items are assumed to be a percentage of the capital cost asshown in Table S9 of the ESI.† The variable operating costaccounts for auxiliary inputs and utilities including steam andelectricity as well as waste treatment costs. The reference year is2007 (see Table S10 of the ESI† for the time-value index factor).
Finally, the unit production cost (UPC) of a technology iscalculated based on the capital and operating costs as well asthe annual production rate (APR) of that technology,
UPC ¼ ACCþOC
APR(4)
The detailed methods for the calculation of UPC aredescribed in the ESI.†
3.2 New technologies
3.2.1 Technical parameters. The yields of new technologiesare estimated using component-based conversion coefficientsof existing technologies, as shown in Fig. 5. For instance,technology T1 converts 1 kg of F1, consisting of components aand b, to 0.4 kg of P1. Based on the conversion coefficients ofcomponents a and b (for conversions a / c and b / d), wecalculate the yield of new technology T1-a with feed F2. In otherwords, the yield of a new technology is estimated based on thecomposition of the input compound. The feedstock composi-tions considered in this study are given in Tables S11 and S12 inthe ESI.†
3.2.2 Economic parameters. The capital cost, Cn, of a newtechnology is,
Cn ¼ Cp(Rn/Rp)a (5)
where Cp is the capital cost of the existing technology, Rp is theamount of reactant in the existing technology, and Rn is the
1098 | Energy Environ. Sci., 2013, 6, 1093–1104
amount of reactant in the new technology. Similarly, operatingcosts are estimated based on the mass ratio of the reactants inthe new and existing technologies (Rn/Rp), assuming that theconsumptions of energy and auxiliary materials are generallyproportional to the amount of feed. Ranges for the technicaland economic parameters for the major technology groups areshown in Table 3.
3.3 Technology uncertainty
While we have tried to estimate production costs for industrialscale production accurately, there is still a signicant amount ofuncertainty in the projected production cost of most technolo-gies in the BUS, since most of them are still in their infancy. Ingeneral, the level of uncertainty depends on the maturity andcomplexity of a technology, as well as the quality of informationwe found in the literature.27 To address this shortcoming, wequantied the uncertainty in production cost based on thefollowing indicators:
� Process maturity: we consider three levels: basic research,development, and demonstration; technologies at a later stagehave lower uncertainty.
� Process complexity: we consider three levels: low, moderate,and high; a higher level results in higher uncertainty.
Based on these indicators, each technology is assigned anuncertainty level (see Fig. 6). We use three levels: low (10%),intermediate (30%) and high (50%). In Section 5, we showhow these levels can be used for the analysis and comparisonof different strategies. Note that the uncertainty weconsider here is in addition to the uncertainty that is typicallyconsidered through the addition of contingencies to the indi-rect cost.
4 Optimization models
To identify promising strategies, we develop a linearprogramming (LP) model based on the network representationof the BUS and the parameters we evaluate. Technologies andcompounds are represented as nodes; consumption andproduction of compounds by technologies, as well asfeedstock purchases and nal product sales, are represented asarc ows58 (see Fig. 7). We use uppercase bold letters torepresent sets, lowercase italics for set indices, uppercaseitalics for variables, and lowercase Greek characters forparameters.
This journal is ª The Royal Society of Chemistry 2013
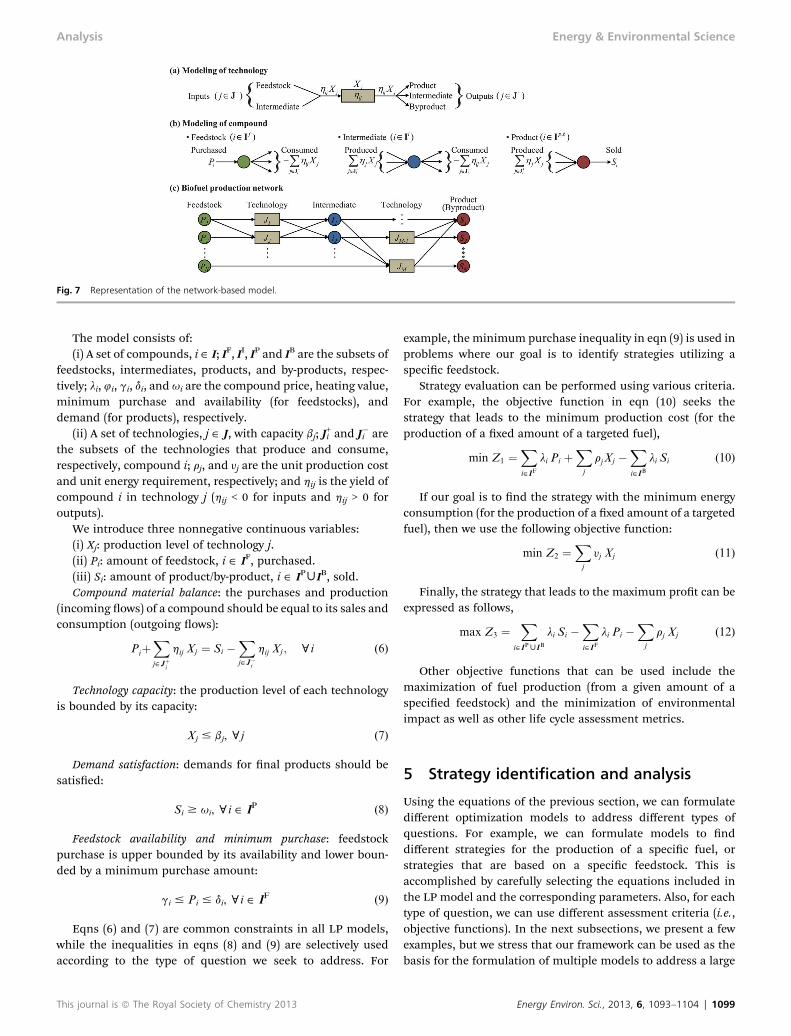
Fig. 7 Representation of the network-based model.
Analysis Energy & Environmental Science
The model consists of:(i) A set of compounds, i ˛ I; IF, II, IP and IB are the subsets of
feedstocks, intermediates, products, and by-products, respec-tively; li, 4i, gi, di, and ui are the compound price, heating value,minimum purchase and availability (for feedstocks), anddemand (for products), respectively.
(ii) A set of technologies, j ˛ J, with capacity bj; J+i and J�i are
the subsets of the technologies that produce and consume,respectively, compound i; rj, and yj are the unit production costand unit energy requirement, respectively; and hij is the yield ofcompound i in technology j (hij < 0 for inputs and hij > 0 foroutputs).
We introduce three nonnegative continuous variables:(i) Xj: production level of technology j.(ii) Pi: amount of feedstock, i ˛ IF, purchased.(iii) Si: amount of product/by-product, i ˛ IPWIB, sold.Compound material balance: the purchases and production
(incoming ows) of a compound should be equal to its sales andconsumption (outgoing ows):
PiþXj˛Jþ
i
hij Xj ¼ Si �Xj˛J�i
hij Xj ; ci (6)
Technology capacity: the production level of each technologyis bounded by its capacity:
Xj # bj, cj (7)
Demand satisfaction: demands for nal products should besatised:
Si $ ui, ci ˛ IP (8)
Feedstock availability and minimum purchase: feedstockpurchase is upper bounded by its availability and lower boun-ded by a minimum purchase amount:
gi # Pi # di, ci ˛ IF (9)
Eqns (6) and (7) are common constraints in all LP models,while the inequalities in eqns (8) and (9) are selectively usedaccording to the type of question we seek to address. For
This journal is ª The Royal Society of Chemistry 2013
example, the minimum purchase inequality in eqn (9) is used inproblems where our goal is to identify strategies utilizing aspecic feedstock.
Strategy evaluation can be performed using various criteria.For example, the objective function in eqn (10) seeks thestrategy that leads to the minimum production cost (for theproduction of a xed amount of a targeted fuel),
min Z1 ¼Xi˛IF
li Pi þXj
rjXj �Xi˛IB
li Si (10)
If our goal is to nd the strategy with the minimum energyconsumption (for the production of a xed amount of a targetedfuel), then we use the following objective function:
min Z2 ¼Xj
yj Xj (11)
Finally, the strategy that leads to the maximum prot can beexpressed as follows,
max Z3 ¼X
i˛IPWIB
li Si �Xi˛IF
li Pi �Xj
rj Xj (12)
Other objective functions that can be used include themaximization of fuel production (from a given amount of aspecied feedstock) and the minimization of environmentalimpact as well as other life cycle assessment metrics.
5 Strategy identification and analysis
Using the equations of the previous section, we can formulatedifferent optimization models to address different types ofquestions. For example, we can formulate models to nddifferent strategies for the production of a specic fuel, orstrategies that are based on a specic feedstock. This isaccomplished by carefully selecting the equations included inthe LP model and the corresponding parameters. Also, for eachtype of question, we can use different assessment criteria (i.e.,objective functions). In the next subsections, we present a fewexamples, but we stress that our framework can be used as thebasis for the formulation of multiple models to address a large
Energy Environ. Sci., 2013, 6, 1093–1104 | 1099

Energy & Environmental Science Analysis
number of questions. A model is denoted byMqc, where q is thetype of question and c the assessment criterion.
5.1 Identication of the optimal strategy
5.1.1 Question 1: optimal production strategy for a givenproduct. The rst question we consider is the identication ofthe optimal strategy for the production of a specic product, i0 ˛IP. This includes the selection of the feedstock to be used as wellas the technologies to be employed. To address this question,we formulate a model where the demand of fuel i0 is equal to 1,all other fuels have zero demand, and the availability of allfeedstocks is unlimited, so that all strategies can be chosen. Ifthe assessment is based on the minimization of cost (objectiveZ1), then we formulate model M11: min {Z1: eqns (6)–(9), withui0 ¼ 1; ui ¼ 0 if IP H is i0; gi ¼ 0, di ¼M,ci ˛ IF}, whereM is asufficiently large number.
The solution of M11 yields feedstock purchase, Pi, and tech-nology production levels, Xj, from which we can construct theoptimal strategy.
5.1.2 Question 2: optimal utilization strategy for a givenfeedstock. In this case, we want to identify the best way to utilizea specic feedstock, i0 0 ˛ IF. We formulate a model that requiresthat one unit of feedstock i0 0 should be purchased (gi0 0 ¼ di0 0 ¼ 1),which, since sales of intermediates are not allowed, leads to theproduction of one or more nal products. If we are interested indetermining the strategy that is more competitive againstexisting technologies today, then we use the maximization ofprot (eqn (13)) as the objective function to formulate themodel,M23: max {Z3: eqn (6), (7) and (9); gi0 0 ¼ di0 0 ¼ 1; gi¼ 0, di¼M if IF H i s i00; ui ¼ 0, ci ˛ IP}.
Note that since the production cost of biofuels is typicallyhigher than the market prices of fossil-based fuels, the protwill be negative, which means that the identied strategy is theone that is closer to becoming competitive.
5.1.3 Question 3: optimal strategy for a given feedstock andproduct. This question arises when there are multiple strategiesto convert a specic feedstock, i0 0 ˛ IF, to a specic product, i0 ˛IP. To address this question, we set the availabilities of all otherfeedstocks to 0, and require the production of one unit ofproduct i0. If our goal is to nd that strategy that requires theleast amount of energy inputs (besides biomass), we use modelM32: min {Z2: eqn (6)–(9); ui0 ¼ 1;ui¼ 0 if IPH is i0; gi¼ 0,ci˛IF; di0 0 ¼ M; di ¼ 0 if IF H i s i0 0}.
Note that since the objective is the minimization of energyuse, exactly 1 unit of fuel i0 will be produced at the optimalsolution, which means that the optimal objective functionvalue, Z*2, is equal to the energy required to produce one unitof fuel i0, or, equivalently, the efficiency of the optimal strategyis 4i’/Z
*2.
5.2 Identication of alternative strategies
Given the high uncertainty in the eld, it is important to be ableto (i) identify alternative strategies, and (ii) evaluate howchanges in production costs affect the selection of the optimalstrategy. Towards the rst aim, we develop a mixed-integerprogramming (MIP) model that can be used iteratively to
1100 | Energy Environ. Sci., 2013, 6, 1093–1104
identify the best K strategies. Towards the second aim, wegenerate production cost intervals for the alternative strategiesusing the uncertainty levels discussed in Section 3.
To formulate the MIP model, we rst introduce binary vari-able Yj and replace eqn (7) with,
Xj # bjYj, cj (7*)
Eqn (7*) essentially activates binary Yj when technology j isutilized at the optimal solution; i.e., Yj ¼ 1 if Xj > 0. Also, weintroduce eqn (13)
Xj˛J l
Yj #��J l
��� 1; l ¼ 0; 1; :::; k � 1 (13)
where Jl is the set of technologies selected in iteration l; J0 is theset of technologies selected using LP model Mqc (iteration 0).Eqn (13) for l ¼ 0 cuts off any strategy that employs the tech-nologies employed in the optimal strategy identied by Mqc. Atiteration k > 1, we solve model Mk
qc, which consists of eqn (6),(7*), (8), (9) and (13) to identify the next best strategy. In general,the inequalities in eqn (13), which are termed as integer cuts,prevent model Mk
qc from nding strategies that were previouslyfound or strategies that include the technologies in a previouslyfound strategy as a subset of Jk. Different types of cuts can beused if it is allowed to have Jl 3 Jk for some l < k.
The procedure for the identication of K alternative strate-gies, aer we solve Mqc once to obtain J0, is as follows:
0. Choose K; set k ¼ 1;1. Solve Mk
qc; obtain Jk; i.e., the kth alternative strategy;2. If k < K, set k ¼ k + 1 and go to 1.
5.3 Strategy analysis
Aer we identify a set of alternatives, we can perform costcontribution and sensitivity analyses on the results. For theminimum cost problem with ui0 ¼ 1, the objective functionessentially gives the total production cost (TPC). By breakingdown TPC into individual contributors (e.g., feedstock andtechnologies), we can identify the major cost drivers. Also, wecan carry out a sensitivity analysis on the major parameters tounderstand the effects of their variations on the objectivefunction value.
Furthermore, based on the technology uncertainty levelsdiscussed in Section 3.3, we can determine an interval for thetotal production cost, TPCk, of strategy k,
TPCk ˛
264
Pi˛IF
liPki þ
Pj˛Jk
�1� xj
�rjX
kj
SkiðkÞ
;
Pi˛IF
liPki þ
Pj˛Jk
�1þ xj
�rjX
kj
SkiðkÞ
375
(14)
where Jk is the subset of technologies included in strategy k (i.e.,the strategy identied at iteration k by model Mk
qc); xj ˛ {10%,30%, 50%} is the cost uncertainty of technology j; Pki and Xk
j arethe values of variables Pi and Xj in the optimal solution of modelMk
qc (or modelMqc for k¼ 0); and Ski(k) is the value of variable Si(k)in the optimal solution ofMk
qc, where i(k) is the primary productof strategy k.
This journal is ª The Royal Society of Chemistry 2013
Analysis Energy & Environmental Science
5.4 Sensitivity analysis
The focus of this paper is on the development of a frameworkfor the study of conversion strategies. While our frameworkallows us to study how technological uncertainty impacts theeconomics of the most promising strategies, there are a numberof other factors that play a key role in the development andadoption of biofuel strategies, most notably, constraints origi-nating from the cultivation of biomass, the existing trans-portation fuel infrastructure, and the market of fuels (andchemicals). One way to study the effect of these factors isthrough sensitivity analysis. For example, we can calculate howthe total production cost of a set of strategies changes as theprice of feedstock changes and determine the threshold valuesat which the optimal strategy changes. Similar analyses can beperformed for other parameters, such as the price of by-prod-ucts, which impacts the economics of a strategy through the by-product credit.
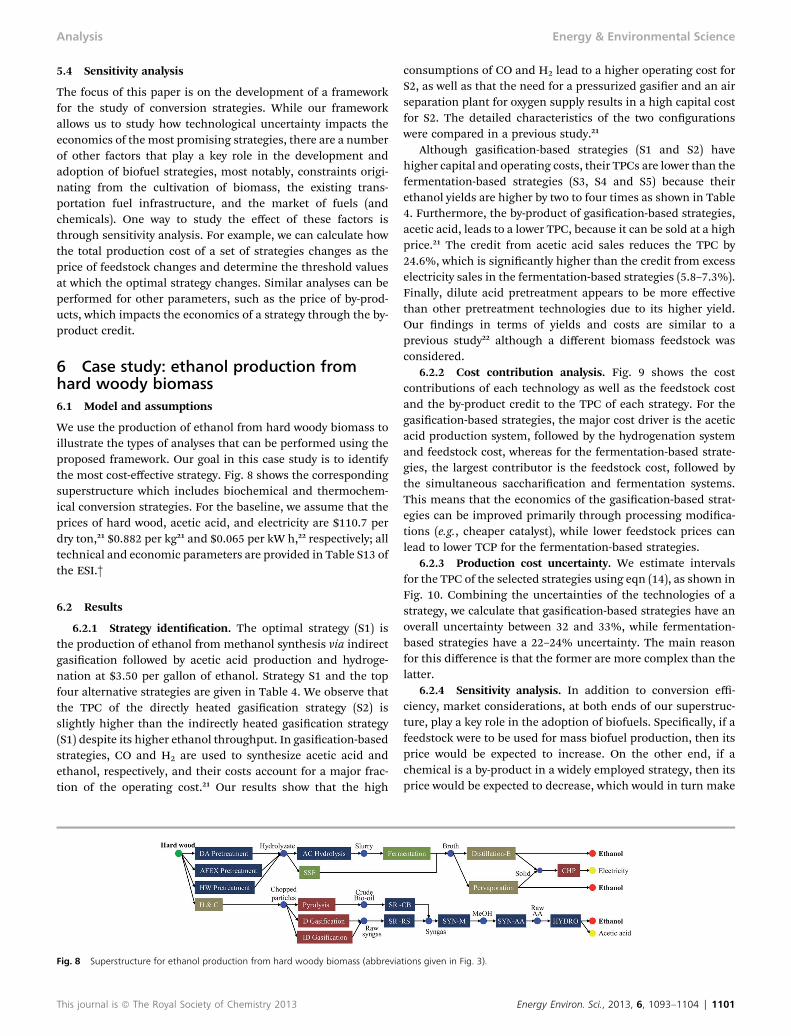
6 Case study: ethanol production fromhard woody biomass6.1 Model and assumptions
We use the production of ethanol from hard woody biomass toillustrate the types of analyses that can be performed using theproposed framework. Our goal in this case study is to identifythe most cost-effective strategy. Fig. 8 shows the correspondingsuperstructure which includes biochemical and thermochem-ical conversion strategies. For the baseline, we assume that theprices of hard wood, acetic acid, and electricity are $110.7 perdry ton,21 $0.882 per kg21 and $0.065 per kW h,22 respectively; alltechnical and economic parameters are provided in Table S13 ofthe ESI.†
6.2 Results
6.2.1 Strategy identication. The optimal strategy (S1) isthe production of ethanol from methanol synthesis via indirectgasication followed by acetic acid production and hydroge-nation at $3.50 per gallon of ethanol. Strategy S1 and the topfour alternative strategies are given in Table 4. We observe thatthe TPC of the directly heated gasication strategy (S2) isslightly higher than the indirectly heated gasication strategy(S1) despite its higher ethanol throughput. In gasication-basedstrategies, CO and H2 are used to synthesize acetic acid andethanol, respectively, and their costs account for a major frac-tion of the operating cost.21 Our results show that the high
Fig. 8 Superstructure for ethanol production from hard woody biomass (abbrevia
This journal is ª The Royal Society of Chemistry 2013
consumptions of CO and H2 lead to a higher operating cost forS2, as well as that the need for a pressurized gasier and an airseparation plant for oxygen supply results in a high capital costfor S2. The detailed characteristics of the two congurationswere compared in a previous study.21
Although gasication-based strategies (S1 and S2) havehigher capital and operating costs, their TPCs are lower than thefermentation-based strategies (S3, S4 and S5) because theirethanol yields are higher by two to four times as shown in Table4. Furthermore, the by-product of gasication-based strategies,acetic acid, leads to a lower TPC, because it can be sold at a highprice.21 The credit from acetic acid sales reduces the TPC by24.6%, which is signicantly higher than the credit from excesselectricity sales in the fermentation-based strategies (5.8–7.3%).Finally, dilute acid pretreatment appears to be more effectivethan other pretreatment technologies due to its higher yield.Our ndings in terms of yields and costs are similar to aprevious study22 although a different biomass feedstock wasconsidered.
6.2.2 Cost contribution analysis. Fig. 9 shows the costcontributions of each technology as well as the feedstock costand the by-product credit to the TPC of each strategy. For thegasication-based strategies, the major cost driver is the aceticacid production system, followed by the hydrogenation systemand feedstock cost, whereas for the fermentation-based strate-gies, the largest contributor is the feedstock cost, followed bythe simultaneous saccharication and fermentation systems.This means that the economics of the gasication-based strat-egies can be improved primarily through processing modica-tions (e.g., cheaper catalyst), while lower feedstock prices canlead to lower TCP for the fermentation-based strategies.
6.2.3 Production cost uncertainty. We estimate intervalsfor the TPC of the selected strategies using eqn (14), as shown inFig. 10. Combining the uncertainties of the technologies of astrategy, we calculate that gasication-based strategies have anoverall uncertainty between 32 and 33%, while fermentation-based strategies have a 22–24% uncertainty. The main reasonfor this difference is that the former are more complex than thelatter.
6.2.4 Sensitivity analysis. In addition to conversion effi-ciency, market considerations, at both ends of our superstruc-ture, play a key role in the adoption of biofuels. Specically, if afeedstock were to be used for mass biofuel production, then itsprice would be expected to increase. On the other end, if achemical is a by-product in a widely employed strategy, then itsprice would be expected to decrease, which would in turn make
tions given in Fig. 3).
Energy Environ. Sci., 2013, 6, 1093–1104 | 1101

Table 4 Alternative strategies for ethanol production; TCC: total capital cost, TOC: total operating cost, TPC: total production cost; calculations based on processing2000 dry tons of aspen wood per daya
Product(gal/h)
By-product(/gal ethanol)
TCC(M$)
TOC(M$/year)
TPC($/gal)
S1 Hard wood/H&C/ ID gasication/SR-RS / SYN-M / SYN-AA / HYDRO
11 225 Acetic acid (1.29 kg) 567 261 3.50
S2 Hard wood / H&C / D gasication /SR-RS / SYN-M / SYN-AA / HYDRO
15 860 Acetic acid (1.29 kg) 644 449 3.70
S3 Hard wood / DA pretreatment / SSF/ distillation-E
5425 Electricity (3.40 kW h) 372 94 4.38
S4 Hard wood/ AFEX pretreatment/ SSF/ distillation-E
4554 Electricity (5.11 kW h) 271 84 4.66
S5 Hard wood / HW pretreatment / SSF/ distillation-E
3840 Electricity (5.40 kW h) 329 81 5.64
a Abbreviations given in Fig. 3.
Fig. 9 Cost contributions in alternative strategies; abbreviations given in Fig. 3.
Energy & Environmental Science Analysis
the specic strategy less attractive. To study these effects, wecarry out sensitivity analyses for the hard woody biomass priceand the price of the acetic acid, which is a by-product of thegasication process.
The TPC of fermentation-based strategies is sensitiveto variations in the feedstock price as shown in Fig. 11a.
Fig. 10 TPC intervals for the selected strategies.
1102 | Energy Environ. Sci., 2013, 6, 1093–1104
When the feedstock price decreases, the TPC of the fermen-tation-based strategies decreases rapidly compared to thegasication-based strategies. At prices below $18 per dry ton,S4 becomes the most cost-effective strategy, while ethanolproduction through S2 is expected to have the least cost atprices higher than $160 per dry ton. Sensitivity analysisresults with respect to the acetic acid price for the gasication-based strategies are shown in Fig. 11b. A 36% increase inthe price ($1.2 per kg) decreases the TPC by 11.1–11.4%(3.11 $ per gal and 3.28 $ per gal for S1 and S2, respectively).On the other hand, when the acetic acid price is less than$0.15/kg, S3 leads to a lower TPC than that of gasication-based strategies.
Fig. 11 Sensitivity analyses with respect to (a) feedstock and (b) acetic acidprices.
This journal is ª The Royal Society of Chemistry 2013

Analysis Energy & Environmental Science
It is important to note that while sensitivity analysis isuseful, it does not fully capture the relationship between theoptimization decisions (adoption of strategy and correspondingfeedstock consumption) and the variability of the parameter(feedstock price). Specically, it does not account for theendogenously generated price change. A rigorous treatment ofthis subject would require the modeling of this interaction, butthis is beyond the scope of this conversion-centric framework.
7 Conclusions
We developed a framework for the systematic assessment ofbiomass-to-fuel conversion strategies. Our framework is basedon a superstructure of technologies that have been reported inthe literature as well as technologies that can be developed inthe future. Based on this superstructure, we developed two typesof optimization models that allow us to: (i) generate novelstrategies combining technologies that were previously thoughtto belong in parallel production systems; (ii) assess strategiesbased on a range of criteria; (iii) identify a set of promisingalternative strategies; and (iv) perform sensitivity analysisstudies with respect to external (e.g., feedstock process) andinternal (e.g., technology maturity) parameters. These modelscan be used to examine a wide range of questions.
Our framework establishes a methodology and suite of toolsfor the systematic comparison of competing strategies, theidentication of technology gaps and cost drivers in existingstrategies as well as synergies between distinct strategies. It alsoenables us to study trade-offs and assess the impact of tech-nology uncertainty. We hope that researchers in the eld ofbiofuels will not only use our framework to explore new strat-egies, but also help us enrich it with emerging conversiontechnologies and improve it with more accurate data whereappropriate. We are currently developing a soware tool thatwill allow users with no optimization background to use iteffectively. Also, building upon this work, we will extend ourframework to study combinations of feedstocks and/or combi-nations of nal products, include life cycle assessment (LCA)methods,59 study the effect of biomass supply chain as well asmarket constraints, and employ more rigorous approaches tostudy the impact of uncertainty.
NomenclatureParameter evaluation
a
This journal
scaling exponent for technology capacity adjustment
3 time-value adjustment factor Cn capital cost of new technology Cp adjusted capital cost of existing technology Cpo capital cost of baseline design n lifetime of plant Q adjusted capacity of existing technology Qo capacity of baseline design r interest rate Rn amount of reactant in new technology Rp amount of reactant in existing technology ACC amortized capital cost [$ per year]is ª The Royal Society of Chemistry 2013
APR
annual production rate [kg per year] CCF capital charge factor TCC total capital cost of technology [$] TOC total operating cost of technology [$ per year] UPC unit production cost of technology [$ per kg] TPC total production cost for a strategy [$ per kg].Mathematical programming model
Sets.
i ˛ I
compounds j ˛ J technologies.Subsets.
IF/II/IP/IB
feedstocks/intermediates/nal products/by-products J+i /J�i
technologies producing/consuming compound iJl/Jk
technologies included in the strategy identied initeration l/k.Parameters.
bj
maximum capacity for technology j gi minimum purchase of feedstock i ˛ IFdi
availability of feedstock i ˛ IFhij
yield of compound i in technology j li price of compound i xj cost uncertainty of technology j rj unit production cost of technology j yj unit energy requirement level of technology j 4i heating value of compound i ui demand for product i ˛ IP.Binary variables.
Yj
¼ 1, if technology j is selected.Continuous (non-negative) variables.
Pi
amount of compound i ˛ IF purchased Si amount of compound i ˛ IPWIB sold Xj production level of technology j.Acknowledgements
This work was supported by the Department of Energy throughthe Great Lakes Bioenergy Research Center (DOE Office ofScience BER DE-FC02-07ER64494).
References
1 N. Sammons Jr, M. Eden, W. Yuan, H. Cullinan and B. Aksoy,Environ. Prog., 2007, 26, 349–354.
2 A. C. Kokossis and A. Yang, Comput. Chem. Eng., 2010, 34,1397–1405.
3 G. Tomlinson, D. Gray, C. White, M. Ackiewicz, E. Schmetzand J. Winslow, DOE/NETL-2007/1298, 2007.
Energy Environ. Sci., 2013, 6, 1093–1104 | 1103

Energy & Environmental Science Analysis
4 W. F. Banholzer, K. J. Watson and M. E. Jones, Chem. Eng.Prog. Mag., 2008, C7–C14.
5 World Proved Reserves of Oil and Natural Gas, US EnergyInformation Administration (EIA) Report, 2007.
6 J. H. Clark, J. Chem. Technol. Biotechnol., 2007, 82, 603–609.7 C. H. Christensen, J. Rass-Hansen, C. C. Marsden,E. Taarning and K. Egeblad, ChemSusChem, 2008, 1, 283–289.
8 B. Bao, D. K. S. Ng, M. El-Halwagi and D. H. S. Tay, Session:Sustainability and Sustainable. Bioreneries (490ah) AIChEAnnual Meeting, Nashville, TN, 2009.
9 Y. H. Zhang and L. R. Lynd, Biotechnol. Bioeng., 2004, 88,797–824.
10 M. Taherzadeh and K. Karimi, Bioresources, 2007, 2, 707–738.11 A. Demirbas, Prog. Energy Combust. Sci., 2007, 33, 1–18.12 C. A. Cardona and O. J. Sanchez, Bioresour. Technol., 2007,
98, 2415–2457.13 J. Sadhukhan, M. A. Mustafa, N. Misailidis, F. Mateos-
Salvador, C. Du and G. M. Campbell, Chem. Eng. Sci., 2008,63, 503–519.
14 L. F. Gutierrez, O. J. Sanchez and C. A. Cardona, Bioresour.Technol., 2009, 100, 1227–1237.
15 M. Wright and R. C. Brown, Biofpr, 2007, 1, 191–200.16 T. Werpy and G. Petersen, DOE/GO-102004–1992, 2004.17 J. E. Holladay, J. J. Bozell, J. F. White and D. Johnson, DE-
AC05–76RL01830, 2007.18 G. W. Huber, S. Iborra and A. Corma, Chem. Rev., 2006, 106,
4044–4098.19 S. A. Hosseini and N. Shah, Chem. Eng. Res. Des., 2009, 87,
1251–1260.20 C. Piccolo and F. Bezzo, Biomass Bioenergy, 2009, 33, 478–
491.21 S. Jones, Y. Zhu and C. C. Valkenburg, PNNL-18482, 2009.22 F. K. Kazi, J. A. Fortman, R. P. Anex, G. Kothandaraman,
D. D. Hsu, A. Aden and A. Dutta, NREL/TP-6A2–46588, 2010.23 F. K. Kazi, J. A. Fortman, R. P. Anex, D. D. Hsu, A. Aden,
A. Dutta and G. Kothandaraman, Fuel, 2010, 89, S20–S28.24 S. A. Hosseini, R. Lambert, S. Kucherenko and N. Shah,
Energy Fuels, 2010, 24, 4673–4680.25 D. J. Braden, C. A. Henao, J. Heltzel, C. T. Maravelias and
J. A. Dumesic, Green Chem., 2011, 13, 1755–1765.26 S. M. Sen, C. A. Henao, D. J. Braden, J. A. Dumesic and
C. T. Maravelias, Chem. Eng. Sci., 2012, 67, 57–67.27 R. P. Anex, A. Aden, F. K. Kazi, J. Fortman, R. M. Swanson,
M. M. Wright, J. Satrio, R. C. Brown, D. E. Daugaard,A. Platon, G. Kothandaraman, D. D. Hsu and A. t. Dutta,Fuel, 2010, 89, S29–S35.
28 T. R. Brown, M. Wright and R. C. Brown, Biofpr, 2011, 5, 54–68.
29 S. Phillips, A. Aden, J. Jechura, D. Dayton and T. Eggeman,NREL/TP-510–41168, 2007.
30 Y. Zhu and S. Jones, PNNL-18483, 2009.31 M. Gassner and F. Marechal, Comput. Chem. Eng., 2009, 33,
769–781.32 R. M. Swanson, A. Platon, J. A. Satrio and R. C. Brown, Fuel,
2010, 89, S11–S19.
1104 | Energy Environ. Sci., 2013, 6, 1093–1104
33 Biomass Research and Development Board (Board), TheEconomics of Biomass Feedstocks in the United States: Areview of the literature, 2008.
34 L. K. James, S. M. Swinton and K. D. Thelen, Agron. J., 2010,102, 675–687.
35 E. D. Larson, S. Consonni, S. Napoletano, R. E. Katofsky,K. Iisa and J. Frederick, Final Report DE-FC26–04NT42260,2006.
36 V. Dornburg, A. P. C. Faaij and B. Meuleman, Resour.,Conserv. Recycl., 2006, 49, 68–88.
37 S. N. Naik, V. V. Goud, P. K. Rout and A. K. Dalai, RenewableSustainable Energy Rev., 2010, 14, 578–597.
38 V. Chambost and P. R. Struart, Ind. Biotechnol., 2007, 3, 112–119.
39 M. Pfeffer, W. Wukovits, G. Beckmann and A. Friedl, Appl.Therm. Eng., 2007, 27, 2657–2664.
40 E. Ahmetovic, M. Martın and I. E. Grossmann, Ind. Eng.Chem. Res., 2010, 49, 7972–7982.
41 V. Dornburg and A. P. C. Faaij, Resour., Conserv. Recycl.,2006, 48, 227–248.
42 B. Palsson, S. Fathi-Afshar, D. F. Rudd and E. N. Lightfoot,Science, 1981, 213, 513–517.
43 A. Jimenez and O. Chavez, Chem. Eng. J., 1988, 37, B1–B15.44 A. C. Dimian, Comput.-Aided Chem. Eng., 2007, 24, 309–318.45 S. Fernando, S. Adhikari, C. Chandrapal and N. Murali,
Energy Fuels, 2006, 20, 1727–1737.46 P. R. Stuart and M. El-Halwagi, Integrated Bioreneries:
Design, Analysis, and Optimization, CRC Press, Florida, 2012.47 L. R. Lynd, C. Wyman, M. Laser, D. Johnson and R. Landucci,
NREL/SR-510–35578, 2005.48 B. Kamm and M. Kamm, Bioreneries—multi product
processes, in White Biotechnology, ed. R. Ulber and D. Sell,Berlin/Heidelberg, Springer, 2007, vol. 105, pp. 175–204.
49 D. Beck, K. Boyack and M. Berman, SAND98–0643, 1997.50 L. R. Lynd and M. Q. Wang, J. Ind. Ecol., 2004, 7, 17–32.51 R. Kempener, J. Beck and J. Petrie, J. Ind. Ecol., 2009, 13, 284–
305.52 R. M. Bright and A. H. Stromman, J. Ind. Ecol., 2009, 13, 514–
531.53 R. M. Bright, A. H. Stromman and T. R. Hawkins, J. Ind. Ecol.,
2010, 14, 422–439.54 F. Cherubini, G. Jungmeier, M. Wellisch, T. Willke,
I. Skiadas, R. V. Ree and E. D. Jong, Biofuels, Bioprod.Bioren., 2009, 3, 534–546.
55 A. Aden, M. Ruth, K. Ibsen, J. Jechura, K. Neeves, J. Sheehan,and B. Wallace, NREL/TP-510–32438, 2002.
56 New Jersey Agricultural Experiment Station (NJAES), NJAESReport 2007-1, 2007.
57 ICS-UNIDO, Book-06-2007, 2007, http://www.ics.trieste.it/ics-activities/ics-publications/archive/book-06-07.aspx.
58 D. F. Rudd, S. Fathi-Afshar, A. A. Trevino and M. A. Staderr,Petrochemical technology assessment, Wiley-Interscience, NewYork, 1981.
59 Waste reduction (WAR)algorithmVersion1.0.17, Environmentalprotection agency (USEPA),Washington,DC, http://www.epa.gov/nrmrl/std/cppb/war/sim_war.htm.
This journal is ª The Royal Society of Chemistry 2013