enabling the insight-driven enterprise implementing a bi and analytic platform to deliver actionable...
TRANSCRIPT

Enabling the Insight-Driven Enabling the Insight-Driven EnterpriseEnterprise
Implementing a BI and Analytic Platform to Deliver Actionable
Business Insight

AgendaAgenda
Business Drivers and Pain Points Oracle Solution
Oracle Warehouse Builder Oracle Business Intelligence Oracle Analytic Applications Oracle EPM
BI Rationalization and rBix Summary/Contact Info

BI & Analytics Challenges

Source: CIO Insight, “The Future of I.T.: What's on Tap for 2007 and Beyond,” January 16, 2007

BI Today - Islands of InformationBI Today - Islands of Information
Siloed BI deployments across apps and departments Fragmented view of information No consistent definition of business metrics
Are metrics such as product profitability, customer lifetime value, and marketing campaign ROI calculated consistently?
Each analyst with a BI tool may have their own answer
Report-centric model with backlog of new requests in IT Top management requests get first priority, while needs of
other Business users go unmet
Few users have timely and actionable information needed to optimize actions and decisions Particularly middle management and “front line” users

Top BI ChallengesTop BI Challenges
48.2%
40.8%
37.6%
35.9%
24.5%
21.2%
15.1%
10.2%
2.9%
1.6%
0% 10% 20% 30% 40% 50% 60%
Data resides in disparate systems
Data is often incomplete or has errors
We don’t get information fast enough to take action
Employees are too busy to use business intelligence tools
Employees receive too much unnecessary business data
Corporate executives do not understand the need foremployees to have access to business intelligence tools
Our business intelligence tools are too complicated
Corporate executives are unwilling to share data withexternal third parties.
Other, please specify
None of the above; there are no challenges

The IT DilemmaThe IT Dilemma
IT WANTS
Fewer tools
User self-service
Secure systems
BUSINESS USERS WANT
Flexibility & choice
Insight & alignment
Relevant access

How do I proactively manage risks of my receivables portfolio?
How does supplier performance impact customer satisfaction and revenue?
Ser
vice
S
ervi
ce
Customers
Sal
esS
ales
Mar
keti
ng
Mar
keti
ng
Dis
trib
uti
on
Dis
trib
uti
on
Fin
ance
Fin
ance
HR
/ W
ork
forc
eH
R /
Wo
rkfo
rce
Op
erat
ion
sO
per
atio
ns
Pro
cure
men
tP
rocu
rem
ent
Customers
Customers
Suppliers
Suppliers
Suppliers
Advanced Analysis Often Spans Advanced Analysis Often Spans Heterogeneous Data SourcesHeterogeneous Data Sources
How does call center agent tenure, training, & compensation affect efficiency and cross-selling performance?

Two Kinds of QuestionsTwo Kinds of Questions
What is our performance?
What are the top 10 markets?
What is the gap to forecast?
What customers are most profitable?
What are revenues by product compared to last year?
What are sales by product, store and quarter?
What is the trend for employee-related costs?
What is our open headcount?
How can we improve performance?
What if we increase promotional lift by 10% in our major markets?
What happens to our forecast if the dollar declines by 5% to the Euro?
What happens to gross margin if our materials costs increase by 20%?
Which customers drive 80% of our overall profitability?
What happens to same store sales if inventory turns increase by 5%?
Situational Forward-looking

The BI ContinuumThe BI Continuum
Ad-Hoc Query& Reporting
Standardized Reporting
AdvancedAnalytics
Modeling
Future Oriented
Operational Static
Strategic Dynamic
Past Oriented

The BI ContinuumThe BI Continuum
Which customers spend the most?
What did this customer buy?Which customers are most profitable?
What if demand falls short of forecast?
What if we rolled out this product nationwide?
Will our cash balances take us through this crisis?
What is the Q4 revenue forecast?
Future OrientedPast Oriented
Operational Static
Strategic Dynamic

Another View: The “BI Pyramid”Another View: The “BI Pyramid”
Standardized Reporting
DashboardsPublishingPixel-perfect

Modeling
Standardized Reporting
DashboardsPublishingPixel-perfect
What-ifScenariosAllocations
Another View: The “BI Pyramid”Another View: The “BI Pyramid”

Modeling
Standardized Reporting
DashboardsPublishingPixel-perfect
Customer Profitability Demand Planning Brand Valuation Loan Default Risk Store Profitability
Promotional ResponseFinancial PlanningSupply Chain
OptimizationCustomer ChurnWorkforce Planning
What-ifScenariosAllocations
Another View: The “BI Pyramid”Another View: The “BI Pyramid”

The Insight GapThe Insight Gap
BusinessInsight
Gap
WHAT
HOW
OLAPServers
BI Server
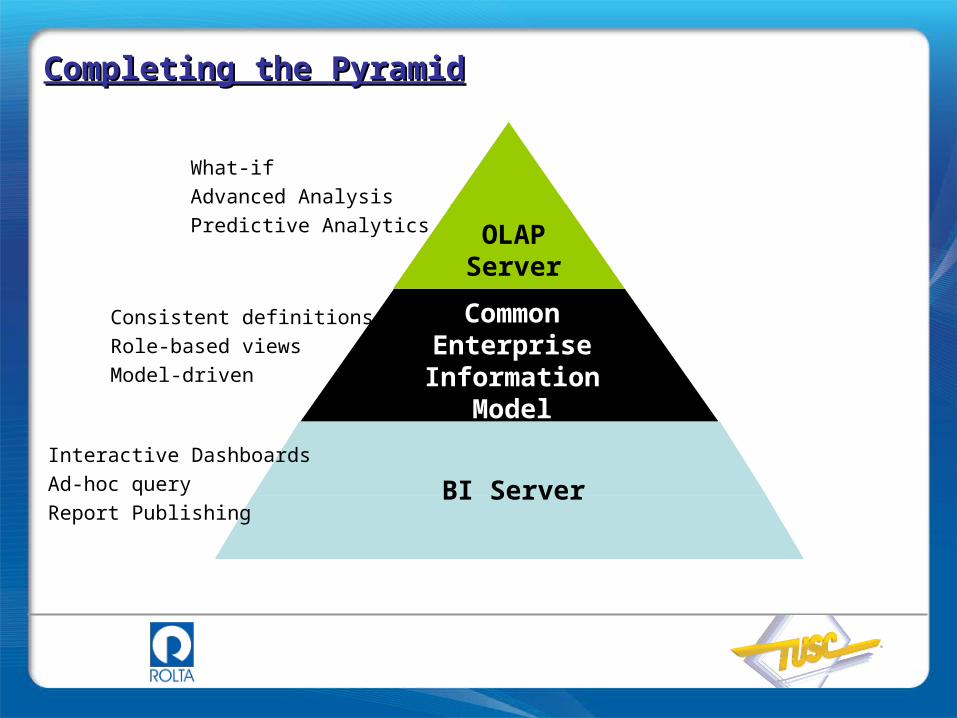
Completing the PyramidCompleting the Pyramid
OLAP Server
BI Server
CommonEnterprise Information
Model
Consistent definitions
Role-based views
Model-driven
What-if
Advanced Analysis
Predictive Analytics
Interactive Dashboards
Ad-hoc query
Report Publishing

Oracle BI & Analytics Solution

Goal: the Insight-Driven EnterpriseGoal: the Insight-Driven Enterprise
1. Empower Everyone – Every person is provided with relevant, complete information tailored to their role.
2. Provide Real-time Intelligence – Deliver insight that predicts the best next step, and deliver it in time to influence the business outcome
3. Use Insight to Guide Actions – lead people to take action based on facts to optimize decisions, actions and customer interactions
Becoming an insight-driven enterprise will drive the next level of value creation and competitive advantage for organizations.
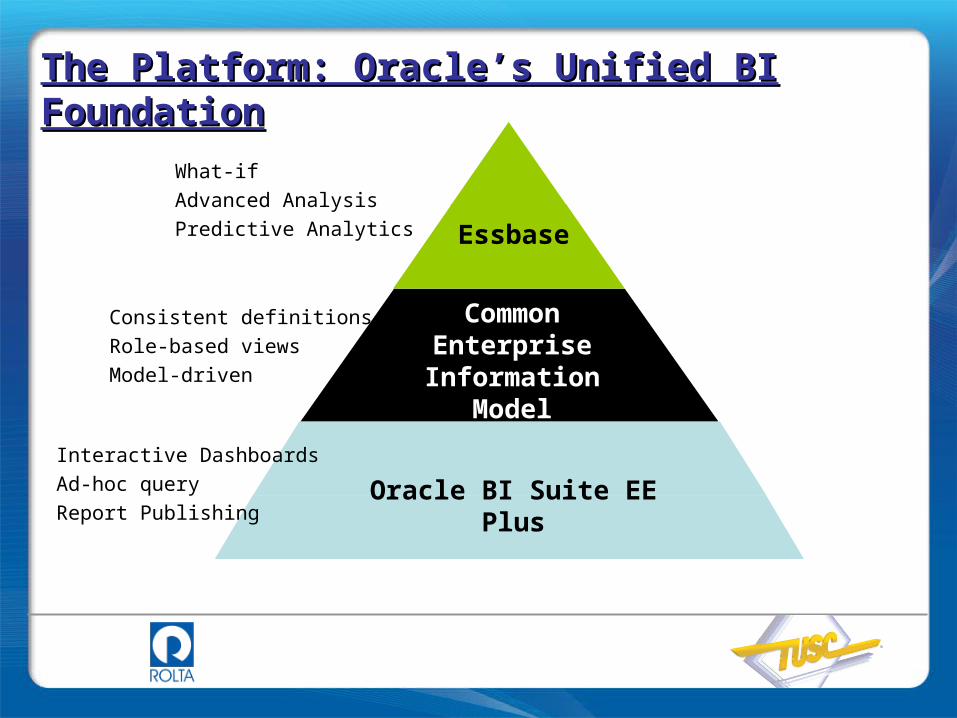
The Platform: Oracle’s Unified BI The Platform: Oracle’s Unified BI FoundationFoundation
Essbase
Oracle BI Suite EE Plus
CommonEnterprise Information
Model
Consistent definitions
Role-based views
Model-driven
What-if
Advanced Analysis
Predictive Analytics
Interactive Dashboards
Ad-hoc query
Report Publishing

Essbase OLAP ServerEssbase OLAP ServerFlexible, Powerful, Modeling Across SourcesFlexible, Powerful, Modeling Across Sources
Flexible business model definition
Advanced calculation & integration engine
Fast “speed-of-thought” calculation power
Leading Excel user interface
Powerful Visual analysis Mission critical scalability
and performance
Oracle BIEE Plus Presentation Services
Essbase Server
Native RDBMSOracleSQL ServerDB2Teradata
Multi-dimensionalOracle OLAPMicrosoftSAP BW
OtherXMLExcelText
Optimized Multidimensional storageOver 300 analytic functionsFinancial, Time and Calendar
intelligenceTrickle feedRead/Write/WritebackEnterprise scale
Office

Common Enterprise Information ModelCommon Enterprise Information ModelEnables Consistency, Security, Reuse, FlexibilityEnables Consistency, Security, Reuse, Flexibility
User Roles, PreferencesSimplified ViewLogical SQL Interface
PRESENTATION LAYER
DimensionsHierarchiesMeasuresCalculationsAggregation RulesTime Series
SEMANTIC OBJECT LAYER
PHYSICAL LAYER
Map Physical DataConnectionsSchema
Role-Based Views of the Information Relevant to the User
Consistent Definition of Business Measures, Metrics, Calculations
Model Once, Deploy Everywhere
Across Any Data Sources
BUSINESS BENEFITSConsistent, Accurate InformationBusiness User Self ServiceChoice of Front End ToolsRole-Based, Secure AccessTransparent Information Access
TECHNICAL BENEFITSModel Once, Deploy AnywhereReduced User SupportEnables Phased BI StandardizationSupports IT Compliance InitiativesEasier Upgrades & Changes

Copyright © 2008, Oracle and/or its affiliates. All rights reserved. 22
Oracle BI ServerOracle BI ServerSimplified, Powerful, Intelligence Across SourcesSimplified, Powerful, Intelligence Across Sources
Simplified business model view
Advanced calculation & integration engine
Intelligent request generation and optimized, distributed data access
Mission critical scalability and performance
Foundation for all OBIEE presentation services
OPEN SQL INTERFACE
Oracle BIEE Plus Presentation Services
Other 3rd Party Tools
Oracle BI Server
Native RDBMSOracleSQL ServerDB2Teradata
Multi-dimensionalEssbaseOracle OLAPMicrosoftSAP
OtherXMLExcelText
Simplified Business ViewUnified MetadataIntelligent CachingAdvanced CalculationsAggregate Navigation & CreationFederated Query and Integration Optimized SQL/Function Shipping

Oracle BI Suite Enterprise Edition PlusOracle BI Suite Enterprise Edition PlusPervasive Information DeliveryPervasive Information Delivery
OLTP & ODSSystems
DataWarehouseData Mart
SAP, OraclePeopleSoft, Siebel,
Custom Apps
FilesExcelXML
BusinessProcess
Financial Performance Management Applications
InsightPerformance
Action
SetGoals
Plan
Monitor
Analyze
Report
Align
HyperionEssbase
Oracle BI Server
Common Enterprise Information Model
Reporting & Publishing
Financial ReportingBI Publisher
Interactive Reporting
SQR Production Reporting
Web Analysis
Ad hoc Analysis
ProactiveDetectionand Alerts
Microsoft Office
Interactive Dashboards

Oracle Enterprise Performance Management SystemOracle Business Intelligence Foundation
Hot-Pluggable With Existing IT Hot-Pluggable With Existing IT InvestmentsInvestments
OracleKerberosiPlanetMSFT ADNovellCustom Others ..
Oracle Data Integrator (Sunopsis)Oracle Warehouse BuilderInformaticaAscentialOthers ..
Any JSR 168 Portal Oracle Data Mining, SPSS, SAS
Oracle EBS, Siebel, SAP, PeopleSoft, JD Edwards ..
Excel, Outlook,Lotus Notes ..
Oracle RDBMSOracle OLAP OptionMicrosoft SQL Server & Analysis ServicesIBM DB2TeradataEssbaseSAP BWXML, Excel, Text
Portals Data Mining Applications Desktop Tools
Security Data Access Data Integration

Ad-hoc Query CapabilityAd-hoc Query Capability
Comprehensive subject areas available for Ad-hoc analysis
New Calculated Fields Available within
Market Leading BI Toolset
Easy to use Charting tool
Formatting Widgets Highlighting Multi-language

Integrated SecurityIntegrated Security
• Launch Oracle OBI EE dashboard from Application Navigator
• Shared responsibilities between Oracle EBS and Oracle OBI EE
• Sign in only once in EBS

Tight Integration with Oracle Apps Tight Integration with Oracle Apps Extends BI Value, Lowers TCOExtends BI Value, Lowers TCO
View performance “in-context” with budgets and plans
INTEGRATED WITH PLANNING AND EPMS
Seamless navigation from analytical information to transactional detail
ACTION LINKS – “INSIGHT TO ACTION”
One login. Right content for each user.
INTEGRATED SECURITY
Data Security
UserSecurity
ObjectSecurity
BPEL, ESB Oracle BI
Intelligence-driven business processes
INTEGRATED WORKFLOW

Prebuilt Oracle BI ApplicationsPrebuilt Oracle BI ApplicationsMulti-Source Analytics with Single ArchitectureMulti-Source Analytics with Single Architecture
Travel& TransTravel
& TransAutoAuto Comms& MediaComms& Media
ComplexMfg
ComplexMfg
ConsumerSector
ConsumerSector EnergyEnergy Financial
ServicesFinancialServices
HighTechHighTech
Insurance& Health
Insurance& Health
LifeSciences
LifeSciences
Public SectorPublic Sector
Other Operational & Analytic Sources
Oracle BI Suite Enterprise Edition
Prebuilt adapters:
Sales MarketingOrder
Management& Fulfillment
Supply Chain
FinancialsHuman
Resources
PipelineAnalysis
TriangulatedForecasting
Sales Team Effectiveness
Up-sell / Cross-sell
Cycle TimeAnalysis
Lead Conversion
Employee Productivity
Compensation Analysis
HR Compliance Reporting
WorkforceProfile
TurnoverTrends
Return on Human Capital
A/R & A/PAnalysis
GL / BalanceSheet Analysis
Customer & ProductProfitability
P&L Analysis
ExpenseManagement
Cash FlowAnalysis
Supplier Performance
Spend Analysis
Procurement Cycle Times
Inventory Availability
EmployeeExpenses
BOM Analysis
OrderLinearity
Ordersvs. Available
Inventory
Cycle TimeAnalysis
BacklogAnalysis
FulfillmentStatus
CustomerReceivables
Campaign Scorecard
Response Rates
Product Propensity
Loyalty andAttrition
Market Basket Analysis
Campaign ROI
Service &Contact Center
Churn Propensity
Customer Satisfaction
ResolutionRates
Service RepEffectiveness
Service CostAnalysis
ServiceTrends

Pre-mapped metadata, including embedded best practice calculations and metrics for Financial, Executives and other Business Users.
Presentation Layer Logical Business
Model Physical Sources
3
Prebuilt ETL to extract data from over 3,000 operational tables and load it into the DW, sourced from SAP, PSFT, and other sources.
2 A “best practice” library of over 350 prebuilt metrics, Intelligent Dashboards, Reports and alerts for CFO, Finance Controller, Financial Analyst, AR/AP Managers and Executives
4
Prebuilt warehouse with more than 15 star-schemas designed for analysis and reporting on Financial Analytics
1
Example: Oracle Financial AnalyticsExample: Oracle Financial Analytics

Lower TCO, Faster ROI: Tools vs Lower TCO, Faster ROI: Tools vs ApplicationsApplications
Federated Data Sources
SiebelOracle SAP R/3
PSFT EDW
Other
ETL
DW
Oracle BI Platform
& Metadata
BI contentBI content
Comparison Points
Prebuilt BI Applicatio
ns Approach
Tools & Build
Approach
BI Content
Metadata Data Warehouse ETL

Build from Scratchwith Traditional BI Tools Oracle BI Applications
Prebuilt Business Adapters for Oracle, PeopleSoft, Siebel, SAP, others
Prebuilt DW design, adapts to your EDW
Role-based dashboards and thousands of pre-defined metrics
Easy to use, easy to adapt
Weeks or Months
Back-end ETL andMapping
DW Design
Define Metrics& Dashboards
Back-end ETL andMapping
DW Design
Define Metrics& Dashboards
Training / Roll-out
Training / Rollout
Months or Years
Oracle BI Applicationssolutions approach:
• Faster time to value• Lower TCO• Assured business value
Source: Patricia Seybold Research, Gartner, Merrill Lynch, Oracle Analysis
Change the Economics of BIChange the Economics of BI

Oracle Positioned in Leaders Oracle Positioned in Leaders QuadrantsQuadrants
The Magic Quadrant is copyrighted 2008 by Gartner, Inc. and is reused with permission. The Magic Quadrant is a graphical representation of a marketplace at and for a specific time period. It depicts Gartner's analysis of how certain vendors measure against criteria for that marketplace, as defined by Gartner. Gartner does not endorse any vendor, product or service depicted in the Magic Quadrant, and does not advise technology users to select only those vendors placed in the "Leaders" quadrant. The Magic Quadrant is intended solely as a research tool, and is not meant to be a specific guide to action. Gartner disclaims all warranties, express or implied, with respect to this research, including any warranties of merchantability or fitness for a particular purpose.
These Magic Quadrant graphics were published by Gartner, Inc. as part of larger research notes and should be evaluated in the context of the entire reports. The Gartner reports are available upon request from Oracle.
Sources: Gartner, Inc., “Magic Quadrant for Business Intelligence Platforms, 2008” by James Richardson, Kurt Schlegel, Bill Hostmann, Neil McMurchy, 1 February 2008Gartner, Inc., “Magic Quadrant for CPM Suites, 2006 “ by Nigel Rayner, Neil Chandler, John E. Van Decker, 19 December 2007Gartner, Inc., “Magic Quadrant for Data Warehouse Database Management Systems, 2007” by Donald Feinberg and Mark A. Beyer, 10 October 2007
Magic Quadrant for Business Intelligence
Platforms, 2008
Magic Quadrant for CPM Suites, 2007
Magic Quadrant for Data Warehouse Database
Management Systems, 2007
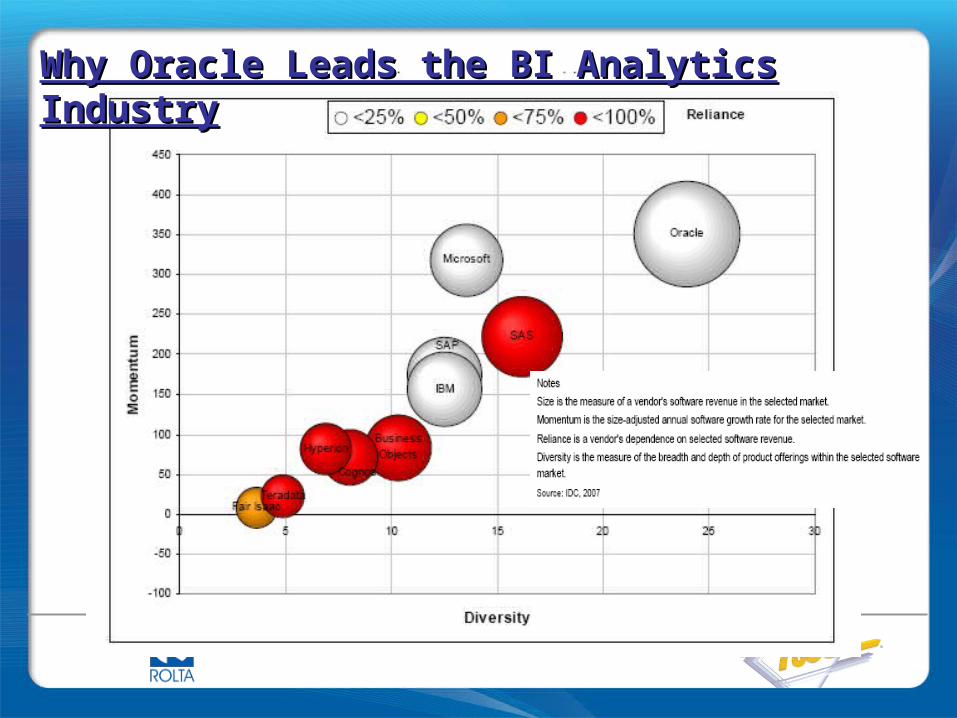
Why Oracle Leads the BI Analytics Why Oracle Leads the BI Analytics IndustryIndustry

Why Enterprise Performance Why Enterprise Performance Management (EPM)?Management (EPM)?
Financial Performance Management
Financials HRSupply Chain ProcurementSales & CRM
Planning & Budgeting
Financial & Statutory Reporting
Metrics & Scorecards
Modeling Financial Management
Operational BI Systems
Operational Business
IntelligenceQuery & Analysis
Dashboards Alerts & Workflow
DataIntegration
OLAPData Warehouse
Enterprise/Operational Reporting
EnterprisePerformanceManagement
SystemTransactional Systems

Based on Michael E. Porter’s Value Chain
Inbound Logistics
Operations Marketing &Sales
ServiceOutbound Logistics
Firm Infrastructure
Human Resource Management
Technology Development
Procurement
Invest to Retire
Source to Procure
Procure to Pay
Order to Cash
Develop to Release
Operational Processes Are Well DefinedOperational Processes Are Well DefinedThat’s Why Customers Implemented ERP/CRM/…That’s Why Customers Implemented ERP/CRM/…

36
But…Management Activities Are Still But…Management Activities Are Still SiloedSiloed
SIX SIGMA
ANALYZE PERFORMANCE
GOAL SETTING
SCORECARDS FINANCIAL REPORTING
FINANCIAL MODELING
VARIANCE ANALYSIS
ROLLING FORECAST OPERATIONAL
PLANNINGMONITOR RESULTS

InsightPerformance
Action
SetGoals
Plan
Monitor
Analyze
Report
Align
The EPM Promise: Insight, The EPM Promise: Insight, Performance, ActionPerformance, Action
Comprehensive
Pervasive
Hot Pluggable

38
EPM Leverages a Comprehensive BI EPM Leverages a Comprehensive BI PlatformPlatform
COMMON ENTERPRISE INFORMATION MODEL
EPM WORKSPACE
Intelligent Request Generation and Optimized Data Access ServicesAdvanced calculation & integration engine
Analytical Modelling & Exploration, Designed by Business Analysts
Responsive to Changing Business Needs
Integrated Security, User Management, Personalization.Mission critical scalability and performance
KPIs DIMENSIONS HIERARCHIES
BI SERVER OLAP SERVER

……That’s Integrated Across the That’s Integrated Across the Technology StackTechnology Stack
OLTP & ODSSystems
Data WarehouseData Mart
SAP, Oracle, Siebel,PeopleSoft, Custom
ExcelXML
BusinessProcessEssbase
Fusion Middleware
Business Intelligence Foundation
Financial Performance Management Applications
Operational BI Applications
Web Office Desktop Mobile Embedded

BI Rationalization

ETLData
warehouseDatabase AnalyticsOLAPReporting Data miningDashboards
Product 1
Product 2
Product 4
Product 3
Prod. 2
Product 5
Pre
2007
2007+
Until recently a company
would have to purchase
multiple tools to meet
information delivery needs.
This is no longer the
case.
Oracle
Problem: Too Many Tools!Problem: Too Many Tools!

TUSC BI Rationalization:TUSC BI Rationalization:Consolidate Multiple BI ToolsConsolidate Multiple BI Tools
Ad Hoc Reporting
Production Reporting
Dashboards**
OLAP
Security
BOBj
Cognos
Actuate
Microstrategy*
OBI
EE
Oracle Answers
Oracle Dashboards
Production Reporting
Financial Reporting
*In process of developing
** Definition needs to be defined per environment

Data and Technology Assessment
Road Map Development
Cleansing Environment
Conversion to Target Platforms
Utilities that automate migration of:
Queries SQL Reports ETL Logic
Data Models Business
Rules Interactivity Universes
TM
TUSC rBix Methodology – ApproachTUSC rBix Methodology – Approach

programmatically reads the BI metadata about each report object in the source system and translates that definition into the target platform’s report object.
rBix Report Metadata Transfer UtilityrBix Report Metadata Transfer Utility