project insight: analytic prototypes
DESCRIPTION
Project Insight: Analytic Prototypes. Summary of Findings: Business Analysis for Category Management Pipeline Performance Management. Corporate Consulting Team December 13, 2004. Expert user (e.g. business analyst). Data producers (e.g. accounting clerk). High. - PowerPoint PPT PresentationTRANSCRIPT
SAP CONFIDENTIAL
Project Insight: Analytic Prototypes
Summary of Findings:Business Analysis for Category Management Pipeline Performance Management
Corporate Consulting TeamDecember 13, 2004
SAP CONFIDENTIAL SAP AG 2004, 041213_Insight/Prototype_Results_Final, CCT / 2
Framework for Discussion
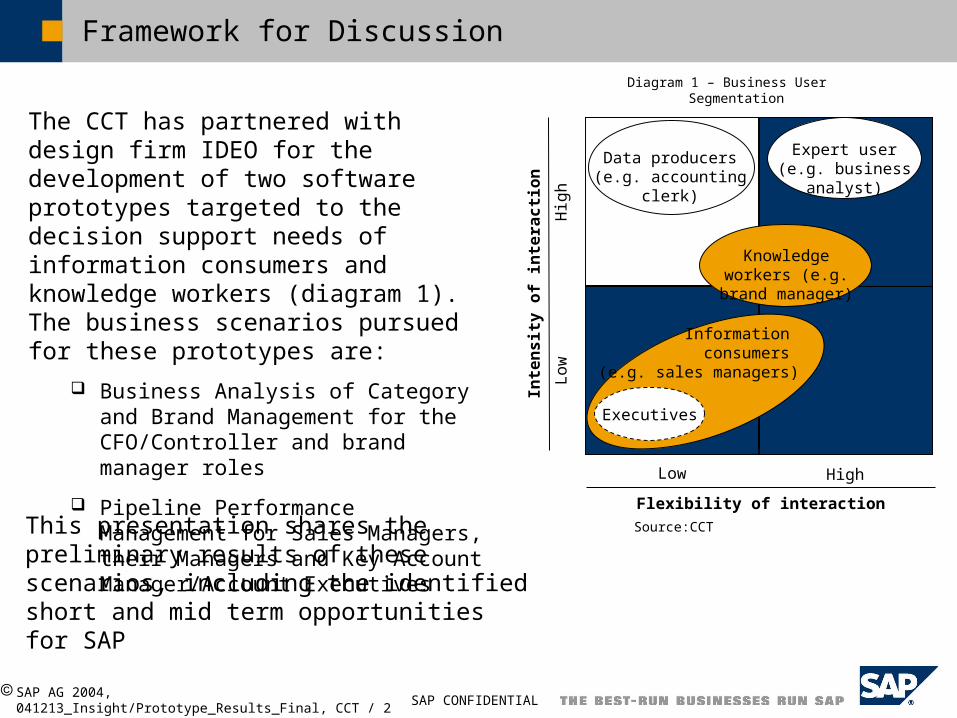
The CCT has partnered with design firm IDEO for the development of two software prototypes targeted to the decision support needs of information consumers and knowledge workers (diagram 1). The business scenarios pursued for these prototypes are:
Business Analysis of Category and Brand Management for the CFO/Controller and brand manager roles
Pipeline Performance Management for Sales Managers, their Managers and Key Account Manager/Account Executives
Inte
ns
ity
of
inte
rac
tio
n
Lo
wH
igh
Flexibility of interaction
Low High
Data producers (e.g. accounting clerk)
Expert user (e.g. business analyst)
Executives
Information consumers
(e.g. sales managers)
Knowledge workers (e.g. brand manager)
This presentation shares the preliminary results of these scenarios, including the identified short and mid term opportunities for SAP
Source:CCT
Diagram 1 – Business User Segmentation
SAP CONFIDENTIAL SAP AG 2004, 041213_Insight/Prototype_Results_Final, CCT / 3
Agenda
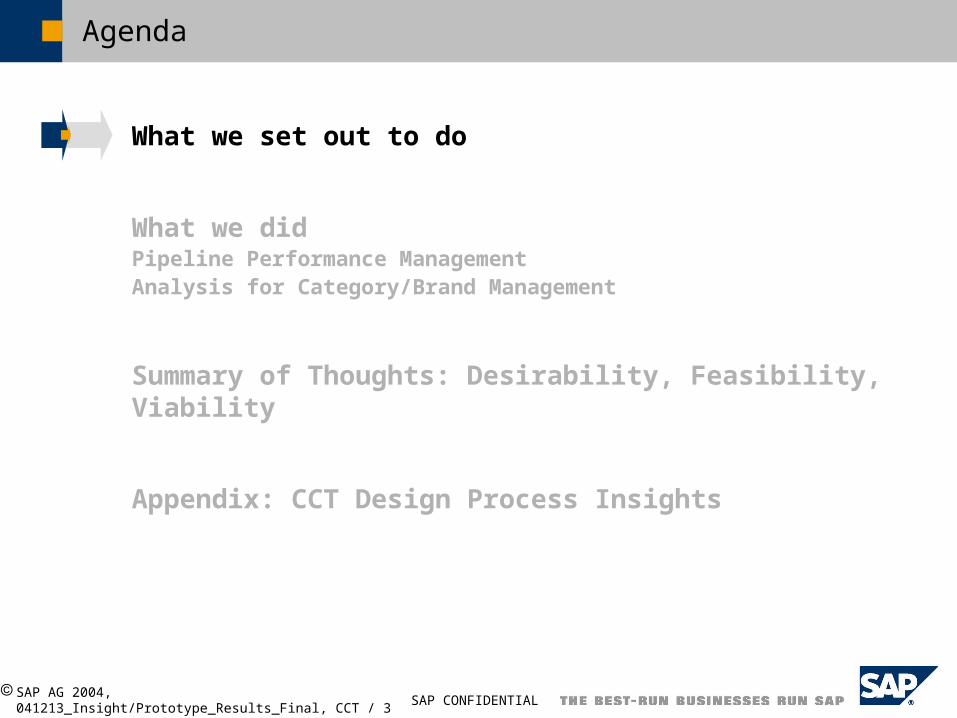
What we set out to do
What we didPipeline Performance ManagementAnalysis for Category/Brand Management
Summary of Thoughts: Desirability, Feasibility, Viability
Appendix: CCT Design Process Insights
SAP CONFIDENTIAL SAP AG 2004, 041213_Insight/Prototype_Results_Final, CCT / 4
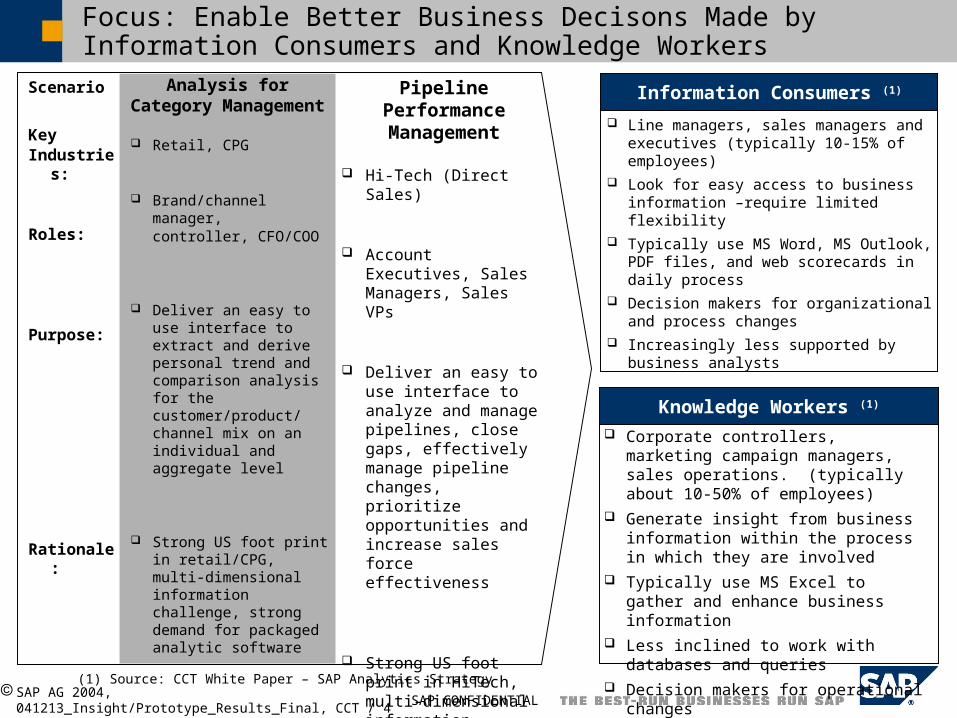
Analysis forCategory Management
Retail, CPG
Brand/channel manager, controller, CFO/COO
Deliver an easy to use interface to extract and derive personal trend and comparison analysis for the customer/product/ channel mix on an individual and aggregate level
Strong US foot print in retail/CPG, multi-dimensional information challenge, strong demand for packaged analytic software
Focus: Enable Better Business Decisons Made by Information Consumers and Knowledge Workers
Scenario
Key Industries:
Roles:
Purpose:
Rationale:
Line managers, sales managers and executives (typically 10-15% of employees)
Look for easy access to business information –require limited flexibility
Typically use MS Word, MS Outlook, PDF files, and web scorecards in daily process
Decision makers for organizational and process changes
Increasingly less supported by business analysts
Information Consumers (1)
Knowledge Workers (1)
Corporate controllers, marketing campaign managers, sales operations. (typically about 10-50% of employees)
Generate insight from business information within the process in which they are involved
Typically use MS Excel to gather and enhance business information
Less inclined to work with databases and queries
Decision makers for operational changes
(1) Source: CCT White Paper – SAP Analytics Strategy
Pipeline Performance Management
Hi-Tech (Direct Sales)
Account Executives, Sales Managers, Sales VPs
Deliver an easy to use interface to analyze and manage pipelines, close gaps, effectively manage pipeline changes, prioritize opportunities and increase sales force effectiveness
Strong US foot print in HiTech, multi-dimensional information challenge, strong demand for CRM analytics, competitive pressures
SAP CONFIDENTIAL SAP AG 2004, 041213_Insight/Prototype_Results_Final, CCT / 5
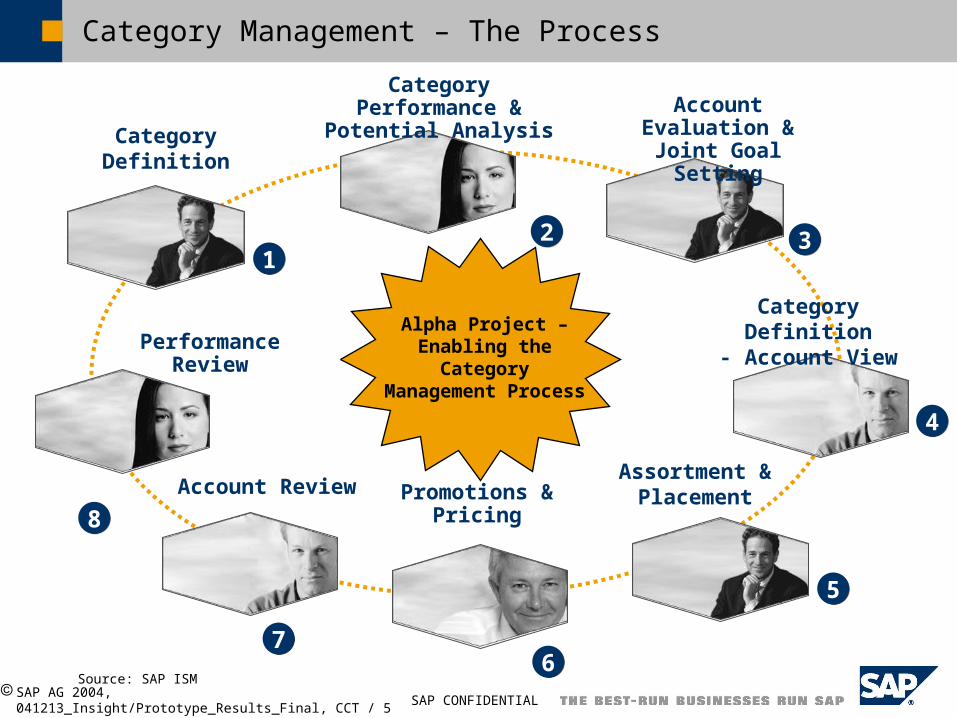
Category Management – The Process
Category Definition
44
22 33
55
11
66
Category Definition- Account View
Account Evaluation & Joint Goal Setting
Category Performance & Potential Analysis
Promotions & Pricing
Assortment & Placement
88
Performance Review
77
Account Review
Alpha Project –Enabling the
CategoryManagement Process
Source: SAP ISM
SAP CONFIDENTIAL SAP AG 2004, 041213_Insight/Prototype_Results_Final, CCT / 6
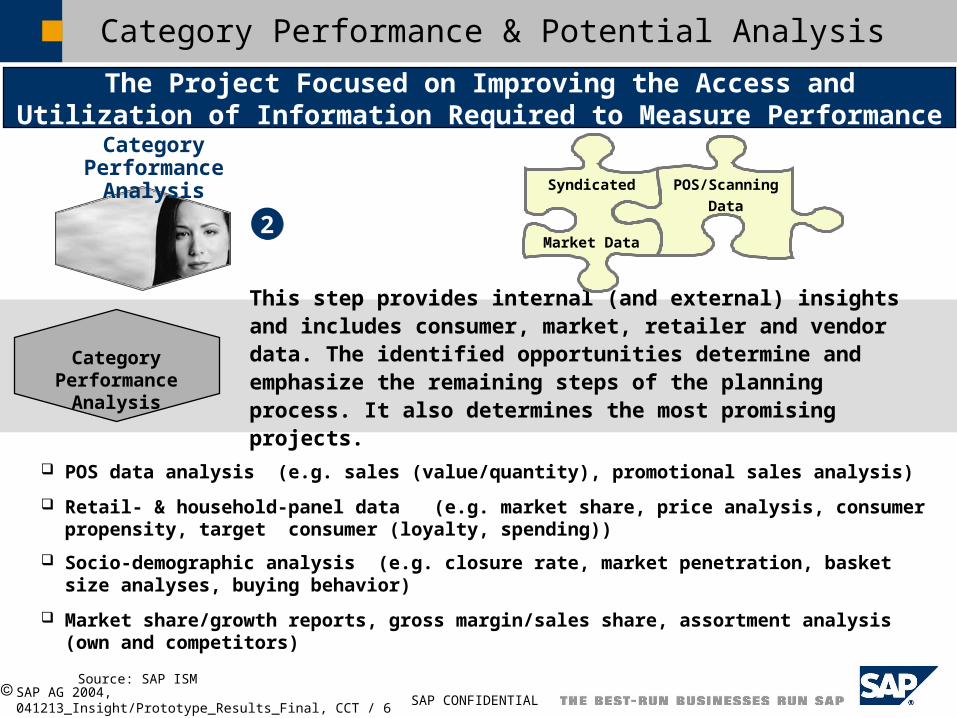
Category Performance & Potential Analysis
22
Category Performance Analysis
Category Performance Analysis
This step provides internal (and external) insights and includes consumer, market, retailer and vendor data. The identified opportunities determine and emphasize the remaining steps of the planning process. It also determines the most promising projects.
POS/Scanning
Data
Syndicated
Market Data
POS data analysis (e.g. sales (value/quantity), promotional sales analysis)
Retail- & household-panel data (e.g. market share, price analysis, consumer propensity, target consumer (loyalty, spending))
Socio-demographic analysis (e.g. closure rate, market penetration, basket size analyses, buying behavior)
Market share/growth reports, gross margin/sales share, assortment analysis (own and competitors)
Source: SAP ISM
The Project Focused on Improving the Access and Utilization of Information Required to Measure Performance
SAP CONFIDENTIAL SAP AG 2004, 041213_Insight/Prototype_Results_Final, CCT / 7
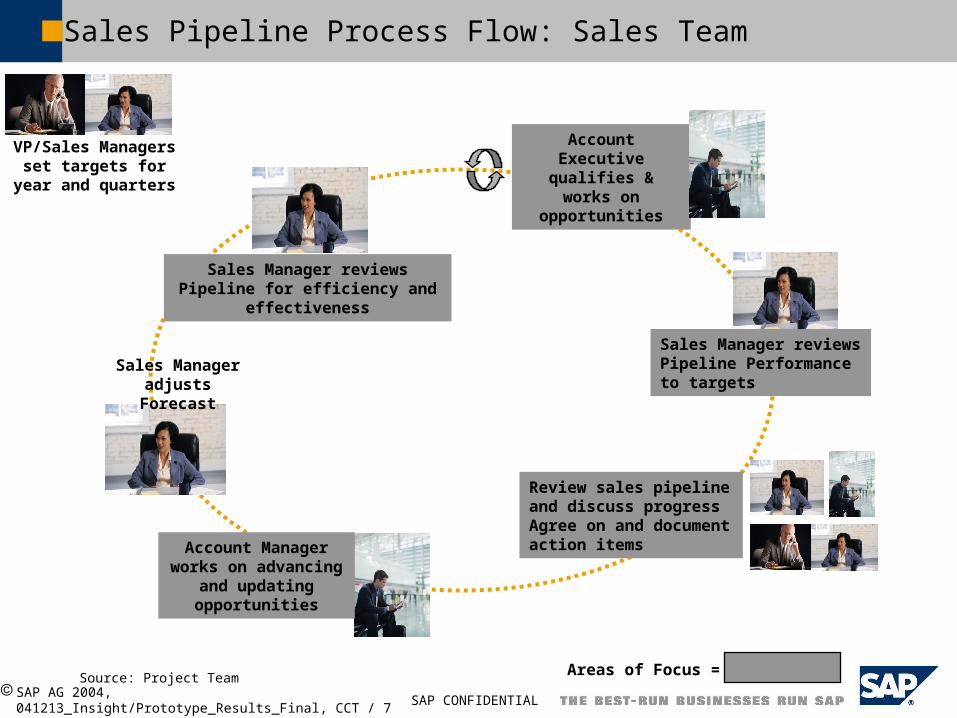
Sales Pipeline Process Flow: Sales Team
VP/Sales Managers set targets for year
and quarters
Account Executive qualifies & works on
opportunities
Review sales pipeline and discuss progress Agree on and document action items
Sales Manager adjusts Forecast
Account Manager works on advancing
and updating opportunities
Sales Manager reviews Pipeline Performance to targets
Sales Manager reviews Pipeline for efficiency and effectiveness
Source: Project Team Areas of Focus =
SAP CONFIDENTIAL SAP AG 2004, 041213_Insight/Prototype_Results_Final, CCT / 8
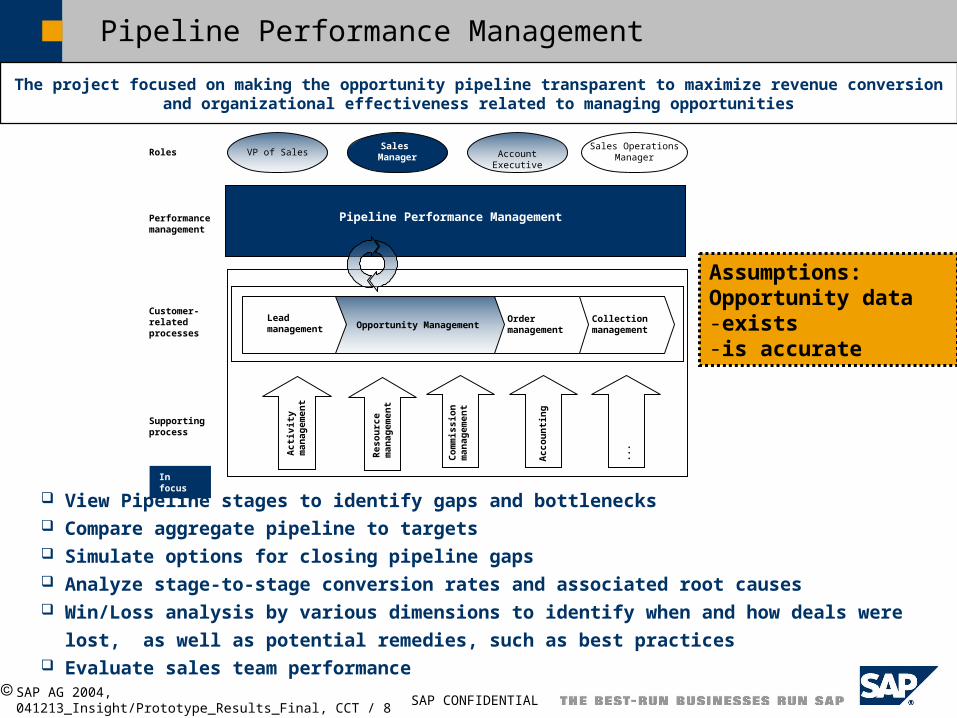
Pipeline Performance Management
View Pipeline stages to identify gaps and bottlenecks Compare aggregate pipeline to targets Simulate options for closing pipeline gaps Analyze stage-to-stage conversion rates and associated root causes Win/Loss analysis by various dimensions to identify when and how deals were lost, as well as
potential remedies, such as best practices Evaluate sales team performance
The project focused on making the opportunity pipeline transparent to maximize revenue conversion and organizational effectiveness related to managing opportunities
Res
ou
rce
man
agem
ent
Order management
Collection management
Roles VP of SalesSales
Manager Account ExecutiveSales Operations
Manager
Performance management
Customer-related processes
Supporting process
Opportunity Management
Act
ivit
y m
anag
emen
t
Co
mm
issi
on
m
anag
emen
t
Acc
ou
nti
ng
...
Pipeline Performance Management
In focus
Lead management
Assumptions:Opportunity data-exists -is accurate
SAP CONFIDENTIAL SAP AG 2004, 041213_Insight/Prototype_Results_Final, CCT / 9
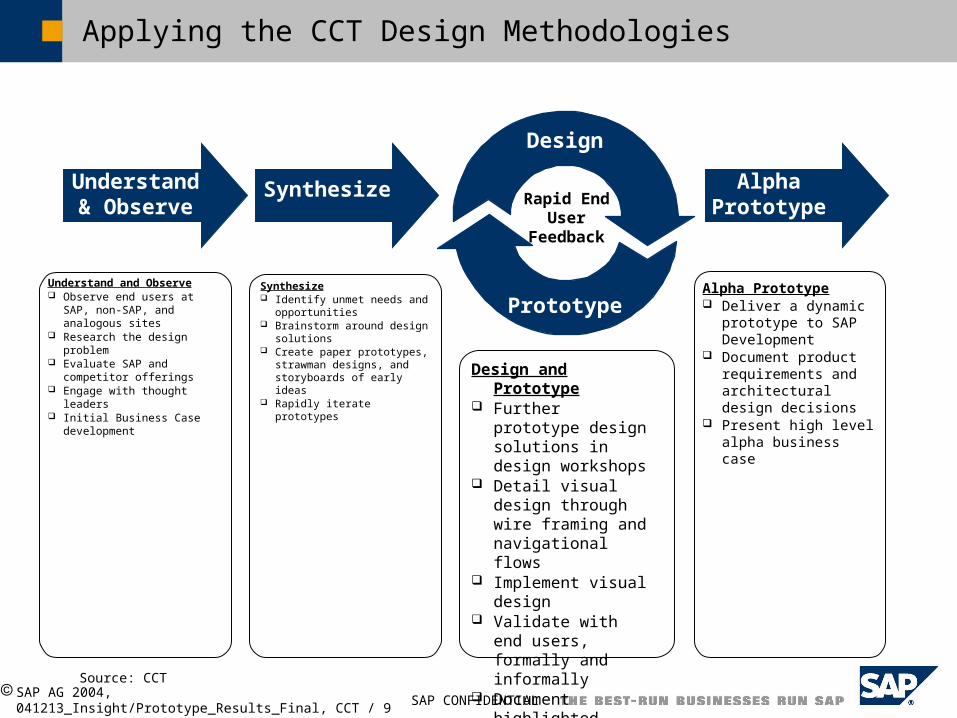
Alpha Prototype Deliver a dynamic
prototype to SAP Development
Document product requirements and architectural design decisions
Present high level alpha business case
Synthesize Identify unmet needs and
opportunities Brainstorm around design
solutions Create paper prototypes,
strawman designs, and storyboards of early ideas
Rapidly iterate prototypes
Understand and Observe Observe end users at SAP,
non-SAP, and analogous sites
Research the design problem Evaluate SAP and competitor
offerings Engage with thought leaders Initial Business Case
development
Applying the CCT Design Methodologies
SynthesizeUnderstand & Observe
Alpha Prototype
Design
Prototype
Rapid End User
Feedback
Design and Prototype Further prototype
design solutions in design workshops
Detail visual design through wire framing and navigational flows
Implement visual design
Validate with end users, formally and informally
Document highlighted features
Produce prototype
Source: CCT
SAP CONFIDENTIAL SAP AG 2004, 041213_Insight/Prototype_Results_Final, CCT / 10
Agenda
What we set out to do
What we didPipeline Performance ManagementAnalysis for Category/Brand Management
Summary of Thoughts: Desirability, Feasibility, Viability
Appendix: CCT Design Process Insights
SAP CONFIDENTIAL SAP AG 2004, 041213_Insight/Prototype_Results_Final, CCT / 11
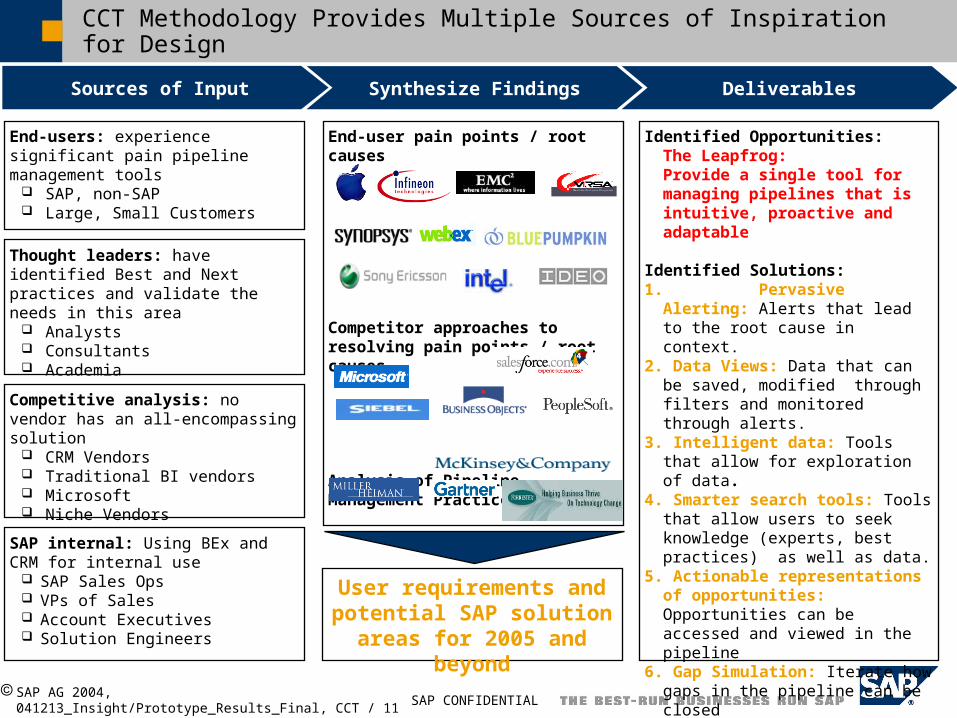
Identified Opportunities:The Leapfrog:Provide a single tool for managing pipelines that is intuitive, proactive and adaptable
Identified Solutions: 1. Pervasive Alerting: Alerts that lead
to the root cause in context.2. Data Views: Data that can be saved,
modified through filters and monitored through alerts.
3. Intelligent data: Tools that allow for exploration of data.
4. Smarter search tools: Tools that allow users to seek knowledge (experts, best practices) as well as data.
5. Actionable representations of opportunities: Opportunities can be accessed and viewed in the pipeline
6. Gap Simulation: Iterate how gaps in the pipeline can be closed
7. Join OLAP and OLTP: Maintain opportunity data within a data view
CCT Methodology Provides Multiple Sources of Inspiration for Design
End-users: experience significant pain pipeline management tools
SAP, non-SAP Large, Small Customers
Thought leaders: have identified Best and Next practices and validate the needs in this area
Analysts Consultants Academia
Competitive analysis: no vendor has an all-encompassing solution
CRM Vendors Traditional BI vendors Microsoft Niche Vendors
SAP internal: Using BEx and CRM for internal use
SAP Sales Ops VPs of Sales Account Executives Solution Engineers
End-user pain points / root causes
Competitor approaches to resolving pain points / root causes
Analysis of Pipeline Management Practices
User requirements and potential SAP solution areas
for 2005 and beyond
Sources of Input Synthesize Findings Deliverables
SAP CONFIDENTIAL SAP AG 2004, 041213_Insight/Prototype_Results_Final, CCT / 12
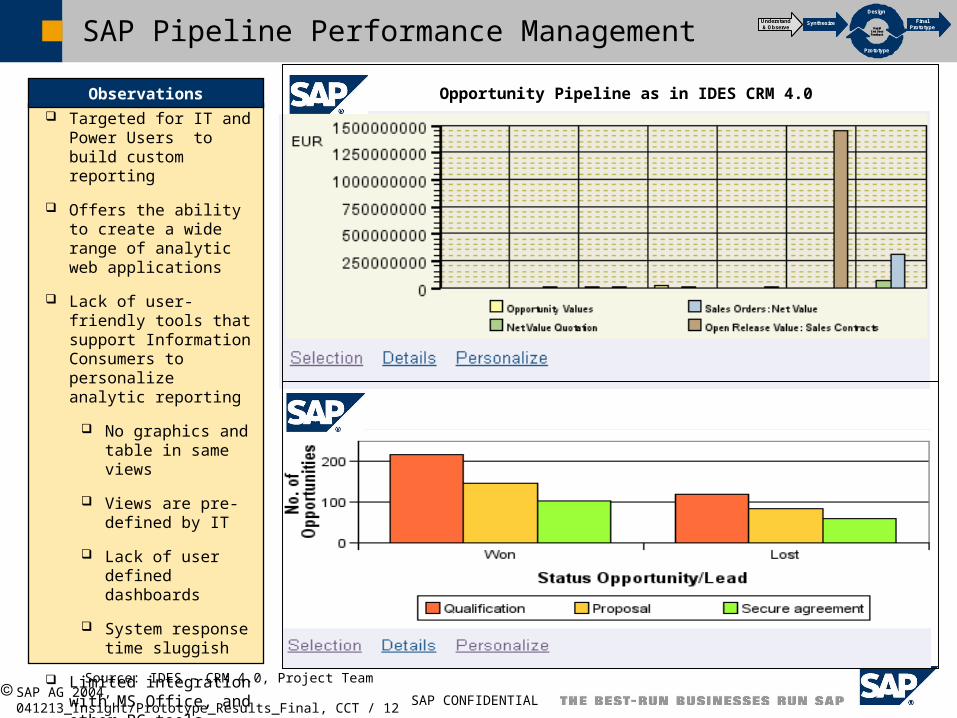
SAP Pipeline Performance Management
Targeted for IT and Power Users to build custom reporting
Offers the ability to create a wide range of analytic web applications
Lack of user-friendly tools that support Information Consumers to personalize analytic reporting
No graphics and table in same views
Views are pre-defined by IT
Lack of user defined dashboards
System response time sluggish
Limited integration with MS Office, and other PC tools
Observations Opportunity Pipeline as in IDES CRM 4.0
SynthesizeUnderstand& Observe
Final Prototype
Design
Prototype
Rapid End User Feedback
SynthesizeUnderstand& Observe
Final Prototype
DesignDesign
Prototype
Rapid End User Feedback
Source:IDES – CRM 4.0, Project Team
SAP CONFIDENTIAL SAP AG 2004, 041213_Insight/Prototype_Results_Final, CCT / 13
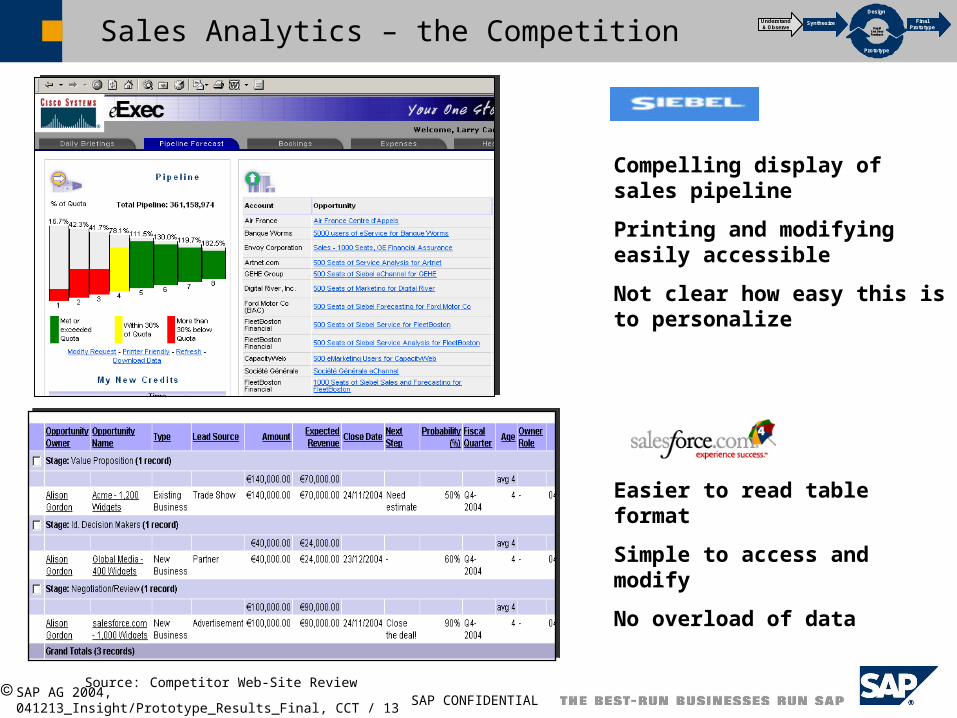
Sales Analytics – the Competition
Compelling display of sales pipeline
Printing and modifying easily accessible
Not clear how easy this is to personalize
Easier to read table format
Simple to access and modify
No overload of data
SynthesizeUnderstand& Observe
Final Prototype
Design
Prototype
Rapid End User Feedback
SynthesizeUnderstand& Observe
Final Prototype
DesignDesign
Prototype
Rapid End User Feedback
Source:Competitor Web-Site Review
SAP CONFIDENTIAL SAP AG 2004, 041213_Insight/Prototype_Results_Final, CCT / 14
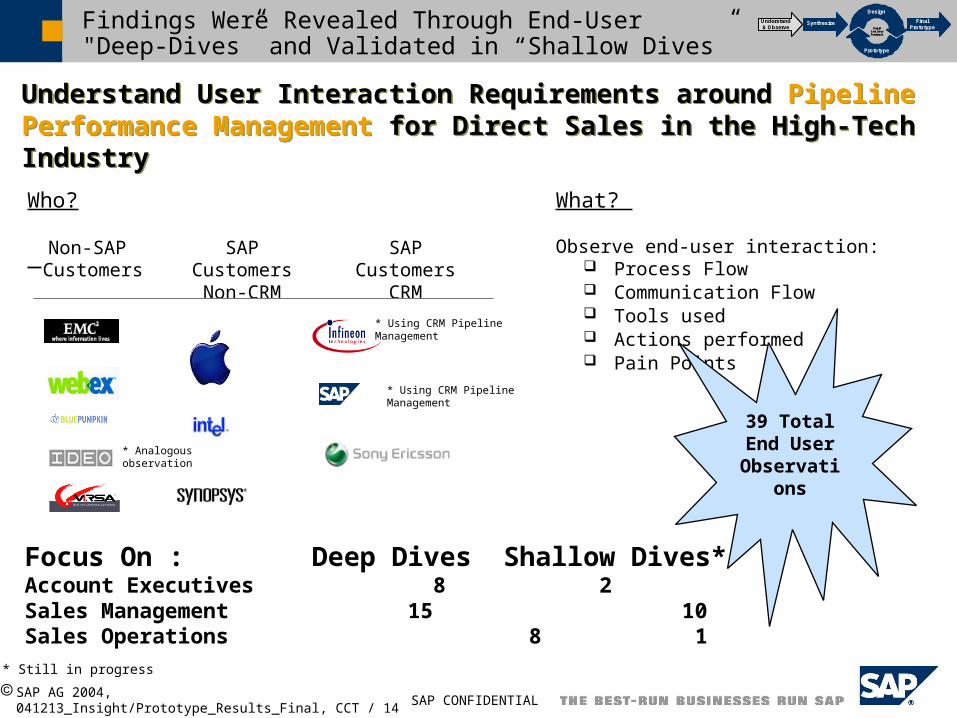
Who?
Findings Were Revealed Through End-User "Deep-Dives” and Validated in “Shallow Dives”
Understand User Interaction Requirements around Pipeline Performance Management for Direct Sales in the High-Tech IndustryUnderstand User Interaction Requirements around Pipeline Performance Management for Direct Sales in the High-Tech Industry
What?
Observe end-user interaction: Process Flow Communication Flow Tools used Actions performed Pain Points
SynthesizeUnderstand& Observe
Final Prototype
Design
Prototype
Rapid End User Feedback
SynthesizeUnderstand& Observe
Final Prototype
DesignDesign
Prototype
Rapid End User Feedback
Non-SAP Customers
SAP CustomersNon-CRM
SAP CustomersCRM
* Using CRM Pipeline Management
Focus On : Deep Dives Shallow Dives*Account Executives 8 2Sales Management 15 10Sales Operations 8 1
39 Total End User
Observations
* Still in progress
* Using CRM Pipeline Management
* Analogous observation
SAP CONFIDENTIAL SAP AG 2004, 041213_Insight/Prototype_Results_Final, CCT / 15
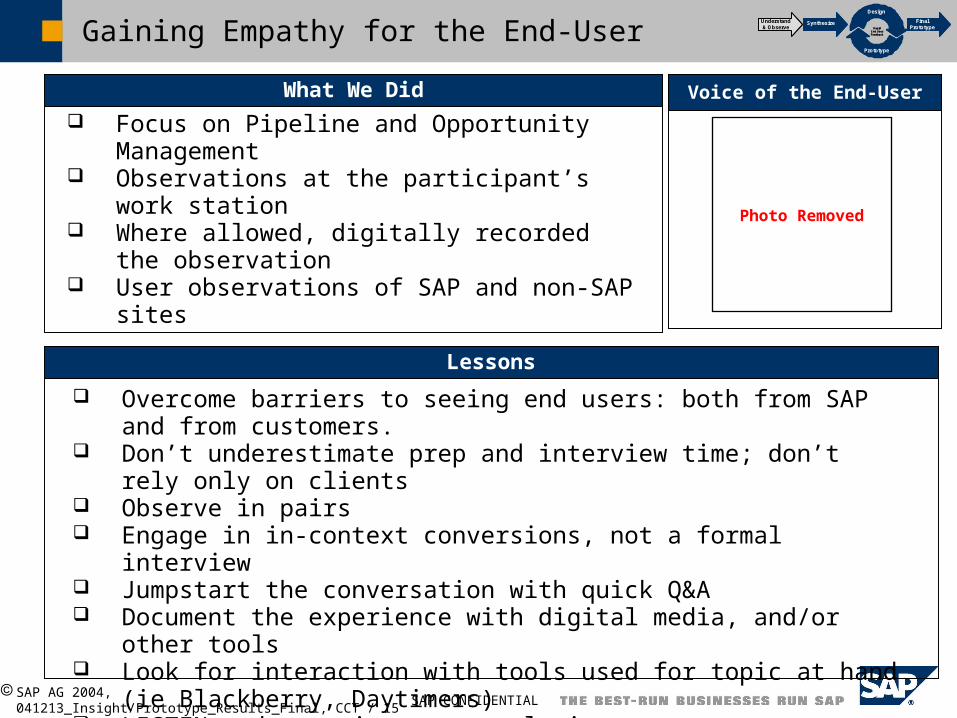
Gaining Empathy for the End-User
Voice of the End-User
SynthesizeUnderstand& Observe
Final Prototype
Design
Prototype
Rapid End User Feedback
SynthesizeUnderstand& Observe
Final Prototype
DesignDesign
Prototype
Rapid End User Feedback
Overcome barriers to seeing end users: both from SAP and from customers.
Don’t underestimate prep and interview time; don’t rely only on clients Observe in pairs Engage in in-context conversions, not a formal interview Jumpstart the conversation with quick Q&A Document the experience with digital media, and/or other tools Look for interaction with tools used for topic at hand (ie Blackberry,
Daytimers) LISTEN – do not jump to conclusions
Lessons
Focus on Pipeline and Opportunity Management Observations at the participant’s work station Where allowed, digitally recorded the observation User observations of SAP and non-SAP sites
What We Did
Photo Removed
SAP CONFIDENTIAL SAP AG 2004, 041213_Insight/Prototype_Results_Final, CCT / 16
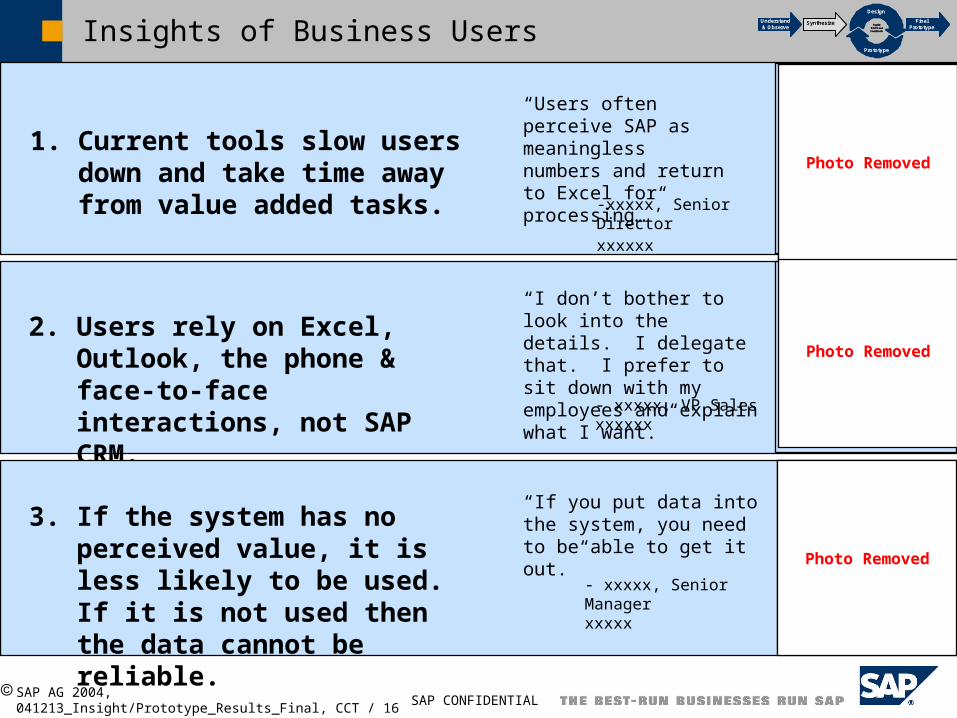
Insights of Business Users
1. Current tools slow users down and take time away from value added tasks.
“Users often perceive SAP as meaningless numbers and return to Excel for processing…”
-xxxxx, Senior Directorxxxxxx
2. Users rely on Excel, Outlook, the phone & face-to-face interactions, not SAP CRM.
“I don’t bother to look into the details. I delegate that. I prefer to sit down with my employees and explain what I want.”
- xxxxx, VP Salesxxxxxx
3. If the system has no perceived value, it is less likely to be used. If it is not used then the data cannot be reliable.
“If you put data into the system, you need to be able to get it out.”
- xxxxx, Senior Managerxxxxx
SynthesizeUnderstand & Observe
Final Prototype
Design
Prototype
Rapid End User Feedback
SynthesizeUnderstand & Observe
Final Prototype
DesignDesign
Prototype
Rapid End User Feedback
Photo Removed
Photo Removed
Photo Removed
SAP CONFIDENTIAL SAP AG 2004, 041213_Insight/Prototype_Results_Final, CCT / 17
Photo Unavailable
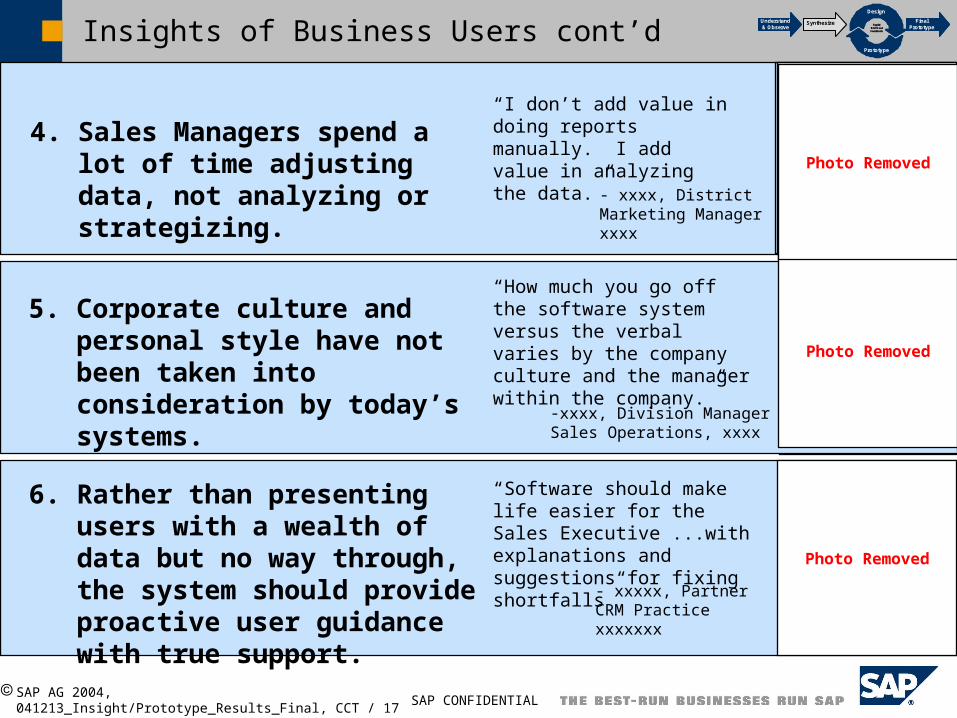
Insights of Business Users cont’d
4. Sales Managers spend a lot of time adjusting data, not analyzing or strategizing.
“How much you go off the software system versus the verbal varies by the company culture and the manager within the company.”
-xxxx, Division Manager Sales Operations, xxxx
5. Corporate culture and personal style have not been taken into consideration by today’s systems.
“I don’t add value in doing reports manually. I add value in analyzing the data.”
- xxxx, District Marketing Managerxxxx
6. Rather than presenting users with a wealth of data but no way through, the system should provide proactive user guidance with true support.
“Software should make life easier for the Sales Executive ...with explanations and suggestions for fixing shortfalls”
- xxxxx, PartnerCRM Practicexxxxxxx
Photo Removed
SynthesizeUnderstand & Observe
Final Prototype
Design
Prototype
Rapid End User Feedback
SynthesizeUnderstand & Observe
Final Prototype
DesignDesign
Prototype
Rapid End User Feedback
Photo Removed
Photo Removed
SAP CONFIDENTIAL SAP AG 2004, 041213_Insight/Prototype_Results_Final, CCT / 18
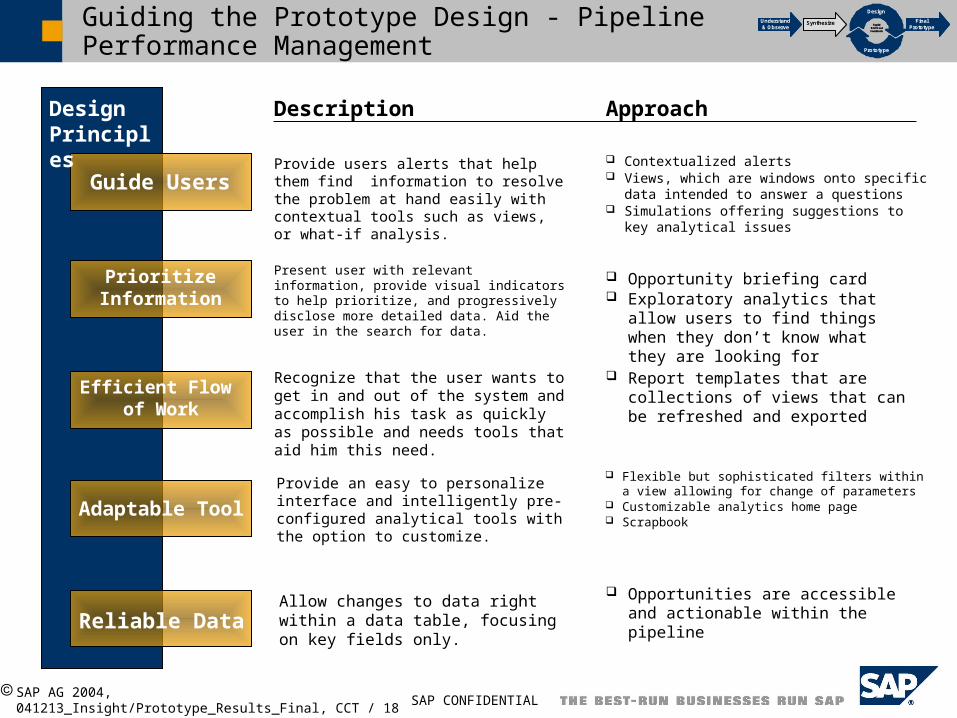
Guiding the Prototype Design - Pipeline Performance Management
Description ApproachDesignPrinciples
Provide users alerts that help them find information to resolve the problem at hand easily with contextual tools such as views, or what-if analysis.
Contextualized alerts Views, which are windows onto specific data
intended to answer a questions Simulations offering suggestions to key analytical
issues
Opportunity briefing card Exploratory analytics that allow users
to find things when they don’t know what they are looking for
Report templates that are collections of views that can be refreshed and exported
Opportunities are accessible and actionable within the pipeline
Present user with relevant information, provide visual indicators to help prioritize, and progressively disclose more detailed data. Aid the user in the search for data.
Recognize that the user wants to get in and out of the system and accomplish his task as quickly as possible and needs tools that aid him this need.
Guide Users
Prioritize Information
Efficient Flow of Work
Adaptable Tool
Reliable Data
Provide an easy to personalize interface and intelligently pre-configured analytical tools with the option to customize.
Allow changes to data right within a data table, focusing on key fields only.
SynthesizeUnderstand & Observe
Final Prototype
Design
Prototype
Rapid End User Feedback
SynthesizeUnderstand & Observe
Final Prototype
DesignDesign
Prototype
Rapid End User Feedback
Flexible but sophisticated filters within a view allowing for change of parameters
Customizable analytics home page Scrapbook
SAP CONFIDENTIAL SAP AG 2004, 041213_Insight/Prototype_Results_Final, CCT / 19
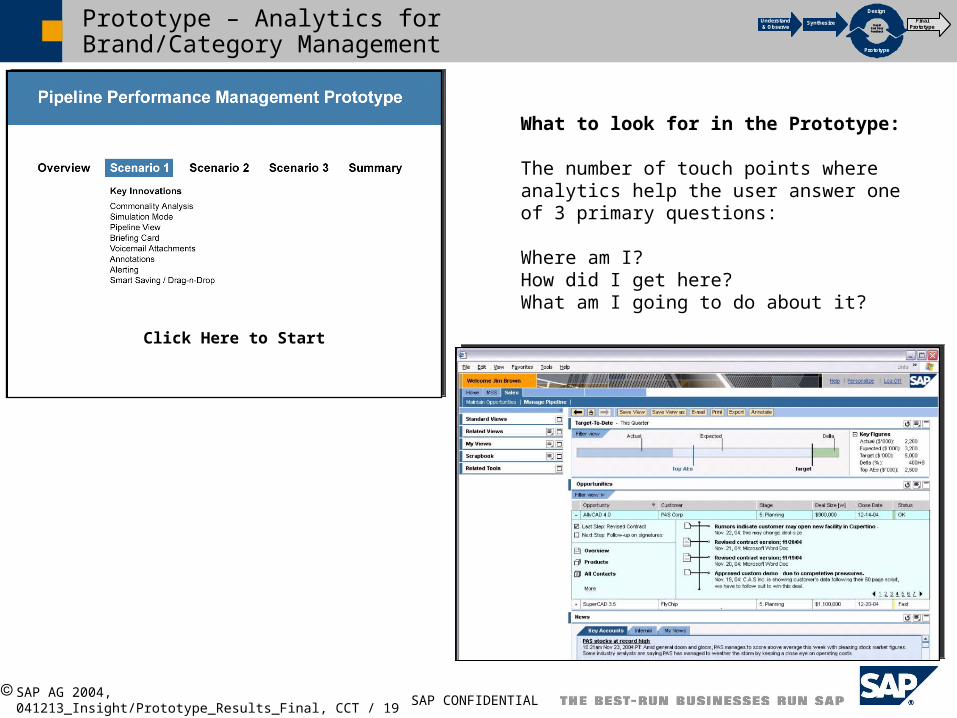
Prototype – Analytics for Brand/Category Management
Click Here to Start
SynthesizeUnderstand & Observe
Final Prototype
Design
Prototype
Rapid End User Feedback
SynthesizeUnderstand & Observe
Final Prototype
DesignDesign
Prototype
Rapid End User Feedback
What to look for in the Prototype:
The number of touch points where analytics help the user answer one of 3 primary questions:
Where am I?How did I get here?What am I going to do about it?
SAP CONFIDENTIAL SAP AG 2004, 041213_Insight/Prototype_Results_Final, CCT / 20
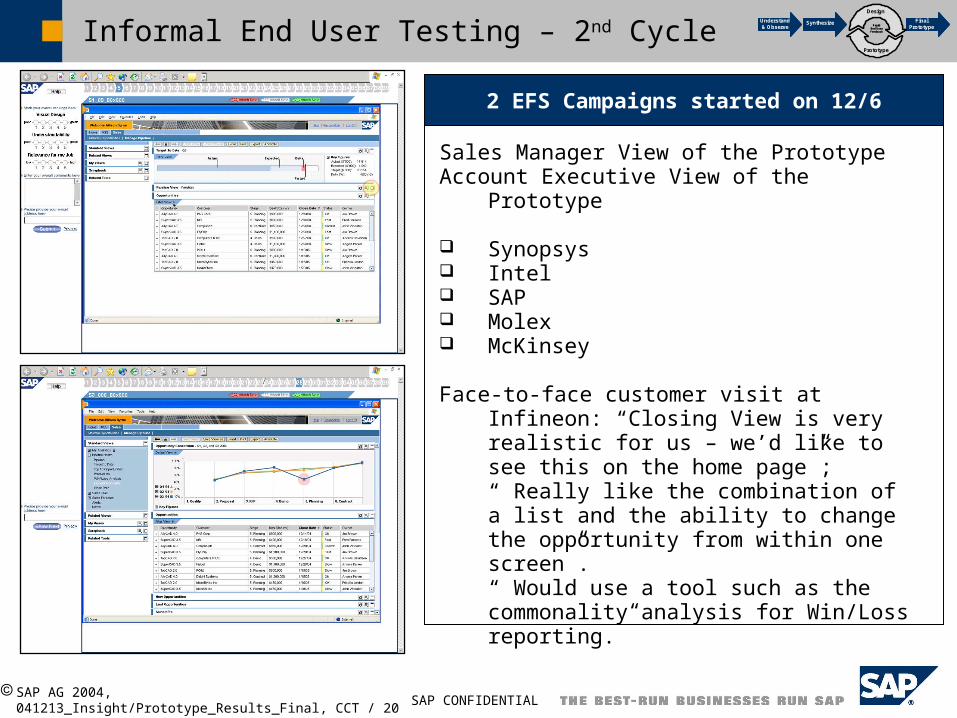
Informal End User Testing – 2nd Cycle SynthesizeUnderstand & Observe
Final Prototype
Design
Prototype
Rapid End User Feedback
SynthesizeUnderstand & Observe
Final Prototype
DesignDesign
Prototype
Rapid End User Feedback
Sales Manager View of the PrototypeAccount Executive View of the Prototype
Synopsys Intel SAP Molex McKinsey
Face-to-face customer visit at Infineon: “Closing View is very realistic for us – we’d like to see this on the home page”;“ Really like the combination of a list and the ability to change the opportunity from within one screen”.“ Would use a tool such as the commonality analysis for Win/Loss reporting.”
2 EFS Campaigns started on 12/6
SAP CONFIDENTIAL SAP AG 2004, 041213_Insight/Prototype_Results_Final, CCT / 21
Agenda
What we set out to do
What we didPipeline Performance ManagementAnalysis for Category/Brand Management
Summary of Thoughts: Desirability, Feasibility, Viability
Appendix: CCT Design Process Insights
SAP CONFIDENTIAL SAP AG 2004, 041213_Insight/Prototype_Results_Final, CCT / 22
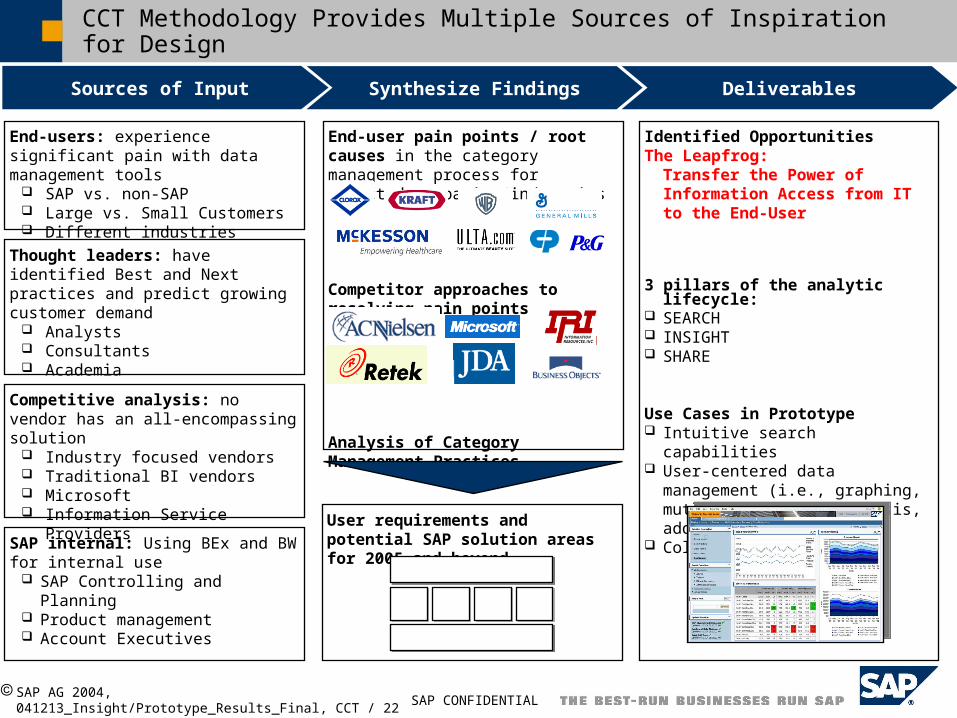
Identified Opportunities The Leapfrog:
Transfer the Power of Information Access from IT to the End-User
3 pillars of the analytic lifecycle: SEARCH INSIGHT SHARE
Use Cases in Prototype Intuitive search capabilities User-centered data management
(i.e., graphing, mutli-dimensional analysis, adding metrics, etc.)
Collaborative Workspace
CCT Methodology Provides Multiple Sources of Inspiration for Design
End-users: experience significant pain with data management tools
SAP vs. non-SAP Large vs. Small Customers Different industries
Thought leaders: have identified Best and Next practices and predict growing customer demand
Analysts Consultants Academia
Competitive analysis: no vendor has an all-encompassing solution
Industry focused vendors Traditional BI vendors Microsoft Information Service Providers
SAP internal: Using BEx and BW for internal use
SAP Controlling and Planning Product management Account Executives
End-user pain points / root causes in the category management process for selected companies/industries
Competitor approaches to resolving pain points / root causes
Analysis of Category Management Practices
User requirements and potential SAP solution areas for 2005 and beyond
Sources of Input Synthesize Findings Deliverables
SAP CONFIDENTIAL SAP AG 2004, 041213_Insight/Prototype_Results_Final, CCT / 23
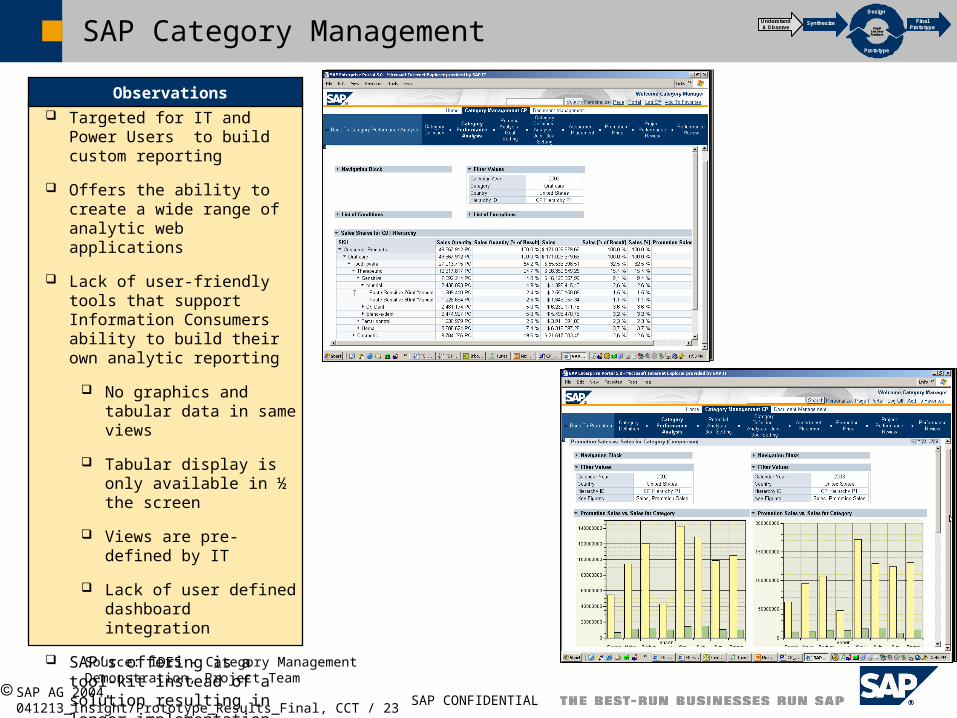
SAP Category Management
Targeted for IT and Power Users to build custom reporting
Offers the ability to create a wide range of analytic web applications
Lack of user-friendly tools that support Information Consumers ability to build their own analytic reporting
No graphics and tabular data in same views
Tabular display is only available in ½ the screen
Views are pre-defined by IT
Lack of user defined dashboard integration
SAP’s offering is a tool-kit instead of a solution resulting in longer implementation project cycles
Observations
Source:IDES - Category Management Demonstration, Project Team
SynthesizeUnderstand& Observe
Final Prototype
Design
Prototype
Rapid End User Feedback
SynthesizeUnderstand& Observe
Final Prototype
DesignDesign
Prototype
Rapid End User Feedback
SAP CONFIDENTIAL SAP AG 2004, 041213_Insight/Prototype_Results_Final, CCT / 24
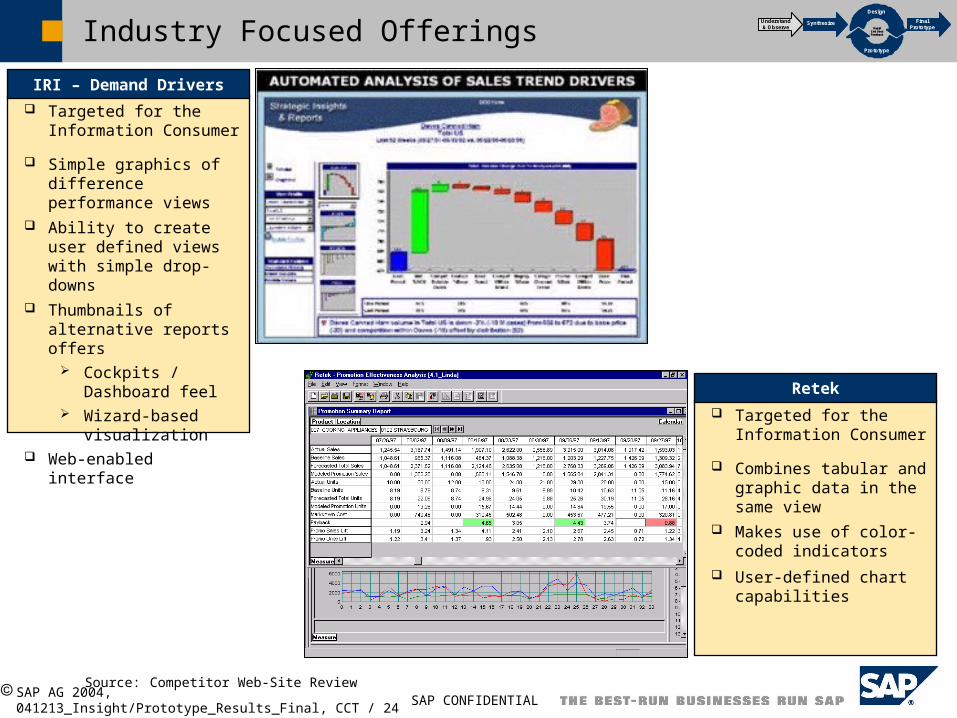
Industry Focused Offerings
Targeted for the Information Consumer
Simple graphics of difference performance views
Ability to create user defined views with simple drop-downs
Thumbnails of alternative reports offers
Cockpits / Dashboard feel
Wizard-based visualization
Web-enabled interface
IRI – Demand Drivers
Source:Competitor Web-Site Review
Targeted for the Information Consumer
Combines tabular and graphic data in the same view
Makes use of color-coded indicators
User-defined chart capabilities
Retek
SynthesizeUnderstand& Observe
Final Prototype
Design
Prototype
Rapid End User Feedback
SynthesizeUnderstand& Observe
Final Prototype
DesignDesign
Prototype
Rapid End User Feedback
SAP CONFIDENTIAL SAP AG 2004, 041213_Insight/Prototype_Results_Final, CCT / 25
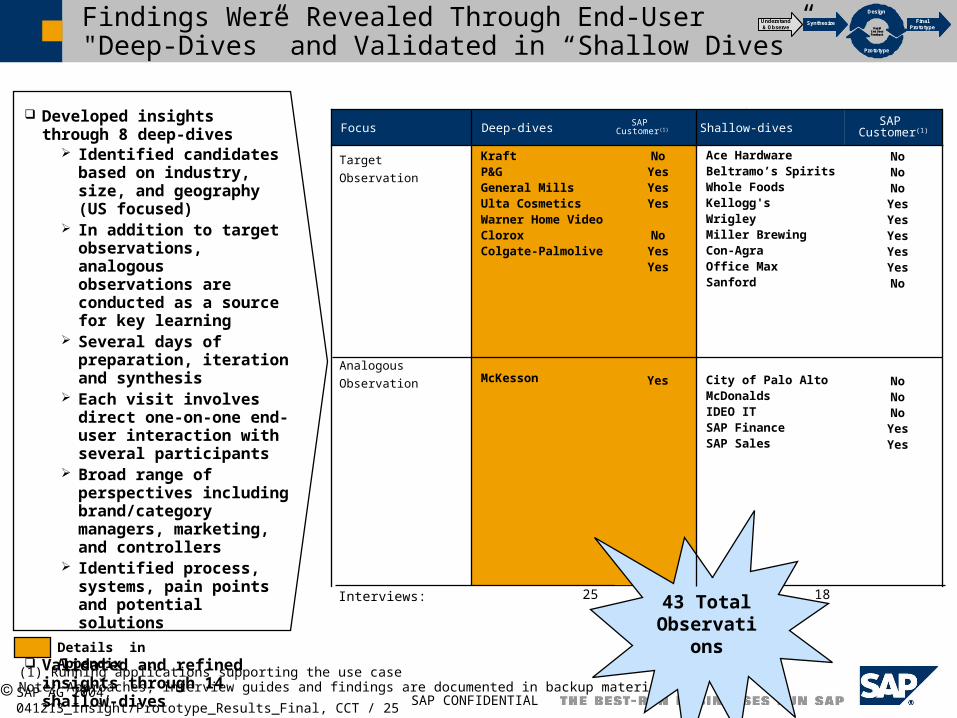
1825Interviews:
Findings Were Revealed Through End-User "Deep-Dives” and Validated in “Shallow Dives”
Note: Approaches, interview guides and findings are documented in backup materials
Details in Appendix
SynthesizeUnderstand& Observe
Final Prototype
Design
Prototype
Rapid End User Feedback
SynthesizeUnderstand& Observe
Final Prototype
DesignDesign
Prototype
Rapid End User Feedback
SAP Customer(1)
KraftP&GGeneral MillsUlta CosmeticsWarner Home VideoCloroxColgate-Palmolive
SAP Customer(1)
Analogous
Observation
Shallow-dives
Target
Observation
Focus Deep-dives
NoYesYesYes
NoYesYes
McKesson
Ace HardwareBeltramo’s SpiritsWhole FoodsKellogg'sWrigleyMiller BrewingCon-AgraOffice MaxSanford
NoNoNoYesYesYesYesYesNo
Developed insights through 8 deep-dives
Identified candidates based on industry, size, and geography (US focused)
In addition to target observations, analogous observations are conducted as a source for key learning
Several days of preparation, iteration and synthesis
Each visit involves direct one-on-one end-user interaction with several participants
Broad range of perspectives including brand/category managers, marketing, and controllers
Identified process, systems, pain points and potential solutions
Validated and refined insights through 14 shallow-dives
Yes City of Palo AltoMcDonaldsIDEO ITSAP FinanceSAP Sales
NoNoNoYesYes
(1) Running applications supporting the use case
43 Total Observation
s
SAP CONFIDENTIAL SAP AG 2004, 041213_Insight/Prototype_Results_Final, CCT / 26
Gaining Empathy for the End-User
Voice of the End-User
SynthesizeUnderstand& Observe
Final Prototype
Design
Prototype
Rapid End User Feedback
SynthesizeUnderstand& Observe
Final Prototype
DesignDesign
Prototype
Rapid End User Feedback
Overcome barriers to seeing end users: both from SAP and from customers.
Don’t underestimate prep time; don’t rely only on clients Observe in pairs Engage in in-context conversions, not a formal interview Jumpstart the conversation with quick Q&A Document the experience with digital media Look for real-life use; demos are not enough
Lessons
Research on brand/category management End-User observations at the participant's work
station Where allowed, digitally recorded the entire visit User observations of SAP and non-SAP sites Conducted “analogous” observations to immerse
oneself in the problem and broaden the definition of competition
What We Did
Photo Removed
SAP CONFIDENTIAL SAP AG 2004, 041213_Insight/Prototype_Results_Final, CCT / 27
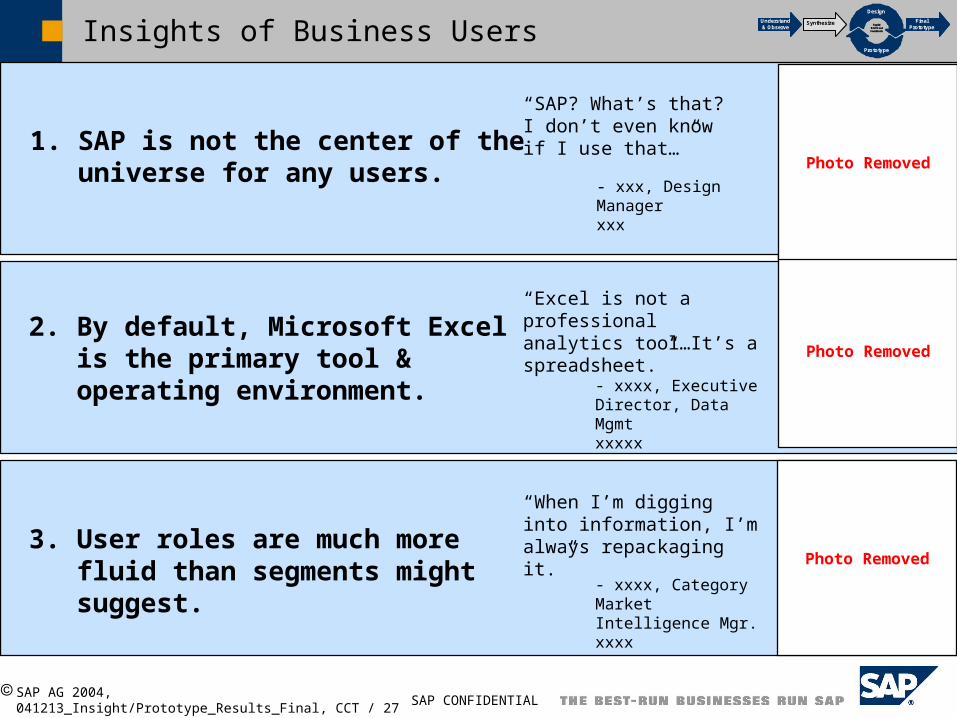
Insights of Business Users
1. SAP is not the center of the universe for any users.
“SAP? What’s that? I don’t even know if I use that…”
- xxx, Design Managerxxx
2. By default, Microsoft Excelis the primary tool & operating environment.
“Excel is not aprofessional analytics tool…It’s a spreadsheet.”
- xxxx, Executive Director, Data Mgmtxxxxx
3. User roles are much more fluid than segments might suggest.
“When I’m digging into information, I’m always repackaging it.”
- xxxx, Category Market Intelligence Mgr.xxxx
SynthesizeUnderstand & Observe
Final Prototype
Design
Prototype
Rapid End User Feedback
SynthesizeUnderstand & Observe
Final Prototype
DesignDesign
Prototype
Rapid End User Feedback
Photo Removed
Photo Removed
Photo Removed
SAP CONFIDENTIAL SAP AG 2004, 041213_Insight/Prototype_Results_Final, CCT / 28
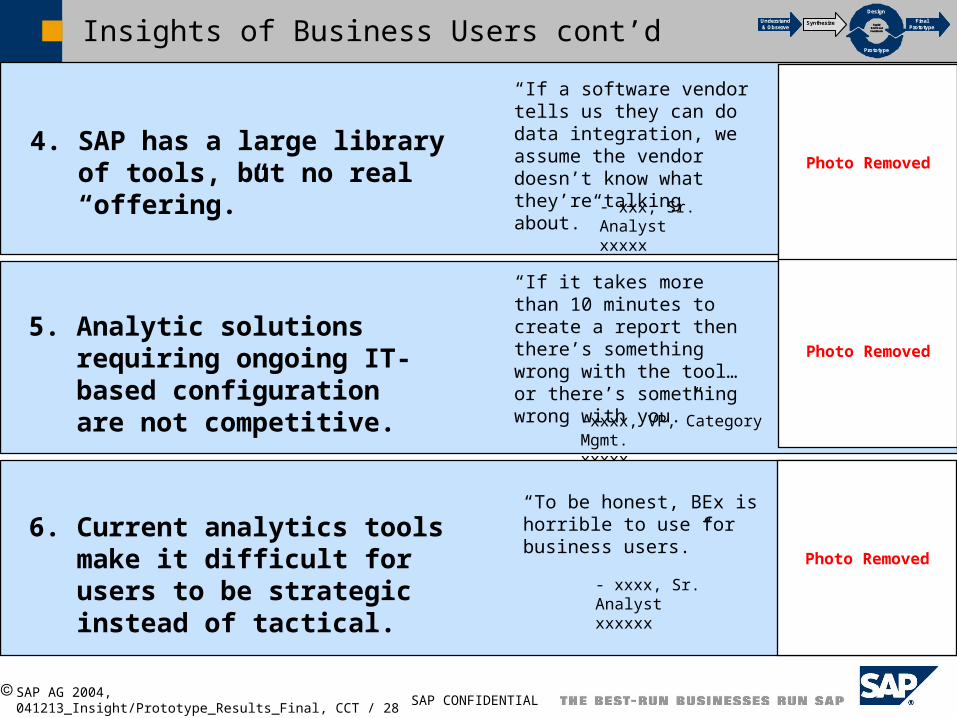
Insights of Business Users cont’d
4. SAP has a large library of tools, but no real “offering.”
“If it takes more than 10 minutes to create a report then there’s something wrong with the tool…or there’s something wrong with you.”
-xxxx, VP, Category Mgmt.xxxxx
5. Analytic solutions requiring ongoing IT-based configuration are not competitive.
“If a software vendor tells us they can do data integration, we assume the vendor doesn’t know what they’re talking about.”
- xxx, Sr. Analystxxxxx
6. Current analytics tools make it difficult for users to be strategic instead of tactical.
“To be honest, BEx is horrible to use for business users.”
- xxxx, Sr. Analystxxxxxx
SynthesizeUnderstand & Observe
Final Prototype
Design
Prototype
Rapid End User Feedback
SynthesizeUnderstand & Observe
Final Prototype
DesignDesign
Prototype
Rapid End User Feedback
Photo Removed
Photo Removed
Photo Removed
SAP CONFIDENTIAL SAP AG 2004, 041213_Insight/Prototype_Results_Final, CCT / 29
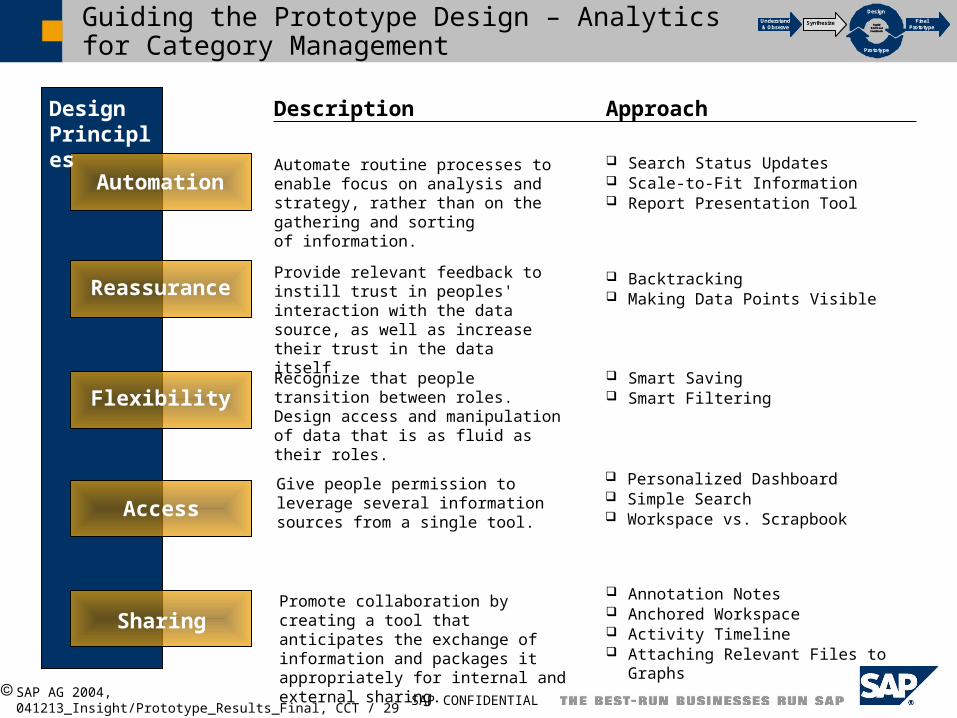
Guiding the Prototype Design – Analytics for Category Management
Description ApproachDesignPrinciples
Automate routine processes to enable focus on analysis and strategy, rather than on the gathering and sorting of information.
Search Status Updates Scale-to-Fit Information Report Presentation Tool
Backtracking Making Data Points Visible
Smart Saving Smart Filtering
Annotation Notes Anchored Workspace Activity Timeline Attaching Relevant Files to Graphs
Provide relevant feedback to instill trust in peoples' interaction with the data source, as well as increase their trust in the data itself.
Recognize that people transition between roles. Design access and manipulation of data that is as fluid as their roles.
Automation
Reassurance
Flexibility
Access
Sharing
Give people permission to leverage several information sources from a single tool.
Promote collaboration by creating a tool that anticipates the exchange of information and packages it appropriately for internal and external sharing.
SynthesizeUnderstand & Observe
Final Prototype
Design
Prototype
Rapid End User Feedback
SynthesizeUnderstand & Observe
Final Prototype
DesignDesign
Prototype
Rapid End User Feedback
Personalized Dashboard Simple Search Workspace vs. Scrapbook
SAP CONFIDENTIAL SAP AG 2004, 041213_Insight/Prototype_Results_Final, CCT / 30
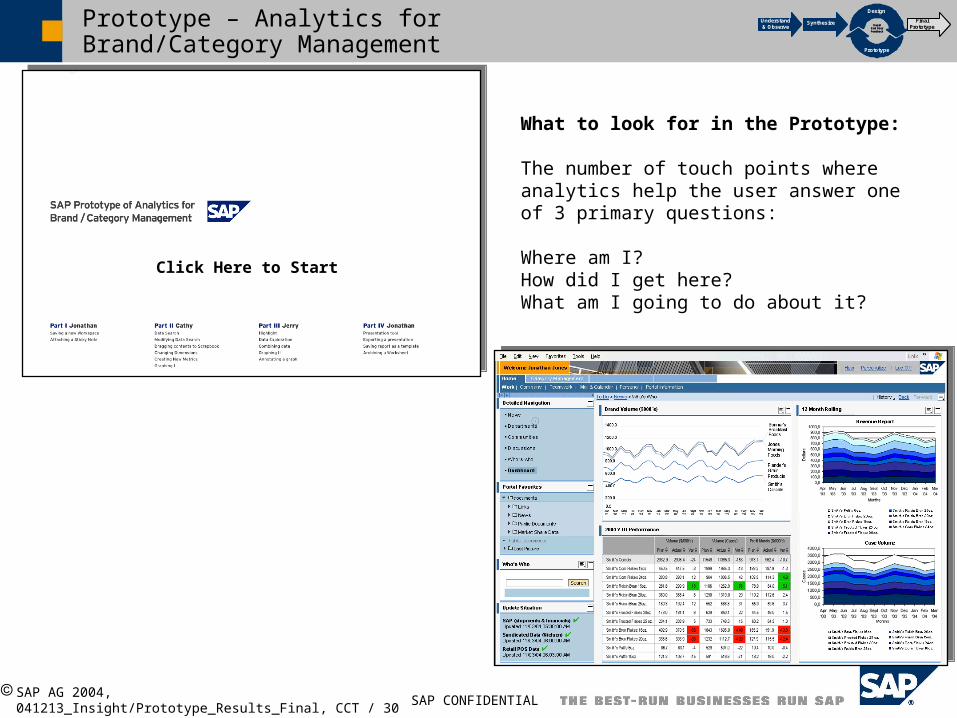
Prototype – Analytics for Brand/Category Management
Click Here to Start
SynthesizeUnderstand & Observe
Final Prototype
Design
Prototype
Rapid End User Feedback
SynthesizeUnderstand & Observe
Final Prototype
DesignDesign
Prototype
Rapid End User Feedback
What to look for in the Prototype:
The number of touch points where analytics help the user answer one of 3 primary questions:
Where am I?How did I get here?What am I going to do about it?
SAP CONFIDENTIAL SAP AG 2004, 041213_Insight/Prototype_Results_Final, CCT / 31
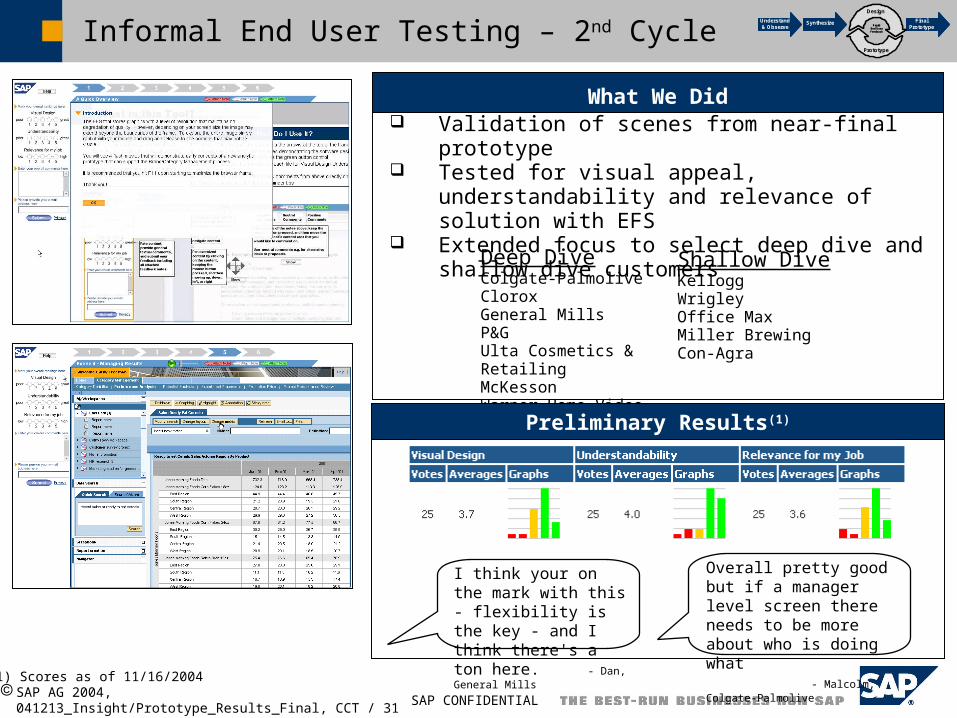
Informal End User Testing – 2nd Cycle
Deep DiveColgate-PalmoliveCloroxGeneral MillsP&GUlta Cosmetics & RetailingMcKessonWarner Home Video
Shallow DiveKelloggWrigleyOffice MaxMiller BrewingCon-Agra
SynthesizeUnderstand & Observe
Final Prototype
Design
Prototype
Rapid End User Feedback
SynthesizeUnderstand & Observe
Final Prototype
DesignDesign
Prototype
Rapid End User Feedback
Validation of scenes from near-final prototype Tested for visual appeal, understandability and
relevance of solution with EFS Extended focus to select deep dive and shallow dive
customers
What We Did
Preliminary Results(1)
(1) Scores as of 11/16/2004
I think your on the mark with this - flexibility is the key - and I think there's a ton here. - Dan, General Mills
Overall pretty good but if a manager level screen there needs to be more about who is doing what - Malcolm, Colgate-Palmolive
SAP CONFIDENTIAL SAP AG 2004, 041213_Insight/Prototype_Results_Final, CCT / 32
Agenda
What we set out to do
What we didPipeline Performance ManagementAnalysis for Category/Brand Management
Summary of Thoughts: Desirability, Feasibility, Viability
Appendix: CCT Design Process Insights
SAP CONFIDENTIAL SAP AG 2004, 041213_Insight/Prototype_Results_Final, CCT / 33
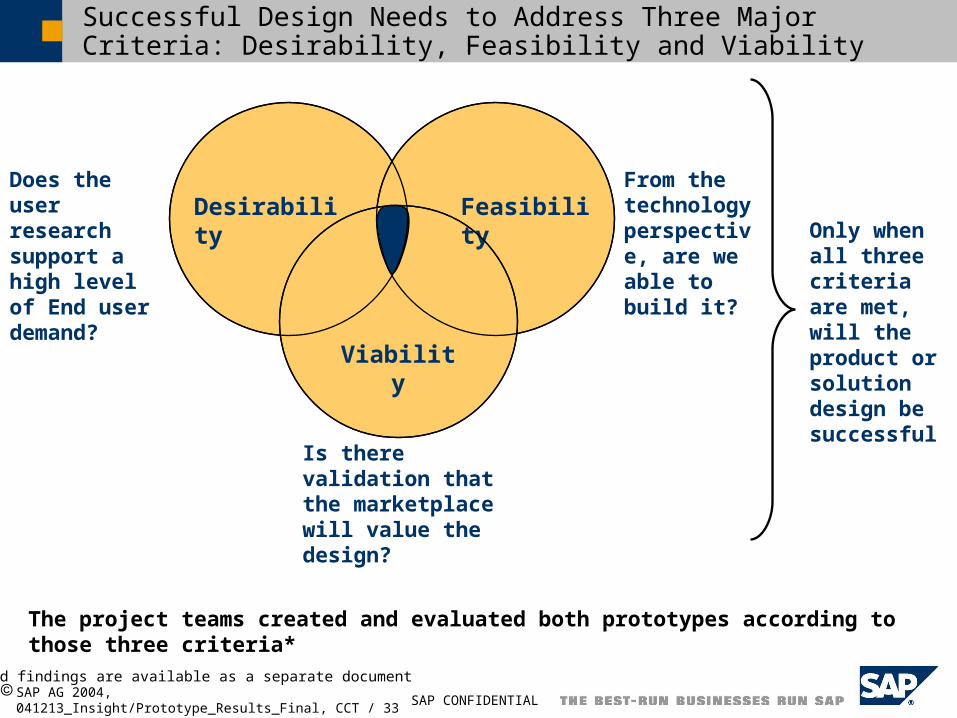
Successful Design Needs to Address Three Major Criteria: Desirability, Feasibility and Viability
From the technology perspective, are we able to build it?
Does the user research support a high level of End user demand?
Is there validation that the marketplace will value the design?
Only when all three criteria are met, will the product or solution design be successful
The project teams created and evaluated both prototypes according to those three criteria*
* Detailed findings are available as a separate document
Desirability Feasibility
Viability
SAP CONFIDENTIAL SAP AG 2004, 041213_Insight/Prototype_Results_Final, CCT / 34
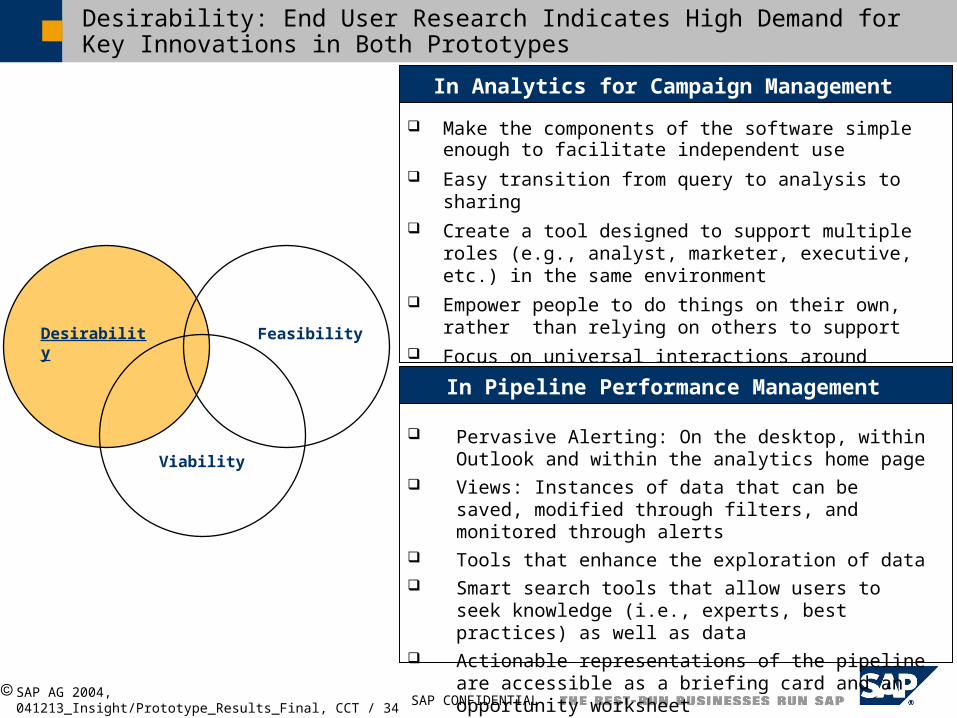
Desirability: End User Research Indicates High Demand for Key Innovations in Both Prototypes
Make the components of the software simple enough to facilitate independent use
Easy transition from query to analysis to sharing Create a tool designed to support multiple roles (e.g.,
analyst, marketer, executive, etc.) in the same environment
Empower people to do things on their own, rather than relying on others to support
Focus on universal interactions around finding, modifying & packaging information
In Analytics for Campaign Management
Pervasive Alerting: On the desktop, within Outlook and within the analytics home page
Views: Instances of data that can be saved, modified through filters, and monitored through alerts
Tools that enhance the exploration of data Smart search tools that allow users to seek knowledge
(i.e., experts, best practices) as well as data Actionable representations of the pipeline are accessible
as a briefing card and an opportunity worksheet
In Pipeline Performance Management
Desirability Feasibility
Viability
SAP CONFIDENTIAL SAP AG 2004, 041213_Insight/Prototype_Results_Final, CCT / 35
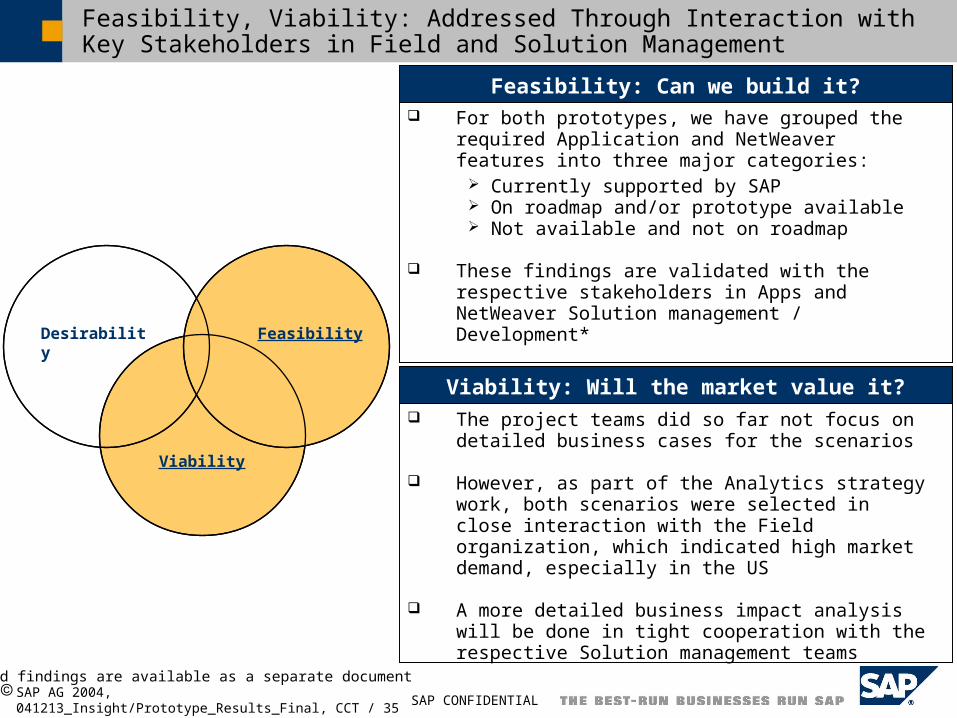
Feasibility, Viability: Addressed Through Interaction with Key Stakeholders in Field and Solution Management
For both prototypes, we have grouped the required Application and NetWeaver features into three major categories:
Currently supported by SAP On roadmap and/or prototype available Not available and not on roadmap
These findings are validated with the respective stakeholders in Apps and NetWeaver Solution management / Development*
Feasibility: Can we build it?
The project teams did so far not focus on detailed business cases for the scenarios
However, as part of the Analytics strategy work, both scenarios were selected in close interaction with the Field organization, which indicated high market demand, especially in the US
A more detailed business impact analysis will be done in tight cooperation with the respective Solution management teams
Viability: Will the market value it?
Desirability Feasibility
Viability
* Detailed findings are available as a separate document
SAP CONFIDENTIAL SAP AG 2004, 041213_Insight/Prototype_Results_Final, CCT / 36
Next Steps
Engage with Solution Management + Development Management
Share outcome/findings of competitor study Share outcome/findings of end-user interviews Share use cases
CCT and Solution Management to evaluate and prioritize potential solution opportunities for improving end-user usability, especially in areas where SAP today has little or nor presence (e.g. flexible query, flexible graphing, etc.)
Short-term Long-term
CCT and Solution Management to evaluate and prioritize the leveraging of MSFT tools in overall solution
CCT to further synthesize findings from usability scenario in regards to the PIL and Solution Production processes
SAP CONFIDENTIAL SAP AG 2004, 041213_Insight/Prototype_Results_Final, CCT / 37
Agenda
What we set out to do
What we didPipeline Performance ManagementAnalysis for Category/Brand Management
Summary of Thoughts: Desirability, Feasibility, Viability
Appendix: CCT Design Process Insights
SAP CONFIDENTIAL SAP AG 2004, 041213_Insight/Prototype_Results_Final, CCT / 38
Gaining Empathy for the End-User
Voice of the End-User
SynthesizeUnderstand& Observe
Final Prototype
Design
Prototype
Rapid End User Feedback
SynthesizeUnderstand& Observe
Final Prototype
DesignDesign
Prototype
Rapid End User Feedback
Overcome barriers to seeing end users: both from SAP and from customers.
Don’t underestimate prep time; don’t rely only on clients Observe in pairs Engage in in-context conversions, not a formal interview Jumpstart the conversation with quick Q&A Document the experience with digital media Look for real-life use; demos are not enough
Lessons
Research on brand/category management End-User observations at the participant's work
station Where allowed, digitally recorded the entire visit User observations of SAP and non-SAP sites Conducted “analogous” observations to immerse
oneself in the problem and broaden the definition of competition
What We Did
Photo Removed
SAP CONFIDENTIAL SAP AG 2004, 041213_Insight/Prototype_Results_Final, CCT / 39
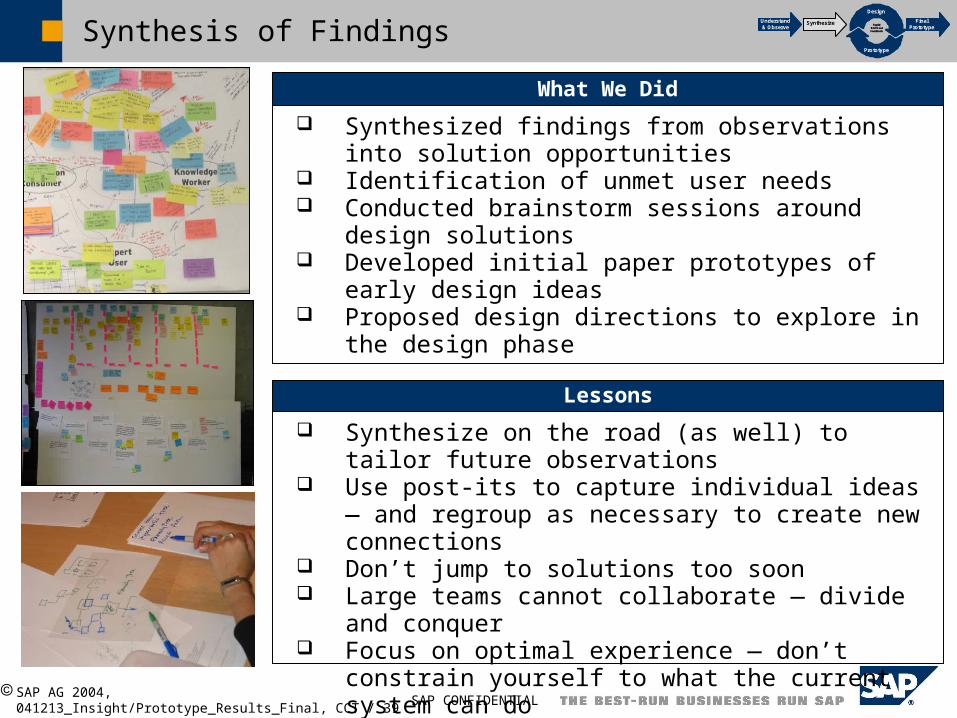
Synthesis of Findings
Synthesize on the road (as well) to tailor future observations
Use post-its to capture individual ideas — and regroup as necessary to create new connections
Don’t jump to solutions too soon Large teams cannot collaborate — divide and conquer Focus on optimal experience — don’t constrain
yourself to what the current system can do
Lessons
Synthesized findings from observations into solution opportunities
Identification of unmet user needs Conducted brainstorm sessions around design
solutions Developed initial paper prototypes of early design
ideas Proposed design directions to explore in the design
phase
What We Did
SynthesizeUnderstand & Observe
Final Prototype
Design
Prototype
Rapid End User Feedback
SynthesizeUnderstand & Observe
Final Prototype
DesignDesign
Prototype
Rapid End User Feedback
SAP CONFIDENTIAL SAP AG 2004, 041213_Insight/Prototype_Results_Final, CCT / 40
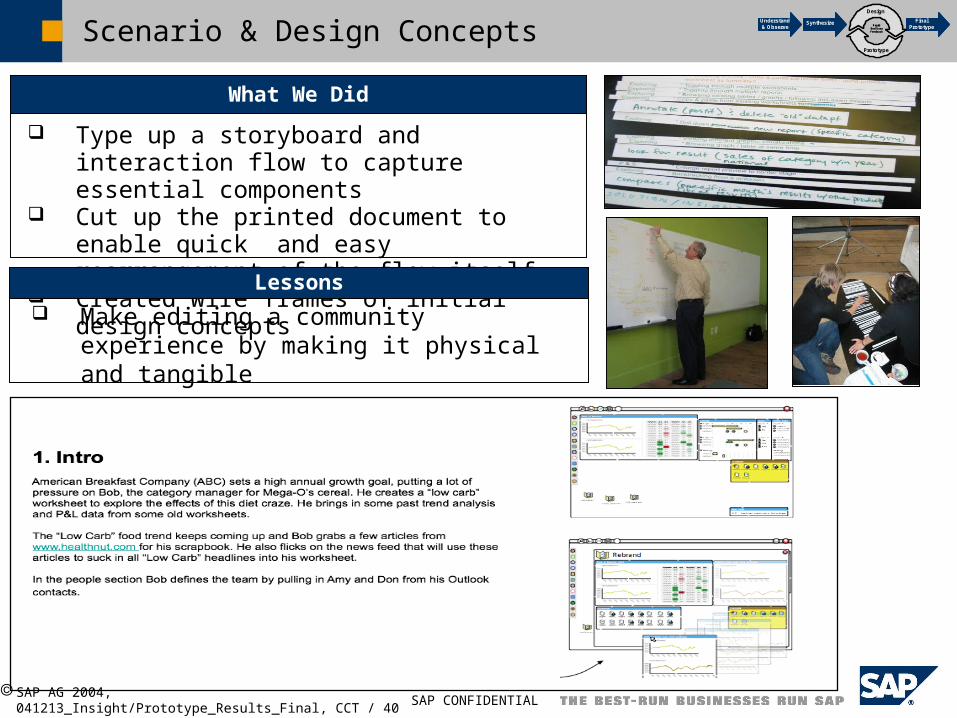
Scenario & Design Concepts
Type up a storyboard and interaction flow to capture essential components
Cut up the printed document to enable quick and easy rearrangement of the flow itself.
Created wire frames of initial design concepts
What We Did
SynthesizeUnderstand & Observe
Final Prototype
Design
Prototype
Rapid End User Feedback
SynthesizeUnderstand & Observe
Final Prototype
DesignDesign
Prototype
Rapid End User Feedback
Make editing a community experience by making it physical and tangible
Lessons
SAP CONFIDENTIAL SAP AG 2004, 041213_Insight/Prototype_Results_Final, CCT / 41
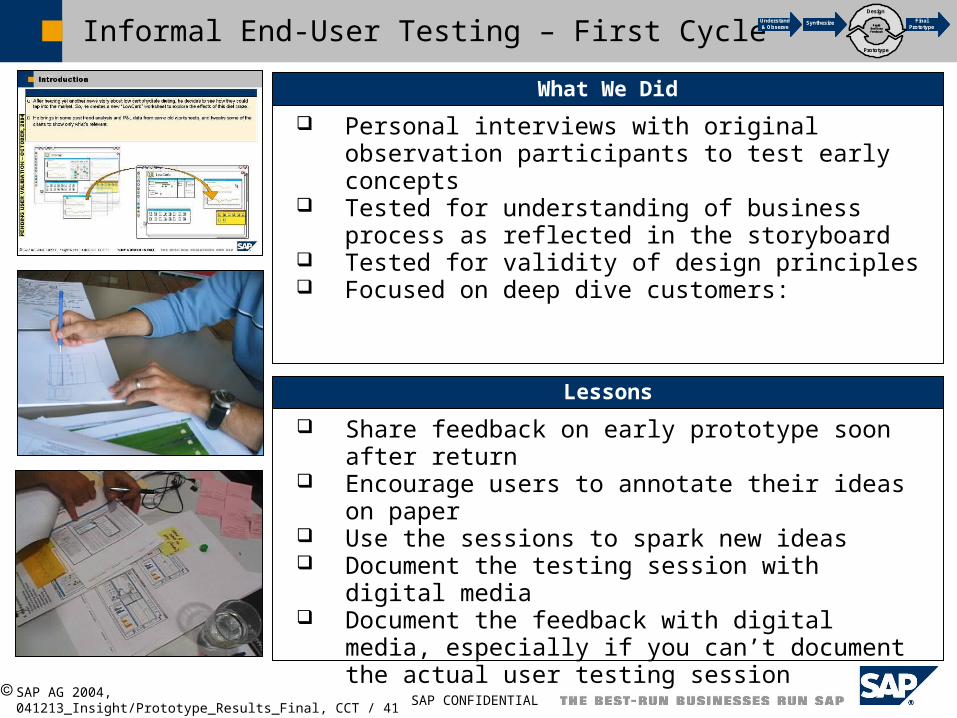
Informal End-User Testing – First Cycle SynthesizeUnderstand & Observe
Final Prototype
Design
Prototype
Rapid End User Feedback
SynthesizeUnderstand & Observe
Final Prototype
DesignDesign
Prototype
Rapid End User Feedback
Personal interviews with original observation participants to test early concepts
Tested for understanding of business process as reflected in the storyboard
Tested for validity of design principles Focused on deep dive customers:
What We Did
Share feedback on early prototype soon after return Encourage users to annotate their ideas on paper Use the sessions to spark new ideas Document the testing session with digital media Document the feedback with digital media, especially
if you can’t document the actual user testing session
Lessons
SAP CONFIDENTIAL SAP AG 2004, 041213_Insight/Prototype_Results_Final, CCT / 42
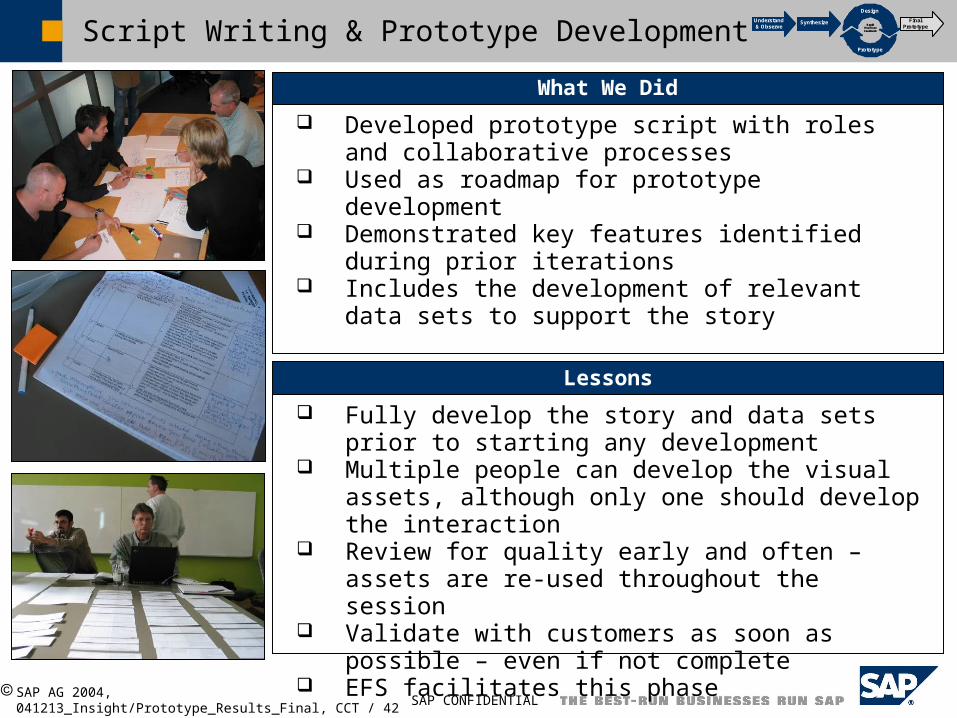
Script Writing & Prototype Development
Developed prototype script with roles and collaborative processes
Used as roadmap for prototype development Demonstrated key features identified during prior
iterations Includes the development of relevant data sets to
support the story
What We Did
Fully develop the story and data sets prior to starting any development
Multiple people can develop the visual assets, although only one should develop the interaction
Review for quality early and often – assets are re-used throughout the session
Validate with customers as soon as possible – even if not complete
EFS facilitates this phase
Lessons
SynthesizeUnderstand & Observe
Final Prototype
Design
Prototype
Rapid End User Feedback
SynthesizeUnderstand & Observe
Final Prototype
DesignDesign
Prototype
Rapid End User Feedback