employment intensity of output · 2015-12-22 · employment intensity of output: an analysis of...
TRANSCRIPT

Employment Intensity of Output: An Analysis of Non-Agriculture Sectors
Retail Trade Sector
Ankita Gandhi
Institute of Applied Manpower Research Planning Commission, Government of India


Acknowledgments
The author is grateful to The Planning Commission for giving financial support to conduct the to studyon Retail sector.
The key insights of the sector were obtained through detailed interviews with the Retailers Association of India, officials in FICCI and CII and Technopak Advisors Ltd. (who are major consultants for the retail sector). For these insightful deliberations the author wishes to thank Mr. Kumar Rajagopalan, CEO of Retailers Association of India, and Mr. Ankur Bisen, AVP-Consumer Products and Retail, Technopak Advisors. Thank are also due to Dr. P.K. Saxena, Jt. Director, IAMR, Dr. Sanchita Bhattacharya, Asstt. Director and Ms. Deboshree Ghosh, Young Professional, who accompanied the author for these primary visits. The author would also like to thank Dr. Bimal Sahoo, Dy. Director for help with data matters and Mrs. Dipika Sen, Asstt. Editor for editing this report.


Contents
Executive Summary vii
I Introduction – Trade and Repair Sector 1
II Retail Trade 3
III Organized Retail 6
IV FDI in Retail 10
V What happened post-2005? 11
VI Challenges facing the Retail Sector and Policy Implications 13
Bibliography 16
List of Tables
Table 1: Sub-sectors within Trade and Repair Sector 1
Table 2: Employment within the Trade and Repair sector, by Organized and 2 Unorganized Segments (in millions)
Table 3: Employment within Sub-sectors of Retail Trade Sector 6
Table 4: Market Size of Sub-sectors within Retail Trade Sector 6
Table 5: Various Formats of Stores by Classification 7
Table 6: Important Retail Statistics for Major Players in the Sector 9
List of Figures
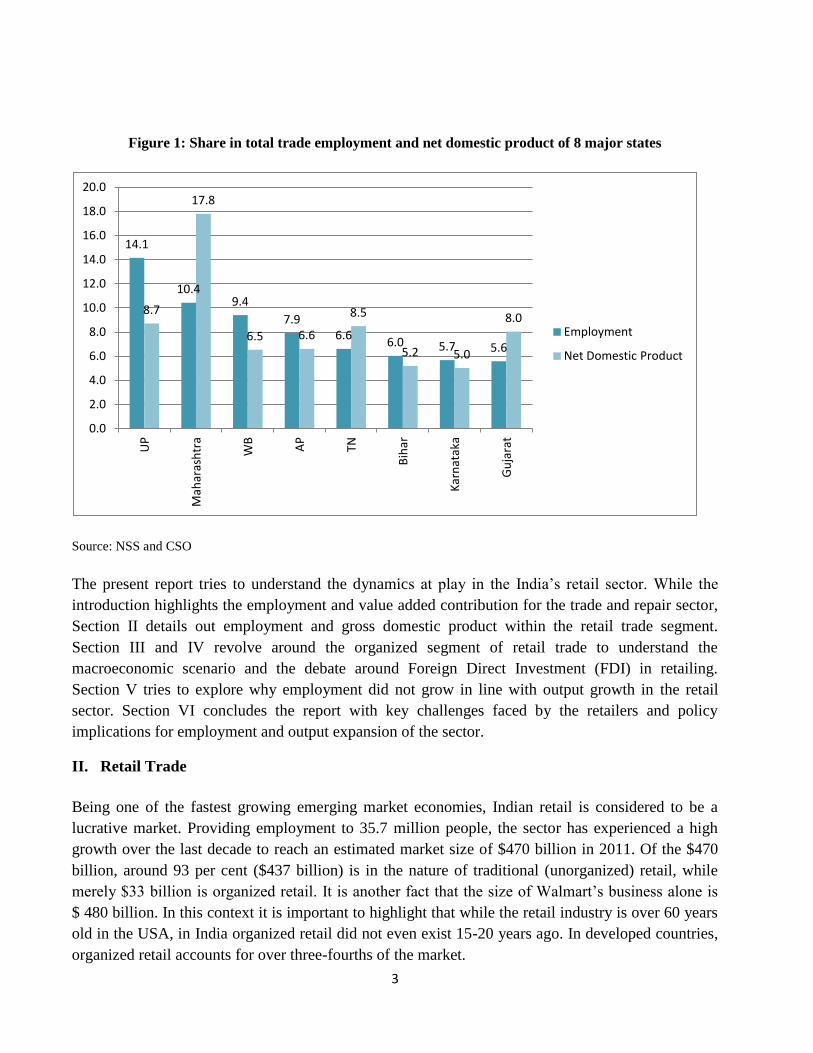
Figure 1: Share in Total Trade Employment and Net Domestic Product 3 of 8 Major States
Figure 2: Value Chain of a Retail Enterprise 8


Executive Summary
As part of the study on ‘Employment Intensity of Output in the Non-Agricultural sectors’, eight non-agricultural sectors namely, Textiles, Wearing Apparel, Food Processing, Real Estate and Construction, Transport, Storage and Communication, Wholesale and Retail Trade, and Computers were selected based on secondary data analysis using the National Sample Survey. The present report analyses the Retail Trade sector and its dynamics in terms of its employment generation potential.
Objectives of the Study
In the wake of sluggish employment growth in the non-agricultural sectors, the study was undertaken to assess the trends and reasons thereof for the slower pace of employment growth in the retail sector during the last decade. The study also aimed at investigating the impediments faced by organized retail for growth both in terms of output and employment; and to examine the impact of growing organized segment on unorganized retail.
Methodology
The study on retail sector was conducted based on secondary data from various sources like National Sample Survey Organization, Central Statistical Organization, Economic Census, Department of Industrial Policy and Planning, Ministry of Commerce and Industry etc. In addition to this various study reports on India’s retail sector by other research institutes and MNCs were also referred to. The key insights of the sector were also obtained through detailed interviews with the Retailers Association of India and Technopak Advisors Ltd., who are major consultants for the retail sector.
Major Findings
The trade sector accounts for a share of 9.5 per cent in total employment and 15 per cent in country’s GVA, providing employment to 43.5 million people. However, growth rate of employment slipped from 3.4 percent during 2000-2005 to 0.08 percent in the second half of the decade (2205-10). Retail trade constitutes of 82 per cent of the Trade and Repair sector.
Being one of the fastest growing emerging market economies, the Indian retail is considered to be a lucrative market. Providing employment to 35.7 million people, the sector has experienced a high growth over the last decade to reach an estimated market size of $470 billion in 2011. Of the $470 billion, around 93 per cent ($437 billion) is in the nature of traditional (unorganized) retail, while merely $33 billion is organized retail. India’s Retail sector is very fragmented and is known to have one of the highest shop densities in the world. Of the 36 million, 34 million workers are employed in the unorganized segment.
Compared to the 1st half of the decade, which witnessed an increase of 4.2 million work opportunities in retail sector, only 0.5 million opportunities were created during 2005-10.

viii
All the increase in the first half of the decade was due to unorganized sector where 5 million workers gained employment, while the organized segment saw an absolute decline. But in the second half, the trend reversed where organized sector saw an increase. Seventy-five lakh workers found work in organized retail during 2005-10. However, the pace of growth for retail slowed down as compared to years before the global financial crisis. The slowdown was experienced in the light of lowering of demand post the crisis accompanied by rising costs. Operating costs rose because of the cut in consumer spending, high rental costs, electricity bills and excise duties. The slowdown led to consolidation within the sector with unviable stores closing down. Worst affected were the apparel stores – a reflection of the hard hit textiles & wearing apparel sector in the country. Reforming the APMC Act, supply chain consolidation and implementation of GST are some of the measures that could be adopted to improve the value addition and employment opportunities in the retail sector, particularly the organized segment.
1
I. Introduction
The Wholesale and Retail trade; Repair of motor vehicles, motorcycles and personal and
household goods (Trade and Repair sector for short)
Together this sector accounts for a share of 9.5 per cent in total employment and 15 per cent in
country’s GVA. Providing employment to 43.5 million people, this sector is the largest employer
among the services sector and third largest among the non-agricultural sectors after total
manufacturing (50.7 million) and construction (44 million). When looking at only non agricultural
employment, this sector alone accounts for 19.4 per cent of workers (2009-10).
Over the past decade, trade and repair sector witnessed an absolute increase in employment of 6.9
million workers, an increase in magnitude greater than manufacturing sector taken as a whole (6.7
million). While this sector experienced an increase of 6.74 million workers in the first half of the
decade (1999-2000 and 2004-5), the sector was not able to withstand the economic downturn, and
witnessed a slowdown in expansion in employment, with a marginal increase of 0.17 million in the
second half of the decade (2004-5 and 2009-10). The sector has grown by over 9 per cent per annum
over the decade and has seen a rise in its contribution to total Gross Value Added (GVA) from 12
per cent in 1999-2000 to 15 per cent in 2009-10. But the dynamics over employment growth have
varied over the decade, thus, resulting in jobless growth during the decade 2000-2010.
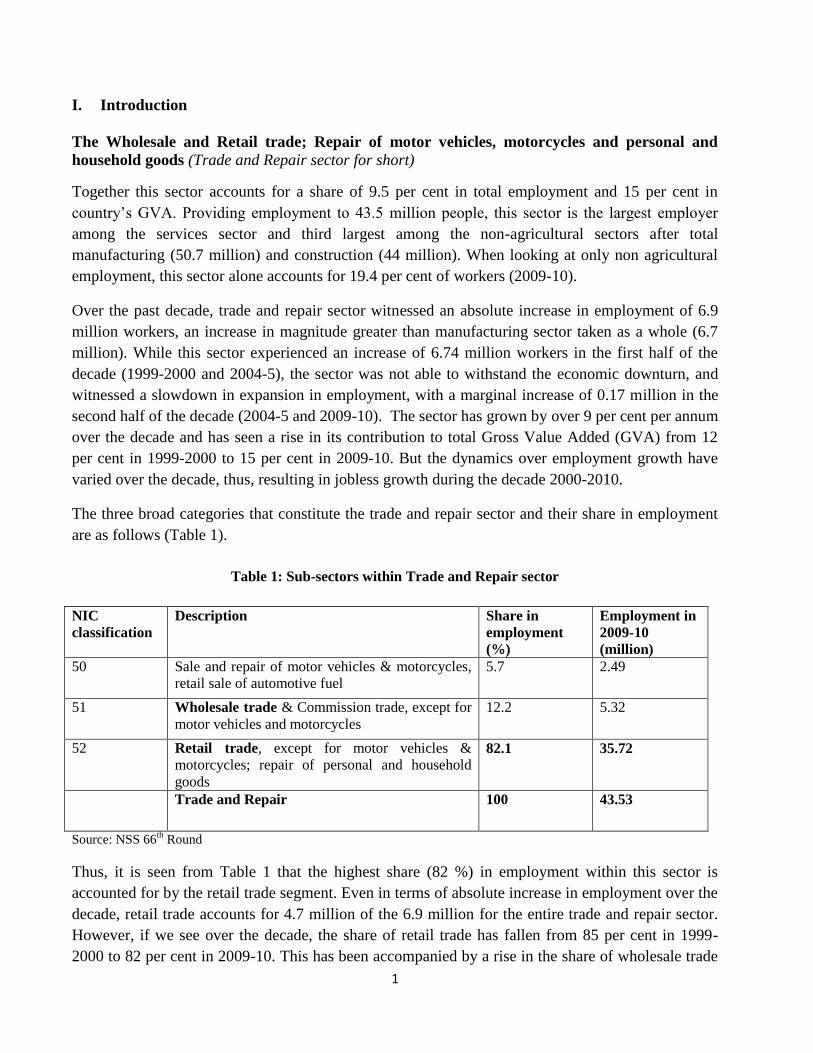
The three broad categories that constitute the trade and repair sector and their share in employment
are as follows (Table 1).
Table 1: Sub-sectors within Trade and Repair sector
NIC
classification
Description Share in
employment
(%)
Employment in
2009-10
(million)
50 Sale and repair of motor vehicles & motorcycles,
retail sale of automotive fuel
5.7 2.49
51 Wholesale trade & Commission trade, except for
motor vehicles and motorcycles
12.2 5.32
52 Retail trade, except for motor vehicles &
motorcycles; repair of personal and household
goods
82.1 35.72
Trade and Repair 100 43.53
Source: NSS 66th
Round
Thus, it is seen from Table 1 that the highest share (82 %) in employment within this sector is
accounted for by the retail trade segment. Even in terms of absolute increase in employment over the
decade, retail trade accounts for 4.7 million of the 6.9 million for the entire trade and repair sector.
However, if we see over the decade, the share of retail trade has fallen from 85 per cent in 1999-
2000 to 82 per cent in 2009-10. This has been accompanied by a rise in the share of wholesale trade

2
segment from 9.7 per cent in 1999-2000 to 12 per cent in 2009-10 with an increase in 1.8 million
workers in the segment.
While looking at the employment within the organized and unorganized segments of trade and repair
sector it is seen that most of the increase in the first half of the decade for the sector was due to an
increase of 7 million in the unorganized segment, while organized sector saw an absolute decline.
But in the second half, the trend reversed where organized sector saw an increase of 1 million (which
is good news), but the absolute increase was offset by a decline in the employment in the
unorganized segment. Of this one million increase, 0.75 million increases was accounted for by
organized retail (Table 2).
Table 2: Employment within the Trade and Repair sector, by Organized and Unorganized Segments
(in millions)
NIC 1999-2000 2004-05 2009-10
Total Unorgan
ized
Organized Total Unorgan
ized
Organized Total Unorgani
zed
Organi
zed
50 2.05 1.84 0.21 2.69 2.4 0.29 2.49 2.01 0.48
51 3.56 3.13 0.43 5.44 4.74 0.7 5.32 4.51 0.81
52 31.02 29.32 1.69 35.23 34.28 0.95 35.72 34.03 1.7
Trade
and
Repair
36.63 34.3 2.33 43.36 41.43 1.93 43.53 40.55 2.98
Source: NSS various rounds
Trade sector has seen decelerating growth both in terms of output/value added and employment.
While growth rate per annum in value added has dropped from 10.3 per cent during 2000-2005 to 9
per cent during the second half of the decade, the fall in employment growth rates is more severe.
Compound annual growth rate for employment declined from 3.4 per cent to less than 1 per cent in
2005-2010. It therefore makes it imperative to investigate what happened post 2005 that can explain
such a slowdown.
Trade and repair sector is also a major employer and contributor to domestic product in most states.
It accounts for over 8 per cent of total employment and over 10 per cent of total net state domestic
product in most of the states. For instance in case of Delhi, share of trade in total employment is as
high as 27 per cent and in net state domestic product1 around 20 per cent. There is even a geographic
concentration of the sector across 8 major states –Uttar Pradesh, Maharashtra, West Bengal, Andhra
Pradesh, Tamil Nadu, Bihar, Karnataka, and Gujarat. Together these states account for two-third
share in total trade employment and contribution to Net Domestic Product.
1 CSO provides estimates for share of Trade, Hotels and restaurants (combined) in Net State Domestic Product. However, share of
hotels and restaurants is below 10 per cent within the combined trade and hotels segment.
3
Figure 1: Share in total trade employment and net domestic product of 8 major states
Source: NSS and CSO
The present report tries to understand the dynamics at play in the India’s retail sector. While the
introduction highlights the employment and value added contribution for the trade and repair sector,
Section II details out employment and gross domestic product within the retail trade segment.
Section III and IV revolve around the organized segment of retail trade to understand the
macroeconomic scenario and the debate around Foreign Direct Investment (FDI) in retailing.
Section V tries to explore why employment did not grow in line with output growth in the retail
sector. Section VI concludes the report with key challenges faced by the retailers and policy
implications for employment and output expansion of the sector.
II. Retail Trade
Being one of the fastest growing emerging market economies, Indian retail is considered to be a
lucrative market. Providing employment to 35.7 million people, the sector has experienced a high
growth over the last decade to reach an estimated market size of $470 billion in 2011. Of the $470
billion, around 93 per cent ($437 billion) is in the nature of traditional (unorganized) retail, while
merely $33 billion is organized retail. It is another fact that the size of Walmart’s business alone is
$ 480 billion. In this context it is important to highlight that while the retail industry is over 60 years
old in the USA, in India organized retail did not even exist 15-20 years ago. In developed countries,
organized retail accounts for over three-fourths of the market.
14.1
10.4 9.4
7.9 6.6
6.0 5.7 5.6
8.7
17.8
6.5 6.6
8.5
5.2 5.0
8.0
0.0
2.0
4.0
6.0
8.0
10.0
12.0
14.0
16.0
18.0
20.0
UP
Mah
aras
htr
a
WB
AP
TN
Bih
ar
Kar
nat
aka
Gu
jara
t
Employment
Net Domestic Product

4
India’s Retail sector is very fragmented and is known to have one of the highest shop densities in the
world. In 2001, it was estimated that there were 11 outlets for every 1000 people2 and this is only
increasing with the rising number of shopping malls. Indian retail sector is often categorized into
three groups, (i) organized large (supermarkets and retail chains which possess legal permissions or
licenses and are registered with the sales tax/VAT etc.), (ii) unorganized (family managed local
kirana/‘mom & pop stores’ and general stores in the nature of own account enterprises registered
under the Shops and Establishments Act and administered by the local authorities), and (iii) informal
sector enterprises (tiny grocery and vegetable shops, paan/beedi kiosks selling variety of items, way-
side vendors and handcarts operating without any licenses) (Prasad and Koshy). The last two
segments comprise of the unorganized sector and provide employment to 34 million workers, i.e.
95 per cent of the total employment, in line with the market share.
Within the trade and repair sector as well, it is only retail trade where organized sector employment
is only about 5 per cent. Both sale and repair of motor vehicles and wholesale trade sub-sectors have
over 15 per cent employment in the organized segment. Providing employment to 34 million
workers, the nature of dynamics in the unorganized segments is quite similar to that of agriculture.
That is, despite low productivity, the family engages in this economic activity. However, over the
years, there has been a migration out of this sector due to its rising unattractiveness and rising
aspiration levels of the youth who rather prefer to work in an organized retail store than selling in
those kirana shops. In fact, one thing that goes in favour of employment in the organized retail
segment is the willingness of people to work in the disciplined, air conditioned environment of a
retail store. Many of the workers in manufacturing and traditional handicrafts sectors reported
preference for sending their children to organized retail stores rather than working all day in
strenuous jobs.
The retail sector grows in line with the growth rate of the economy. Various factors have been
favourable for growth of the Indian retail sector over the past decade. The high Gross Domestic
Product (GDP) growth rate, the growing middle class, rising wages, disposable incomes and
therefore consumption levels of Indian households, the demographic dividend and westernization, all
have contributed towards a growing mall culture with facilitates ‘one roof for all purchases’.
Economic Census, 2005 estimated that there were around 15 million retail trade enterprises, which
grew from 10.7 million enterprises in 1998. Of these 15 million enterprises, approximately 10.5
million were Own Account Establishments (OAE), i.e., those establishments without any hired
worker on a fairly regular basis, normally run by members of the household. Sixty per cent of these
own account retail enterprises were located in rural areas. In terms of employment, Economic
Census 2005 estimated that 25 million workers were employed in retail trade, 13.7 million in the
urban sector, while 11.4 in the rural sector. Of these 25 million, 12.7 million were engaged in own
account establishments.
2 http://www.atimes.com/atimes/Global_Economy/FA31Dj03.html last accessed on 28th June, 2012

5
The distribution within the retail trade segment at National Industrial Classification (NIC) 3-digit
classification as per Employment-Unemployment rounds of National Sample Surveys (NSS) is
shown in Table 3. Retail sale of food, beverages and tobacco in specialized stores along with retail
trade of new goods in specialized stores (which includes pharmaceutical and medical goods,
cosmetic and toilet articles; textiles, clothing, footwear and leather goods; household appliances;
hardware, paints and glass) together account for over 83 per cent of total employment in the retail
sector and 68 per cent of employment in the trade and repair sector.
Table 3: Employment within Sub-sectors of Retail Trade Sector (2009-10)
NIC 3
digit
Description Employment
(in million)
Share within
Retail trade
Share within
total Trade &
Repair sector
521 Non-specialized retail trade in stores 2.23 6.2 5.1
522 Retail sale of food, beverages and tobacco in
specialized stores 18.37 51.4 42.2
523 Other retail trade of new goods in specialized
stores 11.39 31.9 26.2
524 Retail sale of second-hand goods in stores 0.15 0.4 0.3
525 Retail trade not in stores 1.03 2.9 2.4
526 Repair of personal and household goods 2.56 7.2 5.9
52 Retail trade 35.72 100.0 82.1
Source: NSS 66th
Round
Retail sale of food, beverages and tobacco segment mostly includes family run small businesses in
the form of kirana stores, small stalls, paan and beedi shops, hand-cart hawkers and pavement
vendors. These account for almost 72 per cent of retail trade. Technopak Advisors Pvt. Ltd.
estimated that the total number of traditional retailers was 13 million in 2006. The unorganized
segment approximately serves 94 per cent of the market, while the big branded retail outlets like
bigbazaar, reliance fresh, big apple stores etc account for only about 6 per cent. In line with the
share in employment, apparel, jewellery, consumer durables, pharmacy, and footwear (retail trade of
new goods in specialized stores) account for another 23 per cent share in retail trade (Table 4). It is
also seen that the majority of the retail market lies in urban areas, but with rising wages and
consequently purchasing power of rural households, the rural segment of retail is also growing.

6
Table 4: Market Size of Sub-sectors within Retail Trade Sector
In Rs. Cr Share in
Retail
trade
By Geography (%) By Format (%)
Category
Market Size
(2011) Urban Rural Organized Unorganized
Food, Beverage &
Grocery 1,574,954 72 52 48 2.1 97.9
Apparel 175,000 8 49 51 19 81
Footwear 26,500 1 70 30 42 58
Jewellery & Watches 128,000 6 54 46 10.2 89.8
Furniture & Furnishings 45,500 2 51 49 0 100
Consumer Durables & IT 113,500 5 54 46 20 80
Non Food - FMCG - 0 0 0 0
Skin Care 3,863 0 85 15 30 70
Personal Care 28,976 1 69 31 17 83
Home Care 17,208 1 51 49 20 80
Pharmacy 69,500 3 42 58 4 96
Total (Rs. Crore) 2,183,000 100 1138133 1044867 125498 2057502
% of Market 52% 48% 6% 94%
Source: Technopak Advisors Pvt. Ltd.
III. Organized Retail
Organized retail accounts for about 5 per cent share in employment and 6 per cent share in market
value. But it is interesting to note that some of the sub-sectors within retail have a greater share in
the organized format. Most prominent among those sub-sectors are footwear, non-food fast moving
consumer goods (FMCGs), consumer durables and IT and jewellery and watches. These sectors
parallel have a larger concentration in urban markets. The fact is also a reflection of the expanding
consumption basket in favour of luxuries with rising incomes.
With the growing economy, there has been a growth in organized retailing. As noted earlier, while
all the increase in employment in the first half of the decade was on account of unorganized retail,
during 2005-10, there was an addition of approximately 0.8 million workers in organized retail.
This growth can also be determined by the rising number of shopping malls and modern retail
formats. There were just three shopping malls in India in 1999. This number rose to 137 by the end
of 2006 to reach to 350 by 2008 (Technopak Advisors Pvt. Ltd.). From Department and Specialty
stores, to Discount stores, organized retail has expanded with newer formats like the hypermarkets
and Supermarkets/Convenience stores. Store formats create a distinct image of the Retail chain/store
among its customers. An industry player gets a competitive advantage by an innovative mix of
the various formats. Scalability is the most crucial factor to decide the ideal format mix by a player.
An ideal mix is decided keeping the following considerations: (i) long term profitability,
(ii) customer satisfaction, (iii) target customer segments, and (iv) ability to create a distinct
competitive advantage by a unique value proposition. The various store formats are detailed in
Table 5.

7
Table 5: Various Formats of Stores by Classification
By Merchandise By Size By Location By Price By Concessions
Family store Super Store Chain Store Bazaar Stopover
Specialty Stores Hyper store High Street Store Everyday low
price
Kiosk
Departmental Store Plaza Destination Store Category killer
Super market Shopping Mall Convenience
store
Factory Outlet
Emporium Warehouse
Single price
denomination
Source: Retailers Association of India
The geographic penetration of modern retail has been driven by the high population density in the
metropolitan cities and their surrounding tier-1 towns. This penetration started in the late1990s and
has been the highest in the southern states of Tamil Nadu, Kerala, Karnataka and Andhra Pradesh.
It has been possible due to the less complicated licensing regulations by the state and local
authorities. For instance, there is an online licensing process in Andhra Pradesh that reduces time lag
and promotes efficiency (ICRIER 2008). The penetration has now spread to the western
(Maharashtra and Gujarat) and northern parts of the country (Delhi NCR, Punjab, western UP) as
well. Mumbai, Delhi & NCR, Kolkata, Bangalore, Chennai, Hyderabad and Ahmedabad together
account for 20 per cent of total retail consumption of Rs. 23403 billion in India (Technopak
Advisors Pvt. Ltd).
Organized retail still in its nascent stage, is engaged in backend operations like merchandising,
logistics and distribution, marketing, purchase and replenishment and corporate services. Large retail
stores often create secondary employment due to these backend operations. For example, each store
needs security guards; delivery requires courier and transport services. However, around 75-80 per
cent employment in the sector is engaged in front end operations of store management. A typical
value chain in an organized retail store is shown in Figure 2.

8
Figure 2: Value Chain of a Retail Enterprise
Source: Retailers Association of India
Due to the nature of operations in the retail business, not very highly educated workers/employees
are needed in the sector. As per IMaCS Analyis (data received from RAI), of the total human
resource in the sector, around 40 per cent are class 12th
pass outs, while 30 per cent of them are mere
graduates. Thus, this sector provides an avenue for employment for people with lower level of
education and training unlike in case of manufacturing or other services like financial intermediation
or information technology. IMaCS in its analysis has projected that the incremental human resource
requirement in case of retail will be 17 million by 2022, of which there will be a requirement of 12
million for graduates and 12th
class pass outs. In terms operations, of the 17 million, 13 million
incremental human resource will be required in front end store operations (RAI).
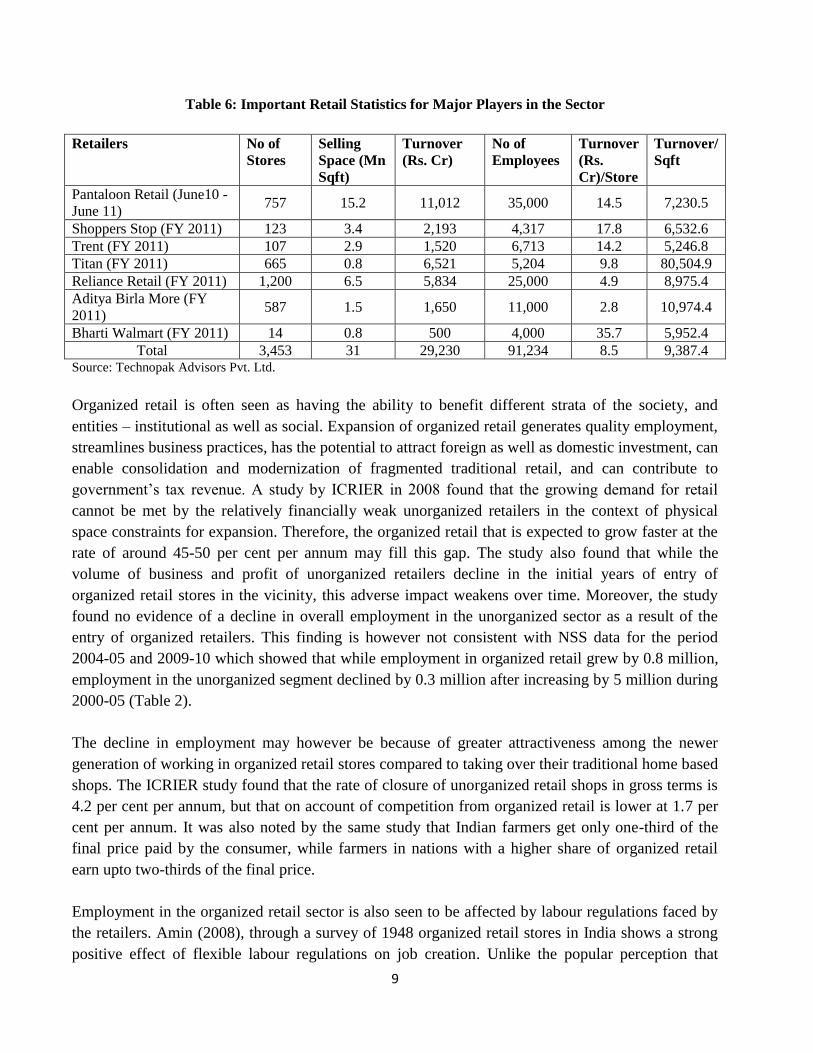
Shoppers Stop Ltd. is India’s first departmental retail chain. Pantaloon Retail India Ltd. is India’s
largest retail firm by revenue. Some of the other big players in organized retail sector are Reliance
Retail, Aditya Birla Retail, Bharti Walmart, and Tata’s Trent and Titan. The details of their business
and store statistics are shown in Table 6.
9
Table 6: Important Retail Statistics for Major Players in the Sector
Retailers No of
Stores
Selling
Space (Mn
Sqft)
Turnover
(Rs. Cr)
No of
Employees
Turnover
(Rs.
Cr)/Store
Turnover/
Sqft
Pantaloon Retail (June10 -
June 11) 757 15.2 11,012 35,000 14.5 7,230.5
Shoppers Stop (FY 2011) 123 3.4 2,193 4,317 17.8 6,532.6
Trent (FY 2011) 107 2.9 1,520 6,713 14.2 5,246.8
Titan (FY 2011) 665 0.8 6,521 5,204 9.8 80,504.9
Reliance Retail (FY 2011) 1,200 6.5 5,834 25,000 4.9 8,975.4
Aditya Birla More (FY
2011) 587 1.5 1,650 11,000 2.8 10,974.4
Bharti Walmart (FY 2011) 14 0.8 500 4,000 35.7 5,952.4
Total 3,453 31 29,230 91,234 8.5 9,387.4 Source: Technopak Advisors Pvt. Ltd.
Organized retail is often seen as having the ability to benefit different strata of the society, and
entities – institutional as well as social. Expansion of organized retail generates quality employment,
streamlines business practices, has the potential to attract foreign as well as domestic investment, can
enable consolidation and modernization of fragmented traditional retail, and can contribute to
government’s tax revenue. A study by ICRIER in 2008 found that the growing demand for retail
cannot be met by the relatively financially weak unorganized retailers in the context of physical
space constraints for expansion. Therefore, the organized retail that is expected to grow faster at the
rate of around 45-50 per cent per annum may fill this gap. The study also found that while the
volume of business and profit of unorganized retailers decline in the initial years of entry of
organized retail stores in the vicinity, this adverse impact weakens over time. Moreover, the study
found no evidence of a decline in overall employment in the unorganized sector as a result of the
entry of organized retailers. This finding is however not consistent with NSS data for the period
2004-05 and 2009-10 which showed that while employment in organized retail grew by 0.8 million,
employment in the unorganized segment declined by 0.3 million after increasing by 5 million during
2000-05 (Table 2).
The decline in employment may however be because of greater attractiveness among the newer
generation of working in organized retail stores compared to taking over their traditional home based
shops. The ICRIER study found that the rate of closure of unorganized retail shops in gross terms is
4.2 per cent per annum, but that on account of competition from organized retail is lower at 1.7 per
cent per annum. It was also noted by the same study that Indian farmers get only one-third of the
final price paid by the consumer, while farmers in nations with a higher share of organized retail
earn upto two-thirds of the final price.
Employment in the organized retail sector is also seen to be affected by labour regulations faced by
the retailers. Amin (2008), through a survey of 1948 organized retail stores in India shows a strong
positive effect of flexible labour regulations on job creation. Unlike the popular perception that

10
labour laws affect only organized manufacturing enterprises and are not implemented in the retail
sector, the World Bank survey found that 27 per cent of the retail stores in the sample reported
labour regulations as an obstacle, which would not have been a concern in case of non-enforcement.
Labour regulations for the retail sector are contained in the Shops and Establishments Act under the
jurisdiction of the State governments. Amin (2008) estimated that labour reforms are expected to
increase employment by 22 per cent of the current average store level. He also estimated that labour
reforms (instilling flexibility for the retailers) could reduce the level of informality in employment
by as much as 33 per cent.
IV. FDI in Retail
Way back in 1990s, India had initially permitted foreign retailers to sell directly to retail customers.
But in 1997, the Foreign Investment Promotion Board (FIPB) decided to encourage foreign investors
to set up manufacturing facilities in the country, instead of permitting entry to merely traders. This
norm of 1997 categorized foreign companies into three main categories:3
a. Companies that set up domestic manufacturing facilities and sold products manufactured
domestically. There were no restrictions on the sale of products by these set of companies.
Thus, consumer durable companies like Sony, LG, Samsung and Phillips came in India
which manufacture and sell products in India.
b. Companies that came in India to trade, prior to 1997 norms
c. Companies that came in to trade after the 1997 norms were adopted. Those foreign retailers
can set up wholly owned subsidiaries in India for trade purpose, but are allowed to sell only
to wholesalers (who are in effect domestic retailers) and not to retail customers. These set of
overseas retailers come in as franchisees and/or cash and carry wholesalers because there are
no restrictions on opening wholesale stores. FDI to the extent of 100 per cent was permitted
under Government approval route.
In 2006, FDI in cash and carry wholesale trading was brought under automatic route. Between April
2000 to March 2010, FDI inflows of US $ 1.779 billion (Rs. 7,799 crore) were received in the sector.
This comprised 1.5 per cent of the total FDI inflows received during the period. But FDI in Multi-
Brand retailing is prohibited in India. However, FDI in Single-Brand Retailing to the extent of
51 per cent was also permitted in 2006. An FDI inflow of US $ 194.7 million (Rs. 901.64 crore)
was received between April, 2006 and March, 2010, comprising 0.21per cent of the total FDI
inflows during the period, under the category of single brand retailing (DIPP 2010). In 2012, 100 per
cent FDI in single brand retail was allowed.
There are often concerns that FDI in retail might displace workers operating from their small shops
due to competition and the lack of level playing field. But the example of China may help to
overcome such fears. China permitted FDI in retailing upto 49 per cent in 1992. However, since
1994, there are no equity restrictions on foreign ownership. Since then, employment in retail and
3 http://www.atimes.com/atimes/Global_Economy/FA31Dj03.html last accessed on 28th June, 2012
11
wholesale trade in China increased from 4 per cent of total labour force in 1992 to about 7 per cent
in 2001. In absolute terms it meant an increase from 28 million to 54 million workers in the sector.
Thailand permits 100 per cent foreign entry, with no limit on the number of outlets. Entry of foreign
players boosted the development of organized retailing which has made Thailand an important
shopping destination. FDI in retail sector without limits on equity participation is permitted in Brazil,
Argentina, Singapore, and Indonesia. In many countries, opening of FDI has led to the development
of organized retail through the entry of major players (KPMG, 2012).
In September, 2012, the government eased FDI restrictions in multi-brand retailing by allowing 51
per cent FDI in the segment. However, the 30 per cent (of the value of products sold) local sourcing
norm from small scale sector at the aggregate level has been made mandatory for both single as well
as multi-brand retailing. While it is upto the individual states to decide whether to let the foreign
investors or not, the government relaxed its restriction of limiting multi-brand outlets to cities with
million plus population. However, the government did not allow companies with FDI to sell their
products through the internet in India, shattering the potential for e-commerce. “E-commerce is a
capital intensive business in India on account of the high cost of logistics and customer acquisition”.4
V. What happened post-2005?
As was noted earlier, compared to the first half of the decade, which witnessed an increase of 4.2
million work opportunities in retail sector, it could only absorb an additional 0.5 million workers
during 2005-10. Even the pace of growth for retail space slowed down compared to years before the
global financial crisis. Retail as a business grows when economy is expected to grow. The larger
retailers faced the biggest hit due to the crisis. Consumer sentiment changed from implusive buying
to need based buying. The slowdown resulted in a consolidation within the sector with unviable
stores closing down. For example, 1600 Subhiksha stores across the country were shut down
in 2009.
The tax structure also strikes hard the retailers, and it was especially felt during the crunch period
post the crisis. Three per cent of profits for retailers often get eroded because of service tax. 10.3 per
cent service tax on rentals also worsens the burden of real estate cost on the retailers. Also, 10-15 per
cent of the retailers’ turnover is paid as occupation charges, which is almost three times compared to
other countries across the globe. Moreover, rising costs of electricity for commercial establishments
is also eating away profits for organized retailers. For instance, electricity costs accounted for 3 per
cent of sales for Subhiksha stores (Kumar Rajagopalan, RAI). In view of one of the experts, there is
a drought of new retail construction in Mumbai and Delhi.5
4http://www.livemint.com/Politics/nkLZlitZlmw53LCq2ENCEM/India-wont-allow-ecommerce-by-retail-companies-with-
FDI.html?facet=print last accessed on 26th September, 2012. 5 http://www.livemint.com/2012/04/17000101/Organized-retailers-change-tac.html last accessed on 10th July, 2012

12
The A.T. Kearney Global Development Retail Index (GRDI), 6 which ranks top 30 emerging
countries for retail development and for potential investment avenues for global retailers, ranked
India 1st in 2005 and 2007. In 2008, India was ranked the second most attractive emerging market in
the retail sector after Vietnam. However, post then, India’s retail sector seems to be losing its
attractiveness. In 2011, India was ranked 4th
, further declining to rank 5 in 2012.
“India's sheer market size and the purchasing power of its growing middle class have contributed to its
prominence as a retail destination. The market remains quite fragmented, yet organized retail has made
impressive gains in 10 years. Regulatory challenges prevented many retailers from entering, while
others were forced into the unfamiliar stance of entering the country with a partner” (A.T Kearney
2011). ‘…limited and expensive desirable real estate and foreign investment restrictions have pushed
the country’s retail market closer to maturity.’7
Almost all major retailers have been witnessing stagnant revenue growth coupled with widening
losses in the aftermath of the crisis. There has also been a drop in sale conversion ratio as well as
sale per unit of retail space. The reckless expansion by the retailers up to 2008-09 was primarily
guided by top line growth and not profitability at the store level. The expansion resulted without a
focus on supply chain development, ‘mindless’ geographic expansion without considering the
complexity of needs of Indian consumers across different states, and ‘needless’ expansion into
multiple formats and product categories without tapping the opportunity to achieve significant scale
and size through single format or limited product categories (Technopak, 2012). Such expansion
tells the story of retailers of all shapes and sizes—Lilliput, Subhiksha, Vishal Mega Mart, Koutons
and The Loot—which currently struggle or have gone out of business.
In response to the slowdown, retail companies across the country undertook change in business
models, tweaked their strategies, and consolidated their operations as the slowing economy
witnessed cut in consumer spending, and high rental costs, electricity bills and excise duties raised
their operating costs. The financial accounts of most publicly listed retailers show retail as a business
of low margins, high costs and high debts. Most notable strategy adopted by the retailers to combat
the crisis has been—fewer formats and stores, and smaller ones. This clearly impacted the
employment in this sector. For instance, the Futures Group reduced its workforce by one-tenth.
Aditya Birla Retail planned to shut around 50 supermarkets in the brand name More, especially in
markets like Mumbai where the rentals are too high. Shoppers Stop exited four of its 11 formats in
the aftermath of the global financial meltdown. Reliance Retail, which has 22 formats from
hypermarkets to speciality stores, exited two formats in 2008-09—Reliance Kitchen, which sold
modular kitchen furniture, and Reliance Wellness, a beauty and lifestyle chain.8 Since the slowdown
6 “The GRDI ranks the retail expansion attractiveness of emerging countries based on a set of 25 variables including economic and
political risk, retail market attractiveness, retail saturation levels, and modern retailing sales area and sales growth. The GRDI focuses
on opportunities for mass merchant and food retailers, which are typically the bellwether for modern retailing concepts in a country.” 7 http://www.atkearney.com/index.php/News-media/global-expansion-a-must-for-retailers-at-kearney-study.html last accessed on 10th
July, 2012 8 http://www.livemint.com/2012/04/17000101/Organized-retailers-change-tac.html last accessed on 15th July, 2012

13
started in late 2008, the small grocery store format has been the biggest casualty as at least 3,000
branded convenience stores were shut by retailers, with the retailers facing that crunch even in
2012.9
VI. Challenges facing the Retail sector and Policy implications
At present, the key challenges that the sector faces are tax arbitrage, real estate cost, shortage of
skilled manpower, and too many government restrictions in the form of the multiple license
requirements, and boundaries of the Agricultural Produce Market Committee (APMC) Act, the
Shops and Establishments Act and Weights and Measures Act.
The biggest challenge for the retail sector has been the lack of investments in the logistics of the
retail chain, which resulted in inefficient market mechanism. For instance, lack of adequate storage
facilities cause heavy losses to the farmers in terms of wastage in quality and quantity of produce.
Though FDI in cold-chain is permitted upto 100 per cent through automatic route, the absence of
FDI in retailing has constrained the FDI inflow into the sector (KPMG 2012).
Lack of ‘industry status’ is another challenge faced by organized retail in India. This often results in
difficulties in procuring organized finance and fiscal incentives. Moreover, lack sophisticated retail
planning which becomes more difficult due to a challenge of acquiring real estate to set up stores,
also affects the sector. Fragmented private land holdings, interchangeability of available space
between commercial and retail use, infrequent auctioning of large government owned vacant lands
and litigation disputes between owners are some of the challenges faced to setup stores.10
Land for
retail store is very difficult to obtain. There is a need to reform the archaic land acquisition laws and
view retail establishments as industrial units to enable the sector to expand.
Retail stores and commercial establishments are covered under the Shops and Establishment Act.
Every state has its own Shops and Establishments Act, so there is no uniformity in the statutory
provisions covering the various states. The operation of this Act is largely confined to Municipal
areas specified in the Act enforced by either the State Labour Commissioner or the local authorities.
In view of Retailers Association of India, as the Act regulates the condition of work and employment
in Shops and Establishments, retailers are subject to a lot of restrictions in their day to day
operations. The main provisions of the Act include compulsory registration of shop/establishment
within thirty days of commencement of work, minimum wages, regulation of hours of work per day
and week, guidelines for spread-over, rest interval, opening and closing hours, closed days, national
and religious holidays, overtime work, rules for employment of children, young persons and women,
rules for annual leave, maternity leave, sickness and casual leave, etc., rules for employment and
termination of service; obligations of employers, obligations of employees, communications of
closure of the establishment within 15 days from the closing of the establishment (Amin 2008).
9 http://www.financialexpress.com/news/retail-inc-stumbles-in-direct-sourcing-of-fresh-produce/937207/0 last accessed
on 25th June, 2012 10
http://www.ficci.com/sector.asp?secid=33

14
To setup a new retail shop/store in India nearly 50 to 55 approvals/permissions/ clearances/ licenses
are required to be obtained from various government agencies. To mitigate such cumbersome
procedure in procuring various approvals/ permissions/licenses, RAI suggests that Government may
consider providing a single window clearance system and also enable online registration of shops
and grant them online certification to expedite the process and avoid corruption therein. Moreover,
keeping in mind the time of maximum sales by retailers (post office working hours, holidays etc.,)
RAI in line with Bombay Shops and Establishments Act of 1948 suggests amendments in the Shops
and Establishments Act to permit the retailers to operate 24X7, 365 days, subject to employers
complying with certain basic provisions of the Act, particularly dealing with health, working hours,
conditions and safety of workers. In addition, restriction on women employment in retail, provided
the employer ensures working hours and safety of women working late hours, should be removed
and guidelines be similar to as applicable in the services sector.
Food and grocery segment accounts for 72 per cent of total retail. Organized retailers have not been
able to directly source fresh fruits and vegetables from farmers, but rely on wholesale markets which
they had intended to bypass. Currently, most of them buy from traditional mandis such as Delhi’s
Azadpur Mandi, where vegetable wholesalers pack crates for different retailers. The presence of
multi-distribution system with so many middlemen (dealers/distributors) brings in added costs and
inefficiencies – defeating the purpose of organized retail in the first place. From the point of view of
retailers, accomplishing a farm-to-fork strategy is difficult in India given the individual small
landholdings of farmers (84 per cent of all farmers are small and marginal farmers with individual
landholding of less than 2.5 acres). In addition, because of lack of supply chain consolidation, food
and groceries segment becomes the most difficult due to the need of entering contracts with
thousands of farmers. In this context, Arvind Singhal of Technopak Advisors argues that “APMC act
must be unequivocally repealed, and farm products given a border-free/octroi-free pan-India market.
This will facilitate creation of more efficient supply chains especially for perishable products and
bring down the prices for the consumers” (Technopak 2011).
Another important piece of legislation that the retailers come under is the Weights and Measures Act
and the Legal Metrology Act which impact the manufacturers and retailers of packaged
commodities. In the opinion of RAI, since organized retailers deal with hundreds of products, it is
difficult to check every stock keeping unit for compliance under the provisions of the Acts. In
addition, there are varying concerns for garment and footwear retailers whose products unlike food
and grocery are not under the category of pre-packed commodities. Often retailers are penalized
under the Act for non-compliance of declarations by the manufacturers/packers/importers. Thus,
RAI in its white paper recommends that only the manufacturer or packer of the product be made
responsible for wrong declaration and not the ultimate retailer.
Retail is a highly labour intensive sector. Growth in employment within the sector is directly
proportional to geographic as well as store expansion. Lack of retail sector reforms has in part been
responsible for fueling inflation in the economy. The fragmented nature of retail sector, multiple

15
intermediaries, and multiple taxation – all need to be addressed through supply side reforms that can
overcome infrastructure bottlenecks. Roll out of Goods and Service Tax (GST) and Direct Tax Code
(DTC) will really boost this sector’s viability. Thus organized retail whether domestic or through
entry of foreign players is expected to improve the supply chain in the long run through increased
investments in both forward and backward infrastructure such as cold chain and storage
infrastructure, warehousing and distribution channels. This in turn is expected to increase
employment (more formal employment) both directly and indirectly (for other related sectors part of
the value chain) and the infusion of technical know-how and capital may also induce skill
development.

16
Bibliography
Amin, Mohammad (2008), 'Labor Regulation and Employment in India's Retail Stores', Social
Protection and Labor Discussion Paper Number 0816, World Bank.
A.T Kearney 2003. ‘2003 Global Retail Development Index: Emerging Market Priorities for Food
Retailers’
A.T Kearney 2011. GRDI: A 10-Year Retrospective The Global Retail Development Index: Lessons
learned from a decade of retail expansion
Department of Industrial Policy and Planning 2010. ‘Discussion paper on FDI in Multi Brand Retail
Trading’, Ministry of Commerce and Industry, Government of India, July
http://dipp.nic.in/english/Discuss_paper/DP_FDI_Multi-BrandRetailTrading_06July2010.pdf
Joseph, Mathew., Soundararjan, Nirupama., Gupta, Manish., Sahu, Sanghamitra 2008. ‘Impact of
Organized Retailing on the Unorganized Sector’, Working Paper no. 222, Indian Council of
Research on International Economic Relations (ICRIER) 2008
KPMG 2012 https://www.in.kpmg.com/SecureData/aci/Files/FDI%20in%20retail2.pdf, last
accessed on October, 2012
Technopak 2011. “FDI in Retail –Heightened Expectations & Obligations”, Arvind Singhal,
Technopak Advisors Pvt. Ltd., 25th
November, 2011
Technopak 2012. “Premature Obituaries of Modern Retail”, MarketMind, Technopak Advisors Pvt.
Ltd., 11th
March, 2012
V.N Prasad and Perumal Koshy. FDI in Multi- brand Retail Trading: MSE Sector Need Level
Playing Field
