employment and pay rolls - fraser · employment and pay rolls detailed report november 1948 united...
TRANSCRIPT

EMPLOYMENT and PAY ROLLS
DETAILED REPORT NOVEMBER 1948
United States Department of Labor Bureau of Labor Statistics
Digitized for FRASER http://fraser.stlouisfed.org/ Federal Reserve Bank of St. Louis

Prepared byDivision of Employment and Occupational Outlook
Branch of Employment StatisticsSamuel Weiss, Chief
Digitized for FRASER http://fraser.stlouisfed.org/ Federal Reserve Bank of St. Louis
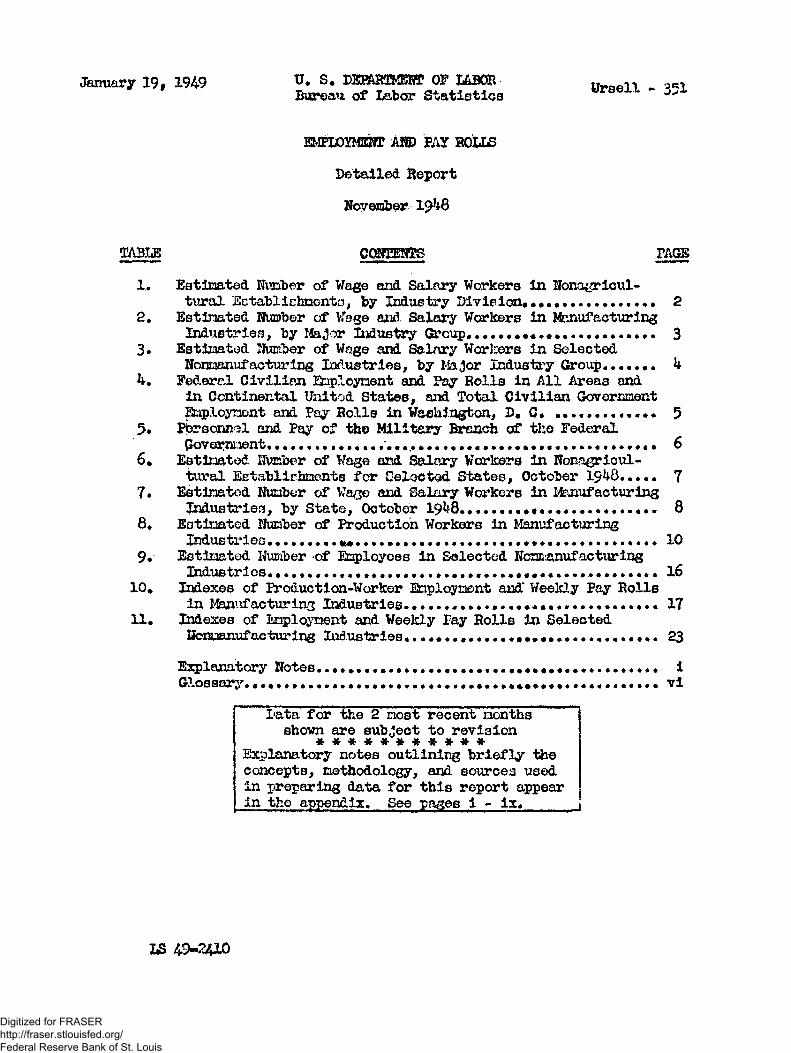
January 19, 1949 U. S. DEBfiBTMEH* OF LABOR Bureau of Labor Statistics Ursell - 351
m Tum m s m> pay boilsDetailed Report November 19**8
TABLE COSmrS PAGE1.. Estimated Nunber of Wage and Salary Workers in Nonagricul
tural Ectablinhncnto, by Industry Division.............. . 22. Estimated Number of Wage and Salary Workers in Manufacturing
Industries, by Major Industry Group........................ 33. Estimated IfuEiber of Wage and Salary Workers in Selected
Nonmanufacturing Industries, by Major Industry Group....... 44. Federal Civilian Qap.loynent and Pay Rolls in All Areas and
in Continental United States, and Total Civilian GovernmentJ&ployoont and Pay Rolls in Washington, D« C» ........ . 5
f>. Pbrsonnol and Pay of the Military Branch of the FederalGovernnent................................... ....... 6
6. Estimted Humber of Wage and Salary Workers in Nonagricultural Establishments for Geloctod States, October 1948..... 7
7. Estimted Number of Wa#e and Salary Workers in ManufacturingIndustries, by State, October I9U8......................... 8
8. Estimted Number of Production Workers in ManufacturingIndustries......... *•................ ........... . 10
9. Estimted Humber of Employees in Selected Norm^nufacturlngIndustries.................. . 16
10. Indexes of Production-Worker Enploynent and* Weekly Pay Rollsin Manufacturins Industries.. 1 7
11. Indexes of Employment and Weekly Pay Rolls in SelectedIfcnuanufacturing Indus-brles................................ 23
Explanatory Notes........................................... 1Glossary............... . vl
Data for the 2 most recent nonths shown are subject to revision * * * * * * * * * * * Explanatory notes outlining briefly the
concepts, methodology, and sources used in preparing data for this report appear in the appendix. See pages i - ix.____
itS
Digitized for FRASER http://fraser.stlouisfed.org/ Federal Reserve Bank of St. Louis
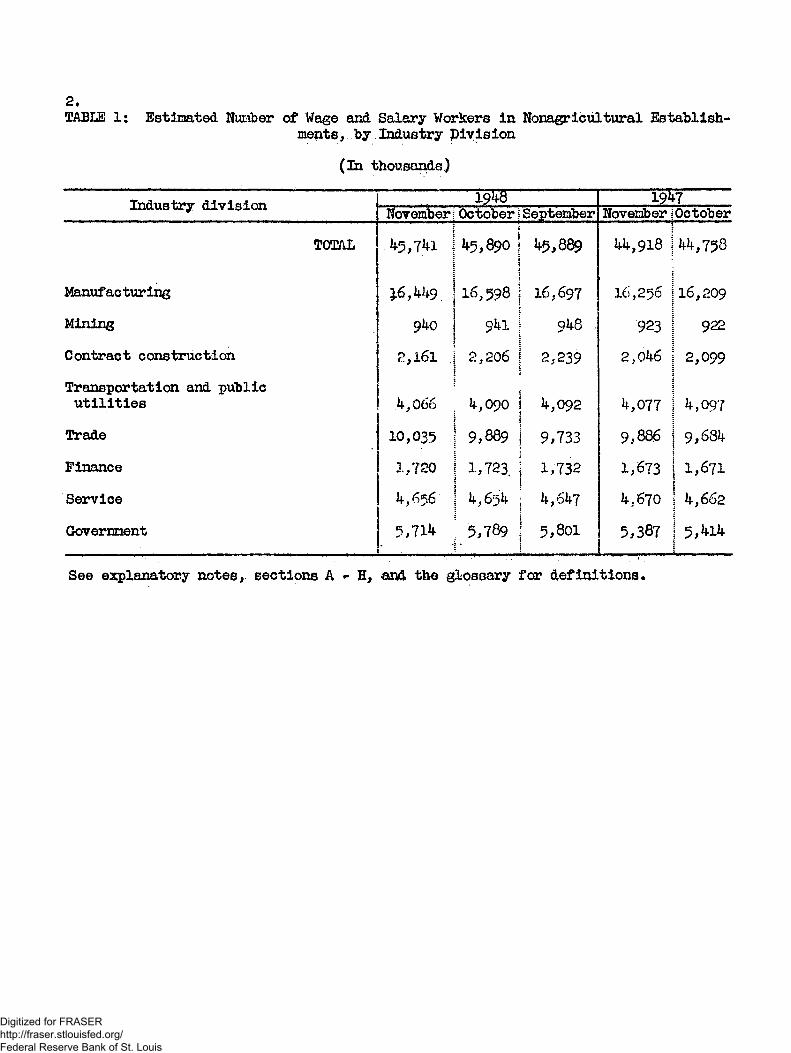
(In thousands)
2.TABLE 1: Estimated Number of Wage and Salary Workers in Nonagricultural Establish
ments , by Industry Division
Industry division 1948 1947Novembers October :1 September November[October
TOTALj
45,741 ||45,890 | 45,889
!:44,918 ]i44,758
Manufacturing|
*6,449. j 16,598 | 16,697 16,256 16,209
Mining 940 j 941 | 948 923 922
Contract construction 2,l6l j 2,206 ! 2,239\ 2,046 2,099
Transportation and public utilities
!34,0 667 ? i 4,090
I
j 4,092 4,077 4,097Trade 10,035 j 9,889 | 9,733 9,886 9,684Finance
!1,720 1i 1,723. i 1,732I 1,673 j 1,671
Service |4,654 1 4,647: 4,670 | 4,662
Government 5,711* 5,789 j 5,801; 5,387jI 5,4l4:
See explanatory notes, sections A - H, and the glossary for definitions.
Digitized for FRASER http://fraser.stlouisfed.org/ Federal Reserve Bank of St. Louis

(In thousands)
3.TABLE 2: Estimated NvuBber of Wag© and Salary Workers In Manufacturing Industries, by
Major Industry Group
Major industry group Notramber fOctober September jNovember \OctoberALL MANUFACTURING 16,449 j 16,598 16,697 j *
16,256 16,209
DURABLE GOODS 8,301 j 8,319 8,294 8,19* 8,126
Iron and steel and their products 1,952 1,955 1,9*5 1,908 1,896Electrical machinery 736 731 725 772 763Machinery, except electrical Transportation equipment, except
1,560 1,569 1,569 1,569 1,565automobiles 588 583 572 578 552
Automobiles 978 ' 983 985 961 964Monferrous metals and their products 1+7* : *73 1 *69 *79 472Lumber and timber basic products Furniture and finished lumber 907 918 | 930i 828 827products 562 562 558 573 565Stone, clay, and glass products 544 5*5 541 526 522
NONDURABLE GOODS 8,148 8,279 8,403 8,062 8,083
Textile-mlll products and otherfiber manufactures
Apparel and other finished textile 1,367 | 1,371 1,384 1,391 1,368products. 1,335 1 1,353 1,3*8 1,277 1,267Leather and leather products 408 *21 425 **2 438Food 1,833 i 1,931 2,069 1,769 1,833Tobacco manufactures 103 ! 103 101 104 103Paper and allied products Printing, publishing, and allied *93 *91 487 479 476
industries 735 735 725 726 720Chemicals and allied products 786 Y89 785 777 773Products of petroleum and coal 248 240 245 239 1 237Rubber products 250 248 246 259' 257Miscellaneous industries 590 597 588 599 591
See explanatory notes, sections A-H, and the glossary for definitions.
Digitized for FRASER http://fraser.stlouisfed.org/ Federal Reserve Bank of St. Louis

*.
(In thousands)
TABLE 3« Estimated Nvuaiber of Wage and Salary Workers in Selected NonmanUfacturingIndustries, by Major Industry Group
Major induetry ^roup 19*7Nov aiter October ;September [November i OctoberMINING 9*0 9*1 9*8 923
;i 9225Anthracite 82 | 82 82 81 | 81;Bituminous coal
j*21 | *22 *26 *17 1 ^15|
Metal 103 I 103 100 1.00 | 99
Quarrying and nonmetallic 95 |j 96 98 96' 1 97ICrude peti'oleum and natural gas prcductlon 1/
]239 s 238 2*2 229
f;j 230
TRANSPORTATION AHD PUBLIC UTILITIES
1*,066 || *,090 *,092 M 7 7
i?| *,097
Transportation 2,809 | 2,835 2,832 2,872 1 2,899
Communication 7*0 7*0 | 7*1 713{1 707;
Other public utilities 517 j 515 i[ i| 519s
*92 *91GOVERNMENT 5,71* | 5,789 || 5,801 5,387 | 5,hlkFederal 1,856 1,875 1 1,873| 1,751
i
| 1,7**State and local 3,858 3,91* 3,928 3,636 | 3,670
i
See explanatory notea, sections A - H, and the glossary for definitions*1/ Includes well drilling and rig building*
Digitized for FRASER http://fraser.stlouisfed.org/ Federal Reserve Bank of St. Louis

TABLE 4: Federal Civilian Employment and Pay Rolls in All Areas and in Continental United States, and Total Civilian Government Employment and Pay Rolls in Washington, D. C. 1/
5.
(In thousands)
Area and branchEmployment
(as of first of month)19**8
November lOctober jSepteinber
Pay rolls (total for month)
1947November
1948November lOctober jSeptember
M*LNovember
All Areas
TOTAL FEDERAL Executive Defense agencies Post Office Department Other agencies Legislative JudicialGovernment corporations
Contlnental United States
TOTAL FEDERAL Executive Defense agencies Post Office Department Other agencies
Legislative JudicialGovernment corporations
Washington., D. C,
TOTAL GOVERNMENT D* G< government Federal Executive Defense agencies Post Office Department Other agencies Legislative Judicial
2,083.6;2,044.2
939.5**59.7645.07.43.5 28.5
1,876.51,843.9770.3458.0615.67.43.5 21.7
236.419.0217.4209.471.1 7.7
130.67.4
.6
2,076.0 ; 2,083.6 2.036.9 j 2,044.0
931.9 ! 933.2 458.4j 646.67.43.5
28.2
457.0653.97.43.5 28.7
1,868.91 1,868.6 1,836.3 ! 1,836.0762.7456.7 616.97.43.4
21.8
756.5455.4624.17.43.4
21.8
234.6 1 18.6 :
216.0 j 208.0 . 70.6 7.6
129.8 ■ 7.4 .6 i
235.1 18.9
216.2208.2
70.87.5
12-9.97.4.6
2,006.41,966.3905.2 429.8631.3 7.1 3.529.5
1,771.41,738.6706.4428.3603.97.13.422.3
221.5 18.1*203.1195.464.57.3
123.6 7.1.6
$567,723557.836248,451126,889182,496
2,6821.4195,786
523,410514,181213,891126,333173,957
2,6821,3795.168
74,2884,51969,76966,85622,064
2,66942,1232,682231
$544,907534,933236,748124,095174,090
2,6561.4545,864
500,746491,503201,988123,633165,882
2,6561.41315,174!
$552,535542,686.235,749121,908185,0292,6941,4535,702
509,6*6 500,419202,296121,479176,644
2.6941,4145.089
70,711! 4,4481
66,263: 63,379} 20,866' 2,684j 39,8291 2,6561
228{
73,5664,606
68.96066,03722,008
2,72241,3072,694
229
$451,502442,171192,111
98,666151,3942,4571,1925,682
414,020405,485162,21998,313144,9532,4571,1544,924
59,400 4,223
.55,177 52,525 16,110
2,60633.8092,457195
See the glossary for definitions.
1/ Data for,Central Intelligence Agency are excluded.
Digitized for FRASER http://fraser.stlouisfed.org/ Federal Reserve Bank of St. Louis

6.TABLE 5: Personnel and Pay of the Military Branch of the Federal Government 1/
(In thousands)
Designation 19^7November I October !September November I OctoberPERSONNEL (as of first of
month)Total 1,610
si
1,5841 1,548 1,490
i
1 1,5^3jBy branch:
Arjpy 647
::11 636 609 2/ 920
2/
|
12/ 9^1 %lAir Force 410 406 401
Navy 446 1 438 432 459 491Marine Corps 85 84 86 92 92Coast Guard 21 i 21\ 21 19 19
By sex: Men 1,596
?! 1,571 1,535 1,473 I 1,525
Women 14 1 13i
13 18 18
PAY (for entire month) Total $299,746.
i
|$294,843 $292,o4oj
$309,705 ($355,961
By branch:Army and Air Force 191,206
;i 183,593 184,162 186,912
ii
1 214,578Navy 89,234 91,927 88,556 102,562 ! 119,898Marine Corps 14,514 14,667!i 14,610 16,046 1 16,684Coast Guard 4,792 I 4,657 ji 4,713 4,184 1 4,802
By type of pay: Pay rolls 264,953 i 259,1751
i
1 251,398 252,112\1 271,040
Mustering-out pay 5,692 ' 5,818 iI 9,292 9,117 j 9,954Family allowance 28,534 1 28,253 28,115 23,127 | 2^,145Leave payments 567 1 1,598 3,235 25,349 j 49,822
Cash 166 366 620 3,982 6,430Bonds 401 i 1,231 2,615 21,367 | 43,392t
See the glossary for definitions.l/ Because of rounding, the individual figures may not add.to group totals.2/ Separate figures for Army and Air Force not available, combined data ebom under Army.
Digitized for FRASER http://fraser.stlouisfed.org/ Federal Reserve Bank of St. Louis

TABLE 6: Estimated Number of Wage and Salary Workers -In Nonagricultural Establishments for Selected States
(In thousands)
State 19*5 19*7October : September Attauet OctkYbefciSeptember
Arizona 156 -154 153 1*6 145California 3,129 ! 3>i6o 3,143 3,086 ; 3,083Connecticut 776 771 761 * 780 i * 771Georgia 750 745 742 735 738Idaho 134 132 122 126 127Illinois 3,228 ! 3,218 3,195 3,166 1 3,142Indiana- 1,222 1 1,237 1,203 1,207 i 1,222Maine 269 1' 275 280 268 272Maryland 719 1 720 717 681 678Massachusetts 1,732 1 1,735 1,726 *1,724 S 1,709Minnesota 813 ; 825 823 . 789 7 98Missouri 1,153 | 1,149 1,146 1,140 i 1,129Montana 143 ! 143 142 138 137Nevada 1/ 48 i 49 50 48 1 49New Jersey 1,594 1 1,604 1,599 1 1,573 ! 1,574New Mexico 129 i 129 128 118 120New York 5,513 ; 5,500 5, *61 5,502 1 5,46lPennsylvania 3,669 ! 3,660 3,627 3,604 ! 3,573Rhode Island 288 1 288 285 293 286Tennessee 1 752 756 754 704 704Texas 1,771 • 1,758 1,7*6 1,675 i 1,665Utah 1£8 » 189 178 179 184Vermont 1/ 94 95 96 96 96Washington 685 688 677 * 673 i * 674Wisconsin 1,003 ! 1,018 1,007 981 ! 998
See explanatory notes, sections H and I.1/ Does not Include contract construction.* Other months have been revised ao follows:
Connecticut - November 19*7 through July 1948 to 782, 792, 770, 766, 773, 773# 7*58, 766, and Jo2.Massachusetts - November 19*7 through February 1948 to 1,739, 1,773, 1,711, and 1,706. “Washington. - November 1947 through January 1948 to 667, 668, and 651.
Digitized for FRASER http://fraser.stlouisfed.org/ Federal Reserve Bank of St. Louis

(In thousands)
8.TABLE 7: Estimated Nuriber of Wag© and Salary Workers in Manufacturing Industries, by
State
Begion and State 1948 ’ 7 r ' .1947.....October \I September August October September
HEW ENGLAND: \
Maine 1/ U3.7 I 117.9 | 120.2 116,9 119.6Hew Hampshire 82,1 82.1 1 83.6 82.9 82.1Vermont 1/ 36.7 !1 37.3 ! 37.9 39.3 39.2Massachusetts 727.9 j1 , 731.3 I 725.6 741,6 732,5Bhode Island 142.8 |1 144.7 1 lU.l 152.9 148.1Connecticut 1/ 397.0 | 397.1 Ji :392.1 414.8 409,2
MIDDLE ATLANTIC:f ;
I iHew York 1,888.1 1,888,5 i1,869.6 1,922,8 1,900.1Hew Jersey 747.3 750.4 i 743.9 751.4 749.2Pennsylvania 1,508.6 j| 1,508.1 j1,498,0 1,517.9 1,504.5EAST KORTH CENTRAL: i
f ;
\ ;
Ohio 1,225.4 !1 1,230.$ j1,224,5 1,244.7 1,243.8Indiana 551.6 569.4 i 542,7 561.0 580.0Illinois 1,243.3 ;i 1,243.8 11,231,0 1,257.0 1,249.0Michigan 1,002.0 11 1,004,9 1 987.8 1,021.8 1,023.3Wisconsin 1/ 431.8 | 445.9 |• i :
434.5 *33,3 452.0WEST HOKIE CEHERAL:Minnesota 1/ 201.9 i1 210.0 1 210.0 200.2 210.6Iowa 1/ 153.8 153.9 s 153.0 151.3 152.3Missouri 1/ 349.8 347.3 j 349.1 351.9 348.7Horth Dakota 7.0 ]i 6.8 | 6,9 6.7 6.7South Dakota 11.9 11.6 | U.7 11.4 11.3Nebraska 43.6 42.4 | 43,1 45,1 43.1Kansas 85.3 84.7 j 84,5 79.8 79.4
SOUTH ATLANTIC:46.3Delaware 48.9 1 48*2 * 45.8 48.2
Maryland 235.3 1 242.4 1 239.2 229.3 232.4District of Columbia 16.9 17.0 ! 16.7 17.5 17.5Virginia 218.4 217.7 ! 214.5 *217.0 214.5West Virginia 134.1 f 132.9 ! 133.7 133.4 132.8Horth Carolina 370,8 375.4 j 378.9 374,1 368.1South Carolina 193.8 194.3 I 196.9 194.8 192.3Georgia 1/ 280.0 ! £80.1 | 280.7 280,3 281.6Florida 1/ 90.71 89.9 1 88,2 90.4 88.6
Digitized for FRASER http://fraser.stlouisfed.org/ Federal Reserve Bank of St. Louis

9.TABLE 7: Estimated Number of Wage end Salary Workers in Manufacturing Industries, by
State - Continued(In thousands)
Region and State : 19 7""October*1 September | August October September
EAST SOUTH CENTRAL: Kentucky 129.2 ; 128.1
s127.^ 130.3 128.2
Tennessee 1/ Alabama lf~ 256.3 256.3 258,9 25^.1 252.6
229.1 227.1 228.3 i 227.9 225. kMississippi 87.2 87.Si- 90.6 j 9^.1 95.0
WEST S0UT3 CENTRAL: Arkansas 1/ 80.2 79.5 77.6 76.7 81.2Louisiana if 153.9 155.9 155.9 149.2 149.5Oklahoma l7 67,8 67.2 66.9 64. 3 64.1Texas ~ 352.4 351.4? 353.6 339.8 337.9
MOUNTAIN:Montana j 18.8 18.1 18.0 19.1 18.1Idaho 1/ I 26.0 !1 24.8 20.1 22.lt 22.6Wyoming j 7,h 6.8 6,8 7.1 6.8Colorado j 60.2 58.3 56.9 60.6 57.9New Mexico l/ ; 10.1 10.4 10.5 8.8 9.1Arizona if ~ i 15.2 14.0 : 15*2 14.0 13.8Utah 31.6 31.1 27.4 29,k 30.1Nevada 1/ | 3.1* 1 3.5 ! 3.6 3.5 3.4
PACIFIC: j Washington 1 191.6. 190.5
• 1183.1
1
183.9 186.7Oregon \ 118.7 121.5 121,2 117.2 122.2California j! 767.6 801.7 771.6 736.4 744.8
See explanatory notes,- sections H and I.1/ Series "based on Standard Industrial Classification.*/ Other months have been revised as follows:
Delaware - November 19^7 to 45.8.Virginia - November and December 19^7 to 217.3 and 215.1.
Digitized for FRASER http://fraser.stlouisfed.org/ Federal Reserve Bank of St. Louis

10.TABLE 8: Estimated Number of Production Workers In Manufacturing Industries
(In thousands)
Industry group and industry r'”-.......TL9W 19*7November sOctober [September November fOctober
ALL MANUFACTURING 13,23* j13,378 j13,*88 13,176 113,1*3. DURABLE GOODS 6,809 ! 6,82* ! 6,803 6,7*6. 1 6,681NONDURABLE GOODS 6, *25 i 6,55* i 6,685 6, *30 | 6,*62
i
Durable goodsiii:i
i::IRON AND STEEL AND THEIR PRODUCTS^ 1,65* j 1,657 | 1,6*8 1,619 | 1,609Blast furnaces, steel works, and s; t
j
rolling mills 538.2 535.0 535.1 505.6 505.1Gray-iron and semisteel castings 115.2 ! 115.6 11*. 9 118.9 118.9Malleable-iron castings 38.6 38.5 38.6 36.7 36.1Steel castings, 75.1 75.0 7*. 7 69.9 j: 69.6Cast-iron pip© and fittings 29.9 1 29.3 29.* 28,3 1 28.1Tin cane and other tinware *7*0 1 *8.7 50.1 *7.1 S. *7.CWire drawn from purchased rods 28.7 29.1 28.6 31.2 1 31.CWirework *2.1 i *2.1 *2.8 *0.5 j *0.6Cutlery and edge tools 25.0 2*. 3 23.9 2*. 8 i 2*.5Tool's (except edge tools, machine j ?rstools, files, and saws) 2*. 5 2*. 6 2*. 7 25.* i 25.0Hardware 5*. 2 1 53.9 53.5 53.8 ! 52.9Plumbers* supplies 42.6 *2.* *1.3 39.6 j 38.7Stoves, oil burners, and heating 1equipment,' not elsewhere 5classified^ •87.6 93.3 92.0 96.2 | 95.7Steam and ifcrt-water heatingapparatus and steam fittings 66.1 66.6 65.3 65.0 6*. 9Stamped and enameled ware and jgalvanizing 117.6 II6.5 11*. 3 122.5 121.2Fabricated’structural andornamental metalwork ♦65.8 66.3 65.0 63.6 [ 62.9
Metal doors, sash, frames,molding, and trim 11.3 11.2 11.0 10.7 10.5Bolts, nuts, washers, and rivets 28.* 28.3 28.1 . 28.* 27. £Forgings, iron and steel 38.2 37.* 36.9 36.8 36.7Wrought pipe, welded and heavy-riveted 19.7 19.9 19.8 18.9 18.*Screw-machine products and woodscrews 35.5 35.5 35.0 35.5 35.*Steel barrels, kegs, and drums 7.7 7.9 . .8.0 r 8.0 8.0
Firearms 22.* 22.1 21.7 19.3 19.0ELECTRICAL MACHINERY l/ 557 i 553 5*8 595 588
Electrical equipment 367.9 1 367.1 368.6 391.* 1 388.0Radios and phonographs 95.9 ! 93.1 89.7 106.3 10**3Communication equipment
i93.5 j
s92.* 89.7 97.5 95.6
See explanatory notes, sections C, D, and G, and the glossary for definitions.
Digitized for FRASER http://fraser.stlouisfed.org/ Federal Reserve Bank of St. Louis

11.TABLE 8: Estimated Number of Production Workers in Manufacturing Industries - Cont'd
(In thousands)
Industry group and industry 191*8 1947Ifcveaiher iOctober |September November October
MACHINERY, EXCEPT ELECTRICAL l/:
1,201** i1,209 ; 1,208 1,218 1,211*Machinery and-machine-shop products 505.6 ! 506.7 ! 509.0 515.1 516.6Engines and turbines 52.5 1 52.1 i 50.5 53.0 53.3Tractors 60.9 59.8 ; 59.2 58.6 58.0Agricultural machinery, excluding tractors 76.2 75.9 72.8 68.0 67.5
Machine tools- 1*7.5 1*7.6 1*8.0 51.1 52.1Machine-tool accessories 5^.5 5^.7 55.3 55.8 55.6Textile machinery 1*1.1* ; 1*1.6 1*1.8 39.8 39.3Pumps and pumping equipment 69.1 68.9 69.1 71*. 3 7l*.2•Typewriters 18.9 20.6 21.0 25.2 21*. 8Cash registers; adding, and calculating machines 1*1*. 1 j 1*1*. 2 1*1*.9 l*l*. 1 1*3.0
Washing machines, wringers, and driers, domestic 15.5 ! 15.7 15.7 15.8 15.3Sewing machines, domestic and industrial ll*. 9 | ll*.8 . 11+.6 13.0 12.6
Refrigerators and refrigeration equipment 79.5 ! 81.0 81.7 80.1 79.7
TRANSPORTATION EQUIPMENT, EXCEPT AUTOMOBILES 453 ! 1*1*9 1*39 1*52 1*27Locomotives 26.5 26.6 26.5 26.0 25.9Cars, electric- and steam-railroad 56.1 5^.5 5^.5 56.8 55.2Aircraft and parts, excluding aircraft engines 11*9.8 1^5.3 138.5 133. 133.9Aircraft engines 28.0 27.5 26.7 25.9 26.2Shipbuilding and boatbuilding 94.5 97.3 97.5 117.6 1Q0.2Motorcycles, bicycles, and parts 13.6 13.8 13.3 11*. 1* 11*. 1AUTOMOBILES 779 781* 788 766 764NONFERROUS METALS AND THEIRPRODUCTS 1/ 1*01* 1*03 399 1*10 1*01*.Smelting and refining, primary, ofnonferrous metals 1*1.1* 1*1.2 1*0.2 39.7 39.7Alloying; and rolling and drawing Of nonferrous metals, except aluminum 5 M 54.6 5 .3 52.9 53.0Clocks and watches 28.2 28.8 28.6 28.1* '28.1Jewelry (precious metals) and Jewelers* findings 27.5 27.5 27.1 28.1 27.5
Silverware and plated ware 28.3 28.1 27.7 26.5 26.1Lighting equipment 31.8 31.9 32.2 3 M 3^.9Aluminum manufactures 1*0.8 1*0.2 38.5 1*3.6 1*3.1Sheet-metal work, not elsewhere classified 37.1 37.3 37.0 1*0.6 1*0.1l
See explanatory notes, sections C, D, and G, and the glossary for definitions.
Digitized for FRASER http://fraser.stlouisfed.org/ Federal Reserve Bank of St. Louis

(In tboMean&a)
12.TABLE 8; Estimated. Number of Production Workers in Manufacturing Indus trios - Cont'd,
Industry croup' and industry --------- i9%r~-’SwedSeri 'ISotSber I
wSeptember { November i October
LUMBER AND TIMBER BASIC PROEUCTS l/Sawmills and logging cj-xips Planing and plywofcd millsFURNITURE AND FBrrJto LUMBER PRODUCTS 1/Mattresees and be&springs FurnitureWooden boxes, oth&r than cigar Caskets and other morticians* goods Wood p**eesrving Wood, turned and shapedSTONE, CLAY, AND GLASS PRODUCTS 1/Glass and.glassware Glass products made from purchased glass CementBrick, tile, and torra cotta Pottery and related products GypsumWallbaard, plaster (except gypsum), and mineral wool Limegarble, granite, slats, and other products
.Abrasives
.Asbestos productsNondurable goods
TEXTILE-MILL PRODUCTS A1JD CTHSE FIBER MANUFACTURES l/ : 1,245 I1,249 j l,26l
821667.2154.1
47035.7 256.535 .V19.5 17.033.946?121,8
Sk.J37*283.561.57.814.910.719.020.525.6
831678.2152.8
^7037.1
255.635.019.217.1 34.5468*23.214.4 36.983.5 61.07.924.810.719.020.625.7
843691.4 152.1
46636,8
252.534.419.5 17 «3 34-3464122*913.9 36.283.6 60,37.814.710.813.9 20*524.9
Cotton manufactures, oxcept emallwaros Cotton smallwares Silk and rayon goods Woolen and worsted manufactures, except dyeing and finishing HosieryKnitted cloth jKnitted outerwear and knitted gloves Knitted underwear Dyeing.end finishing textiles, including woolen and worsted Carpets and rugs, wool Hato, fur-felt Jute goods, except felts Cordage and Wine
508.913.3
122.0
158.2142.311.533.946.091.9 40,712.0 4.315.1
511.413.4122.4159.6141.7 11.3 32.847.991.5 40.811.5 4.114.9
516.913.4 122.1
165,8141.711,131.849.191.1 40.712.5 4,015.3
751612.8137.7
4833'3*2259.337.6 20,918.634.5452123.414.635.5 77«2 5'3.37.614.6 10,318.5 19.1 . 24,7
1,271
516,9 13.9 114.8
174.2146.311.5 33.7 51.^92.2 36.9.13.6 3.0
16,1
751616.3134.5
47537.2 253.838.3 20^7 19.033.6449122.714.335.4 7 6,8 57.07.414.310.618.4I9.324,9
1,249
5C8.2 13.7 113.4170.9 143.1 11.233.050.491A36.1 13.63.015.4
See explanatory notes, sections C, D, and G, and the glooanry for definitions.
Digitized for FRASER http://fraser.stlouisfed.org/ Federal Reserve Bank of St. Louis

J-3.XASfiR 8: Estimated Number of Production Workers in Manufacturing Industries - Coat'd,*
(Ia thousands)Industry group and industry ~ igw 7~ 1 47
Novenbei' 1r6ctober 1:September November IOctober*APPAREL AND OTHER FINISHED TEXTILE PRODUCTS
\
1,159!i
1,175 |!, 173j
1,117 1,127
Men's olothing, not elsewhere classified 308.0 319.2 320,4 309.2 ! 306.9Shirts, collars, and nightwear 77.7 78*1 77.4 8l*l i 79.3Underwear and neckwear, isen's 19.4 i 18.8 I 18.1 18*1 ] 17.3Work shirts 18.8 18,9 18.2 15.5 j 15.8Women>s clothing, not elsewhere classified *8S.3 488.8 490.3
3
452.1 1 462.3Corsets and allied garments 19.4 19.3 ; 19*0 19.4 I 18.8Millinery 22.2 25.7 24.8 21*6 ! 25.2Handkerchiefs 5.5 5.3 5.0 5.2 I 5*1Curtains, draperies, and "bedspreads 27.1 27.4 27.9 32*1 j 30.9Housefurnlshings, other than curtains, etc. 33.0 32.1 31.4 30.0 1 31.6Textile "bags 29.9 29.7 29.2 28.f 28.4
LEATHER AND LEATHER PRODUCTS l/ 363 376 379 396 393Leather i 46.4 47.7 48.0 50.2 50.2Boot and shoe cut stock and findings 17*0 17.6 17.9 19.8 I 19.6Boots and shoes 229.5 1 238.5 241.0 251.1 i 248.8Leather gloves and mittens 12.3 ! 12.8 13.0 13.2 13.1Trunks and suitcases 14.2 | 14.6 14*3 14.8 i 14.4FOOD 0/ 1,306 1,400 11,537 1,288 1,353Slaughtering and neat packing 205.3 197.7 I 195.2 203.9 !1 194.2Butter 34.6 35.5 36*6 33.9 34.8Condensed and evaporated milk 19.5 20.3 i 21.1 19.5 j 20.5Ice cream 24,3 a£*2 ! 29.6 26.3 !I 27.8Flour 41.7 40.1 41.5 42 J. 42.0Feeds, prepared 28.9 29.2 29*3 28.5 ! 20.9Cereal preparations 13.1 13*2 13.2 12*8 '\ 12.8Baking 255.7 258.0 1 253*2 246.1 i[• 245.4Sugar refining, cane 22.5 22.4 25*0 24.8 1 24.3Sugar, beet 24.5 24.3 ! 10.6 27.4<i 27.6Confectionery 2/ 89.7 88.9 1 81.1 87.0 ! 83.5Beverage?, nonalcoholic 40.4 43.0 46*6 38.2 j 39.7Malt liquors 80.7 81.3 86*0 80*6 ! 81*8Canning and preserving 196.9 291*7 | 444*4 190.1 j| 265*2
TOBACCO MANUFACTDRES 1/ ' 90 90 | 88 90 i 89
Cigarettes 35.1 35.1 34.9 3*.0 ! 33*4Cigars 47.2 46.5 44.9 47.8 ; 47.0Tobacco (chewing and smoking) and snjiff 7*8 7.9 ! 7.8 8*2 8*27.9 ! 7.8
1 lSee explanatory notes, sections C, D, and G, and the glossary far definitions*
Digitized for FRASER http://fraser.stlouisfed.org/ Federal Reserve Bank of St. Louis

X*.TABLE 8s Estimated. Number of Production Workers in Manufacturing Industries - Cont*d.
(In thousand s)
'Industry group and industry. icnrs— 1947ftoreffiber October 1September November iOctober
PAPER ABD ALLIED PRODUCTS 1/ 403 4oi j 398 39* | CVION
Paper and pulp 206.6 206.0 ! 206.7 200.7 200.2Paper goods, other 63.6 1 63.5 j 62.7 63.3 63.0Envelopes 13.0 j 12.8 j 12.6 12.4 02.2Paper bags 17.0 ! 17*3 i 17.8 17.9 17.9Paper boxes 101.5 ]| 99.8 j 97.0 99.0 98.1PREiTIKG, PUBLISHING, AHD ALLUSD IHDU3TRIES 1/ 442 i
I j i j | bk2 |
I .
; *36 444 *41Newspapers and periodicals 151.0 1 150.7 1*9.* 145.1 144.6.Printing; book and job 187.8 1i 168.8 185,4 190.6 089.3Lithographing 31.* 1 31.4 31.1 33.0 32.6Bookbinding 35*0 • |! 3*.9 3*.* 38.7 38.5CHEMICALS AMD ALLIED -PRODUCTS i f 597 600 597 589 586
Paints, varnishes, and colors *8.1 |1 *8.7 ifB.6 48.0 47.6Drugs, medicines, and insecticides 64.8 6k. 4 64.2 66.4 67.OPerfumes, and cosmetics 12.9 12.8 12.5 13.9 13.5Soap 26.5 ! 27.2 27.0 25.8 25.3Rayon and allied products ;63.9 .!! 63.9 63.7 63.1 62.9Chemicals, not elsewhere classified 209.6
}210.0 210.9 205.5 204.3Explosives and safety fuses 27.* 27.7 27.6 24.8 24.1
Compressed and liquefied gases 9.5 9.9 ' 9.8 9*7 9.7Amunition, email-arms 7.4 7.4 7.5 7.2 7.2.Fireworks '2.6 2.6 2.8 2.9 2.9Cottonseod oil 26.5 26.6 ! 23.* 24.5 24.QFertilizers 28.7 28.8 j 28.7 29.2 29.3PRODUCTS OF PETROLEUM AMD COAL l/ 168 163
| !| 168 165 165
Petroleum, refiningi
115.0 !I i
S 108,1).:
114.0 112.3 112.4Coko and byproducts 32.2 1!= 32.1 32.4 30.0 29.6Paving materials 2 . 8 \ 2.9 2.9 3.* 3.*Hoofing materials 17.2 ji. 18.1 18,0 18.5 18.*See explanatory notos, sections C, D, and G, and the glossary for definitions.
Digitized for FRASER http://fraser.stlouisfed.org/ Federal Reserve Bank of St. Louis

15TABLE 8: Estimated Number of Production Workers in Manufacturing Industries - Cont*d.(In thousands)
Industry group and industry 19W 1241.November 1October j September November October
RUBBER PRODUCTS l/ 199 198 j\, 197 210 208
Rubber tires and inner tubes 91.2 90.0 91.^ 102.4 102.0Rubber hoots and shoes 23*2 22.9 22.5 22.0 21.7Rubber goods, other 84.5 84.7 82.9 86.1 84.0MISCELLANEOUS INDUSTRIES 1/ ^53 46o 451 466 U59
tj
Instruments (professional and scientific), and fire-control equipment 30.0 29.5 29.0 27.8 j 28.0Photographic apparatus 39.7 39.7 39.7 38.8 j| 38.7Optical instruments and ophthalmic goods 2/ 26.1
t!
26.4 26,1 27.6 t 27.5Pianos,"organs, and parts 13.5 !. 13.9 13.5 17.8 17.UGames, toys, and dolls 47.1 50.0 48.1 43.4 42.3Buttons 13.1 13.1 13.0 12.7 12.1Fire extinguishers 2.9 2.9 2.8 2.7 2.8!
See explanatory notes, sections C, D, and G, and the glossary for definitions.j/ Estimates for the individual industries comprising the major Industry groups have been adjusted to levels indicated by Federal Security Agency data through 1946 and have been carried forward frcaa 1946 bench-mark levels, thereby providing consistent series. Comparable data from January 1939 are available upon request to the Bureau of Labor Statistics. Such requests should specify the series desired.
More recently adjusted data for the individual industries comprising the major industry groups listed below supersede data shown in publications dated prior to:Major industry group ... . : Mimeographed release Monthly Labor ReviewIron and steel and theirproducts December 1948 January 1949Stone, clay, and glass products December 1948 January 1949
2/ Data for earlier months in 1948 have been revised aB follows; Confectionery - June through August to 64.5, 63.0, and 71*6. Optical instruments and ophthalmic goods - August to 26*0.
Digitized for FRASER http://fraser.stlouisfed.org/ Federal Reserve Bank of St. Louis

(In thousands)
16.TABIiE 9: Estimated Humber of Employees in Selected Nonmanufacturing Industries l/
Industry group and industry lgftb 1947November ; October iSeptember November I October
MINING:. 2/ j1 I
Cool'Anthracite 77.0
:: 76.6
I
1 77.5 76.2j
76.2Bituminous coal 403 ! 404 1 408 399 1 397Metal 88.0 i 92.0 ! 89.4 89.4 88.7Iron 32.1 I 32.8 1 33.4 32.0 32.4Copper 23.1 27.0 26.9 26.1 25.8Load and zinc 16.6 * 16.2 13.0 15.4 14.9Gold and silver 8.2 1 8.1 8.2 8.1 8.0Miscellaneous' 7.9 1 7.9 7.9 7.8 7.6Quarrying and nonmetallic 85.3. 86,6 87.8 86.4 87.3Crudo petroleum end natuirJL gas production 3/‘ 130.1* 129.9 133.2 126.4 127.1
TRANSP0ETATI0N.AND PUBLIC' UTILITIES:Class I steam railroads .4/ ! 1,329
> I
1,345
i
1 1,350 1,340 1,357Street railways arid busses 5/ 245 246 248 249 249Telephone 642 642 643 614 609Telegraph 6/ , 34.2 34.5 34.7 36.6 36.9Electric light and power 282 281 284 268 267
SERVICE:Hotels (year-round.) 371 375 373 378 380Power laundries 2/ 225 229 232 238 241C].eaning and dyeing 2/ j 87.5 89.4 88.7 92.7 95.6
See explanatory notes, sections C, D, and G, and the glossary for definition.,;.l/ Unless otherwise noted, data include all employees.2/ Includes production and related workers only.3/ Does not- include well drilling or rig building'.%J Includes all employees at jaiddle of r.onth. Exclri&ea employees of switching and terminal companies. Class I steam railroads include those with over $1,000,000 annual revenue. Source: 'Interstate Commerce Commission.5/ Includes private and municipal street-railway companies and affiliated, subsidiary, or successor trolley-bus and motor-bup companies.6/ Includes all land-line employees except those compensated on a commission basis* Excludes general and divisional headquarters personnel, trainees in school, and messengers.
Digitized for FRASER http://fraser.stlouisfed.org/ Federal Reserve Bank of St. Louis

17.TABLE 10: Indexes of Production-worker Employment and Weekly Pay Bolls in Manufacturing Industries(1939 Average = 100)
Industry group and industryEmployment indexes Pay-roll indexes '
19*8 19*7 19*8 19*7 •Nov, 1 Oct. | Sept, Nov. Nov. I Oct, 1 Sept. Nov.ALL MANUFACTURING I6I.5 163.3 jl6*;6 160.8 378.lj382.l|382.2 353.*
DURABLE GOODS 188.6 I89.O!188.* 186.8 *28.3!*3*.li*23.7 395.0NONDURABLE GOODS 1*0.3 1*3.1(1*5-9 1*0.* 329.li331.2|3*1.6
: j312.8
Durable goods ji ;IRON AND STEEL AND THEIRPRODUCTS 1/ 166.8 167.1 |l66.2 163.3 373.6j376.01365.0 335.1Blast furnaces, steel works, it
and rolling mills 138.5 137.7 Il37.7 130.2 30*. 7 305.0I300.3 2$5.1Gray-iron and semisteel castings 185.1 1185.8 !l8*.7 191.2 *29.2 *37.91*33.3 *19.9Malleable-iron castings 200.8 200.31200.8 191.1 505.7 512.2i*93*l *59.6Steel castings 23*. 2 23*.11233.1 218.0 528.0 523.2150*.* *51.7Cast-iron pipe and fittings 169.9 Il66.3 il67.0 160.6 *70.9 **5.71*37.1 381.*Tin cans and other tinware 1*8.0 1153.21157.7 1*8.3 33*. 7 351.6I391.7 320.7Wire drawn from purchased rods 130.5 1132.3 H 30.3 1*1.8 269.7 27*.11263.8 270.1Wirework 138.*:138.*.; 1*0.8 133.2 331.6 333.2}322.5 297.*Cutlery and edge tools 162.11157.7!15*.9 161.0 *05.8 392.1|37*.9 38*. 1Tools (except edge tools, machine V :
]tools, files, and saws) 160.31160.81161.6 166.1 373.8 376.31366.3 363.0Hardware 152.1!.151.2 !l50.0 150.8 363.91359.713*9.2 3*5.7Plumbers* supplies 162.*!161.7S157.2 150.9 376.9]301.91338.7 32*. 1Stoves, oil burners, and |heating equipment, not 1 i i
elsewhere classified 178.3 189.8|l87.2 195.8 *00.Oj**8,*1*26.7 *25.*Steam and hot-water heating I {apparatus and steam fittings 20*. 7 206,*j202.3 201.2 *66.*:*76,*!**7.6 **1.1Stamped and enameled ware ► iand galvanizing 198.8 196.91193.1 207.0 *91.9j*8g.6|*53.7 *77.1Fabricated structural andornamental metalwork 185.3 186.7jl83.0 179.0 *06.2; *09.*!371.9 368.6
Metal doors, sash, frames, i I \
molding, and trim 1*5.7 1**,1 jl*2.1 138.3 3*2.713*0.113*0.* 298.1Bolts, nuts, washers, and rivets I86.3 185.6118*.6 186.5 *33.6! *28.01*15.5 391.5Forgings, iron and steel 233.2 228.1 [225.1 225.0 5**.81533.61513,* *8*. 8Wrought pipe, welded and :
r t: Iheavy-riveted 220.7 223.6|222i2 212.5 515,81505.11*87.1 **3.1
Screw-machine products and jwood screws 196.8 196.8|l9*.3 196.8 **5.2|*53.0|*33.1 *21.7Steel barrels, kegs, and drums 119.5 121.5|12*.2 123.5 32*. 3 326.*!306.9 308.6Firearms *21.3 *1*.9|*06.* 361,6 1018.G 998,71963*1 796.1ELECTRICAL MACHINERY l/ 215.1 213.*1211.5 229,7 *79.2 *7*.*j *65.* *71.9Electrical equipment 201.* 201.01201,8 21*. 3 **7.8 **5.*|**2.2 *36.3Radios and phonographs 218.1 211.71203.6 2*1.7 539.7 509.ll*89.* 539.6Communication equipment 238.0 28*.7 I276.2 300.3 587.6 591.6[567.3 597.8See explanatory notes, sections C, F, and G, and the glossary for definitions.
Digitized for FRASER http://fraser.stlouisfed.org/ Federal Reserve Bank of St. Louis

18.TABU! 10: Indexes of Production-Worker Jfcipl'oyinont and Weekly Pay Rolls in Manufac
turing Industries - Continued
Industry group »and industry Employment indexe s194B"
Nov. j Oct. j Sept. Nov.'Pay-roll indexes
"1958"Nov.jOct. jSopt.
194?Nov.
MACHINERY* EXCEPT ■ ELSCTRICAL l/Machinery and nachine-shop products Engines and turbines TractorsAgricultural machinery, excluding tractors
Machine tools Machine-tool accessories Textile machinery -Pumpa and pumping equipment TypewritersCash registers; adding, and calculating machines
Washing machines, wringers, and driers, domestic
Sewing machines, domestic and industrial
Refrigerators and refrigeration equipment
TRANSPORTATION EQUIPMENT,EXCEPT AUTOMOBILES
LocomotivesCars, electric- and Steaci- railroad
Aircraft and parts, excluding aircraft engines
Aircraft engines Shipbuilding and boatbuilding Motorcycles, bicycles, and partsAUTOMOBILESNONFERROUS METALS AND, THEIR PRODUCTS 1/Smelting and' refin'ing, primary, of nonferrpus. metals •
Alloying; and' rolling arid, drawing of nonferrous metals, except aluminum Clocks and watches Jewelry (precious metals') and Jewelers * findings Silverware and plated ware Lighting equipment Aluminum manufactures Sheet-metal work, not elsewhere classified
227.91228.7
2 3.5 I244.0 281.21279.1 19^.61191.2
228.7
21*5.1 270.8 189.4
230.5
21*8.1283.9187.5
267.11266.1:255.2 238.1* 129.71130.01131.2 139*5 211.11211.91214.0 216.2 I88.9ll89.7ll90.7 181.9 277.6!276.8i278.0 298.9
~ 155*5115.6|1£6.8|129;8224.lj224.81228,1
: ]207,31210.6!210.3.189.8
226.0
285.7
1*09.6
228.9377.4 315.0136.5194.6193.6
188.61186.1*S230.4I232.3
1282.9(276.3
410.71409.0222.1
366.2309.0140.5197.4
222.2
349.2 300.1 140.8190.3
Il9^9l 195.9,
176.1(176.0|173.9
150.0 |l49.lll45.5
140.4 !l40.7!l40.0 139.0 fl4l.9|l4l.l190.3 I190.6I187.7 233.51231.5 !228.5 155.2ll55.6jl57.3 173.lH70.6il63.5 ; j j.; • 197.6 |l99.o|l97.2
224.1211; 2165.7227.7
284.6
402.0
231.4
336.2291.0 169;9207.0
190.4
178.8
1^3.7
136.3 139.9194.6218.8167.3185.4
216.8
486.9!491.7 !484.0 459.6i j 1 i
527.3I531.5 523.2!498.8 620.1:622.11581.9 601,9358.4}364.1 :360.5 336.9
j ■ ’ :
592* M 597.91577.1 248.1! 250.3-1248.3 387.I:391*81391.0 450.4,! 457.5I458.9625.51620.1 1615.0 271.11255.012)36.8487.9j 48i.3j492.3470.01484.2j460.6501.9] 491.6jl*78.8
486.2j508.7|493.3
611.8:613.3 {581.8
942;51909.4|948,4: •533.9(526.6)477.3 830.7179^.91746.1601.31599.7)570.0262.41291.21283.1 468.2}474.3j4s4.5I !i*25.5 ! 439.91425.9
391.1|39^*2(386,3;: (: i
3 0.0 1344.613 2.4
298.21308.01307.0348.11353.01348.6
i :: :^07.3 (397.0 (383. a572.01565.01555,43^3.113^0.01345.6355.7 1352.51325.8: !450.6 1467.4 1443.9
482.5253.3 380.2396.3624.6 358.2>63,5
449.7 382.1 ^ . 3
555.1
863.1
503.5
653.8479.2316.6441.3395.6
367.3
300.3
263.7330.5403.6507.4333.9351.7
See explanatory notes, sections C, F, and G, and the glossary for definitions.454,0
Digitized for FRASER http://fraser.stlouisfed.org/ Federal Reserve Bank of St. Louis
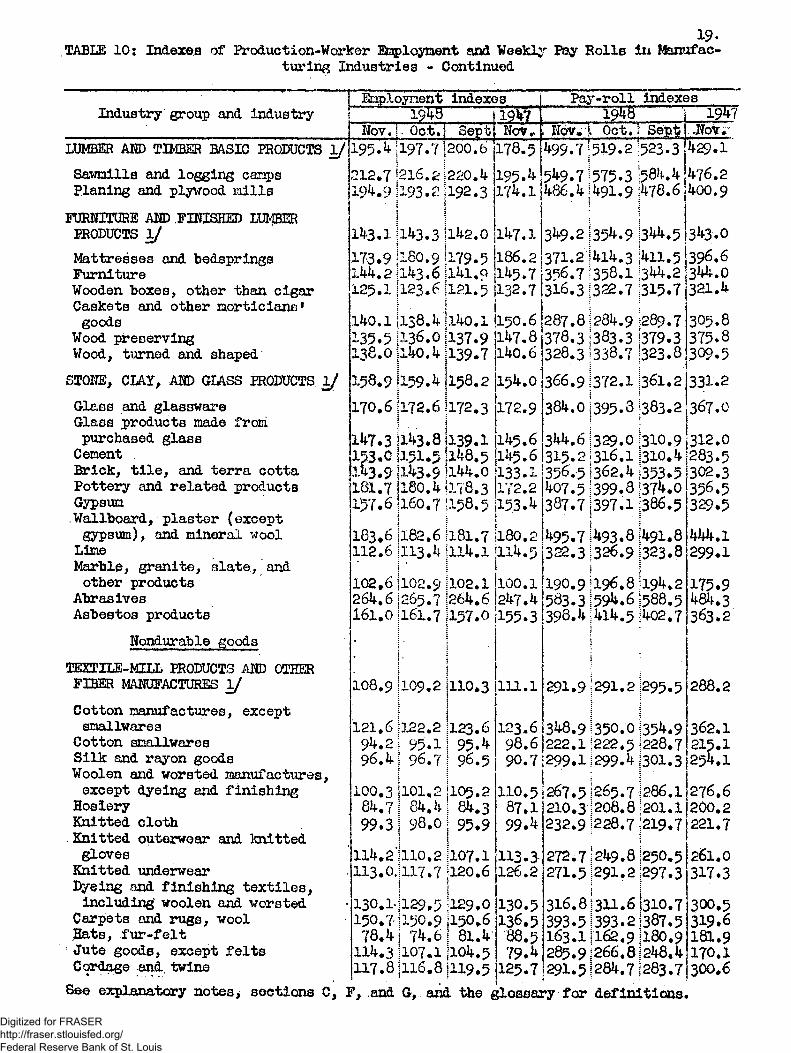
19.TABLE 10; Indexes of Pr oduc t i on-W or leer Employment and Weekly Bay Rolls in Ifenufac-turing Industries - Continued
Industry group and industryEnp.loynent
MNov. I Oct.!indexes
M lepfr Nov.
Pay-roll indexes-- 1955-------
NoVm'l Oct, i Sep$1957
.Not,-LUMBER AND TIMBER BASIC PRODUCTS 1/Sawmills and logging camps Planing and plywood millsFURNITURE AND .FINISHED LUMBER PRODUCTS 1/Mattresses and bedsprings FurnitureWooden boxes, other than cigar Caskets and other morticians» goods
Wood preserving Wood, turned and shapedSTONE, CLAY, AND GIASS PRODUCTS l /Glass and glassware Glass products made from purchased glass CementBrick, tile, and terra cotta Pottery and related products Gypsum. Wallboard, plaster (except gypsum), and mineral wool LimeMarble, granite, slate, and other products
Abrasives Asbestos products
Nondurable goodsTEXTILE-MUL PRODUCTS AND OTHER FIBER MANUFACTURES 1/Cotton manufactures, except smallwarea
Cotton smallwares Silk and rayon goods Woolen and worsted manufactures, except dyeing and finishing
Hosiery Knitted clothKnitted outerwear and knitted gloves Knitted underwear Dyeing and finishing textiles, including' woolen and worsted
Carpets and rugs, wool Bats, fur-felt Jute goods, except felts Cordage and twine
195•k ; 197 •71200.6
212.7 I2i6.ej220.fc 19 .9 |193.2|192.3
U3.1 [1 3.3 |lfc2.0173.9 |180.9 I179.5 144.21143.61141.0 125.1 }123.6 H 21.5
178.5195 .fc 174.1
147.1186.2145.7132.7
140.11138.41140.1 .150.6 135.3 |136.0.{137.9 1^7.8 138.01140.4 1139.7 1140.6
I \158.9 159.'fc (158.2 15^.0! :170.6 jl72.fi |l72.3 172.9j 11U7.3 Il43.8|139.1 153.C H5I.5 1148.5 Ik3.9 P-^3.91144.0a/\ K r: O ~
499.7[519.25^9.7'575.3486.41491.9|349.2 i35 .9371.2 1414.3 356.7 I358.1 316.3(322.7287.8 1284.9 378.3:333.3 328.3(338.7366.91372.1384.01395.8
523.3584.4478.6
3^.5411.5344.2315.7289.7379.3323.8361.2383.2
145.6145.6172.2
157.6 160.7 158.5 153.4183,6 182.6 181.7 i180.2112.6 X13.it 114.1j1114.5102,6 102.9 102.1 100.1264.6 265.7 264.6 247.4161.0 161.7 157.0 155.3
108.9 109.2 110.3 111.1
121.6 122.2 123.6 123.694.2 95.1 95.**- 98.696.4 96.7 96.5 90.7100.3 101.2 105.2 110.584.7 84.4 84.3 87.199.3 98.0 95.9 99.^114.2' 110.2 107.1 113.3113.0.117.7 120.6 126.2
130.1- 129,5 129.0 130.5150.7-150.9 150.6 136.578.4 74.6 ! 81.4 88.5114.3 107.1 H04.5 79. 117.8 116.8 1119.5 125.7
3*^.61329.0 1310.9 315.21316.11310.4
133.1 356.5]362.4;353.5 ^07.51399.8137^.0 387.71397.1 {386.5
^95*71^93.81491.8 322.31326.9 1323.8190.9 196.81194.2 583.3159^.61588.5398.41414.5 1402.7
291.9{291.2 (295*5i ;3^8.91350.01354.9222.11222*5 228.7 299.1i299.^i301.3267.5i265.7i286.1 210.3l208*8 1201.1232.91228.7 J219.7272.7;249.88250.5271.5 (291.21297.3
i 1316.81311.61310.7393.51393.21387.5 163.11162,91180.9 285.9|266.81248,4291.51284.71283.7
429.1476.2 400.9
343.0396.6344.0321.4
305.8375.8309.5331.2367.0312.0283.5302.3356.5329.5444.1299.1
175.9484.3363.2
288.2
362,1215.1254.1
276.6200.2221.7261.0317.3300.5319.6 181.9 170.1300.6
See explanatory notes, sections C, F, and G, and the glossary for definitions.Digitized for FRASER http://fraser.stlouisfed.org/ Federal Reserve Bank of St. Louis

2°.TABLE 10: Indoxea of Productlon-Worker Earployment and Weekly Pay Rolls In Manufac
turing Industries - Continued
Industry group and industryEmLo.yriant indexes
T<555"Nov. 's Oct. | Sept, Nov,
Pay-roll indexes1958
Nov.jOct, j Sept19WNov,
APPAREL AND OTHER FINISHED TEXTILE HSODUCTSMen's clothing, not elsewhere classifiedShirts, collars, and nightwear Underwear and neckwenr, men's Work ohirtsWomen's clothing, not elsewhere classified
Careets and allied garoents Millinery Handkerchiefs Curtains, draperies, and "bedspreads Housefuraishings, other than curtains, etc.
Textile hagsLEATHER ‘AND LEATHER PRODUCTS 1/ LeatherBoot and shoe cut stock and findings Boots and shoes Leather gloves and nittens Trunks and suitcasesFOOD 1/Slaughtering and neat packing ButterCondensed rand evaporated railkIce creamFlourFeeds, prepared Cereal preparations BakingSugar refining, cane Sugar, beet Confectionery 2/Beverages, nonalcoholic Malt liquors *Conning and preservingTOBACCO -MANUFACTURES 1/CigarettesCigarsTobacco (chewing and smoking) and snuff
146.9 148.8 ;148.6f141.5 335.4 ] 325.0 i 31*8,1
13^*11139.0 1139.5 13^.7 105.11105.6 !lo4.7>109.7 1X4.5 jlll.o iio r.o 106.5133*2!l33.5 -129.1 109.1*\ I170,61170.8 il?l*3 158* 0 103.6il0340 ‘10l.5 103.3
66.9 ;1G0*8 j 97*0 ! 81*.7 108.2j104.4 | 98.8 102.2
I I 152.8j154.0jl57.3 180.9
295*5128? .61281.0 268.7 236.8;23t).2!231.7 [225.3
I0U.5! 108.3.|l09,3 114.1s' 5 |92.81 95.1*; o6,olioo .3
\ ■85.1I 68.11 89.8 99.0 99,i*ll03.3 ;io4.4 108.7 123.5 i128* 21129.9•131.8 170,5! 174.81171*8 177*9i * \ I3-52.9] 163.8 |l79.9|150.7152.0|172.1!179.6;137.8!150,2 i167.3!156,8!134.3!11*1.51 211.0! 161,ii 169.7! 199.5! 131.0!
11*6.1*176.2186,3148,6144.5169.1158.0135.5141.0209.2
!144.5 1181.7 1194.3i167.9!i49.4 : 170.01157.6 1133.0 1157.1* ! 91.0 ’11*5.6 I195.1*1212.6
159.5180.5 200.9194.11295,7
96.51 95.9! 93*9
127.9!84.5!
128,2I127,3 83.2 | 80.5
77.2) 78.6 | 77.7
300.1 !302.41324.7 258.81256.0!254.0 336.4:310.6:301.3 339.51352.41341.4379.8l351.0l390.2 239.1^33.1'225.3 138.1 !192.8i201.5 303.2;289.3;259.4
345.2?346.5;356.5; . ;725.2 1696.8 f 634.9 550.2|555.0:549.5223*3|236.8:245.1202.0 j 206. 3 !206.5
3.66*5 [175^3 j 185.2 211. 31227.6 ;238.7 256. 51266.8!274.5 4C6.4|397.3;393.3340.7|358.2;389*8
151.0 168.2 179.7149.1151.6165.3153.7129.3156.5 235.9156.1160.2199.3126.5
96.5
124,085.5
81,3
336.2 1379.0; 424.4! 273.9! 351.91 405.9: 342.3! 280.81 282.2! 496.5 ? 387.9! 287.1! 377.4! 317.9!
305.4!384.7 i 435.6I 291.2; 355.2!405.8!341.6!286.6!286.4!433.3!376.4!298.6!371.8!544.31
303.5 397.8473.7333.5360.7 415.4 326.0282.6348.2207.7345.7 3**0.9417.2 835.0
223*5]224.3;214.8
264.4!279*0!268.1207.4ll97.2i187.4: |173.11180.7! 176.1
304.8
301.5 266,0 292,9 253*1
319.3 £26.8123.6260.4
422.2
590.1 484.8
252.5
213*8
190.3246.7264.1406.0
323.5
337.6346.0377.8269.9357.0346.9313.7249.4360.8 540.7355.6267.3359.3293.7216.3
253.3201.7
169.0
See explanatory notes, sections 0, F, and 0, and the glossary for definitions,
Digitized for FRASER http://fraser.stlouisfed.org/ Federal Reserve Bank of St. Louis

TABUS 10: Indexes of Production-Worker iteploynent and Vibekly Pay Rolls In Manufacturing Industries - Continued
Industry group and industryNov. j Oct,, I Sep
indexesM lNov,
Pay-roll indexes___i?*TTNov. lOciV | Sept 19%Nov.
PAPER AND ALLIED PRODUCTS 1/Paper and, pulp Pape? goods, other Envelopes Paper bags Paper boxesPRINTING, F3BLISHHJG, AND ALLIED INDUSTRIES \f
Newspapers end periodicals Printing; bools: and job Lithographing BookbindingCHEMICALS AND ALLIED PRODUCTS 1/Paints, varnishes, and colors Drugs, raedicines, and insecticides Porfuneo and cosmetics SoapRayon and allied products Chemicals, not elaewljers classified Explosives and safety fuees Compressed and liquefied gases Ammunition, small-arris Fireworks Cottonseed oil FertilizersPRODUCTS OF PETROLEUM AND COAL l/Petroleum refining Coke and byproducts Paving materials Roofing materials
151,7j151.CI149.8150.0Ii49,5 l68.6i168.4 149.51146,9 152.81160.1 146,3!144.c
1150.01166.1 I145.21159.91139.9
134,7!134.8S133.0127.21127.0147.IU47.9 119.71119.7 136»Ol135.3! •207.1!208*1
! 125-9 !1*5.3 :il8.5 133.7
207.1
170,2 i172»1-172.0
235.*^3*.1 124.11122.7 173.91178.4132.3!132.3 j131.8
i233.21II9.7*177.2O
299.91 375.4! 239.2iJ I7l.5i 220.6: 173.5!152,4;
300.3379.3 "7.9 173.';
1301,6 1 3 1 9 • ? :247.01174.21243.31153.3
227.4 174.6 152.91152.3
158.9|153.6 [159.15 !
157.01148.11155.7 148.2!147.81149.2 113.6!117.2ill8.0212.81223.3 1222.7
148.6145.7 167.9 142.5 161.3142.7
135.*122.21*9.3125.8150.3
204.5
169.9241.3133.1166.9130.5294.0339.7244.9168.7249.0160.5155.1156.1153.*138.2 138.1 228,0
362.2]357.*j355*036*.7!359.1;362.9 392.8)38l.2i372.3 3!5.6i3(>5.3!298.3 362.*!391.*1390.2 3**.5i3*2,1:328.0
275.*1273.61273.6i •253.3!252,21253.6 307.9130?.*130*.8 23*.5;235.5!233.1 315.1|309.71307.8
: J460.2|*60.!|462.5329.9512.4261.9 *05.3 300.1
634.0 7*9.1491.0 403.7 5*4.2537.6415.3352.73*1.0346.7253.3517.5
338.4]339.3 506.91491.1252.21243.0412.21400,7296,7 297.5
628.6 763.8: 488,5! 409.41552.7 5*1.9 *30.8
641.6796.0513.9411.2621.0 *59.3 *36.1
344.1I345.6
325.9325.0 352.7 28I.5 3*7.4 31*. 5
257.2
22*.0 292.5 236.1325.1416.4 313*1 489.9265.3371.0260.5
566.0645.6458.0398.0711.6 448,7397.2309.5
323.6<326.1>295.9 3*9.51353.2>292.7 276.31279.1:263.8 577.7 I558.3 1526.4
See explanatory notes, sections C, F, and G, and the glossary for: definitions.
Digitized for FRASER http://fraser.stlouisfed.org/ Federal Reserve Bank of St. Louis

22.TABLE 10: Indexes of Product!cn-Worker Employment and Weekly Pay Rolls in Manufac
turing Industries - Continued
Industry group and industry 1948 ' ] 1947! 19© 1947Nov.iOct. } Soptj Hov.1 Nov.;Oct. iSept. Nov.
RUBBER PRODUCTS l/Rubber tires and inner tubes Rubber boots and shoes Rubber goods, otherMISCELLANEOUS INDUSTRIES l/
l64.‘ij163,5j162.8
168.2 i165.9:168.6156.2 ;i£> . 0;152.2I62.9il63.4jl59.9
184.9!187.8jl84.2
I1. .» " 1 1 1 ? t174.0|34l.913*5.5;3**.9
i i ; 1 188.71312.9:318.2s326.2!147.91377.2*369.0:355.9 !l66.0j378.7 J383.01370.8
190.4]420.81422.6:411.8
361.4|[362.41322.4 362.2
403.9Instruments (professional and scientific), and fire-control equipment Photographic apparatus Optical instruments and ophthalmic goods 2/Pianos, organs, and perto Games, toys, and dolls ButtonsFire extinguishers
265.0I224.6;
261.0 256.7 224.5;224.4
219.8]221.9!219.7 173.7!178.2;173.6 246.6j26l.7;251.7 ll6.5i 117.0. U 6.1 28l.0|28l.8j271.3
I J)246.112X9.5I1232.1-228.6[226.9113.0269.5
571.91555.5! 456.7 ^ 50.2;
530.1450.5
480.84lb.8
448.2;452.6;444.41445.3 389.5:38?.6;369.l'500.1 644.21662.51613.5 525.9 276.4!275.*1271.9 262.5 638.1 1616.9 i 606.1 s560.6
See explanatory notes, sections C, F, and G, and the glossary for definitions. 1/ See footnote 1, table 8.2/ Indexes for earlier months in 1948 have been revised as follows:
Confectionery - June through August employment to 115.8, 113.0, and 128.5; June and July pay roll to 261,8 arid 255.4.
Optical instruments and ophthalmic goods - August employment to 2l8.3; pay roll to 439.6. ’ ""
Digitized for FRASER http://fraser.stlouisfed.org/ Federal Reserve Bank of St. Louis

iTABI23 llj Indexes of Employment and Weekly Pay Bolls in Selected Honnianufacturing
Induetries(1930 Averse * 100)
23.
Induetry group and industry
MINING:CoalAnthracite Bituminous coal Metal Iron CopperLead and zlaa Gold and silver Miscellaneous Quarrying and nonr.atallic Crude petroleum and natural gas production
TRANSPORTATION AND PUBLICflmmss:Class I steam railroads 1/ Street railways and busses Telephone TelegraphElectric light and pcverTRADE:WholesaleRetailPoodGeneral merchandiseApparelFurniture and housefurnishinga AutomotiveLumber and building materials
SERVICExHotels (year-round) 4/Power laundries Cleaning and dyeing
JELi:loygient indexesTTICov, |Got, Sept.
lg4T
i92.1
i91.7
5sS 92.7 91.2
108,3 108.8 !109.7 107.495.0 99.3 ! 9^»5 96.5152 cl 155.4 ! 153.2 151.392,6 107.9 1107.7 104,4101.9 99.8 ! 79.8 94.831*6 30,9 i 31.4 31.3183.4 188,6 1183.9 185.7124.6 126.5 !128,3j 126.2
114,0 113.5ri|
j116.4 U0.5
134,6 136.2!t
1136.7 135.7126,2 126.9 1127.9 128.7202.1 201.9 ! 202.3 .193.390.7 91.6 i 92.3 97.2115.5 115.2 1116.2 109.7
Nov,
L18.3119.4113.8146.4122.8 93.8flll.7L26.6
L15.2L14.8150,5
118,1ll6,0113.8135.3119.4 92,2110,0127.8
116.2116.7153.7
117.1113.4112.012J.2113.9$1,6110.1 128.0
115.7118.4152.5
116,5119.8116,1143.6124.092*4L07.6126.4
L17.1L21.3L59.4
Pay-roll indexes-iqITB-------1Nov. Oct. Sept
Tgfff
227.3!343.ll215.2I355.0;226,4!265.4!
56.6;401.4!329-51
260.M 358,5! 224.9' 371.6! 255.6! 252.7! 56.4! 405.0;345.2!
247.3355.1211.2 361.0247.6 199.254.1406.7342.4
235.3123O.7I 235.6
2/ 12/ 122/ 237*4! 242.0? 239.7 349.0!338.2!335.4 215.31217.4!220,4 205.8!204.5!204.3
Nov,
224.2l22£a5! 228*4!223.5i 229.61227.4! 270.3(252,7 ! 226.5!222,2!182,51184.3! 219.0!215.6! 254.71261.3!
220.8219.4226,0238.3 210.8 179.9 217.0258.3
237.45238.7!235«3 226.9l227.6i232.9 289.3!300.0 I296.8
224.4327.4 194.8 310.2224.7 220.653.73^6.7305.7211.0
223.6321.5 206.8187.6
213.6216,5220.0251.1222.7177.3198.6233.5
228.6226.8293.7
See footnotes, table 9, ® d explanatory notes, sections C, F, and G.1/ Sources Interstate Coroejsroe Commission,2/ Not available,3/ Includes all nonsupervisory employees and working supervisors.4/ Money payments only; additional value of board, room, uniforms, and tips, not included.
Digitized for FRASER http://fraser.stlouisfed.org/ Federal Reserve Bank of St. Louis

ITOIAmTORY KOTOS
Sec. A. Scope of Enrplo3~ment revisions - The employment estimates shewn in this report for the industry divisions (e.g., manufacturing, mining, etc.) and industry groups (e.g., iron and steel, electrical machinery, etc.) have been adjusted to levels indicated by Federal Security Agency data through 19*6 and have been carried forward from 19*6 bench-mark levels, thereby providing consistent series.
Sec. B. Sources of Bench-Mark Data - In preparing estimates for private employment prior to 1939, the various industrial censuses taken by the Bureau of the Census were used as sources of bench-mark data. Data obtained from the Federal Security Agency are the main bases for 19*6 bench marks. Bench marks for State and local government are based on data compiled by the Bureau of the Census, while most of the data on Federal Government employment is made available by the U. S. Civil Service Commission. The Interstate Commerce Commission is the source for railroads,, and the U. S. Maritime Commission for water transportation.
Sec. C. Revisions of Production-Worker Estimates - Data for the manufacturing major industry croups have been adjusted to levels' indicated by Federal Security Agency data through 19*6 and have been carried forward from 19*6 bench-mark levels, thereby providing consistent series. Estimates for the individual manufacturing industries, formerly adjusted to data through 19*5, ar© now being adjusted to 19*6 bench-mark levels. As these revisions are completed, they are published in this report and indicated by appropriate footnotes. In the nonmanufacturing industries, the entire series of mining Industries have been adjusted to 19*6 bench-mark levels.
Since the data shown in this report cover only the current months, a set of summary sheets for each industry presenting comparable figures from January 1939 to date, by months, will be provided upon request to the Bureau of Labor Statistics, Such requests should specify the series desired.
Sec. D. How Employment Estimates Are Made - Estimates' of changes in the level of employment are based on reports frcaa a sample group of establishments, inasmuch as full coverage is prohibitively costly and time-consuming. In using a sample, it is essential that an accurate base be established from which estimates may be carried forward. This base or "bench mark" is either a complete count or an estimate with a satisfactory degree of accuracy.
Digitized for FRASER http://fraser.stlouisfed.org/ Federal Reserve Bank of St. Louis

When a new bench marlc becomes available, estimates prepared since the last bench mark are reviewed to determine if any adjustment of level is required. This is the basic principle of employment estimating used by the BLS. It yields a satisfactory compromise between a slow but highly accurate complete count on the one hand, and a rapid but less accurate eauipla count on the other.
Briefly, the Bureau of Labor Statistics computes employment estimates as follows: first, a bench mark or level of employment is determined] second, a sample of establishments is selected; and third, changes in employment indicated by this reporting sample are applied to the bench mark to determine the monthly estimates of employment between bench-mark periods. Fox' example, if the latest complete data on employment for an industry were 40,200 in September 19*5, and if the industry has a reporting sample of 13 establishments employing 23,200 workers in September and 23,800 in October, the October estimates would be prepared as follows:
1*0,200 X |kf§5 « *1,2*0
In general, then, the month~ to-month changes in employment reflect the fluctuations shown by estabiishments reporting to the Bureau of Labor Statistics.
Why Revisions Are Necessary - Because reports are not immediately available from new firms, they are frequently introduced into the BLS sample after they have been in operation for some time, This lapse of time produces a rather consistent understatement which becomes larger from year to year. It is important, therefore, that estimates not be allowed to go unccrrected for too long a period.The most recent revisions correct for the downward bias that had accumulated in the nonmanufacturing oeries beginning January 19^5 and in the manufacturing series beginning tTamiarj 19*6. Revisions in some industry divisions were made in order to incorporate greater refinements in methodology and new source materials that have become available.
Sec. E. Comparability With Other Types of Employment Data - The Bureau of Labor Statistics employment estimates are based upon reports submitted by cooperating establishments and therefore differ from employment information obtained by household interviews, such as the Monthly Report of the Labor Force. The BIS estimates of employment in nonagricultural establishments differ from the Monthly Report of the Labor Force total nonagricultural employment estimates in several important respects.
- ii -
Digitized for FRASER http://fraser.stlouisfed.org/ Federal Reserve Bank of St. Louis

For example: (l) The BLS estimates cover all full- and part-time vage and salary workers in private nonagricultural establishments who worked or received pay during the pay period ending nearest the 15th of this month; in Federal establishments during the pay period ending just before the first of the month; and in State and local government during the pay period ending on or Just before the last of the month. Persons who -worked in more than one establishment during the reporting period would be counted more then once; (2) Proprietors, self-employed persons, domestic servants, and unpaid family workers are excluded.
Sec. F. Pay-Roll Indexes - Cooperating establishments are instructed to report pay rolls of production or nonsupervisory workers prior to deduction for old age and unemployment insurance, withholding taxes, bonds, and union dues. Pay for sick leave, holidays, and vacations taken is included. Respondents are instructed to exclude pay for vacations not taken as well as cash estimates of any payments in kind. Bonuses, unless earned and paid regularly each pay period, are also excluded.
The methodology for obtaining pay-roll estimates is similar to that for employment estimates. Sample changes showing monthly movements are used In projecting established bench marks to secure current pay-roll estimates. These pay-roll estimates are converted Into indexes, using the 1939 average as a base.
Sac. G. Source of Data - Employment and pay-roll estimates are based on reports 'from cooperating Establishments. The approximate number of establishments, and workers covered, for each industry division is as follows:
Approximate Coverage of BIS Employment and Pay-Roll Sample
Industry division: Number : of estab- : llshments
Employees or production workers
Number : Percent of totalManufacturing 3*,300 7,5*2,000 56Mining 2,700 *07,000 52Contract construction 12, >)0 *80,000 22Public utilities 7,500 933,000 78Trade:Wholesale 12,800 360,000 20Retail 37,900 1,097,000 25
Service:Hotels (year-round) 1,200 131,000 35Power laundries andcleaning and dyeing 1,600 67,000 21
- Hi -
Digitized for FRASER http://fraser.stlouisfed.org/ Federal Reserve Bank of St. Louis

Sec. H. Coverage of Employment Estimates - The employment estimates shown in tables 1, 2, 3, b, <jnd 7 cover all full- arid pert- tiro wage and salary workers who worked or received pay during tRe pay period ending nearest the lf>th of the month. Proprietors, self-employed persons, domestic servants, and personnel of the armed forces are excluded. The estimates and indexes shown in tables 8 and 10 refer to production and related workers as defined in the glossary, page ix.
Sec, I. State Estimates - State estimates ere prepared in cooperation with various Steto Agencies as indicated on page v. The estimates for manufacturing have been adjusted to recent data made available under the Federal Social Security program.Since some States have adjusted to nore recent bench-mark data than others, and because very.-ng metheds of computation are used, the total of the State estimates differs, from the national total (see tables 1 and 2). Because ot these recent revisions the State estimates for manufacturing are not consistent with the unrevised data shown prior to June. lQVf for total employment in nonagricultural establishments, by State. A number of States also make available more detailed industry data arid information for earlier periods which may be secured directly upon request to the appropriate State Agency. Estimates of nonagricultural employment, by State, for those States which are now publishing such estimates are shown in table 6 and are consistent with the manufacturing estimates in table 7. As nonagricultural estimates for additional States became available, they will bo shewn in table 6.
The following publications are available upon request from the BLS Regional Offices or the Bureau’s Washington Office:
Nonagricultural Employment, by State, I9U3-I9V7;Employment in Manufacturing industries, by State, l9i3-19<46j Estimates of Total Employment in Manufacturing Industries by State,• 1947*
- iv -
Digitized for FRASER http://fraser.stlouisfed.org/ Federal Reserve Bank of St. Louis

COOPERATHftr STATE AGESCXSS
Alabama - Dept, of Industrial Relations, Mofcteonery 5*Arizona - TJ^ewplqyment Compensation Div., Employment Security
Commission, Phoenix.Arkansas - Employment Security piv., Dept, of Labor, Little Rock. California - Div. of Labor Statistics and Research, Dept, of
Industrial Relations, San Francisco 3*Connecticut - Employment Security Div,, Dept, of Labor and Factory
Inspection, Hartford 15,Delaware - Federal Reserve Bank of Philadelphia, Philadelphia 1, Pa. Florida - Unemployment Compensation Div., Industrial Commission >
Tallahassee.Georgia - Employment Security Agency, Dept, of Labor, Atlanta 3.Idaho - Employment Security Agency, Industrial Accident Board, Boise. Illinois - Dept, of Labor, Chicago 1«Indiana - Employment Security Div., Indianapolis U.Icwa - Employment Security Commission, Des Moinos 8.Kansas - State Labor Dept., Topeka.Kentucky - Dept, of Economic Security, Frankfort, .Louisiana - Div. of Employment Security, Dept, of Labor# Bate® Rouge J;« Maine - Unemployment Compensation Ccmsaission, Augusta.Maryland - Dept, of Employment Security, Baltimore 2. .Massachusetts - Div. of Statistics, Dept, of Labor and Industries,
Boston 10.Michigan - Dept, of Labor and Industry, Lansing 13.Minnesota - Div. of Employment and Security, Dept, of Social
Security, St. Piaul 1.Missouri - Div. of Employment Security, Dept, of Labor and Indus
trial Relations, Jefferson City.Montana - Unemployment Compensation Commission, Helena."Nebraska - Div. of Placement and Unemployment Insurance, Dept, of
Labor, Lincoln 1.Nevada - K&ployment Security Dept., Carson City.New Hampshire - Unemployment Compensation Div., Bureau of Labor,
Concord.New Jersey - Dept, of Labor, Trenton 8.New Mexico - Employment Security Commission, Albuquerque.New York - Div. of Placement and Unemployment Insurance, Dept, of
Laboi*. New York 17'.North Carolina - Dept, of Labor, Raleigh.Oklahoma - Employment Security Commission, Oklahoma City 2. Pennsylvania - Federal Reserve Bank of Philadelphia, Philadelphia 1
(mfg.); Bureau of Research and Information, Dept, of Labor and Industry, Harrisburg (nonmfg.).
Rhode Island - Div. of Census and Information, Dept, of Labor, Providence 2.
Tennessee - Dept, of Employment Security, Nashville 3.Texas - Bureau of Business Research, University of Texas, Austin 12, Utah - Dept, of Employment Security, Industrial Commies ion, Salt
Lake City 13.Vermont - Unemployment Compensation Commission, Montpelier.Virginia - Div, of Research and Statistics, Dept, of Labor pnd
Industry, Richmond 21.Washington - Employment Security Dept,, Olympia.Wisconsin - Statistical Dept., Industrial Commission, Madison 3. Wyoming - Employment Security Caneoission, Casper.
- v -Digitized for FRASER http://fraser.stlouisfed.org/ Federal Reserve Bank of St. Louis
BLS REGIONAL OFFICESNev England - Regional Director, U, S. Bureau' of Labor Statistics,Old South Bldg., 294 Washington St., Boston 33, Massachusetts (Connecticut, Maine, Massachusetts, New Hampshire, Rhode Island, Vermont). .
North Atlantic - Regional Director, U. S. Bureau of Labor Statistics, 1000 Parcel Post Bldg., 3*1 Ninth Avenue, New York 1, New York (Delaware, Pennsylvania, New Jersey, New York).
North Central Regional Director, U. Si Bureau of Labor Statistics,312 National War Agencies Bldg., 226 W. Jackson Blvd., Chicago 6, Illinois (Illinois, Indiana, Iowa, Kansas, Kentucky, Michigan, Minnesota, Missouri, Nebraska, Ohio, North Dakota, South Dakota, Wisconsin).
Southern - Regional Director, U. S. Bureau of Labor Statistics, 6th Floor Silvey Bldg., 114 Marietta Street, N. W., Atlanta 3, Georgia (Alabama, Arkansas, Florida, Georgia, Louisiana, Mississippi, North Carolina, Oklahoma, South Carolina, Tennessee, Texas).
Pacific-Rocky Mountain - Regional Director, U. S. Bureau of Labor Statistics, 546 Federal Office Bldg., San Francisco 2, California (Arizona, California, Colorado, Idaho, Montana, Nevada, New Mexico, Oregon, Utah, Washington, Wyoming).
Technical advice and assistance on employment statistics inthe states of Virginia, West Virginia, Maryland, and the District ofColumbia will be given by the Bureau*s Washington Office.
GLOSSARYContinental United States - Covers only the 48 States and the District of Columbia.
Contract construction - Covers only.firms engaged in the construction business on a contract basis for others. Force-account construction workers, i.e., hired directly by and on the pay rolls of Federal, State, and local government, public utilities, and private establishments, are excluded.
Defense Agencies - Covers civilian employees of the National Military Establishment, Maritime Commission, National Advisory Committee for Aeronautics, The Panama Canal, Philippine Alien Property Administration, Philippine War Damage Commission, Selective Service System, War Assets Administration, Office of Defense Transportation,National Security Resources Board* National Security Council.
Family Allowances - Represents the Government's contribution; the amount contributed by the personnel is included under pay rolls.
Federal Government-Executive Branch - Includes U. S. Navy Yards, Federal arsenals, and forceraccount construction. Fourth-class postmasters are included under the executive branch in table 4, but are excluded from the government data shown in tables 1 and 3.
- vi
Digitized for FRASER http://fraser.stlouisfed.org/ Federal Reserve Bank of St. Louis

Employment shown here for the executive braffch.differs from data published by the U. S. Civil Service'Cofami'sUic /in the following respects: (1) Employment collected ar.& published by the Civil Service C omission as of the last day of the month, is hero• present sd m. of the first day of the next month; (2) substitute rural mil carriers are excluded; (3) employment in Decem'ber of each year: iiicludba the additional'postal employees necessitated by theXtsx’intsaa peasonj, excised from published Civil Service Coamie&ton figures starting 19 2; (.4) seamen and trainees vho, are hirdd aad paid by private steamship companies having' contracts with the Maritime! Commission are excluded; (5) the Panama Railroad Company is shown here under Government corporations but is included under the executive branch by the Civil Service Cowisaion,finance - Covers establishments operating in the fields of finance,“ Insurance, and real estate; excludes the Federal Reserve District Banks and the mixed ownership banks of th6 Farm Credit Administration.
Government - Covers Federal, State, and local governmental establishments performing legislative, executive, and judicial functions, as well as all government-owned and operated establishments end institutions (arsenols, navy yards, hospitals, etc.), government corporations, and government force-account construction. The data shown in tables 1 and 3 exclude fourth-claes postj&asters because they presumably have othsr major job3.
Governgent.corporations - Covers only three corporations: The Panama Railroad' Cgmpany,' the Federal Reserve banks, and the mixed-owner- ship banks of the Farm Credit Administration. All other corporations are included under, the executive branch.
Indexes of production-worker employment - Estimates of productlon- worker employment1 expressed.as a percentage of the average employment in 1939.
Indexes of productlon-workor weekly pay rolls - Estimates of production- worker weekly pay rolls expressed as a percentage of the average weekly pay roll far 3.939.
Leave payments - Payments, were authorized' by Public Law 70k of the T fch Congress-and were continued by Public law 25k of the 80th Congress to enlisted personnel who were discharged prior to September 1, I9U6 for accrued and unused leave and to officers and enlisted personnel then on active duty for leave accrued in excess of 60 days. Value of bonds represents face value; interest is paid in addition when bonds are cashed. Lump-sum payments for terminal leave, which ware authorized by Public Law 350 of the 80th Congress, and were started October 19 7, see excluded here and included under pay rolls.
- vii -
Digitized for FRASER http://fraser.stlouisfed.org/ Federal Reserve Bank of St. Louis

Manufacturing - Covers only privately owned establishments; governmental manufacturing operations such as arsenals and navy yards are excluded.
Military personnel - Represents persona on active duty as of the first of thexaonth. Reserve personnel are excluded if on inactive duty or if cat active duty for a brief training or emergency period.
Military pay rolls - Represent estimated pay roll obligations based on an average monthly personnel count, plus lump-sum payments for terminal leave. Pay rolls fear the Navy and Coast Guard include cash payments for clothing-allowance balances in January, April, July, and October.
Mining - Covers establishments engaged in the extraction from the earth of organic and inorganic minerals which occur in nature as solids, liquids, or gases; includes various contract services required in mining operations, such as removal of overburden, tunnelling and shafting, and the drilling or acidizing of oil wells; also includes ore dressing, beneficiating, and concentration.
Nonagricultural establishments - Governmental or private business establishments; (l) that are physically located within continental United States; and (2) whose principal activity can be classified under one of the following industry divisions - manufacturing, mining, contract construction, transportation and public utilities, trade, finance, service, or government.
Pay rollg - Private pay rolls represent weekly pay rolls of bothfull- and part-time production and related workers (or nonsupervisory employees and working supervisors) who worked or received pay for any part of the pay period ending nearest the 15th of the month, before deductions for old-age and unemployment Insurance, group insurance, withholding tax, bonds, and union dues, but after deductions for damaged work. Includes pay for sick leave, holidays, and vacations taken. Excludes cash payments for vacations not taken, retroactive pay not earned during period reported, value of payments in kind, and bonuses, unless earned and paid regularly each pay period. In coal mining portal-to-portal pay is included.Federal civilian pay rolls are for all employees before deductions for income tax, retirement, and bonds, and cover the working days in the calendar month.
- viii -
Digitized for FRASER http://fraser.stlouisfed.org/ Federal Reserve Bank of St. Louis
Production ana related workers - Includes working foremen and all non- supervisory workers (including lead men and trainees) engaged in fabricating, processing, assembling, inspection, receiving, storage, handling, packing, warehousing, shipping, maintenance, repair, Janitorial, watchman services, products development, auxiliary production for plant's own use (e.g., power plant), and recordkeeping and other services closely associated with the above production operations. Excludes supervisory employees (above the working foreman level) and their clerical staffs, routemen, salesmen, and other groups of nonproduction workers defined below under wage and salary workers.
Service - Covers establishments primarily engaged in rendering services to individuals and business firms. Excludes automobile repair services, government owned and operated hospitals, museums, etc., and domestic service.
Trade - Covers establishments engaged In wholesale trade, i.e., selling merchandise to retailers, and in retail trade, i.e., selling merchandise for persona], or household consumption, and rendering services Incidental to the sale of goods. Includes auto repair services.
Transportation and public utilities - Covers only privately owned and operated enterprises engagedTin providing all types of transportation and related services; telephone, telegraph, and other communication services; or providing electricity, gas, steam, water, or sanitary service. Government owned and operated establishments are included under government.
Wage and salary workers - In addition to production and relatedworkers as defined above, includes workers engaged in the following activities; executive, purchasing, finance, accounting, legal, personnel (including cafeterias, medical, etc.), professional and technical activities, sales, saleg-delivery, advertising, credit, collection, and in installation and servicing of own products, routine office functions, factory supervision (above the working foreman level) and other workers not included as production workers. Also includes employees on the establishment pay roll engaged in new construction and major additions or alterations to the plant who are utilized as a separate work force (force-account construction workers).
Wage earner - See production workers.
Washington, D. C. - Data for the executive branch of the Federal Government also Include areas in Maryland and Virginia which are within the metropolitan area, as defined by the Bureau of the Census.
- ix -
Digitized for FRASER http://fraser.stlouisfed.org/ Federal Reserve Bank of St. Louis