employee turnover prediction with machine learning: a
TRANSCRIPT
Employee Turnover Prediction with MachineLearning: A Reliable Approach
Yue Zhao1(&), Maciej K. Hryniewicki2, Francesca Cheng2,Boyang Fu3, and Xiaoyu Zhu4
1 Department of Computer Science, University of Toronto, Toronto, [email protected]
2 PricewaterhouseCoopers, Toronto, Canada{maciej.k.hryniewicki,francesca.cheng}@pwc.com
3 University of Münster, Münster, [email protected] Fifth Third Bank, Cincinnati, USA
Abstract. Supervised machine learning methods are described, demonstratedand assessed for the prediction of employee turnover within an organization. Inthis study, numerical experiments for real and simulated human resourcesdatasets representing organizations of small-, medium- and large-sizedemployee populations are performed using (1) a decision tree method; (2) arandom forest method; (3) a gradient boosting trees method; (4) an extremegradient boosting method; (5) a logistic regression method; (6) support vectormachines; (7) neural networks; (8) linear discriminant analysis; (9) a NaïveBayes method; and (10) a K-nearest neighbor method. Through a robust andcomprehensive evaluation process, the performance of each of these supervisedmachine learning methods for predicting employee turnover is analyzed andestablished using statistical methods. Additionally, reliable guidelines are pro-vided on the selection, use and interpretation of these methods for the analysis ofhuman resources datasets of varying size and complexity.
Keywords: Machine learning � Artificial intelligence � Data miningData analytics � Data visualization � Feature selection � Model stabilityEmployee turnover � Human resources management
1 Introduction and Motivation
Employee turnover is one of the most significant problems an organization canencounter throughout its lifecycle, as it is difficult to predict and often introducesnoticeable voids in an organization’s skilled workforce [1]. Service firms recognize thatthe timely delivery of their services can become compromised, overall firm produc-tivity can decrease significantly and, consequently, customer loyalty can decline whenemployees leave unexpectedly [8]. As a result, it is imperative that organizationsformulate proper recruitment, acquisition and retention strategies and implementeffective mechanisms to prevent and diminish employee turnover, while understandingits underlying, root causes [2, 3].
© Springer Nature Switzerland AG 2019K. Arai et al. (Eds.): IntelliSys 2018, AISC 869, pp. 737–758, 2019.https://doi.org/10.1007/978-3-030-01057-7_56

Most recently, the prevalence of intelligent machine learning algorithms in the fieldof computer science has led to the development of robust quantitative methods toderive insights from industry data. Supervised machine learning methods—whereincomputers learn from analyses of large-scale, historical, labelled datasets—have beenshown to garner insights in various fields, like biology and medical sciences [21, 22],transportation [23, 24], political science [25], as well as many other fields. Owing to theadvancements in information technology, researchers have also studied numerousmachine learning approaches to improve the outcomes of human resource (HR) man-agement [2, 4, 5]. A detailed listing of recent studies in using supervised machinelearning on employee turnover is described in Table 1, and lists the data included andrelated machine learning algorithms that were used therein, including decision tree(DT) methods, random forest (RF) methods, gradient boosting trees (GBT) methods,extreme gradient boosting (XGB), logistic regression (LR), support vector machines(SVM), neural networks (NN), linear discriminant analysis (LDA), Naïve Bayes(NB) methods, K-nearest neighbor (KNN), Bayesian networks (BN) and induction rulemethods (IND).
The performance evaluation of machine learning algorithms has also been studiedpreviously by various researchers [6, 9, 13, 14]. Notably, Punnoose and Ajit [13]compared the predictive capabilities of seven different machine learning algorithms,including recently developed algorithms, like Extreme Gradient Boosting [26], onemployee turnover. Similarly, Sikaroudi and co-researchers [14] conducted simulationsto predict employee turnover using ten different data mining algorithms, including testson various types of neural networks and induction rule methods.
In addition to placing focus on classification and prediction ability, manyresearchers have also made substantial efforts to better understand which features (e.g.compensation, age, work experience, etc.) are most influential in predicting employeeturnover [1–4, 8, 9, 14]. These features seldom carry equal value in data miningapplications, so it is useful to gain a better understanding of their importance [34].
For instance, many of the studies using tree-based quantified feature importance bycalculating the impurity reduction by node split in decision trees [1, 35]. Moreover,modified genetic algorithms [8] and sensitivity analysis [6] have been used to under-stand relative feature importance as well. Numerous studies have also generatedclassification rules or visualized the classification procedure to provide further insightand confidence in using machine learning methods [2, 6, 35].
Despite the breadth of research outcomes mentioned above, the findings for pre-dicting employee turnover that stem from using machine learning methods are oftenproblem-specific and difficult to generalize. First and foremost, this is primarilybecause HR data is confidential [7], which inherently impedes conducting in-depthanalyses on multiple datasets. In addition, HR data is often noisy, inconsistent andcontains missing information [4, 13], a problem that is exacerbated by the small pro-portion of employee turnover that typically exists within a given set of HR data.Secondly, gaps tend to persist in model performance evaluation. Specifically, previousresearch on the assessment of machine learning algorithms has generally focused on anarrow evaluation of metrics across various models.
738 Y. Zhao et al.

Tab
le1.
Overview
ofrecent
stud
iesin
theapplicationof
supervised
machine
learning
metho
dsto
predictem
ploy
eeturnov
er
Ref.
Dataset
size
Num
ber
of features
Organization
type
Supervised
machine
learning
method
DT
RF
GBT
XGB
LRSV
MNN
LDA
NB
KNN
BN
IND
[1]
309
9Higher
education
Yes
––
––
––
––
––
–
[2]
130
–IT
indu
stry
Yes
––
––
––
–Yes
––
–
[3]
881
44Manufacturing
––
––
––
––
–Yes
––
[4]
3852
–High-tech
indu
stry
Yes
––
––
––
––
––
–
[6]
150
14So
ftware
company
Yes
––
–Yes
–Yes
Yes
––
––
[7]
536
–Child
welfare
agency
––
––
Yes
–Yes
––
––
–
[8]
<10
0–
Fabrication
firm
––
––
––
Yes
––
––
–
[9]
2572
12IT
indu
stry
Yes
Yes
––
––
––
Yes
–Yes
–
[10]
768
–Nurse
data
from
hospital
––
––
–Yes
––
––
––
[11]
1037
–Callcenter
Yes
––
––
––
–Yes
––
–
[13]
7311
5–
Globalretailer
Yes
Yes
–Yes
Yes
Yes
–Yes
Yes
Yes
––
[14]
–14
Arakcompany
Yes
Yes
––
Yes
Yes
Yes
–Yes
Yes
–Yes
[38]
132
–Marketin
gfirm
––
––
Yes
Yes
––
––
––
[40]
577
–Medicalcenter
––
––
Yes
–Yes
––
––
–
Employee Turnover Prediction with Machine Learning 739

Accuracy has traditionally been selected as the primary evaluation standard for thisproblem, but this approach is questionable as accuracy measures are not reliable forimbalanced datasets [2, 8, 10, 14]. As the proportion of people who leave an organi-zation is generally much smaller than that of those who stay, there is often a risk ofcomputing misleadingly high accuracy correlations. The deficiency of the analysis isoften made worse by the limited use of statistical instruments, often only opting forrelatively simple comparisons instead. Thirdly, the attempt to improve the modelinterpretability by ranking feature importance and visualizing classifier rules should beexecuted cautiously. The analysis of feature importance in several studies [1, 3, 8,9, 35] could be biased as it takes classifier-dependent approaches, where model per-formance matters. For instance, some works [1, 35] use decision trees to calculate thefeature importance as part of the model building process. However, if decision trees donot perform well, the corresponding feature importance result may be inaccurate. Withthe assumption that decision trees perform well, visualizing their classification rulescould improve the model interpretability. However, decision trees come with highvariance and low stability, resulting in precarious model interpretation with a smallchange in data [34].
The aim of this paper is to provide a comprehensive description, demonstration andassessment of supervised machine learning approaches for the prediction of employeeturnover within organizations of varying size. In the present study, ten supervisedmachine learning methods are evaluated for organizations of small-, medium- andlarge-sized populations. Details of each supervised machine learning method are givenand the benefits, capabilities and performance of each are provided in the context ofpredicting employee turnover. The effect of data size and data type, and how to getreliable feature importance and data visualization are also discussed. Lastly, generalguidelines are provided on the selection, use and interpretation of these ten supervisedmachine learning methods for reliable analysis of HR datasets of varying size andcomplexity.
2 Methodology
In this research, various supervised machine learning algorithms are described,demonstrated and assessed in their ability to predict employee turnover. This sectionprovides a general overview of the theory behind these algorithms.
2.1 Decision Tree (DT)
Decision tree is a supervised method which builds classification or regression models ina tree-like structure. It is an established method that was first published in 1963 byMorgan and Sonquist [31]. The decision tree method is: (1) conceptually easy yetpowerful [34]; (2) intuitive for interpretation; (3) capable of handling missing valuesand mixed features [44]; and (4) able to select variables automatically [20, 44].However, its predictive power is not overly competitive. Decision tree is usually notstable with high model variance [44] and small variations in the input data would resultin a large effect on the tree structure [17].
740 Y. Zhao et al.
2.2 Random Forests (RF)
Random forests take an ensemble approach that provides an improvement over thebasic decision tree structure by combining a group of weak learners to form a strongerlearner (see the paper by Breiman [28]). Ensemble methods utilize a divide-and-conquer approach to improve algorithm performance. In random forests, a number ofdecision trees, i.e., weak learners, are built on bootstrapped training sets, and a randomsample of m predictors are chosen as split candidates from the full set P predictors foreach decision tree. As m � P, the majority of the predictors are not considered. In thiscase, all of the individual trees are unlikely to be dominated by a few influentialpredictors. By taking the average of these uncorrelated trees, a reduction in variancecan be attained [34], making the final result less variable and more reliable [44].
2.3 Gradient Boosting Trees (GBT)
Gradient boosting trees is an ensemble machine learning method proposed in 2001 byFriedman [30] for regression and classification purposes. The difference between RFand GBT is the gradient boosted tree models learn sequentially. In GBT, a series oftrees are built and each tree attempts to correct the mistakes of the previous tree in theseries. Trees are added sequentially until no further enhancement can be achieved.Making predictions in GBT is fast and memory-efficient; boosting could be viewed as aform of ‘1 regularization to reduce overfitting [20]. However, unlike highly inter-pretable single DT, GBT is harder to visualize and interpret [34].
2.4 Extreme Gradient Boosting (XGB)
Extreme Gradient Boosting is a tree-based method that was introduced in 2014 byChen [26]. It is also commonly referred to as XGBoost. It is a scalable and accurateimplementation of gradient boosted trees, explicitly designed for optimizing thecomputational speed and model performance. Compared to gradient boosting,XGBoost utilizes a regularization term to reduce the overfitting effect, yielding a betterprediction [13] and much faster computational run times.
2.5 Logistic Regression (LR)
Logistic Regression is a traditional classification algorithm involving linear discrimi-nants, as originally proposed in 1958 by Cox [37]. The primary output is a probabilitythat the given input point belongs to a certain class. Based on the value of the prob-ability, the model creates a linear boundary separating the input space into two regions.Logistic regression is easy to implement and work well on linearly separable classes,which makes it one of the most widely used classifiers [43].
2.6 Support Vector Machine (SVM)
Support vector machine was initially proposed in 1995 by Vapnik and Cortes [36].SVM is commonly used as a discriminative classifier to assign new data samples to one
Employee Turnover Prediction with Machine Learning 741

of two possible categories. The basic idea of SVM is to define a hyperplane whichseparates the n-dimensional data into two classes, wherein the hyperplane maximizesthe geometric distance to the nearest data points, so-called support vectors. It isnoteworthy that practical linear SVM often yields similar results as logistic regression[43].
In addition to performing linear classification, SVM also introduces the idea of akernel method to efficiently perform non-linear classification. It is a feature mappingmethodology which transfers the attributes into a new feature space (usually higher indimension) where the data is separable. For further details, refer to the paper by Mullerand co-researchers [32].
2.7 Neural Networks (NN)
Neural networks, also known as multi-layer perceptron, are designed to simulate theoperations of the human nervous system. The simplest form of a neural network is asingle perceptron. Essential elements for a perceptron are input values, associatedweights, bias, activation functions and a computed output. Commonly used activationfunctions include the sigmoid, hyperbolic tangent (Tanh) and rectified linear units(ReLU). A neural network may contain more than one layer between input and outputto handle complex problems.
This sophisticated structure of neural networks makes it a universal approximationtool which could model any smooth function to any desired level of accuracy, givenenough hidden units [20]. One can extend the model to become deep with moreadvantages [20], in what is commonly referred to as deep learning. Due to the rapiddevelopment of hardware and the continuous exploration of backpropagation tech-niques, neural networks are currently the most heavily researched topic in machinelearning.
2.8 Linear Discriminant Analysis (LDA)
Linear Discriminant Analysis is a commonly used topic modelling technique. It is ageneralization of Fisher’s linear discriminant, proposed in 1936 by Fisher [19]. LDAdedicates to find the optimal linear combination that can separate data into differentclusters by projecting data samples into a lower-dimension space. Unlike the PrincipleComponent Analysis (PCA), LDA is a supervised method, although its performancemay be inferior to PCA in certain cases [43].
LDA assumes the data is normally distributed, the class share the identicalcovariance and features are all independent an identically distributed. To conduct theclassification, LDA measures the distance between projected means and utilizes ascatter matrix to maximize the ratio of between-class sample distance to the within-class sample distance.
2.9 Naïve Bayes (NB)
Naïve Bayes is a probabilistic approach that uses Bayes Theorem. The Bayes Theo-rem describes the occurrence probability of an event based on the prior knowledge of
742 Y. Zhao et al.
related features. The other important characteristic of Naïve Bayes is the conditionalindependence assumption of its features. This assumption indicates that the presence ofa feature would not influence any other features. Naïve Bayes classifiers first learn jointprobability distribution of their inputs by utilizing the conditional independenceassumption. Then, for a given input, the methods produce an output by computing themaximum posterior probability with Bayes Theorem. See the paper by Zhang [33] andthe book by Géron [17] for more details.
2.10 K-Nearest Neighbors (KNN)
K-nearest neighbors is a non-parametric algorithm used for classification and regres-sion problems. For classification problems, the idea is to identify the K data points inthe training data that are closest to the new instance and classify this new instance by amajority vote of its K neighbors. In practice, the popular distance measures include theEuclidean distance, the Manhattan distance as well as the Minkowski distance. Forregression problems, the idea is to calculate the new instance value by taking theaverage of its K neighbors. KNN could work well with a small number of features, butit struggles when the feature dimensions increase drastically. See the book by Fried-man, Hastie and Tibshirani [34] and the book by Murphy [20] for further information.
3 Human Resource Datasets
3.1 Data Sources
In this research, two primary datasets were collected with all personally identifiableinformation cleansed. The first dataset originates from a regional bank in the UnitedStates of America. The bank data was collected from 2013 to 2016, during which timeroughly 28% of the bank’s employees had left. The raw bank dataset contains 14,322employee entries and 24 features. The second dataset is a simulated dataset created byIBM Watson Analytics [15] and is included in this research to facilitate a more thor-ough analysis. The IBM dataset contains 1,470 employee entries and 38 features, inwhich 237 employees (roughly 16%) left. Some necessary data cleaning was intro-duced. Firstly, all individuals marked as temporary workers were removed from thedatasets. Secondly, any unique-value features that were consistent amongst allemployee entries were removed. Following these basic data cleaning procedures, thefinal datasets consisted of 9,089 employees with 19 features for Bank data and 1,470employees with 31 features for IBM data. Both datasets contained common HR fea-tures like age, compensation, gender and education.
3.2 Data Sampling and Simulation
As discussed in the introduction of this paper, previous studies have always focused ona single, small-sized dataset. To best assess the performance of machine learningalgorithms in a variety of different settings (i.e., various dataset sizes), data samplingmethods were employed to create additional datasets from the two main sets of data.
Employee Turnover Prediction with Machine Learning 743
With the number of features and turnover rate fixed, additional datasets are randomlydown-sampled from original datasets without replacement. This process ensured thatall newly generated datasets contained minimal overlap. As the intention is to bringdiversity and restrict complexity, this research does not use sampling methods likeMarkov Chain Monte Carlo [34].
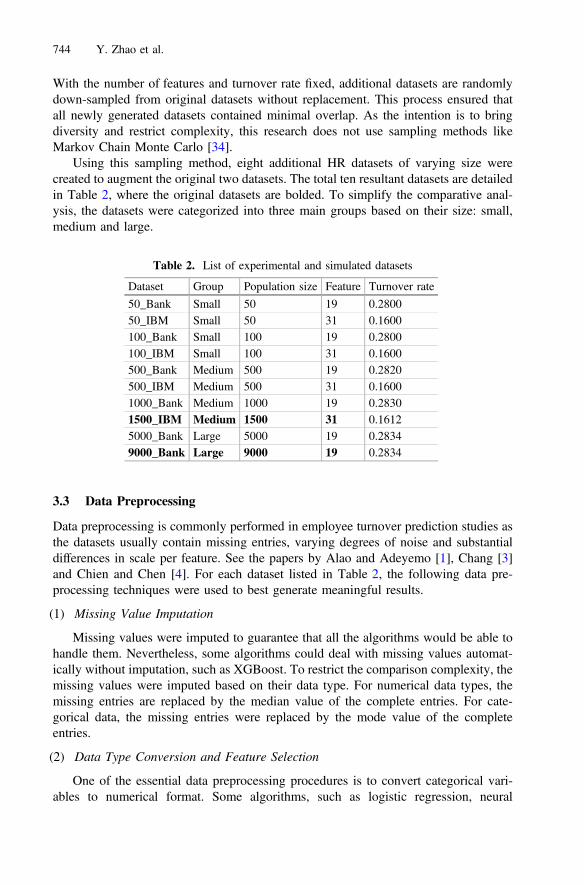
Using this sampling method, eight additional HR datasets of varying size werecreated to augment the original two datasets. The total ten resultant datasets are detailedin Table 2, where the original datasets are bolded. To simplify the comparative anal-ysis, the datasets were categorized into three main groups based on their size: small,medium and large.
3.3 Data Preprocessing
Data preprocessing is commonly performed in employee turnover prediction studies asthe datasets usually contain missing entries, varying degrees of noise and substantialdifferences in scale per feature. See the papers by Alao and Adeyemo [1], Chang [3]and Chien and Chen [4]. For each dataset listed in Table 2, the following data pre-processing techniques were used to best generate meaningful results.
(1) Missing Value Imputation
Missing values were imputed to guarantee that all the algorithms would be able tohandle them. Nevertheless, some algorithms could deal with missing values automat-ically without imputation, such as XGBoost. To restrict the comparison complexity, themissing values were imputed based on their data type. For numerical data types, themissing entries are replaced by the median value of the complete entries. For cate-gorical data, the missing entries were replaced by the mode value of the completeentries.
(2) Data Type Conversion and Feature Selection
One of the essential data preprocessing procedures is to convert categorical vari-ables to numerical format. Some algorithms, such as logistic regression, neural
Table 2. List of experimental and simulated datasets
Dataset Group Population size Feature Turnover rate
50_Bank Small 50 19 0.280050_IBM Small 50 31 0.1600100_Bank Small 100 19 0.2800100_IBM Small 100 31 0.1600500_Bank Medium 500 19 0.2820500_IBM Medium 500 31 0.16001000_Bank Medium 1000 19 0.28301500_IBM Medium 1500 31 0.16125000_Bank Large 5000 19 0.28349000_Bank Large 9000 19 0.2834
744 Y. Zhao et al.

networks and K-nearest neighbor, are not able to work directly with categorical vari-ables. Traditionally, researchers typically utilize one-hot encoding to conduct theconversion from categorical to numerical data type formats [7, 13] which converts eachof the distinct values in a categorical value to binary fields. Naturally, this conversionmay significantly increase feature dimensions, provided there are many distinct valuesfor a categorical feature. In this research, data conversion was performed using labelencoding via the Scikit-learn package in Python [18]. The feature selection methods areoften used to further improve the classifier’s predictive capabilities by selecting rele-vant attributes. In addition, dimensionality reduction methods like principal componentanalysis are used if the data dimensionality is high. In an effort to restrict the com-plexity of the results analysis and the interpretation needed of HR data, neither featureselection nor dimensionality reduction was used.
(3) Feature Scaling
Feature scaling is a data mining approach to adjust the range of features and reducedisparate feature scales. This may help some machine learning classifiers performbetter, because significant scale gaps among features are generally not favored withinthe optimization stage of these algorithms. For example, neural networks are recom-mended to scale the inputs to achieve good results [34]. In HR datasets, featuresgenerally have significantly disparate scales. For example, employee ages could be inthe range of 18 to 74 years old, whereas the compensation range could be $24,521 to$2,323,000. In this research, both normalization and standardization were performed onthe original datasets for a complete assessment.
4 Experiment Design
The design of the numerical experiments performed in this research has been createdwith the intent to comprehensively measure the effectiveness of various supervisedmachine learning algorithms. Details of the experiment design are presented herein todescribe the evaluation criteria, algorithm effectiveness and procedures that were usedin conducting the numerical experiments performed in this research.
4.1 Evaluation Matrices
In employee turnover analytics, the imbalance of individuals who left and those whostayed should be taken into account. As defined previously in Table 2, the turnover rateis always below 0.50 (Bank dataset: 0.2834, IBM dataset: 0.1612), making the accu-racy an inherently biased measure. To remedy this issue, additional evaluation metricsare introduced to provide complete coverage and analysis of the results.
In this research, the positive class is assigned to the employees who turn over, whilethe negative class consist of the employees who stay. Five evaluation metrics areintroduced in the evaluation of the supervised machine learning algorithms
studied in this research: (1) accuracy (ACC) is defined as the percentage of thecorrectly classified data by the model; (2) precision (PRC) is defined as the number oftrue positives divided by the sum of true positives and false positives; (3) recall
Employee Turnover Prediction with Machine Learning 745

(RCL) is defined as the number of true positives divided by the sum of true positivesand false negatives; (4) F1 is defined as the harmonic mean of precision and recall; and(5) Receiver operating characteristic (ROC) curve is defined as a graphical plot of thetradeoff between precision and recall [17]. The area under the ROC curve providesanother view of the quality of classifiers which is used in this study. As ROC yieldsfurther insights in classifier performance regarding imbalanced samples [43], it hasbeen selected as the primary evaluation standard in this research.
4.2 Probability and Statistical Analysis
Non-parametric Kruskal-Wallis tests followed by Dunn’s post-hoc test [42] were usedto conduct multi-group comparison on classifier performances (e.g. data type, size andmodel selection). The Mann-Whitney U test [41] was used to conduct pairwise com-parisons between two groups. For these tests, the probability P\0:05 was consideredsignificant while the remainder was considered non-significant (NS).
Probability and information theory methods were also used in this study to analyzedata characteristics. In general, mutual information (MI) measures how much uncer-tainty is reduced about random variable (RV) Y after X is observed. MI between X andY , I XjYð Þ; is given as follows, where p is the probability:
I XjYð Þ ¼X
x
Xyp x; yð Þlog p x; yð Þ
p xð Þp yð Þ ð1Þ
In this study, features include both discrete and continuous RVs. However, MI isonly feasible for a pair of discrete RVs, rather than continuous RVs. Therefore, themaximal information coefficient (MIC) was introduced to quantify the linear and non-linear correlation [20] between features and the predicted value. MIC could measurethe MI between continuous and discrete RVs, ranging from 0 (no correlation) to 1(fully correlated). The function m x; yð Þ is defined as the approximately maximized MIwith various bin sizes and locations while discretizing a continuous random variable:
ð2Þ
Where, ℊ(x, y) is the set of 2-dimensional grids with size x� y. IðX Gð ÞjY Gð ÞÞ is MI(Eq. 1) enumerated on ℊ(x, y). MIC is then given as:
MIC,maxx;y;xy\Bm x; yð Þ ð3Þ
Where, x and y are two RVs and B is a sample size dependent bound.
4.3 Model Building and Validation
Cross validation is used to assess the generalization ability of an algorithm on anindependent dataset. It can prevent a model from overfitting that is possibly caused by
746 Y. Zhao et al.
the high complexity of the model. Grid search is a parameter searching algorithm that isused to automatically find the most optimal parameters within a predefined range [17].
All of the datasets listed in Table 2 were run against the ten algorithms introducedin Sect. 2 with data preprocessing methods. In total, there were 10 datasets, 10 algo-rithms and 3 data formats (raw, normalized, standardized), yielding a total of 300numerical experiments performed in this research. For each numerical experiment, theoptimal algorithm parameters were defined by the Grid Search technique within apredefined range using GridSearchCV package [18]. Once the optimal parameter wasfound, the accuracy, precision, recall, F1 and ROC values were calculated using 10-fold cross validation.
5 Results and Discussions
The results of the numerical experiments for datasets representing small-, medium- andlarge-sized organizations are presented in this section. Various statistical methodsmentioned above were utilized to analyze the results: the Kruskal-Wallis test was usedto identify significant performance difference in multi-groups, and Dunn’s test wasapplied as the post-hoc test. Although the experimental datasets may deviate slightlyfrom other real-world employee profiles and turnover datasets for varying size oforganizations, the datasets used in this research provide a framework to perform acomplete and comparative analysis across various machine learning algorithms. Fur-thermore, the study limited the use of advanced feature engineering methods likefeature selection and dimensionality reduction; it is understood that these types ofmethods would likely increase the predictive capabilities. Lastly, it should be noted thatthe scope of the presented results and discussion is limited to describing how best touse the data mining methods to understand employee turnover, rather than how best toreduce it. The latter is beyond the scope of this paper.
5.1 Results for Small HR Datasets
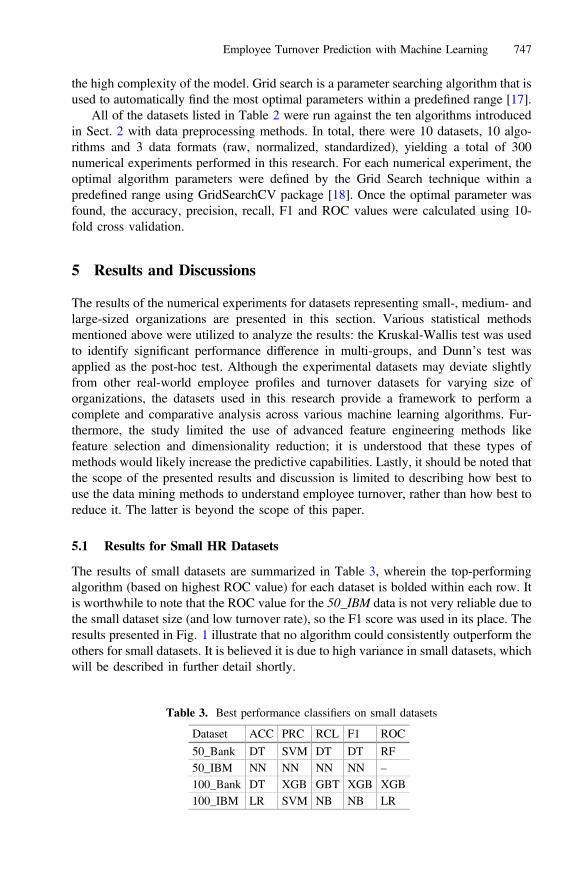
The results of small datasets are summarized in Table 3, wherein the top-performingalgorithm (based on highest ROC value) for each dataset is bolded within each row. Itis worthwhile to note that the ROC value for the 50_IBM data is not very reliable due tothe small dataset size (and low turnover rate), so the F1 score was used in its place. Theresults presented in Fig. 1 illustrate that no algorithm could consistently outperform theothers for small datasets. It is believed it is due to high variance in small datasets, whichwill be described in further detail shortly.
Table 3. Best performance classifiers on small datasets
Dataset ACC PRC RCL F1 ROC
50_Bank DT SVM DT DT RF50_IBM NN NN NN NN –
100_Bank DT XGB GBT XGB XGB100_IBM LR SVM NB NB LR
Employee Turnover Prediction with Machine Learning 747

For the highest ROC values across small-dataset experiments, random forestsachieved 0.9625 for the 50_Bank dataset, extreme gradient boosting reached 0.8673 onthe 100_Bank dataset and logistic regression accomplished 0.9299 on the 100_IBMdataset. For the 50_IBM dataset, the ROC value is not available due to the small datasetsize, but it was found that neural networks score the highest for all other evaluationmetrics (ACC, PRC, RCL and F1).
5.2 Results for Medium HR Datasets
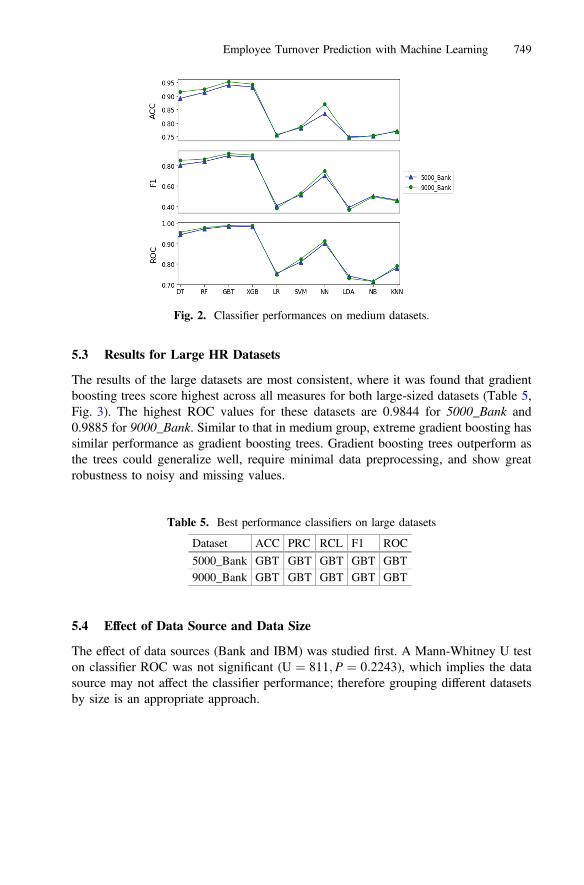
The results for medium-sized datasets indicate that gradient boosting trees generallyrank the highest, as shown in Table 4 and Fig. 2. The highest ROC values for the500_Bank, 500_IBM, 1000_Bank and 1500_IBM datasets were 0.9486, 0.7780,0.9634, and 0.8434, respectively.
Neural networks appeared to rank the second highest, behind gradient boosting trees,as they gained the highest ROC value at 0.778 for the 500_IBM dataset, as well as thesecond highest ROC classifier on the 1500_IBM dataset, at 0.840. On the 1500_IBMdataset, neural networks were found to have very similar ROCvalues as gradient boostingtrees (0.840 and 0.843, respectively) and better results for all othermetrics. As a result, it isreasonable to state that for the 500_Bank and 1000_Bank datasets, gradient boosting treesare the top performers,whereas for the 500_IBM and 1500_IBM datasets, neural networksperformed the best. Gradient boosting trees and neural networks have great ability to fitcomplex data, which explains their decent performance on medium datasets.
Fig. 1. Classifier performances on small datasets.
Table 4. Best performance classifiers on medium datasets
Dataset ACC PRC RCL F1 ROC
500_Bank XGB RF XGB XGB GBT500_IBM NN LDA NN NN NN1000_Bank XGB RF XGB XGB XGB1500_IBM LR LDA NN NN GBT
748 Y. Zhao et al.
5.3 Results for Large HR Datasets
The results of the large datasets are most consistent, where it was found that gradientboosting trees score highest across all measures for both large-sized datasets (Table 5,Fig. 3). The highest ROC values for these datasets are 0.9844 for 5000_Bank and0.9885 for 9000_Bank. Similar to that in medium group, extreme gradient boosting hassimilar performance as gradient boosting trees. Gradient boosting trees outperform asthe trees could generalize well, require minimal data preprocessing, and show greatrobustness to noisy and missing values.
5.4 Effect of Data Source and Data Size
The effect of data sources (Bank and IBM) was studied first. A Mann-Whitney U teston classifier ROC was not significant (U ¼ 811;P ¼ 0:2243), which implies the datasource may not affect the classifier performance; therefore grouping different datasetsby size is an appropriate approach.
Fig. 2. Classifier performances on medium datasets.
Table 5. Best performance classifiers on large datasets
Dataset ACC PRC RCL F1 ROC
5000_Bank GBT GBT GBT GBT GBT9000_Bank GBT GBT GBT GBT GBT
Employee Turnover Prediction with Machine Learning 749
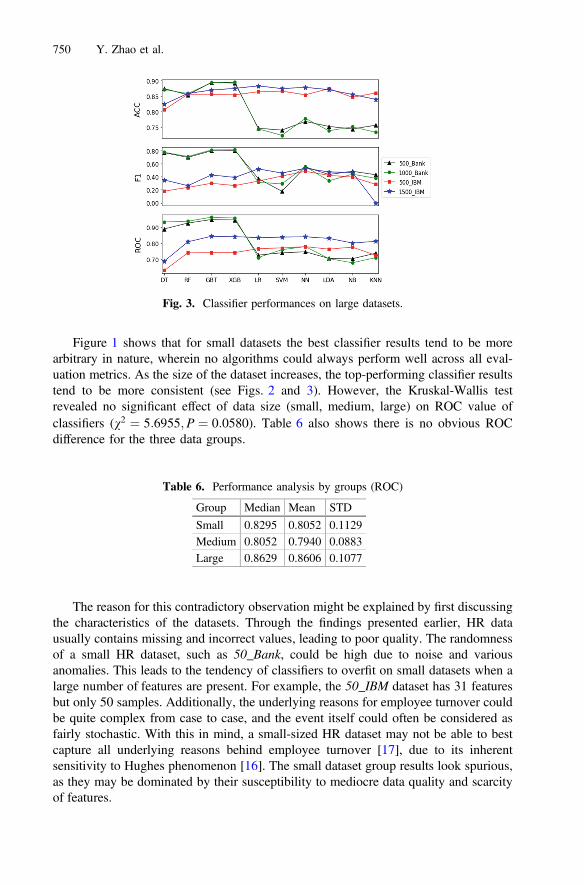
Figure 1 shows that for small datasets the best classifier results tend to be morearbitrary in nature, wherein no algorithms could always perform well across all eval-uation metrics. As the size of the dataset increases, the top-performing classifier resultstend to be more consistent (see Figs. 2 and 3). However, the Kruskal-Wallis testrevealed no significant effect of data size (small, medium, large) on ROC value ofclassifiers (v2 ¼ 5:6955;P ¼ 0:0580). Table 6 also shows there is no obvious ROCdifference for the three data groups.
The reason for this contradictory observation might be explained by first discussingthe characteristics of the datasets. Through the findings presented earlier, HR datausually contains missing and incorrect values, leading to poor quality. The randomnessof a small HR dataset, such as 50_Bank, could be high due to noise and variousanomalies. This leads to the tendency of classifiers to overfit on small datasets when alarge number of features are present. For example, the 50_IBM dataset has 31 featuresbut only 50 samples. Additionally, the underlying reasons for employee turnover couldbe quite complex from case to case, and the event itself could often be considered asfairly stochastic. With this in mind, a small-sized HR dataset may not be able to bestcapture all underlying reasons behind employee turnover [17], due to its inherentsensitivity to Hughes phenomenon [16]. The small dataset group results look spurious,as they may be dominated by their susceptibility to mediocre data quality and scarcityof features.
Table 6. Performance analysis by groups (ROC)
Group Median Mean STD
Small 0.8295 0.8052 0.1129Medium 0.8052 0.7940 0.0883Large 0.8629 0.8606 0.1077
Fig. 3. Classifier performances on large datasets.
750 Y. Zhao et al.

To confirm the assumption above, uncertainty analysis was conducted to under-stand the characteristics of the datasets. The MIC introduced in (3) could quantify thecorrelation between two random variables. Table 7 summarizes the MIC among fea-tures and turnover results in pairwise manner on all datasets. The results indicate thatfeatures in small datasets generally have a higher correlation with the turnover results.In 50_Bank, the most influential feature, last pay raise, has a large MIC at 0.8556,which almost dominates the classification result. In 100_IBM data, the highest MICfeature is employee ID, which should be removed in most of the scenarios usingcommon sense. To further investigate the cause, the classification rules on the 50_Bankdataset were visualized using a decision tree (see Fig. 4). It only uses one feature, lastpay raise, in its prediction, testing whether an individual has received a pay raise in thelast 66 days. This observation confirms the finding using MIC. Even with this singlefeature and simple classification rule, the model achieves a ROC value of 0.944 and anaccuracy of 0.938, and only 2 to 3 employees out of the 50 total are misclassified.Nevertheless, the promising results of small-sized datasets do not guarantee the algo-rithms are working correctly—it could be due to poor data quality that few featuresaccidently dominate the prediction. This suggests that it is well worth the effort tofurther investigate the data itself [17]. The classification visualization was repeated formedium- and large-sized datasets, and the results are more reliable than that of small-sized datasets. More features are involved, and the classification rule is more complex.This explains the randomness of best classifiers on small datasets, and more consistentperformances on medium and large datasets.
Table 7. Mic on all datasets (bank and IBM)
Dataset Group Mean STD Max Max feature
50_Bank Small 0.1834 0.2058 0.8555 Pay raise100_Bank Small 0.1150 0.1237 0.5355 Pay raise500_Bank Med 0.0945 0.1328 0.5726 Pay raise1000_Bank Med 0.0785 0.1295 0.5665 Pay raise5000_Bank Large 0.0753 0.1434 0.6250 Pay raise9000_Bank Large 0.0750 0.1463 0.6322 Pay raise50_IBM Small 0.1284 0.1042 0.3844 Pay/month100_IBM Small 0.0876 0.0760 0.2460 Personal ID500_IBM Med 0.0471 0.0486 0.1733 Pay/month1500_IBM Med 0.0323 0.0352 0.1389 Pay/month
Fig. 4. Decision tree visualization on 50_Bank.
Employee Turnover Prediction with Machine Learning 751
5.5 Classifier Performance Analysis
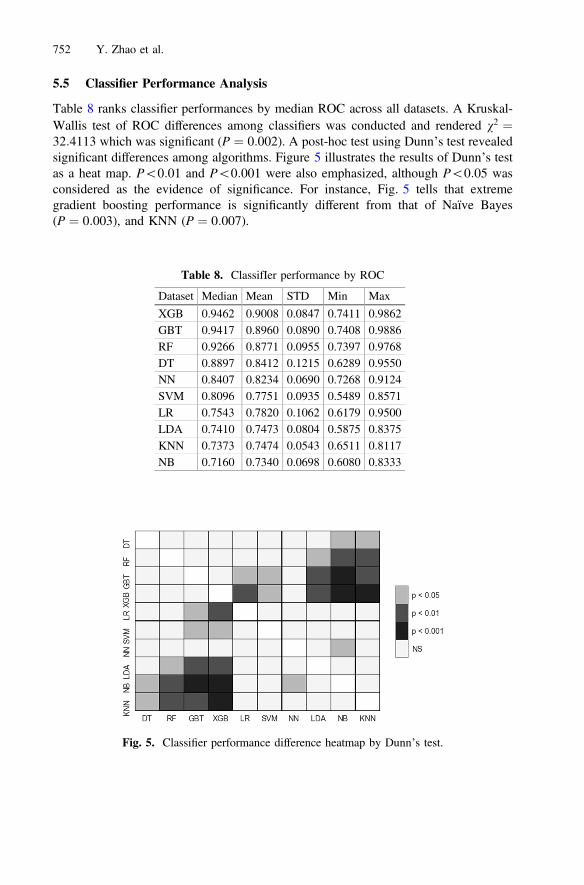
Table 8 ranks classifier performances by median ROC across all datasets. A Kruskal-Wallis test of ROC differences among classifiers was conducted and rendered v2 ¼32:4113 which was significant (P ¼ 0:002). A post-hoc test using Dunn’s test revealedsignificant differences among algorithms. Figure 5 illustrates the results of Dunn’s testas a heat map. P\0:01 and P\0:001 were also emphasized, although P\0:05 wasconsidered as the evidence of significance. For instance, Fig. 5 tells that extremegradient boosting performance is significantly different from that of Naïve Bayes(P ¼ 0:003), and KNN (P ¼ 0:007).
Table 8. ClassifIer performance by ROC
Dataset Median Mean STD Min Max
XGB 0.9462 0.9008 0.0847 0.7411 0.9862GBT 0.9417 0.8960 0.0890 0.7408 0.9886RF 0.9266 0.8771 0.0955 0.7397 0.9768DT 0.8897 0.8412 0.1215 0.6289 0.9550NN 0.8407 0.8234 0.0690 0.7268 0.9124SVM 0.8096 0.7751 0.0935 0.5489 0.8571LR 0.7543 0.7820 0.1062 0.6179 0.9500LDA 0.7410 0.7473 0.0804 0.5875 0.8375KNN 0.7373 0.7474 0.0543 0.6511 0.8117NB 0.7160 0.7340 0.0698 0.6080 0.8333
Fig. 5. Classifier performance difference heatmap by Dunn’s test.
752 Y. Zhao et al.

In this research, tree-based classifiers (XGB, GBT, RF, DT) worked well in general,and were found to be the top four best performing classifiers. Extreme gradient boostinghad the best overall performance, and gradient boosting trees ranked second and per-formed best for the bank datasets. Neural networks ranked behind tree-based methods asthe fifth, performing better for the IBM datasets. These methods were found to be mostrobust and they could handle the HR datasets which contained noise, missing values andwere imbalanced. Focusing on tree-based methods, another Kruskal-Wallis test showedno significant difference among them (v2 ¼ 2:6116; P ¼ 0:4555). Notably, decision treehad the highest standard deviation, which implies low stability, although it ranked thefourth highest of all (Table 8). In contrast, ensemble approaches (XGB, GBT and RF)mitigate decision trees’ instability with lower variance and possibly lower bias as well toimprove predictive ability [17, 34, 44]. Although the execution time is not measured inthis study, XGB has been reported to run faster than GBT [26]. For neural networks,multilayer settings with nonlinear activation functions seem to provide the greatestpotential in handling complex data structures prevalent in larger datasets. With limiteddata and moderate preprocessing, the performance of neural networks is reasonable andshows the most potential for improvement.
It is also noted that there is an apparent performance gap between the best-performing classifier and some weaker-performing algorithms including K-nearestneighbors, LDA, naïve Bayes, support vector machine and logistic regression.Although this is typical because these methods require more involved data prepro-cessing to handle spurious datasets, it is hard to pinpoint the specific causes for each ofthese poor-performing classifiers. Some potential explanations include that the algo-rithm (1) depends on data conversions from categorical to numerical types, which tendsto introduce bias into the data; (2) is sensitive to the data magnitude and require datascaling (e.g. normalization) to operate efficiently; (3) is not robust in handling noisydatasets; (4) does not have strong predictive ability to handle complex problem (e.g.imbalanced data); and (5) lacks the stability required to handle small perturbations inthe input data (see the work by Bousquet and Elisseeff [27]). Refer to a detailed studyon classifier performance by Kotsiantis [29] for further reading.
Datatype conversion and data scaling tend to be an integral component to specificalgorithms. An investigation into the effects of data scaling on the performance of KNNwas performed. Table 9 illustrates that data scaling improves the performance of KNN,and similar results are suspected for the aforementioned supervised machine learningalgorithms. For KNN on 1000_Bank, standardization improves ACC by 5.47%, PRCby 45% and ROC by 13.26%; normalization improves RCL by 90.13% and F1 by72.48%. It is noteworthy that tree-based methods are not affected by data scaling andconversion, which gives rise to more stable performance.
Table 9. Scaling effects on KNN (1000_Bank)
Scaling method ACC PRC RCL F1 ROC
Raw data 0.6952 0.4012 0.1522 0.2182 0.6262Normalized 0.7300 0.5472 0.2891 0.3762 0.6667Standardized 0.7333 0.5801 0.2057 0.3000 0.7095
Employee Turnover Prediction with Machine Learning 753
5.6 Model Interpretability
Machine learning models are often referred to as black boxes due to their limitedinterpretability. In employee turnover prediction, improving the machine learningmodel’s interpretability is critical for the end-user to make data-driven decisions thatare impactful. In an effort to make the machine learning models studied in this researcheasier to understand, two data mining techniques are introduced: feature importanceranking and classification rule extraction and visualization.
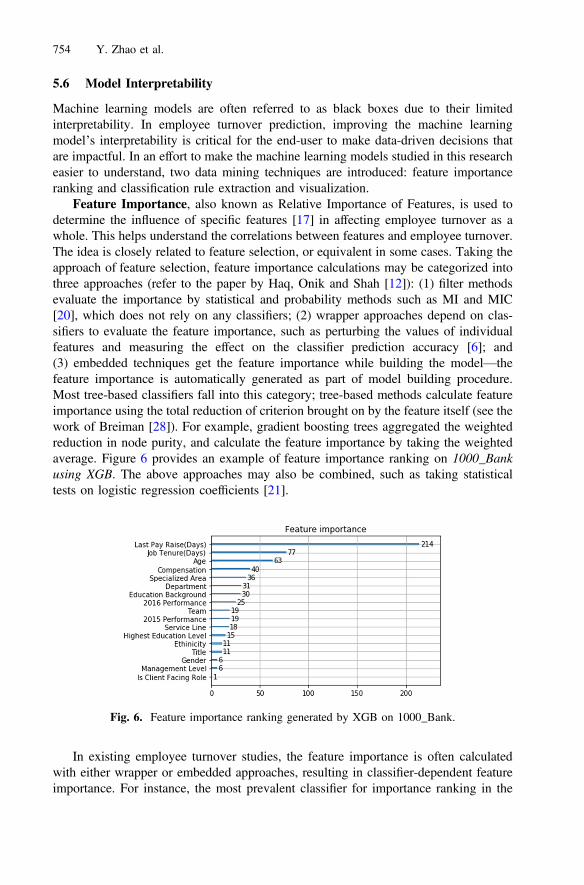
Feature Importance, also known as Relative Importance of Features, is used todetermine the influence of specific features [17] in affecting employee turnover as awhole. This helps understand the correlations between features and employee turnover.The idea is closely related to feature selection, or equivalent in some cases. Taking theapproach of feature selection, feature importance calculations may be categorized intothree approaches (refer to the paper by Haq, Onik and Shah [12]): (1) filter methodsevaluate the importance by statistical and probability methods such as MI and MIC[20], which does not rely on any classifiers; (2) wrapper approaches depend on clas-sifiers to evaluate the feature importance, such as perturbing the values of individualfeatures and measuring the effect on the classifier prediction accuracy [6]; and(3) embedded techniques get the feature importance while building the model—thefeature importance is automatically generated as part of model building procedure.Most tree-based classifiers fall into this category; tree-based methods calculate featureimportance using the total reduction of criterion brought on by the feature itself (see thework of Breiman [28]). For example, gradient boosting trees aggregated the weightedreduction in node purity, and calculate the feature importance by taking the weightedaverage. Figure 6 provides an example of feature importance ranking on 1000_Bankusing XGB. The above approaches may also be combined, such as taking statisticaltests on logistic regression coefficients [21].
In existing employee turnover studies, the feature importance is often calculatedwith either wrapper or embedded approaches, resulting in classifier-dependent featureimportance. For instance, the most prevalent classifier for importance ranking in the
Fig. 6. Feature importance ranking generated by XGB on 1000_Bank.
754 Y. Zhao et al.
works discussed above [1, 35] is decision tree. However, it is not the best classifier inall experiments, implying that the feature importance by decision tree could be lessreliable compared with better performing classifiers. Taking 1000_Bank dataset as anexample, three most important features generated by ensemble methods (GBT, XGB,RF) are the same: last pay raise, job tenure and age. In comparison, decision tree gavedifferent results: last pay raise, performance rating and job tenure, which appeared to beless dependable.
An empirical set of guidelines to achieve reliable feature importance is provided.First of all, feature importance should be calculated after identifying the best per-forming classifier. Ensemble tree-based method results are generally sound [34]. If thechosen classifier does not support embedded feature selection, the wrapper approachcould be executed by observing classifier change by perturbing features included.Alternatively, probability or information theory methods like MIC could be used to getthe feature importance without classifier dependency. Partial dependence analysiscould also help understand the interactive effect of multiple features [34].
Classifier Rule Visualization and Extraction is a method to convert machinelearning models into easy-to-understand, interpretable figures or sets of rules. Besidesthe feature
importance visualization shown in Fig. 6, classifier visualization provides a moredirect way to present the prediction rule. Decision tree models support the creation ofclassifier visualizations rather naturally. Figure 4 shows a decision tree example on50_Bank to generate sequences of logical if statements. As ensemble tree-basedmethods are hard to visualize [44], visualization on a single tree is picked as thecompromise. However, instability of decision tree implies a small change in data couldaffect the tree split order significantly, resulting in a different tree structures andtherefore different rules [34, 44]. As a result, decision tree visualization should be donecautiously; one should always confirm the model performance is decent first and utilizeit for illustrative purpose only after. Alternatively, one can pick individual trees in XGBto visualize the decision process [39].
5.7 A Reliable Approach
Through the discussions noted above, some empirical guidelines are provided forapproaching the employee turnover prediction problem. As noted, small HR datasetsmay contain high variance and randomness. This would suggest that more time shouldbe spent on data quality assessments [17] and data augmentation in this case. For smalldatasets, the choice of classifiers should be selected using a heuristic approach.
For medium and large HR datasets, the data variance decreases and a more reliablemodel may be built. Best practice would be using tree-based ensemble methods such asextreme gradient boosting and gradient boosted trees. Extreme gradient boosting ispreferred due to its superior predictive power and speed. This approach requires theleast data preparation—it does not need data scaling and type conversions—and islikely to result in decent, if not the best, performance.
Lastly, to improve the model interpretability, feature ranking importance andclassification rule visualization and extraction methods are recommended with cautionfor employee turnover prediction. Although feature importance ranking could be
Employee Turnover Prediction with Machine Learning 755
straightforwardly acquired through tree-based models, a more robust approach isprovided in this research (see Sect. 4).
6 Concluding Remarks
Employee turnover has been identified as a pivotal factor to curb the growth oforganizations. In this research, the performance of ten supervised machine learningmethods was evaluated on various HR datasets. In addition to statistical analysis, anumber of data mining techniques were introduced and used in this study, includingdata scaling, parameter searching and cross validation. To enhance the interpretabilityof employee turnover model, the examples of feature importance ranking and classifiervisualization, and suggestions on how to use them appropriately, were also provided inSect. 4.
The numerical experiment results indicate that for small HR datasets, the key is totry different algorithms as Hughes phenomenon may result in overoptimistic results. Ifthere are more HR datasets available, extreme gradient boosting is recommended to useas the most reliable algorithm. It requires minimal data preprocessing, has decentpredictive power, and ranks the feature importance automatically and reliably. How-ever, due to the complexity of employee turnover prediction, one should try to find theclassifier that best fits the underlying data before taking this approach.
6.1 Original Contribution
A reliable approach for employee turnover prediction using machine learning is pro-vided in this research. The use of data sampling methods enables the evaluation of howorganization size affects the effectiveness of supervised machine learning models.Additionally, a series of information theory and statistical measures are used to analyzethe results. This approach is the first of its kind, to the authors’ best knowledge, inemployee turnover prediction. Existing works in this field usually focus on one datasetwith a single evaluation approach, making the generalization of their findings ratherlimited.
6.2 Recommendations for Future Research
Although data sampling is an efficient way to augment the data, it may still be non-representative of real-world. Further studies are necessary to determine if the conclu-sion holds. It is also recommended to extend this research to include more baselinemodels with a focus on feature engineering, i.e. using different data encoding andscaling methods.
References
1. Alao, D., Adeyemo, A.B.: Analyzing employee attrition using decision tree algorithms.Comput. Inf. Syst. Dev. Inform. Allied Res. J. 4 (2013)
756 Y. Zhao et al.

2. Al-Radaideh, Q.A., Al Nagi, E.: Using data mining techniques to build a classification modelfor predicting employees performance. Int. J. Adv. Comput. Sci. Appl. 3, 144–151 (2012)
3. Chang, H.Y.: Employee turnover: a novel prediction solution with effective feature selection.WSEAS Trans. Inf. Sci. Appl. 6, 417–426 (2009)
4. Chien, C.F., Chen, L.F.: Data mining to improve personnel selection and enhance humancapital: a case study in high-technology industry. Expert Syst. Appl. 34, 280–290 (2008)
5. Li, Y.M., Lai, C.Y., Kao, C.P.: Building a qualitative recruitment system via SVM withMCDM approach. Appl. Intell. 35, 75–88 (2011)
6. Nagadevara, V., Srinivasan, V., Valk, R.: Establishing a link between employee turnoverand withdrawal behaviours: application of data mining techniques. Res. Pract. Hum. Resour.Manag. 16, 81–97 (2008)
7. Quinn, A., Rycraft, J.R., Schoech, D.: Building a model to predict caseworker andsupervisor turnover using a neural network and logistic regression. J. Technol. Hum. Serv.19, 65–85 (2002)
8. Sexton, R.S., McMurtrey, S., Michalopoulos, J.O., Smith, A.M.: Employee turnover: aneural network solution. Comput. Oper. Res. 32, 2635–2651 (2005)
9. Suceendran, K., Saravanan, R., Divya Ananthram, D.S., Kumar, R.K., Sarukesi, K.:Applying classifier algorithms to organizational memory to build an attrition predictor model
10. Tzeng, H.M., Hsieh, J.G., Lin, Y.L.: Predicting nurses’ intention to quit with a supportvector machine: a new approach to set up an early warning mechanism in human resourcemanagement. CIN: Comput. Inf. Nurs. 22, 232–242 (2004)
11. Valle, M.A., Varas, S., Ruz, G.A.: Job performance prediction in a call center using a naiveBayes classifier. Expert Syst. Appl. 39, 9939–9945 (2012)
12. Haq, N.F., Onik, A.R., Shah, F.M.: An ensemble framework of anomaly detection usinghybridized feature selection approach (HFSA). In: SAI Intelligent Systems Conference(IntelliSys), pp. 989–995, IEEE (2015)
13. Punnoose, R., Ajit, P.: Prediction of employee turnover in organizations using machinelearning algorithms. Int. J. Adv. Res. Artif. Intell. 5, 22–26 (2016)
14. Sikaroudi, E., Mohammad, A., Ghousi, R., Sikaroudi, A.: A data mining approach toemployee turnover prediction (case study: Arak automotive parts manufacturing). J. Ind.Syst. Eng. 8, 106–121 (2015)
15. McKinley Stacker, I.V.: IBM waston analytics. Sample data: HR employee attrition andperformance [Data file]. Retrieved from https://www.ibm.com/communities/analytics/watson-analytics-blog/hr-employee-attrition/ (2015)
16. Shahshahani, B.M., Landgrebe, D.A.: The effect of unlabeled samples in reducing the smallsample size problem and mitigating the Hughes phenomenon. IEEE Trans. Geosci. RemoteSens. 32, 1087–1095 (1994)
17. Géron, A.: Hands-on machine learning with Scikit-Learn and TensorFlow: concepts, tools,and techniques to build intelligent systems. O’Reilly Media (2017)
18. Pedregosa, F., Varoquaux, G., Gramfort, A., Michel, V., Thirion, B., Grisel, O., Blondel, M.,Prettenhofer, P., Weiss, R., Dubourg, V., Vanderplas, J.: Scikit-learn: machine learning inPython. J. Mach. Learn. Res. 12, 2825–2830 (2011)
19. Fisher, R.A.: The use of multiple measurements in taxonomic problems. Ann. Hum. Genet.7, 179–188 (1936)
20. Murphy, K.P.: Machine learning: a probabilistic perspective. MIT press, Cambridge (2012)21. Seddik, A.F., Shawky, D.M.: Logistic regression model for breast cancer automatic
diagnosis. In: SAI Intelligent Systems Conference (IntelliSys), IEEE, pp. 150–154 (2015)22. Bakry, U., Ayeldeen, H., Ayeldeen, G., Shaker, O.: Classification of Liver Fibrosis patients
by multi-dimensional analysis and SVM classifier: an Egyptian case study. In: Proceedingsof SAI Intelligent Systems Conference, pp. 1085–1095. Springer, Cham (2016)
Employee Turnover Prediction with Machine Learning 757
23. Mathias, H.D., Ragusa, V.R.: Micro aerial vehicle path planning and flight with a multi-objective genetic algorithm. In Proceedings of SAI Intelligent Systems Conference, pp. 107–124. Springer, Cham (2016)
24. Ye, Q., Zhang, Z., Law, R.: Sentiment classification of online reviews to travel destinationsby supervised machine learning approaches. Expert Syst. Appl. 36, 6527–6535 (2009)
25. Durant, K.T., Smith, M.D.: Predicting the political sentiment of web log posts usingsupervised machine learning techniques coupled with feature selection. In: InternationalWorkshop on Knowledge Discovery on the Web, pp. 187–206. Springer, Berlin, Heidelberg(2006)
26. Chen, T., Guestrin, C.: Xgboost: A scalable tree boosting system. In: Proceedings of the22nd acm sigkdd international conference on knowledge discovery and data mining,pp. 785–794, ACM (2016)
27. Bousquet, O., Elisseeff, A.: Stability and generalization. J. Mach. Learn. Res. 2, 499–526(2002)
28. Breiman, L.: Random forests. Mach. Learn. 45, 5–32 (2001)29. Kotsiantis, S.B.: Supervised machine learning: a review of classification techniques.
Informatica 31, 249–268 (2007)30. Friedman, J.H.: Greedy function approximation: a gradient boosting machine. Ann. Stat.
1189–1232 (2001)31. Morgan, J.N., Sonquist, J.A.: Problems in the analysis of survey data, and a proposal. J. Am.
Stat. Assoc. 58, 415–434 (1963)32. Muller, K.R., Mika, S., Ratsch, G., Tsuda, K., Scholkopf, B.: An introduction to kernel-
based learning algorithms. IEEE. T. Neural. Networ. 12, 181–201 (2001)33. Zhang, H.: The optimality of naive Bayes. AA, 1, 334. Friedman, J., Hastie, T., Tibshirani, R.: The elements of statistical learning. Springer, New
York (2001)35. Jantan, H., Hamdan, A.R., Othman, Z.A.: Human talent prediction in HRM using C4.
5 classification algorithm. Int. J. Comput. Sci. Eng. 2, 2526–2534 (2010)36. Cortes, C., Vapnik, V.: Support-vector networks. Mach. Learn. 20, 273–297 (1995)37. Cox, D.R.: The regression analysis of binary sequences. J. Roy. Stat. Soc. B. Met., 215–242
(1958)38. Hong, W.C., Pai, P.F., Huang, Y.Y., Yang, S.L.: Application of support vector machines in
predicting employee turnover based on job performance. Adv. Nat. Comput., 419 (2005)39. DMLC: Introduction to boosted trees. Retrieved from http://xgboost.readthedocs.io/en/latest/
model.html (2015)40. Somers, M.J.: Application of two neural network paradigms to the study of voluntary
employee turnover. J. Appl. Psychol. 84, 177 (1999)41. McKnight, P.E., Najab, J.: Mann Whitney U Test. In: Corsini Encyclopedia of Psychology
(2010)42. Dos Santos, E.M., Oliveira, L.S., Sabourin, R., Maupin, P.: Overfitting in the selection of
classifier ensembles: a comparative study between pso and ga. In: Proceedings of the 10thAnnual Conference on Genetic and Evolutionary Computation, ACM, pp. 1423–1424(2008)
43. Raschka, S.: Python Machine Learning. Packt Publishing Ltd, Birmingham (2015)44. Efron, B.S., Hastie, T.: Computer Age Statistical Inference. Cambridge University Press,
Cambridge (2016)
758 Y. Zhao et al.