employee self-service technology acceptance: a case study ... · pdf fileemployee self-service...
TRANSCRIPT

Employee Self-Service Technology Acceptance: A Case Study at
TAP Portugal
Emilia Snicker
Dissertação de Mestrado
Orientador na FEUP: Prof. Jorge Freire de Sousa Orientador na TAP Portugal: Dr. Victor Vale
Faculdade de Engenharia da Universidade do Porto
2013-09-23

Employee Self-Service Technology Acceptance: A Case Study
ii

Employee Self-Service Technology Acceptance: A Case Study
iii
Abstract
Implementation of employee self-service (ESS) technology presents a variety of challenges to organizations. Employees’ underutilization of new information system challenges organizations’ efforts to gain benefits from such systems. Although ESS technology offers important benefits for the organization as a whole, organizations may not be able to overcome the resistance of individuals who do not perceive those benefits as being particularly beneficial to themselves. Using a research framework based on Technology Acceptance Model 2 (TAM2) and Theory of Planned Behavior (TPB), this study examines factors that enhance user acceptance in the pre-implementation phase of an ESS project.
An online questionnaire was sent to 150 mid-level manages of TAP Portugal in order to find out their perceptions about the new ESS portal that will be implemented, how much they plan to use it, and which are the variables that affect those perceptions and usage intentions. The questionnaire comprised 40 questions and included variables such as organizational support, management pressure, job relevance, perceived usefulness and ease of use of the new ESS portal. All the measures used have been validated in previous studies. Based on the results of the questionnaire, the statistical significances of the constructed hypotheses were tested using SPSS program.
The results suggest, that overall, the TAM2 fits the ESS context fairly well. TAM2 was able to explain 38% of the variance in usage intentions. Perceived ease of use was the strongest determinant of the usage intention, followed by perceived usefulness. Regarding perceived usefulness, TAM2 was able to explain 52% of its variance. Subjective norm and job relevance proved to be the strongest determinants of perceived usefulness. The results suggest that in addition to the technology itself, organizational factors also play an important role in employee acceptance of new information technologies. Of the supplementary variables that were added to the TAM2 model in this study, perceived resources and perceived organizational support proved to be strong determinants of the intention to use the ESS system.

Employee Self-Service Technology Acceptance: A Case Study
iv

Employee Self-Service Technology Acceptance: A Case Study
v
Table of Contents
1 INTRODUCTION ....................................................................................................................................... 1 1.1 COMPANY PRESENTATION .................................................................................................................................... 1 1.2 PROJECT “PORTAL DO TRABALHADOR” .............................................................................................................. 2 1.3 METHODOLOGY ....................................................................................................................................................... 3 1.4 COMPARATIVE ANALYSIS OF EXISTING APPROACHES AND THEIR ADVANTAGES AND DISADVANTAGES .................................................................................................................................................... 3 1.5 THE STRUCTURE OF THE STUDY .......................................................................................................................... 4
2 THEORY AND PREVIOUS STUDIES ..................................................................................................... 5 2.1 TECHNOLOGY ACCEPTANCE MODEL ................................................................................................................... 5 2.2 TECHNOLOGY ACCEPTANCE MODEL 2 ................................................................................................................ 6 2.3 CRITICISM AND FURTHER EXTENSIONS OF TAM ............................................................................................. 8 2.4 TAM AND EMPLOYEE SELF-‐SERVICE SYSTEMS ................................................................................................ 8 2.5 THEORY OF PLANNED BEHAVIOR ........................................................................................................................ 9 2.6 THEORY FRAMEWORK USED IN THIS STUDY ................................................................................................. 11
3 E-‐HRM AND THE EMPLOYEE SELF-‐SERVICE SYSTEMS ............................................................. 13 3.1 E-‐HRM .................................................................................................................................................................. 13 Types of e-‐HRM ............................................................................................................................................................. 13 E-‐HRM and Technology ............................................................................................................................................. 14 Benefits and Challenges of e-‐HRM ........................................................................................................................ 15
3.2 EMPLOYEE SELF-‐SERVICE SYSTEMS ................................................................................................................ 16 3.3 PROJECT “PORTAL DO TRABALHADOR” ........................................................................................................... 17 Objectives ......................................................................................................................................................................... 18 Scope of the Project ..................................................................................................................................................... 18 Technological Infrastructure .................................................................................................................................. 19 Project Duration and Teams ................................................................................................................................... 19 Budget ............................................................................................................................................................................... 20
4 HYPOTHESES CONSTRUCTION ......................................................................................................... 21 4.1 SOCIAL INFLUENCE PROCESS ............................................................................................................................. 21 Subjective Norm ........................................................................................................................................................... 21 Voluntariness ................................................................................................................................................................. 21 Image ................................................................................................................................................................................. 22
4.2 COGNITIVE INSTRUMENTAL PROCESS .............................................................................................................. 23 Job Relevance ................................................................................................................................................................. 23 Output Quality ............................................................................................................................................................... 23 Result Demonstrability .............................................................................................................................................. 24 Perceived Ease of Use ................................................................................................................................................. 24 Perceived Usefulness ................................................................................................................................................... 25
4.3 ADDITIONAL VARIABLES .................................................................................................................................... 25 Managerial Pressure .................................................................................................................................................. 25 Perceived Organizational Support ....................................................................................................................... 26 Perceived Resources .................................................................................................................................................... 26
4.4 STUDY METHOD ................................................................................................................................................... 27 Sample and Procedures ............................................................................................................................................. 27 Validity and Reliability .............................................................................................................................................. 28 Statistical Methods Used ........................................................................................................................................... 28 Measures .......................................................................................................................................................................... 29

Employee Self-Service Technology Acceptance: A Case Study
vi
5 RESULTS .................................................................................................................................................. 33 5.1 EXPLAINING INTENTION AND USAGE ............................................................................................................... 34 5.2 EXPLAINING PERCEIVED USEFULNESS ............................................................................................................. 36 5.3 ADDITIONAL HYPOTHESIS TESTING ................................................................................................................. 39 5.4 LIMITATIONS ......................................................................................................................................................... 40
6 CONCLUSIONS AND FUTURE STUDIES ........................................................................................... 41 REFERENCES .................................................................................................................................................. 45 APPENDIX 1: THE QUESTIONNAIRE ...................................................................................................... 51 APPENDIX 2: “PORTAL DO TRABALHADOR” PROJECT DETAILS ................................................. 57 APPENDIX 3: STATISTICAL DETAILS .................................................................................................... 60
Employee Self-Service Technology Acceptance: A Case Study
vii
Figure 1 - TAP Shareholder Structure (TAP Annual Report, 2012). ................................................. 2 Figure 2 - Original Technology Acceptance Model (Davis et al., 1989). ......................................... 6 Figure 3 - Technology Acceptance Model 2 (Venkatesh et al., 2000). .............................................. 7 Figure 4 - Theory of Planned Behavior (Ajzen, 1991). ........................................................................... 9 Figure 5 - Framework of the Study. ............................................................................................................. 11 Figure 6 - Recent Projects in TAP HR. ...................................................................................................... 17 Figure 7 - Prototype of the ESS Homepage. ............................................................................................. 18 Figure 8 - Pearson Correlation Values. ....................................................................................................... 34 Figure 9 - Variables Explaining Intention to Use and Their Correlations. ..................................... 34 Figure 10 - Explaining Intention to Use According to TAM2. ........................................................... 35 Figure 11 - Variables Explaining Perceived Usefulness and Their Correlations. ........................ 37 Figure 12 - Explaining Perceived Usefulness According to TAM2. ................................................ 38

Employee Self-Service Technology Acceptance: A Case Study
viii
Table 1 - Previous Studies and Their Key Findings. .............................................................................. 10 Table 2 - One Classification of the HRIS in Use (Florkowski et al., 2006). .................................. 14 Table 3 - Project Team Megasis. .................................................................................................................. 20 Table 4 - Project Team TAP. ......................................................................................................................... 20 Table 5 - Budget of the Project. .................................................................................................................... 20 Table 6 - Descriptives. ...................................................................................................................................... 33 Table 7 - Results of the Regression Analysis, Intention to Use. ........................................................ 35 Table 8 - Results of the Regression Analysis, Perceived Usefulness. .............................................. 37
Employee Self-Service Technology Acceptance: A Case Study
1
1 Introduction
The Internet has radically affected the human resources management (HRM). By using web-based technologies, the HR function is now able to hand over much of its data management and transaction processing responsibilities to employees and managers. Employee self-service (ESS) is one of the fastest developing trends in the domain of human resources information systems (HRIS). It’s announced as a revolutionary HR innovation (The Hunter Group, 2001), and it’s expected to transform the way HR departments deliver their services (Zampetti & Adamson, 2001). That can be done by removing or reducing the role of HR in the middle, eliminating the duplication of data entry and tracking of paper forms (Snell, Stueber & Lepak, 2002). With this technology, the employees can for example update their personal information, check their pay slip and justify periods of absenteeism, among other things. Shifting those duties to individual employees allows the organization to reduce the amount of special resources devoted to these activities and allows HR to focus on more strategic functions.
Even though organizations often invest a lot of resources into new IS systems, it is still common for these projects to have major problems or to fail completely. In order to make the implementation a new IS system, such as ESS, to increase the efficiency of an organization, it’s crucial that the end users accept it and actually use it (Venkatesh, Morris, Davis & Davis, 2003). Implementing a new system doesn’t automatically bring any benefits to the organization, but it’s the level of usage that matters (Devaraj & Kohli, 2003). Especially in the case of ESS, where the usage is typically not mandatory, an unaccepted system will seldom be used by personnel.
This dissertation studies the ESS technology implementation process in the HR function of TAP Portugal. It examines ways in which the users’ perceived outcomes of the new system, management and the organizational environment may facilitate individual acceptance and use of ESS technology. The dissertation is limited to study the phenomena of user acceptance from the end user point of view – all the aspects of the technology itself and the implementation process are excluded. The study focuses on the pre-implementation stage and the theory is based on Technology Acceptance Model 2 (TAM2) (Venkatesh & Davis, 2000) and Theory of Planned Behavior (TPB) (Ajzen, 1991). The theoretical key contributions of the dissertation are that the chosen theories are applied to a highly relevant, yet under-researched management innovation of ESS, and that the TAM2 model is extended to examine the effect of organizational factors on technology acceptance and not just the features of the system itself. The organization receives important information of its employees’ attitudes and usage intentions towards the new system, and the factors that affect them.
1.1 Company Presentation
TAP Portugal, commonly known as TAP, is the national airline of Portugal that was founded in 1945 as Transportes Aéreos Portugueses, SGPS, S.A. It operates from its base in Lisbon and from Porto airport, its second operational hub. In the development of its network, the company pursues a niche strategy, connecting Europe to a growing number of destinations in Africa and North-, Central- and South America. In the latter, TAP is the leading European air carrier flying to Brazil (TAP Annual Report, 2012).

Employee Self-Service Technology Acceptance: A Case Study
2
Currently TAP Portugal, together with its partners, offers its passengers and cargo customers access to 215 cities, of which 120 are located in Europe, 61 in the Americas, 19 in Africa, 9 in Portugal and 6 in the Middle East/Asia. The acquisition of the company Portugália, which took place in 2007, has enabled TAP to attract regional traffic to its operation network, due to the addition of 16 aircraft prepared for regional route operations (TAP Annual Report, 2012).
In 2011 TAP Group had a net income of -76,8 MEUR, less 19,7 MEUR than the -57,1 MEUR registered in the previous year. At the operating level the company recorded -18,1 MEUR, which reflects an aggravation of 17,6 MEUR relative to 2010. It should be noted, that by the end of 2011, TAP had more than doubled its size in relation to 2000, with its offer having grown by approximately 150% over this period (TAP Annual Report, 2012).
During the year (2011), the TAP Group (TAP, S.A. and other participated companies) employed an average of 12 671 persons, ending the year with 12 395 workers. TAP Portugal is currently 100% state owned, but the privatization of the airline it’s currently on its way (2013). The shareholder structure of TAP group is presented in Figure 1.
Figure 1 - TAP Shareholder Structure (TAP Annual Report, 2012).
1.2 Project “Portal do Trabalhador”
TAP Portugal has implemented numerous HR Information Systems (HRIS) tools in the past couple of years. In this dissertation, the focus is on the HR Self-Service project called “Portal do Trabalhador”, the employee portal, which is currently on its way to be implemented. The employee portal is a human resource management tool, which offers a range of services to workers and their supervisors in order to simplify, to rationalize and to increase the speed of some HR processes. In this portal, the users may consult their personal information, change any of this information, justify periods of absenteeism, consult the pay slip, and analyze the results of the performance evaluation, among many other features. Currently this information is a bit difficult to access – it is only available in person or by means of Excel or PDF.
The objectives of the project include, for example, reducing the administrative effort of the existing processes, making them faster and more efficient, reducing the response time to the employees and increasing the information available for them. The new systems also aims to support management in their decision making by providing more reliable data, and to change the focus of the HR itself from manual data entering to data analysis. The organization expects the investment to be covered in 3 years by cost savings. This requires that the employees in the organization accept the new system and use it to a great extent. This

Employee Self-Service Technology Acceptance: A Case Study
3
dissertation aims to shed further light to which are the factors that affect the TAP employees’ willingness to use the new system.
1.3 Methodology
IT-department of TAP (called Megasis, see Figure 1) is fully responsible for gathering the user requirements, developing the new system and implementing it. In this dissertation all those tasks are excluded, and the focus is on exploring the attitudes of the employees towards the new portal, how much the employees plan to use the new system, and which are the variables that affect those attitudes and usage intentions. To find out those matters, an online questionnaire was sent to 150 mid-level managers of TAP Portugal. The questionnaire comprised 40 questions, mostly in a 7-point Likert-type scale. The questionnaire included variables like organizational support, management pressure, image, perceived usefulness and ease of use of the new ESS-portal. Also, the goal was to find out how the results fit to the individual technology acceptance model, when a new ESS system is being implemented. The results were then analyzed using SPSS program to test the hypotheses by examining the statistical significance between the variables.
1.4 Comparative Analysis of Existing Approaches and Their Advantages and Disadvantages
The study of people’s reactions to computing technology has been an important topic in IS research since the 1980’s. The theoretical foundation for the study of whether a person is willing to use a technology comes from research on adoption and diffusion (Moore & Benbasat, 1991; Rogers, 2003). The continuous research in this area has produced other theories, such as the technology acceptance model (TAM) (e.g., Davis, Bagozzi, & Warshaw, 1989; Venkatesh & Davis, 1996), the theory of planned behavior (TPB) (e.g., Ajzen, 1991; Mathieson, 1991; Taylor & Todd, 1995), and social cognitive theory (e.g., Compeau & Higgins, 1995; Hill, Smith & Mann, 1987). To gain better understanding of how individuals make decisions regarding new technologies, studies based on these theories have examined variables related to individuals’ beliefs and intentions regarding the acceptance and continued use of new IT (Bhattacherjee, 2001). Studies have been made from different aspects of the phenomenon and they have produced insights into the reactions of individuals to technology and into the factors that influence these reactions. No theoretical framework has been more successful at this than the TAM (Davis et al., 1989).
Mathieson (1991) compared the theory of planned behavior with the technology acceptance model. He found that both models were strong at explaining user intentions, but while TPB was predictive of user intention, it did not provide as complete an explanation of intention as TAM. Mathieson (1991) argued that the TPB could be more useful in developing a better understanding of why users were more or less motivated to use a technology. Taylor et al. (1995) developed a more detailed version of the theory of planned behavior, the Decomposed Theory of Planned Behavior (DTPB), that more completely explores the dimensions of subjective norm (i.e., the social influence) and perceived behavioral control by decomposing them into specific belief dimensions. This model did increase the amount of variance explained in adoption outcomes (36%) beyond the technology acceptance model (34%) and provided more information about how managers might influence organizational members to adopt a particular system through subjective norm. But while TAM includes five constructs, the decomposed TPB includes thirteen. So the small increase in predictive power comes at the cost of a large increase in complexity.

Employee Self-Service Technology Acceptance: A Case Study
4
However, TAM still remains the most popular and successful approach. As of August 2013, Google Scholar listed the number of citations for the two journal articles that introduced TAM (Davis, 1989; Davis et al., 1989) at 26 101. Later, the technology acceptance model has been developed further to increase the explanatory power of the model (e.g., Venkatesh et al., 2000). Since this study concentrates on the pre-implementation phase, TAM and its newer version TAM2 seems to be the most suitable approach, with some influence from TPB to cover the shortcomings of the original TAM model, that tends to ignore some factors related to the implementation process or the environment.
1.5 The Structure of the Study
Chapter two focuses on theory and previous studies. The technology acceptance model and theory of planned behavior are presented, and the theory framework used in this dissertation is formed. Chapter three gives an overview on electronic human resources and employee self-service systems, and the TAP project “Portal do Trabalhador” is introduced. In chapter four the variables used in the questionnaire are presented and the hypotheses are constructed. Chapter five is devoted to the results of the questionnaire. Finally, chapter six concludes the findings and gives references for future studies.

Employee Self-Service Technology Acceptance: A Case Study
5
2 Theory and Previous Studies
According to the Standish Group's 2012 Chaos Research report, only 39 percent of IT projects were successful (delivered on time, on budget, with required features and functions); 43 percent were challenged (late, over budget, and/or with less than the required features and functions); and 18 percent failed (cancelled prior to completion or delivered but never used). As stated by Venkatesh & Bala (2008), technology is only useful if the users embrace the technology and apply it within their work routines.
In the past decades, studies based on different theoretical approaches have been made to explain, predict and increase user acceptance of information systems. For example, according to the Innovations Diffusion Theory (IDT), the user’s perception of the characteristics of an innovation affects its adoption (e.g., Moore et al., 1991; Rogers, 2003). The intention-based theories of IT adoption, i.e., the technology acceptance model (e.g., Davis et al., 1989; Venkatesh & Davis, 1996, 2000) and the theory of planned behavior (e.g., Mathieson, 1991; Taylor et al., 1995) show that the adoption and usage of an IT innovation is eventually determined by the users’ beliefs and attitudes toward the information systems. Some other theories, for example, Social Cognitive Theory (SCT) (Compeau & Higgins, 1999) and Triandis’ model (e.g., Thompson, Higgins & Howell, 1991; Cheung, Shang & Lai, 2000), have also been applied to user adoption of IS studies. These studies have produced valuable insights into the cognitive, emotional and behavioral reactions of individuals to technology, as well as into the external variables that influence the formation of these reactions, or that even have a direct influence in the intention or behavior of a user.
Among these theoretical models, the Technology Acceptance Model (TAM) is tailored to study the user acceptance of computer technology. It has been applied across different user populations and a broad range of end-user computing technologies, and it has been empirically approved to be a strong model for studying user acceptance behavior in the IS research field. In the next chapters, TAM and its more recent extensions are explained in detail.
2.1 Technology Acceptance Model
Davis et al. (1989) developed technology acceptance model (TAM, Figure 2) to explain why users accept or reject an innovative information system. The theory explains user acceptance of a technology based on user perceptions and it is based on the social psychology theory of reasoned action (Ajzen & Fishbein, 1980). Generally, the goal of TAM is “to provide an explanation of the determinants of computer acceptance that is general, capable of explaining user behavior across a broad range of end-user computing technologies and user populations, while at the same time being both parsimonious and theoretically justified” (Davis et al., 1989:985).
According to TAM, two specific behavioral beliefs, perceived ease of use and perceived usefulness, determine an individual’s behavioral intention to use a technology. In addition, it suggests that the effect of external variables (e.g., design characteristics of the system) on intention is mediated by these two key beliefs. Perceived ease of use is the extent to which a person believes that using a technology will be free of effort. Perceived usefulness is the extent to which a person believes that using a technology will improve his productivity. In contrast to perceived ease of use, which is process expectancy, perceived usefulness is

Employee Self-Service Technology Acceptance: A Case Study
6
outcome expectancy. Perceived usefulness is expected to be influenced by perceived ease of use, because the easier a technology is to use the more useful it can be. The direct effect of perceived ease of use on behavioral intention to use is stronger in the early stages on learning and usage. With time/experience, the effect becomes indirect operating through perceived usefulness (Davis, 1989; Davis et al., 1989).
Figure 2 - Original Technology Acceptance Model (Davis et al., 1989).
The validation of TAM in other researches seems to go two ways: One is focusing on validating the instruments of perceived usefulness and perceived ease of use to prove their psychometric properties. The other is focusing on testing the causal links in the model (e.g., perceived usefulness – attitude or behavioral intention to use) and the external variables to perceived usefulness and perceived ease of use relationships. In general, the psychometric properties of the measures of perceived usefulness and perceived ease of use developed by Davis (1989) appear to be robust across studies and different user groups.
2.2 Technology Acceptance Model 2
In 2000, Venkatesh and Davis identified that TAM had some limitations in explaining the reasons for which a person would perceive a given system useful. They proposed that additional variables could be added as originators to the perceived usefulness variable in TAM. So they developed TAM further to TAM2. Two processes, the social influence processes (subjective norm, voluntariness and image) and the cognitive instrumental processes (job relevance, output quality, result demonstrability and perceived ease of use), were integrated into this model in order to explain the effects of the various determinants on perceived usefulness and behavioral intention.
Subjective norm and image are the two determinants of perceived usefulness that represent the social influence processes. Following Kelman’s (1958, 1961) work on social influence and French and Raven’s (1959) work on power influences, TAM2 theorizes that three social influence mechanisms – compliance, internalization, and identification – will play a role in understanding the social influence processes. Compliance represents a situation in which an individual performs a behavior in order to achieve certain rewards or avoid punishment (Miniard & Cohen, 1979). Identification refers to an individual’s belief that performing a behavior will lift his social status within a referent group, because important referents believe the behavior should be performed (Venkatesh et al., 2000). Internalization is defined as the incorporation of a referent’s belief into one’s own belief structure (Warshaw, 1980). TAM2 suggests that subjective norm and image will positively influence perceived usefulness through processes of internalization and identification, respectively. It further theorizes that

Employee Self-Service Technology Acceptance: A Case Study
7
the effect of subjective norm on both perceived usefulness and behavioral intention would decrease over time as users gain more experience with a system.
Four constructs – job relevance, output quality, result demonstrability and perceived ease of use – capture the influence of cognitive instrumental processes on perceived usefulness. Based on three different theoretical paradigms – work motivation theory (e.g., Vroom, 1964), action identification theory (e.g., Vallacher & Wegner, 1987) and behavioral decision theory (e.g., Beach & Mitchell, 1996, 1998) – Venkatesh and Davis (2000) provided a detailed discussion of how and why individuals form perceptions of usefulness based on cognitive instrumental processes. They stated that individuals “form perceived usefulness judgment in part by cognitively comparing what a system is capable of doing with what they need to get done in their job” (Venkatesh et al., 2000:190). TAM2 theorizes that the basis for forming perceptions regarding the usefulness of the system is individuals’ mental assessment of the match between important work goals and the results of performing job tasks using a system (Venkatesh et al., 2000). It also suggests that perceived ease of use and result demonstrability will have a positive direct influence on perceived usefulness. Job relevance and output quality will have a moderating effect on perceived usefulness, such that the higher the output quality, the stronger the effect job relevance will have on perceived usefulness. Venkatesh et al. (2000) found strong support for TAM2 in their longitudinal field studies conducted at four organizations.
Figure 3 - Technology Acceptance Model 2 (Venkatesh et al., 2000).
The difference between TAM2 and the original TAM model can be seen clearly from Figure 2 and Figure 3. Attitude toward using has been deleted from TAM2. In addition, the external variables of the original model (such as system characteristics, training, the user involvement in the system design phase, and the nature of system establishment process) are significantly different from the external variables adopted in TAM2. The original TAM model limited the effects to attitude toward using and behavioral intention to use the technology system in perceived usefulness and perceived ease of use. The advantage is that it is easy to operate but the explanation ability of the model is very limited. TAM2 expanded the social influence factor, and deeply analyzed the two major influence processes (social influence process and

Employee Self-Service Technology Acceptance: A Case Study
8
cognitive instrumental process) of forming the perceived usefulness of a technology system. Therefore, TAM2 has higher explanation ability than the original TAM model.
Several empirical studies have accumulated in favor of the technology acceptance model. These studies have found that TAM consistently explains a considerable proportion of the variance in the usage intentions and behavior (typically about 40%, whereas TAM2 may reach 60%), and that TAM compares favorably with alternative models such as theory of reasoned action and theory of planned behavior (Venkatesh, 2000).
2.3 Criticism and Further Extensions of TAM
Along with the fact that several studies have confirmed the robustness of TAM model, several other researchers have also highlighted its important limitations. One of the most common criticisms of TAM has been the lack of actionable guidance to practitioners (Lee, Kozar & Larsen, 2003). In many cases, TAM has produced relatively low explanatory power (Zhang, 2005), which has been attributed to not taking into account many influential factors, especially potential moderating variables (Adams, Nelson & Todd, 1992; Lucas & Spitler, 1999; Venkatesh et al., 2003; Zhang, 2005). For example, most of the studies have been conducted in voluntary system usage environment, when in real life settings most organizations usually require users to use the system available with little choice for alternatives (Lee et al., 2003).
Another concern involves the lack of research on what represents meaningful acceptance of a technology. Obtaining accurate measurements of “actual system use”, TAM's outcome variable, has been particularly problematic because actual usage of a technology can be difficult to define and it is often unavailable to researchers (Johnson, Zheng & Padman, 2012). According to Rogers (2003), a person's decision process of technology acceptance can be split into sequential steps, starting from formation of attitude and adoption decision to actual use and reinforcement feedback of the adoption decision made. TAM-based models are often built to predict future acceptance of a technology that is going to be introduced, based on current beliefs of its potential end users, overlooking the fact that users' perceptual beliefs may be subject to change with increased use experience and other possible factors.
Even though the TAM has many limitations, only a few studies have pursued to expand the TAM beyond simply testing slight differences in terms of relationships among well-accepted constructs (Lee et al., 2003). The TAM2 was the first expansion of the TAM, adding some additional determinants of perceived usefulness and perceived ease of use (Venkatesh et al., 2000). The second expansion was the Unified Theory of Acceptance and Use of Technology (UTAUT) (Venkatesh et al., 2003), which included variables from IT-related models outside the TAM, including the model of personal computer utilization (Thompson et al., 1991) and the motivational model (Davis, Bagozzi & Warshaw, 1992). The latest expansion of the TAM – TAM3 (Venkatesh et al., 2008) – focuses on differences among the relationships of previously tested variables in pre-implementation and post-implementation stages.
2.4 TAM and Employee Self-Service Systems
Recently TAM has been applied to the context of technology-based self-service. For instance, Marler and Dulebohn (2005) argued that HR self-service technology has a unique character that blends the voluntary and mandatory aspects of usage. Therefore, the conventional constructs of TAM are far too narrow in their focus and measurement. Bobbitt and Dabholkar (2001) suggest extending TAM by including the theory of understanding whether a good or

Employee Self-Service Technology Acceptance: A Case Study
9
bad previous experience of self-service has an impact on an individual’s attitude towards using the technology again. Huang and Martin-Taylor (2013) used a mix of TAM and action research approach to research how users’ perceptions can be proactively reshaped to foster the acceptance of technology and what roles will HR need to play. Despite the limited amount of TAM studies focusing in ESS, the overall results suggest that the technology acceptance model fits well for the self-service system environment.
2.5 Theory of Planned Behavior
The theory of planned behavior (TBP) is originated from social psychology and behavioral intention models (Eagly & Chaiken, 1993). The theory involves three belief categories: behavioral beliefs, normative beliefs and control beliefs, which in turn determine three main attitudes toward technology and intention to use a technology (Figure 4).
Figure 4 - Theory of Planned Behavior (Ajzen, 1991).
Behavioral beliefs determine a person’s affective attitude toward performing the behavior. Normative beliefs determine attitude to social pressures to perform a behavior. Finally, control beliefs determine perceptions of behavioral control (Ajzen, 1991; Taylor et al., 1995). These three attitudes are predecessor to the fourth attitude, intention to perform a behavior. In the technology context, the theory suggests that three attitudes (attitude toward a specific technology, attitude toward social pressure to use the technology, and perceptions of one’s ability to actually use the technology) determine an individual’s intention to use that particular technology.
Theory of planned behavior includes constructs that do not appear in the technology acceptance models. Mathieson (1991) and Taylor et al. (1995) suggest that subjective norm and perceived behavioral control overlap only minimally with TAM’s constructs. Subjective norm is an individual’s perception of the other people’s opinions of the behavior, while the perceived behavioral control “refers to people’s perception of the ease or difficulty of performing the behavior of interest” (Ajzen, 1991:183). However, TPB requires unique operationalization in every different situation in which it is used. In particular, it requires the development of customized instruments for behavioral beliefs, normative beliefs and control beliefs. While the TPB includes more effects that it might be important in some situations, TAM is easier to apply when predicting IS usage. Therefore TAM is used as the main theory in this study, but some features from TPB (organization support, management pressure and perceived resources) are added, following the example of Marler et al. (2009).
A summary of the most relevant technology acceptance articles regarding this study, and their findings, can be found in Table 1.

Employee Self-Service Technology Acceptance: A Case Study
10
Table 1 - Previous Studies and Their Key Findings.

Employee Self-Service Technology Acceptance: A Case Study
11
2.6 Theory Framework Used in This Study
There are hundreds of studies in the information science literature based on TAM models, which empirically identify and validate various individual, organizational and technological factors associated with a person's intention to use new information technology in many different contexts. According to Venkatesh (2000), “the parsimony of TAM combined with its predictive power makes it easy to apply to different situations”. Only recently has this model been applied in an e-HRM context (Marler, Fisher & Ke, 2009; Marler et al., 2005), demonstrating that when employees perceive e-HRM technology to be useful and easy to use, they are more likely to actually use it.
In this study, the TAM2 model was used as the base of the theory formation. TAM2 includes the moderating variable “experience”. In this study the experience is not taken into consideration, because the study was conducted only at one point of time: in the pre-implementation phase. Three variables, “perceived organizational support”, “managerial pressure” and “perceived resources”, were added to the model. This was done capture the special characteristics of the employee self-service system implementation and to increase the practical contribution of the study. The aim was also to test if other factors, than those related directly to the characteristics of the innovation itself, can increase the explanatory power of the model. The model used in this study is presented in Figure 5.
Figure 5 - Framework of the Study.

Employee Self-Service Technology Acceptance: A Case Study
12

Employee Self-Service Technology Acceptance: A Case Study
13
3 E-HRM and the Employee Self-Service Systems
The Human Resource Management (HRM) function has evolved over time from the traditional administrative function, primarily responsible for payroll processing, to a more strategic direction of human capital management that can add value to an organization (Walker, 2001). One of the main driving forces to allow this transformation is argued to be the adoption of electronic human resource management (e-HRM) (Bondarouk & Ruël, 2009; Strohmeier, 2009).
3.1 E-HRM
The term e-HRM is used extensively, but a universally accepted definition is still missing. In the literature, e-HRM is often used synonymously with human resource information systems (HRIS), virtual HRM, HR Intranet, web-based HR, computer-based human resource management systems and HR portals (Ruël, Bondarouk & Looise, 2004). Ruël, Bondarouk, & Van der Velde (2007) defined e-HRM as a way of implementing HR strategies, policies, and practices in organizations through a conscious and directed support and/or with the full use of web-technology-based channels. E-HRM is also seen as a collection of knowledge, principles and best-practice approaches to effective human resource management (Walker, 2001). E-HRM has a wide range of uses. It may support particular HR activities, for example recruitment and selection, performance management, compensation and benefits, training and development, health and safety, employee relations, retention and policies on work-life balance. It may be used to manage employee information across the entire employment cycle (Ensher, Nielson & Grant-Vallone, 2003).
Types of e-‐HRM The current e-HRM literature separates three types of e-HRM: operational e-HRM, relational e-HRM and transformational e-HRM. These distinctions are based upon the work of Lepak and Snell (1998) and Wright and Dyer (2000). The operational HRM includes the basic HR administrative activities, such as payroll and personnel data administration. Relational HRM concerns more advanced HRM activities, and the emphasis is more on HR tools that support basic business processes, such as recruiting, training, performance management and rewards. Transformational HRM deals with activities of strategic character, such as organizational change processes and strategic knowledge management. Within all these types of HRM, the organization needs to choose which HRM activities will be offered face-to-face, and which will be offered through web-based HR. For the operational type of HRM, the employees can, for example, be asked to keep their own personal data up-to-date through an HR web site, or there needs to be administrative staff available to do this for them. In relational HRM, the company can either use a traditional paper-based approach, or they can support recruitment and selection through a web-based application. In transformational HRM, the e-HRM can enable the workforce to develop in line with the company’s strategic choices (Ruël et al., 2007).
Although the e-HRM types tend to be mixed in practice, creating a good basis for e-HRM at the operational level seems to be an essential prerequisite for relational and transformational e-HRM. To support these developments, a change in the tasks of HR professionals is also required, such as moving towards paperless administration, more e-communications with employees and acquiring skills for operating IT. E-HRM assumes an active role for line management and employees in implementing HRM strategies, policies and practices. When it

Employee Self-Service Technology Acceptance: A Case Study
14
comes to the organizations with operational e-HRM approach, moving part of the administrative HR tasks to managers and employees means that there will be less demand for HR staff. Also organizations with a relational e-HRM approach will need a smaller HR staff, if line management and employees pick up and use the HRM instruments provided. With a more transformational e-HRM approach, strategic HRM expertise will be necessary in order to formulate adequate strategic HRM plans. Ruël et al. (2004) emphasize that there are no better or worse e-HRM types. They also show that there is a gap between e-HRM in a technical sense and its use and adoption by employees and line managers. Actual usage/adoption can lag by up to three years.
E-‐HRM and Technology There are many information technology-based systems used for human resource management purposes. The most dominant and most well known is human resource information systems (HRIS), followed by enterprise resource planning (ERP) systems. E-HRM is an extension of these technologies, adding strategic value to the organization, through automation and information.
According to Ruël et al. (2004), there is an essential difference between HRIS and e-HRM. HRIS are intended for the HR department, where users of this technology are largely HR professionals who use the system to enhance processes within the HR department, with the aim of improving service to the business. E-HRM, on the other hand, is targeted to employees and management. HRIS concern the automation of HR services and e-HRM provides technological support of information regarding HR services. E-HRM is seen as a “way of doing HRM” (Ruël et al., 2007: 281).
Florkowski and Olivas-Luján (2006) identified seven major HR technologies in use, which they cluster into two major groupings – software targeting HR staff as primary end-users versus applications directed at HR’s internal customers. Table 2 summarizes the goals, features, and activities associated with each technology.
Table 2 - One Classification of the HRIS in Use (Florkowski et al., 2006).
ERP systems (e.g., SAP, Oracle, PeopleSoft), on the other hand, link and integrate data and information from financial, operations, sales, human resources, supply-chain and other

Employee Self-Service Technology Acceptance: A Case Study
15
business functions to create a single, collective picture of the entire business and its processes. This type of shared database allows access to common data, reducing the need to continually integrate information from separate databases and software applications (Hendrikson, 2003). Marnewick and Labuschagne (2005:145) state: “The ultimate goal of an ERP system is that information must only be entered once”. ERPs are all about integration and real-time access to information. One of the main drivers of enterprise resource planning has been the integration of the technology from the assorted HR functions (Keebler, 2001). A major challenge faced by many organizations is integrating e-HRM tools and HRIS systems with enterprise-wide software such as an ERP system.
Benefits and Challenges of e-‐HRM The main three organizational benefits for e-HRM investments have been found to include cost reduction through streamlining HRM operations (Marler et al., 2009), improved effectiveness through providing better delivery of HRM services (Ruël et al., 2004), transformation of the HRM function to a strategic business partner (Lepak et al., 1998) and improving client service/facilitating management and employees (Ruël et al., 2004). Some of the empirical findings add globalization to these goals. Other benefits of e-HRM may include improved accuracy, reduced response times, improved employee productivity and morale, better decision-making, information sharing and information flow (Snell et al., 2002; Lengnick-Hall & Moritz, 2003).
Regarding improving strategic orientation, the findings show that the goals are not often clearly defined in practice, and that e-HRM is mostly directed towards cost reductions and efficiency increases in HR services, rather than aiming to improve the strategic orientation of HRM (Gardner, Lepak & Bartol, 2003; Ruël et al., 2004; Ruta, 2005). Recent studies have found that in nearly half of the companies with a fully integrated e-HRM, HR was not viewed as a strategic partner. This is despite the observation by Shrivastava and Shaw (2003:201) that “it appears that firms that undertake technology initiatives with a view to enable the HR function to focus more on value-added activities are the ones most likely to realize the full potential of technology”.
An important challenge that organizations might face when implementing e-HRM systems may be resistance to change – employees like the feeling of safety in the old paper system (Ostermann, Staudinger & Staudinger, 2009). In the CedarCrestone (2007) study, the most frequently highlighted issue in relation to the lack of success in meeting the self-service objectives was the resistance of employees and managers, who perceive self-service as “HR dumping its transactional work on them”. Most organizations underestimate the cultural impact of technology on their employees. Therefore, a focus on the change management is needed along with the training and the implementation of the software. Better yet, employees should be involved in the development of the HR system (Bussler & Davis, 2001; Ostermann et al., 2009). According to Bussler et al. (2001), security is another factor to consider for HR and IT professionals, as with any software system. Human Resources by its very nature deals with very confidential data and companies need to be careful in managing that data.
As HRIS can represent a large investment decision for companies of all sizes, a convincing case must be made to prove to the decision makers that the benefits offset the costs. The costs associated with implementing a HR information system are first of all the software itself and the transition costs, but also granting the access to workers to be able to use it efficiently, at work or even at home (Lengnick-Hall et al., 2003). While it may be possible to identify many of the applicable costs (e.g., software and hardware), it is more difficult to quantify the

Employee Self-Service Technology Acceptance: A Case Study
16
intangible benefits to be gained from a HRIS. Some metrics that are used to justify HRIS are the average cost of an HR transaction, number of inquiries to the service center, cycle times, headcount changes, employee satisfaction, and financial metrics, such as the return on investment or payback period.
In the long term, the adoption of e-HR demands significant adjustments overall in the way the HR department operates. These include devolving some functions to the managers, declining of several administrative functions and increased expectations on the HR professionals, who will be expected to take up a more strategic and knowledgeable role (Panayotopoulou, Vakola & Galanaki, 2007).
3.2 Employee Self-Service Systems
Employee self-service (ESS) is a group of systems used in HRM, and it represents one of the fast developing trends in the domain of HRIS (Strohmeier, 2007; Ruël et al., 2004). Konradt, Christophersen and Schaeffer-Kuelz (2006) define ESS system as a “corporate web portal that enables managers and employees to view, create and maintain relevant personnel information”. ESS systems are designed to automate tasks that are normally done by the organizations’ HR department, like updating personal details, applying for leave, viewing pay details and associated benefits, viewing internal job vacancies and booking training and travel. In the Management Self-Service (MSS) side, the managers can access the info of his subordinates, approve their requests and take out different kinds of reports (Hawking, Stein & Foster, 2004). The rationale of the self-service approaches is that they help to release the personnel department from the burden of repeated tasks and to empower employees to take a more active role in personnel processes (Lengnick-Hall et al., 2003; Marler et al., 2005).
The tangible and intangible benefits of ESS have been well documented. Like in e-HRM in general, the benefits include reduced administrative overheads, freeing up HR staff for more strategic activities, improved data reliability and empowerment of employees. One report identified a major benefit as the delivery of HR services to employees in a geographically decentralized company. Other tangible measures include reductions in administrative staff by 40%, reductions in transaction costs of up to 50% and the reduction in processing activities from several days to a few hours (Hawking et al., 2004). However, the benefits are not only on the organizations’ side; employees also profit from the implementation of ESS. They have instant access to information and the effort needed for certain transactions, such as expense claims, is reduced. Managers also benefit from the up-to-date information and easy access to different kinds of reports, resulting in a better overview of their resources. ESS further provides the ability to create, view and maintain data through multiple access technologies (Koopman & Batenburg, 2009).
According to the CedarCrestone 2011-2012 survey, the adoption rate of employee self-service is now at 82%, and manager self-service at 54%, with the adoption rate typically 10% higher in large organizations. Financial services and high-tech manufacturing organizations are the strongest adopters; agriculture, mining and construction, public administration, higher education and even healthcare are lower than average adopters (CedarCrestone, 2012). One of the reasons for self-service is to support an organization to go paperless and “go green”. In the CedarCrestone study, the percentage of paperless was 51% today and 64% forecast for the next year. So, self-service adoption does not necessarily translate to comprehensive use yet within the organizations indicated by the adoption numbers (CedarCrestone, 2012).
Employee Self-Service Technology Acceptance: A Case Study
17
One of the biggest challenges of e-HRM in organizations is to fully embrace and actually use HRIS to its full potential, and thus realize its strategic potential (Stone & Lukaszewski, 2009). For example, a poor communication of the reasons of the change could give employees the impression that the HRIS is implemented to reduce costs instead of facilitating employees’ work (Stone et al., 2009). For example, a survey by Towers Perrin found that 80% of respondents said employee self-service can lower HR costs, but only 5% said they fully achieved this objective, another 35% said they have only partially achieved that objective, and only 3% said it was accelerating HR’s transformation into a strategic partner (Brown, 2002).
3.3 Project “Portal do Trabalhador”
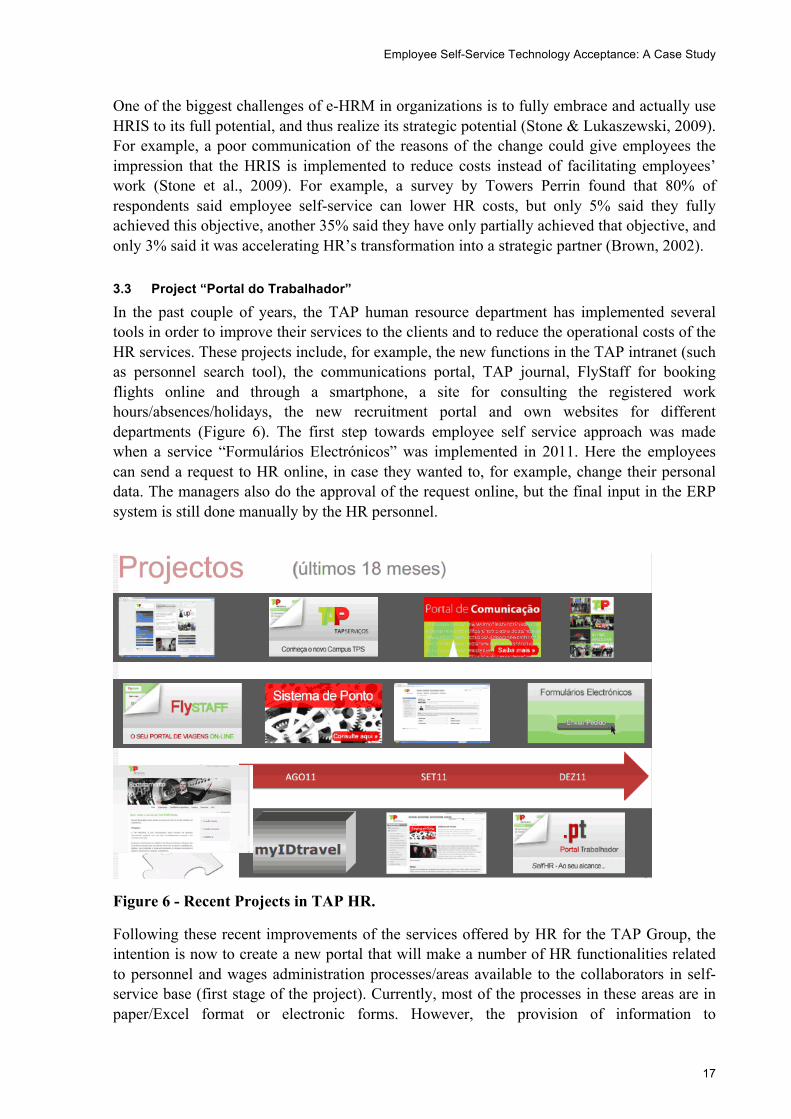
In the past couple of years, the TAP human resource department has implemented several tools in order to improve their services to the clients and to reduce the operational costs of the HR services. These projects include, for example, the new functions in the TAP intranet (such as personnel search tool), the communications portal, TAP journal, FlyStaff for booking flights online and through a smartphone, a site for consulting the registered work hours/absences/holidays, the new recruitment portal and own websites for different departments (Figure 6). The first step towards employee self service approach was made when a service “Formulários Electrónicos” was implemented in 2011. Here the employees can send a request to HR online, in case they wanted to, for example, change their personal data. The managers also do the approval of the request online, but the final input in the ERP system is still done manually by the HR personnel.
Figure 6 - Recent Projects in TAP HR.
Following these recent improvements of the services offered by HR for the TAP Group, the intention is now to create a new portal that will make a number of HR functionalities related to personnel and wages administration processes/areas available to the collaborators in self-service base (first stage of the project). Currently, most of the processes in these areas are in paper/Excel format or electronic forms. However, the provision of information to

Employee Self-Service Technology Acceptance: A Case Study
18
collaborators and different managers is practically non-existent, or the information is only available in person or by means of Excel or PDF files.
Because SAP is the tool for supporting the TAP Group’s Human Resources processes, the goal is to create a portal based on the already existing functionalities, bringing the collaborators closer to the company in their access to, and provision of, faster and more reliable information.
The TAP Intranet homepage (Campus TAP) is currently used as an entry point for internal content and external sites (related to TAP’s activity), as well as useful applications for all TAP collaborators. With the addition of the Worker’s Portal (Portal do Trabalhador), restructuring the design and contents of the homepage was requested with regards to both the new portal and the already existing contents. Figure 7 presents a prototype for the ESS homepage.
Figure 7 - Prototype of the ESS Homepage.
Objectives The objectives of the project are: Automating and dematerializing the procedures and processes managed by the personnel and wages administration, as well as eliminating paper circulation associated with these processes. The goal is also to reduce the administrative effort of the existing processes, making them faster and more efficient, reducing the response time to the employees and increasing the information available for them. A very important objective is also to standardize processes between the different business units of the TAP Group. For managers, the objective is to provide them information online, and to enable faster and more reliable decision-making. Regarding the HR itself, the objective is to change the focus of backend HR from “Insert Data” to “Analyze Data”. Also, one of the objectives is to implement a new design for the Campus homepage and TAP Communications Portal.
Scope of the Project In the first phase of the project, the portal will include the following functions:
- Searching and providing basic information of employees of the Group;
- Viewing/changing personal data, address, tax data, personal documents, family, academic records, bank data, health insurance, registered working time and affiliations;
- Viewing and justification of absence;
- Holiday planning and scheduling;

Employee Self-Service Technology Acceptance: A Case Study
19
- Exchanging shifts;
- IRS statement consultation;
- Pay slip requests;
- Viewing training history and the results of performance evaluation;
- Requesting several statements.
Every manager should be able to approve workflows resulting from claims of a worker. The manager should be able to view the basic information of the worker, his academic records, results of performance evaluations, absences / presences, and work time, as well as hours and shift changes. The project also includes refreshing the image of the Intranet, generating alerts for notification of pending cases, QuickStart Guide as well as detailed manuals for both the employees and the managers. The confirmation of the project is made in the same phase as of drawing the Business Blueprint. At that stage, and after detailing the necessary developments to meet the needs of the case, the estimated effort may be reviewed and adjusted.
Technological Infrastructure The implementation of the “Portal do Trabalhador” requires also the development and implementation of the new design for the TAP Intranet homepage and the Campus Communication Portal in accordance with the graphic, navigation and related functionalities reformulation needs. The end users must be granted access to the portal, and an easy, transparent and advantageous transition from the old to the new design in terms of user experience. A mockup of the new Intranet homepage can be found in Appendix 2/ 1.
TAP current solutions operate in Microsoft SharePoint sites, and the solution will be integrated into the existing structure. Thus, the solution will be this platform that allows content management enhancing the aggregation and integration of information/documents available in other systems/platforms. The high level diagram showing the interoperability of the system is shown in Appendix 2/ 2. The “Portal do Trabalhador” infrastructure, SAP-based and available via SharePoint, is presented in Appendix 2/ 3.
Project Duration and Teams The project “Portal do Trabalhador” was originally started in 2011 but put on hold for some time. The project was restarted on February 2013 and the go-live for the first phase is currently planned in the first quarter of 2014. The implementation of the project is estimated to take 150 working days. Appendix 2/ 4 presents the implementation plan of the project, its milestones and their duration estimates.
The persons that are involved in the project from both Megasis and TAP side, and their respective roles are presented in Table 3 and Table 4.

Employee Self-Service Technology Acceptance: A Case Study
20
Table 3 - Project Team Megasis.
Table 4 - Project Team TAP.
Budget The budget of the project is presented in Table 5. The goal is to reach cost savings by reducing the HR personnel by 5 full-time equivalents (FTE). The payback time for the investment is estimated to be 3 years (measured in ROI).
Table 5 - Budget of the Project.

Employee Self-Service Technology Acceptance: A Case Study
21
4 Hypotheses Construction
In this chapter, the variables included in the framework of the study are presented and all the hypotheses are built. The first three variables belong to the “Social Influence Process” of TAM2. They are followed by the four “Cognitive Instrumental Process” variables of TAM2. The last three “additional variables” are the ones that are adapted from theory of planned behavior to be included in this study.
4.1 Social Influence Process
The first group of variables includes “subjective norm”, “voluntariness” and “image”. The relationship among the three concepts is an important factor that affects user acceptance or rejection of an innovative system (Venkatesh et al., 2000).
Subjective Norm Subjective norm about using the technology is one of the important predictors of technology acceptance. TAM2 suggests that subjective norm is the medium of social influence processes; it is defined as “a person's perception that most people who are important to him think he should or should not perform the behavior in question” (Fishbein & Ajzen, 1975:302).
Subjective norm influences trough three major mechanisms: compliance, internalization and identification. Compliance is reflected in the direct “subjective norm – intention to use” -relationship, while internalization and identification change a user’s belief structure, such as perceived usefulness. Therefore, subjective norm has been found to play two separate and different roles, which are included in TAM2: One as influencing the intention to use and the other as influencing the perceived usefulness. (Venkatesh et al., 2000.) The internalization mechanism means that when a person feels that important referents think he should use the system, this person incorporates the referents’ beliefs into his own belief structure: If a superior or co-worker suggests that a particular system might be useful, a person may come to believe that it actually is useful, and in turn form an intention to use it. Therefore:
Hypothesis 1: Subjective norm about using the ESS technology will be positively related to perceived usefulness.
Voluntariness Subjective norm influences one’s intention to use a system, whether one likes to do it or not: If people important or powerful enough to this person think that using the system is necessary, and the person cares what these referents think, this person will be influenced to adopt the technology (Fishbein et al., 1975). The previous studies examining the direct effect of subjective norm on intention to use have had mixed results, potentially because they have been performed in a variety of situations. In theory of planned behavior the effect of subjective norm is recognized (Ajzen, 1991). Mathieson (1991) found no significant effect of subjective norm on intention to use, whereas Taylor et al. (1995); Karahanna, Straub and Chervany (1999) and Venkatesh (2000) found that there was a significant influence. Hartwick and Barki (1994) studied the mixed findings by separating the respondents in their study into mandatory and voluntary usage context. They found out that subjective norm had a significant effect on intention to use in mandatory settings, but not in voluntary ones.

Employee Self-Service Technology Acceptance: A Case Study
22
Also Venkatesh et al. (2000) considered that the reason for the insignificant “subjective norm – intention to use” -relationship that exists in prior studies was because they were conducted in voluntary settings. They retested the role of voluntariness and their study confirmed that subjective norm had a significant direct effect on intention to use for the mandatory, but not for the voluntary usage context. Venkatesh et al. (2003) retested and confirmed this influence of voluntariness again in their latter work.
Therefore, voluntariness, “the extent to which potential adopters perceive the adoption decision to be non-mandatory” (Hartwick et al., 1994), seems to moderate the “subjective norm – intention to use” -relationship. The compliance part of subjective norm can be thought as level of voluntariness. Users have to “comply” with the managerial or organizational demands or rules in a mandatory context, but not in a voluntary one.
ESS technology offers an interesting case in terms of user preferences and the role of subjective norm. Use of ESS is typically neither completely mandatory nor completely voluntary. Normally, some degree of adoption is mandatory, but the overall extent of ESS use is voluntary. Users can decide whether they want to use or not to use broad range of ESS functions, many of which are not core to users’ job. Meanwhile, the organizations expect a high level of adoption and use to benefit from their investment in the ESS technology (Marler et al., 2009).
Hypothesis 2a: Subjective norm will have a positive direct effect on intention to use the ESS technology when system is perceived to be mandatory.
Hypothesis 2b: Subjective norm will have no significant effect on intention to use the ESS technology when system use is perceived to be voluntary.
Hypothesis 2c: Voluntariness will moderate the effect of subjective norm on intention to use the ESS technology.
Image Moore et al. (1991:195) define image as “the degree to which use of innovation is perceived to enhance one’s status in one’s social system”. It is the belief of a group that is important to an individual, that a certain behavior should be implemented. Once an individual implements this behavior, it can improve the quality of internal works of the organization (Pfeffer, 1982). Kelman (1958) refers to this source of social influence as identification, and separates it from compliance and internalization. According to French et al. (1959), the basis of identification is referent power, which can be obtained by performing behaviors that are consistent with group norms (Pfeffer, 1982).
According to TAM2, subjective norm will positively influence image, because if important members of a person’s social group at work believe that he should use the system, then his system usage will tend to elevate his standings within the group (Pfeffer, 1982). This raised status, which leads to increased power and influence, is the basis for greater productivity (Venkatesh et al., 2000). An individual may therefore feel that using a system will lead to improvements in his own job performance (which is the definition of perceived usefulness) indirectly due to image improvement, in addition to any performance benefits directly attributable for the system use. Therefore, TAM2 captures the effect of identification by the

Employee Self-Service Technology Acceptance: A Case Study
23
effect of subjective norm on image, combined with the effect of image on perceived usefulness. Venkatesh et al. (2000) found support for both of the following hypotheses:
Hypothesis 3a: Subjective norm will have a positive effect on image.
Hypothesis 3b: Image will have a positive effect on perceived usefulness.
4.2 Cognitive Instrumental Process
The cognitive instrumental process refers to the judgment of people regarding the perception of being useful. The key is the perception of whether the technology will be able to complete a mission. The four cognitive instrumental processes in TAM2 are the determinants of perceived usefulness; “job relevance”, “output quality”, “result demonstrability” and “perceived ease of use”.
Job Relevance Job relevance is a key component of the matching process in which a potential user judges the effects of using a particular system on his job. In TAM2, it is defined as “an individual’s perception regarding the degree to which the target system is applicable to his job” (Venkatesh et al., 2000).
In TAM2 job relevance is a perception judgment, but it doesn’t originate from the subjective norm, but directly impacts perceived usefulness. TAM2 considers that job relevance directly impacts perceived usefulness: If users clearly understand the knowledge and tools that are related to their work, implementing the system on the work will increase work efficiency. After the users believe that the technology system has satisfied the basic mission requirements, whether the technology system will do a better job and achieve the work goal shall be the next consideration (Venkatesh et al., 2000). Venkatesh et al. (2000) found that the interaction of job relevance to perceived usefulness was significant in all of their four case studies.
Hypothesis 4: Job relevance will have a positive effect on perceived usefulness of the ESS technology.
Output Quality Output quality is another determinant of perceived usefulness. It is defined as the degree to which an individual judges the effect of a new system (Venkatesh et al., 2000). In other words, it refers to an individual’s perception about how well the system performs the tasks. Venkatesh et al. (2000:192) suggest that judgments of output quality take the form of a profitability test, “in which, given a choice set containing multiple relevant systems, one would be inclined to choose a system that delivers the highest output quality”.
If users cannot obtain work performance from the technology systems related to their own work, even if it is an effective technology system, the users will not accept it. Therefore, Venkatesh et al. (2000) theorize that the result shown will impact perceived usefulness. Empirically, the relationship between perceived output quality and perceived usefulness has been shown before (Davis et al., 1992) and again in the study of Venkatesh et al. (2000).
Employee Self-Service Technology Acceptance: A Case Study
24
Hypothesis 5: Output quality will have a positive effect on perceived usefulness of the ESS technology.
Result Demonstrability Even effective systems can fail to gain user acceptance if people have difficulties connecting gains in their job performance specifically to their usage of the system. TAM2 theorizes that result demonstrability – defined by Moore et al. (1991) as the degree, to which an individual believes that the results of using a system are tangible, observable and communicable – will directly influence perceived usefulness. This implies that users will have more positive perceptions of the usefulness of a system if positive results are readily visible. In other words, if the result demonstrability of a system is low, users of the system may attribute their achievement to work behavior rather than usage of the system. Equally, if a system produces effective job-relevant results that the user desires, but does so in an unclear way, the system users are unlikely to understand how useful the system really is (Venkatesh et al., 2000). Agarwal & Prasad (1997) found a significant correlation between result demonstrability and usage intentions. Venkatesh et al. (2000) found a significant relation between result demonstrability and perceived usefulness.
Hypothesis 6: Result demonstrability will have a positive effect on perceived usefulness of the ESS technology.
Perceived Ease of Use Extensive research over the past decade provides evidence of the significant effect of perceived ease of use on usage intention, either directly or indirectly through its effect on perceived usefulness (e.g., Agarwal & Prasad, 1999; Davis et al., 1989; Hu, Chau & Sheng, 1999; Venkatesh et al., 2000; Venkatesh et al., 2003).
Firstly, in TAM2, the perceived ease of use is a direct determinant of perceived usefulness since the less effort it takes to use a system, to a greater extent it will be used. This is consistent with the definition of perceived ease of use (Davis et al., 1989). Davis (1989:334) suggests that “from a causal perspective, the regression results suggest that ease of use may be an antecedent of usefulness, rather than a parallel, direct determinant of usage”. Many previous researchers have revealed the significant effect of perceived ease of use to perceived usefulness (e.g., Taylor et al., 1995; Davis et al., 1989; Venkatesh et al., 2000). However, many other researchers find no empirical evidence to support the same relation (e.g., Hu et al., 1999; Bajaj & Nidumolu, 1998; Jackson, Chow & Leitch 1997; Subramanian, 1994). For instance Keil, Beranek and Konsynski (1995:89) conclude: “No amount of ease of use will compensate for low usefulness”.
The direct effect to intention to use suggests that perceived ease of use could be a potential facilitator to increasing the likelihood of user acceptance. Prior research has demonstrated that the direct causal pathway (i.e., ease of use – behavioral intention) is the most relevant one, and the indirect effect via perceived usefulness is somewhat less important (Davis et al., 1989; Szajna 1996). Some studies (e.g., Agarwal et al., 1997; Gefen & Keil, 1998; Lucas et al., 1999) however, found no empirical evidence to support the relation between perceived ease of use and actual use. Ruël et al. (2007) found no significant effect of ease of use to e-HRM

Employee Self-Service Technology Acceptance: A Case Study
25
effectiveness. On the contrary, Marler et al. (2009) found a significant direct effect of perceived ease of use on attitude toward using ESS technology in the pre-implementation phase. Also in this study, a positive belief about the ease of use is expected to form the basis of a favorable intention to use the ESS technology.
Hypothesis 7a: Perceived ease of use will have a positive effect on perceived usefulness of the ESS technology.
Hypothesis 7b: Perceived ease of use will have a positive effect on intention to use the ESS technology.
Perceived Usefulness Perceived usefulness is defined as “the degree to which a person believes, that using a particular system would enhance his job performance” (Davis, 1989:82). Davis (1989) describes a system high in perceived usefulness as one for which a user believes in the existence of a positive user–performance relationship: The user perceives the system to be an effective way of performing the task. There are several similar equivalent constructs in other models, such as the outcome expectation in the computer self-efficacy model and the extrinsic motivation in the motivational model. These similar concepts confirm from different angles that perceived usefulness plays an important role in forming a user’s attitude or behavioral intention.
TAM and TAM2 suggest that perceived usefulness is the strongest predictor of an individual’s intention to use an information technology (Davis, 1989; Venkatesh et al., 2000; Venkatesh et al., 2003), and therefore it has received a great deal of attention from researchers. Almost all of the prior studies that test the effects of perceived usefulness indicate, with few exceptions (e.g., Jackson et al., 1997), that it has significant influence on attitude, behavioral intention or usage.
Hypothesis 8: Perceived usefulness will be positively related to intention to use the ESS technology.
4.3 Additional Variables
In this study, three additional variables of “managerial pressure”, “perceived organizational support” and “perceived resources” are added to the TAM2 model. These variables are adapted from the theory of planned behavior.
Managerial Pressure In addition to understanding the role of subjective norm in general, it’s important to understand which references have influence on the development of these norms relative to ESS technology adoption. A range of potential referents have been studied in the IS literature, including coworkers, supervisors, IT department, close friends, top management, IT instructors and other IT specialists (e.g., Karahanna et al., 1999; Thompson, Compeau & Higgins, 2006; Venkatesh et al., 2000). Considering the target group of this study, and to find

Employee Self-Service Technology Acceptance: A Case Study
26
out practical actions that the organization can take to positively affect the ESS technology adoption, the impact of managerial pressure and individual perception of organizational support are the focus in this study.
Managerial pressure means individuals’ normative belief on their manager’s expectation regarding their behavior. It examines views about messages sent by a specific authority figure in the organization, typically the direct supervisor. Such normative beliefs should impact the individual’s perceived subjective norm because managers are an important referent, given that they have the ability to reward behaviors or punish non-behavior (Warshaw, 1980). In the ESS technology implementation context, it is assumed that managerial pressure will be a key factor in the formation of overall subjective norm about using ESS technology.
Hypothesis 9: Managerial pressure to adopt the new technology will be positively related to subjective norm.
Perceived Organizational Support In the technology acceptance literature, predictors of attitude have been mainly restricted to features of the technology itself (such as ease of use and perceived usefulness). Unlike the traditional information systems, ESS technology does not typically have a significant impact on an individual user’s job performance: Adoption of this technology mainly benefits the organization rather than the employee (Marler et al., 2005). Due to this unique aspect of ESS technology implementation, other factors that are not included in the technology acceptance models should be considered. Marler et al. (2009) suggest that organizational support may play a role in employees’ acceptance of ESS technology.
Perceived organizational support (POS) is defined as employee’s “global beliefs concerning the extent to which the organization values their contributions and cares about their well-being” (Rhoades & Eisenberger, 2002:698). A high level of POS leads employees to favor obligations and opportunities to care about the employer and to help the organization achieve its goals (Eisenberger, Armeli, Rexwinkel, Lynch & Rhoades, 2001).
When a user perceives a high level of POS, he will evaluate the adoption of ESS technology in a favorable way (e.g., Coyle–Shapiro & Conway, 2005) because it represents a reciprocal behavior that positively benefits the organization. According to Eisenberg et al. (2001) this effect of POS is particularly significant in voluntary context, such as ESS technology adoption. Marler et al. (2009) proposed in their study that POS should have a positive effect on a user’s attitude towards ESS technology use. They found no significant evidence supporting their hypothesis, but the same hypothesis is used in this study:
Hypothesis 10: Perceived organizational support will be positively related to intention to use the ESS technology.
Perceived Resources Mathieson, Peacock and Chin (2001) proposed adding another belief construct to the basic technology acceptance model. In addition to ease of use and usefulness, they added perceived resources, which is defined as the extent to which an individual believes that he has the

Employee Self-Service Technology Acceptance: A Case Study
27
personal and organizational resources needed to use an information system. It is related to similar theoretical constructs in other technology acceptance theories, such as facilitating conditions from the unified theory of acceptance and use of technology (Venkatesh et al., 2003), that has been shown to be related to technology acceptance (Marler et al., 2005).
Mathieson et al. (2001) argued that this additional concept was an important addition to TAM because it focused on perceptions of the environment in which technology was implemented and not simply features of the technology itself. They proposed that perceived resources would have a direct positive relationship with intention to use the technology because it relates to perceptions of potential barriers to use and of organizational support. Perceived barriers to use the system would delay intention to take action, and perceptions of facilitating conditions would motivate intentions to try a new technology. If users do not believe that sufficient resources such as the necessary computer equipment, documentation or help function exist, they are unlikely to even attempt to use the system.
Many studies have suggested that perceived resources affect use, either directly or through behavioral intention (Thompson et al., 1991; Taylor et al., 1995; Mathieson et al., 2001). However, many other empirical studies find the effect to be non-significant. For instance, Gallivan, Spitler & Koufaris (2003) found no evidence to support the relation between facilitating conditions (such as training) and technology usage. Venkatesh et al. (2003) explains the mixed results by suggesting that the influence of facilitating conditions on usage is moderated by age and experience of the individual. However, knowing these contingencies cannot help much in providing any meaningful guidance to implementation practices. Marler et al. (2009) tested the effect of perceived resources in the ESS technology context, and found that perceived resources and intention to use were positively related in the pre-implementation phase.
Hypothesis 11: Perceived resources will be positively related to intention to use the ESS technology.
4.4 Study Method
This study is quantitative in its nature. Quantitative research explains phenomena by collecting numerical data that are analyzed using mathematically based methods, in particular statistics (Heikkilä, 2005). In the next chapters, the construct of the questionnaire and the statistic methods used are presented.
Sample and Procedures The link to the online questionnaire in Google docs was sent out to a random sample of 150 mid-level managers in TAP Portugal on 25.7.2013 by email, which resulted to 49 replies. Reminder e-mail was sent out on 6.8.2013. In total 73 answers were received, with the overall response rate of 49%. By the time the questionnaire was sent out, the implementation process of the project had not been started and no training had been provided. The respondents had been informed about the new upcoming tool with newsletters and in different meetings, where the project and the prototypes were presented.

Employee Self-Service Technology Acceptance: A Case Study
28
Validity and Reliability Validity refers to the degree to what the researcher intended to measure, and what is actually being measured. In an internally valid study, the measures correspond to the concepts presented in the theory. External validity concerns the extent to which the (internally valid) results of a study can be held to be true for other cases, for example to different people, places or times – that is whether findings can be validly generalized. This is not the same as reliability, which is the extent to which a measurement gives results that are consistent. Validity requires that an instrument is reliable, but an instrument can be reliable without being valid. There are two components of reliability: stability and consistency. Stability is a measure of the repeatability of a test over time – it gives the same results whenever it is used. Internal consistency is the extent to which a group of items measure the same construct, as evidenced by how well they vary together or inter-correlate. It is often measured by using Cronbach’s alpha (Heikkilä, 2005).
Authors of various TAM-based models’ taxonomies have concluded the reliability and validity of TAM measurements and the relationships among their variables (Schepers & Wetzels, 2007). Also the other measures used in this study have been used and validated in previous studies, only slight adjustments were done in wording to include the name of the employee self-service system “Portal do Trabalhador”. Each variable was measured with multiple indicators, in order to provide reliability test of the measures. Some negatively worded questions were included in the questionnaire to control for response bias and to increase the validity of the scale. For analysis, these questions were reverse-coded to ensure that the higher score corresponds to a positive response. The questionnaire was reviewed by one professor and one person in the TAP organization. The Cronbach’s alpha for each variable was in an acceptable level. All in all, the validity and reliability of this study is considered good.
Statistical Methods Used The results of the questionnaire were analyzed by using the SPSS program. The statistical tests used were the following:
Cronbach’s alpha is a commonly used indicator to measure reliability. It measures the internal consistency of a test or scale. Internal consistency describes the extent to which all the items in a test measure the same concept or construct, and therefore it is connected to the inter-relatedness of the items within the test. Usually, when a variable is measured with several items, those items need to be joined in one figure. So the reliability is calculated for those items that want to be combined. Cronbach’s alpha is expressed as a number between 0 and 1. Nunnaly (1978) has indicated 0.7 to be an acceptable reliability coefficient. If the value is too low, one can consider deleting one of the items measuring a specific variable. For example, in SPSS there is a feature “Cronbach’s alpha if item deleted”, which can be helpful in determining which items to include in the final measurement of a variable. Excluding items needs to be done carefully not to lower the validity of the measure (Tavakol & Dennick, 2011).
Pearson correlation coefficient is a measure of the strength of a linear association between two variables and is denoted by r. The Pearson correlation coefficient, r, can take a range of values from +1 to -1. A value of 0 indicates that there is no association between the two variables. A value greater than 0 indicates a positive association: as the value of one variable increases, so does the value of the other variable. A value less than 0 indicates a negative association. That is, as the value of one variable increases, the value of the other variable

Employee Self-Service Technology Acceptance: A Case Study
29
decreases. Correlation doesn’t necessarily mean causation. Two variables may be related to each other, but this doesn’t mean that one variable causes the other (Heikkilä, 2005).
Regression analysis is a statistical process for estimating the relationships among variables. It includes many techniques for modeling and analyzing several variables, when the focus is on the relationship between a dependent variable and one or more independent variables. It helps to understand how the typical value of the dependent variable changes when any one of the independent variables is varied, while the other independent variables are held fixed. R2 -figure is the explanatory part of the regression model. It tells how much of the variance of the dependent variable is explained by the independent variables, and it varies between 0 and 1. The adjusted R2 is used when there is a need to compare the results of two regression analyses. It is needed, because adding more independent variables always raises the R2 value, even though new variables cannot increase the explanatory power. The adjusted R2 takes into account the amount of independent variables. T-test gives a significance level for each variable and the F-test gives the overall significance of the regression model. In multiple regressions there is a choice to include all the independent variables (Enter), even if they are not statistically significant, or include only the statistically significant ones (Stepwise). In the hierarchical regression analysis the data is inserted in levels. This can be used to explore if one or more variables moderate the effect of the other independent variables (Heikkilä, 2005).
In some cases, multiple regression result may seem paradoxical – the model may fit the data well, but none of the variables are statistically significant. Multicollinearity refers to an undesirable situation in a multiple regression model, in which two or more explanatory variables are highly linearly related, i.e., they both convey essentially the same information. When this happens, the variables are collinear and the results show multicollinearity. It can be detected with variance inflation factors (VIF) measure. If VIF for one of the variables is around or greater than 5, there is collinearity associated with that variable. In that case, removing one of these variables from the regression model should be considered (Heikkilä, 2005).
One-way ANOVA is a technique used to determine whether there are any significant differences between the means of two or more independent groups. The null hypothesis is that the averages of the groups are similar. If the null hypothesis can be rejected, there are statistically significant differences in the averages of the different groups (Heikkilä, 2005).
Measures Almost all items were measured with a seven-point Likert-type scale. The only exception was the measure for usage behavior, where the answer was given in hours and minutes. The Likert scale is one of the most popular approaches for measuring questionnaire statements, and it was utilized here to measure respondents’ level of agreement with each statement in a scale from 1 = “strongly disagree” to 7 = “strongly agree”. Options such as “not applicable”, or “I don’t know” were not provided, as the assumption was that every respondent has some kind of perception of every construct. Each question was mandatory to answer in order to complete the survey, so that no missing data would occur. In the next paragraphs the measures for each variable are explained in detail. The complete questionnaire can be found in Appendix 1/ 1.
Subjective norm was measured with two items from Morris and Venkatesh (2000). These items assess the extent to which respondents perceive that other people in the organization believe that they should use the new ESS technology. A sample item included “People who influence my behavior think that I should use the ‘Portal do Trabalhador’". A mean of these two items was used as the final measure for subjective norm, and the Cronbach’s alpha for

Employee Self-Service Technology Acceptance: A Case Study
30
this item was 0,90. A three-item scale developed by Moore et al. (1991) was used to measure voluntariness. One of the items to measure this variable was “Although it might be helpful, using the ‘Portal do Trabalhador’ is certainly not compulsory in my job.” A mean of the three items was used as the final measure for voluntariness, which had the Cronbach’s alpha value of 0,76. The measure of image was adopted from Moore et al. (1991). Three items were included in this measure, including a sample item “People in my organization who will use the ‘Portal do Trabalhador’ have a high profile”. The final measure for image was a mean of the three items, with the Cronbach’s alpha of 0,73.
The measure of job relevance was adapted from Davis et al. (1992). One of the two items included in the measure was “In my job, usage of the ‘Portal do Trabalhador’ is relevant“. A mean of the two items was used as the final measure for job relevance, which had the Cronbach’s alpha value of 0,90. The measure of output quality is adapted from Davis et al. (1992). An example of this two-item measure was “I expect the quality of the output I get from the ‘Portal do Trabalhador’ to be high”. A mean of the two items was used as the final measure, and the Cronbach’s alpha amounted to 0,93. Result demonstrability measure was adopted from Moore et al. (1991). A sample item of this four-item measure was “The results of using the ‘Portal do Trabalhador’ are clear to me”. A mean of the four items was used as the final measure for result demonstrability. The Cronbach’s alpha for this item was 0,77.
Davis (1989) built a six items measurement tool to measure perceived ease of use. It included four items, which are most commonly used in the other TAM studies. These four items are found to lead to a reasonable degree of internal consistency (Legris, Ingham & Collerette, 2003), and are therefore used in this study. A sample item included “Learning to operate the ‘Portal do Trabalhador’ will be easy for me”. A mean of the four items was used as the final measure for perceived ease of use, and the Cronbach’s alpha was 0,86. In the same study, Davis (1989) used a six-item measurement tool to measure perceived usefulness. In the further studies of perceived usefulness, four of the items have been used the most (Legris et al., 2003), and those four are chosen to this study. This measure is found to lead to and acceptable level of internal consistency. An example of the items was “Using the ‘Portal do Trabalhador’ will enhance my effectiveness in my job”. A mean of the four items was used as the final measure for perceived resources, and the Cronbach’s alpha amounted to 0,91.
Managerial pressure was measured with two items based on measure used by Taylor et al. (1995). One of the question was “I will have to use the ‘Portal do Trabalhador’ because my manager requires it”. A mean of the two items was used as the final measure for managerial pressure, and the Cronbach’s alpha was 0,73.
The short version of the Survey of Perceived Organizational Support (Eisenberger, Cummings, Armeli & Lynch, 1997) was the basis used to assess the extent to which employees perceived that the organization valued their contributions and cared about their well-being. An example of the seven items used was “Help is available from my organization when I have a problem”. When calculating the Cronbach’s alpha, the SPSS program suggested deleting question number six to increase the alpha value. Item number six ”My organization shows very little concern for me”, was a reversed question and its replies differenced a lot from the other items of the variables, so it was removed. The final measure for organization support was then composed by the mean of six remaining items, which gave the value of Cronbach’s alpha of 0,84.
The measure for perceived resources was a four-item scale based on a measure by Mathieson et al. (2001). The items are reflective items, that is, they do not identify any specific resource,

Employee Self-Service Technology Acceptance: A Case Study
31
and are at the same level of generality as TAM’s other items. A sample item included “I have access to resources I would need to use the ‘Portal do Trabalhador’ in my job”. A mean of the four items was used as the final measure, which gave the Cronbach’s alpha value of 0,85.
Intention to use the system was measured by items adapted from Davis (1989) and Davis et al. (1989). Two items were used to measure this variable, including “Assuming I have access to the ‘Portal do Trabalhador’, I intend to use it”. A mean of the two items was used as the final measure for intention to use the system, and the Cronbach’s alpha was 0,74. Finally, following Davis (1989) and Venkatesh (2000), the usage behavior was measured with the question “On average, how much time do you expect to use the ‘Portal do Trabalhador’ every week?”. The response was asked to be given in hours/minutes. Although some research suggest that self-reported usage measures are biased (e.g., Straub, Limayem & Karahanna-Evaristo, 1995), other research suggest that self-report usage measures correlate well with actual usage measures (e.g., Taylor et al., 1995).
Employee Self-Service Technology Acceptance: A Case Study
32

Employee Self-Service Technology Acceptance: A Case Study
33
5 Results
Of the 73 respondents, 31 (42,5%) were female and 42 (57,5%) were male. The age of the respondents varied between 20 and 63. Table 6 presents the minimum and maximum values, mean scores and standard deviations of the different variables. In Appendix 3/ 1 the values are separated by each question. The ratings of the variables are overall fairly high. Some notes can be seen from the table: The mean value for intention to use is very high at 6,14 (with 3,5 being the lowest rated score), remembering that the respondents have yet limited knowledge about the system and they have not been able to test it. Clearly the new portal is something that they are expecting and planning to use. The predicted usage time averages to 116 minutes per week, ranging from 0 to 480 minutes.
The high scores of output quality and ease of use might be related to the satisfaction with the previous IT-project launches (such as FlyStaff), from which they have gained experience in usability and ease of use. A slightly lower mean in perceived usefulness was expected, since the portal will not directly enhance an individual’s job productivity, performance or effectiveness. The mean for job relevance is 5, with the biggest standard deviation (1,46), suggesting that the importance and relevance of the new portal varies among the respondents. Image rates the lowest of all variables (3,61).
Table 6 - Descriptives.
Figure 8 shows the individual correlations between different variables according to the hypotheses (the correlations between all the variables can be found in Appendix 3/ 2). All relations between variables except for the managerial pressure–subjective norm, subjective norm–image and voluntariness–intention to use are statistically significant. This figure builds the basis for the analysis of the results. In the next sections, on top of the individual relationships between the variables, the TAM2 model is examined as a whole, and the effects of the variables are considered together.

Employee Self-Service Technology Acceptance: A Case Study
34
Figure 8 - Pearson Correlation Values.
5.1 Explaining Intention and Usage
According to TAM2, the variables determining the intention to use are perceived usefulness, perceived ease of use and subjective norm. Figure 9 shows the Pearson correlation values of these items.
Figure 9 - Variables Explaining Intention to Use and Their Correlations.
The individual correlations between intention to use and both perceived usefulness and perceived ease of use are statistically significant at the 0,01 level, and subjective norm is significant at the 0,05 level. Stepwise regression model was used to test the common effect of these variables as theorized in TAM2. There, the effect of subjective norm was no longer significant, and it was excluded from the model (Figure 10). A multicollinearity test (VIF) was performed to see if that would provide an explanation for the disappearing significance level of subjective norm in the TAM2 model, but there was no multicollinearity between the variables (VIF-values were lower than 5, Table 7). Based on these results, in the TAM2 model the subjective norm doesn’t have a direct effect on intention over and above what was explained by perceived usefulness and perceived ease of use. If the overall use of “Portal do Trabalhador” is considered to be voluntary, the results of the regression analysis are in accordance with the TAM models.

Employee Self-Service Technology Acceptance: A Case Study
35
Figure 10 - Explaining Intention to Use According to TAM2.
In the regression model, the strongest predictor of intention to use was ease of use, which alone had adjusted R2 value of 0,31 (F=33,05; p<0,01). Adding perceived usefulness to the model raised the adjusted R2 value of the final model to 0,38 (F=22,70; p<0,01). These two variables then explain 38% of the variance in usage intentions. Both hypotheses 7b (Perceived ease of use will have a positive effect on intention to use the ESS technology) and 8 (Perceived usefulness will be positively related to intention to use the ESS technology) are therefore supported. The results are in accordance with much previous research, although perceived usefulness tends to be a stronger determinant on intention than the perceived ease of use (Venkatesh et al., 2000).
Table 7 - Results of the Regression Analysis, Intention to Use.
TAM2 theorizes that the effect of subjective norm to usage intention differs depending if the usage is considered voluntary or mandatory. The overall score of the voluntariness in this study was 5,2. Generally speaking, the usage of “Portal do Trabalhador” can be considered voluntary. However, some respondents rated the voluntariness low. To test if there were differences regarding the usage intentions between the respondents with different view of

Employee Self-Service Technology Acceptance: A Case Study
36
voluntariness, the replies were divided into two groups: those that had the mean of the voluntariness measure at exactly or less than four were considered as mandatory, and those who had the mean above four, the usage was considered to be voluntary. Ten replies formed the first group, and the second one had 63 replies. A One-Way ANOVA test was performed to test the differences between these groups. Although the mean value of intention to use was slightly higher (6,35) in the mandatory group compared to the voluntary group (6,10), the difference between the groups was not statistically significant. Again, having the data split according to mandatory and voluntary settings, the correlation between subjective norm and intention to use was not significant in the mandatory setting, but it was significant at 0,05 level in the voluntary setting. The results are not in accordance to the expectations of hypothesis 2a, where a direct effect of subjective norm to intention to use was expected in mandatory settings.
Finally, a linear regression model was run between subjective norm and intention to use, adding a new variable “voluntariness moderator” (multiplying the centralized value of subjective norm by the centralized value of voluntariness). The new moderating value was not statistically significant, nor was the whole regression model including the new variable. No signs of the moderator role of the voluntariness lead to rejecting hypothesis 2c (Voluntariness will moderate the effect of subjective norm on intention to use the ESS technology). Even though the subjective norm individually has a positive direct effect on the intention to use in the voluntary settings, the relationship doesn’t hold in the TAM2 model. Therefore, hypothesis 2b, where no significant effect was expected, is partially supported, reflecting the results from Venkatesh et al. (2000).
To further examine the claim that intention fully mediates the effects of perceived usefulness, perceived ease of use and subjective norm on usage behavior, a hierarchical regression analysis was performed. Usage behavior was the dependent variable, perceived ease of use, usefulness and subjective norm as possible predictors, intention to use forming the second block for moderating purposes. The results show that intention fully mediated the effects of perceived usefulness, perceived ease of use and subjective norm on usage behavior, as it did in the study of Venkatesh et al. (2000).
5.2 Explaining Perceived Usefulness
To explain the effects of the TAM2 variables over perceived usefulness, Figure 11 shows the Pearson correlation values for the variables of perceived ease of use, subjective norm, image, job relevance, output quality and result demonstrability regarding perceived usefulness. The correlations are positive and statistically significant for all variables at 0,01 level, except for image, that is significant at the 0,05 level.
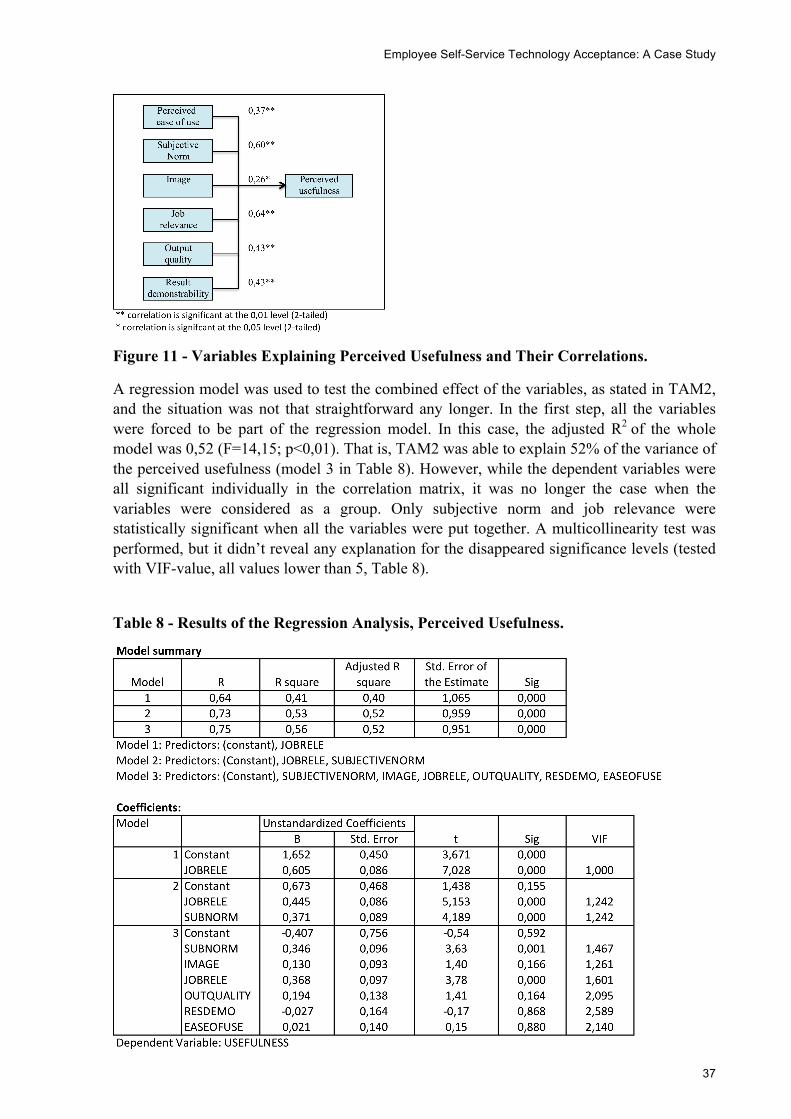
Employee Self-Service Technology Acceptance: A Case Study
37
Figure 11 - Variables Explaining Perceived Usefulness and Their Correlations.
A regression model was used to test the combined effect of the variables, as stated in TAM2, and the situation was not that straightforward any longer. In the first step, all the variables were forced to be part of the regression model. In this case, the adjusted R2 of the whole model was 0,52 (F=14,15; p<0,01). That is, TAM2 was able to explain 52% of the variance of the perceived usefulness (model 3 in Table 8). However, while the dependent variables were all significant individually in the correlation matrix, it was no longer the case when the variables were considered as a group. Only subjective norm and job relevance were statistically significant when all the variables were put together. A multicollinearity test was performed, but it didn’t reveal any explanation for the disappeared significance levels (tested with VIF-value, all values lower than 5, Table 8).
Table 8 - Results of the Regression Analysis, Perceived Usefulness.

Employee Self-Service Technology Acceptance: A Case Study
38
Next, a stepwise regression analysis was performed, and only these two variables found significant in the first model – subjective norm and job relevance – were included. The adjusted R2 of that model is 0,52 (F=39,23; p<0,01) (model 2 in Table 8), which means that adding the four additional variables of ease of use, result demonstrability, output quality and image only help to explain the variance in perceived usefulness with less than one percentage unit. These results show clear support to hypothesis 1 (Subjective norm about using the ESS technology will be positively related to perceived usefulness) and hypothesis 4 (Job relevance will have a positive effect on perceived usefulness of the ESS technology). While there was no clear evidence on the compliance mechanism (in hypothesis 2a), the effect of the other mechanism of subjective norm, internalization, was as expected.
Figure 12 - Explaining Perceived Usefulness According to TAM2.
The results show partial support for the hypothesis 3b (Image will have a positive effect on perceived usefulness), hypothesis 5 (Output quality will have a positive effect on perceived usefulness of the ESS technology), hypothesis 6 (Result demonstrability will have a positive effect on perceived usefulness of the ESS technology) and hypothesis 7a (Perceived ease of use will have a positive effect on perceived usefulness of the ESS technology). When considered individually, the relationships between image, ease of use, output quality and result demonstrability to perceived usefulness are positive and statistically significant, but when their effects are combined with other variables according to the TAM2 model, the relationships between these variables are no longer significant. Hypothesis 3a theorized that subjective norm would have a positive effect on image. The Pearson correlation between these two variables was not significant (p>0,05), leading to rejection of the hypothesis.
To further examine the assertion that perceived usefulness fully mediates the effects of the other determinants on intention, a hierarchical regression analysis was performed. Intention to use was the dependent variable, all the variables connected to perceived usefulness were set as possible predictors and perceived usefulness formed the second block for moderating purposes. The results do not fully support TAM2. It was expected that perceived usefulness would fully moderate the effects of all its determinants on usage intention, expect for the direct effect of perceived ease of use. In fact, the only significant individual predictor in the model was output quality. Therefore, no support was found for the mediating ability of perceived usefulness.

Employee Self-Service Technology Acceptance: A Case Study
39
5.3 Additional Hypothesis Testing
In addition to testing the overall fit of the hypothesized model, some specific bivariate and moderator relationships were examined, detailed in the hypothesis. Hypothesis 9 predicted a positive effect of managerial pressure to subjective norm. The Pearson correlation between the variables was not significant (p>0,05). Therefore the hypothesis 9 was rejected. Marler et al. (2009) theorized that the organizational support would moderate the effect of managerial pressure to subjective norm. This was tested with linear regression, adding a moderator value (of centralized values of managerial pressure and organizational support multiplied) to see if the effect of managerial pressure would become significant. Adding the moderator value increased the significance of managerial pressure a little bit, but even then, it was not statistically significant. No support was found that the individuals with high organizational support would be more sensitive to managerial pressure. What was noted outside the hypotheses was that the Pearson correlation between managerial pressure and both image and intention to use was positive and statistically significant (r=0,50, p<0,01 and r=0,34, p<0,01, respectively). It seems that, instead of the hypothesized effect to subjective norm, managerial pressure effects through image, or it directly influences the intention to use.
Hypothesis 11 suggested that perceived resources would be positively related to intention to use. These two items correlated positively in a statistically significant level (p<0,01). The regression analysis confirmed the result, with a very high adjusted R2 value of 0,52 (F=77,41; p<0,01), showing strong support for the hypothesis 11. Hypothesis 10 predicted that organizational support would have a direct positive effect on intention to use. The two variables correlated positively at a statistically significant level (p<0,01). Also the regression analysis showed support to the hypothesis, with the R2 of 0,19 (F=18,02; p<0,01). The final link of the TAM model explores the connection with intention to use to usage behavior. The two items correlated significantly at p<0,05 level. The adjusted R2 value in the regression analysis was 0,06 (F=4,23; p<0,05), which is in accordance to the TAM models.
Even though not hypothesized, the effect of age and gender was also tested to different variables. In their study of theory of planned behavior, Morris et al. (2000) theorized that age has a direct effect on actual system usage, attitude towards using, subjective norm and perceived behavioral control, and that age also moderates the relationships between those variables. They found support to their hypothesis: age had a negative influence on attitude, and positive effect on both subjective norm and perceived behavioral control. The correlations found in this study are quite the opposite – the only significant correlation related to age was the one with organizational support, which was negative. Gender had no statistically significant effect on any of the variables.
Finally, all the variables related directly to intention to use (subjective norm, perceived ease of use, perceived usefulness, organization support and perceived resources) were put together in one regression model. This was done to see if the variables that were added to TAM2 model would increase the amount of the explanatory power of the model. The adjusted R2 of the model was 0,50, and the model was statistically significant (F=15,53; p<0,01). Interestingly, the only significant variable in the regression model was perceived resources. Remembering that in TAM2 model, the adjusted R2 of intention to use including only subjective norm, perceived ease of use and perceived usefulness was 0,38, these results show that when considering the variables affecting the intention to use, it is important to consider also other variables, that are not directly related to the system that is implemented.
Employee Self-Service Technology Acceptance: A Case Study
40
5.4 Limitations
The study has several limitations that should be noted. First, although the response rate was relatively high (49%) the sample size is not big enough to make overall conclusions. Especially the tests related to the group that considered the system usage as mandatory should be discounted due to the small sample size. Also, all data used in the study was self-reported, and there is a possibility that the results are affected by common method variance. There is also a small concern about the language issue - the questionnaire was in English and it was sent to Portuguese employees. This concern was raised when some of the reversed questions showed clearly some exceptions in the answering patterns. One of these questions was eventually removed.
Another limitation of the study is that the data is cross-sectional and not longitudinal in nature. Moreover, the study was conducted in the pre-implementation phase, where the respondents had not yet had a possibility to test the system and all the answers about the technology itself are based on perceptions. Especially the measure of usage behavior might be somewhat arbitrary, because it’s predicting future usage. Thus, the study does not tell whether acceptance and usage are affected by expectations or vice versa. However, longitudinal data has shown that TAM variables also satisfactorily predict system usage (Venkatesh et al., 2000).

Employee Self-Service Technology Acceptance: A Case Study
41
6 Conclusions and Future Studies
Overall, the collected data fits the hypothesized model fairly well and the results shed light on how the TAM2 model fits to ESS technology concept. The additional variables used in this study also provided interesting results:
Of the individual variables, perceived ease of use was the strongest predictor of intention to use. Especially in a case where the system usage is voluntary and not directly improving the employee job performance, it is critical that the system is user friendly and easy to use to encourage the employees to use it in full scale. If the employees cannot easily find where to check or change the needed data, they might give up using the new technology and go back to the old habits, where the process is not automated.
Perceived usefulness also played a critical role in affecting an employee’s intention to use the ESS system. Managers should communicate information on the benefits of the ESS so that the employees will be better aware of the possible job performance improvements enabled by ESS technology. When employees perceive high ESS usefulness, they will have favorable intention to use the portal, and to use more functions and features of the portal, which is the key to realizing the benefits of the ESS by the organization.
In this study, the third variable predicting intention to use, subjective norm, did not have a direct effect to usage intention in the TAM model. In a voluntary usage context, where the users don’t have to comply with the managerial or organizational demands, it’s difficult to affect the individuals’ usage intentions through the opinions of the co-workers and supervisors. The results from this first part of analysis were in accordance to both the TAM models.
Of the variables predicting perceived usefulness, the strongest were subjective norm and job relevance. Those respondents who rated subjective norm high, in other words, those respondents who think that people who are important to them and who influence their behavior think that the respondent should use the new portal, found the new system more useful. Positive messages and examples from coworkers and managers can therefore increase the perception of an individual about the usefulness of the portal. Enhancing job relevance may be a bit trickier in a situation like this, when using the portal is not directly related to the job tasks. The company has to listen to the end users while planning the content of the portal and make sure that the features of the portal are important and useful to them. In the next phases of the implementation, new features can be added to the portal, which could make the usage of the portal more important and relevant to an individual’s job tasks. The final size of the portal needs to be carefully considered. There is a danger of information overkill through the HR Intranet. Without a clear and easy structure employees and line management can be afraid of spending time on exploring web-based HR tools.
Image, ease of use, output quality and result demonstrability – as individual variables – also showed to have influence on perceived usefulness. The basis of image is referent power, which can be obtained by performing behaviors that are consistent with group norms. Communication may be the key to influence an individual’s perception through coworkers and other referent groups. Ease of use doesn’t only affect the intention to use, but also the perceived usefulness. The less effort it takes to use a system, to a greater extent it will be used.

Employee Self-Service Technology Acceptance: A Case Study
42
Output quality refers to an individual’s perception about how well the system performs the tasks. Making sure that the outputs from the system are error-free and especially in the case of “Portal do Trabalhador”, which deals with delicate human resources information, the employees need to be able to trust that the data is correct and private. Result demonstrability is the degree to which an individual believes that the results of using a system are tangible, observable, and communicable. Users will have more positive perceptions of the usefulness of a system if positive results are readily visible. If the result demonstrability of a system is low, users of the system may attribute their achievement to work behavior rather than usage of the system. The company has to make sure that not only the system provides important and relevant results, but also that it does it in a clear way that the users understand how useful the system really is. Practical interventions for increasing result demonstrability, such as empirically demonstrating to users the comparative effectiveness of the new system relative to status quo may provide important leverage for increasing user acceptance.
In this study, the part of the analysis concerning perceived usefulness wasn’t completely in accordance to the TAM2 model. This might be due to the special characteristics of an ESS system – the use of the system benefits mainly the organization instead of an individual worker; they might have trouble finding the usefulness of the system regarding their own job tasks.
Apart from the TAM2 model, the study also extends the understanding of technology acceptance by examining how intention to use a new technological innovation is affected by organizational factors in addition to individual’s perceptions about characteristics of the innovation. The results of the study suggest that, in the context of ESS technology, organizational and normative factors should be considered in addition to attitudes in predicting intentions to use ESS technology.
Two variables that were thought to have a direct effect on intention to use were added to the study framework that was based on TAM2. These two variables were perceived organizational support and perceived resources. Both of these variables seem to be important predictors of the intention to use. Those respondents that stated higher organizational support also reported higher scores on intention to use. Another interesting finding of the study outside the hypotheses was that age and organizational support had a significant negative correlation with each other. The organization has to make sure that the employees feel that the organization supports them and cares about their well-being. They will in return be more open and willing to use a system that benefits the organization more than it does an individual worker.
It is important to note the very strong influence of the perceived resources to intention to use. Resources are not only physical resources, like a computer/smartphone in this case to access the portal, but also knowledge. The end users must be trained to use the system and they must be aware about all they can do with the portal to maximize the benefits of the new system. Since the usage of the system is mainly voluntary, the barriers to use the system must remain very low and easy access should be granted to all workers, otherwise they might find it easier to stick to the old routines and let the HR department do the job.
The results of this study open some interesting opportunities for future studies. For example, in this study the usage of the system can be considered voluntary. Since the previous studies about subjective norm have led to conflicting results, an interesting possibility for future research would be to study the ESS system in a mandatory setting (e.g., when the option of

Employee Self-Service Technology Acceptance: A Case Study
43
dealing with HR personally would not be an option any longer), and to compare the results with the ones from a voluntary one.
Future studies should also seek to further extend models of technology acceptance to involve other important theoretical constructs such as learning and training and changing social environments. This study was done in a rather hierarchical organization. The continuing trend in organizations is to get away from the hierarchical, command-and-control structures toward networks of empowered, autonomous teams. This could provide a very interesting context to test the technology acceptance models and the organizational and normative factors, when the adoption decision becomes more team, rather than individual level decision.
In studying the acceptance and use of a new technology, it is important to examine the phenomena over time in order to understand how increasing user experience with the specific system software influences usage patterns. Theoretically, in the earliest stages of technology introduction, users are making an “acceptance” decision. However, initial acceptance decisions have been shown to be systematically different from long-term “usage” decisions (Davis et al., 1989). TAM2 contains “experience” as a moderating variable. Due to limitations of time and the postponement of the “Portal do Trabalhador” launch, in this case it was not possible to conduct a post-implementation study to compare the results with the pre-implementation phase. It would be interesting to know how the individuals working at TAP finally accept the new portal, and to compare the amount of the real usage and the factors affecting it with the results of this study.
In this study, the questionnaire was sent to mid-level management, because they were aware of the new portal. Although in the first phase of the project the features of the portal are mainly related to the employee self-service perspective, some of the respondents might have thought of the manager self-service features already. Therefore, once the project is further and all the employees are aware of it, it would be interesting to replicate the study with a different target group and see if the individual’s position in the organization influences the perceptions of the new system. For example, the results of the effect of the managerial pressure could be different with another target group. Also the perceived usefulness of the system could provide different results, when the respondent would only have access to the employee part of the portal, and not the additional features available for managers.
Finally, it is important that employees’ and line managers’ mindsets will change: they have to realize and accept the usefulness of the ESS system. The results of the study might provide some ideas to the organization how to accomplish that task and enhance the individual acceptance of the new portal, leading to frequent and wide use of the “Portal do Trabalhador”.

Employee Self-Service Technology Acceptance: A Case Study
44

Employee Self-Service Technology Acceptance: A Case Study
45
REFERENCES
Adams, D. A., Nelson, R. R. & Todd, P. A. (1992). Perceived Usefulness, Ease of Use, and Usage of Information Technology: A Replication. MIS Quarterly, 16(2), 227–247.
Agarwal, R. & Prasad, J. (1997). The Role of Innovation Characteristics and Perceived Voluntariness in the Acceptance of Information Technologies. Decision Sciences, 28(3), 557–582.
Agarwal, R. & Prasad, J. (1999). Are Individual Differences Germane to the Acceptance of New Information Technologies? Decision Sciences, 30(2), 361–391.
Ajzen, I. (1991). The Theory of Planned Behavior. Organizational Behavior and Human Decision Processes, 50(2), 179–211.
Ajzen, I. & Fishbein, M. (1980). Understanding Attitudes and Predicting Social Behavior. Upper Saddle River, NJ: Prentice Hall.
Bajaj, A. & Nidumolu, S. R. (1998). A Feedback Model to Understand Information System Usage. Information & Management, 33(4), 213–224.
Beach, L. R. & Mitchell, T. R. (1996). Image Theory, the Unifying Perspective. In L. R. Beach (Ed.), Decision Making in the Workplace: A Unified Perspective. Mahwah, NJ: Erlbaum, 1–20.
Beach, L. R. & Mitchell, T. R. (1998). The Basics of Image Theory. In L. R. Beach (Ed.), Image Theory: Theoretical and Empirical Foundations. Mahwah, NJ: Erlbaum, 3–18.
Bhattacherjee, A. (2001). Understanding Information Systems Continuance: An Expectation–Confirmation Model. MIS Quarterly, 25(3), 351–370.
Bobbitt, M. & Dabholkar, P. (2001). Integrating Attitudinal Theories to Understand and Predict Use of Technology-Based Self Service. International Journal of Service Industry Management, 12, 423–450.
Bondarouk, T. V. & Ruël, H. J. M. (2009). Electronic Human Resource Management: Challenges in the Digital Era. The International Journal of Human Resource Management, 20(3), 505–514.
Brown, D. (2002). eHR -Victim of Unrealistic Expectations. Canadian HR Reporter, 15(16): 1, 6.
Bussler, L. & Davis, E. (2001). Information Systems: The Quiet Revolution in Human Resource Management. Journal of Computer Information Systems, 42(2), 17–20.
CedarCrestone (2007). HR Systems Survey: HR Technologies, Service Delivery Approaches, and Metrics. 10th Annual Edition.
CedarCrestone (2012). HR Systems Survey: HR Technologies, Deployment Approaches, Value and Metrics. 14th Annual Edition.
Cheung, W., Chang, M. K. & Lai, V. S. (2000). Prediction of Internet and World Wide Web Usage at Work: A Test of an Extended Triandis Model. Decision Support Systems, 30(1), 83–100.
Compeau, D. R. & Higgins, C. A. (1995). Computer Self-Efficacy: Development of a Measure and Initial Test. MIS Quarterly, 19(2), 189–211.

Employee Self-Service Technology Acceptance: A Case Study
46
Compeau, D., Higgins, C. A. & Huff, S. (1999). Social Cognitive Theory and Individual Reactions to Computing Technology: A Longitudinal Study. MIS Quarterly, 23(2), 145–158.
Coyle–Shapiro, J. A. & Conway, N. (2005). Exchange Relationships: Examining Psychological Contracts and Perceived Organizational Support. Journal of Applied Psychology, 90(4), 774.
Davis, F. D. (1989). Perceived Usefulness, Perceived Ease of Use and User Acceptance of Information Technology. MIS Quarterly, 13(3), 319–340.
Davis, F. D., Bagozzi, R. P. & Warshaw, P. R. (1989). User Acceptance of Computer Technology: A Comparison of Two Theoretical Models. Management Science, 35(8), 982–1003.
Davis, F. D., Bagozzi, R. P. & Warshaw, P. R. (1992). Extrinsic and Intrinsic Motivation to Use Computers in the Workplace. Journal of Applied Social Psychology, 22(14), 1111–1132.
Devaraj, S. & Kohli, R. (2003). Performance Impacts of Information Technology: Is Actual Usage the Missing Link? Management Science, 49(3), 273–289.
Eagly, A. H. & Chaiken, S. (1993). The Psychology of Attitudes. Fort Worth, TX: Harcourt Brace Jovanovich.
Eisenberger, R., Cummings, J., Armeli, S. & Lynch, P. (1997). Perceived Organizational Support, Discretionary Treatment and Job Satisfaction. Journal of Applied Psychology, 82(5), 812.
Eisenberger, R., Armeli, S., Rexwinkel, B., Lynch, P. D. & Rhoades, L. (2001). Reciprocation of Perceived Organizational Support. Journal of Applied Psychology, 86(1), 42.
Ensher, E. A., Nielson, T. R. & Grant-Vallone, E. (2003). Tales From the Hiring Line: Effects of the Internet and Technology on HR Processes. Organizational Dynamics, 31(3), 224–244.
Fishbein, M. & Ajzen, I. (1975). Belief, Attitude, Intention and Behavior: An Introduction to Theory and Research. Reading, MA: Addison-Wesley.
Florkowski, G. W. & Olivas-Luján, M. R. (2006). The Diffusion of Human-Resource Information-Technology Innovations in US and Non-US Firms. Personnel Review, 35(6), 684–710.
French, J. R. P. & Raven, B. (1959). The Bases of Social Power. In D. Cartwright (Ed.), Studies of Social Power. Ann Arbor, MI: University of Michigan, Institute for Social Research, 150–167.
Gallivan, M. J., Spitler, V. K. & Koufaris, M. (2003). Does Information Technology Training Really Matter? A Social Information Processing Analysis of Coworkers' Influence on IT Usage in the Workplace. Journal of Management Information Systems, 22(1), 153–192.
Gardner, S. D., Lepak, D. P. & Bartol, K. M. (2003). Virtual HR: the Impact of Information Technology on the Human Resource Professional. Journal of Vocational Behavior, 63(2), 159–179.
Gefen, D. & Keil, M. (1998). The Impact of Developer Responsiveness on Perceptions of Usefulness and Ease of Use: An Extension of the Technology Acceptance Model. The DATA BASE for Advances in Information Systems, 29(2), 35–49.
Hartwick, J. & Barki, H. (1994). Explaining the Role of User Participation in Information System Use. Management Science, 40(4), 440–465.

Employee Self-Service Technology Acceptance: A Case Study
47
Hawking, P., Stein, A. & Foster, S. (2004). e-HR and Employee Self Service: A Case Study of a Victorian Public Sector Organisation. Journal of Issues in Informing Science and Information Technology, 1, 1019–1026.
Heikkilä, T. (2005). Tilastollinen Tutkimus. 5.–6. Edition. Edita, Helsinki.
Hendrickson, A.R. (2003). Human Resource Information Systems: Backbone Technology of Contemporary Human Resources. Journal of Labor Research, 24(3), 381–394.
Hill, T., Smith, N. D. & Mann, M. F. (1987). Role of Efficacy Expectations in Predicting the Decision to Use Advanced Technologies: The Case of Computers. Journal of Applied Psychology, 72, 302–313.
Hu, P. J., Chau, P. Y., Sheng, O. R. L. & Tam, K. Y. (1999). Examining the Technology Acceptance Model Using Physician Acceptance of Telemedicine Technology. Journal of Management Information Systems, 16(2), 91–112.
Huang, J. & Martin-Taylor, M. (2013). Turnaround User Acceptance in the Context of HR Self-Service Technology Adoption: An Action Research Approach. The International Journal of Human Resource Management, 24(3), 621–642.
The Hunter Group, (2001). 2000 Human Resources Self-Service Survey. In: A. Doran (Ed.), E-Work architect: How HR Leads the Way Using the Internet. Austin: Rector Duncan & Associates, Inc. 135–154.
Igbaria, M., Zinatelli, N., Cragg, P., & Cavaye, A. L. (1997). Personal Computing Acceptance Factors in Small Firms: A Structural Equation Model. MIS Quarterly, 21(3), 279–305.
Jackson, C.M., Chow, S. & Leitch, R.A. (1997). Toward an Understanding of the Behavioral Intention to Use an Information System. Decision Sciences, 28(2), 357–389.
Johnson, M. P., Zheng, K. & Padman, R. (2012). Modeling the Longitudinality of User Acceptance of Technology with an Evidence-Adaptive Clinical Decision Support System. Decision Support Systems.
Karahanna, E., Straub, D. W. & Chervany, N. L. (1999). Information Technology Adoption Across Time: A Cross-Sectional Comparison of Pre-Adoption and Post-Adoption Beliefs. MIS Quarterly, 23(2), 183–213.
Keebler, T. (2001). HR Outsourcing in the Internet Era. In A.J. Walker (Ed.), Web-Based Human Resources: The Technologies and Trends That Are Transforming HR. New York: McGraw-Hill. 259–277.
Keil, M., Beranek, P. M. & Konsynski, B. R. (1995). Usefulness and Ease of Use: Field Study Evidence Regarding Task Considerations. Decision Support Systems, 13(1), 75–91.
Kelman, H. C. (1958). Compliance, Identification, and Internalization: Three Processes of Attitude Change. The Journal of Conflict Resolution, 2(1), 51–60.
Kelman, H. C. (1961). Processes of Opinion Change. Public Opinion Quarterly, 25(1), 57–78.
Konradt, U., Christophersen, T. & Schaeffer-Kuelz, U. (2006). Predicting User Satisfaction, Strain and System Usage of Employee Self-Services. International Journal of Human-Computer Studies, 64(11), 1141–1153.
Koopman, G. & Batenburg, R. (2009). Early User Involvement and Participation in Employee Self-Service Application Deployment: Theory and Evidence from Four Dutch
Employee Self-Service Technology Acceptance: A Case Study
48
Governmental Cases. In: T.V. Bondarouk; H.J.M. Ruël; E. Oiry; K. Guiderdoni-Jourdan (Eds.). Handbook of Research on E-Transformation and Human Resources Management Technologies: Organizational Outcomes and Challenges. Hershey: IGI Publishers. 56–77.
Lee, Y., Kozar, K. A. & Larsen, K. R. (2003). The Technology Acceptance Model: Past, Present, and Future. Communications of the Association for Information Systems, 12(1), 50.
Legris, P., Ingham, J. & Collerette, P. (2003). Why do People Use Information Technology? A Critical Review of the Technology Acceptance Model. Information & Management, 40(3), 191–204.
Lengnick-Hall, M. L. & Moritz, S. (2003). The Impact of e-HR on the Human Resource Management Function. Journal of Labor Research, 24(3), 365–379.
Lepak, D. P. & Snell, S. A. (1998). Virtual HR: Strategic Human Resource Management in the 21st Century. Human Resource Management Review, 8(3), 215–234.
Lucas, H. C. & Spitler, V. K. (1999). Technology Use and Performance: A Field Study of Broker Workstations. Decision Sciences, 30(2), 291–311.
Marler, J., Fisher, S. & Ke, W. (2009) Employee Self-Service Technology Acceptance: A Comparison of Pre-Adoption and Post-Adoption Relationships. Personnel Psychology, 62(2), 327–358.
Marler, J. H. & Dulebohn, J. H. (2005). A Model of Employee Self-Service Technology Acceptance. Research in Personnel and Human Resources Management, 24, 137–180.
Marnewick, C. & Labuschagne, L. (2005). A Conceptual Model for Enterprise Resource Planning (ERP). Information Management & Computer Security, 13(2), 144–155.
Mathieson, K. (1991). Predicting User Intentions: Comparing the Technology Acceptance Model with the Theory of Planned Behavior. Information Systems Research, 2(3), 173–191.
Mathieson, K., Peacock, E., & Chin, W. W. (2001). Extending the Technology Acceptance Model: The Influence of Perceived User Resources. ACM SIGMIS Database, 32(3), 86–112.
Miniard, P.W. & Cohen, J.B. (1979). Isolating Attitudinal and Normative Influences in Behavioral Intention Models. Journal of Marketing Research, 16, 102–110.
Moore, G. C. & Benbasat, I. (1991). Development of an Instrument to Measure the Perceptions of Adopting an Information Technology Innovation. Information Systems Research, 2(3), 192–222.
Morris, M. G. & Venkatesh, V. (2000). Age Differences in Technology Adoption Decisions: Implications for a Changing Work Force. Personnel Psychology, 53(2), 375–403.
Nunnaly, J. (1978). Psychometric Theory. New York: McGraw-Hill.
Ostermann, H., Staudinger, B. & Staudinger, R. (2009). Benchmarking Human Resource Information Systems. Encyclopedia of Human Resources Information Systems: Challenges in E-HRM, 92–101.
Panayotopoulou, L., Vakola, M. & Galanaki, E. (2007). E-HR Adoption and the Role of HRM: Evidence from Greece. Personnel Review, 36(2), 277–294.
Pfeffer, J. (1982). Organizations and Organization Theory. Marshfield, MA, Pitman.
Rhoades, L. & Eisenberger, R. (2002). Perceived Organizational Support: A Review of the Literature. Journal of Applied Psychology, 87(4), 698.

Employee Self-Service Technology Acceptance: A Case Study
49
Rogers, E. M. (2003). Diffusion of Innovations (5th ed.). New York: Free Press.
Ruël, H., Bondarouk, T. & Looise, J. K. (2004). e-HRM: Innovation or Irritation: An Explorative Empirical Study in Five Large Companies on Web-Based HRM. Management Revue, 15(3), 364–380.
Ruël, H. J., Bondarouk, T. V. & Van der Velde, M. (2007). The Contribution of e-HRM to HRM Effectiveness: Results from a Quantitative Study in a Dutch Ministry. Employee Relations, 29(3), 280–291.
Ruta, C. D. (2005). The Application of Change Management Theory to HR Portal Implementation in Subsidiaries of Multinational Corporations. Human Resource Management, 44(1), 35–53.
Schepers, J. & Wetzels, M. (2007). A Meta-Analysis of the Technology Acceptance Model: Investigating Subjective Norm and Moderation Effects. Information & Management, 44(1), 90–103.
Shrivastava, S. & Shaw, J. B. (2003). Liberating HR Through Technology. Human Resource Management, 42(3), 201–222.
Snell, S., Stueber, D. & Lepak, D. (2002). Virtual HR Departments: Getting Out of the Middle. In R. L. Heneman & D. B. Greenberger (Eds.), Human Resource Management in Virtual Organizations. Greenwich, CT: Information Age Publishing. 81–101.
The Standish Group, (2013). The Chaos Manifesto. Think Big, Act Small. Accessed June 2013: http://versionone.com/assets/img/files/ChaosManifesto2013.pdf
Stone, D. L. & Lukaszewski, K. M. (2009). An Expanded Model of the Factors Affecting the Acceptance and Effectiveness of Electronic Human Resource Management Systems. Human Resource Management Review, 19(2), 134–143.
Straub, D., Limayem, M. & Karahanna-Evaristo, E. (1995). Measuring System Usage: Implications for IS Theory Testing. Management Science, 41(8), 1328–1342.
Strohmeier, S. (2007). Research in e-HRM: Review and Implications. Human Resource Management Review, 17(1), 19–37.
Strohmeier, S. (2009). Concepts of e-HRM Consequences: A Categorisation, Review and Suggestion. The International Journal of Human Resource Management, 20(3), 528–543.
Subramanian, G. H. (1994). A Replication of Perceived Usefulness and Perceived Ease of Use Measurement. Decision Sciences, 25(5–6), 863–874.
Szajna, B. (1996). Empirical Evaluation of the Revised Technology Acceptance Model. Management Science, 42(1), 85–92.
TAP Portugal Annual Report 2012. http://www.tapportugal.com/Info/en/ABOUTTAP/TAPGroup/AnnualReport
Tavakol, M. & Dennick, R. (2011). Making Sense of Cronbach's Alpha. International Journal of Medical Education, 2, 53–55.
Taylor, S. & Todd, P. A. (1995). Understanding Information Technology Usage: A Test of Competing Models. Information Systems Research, 6(2), 144–176.
Thompson, R. L., Higgins, C. A. & Howell, J. M. (1991). Personal Computing: Toward a Conceptual Model of Utilization. MIS Quarterly, 15(1), 125–143.

Employee Self-Service Technology Acceptance: A Case Study
50
Thompson, R., Compeau, D. & Higgins, C. (2006). Intentions to Use Information Technologies: An Integrative Model. Journal of Organizational and End User Computing (JOEUC), 18(3), 25–46.
Vallacher, R. R. & Wegner, D. M. (1987). What Do People Think They're Doing? Action Identification and Human Behavior. Psychological Review, 94(1), 3–15.
Venkatesh, V. (2000). Determinants of Perceived Ease of Use: Integrating Control, Intrinsic Motivation, and Emotion into the Technology Acceptance Model. Information Systems Research, 11(4), 342–365.
Venkatesh, V. & Davis, F. D. (1996). A Model of the Antecedents of Perceived Ease of Use: Development and Test. Decision Sciences, 27(3), 451–481.
Venkatesh, V. & Davis, F. D. (2000). A Theoretical Extension of the Technology Acceptance Model: Four Longitudinal Field Studies. Management Science, 46(2), 186–204.
Venkatesh, V., Morris, M. G., Davis, G. B. & Davis, F. D. (2003). User Acceptance of Information Technology: Toward a Unified View. MIS Quarterly, 27(3), 425–478.
Venkatesh, V. & Bala, H. (2008). Technology Acceptance Model 3 and a Research Agenda on Interventions. Decision Sciences, 39(2), 273–315.
Vroom, V. (1964). Work and Motivation. New York, NY: Wiley.
Walker, A. J. (2001). How the Web and Other Key Trends Are Changing Human Resources. Web-Based Human Resources: The Technologies and Trends That Are Transforming the HR Function. New York: R. R. Donnelley & Sons. 13–28.
Warshaw, P. R. (1980). A New Model for Predicting Behavioral Intentions: An Alternative to Fishbein. Journal of Marketing Research, 17,153–172.
Wright, P.M. & Dyer, L. (2000). People in e-Business: New Challenges, New Solutions. Ithaca NY: CAHRS Working Paper Series, Cornell University.
Zampetti, R. & Adamson, L. (2001). Web-Based Employee Self-Service: A Win-Win Proposition for Organizations and Employees. In Walker, A. (Eds.), Web-Based Human Resources, McGraw-Hill, New York, NY. 15–23.
Zhang J. J. (2005). The Importance of Affective Quality. Communications of the ACM, 48(9), 105–108.
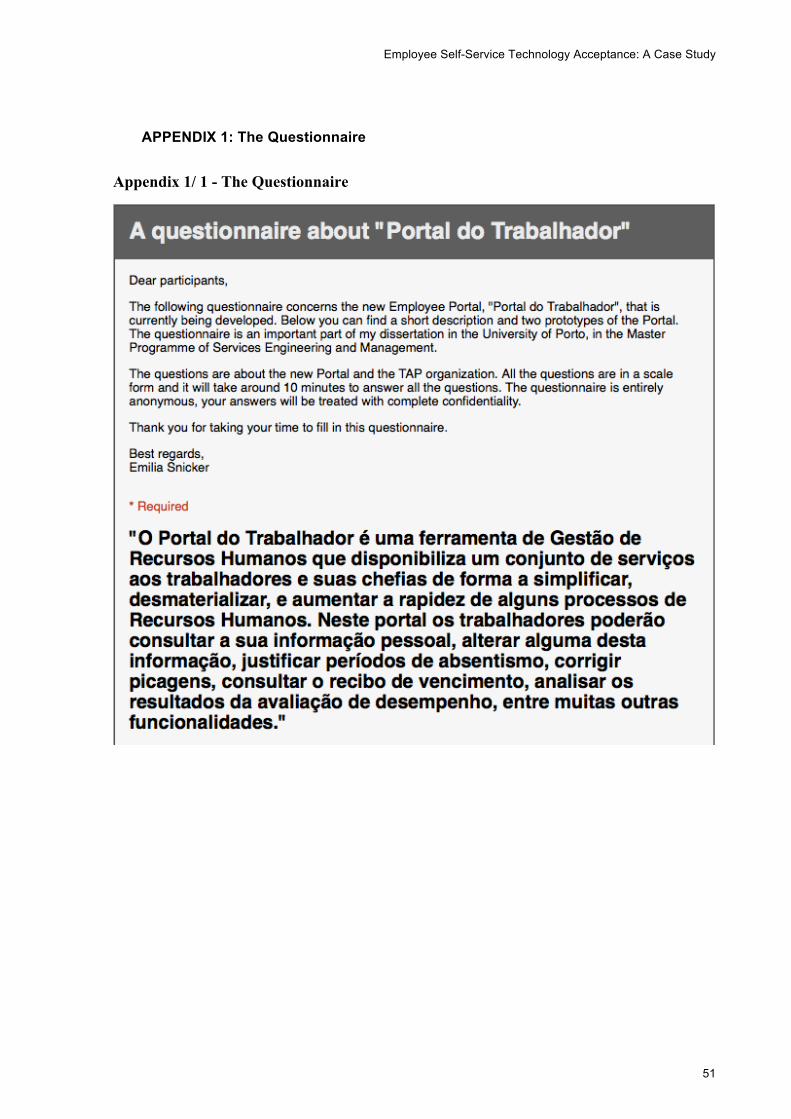
Employee Self-Service Technology Acceptance: A Case Study
51
APPENDIX 1: The Questionnaire
Appendix 1/ 1 - The Questionnaire

Employee Self-Service Technology Acceptance: A Case Study
52

Employee Self-Service Technology Acceptance: A Case Study
53

Employee Self-Service Technology Acceptance: A Case Study
54

Employee Self-Service Technology Acceptance: A Case Study
55

Employee Self-Service Technology Acceptance: A Case Study
56

Employee Self-Service Technology Acceptance: A Case Study
57
APPENDIX 2: “Portal do Trabalhador” project details
Appendix 2/ 1 - Mockup of the TAP Campus Homepage

Employee Self-Service Technology Acceptance: A Case Study
58
Appendix 2/ 2 - Interoperability of the Solution
Appendix 2/ 3 - Technical Infrastructure

Employee Self-Service Technology Acceptance: A Case Study
59
Appendix 2/ 4 – Project Implementation Schedule

Employee Self-Service Technology Acceptance: A Case Study
60
APPENDIX 3: Statistical details
Appendix 3/ 1 - Descriptives by Each Question

Employee Self-Service Technology Acceptance: A Case Study
61
Appendix 3/ 2 -‐ Correlations Between All the Variables