employee engagement survey - charlotte-mecklenburg · pdf fileengagement is the sense ......
TRANSCRIPT

Employee Engagement Survey
Charlotte-Mecklenburg Schools October 8-25, 2012

Overview Engagement is the sense of connection that individuals have with their profession in
general and with their current jobs in particular. Several factors have an impact on
staff members’ level of engagement. Aspects of the working environment such as
relationships with school administration, colleagues, students, and parents; the
physical work conditions; shared values; policy considerations and implementation;
support for personal development and growth; prior preparation; perceptions of
personal relevance; and satisfaction all impact engagement.
This study was conducted to accomplish three goals:
1. Measure the level of engagement among all CMS employees.
2. Identify groups of employees who are less engaged.
3. Identify areas where engagement can be improved.
With this information we hope to improve conditions so that all staff at
CMS are fully engaged in their profession. Fully engaged staff are key to improving
overall productivity and improve the quality of education and services provided by CMS
to students, parents and staff. Because more engaged individuals likely completed the
survey, these data may overestimate engagement among employees district-wide.
2

Study Design The survey was designed with input from nearly 200 CMS employees during two-days of focus groups. The
focus groups were designed to have representation from every CMS school, department, and job category.
All employees of CMS were invited to complete the engagement survey. A likert-type scale was used for
survey items. The scale range was 1 = Strongly Disagree to 5 = Strongly Agree. The survey consisted of
three parts:
Engagement Scale was comprised of eight items that were specifically designed to measure each
staff members’ level of engagement. Based on the average of these questions, an “Engagement
Score” was computed for each respondent. Scores were classified: Not Engaged (less than 3.5),
Engaged (3.5 to 4.5), and Highly Engaged (4.5 to 5.0).
Several factors influence engagement. The survey included 7 categories of items that were
designed to measure a range of factors that influence employee engagement. Many of these items
were generated as a result of 10 employee focus groups held in September.
• Shared Values
• Leadership
• Communication
• Feedback and Recognition
• Work Environment
• Career Growth and Training Opportunities
• Quality Service
Respondent background items included work location, position, job classification, race/ethnicity as
well as gender. 3
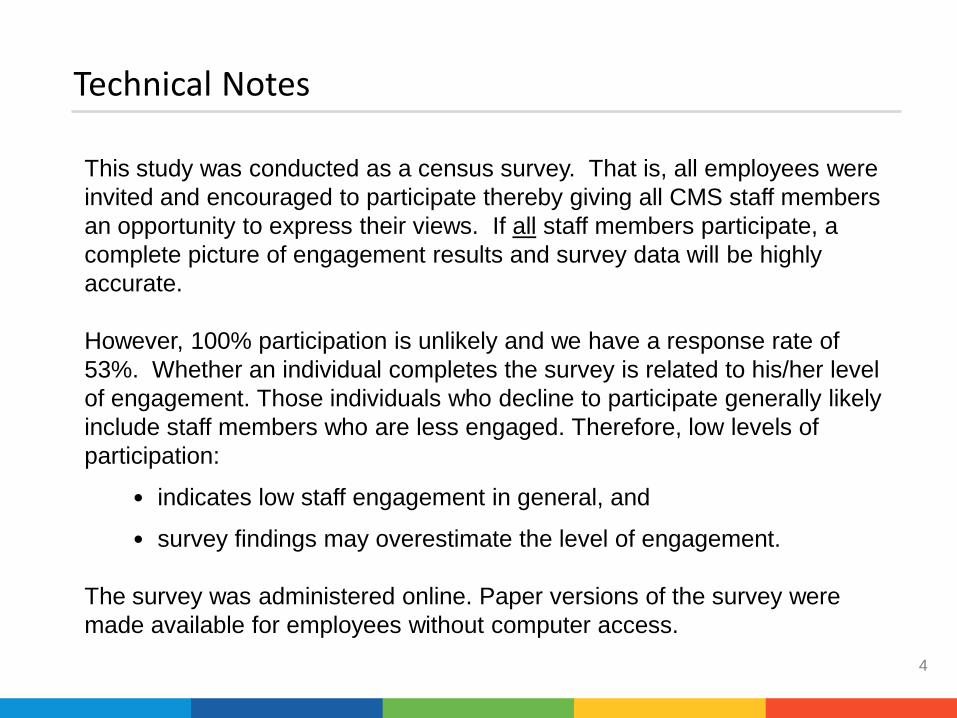
Technical Notes
This study was conducted as a census survey. That is, all employees were
invited and encouraged to participate thereby giving all CMS staff members
an opportunity to express their views. If all staff members participate, a
complete picture of engagement results and survey data will be highly
accurate.
However, 100% participation is unlikely and we have a response rate of
53%. Whether an individual completes the survey is related to his/her level
of engagement. Those individuals who decline to participate generally likely
include staff members who are less engaged. Therefore, low levels of
participation:
• indicates low staff engagement in general, and
• survey findings may overestimate the level of engagement.
The survey was administered online. Paper versions of the survey were
made available for employees without computer access.
4

Participation Rate
Out of the 17,422 delivered email invitations and the option to complete a paper survey, 9,003 staff members completed the survey to provide an overall completion rate of 52%. There were 243 incomplete responses. The overall participation rate was 53% based on all 9,236 survey participants .
5
6
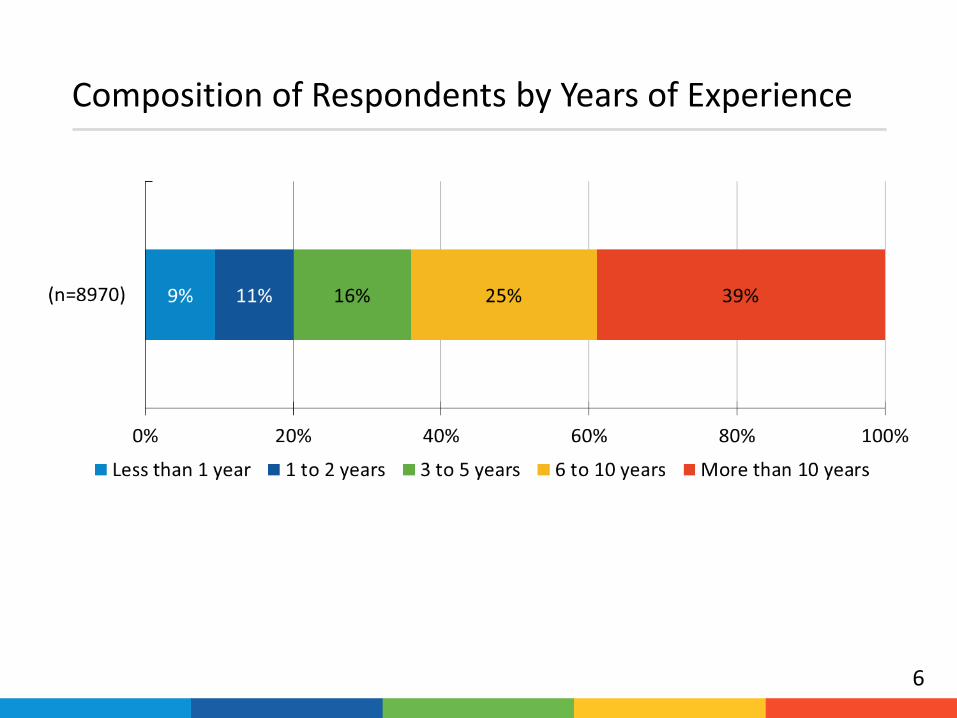
Composition of Respondents by Years of Experience
7
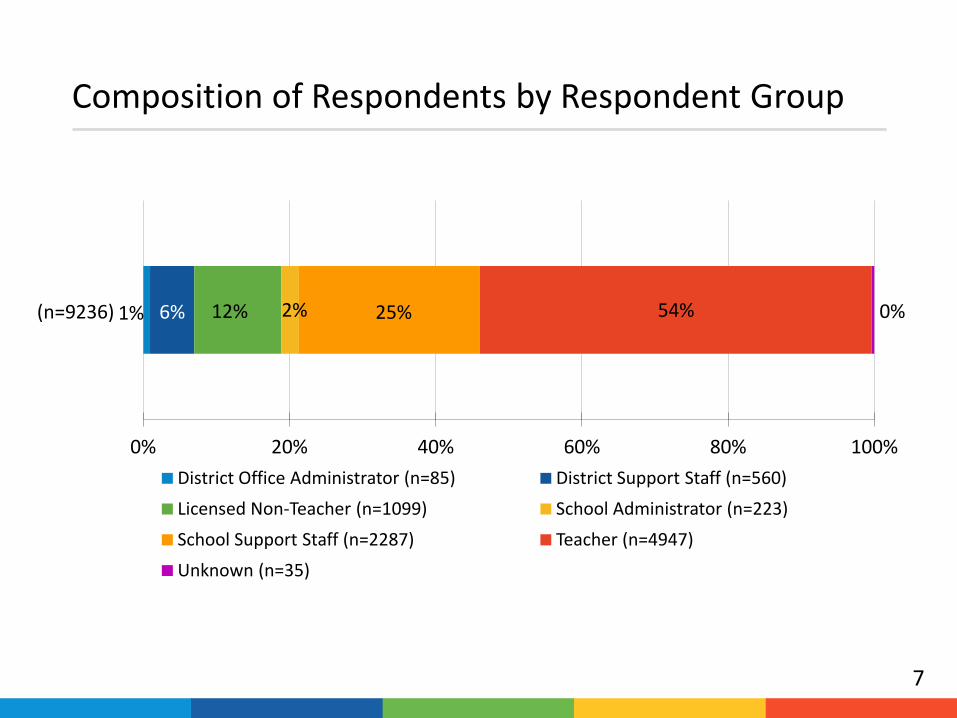
Composition of Respondents by Respondent Group
1% 6% 12% 2% 25% 54% 0%
0% 20% 40% 60% 80% 100%
(n=9236)
District Office Administrator (n=85) District Support Staff (n=560)
Licensed Non-Teacher (n=1099) School Administrator (n=223)
School Support Staff (n=2287) Teacher (n=4947)
Unknown (n=35)

Participation Rate by Respondent Group Total
8

Composition of Respondents by Classification
9

Composition of Respondents by Ethnicity/Race
10
1% 29% 3% 3% 64%
0% 20% 40% 60% 80% 100%
(n=9210)
Asian Black Hispanic Multi-Racial White


Overall Engagement
Ratings on the eight engagement scale items were averaged to provide an engagement score for each respondent. Scores were classified according to three levels: Not Engaged (less than 3.5), Engaged (3.5 to 4.5), and Highly Engaged (4.5 to 5.0). Most individuals scored either highly engaged (29%) or engaged (47%). While 24% (n=2230) of respondents registered as not engaged. The median engagement score was 4.0 and ranged from 1.0 to 5.0.
14
29% 47% 24%
0% 20% 40% 60% 80% 100%
All Respondents (n=9236)
Highly Engaged (n=2663) Engaged (n=4343) Not Engaged (n=2230)

Engagement Items
15
25%
32%
43%
39%
48%
30%
20%
42%
46%
46%
43%
45%
31%
34%
36%
31%
19%
13%
6%
8%
8%
14%
19%
12%
8%
7%
6%
5%
9%
15%
17%
8%
2%
2%
1%
1%
3%
6%
8%
6%
0% 20% 40% 60% 80% 100%
I am proud to work for CMS.
Working for a public school system gives me a feeling of accomplishment.
I am satisfied with the work that I do.
My current duties and work assignments are interesting.
I am motivated to contribute more than what is expected of me.
I am hopeful of my professional growth and long-term career opportunities at CMS.
I would feel comfortable referring a good friend to work for CMS.
I enjoy working for my principal or direct supervisor.
Strongly Agree Agree Neither Disagree nor Agree Disagree Strongly Disagree
3.9
4.0
4.2
4.2
4.1
3.7
3.4
4.0


Factors that Influence Engagement
*Response Options: 1 = Strongly Disagree; 2 = Disagree; 3 = Neither Disagree nor Agree; 4 = Agree; 5 = Strongly Agree and “Not Applicable” Not Applicable responses were excluded from all calculations
17
0.54
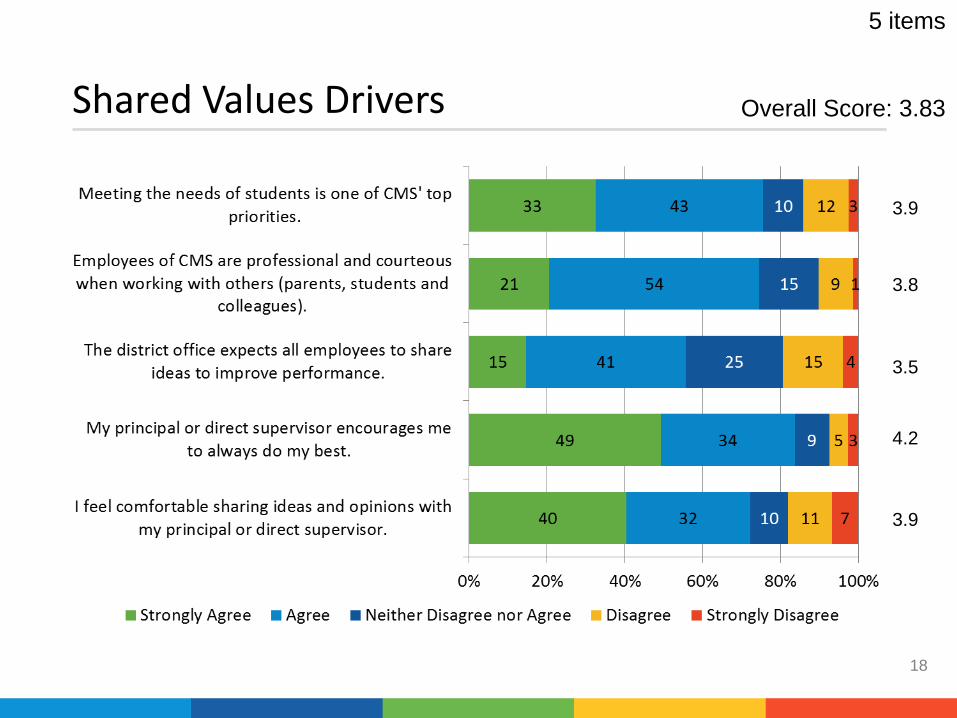
Shared Values Drivers
18
5 items
3.9
3.8
3.5
4.2
3.9
Overall Score: 3.83

Leadership Drivers
19
9 items
3.9
3.1
3.0
2.7
3.8
3.8
3.9
3.8
4.0
Overall Score: 3.51

Communication Drivers
20
9 items
3.2
2.8
2.8
3.0
4.0
3.9
3.9
3.5
3.3
Overall Score: 3.34
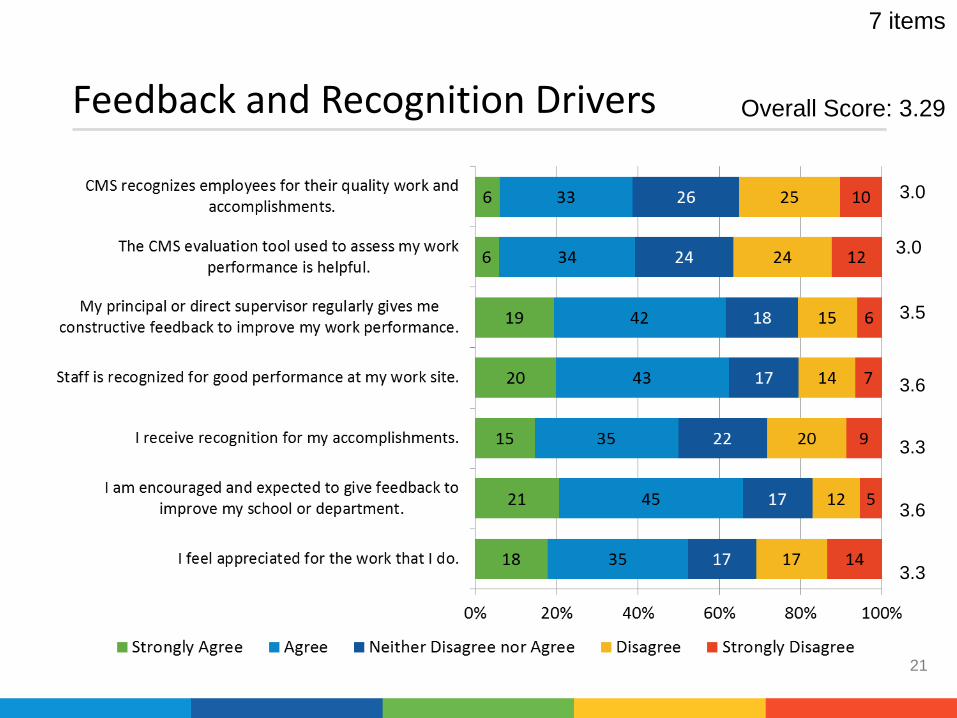
Feedback and Recognition Drivers
21
7 items
3.0
3.0
3.5
3.6
3.3
3.6
3.3
Overall Score: 3.29

Work Environment Drivers
22
6 items
4.0
4.0
4.1
3.8
3.5
3.6
Overall Score: 3.80

Career Growth and Training Opportunities Drivers
23
6 items
3.9
3.5
3.7
3.7
3.7
4.1
Overall Score: 3.71
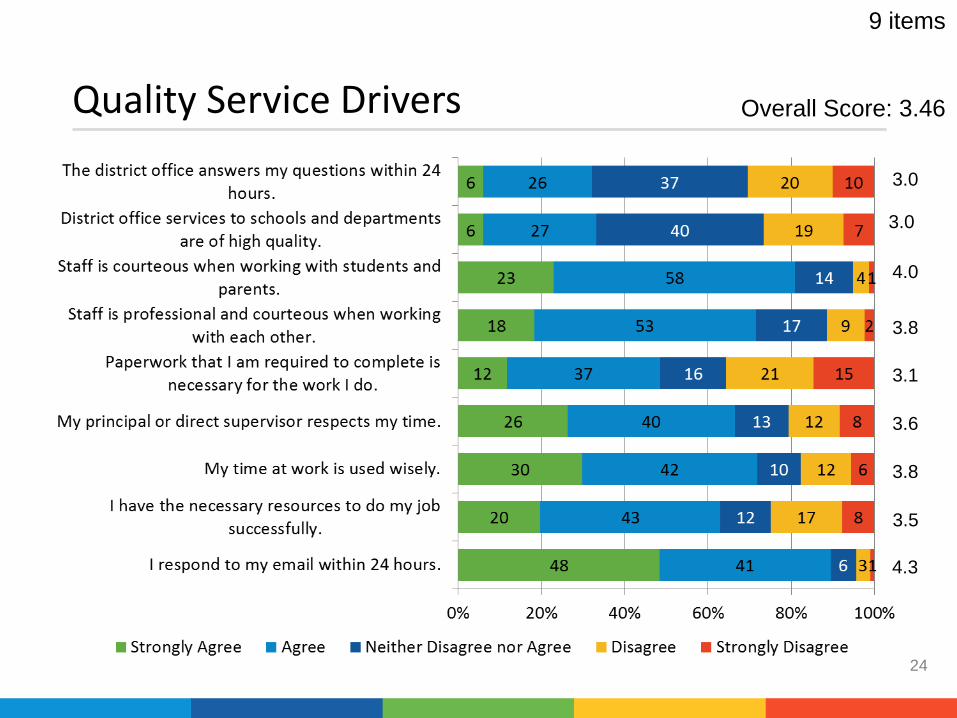
Quality Service Drivers
24
9 items
3.0
3.0
4.0
3.8
3.1
3.6
3.8
3.5
4.3
Overall Score: 3.46

Where Should Efforts be Focused to Improve Employee Engagement?
Fifty-one items examined aspects of the school/workplace environment to find areas
of focus to help improve engagement. Each area was rated on a five-point scale, with
higher values indicating a stronger level of agreement.
The relationship between each employee’s ratings and their overall engagement
score was also examined. To do this, correlation coefficients were computed between
the engagement scores and each school/workplace item. A correlation coefficient is
a measure of how strongly two items are related to each other. The value can range
from -1.0 to 0 to +1.0. The closer to ±1.0, the stronger the relationship.
Based on the combination of ratings and correlation with engagement, the areas
were classified as high vs. low in ratings and high vs. low in relation to engagement.
The relation to engagement is based on a median rating to engagement of 0.46.
Those areas that were rated low, but had a strong correlation with engagement (red)
should receive primary focus. The secondary area contains items that had high
ratings and a strong correlation with engagement (yellow).
25


Where Should Efforts be Focused to Improve Employee Engagement?
Relation to Engagement High Low
Rat
ing
Low
Best Opportunity - Gain These items are highly related to Engagement, but were rated low.
These items offer best opportunity for improving engagement.
Improvement in these items may help with the overall work environment, but would
have little impact on engagement.
Hig
h
Best Opportunity - Maintain These items are highly related to
Engagement, and were rated favorably. Emphasis on these items may help improve
engagement among some teachers.
District is performing well with these items.

29
Rating Relation To
Engagement Leadership District office administrators understand my needs as an employee. 2.73 0.52 Feedback & Recognition
The CMS evaluation tool used to assess my work performance is helpful. 2.96 0.47
Leadership District office administrators' actions are consistent with their words. 3.01 0.46 Leadership District office administrators make good decisions overall. 3.08 0.49 Feedback & Recognition
I feel appreciated for the work that I do. 3.26 0.62
Feedback & Recognition
I receive recognition for my accomplishments. 3.27 0.50
Work Environment
I believe work is distributed fairly at my school or department. 3.45 0.50
Communication I believe I can influence decisions at my school or department. 3.54 0.53 Feedback & Recognition
My principal or direct supervisor regularly gives me constructive feedback to improve my work performance.
3.54 0.49
Work Environment
I work in an atmosphere where there is mutual respect among all staff. 3.59 0.48
Feedback & Recognition
I am encouraged and expected to give feedback to improve my school or department. 3.64 0.49
Quality Service My principal or direct supervisor respects my time. 3.64 0.56
Best Opportunity for Gain
12 items
Median
Rating 3.69
Relation to Engagement 0.46
Relation to Engagement
High Low
Rating Low Primary Focus
High Secondary Focus

30
Best Opportunity to Maintain
Rating Relation To
Engagement
Quality Service My time at work is used wisely. 3.78 0.50
Leadership My principal's or direct supervisor's actions are consistent with his/her words. 3.79 0.53
Leadership My principal or direct supervisor has strong management skills. 3.82 0.54
Work Environment My principal or direct supervisor implements policies fairly at my school or department.
3.82 0.53
Leadership I can count on my principal's or direct supervisor's support when addressing problems or issues.
3.85 0.55
Shared Values I feel comfortable sharing ideas and opinions with my principal or direct supervisor. 3.88 0.57
Leadership I enjoy the professional relationship I have with my principal or direct supervisor. 3.88 0.57
Communication My principal or direct supervisor effectively communicates important issues that affect me.
3.91 0.51
Communication My principal or direct supervisor is willing to listen to new ideas. 3.93 0.52
Work Environment My principal or direct supervisor allows me to make decisions about how to do my work.
3.96 0.52
Work Environment My principal or direct supervisor creates a professional work environment. 3.99 0.52
Leadership I trust my principal or direct supervisor to make good decisions for students. 4.01 0.56
Communication My principal or direct supervisor clearly communicates his/her expectations of my job performance.
4.04 0.48
Shared Values My principal or direct supervisor encourages me to always do my best. 4.23 0.53
14 items
Median
Rating 3.69
Relation to Engagement 0.46
Relation to Engagement
High Low
Rating Low Primary Focus
High Secondary Focus
31
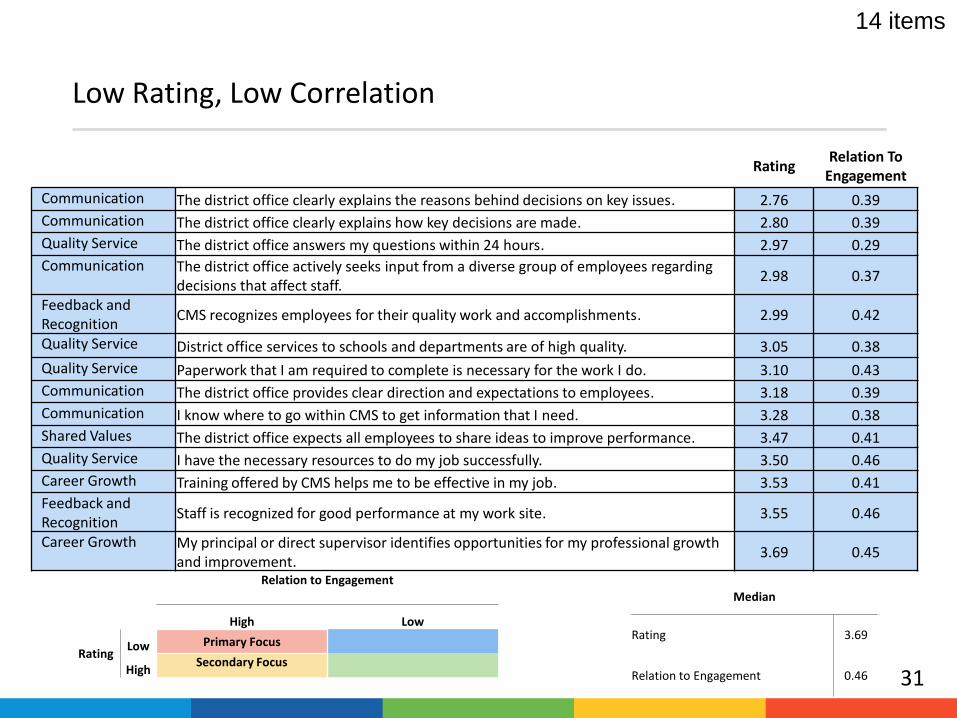
Low Rating, Low Correlation
Rating Relation To
Engagement
Communication The district office clearly explains the reasons behind decisions on key issues. 2.76 0.39
Communication The district office clearly explains how key decisions are made. 2.80 0.39
Quality Service The district office answers my questions within 24 hours. 2.97 0.29
Communication The district office actively seeks input from a diverse group of employees regarding decisions that affect staff.
2.98 0.37
Feedback and Recognition
CMS recognizes employees for their quality work and accomplishments. 2.99 0.42
Quality Service District office services to schools and departments are of high quality. 3.05 0.38
Quality Service Paperwork that I am required to complete is necessary for the work I do. 3.10 0.43
Communication The district office provides clear direction and expectations to employees. 3.18 0.39
Communication I know where to go within CMS to get information that I need. 3.28 0.38
Shared Values The district office expects all employees to share ideas to improve performance. 3.47 0.41
Quality Service I have the necessary resources to do my job successfully. 3.50 0.46
Career Growth Training offered by CMS helps me to be effective in my job. 3.53 0.41
Feedback and Recognition
Staff is recognized for good performance at my work site. 3.55 0.46
Career Growth My principal or direct supervisor identifies opportunities for my professional growth and improvement.
3.69 0.45
14 items
Median
Rating 3.69
Relation to Engagement 0.46
Relation to Engagement
High Low
Rating Low Primary Focus
High Secondary Focus

32
High Rating, Low Correlation
Rating Relation To
Engagement
Career Growth The district office provides professional development that supports district initiatives.
3.70 0.34
Career Growth There are leadership opportunities for me within my school or department. 3.74 0.40
Quality Service Staff is professional and courteous when working with each other. 3.76 0.35
Quality Service Employees of CMS are professional and courteous when working with others (parents, students and colleagues).
3.83 0.35
Career Growth CMS encourages continued education and professional growth. 3.85 0.36
Shared Values Meeting the needs of students is one of CMS' top priorities. 3.91 0.46
Leadership District office administrators have high expectations for all staff. 3.91 0.34
Quality Service Staff is courteous when working with students and parents. 3.97 0.30
Career Growth I have the education and training I need to perform my best work at CMS. 4.11 0.32
Work Environment
My principal or direct supervisor encourages collaboration within and across teams at my school or department.
4.13 0.43
Quality Service I respond to my email within 24 hours. 4.32 0.15
11 items
Median
Rating 3.69
Relation to Engagement 0.46
Relation to Engagement
High Low
Rating Low Primary Focus
High Secondary Focus

Analysis by Respondent Group
33

Overall Engagement by Respondent Group
34
Range of Not Engaged: 6% to 30%
Note: The principal respondent group is also included in the school administrator group.
29%
48%
29%
31%
50%
46%
38%
23%
47%
41%
48%
49%
42%
48%
46%
47%
24%
11%
23%
20%
8%
6%
17%
30%
0% 20% 40% 60% 80% 100%
All CMS Employees (n=9236)
District Office Administrator (n=85)
District Support Staff (n=558)
Licensed Non-Teacher (n=1099)
School Administrator (All) (n=223)
Principal (n=104)
School Support Staff (n=2318)
Teacher (n=4947)
Highly Engaged Engaged Not Engaged

Shared Values
35
3.8
4.0
3.7
3.9
4.0
4.0
3.9
3.8
1 2 3 4 5
All CMS Employees
District Office Administrator
District Support Staff
Licensed Non-Teacher
School Administrator (All)
Principal
School Support Staff
Teacher
*Response Options: 1 = Strongly Disagree; 2 = Disagree; 3 = Neither Disagree nor Agree; 4 = Agree; 5 = Strongly Agree and “Not Applicable” Not Applicable responses were excluded from all calculations
0.3
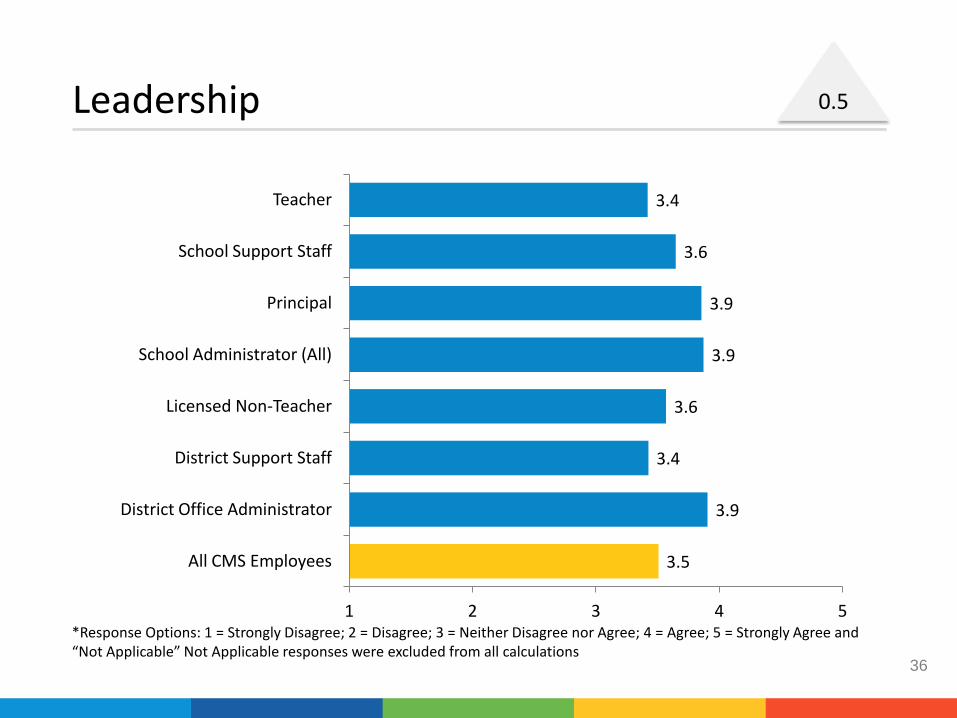
Leadership
36
3.5
3.9
3.4
3.6
3.9
3.9
3.6
3.4
1 2 3 4 5
All CMS Employees
District Office Administrator
District Support Staff
Licensed Non-Teacher
School Administrator (All)
Principal
School Support Staff
Teacher
*Response Options: 1 = Strongly Disagree; 2 = Disagree; 3 = Neither Disagree nor Agree; 4 = Agree; 5 = Strongly Agree and “Not Applicable” Not Applicable responses were excluded from all calculations
0.5

Communication
37
*Response Options: 1 = Strongly Disagree; 2 = Disagree; 3 = Neither Disagree nor Agree; 4 = Agree; 5 = Strongly Agree and “Not Applicable” Not Applicable responses were excluded from all calculations
0.2

Feedback and Recognition
38
*Response Options: 1 = Strongly Disagree; 2 = Disagree; 3 = Neither Disagree nor Agree; 4 = Agree; 5 = Strongly Agree and “Not Applicable” Not Applicable responses were excluded from all calculations
0.6

Work Environment
39
3.8
4.1
3.6
3.9
4.2
4.2
3.8
3.8
1.0 2.0 3.0 4.0 5.0
All CMS Employees
District Office Administrator
District Support Staff
Licensed Non-Teacher
School Administrator (All)
Principal
School Support Staff
Teacher
*Response Options: 1 = Strongly Disagree; 2 = Disagree; 3 = Neither Disagree nor Agree; 4 = Agree; 5 = Strongly Agree and “Not Applicable” Not Applicable responses were excluded from all calculations
0.6

Career Growth and Training Opportunities
40
*Response Options: 1 = Strongly Disagree; 2 = Disagree; 3 = Neither Disagree nor Agree; 4 = Agree; 5 = Strongly Agree and “Not Applicable” Not Applicable responses were excluded from all calculations
0.9
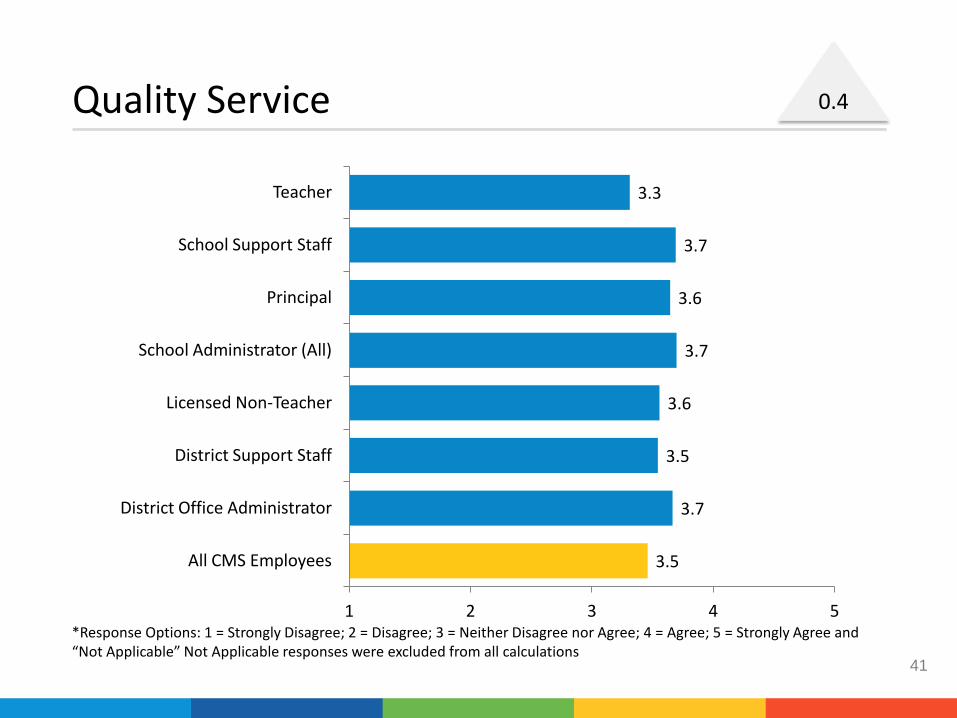
Quality Service
41
3.5
3.7
3.5
3.6
3.7
3.6
3.7
3.3
1 2 3 4 5
All CMS Employees
District Office Administrator
District Support Staff
Licensed Non-Teacher
School Administrator (All)
Principal
School Support Staff
Teacher
*Response Options: 1 = Strongly Disagree; 2 = Disagree; 3 = Neither Disagree nor Agree; 4 = Agree; 5 = Strongly Agree and “Not Applicable” Not Applicable responses were excluded from all calculations
0.4
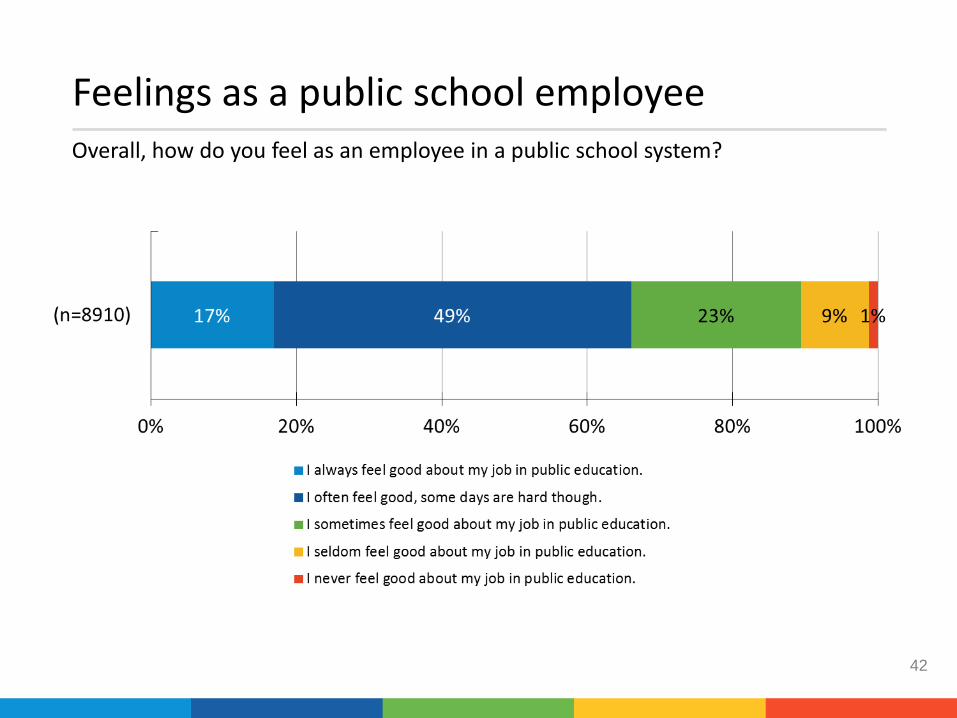
Feelings as a public school employee Overall, how do you feel as an employee in a public school system?
42

Themes of Responses to Open-Ended Questions
Please share some short-term suggestions that CMS could do to make you feel better about working in a public school system. (n=4243)
Selected Themes
Share positive stories about CMS work in the media and community (e.g., zone celebrations, staff appreciations days)
Examine policies and procedures with Human Relations (e.g., evaluation process, pay for performance)
Pay attention to a more thoughtful implementation and training related to new initiatives (e.g., new report card)
Provide school staff with improved technical resources (e.g., WiFi connectivity, updated version of Microsoft office and newer printers)
Continue with the “town hall meeting” and open lines of communication
Reduce unnecessary paperwork and non-teaching tasks (e.g., limit the number of meetings)
43

Themes of Responses to Open-Ended Questions
Please share some long-term suggestions that CMS could do to make you feel better about working in a public school system. (n=3640)
Selected Themes
Create more opportunities to highlight quality performance for ALL types of employees
Set up structures to seek representation from appropriate employee groups when making decisions that may impact them directly
Design communication system to gather input from all employees and disseminate information to all employees, not only teachers and administrators
Improve compensation and benefits
Provide more sustained and on-going training for prioritized initiatives (e.g., inclusion practices, differentiation, collaboration and common core)
Examine current initiatives and prioritize them based on highest impact on student performance, lowest impact on staff time and overall potential benefit
Establish a process to observe and listen at the school sites
44

Conclusions Highlights: More than 50% of all employees participated in the survey with representation
of more than 50% of each respondent group with the exception of School Support Staff.
Seventy-six percent of employees who responded are engaged or highly engaged in their work in CMS.
Shared values (3.8) was the strongest factor that influences engagement, with communication (3.34) and feedback and recognition (3.29) being the two weakest factors.
Generally, the majority of employees rated items referencing their workplace or school more positively than items referencing the district office.
Items about district office communicating clear direction, expectations, decision-making processes and explanation were the lowest survey items.
45