emerson network power data center assessment … network power data center assessment report of...
TRANSCRIPT
Emerson Network Power Data Center Assessment
Report of Findings
Customer Name Customer A
Project Name
Data Center Assessment
Address 1243 Happy Days Lane Somewhere, MN 55555
Customer Contacts
Hank Hill (555) 555-8621
Surveys Completed Electrical Infrastructure Power Audit……….May 27th 2008 Data Center Thermal Assessment……..….June 11th 2008
1
Executive Summaries Emerson Electrical Reliability Services
Electrical Infrastructure Power Audit Emerson Electrical Reliability Services performed the facility power audit for the Any Data Center, Somewhere, MN. Some issues were found such as no one-line diagrams and the feeder circuit breaker for ‘TU-D-1’ transformer could not be located. The transformer label ‘TU-D-2’ is used twice in the building. A single point of failure was found on the automatic transfer switch which does not have a bypass capability. The building and computer room would not be able to switch to the emergency generator in the event of failure. Additional single point of failure is all computer room racks that are supplied from the single transformers and not supplied through a static switch.
Emerson Network Power Data Center Thermal Assessment
The Any Data Center at Somewhere, MN has hot spots throughout the area which can be attributed to several things. The most important of these is the fact that a hot/cold aisle arrangement is not being utilized. This causes several issues within the data center. Problems associated with aisle arrangement as well as additional important factors leading to data center hot spots are summarized below.
• Short circuiting of room air causes elevated temperatures at server inlets and decreased temperatures at computer room air conditioning (CRAC) return.
o Hot exhaust air is pushed directly to other server inlets because of the data center layout which greatly increases the temperature of the equipment.
o Hot exhaust air also mixes with cold supply air which can and does short circuit back to the CRAC unit. These lowered return air temperatures reduce the cooling capacity of the CRAC unit.
o Many racks are not equipped with block off plates allowing hot exhaust air to pass through the rack into the cold aisle.
• Incorrectly placed/balanced ceiling air supply grilles • Under floor plenum in conjunction with perforated floor tiles is not used to cool racks in
this data center. Under floor cooling is the preferred method for conventional cooling of data centers because of its precisely located CRAC air as well as assisting in the ‘hot air rises’ principle.
The purpose of this report is to deliver field observations and recommendations to Any Data Center about problems identified at the Lake Elmo Data Center along with Liebert recommended solutions that can be used for future expansion considerations of equipment space.
2
Examples of how these things affect airflow and cooling in the data center are explained in further detail later in the report.
Table of Contents Executive Summaries................................................................................................................................................ 1 Standards for Evaluation for Power Audits................................................................................................................ 5 System Load Review................................................................................................................................................. 6 Single Point of Failure ............................................................................................................................................... 7 Electrical Distribution Equipment Inventory............................................................................................................... 8 Electrical Audit ...................................................................................................................................................... 9
Main / Distribution Breakers................................................................................................................................... 9 PDU Main Breaker ............................................................................................................................................... 10
ULP-D-1A Panelboard............................................................................................................................................. 11 ULP-D-1B Panelboard............................................................................................................................................. 12 ULP-D-1C Panelboard............................................................................................................................................. 13 Generator / UPS Information ................................................................................................................................... 14 Future Growth Considerations................................................................................................................................. 15 Power Audit Observations ....................................................................................................................................... 16 Main Switchgear Load Recording............................................................................................................................ 18 Main Switchgear Recorded Volt/Amp...................................................................................................................... 18 Main Switchgear Recorded Voltage Harmonics...................................................................................................... 19 Main Switchgear Recorded Current Harmonics ...................................................................................................... 20 Main Switchgear Recorded Power .......................................................................................................................... 21 UPS 1 Output Harmonics Snapshot............................................................................................................. 22
UPS 1 Output Snapshot Scope ........................................................................................................................... 22 UPS 1 Output Snapshot Meter ............................................................................................................................ 23 UPS 1 Output Snapshot Voltage Harmonics ....................................................................................................... 24 UPS 1 Output Snapshot Current Harmonics ....................................................................................................... 25 UPS 1 Output Snapshot Power ........................................................................................................................... 26
UPS 2 Output Harmonics Snapshot............................................................................................................. 27 UPS 2 Output Snapshot Scope ........................................................................................................................... 27 UPS 2 Output Snapshot Meter ............................................................................................................................ 28 UPS 2 Output Snapshot Voltage Harmonics ....................................................................................................... 29 UPS 2 Output Snapshot Current Harmonics ....................................................................................................... 30 UPS 2 Output Snapshot Power ........................................................................................................................... 31
Thermal Assessment Section 1........................................................................................................... 32 1.1 Objectives ...................................................................................................................................................... 32 1.2 Survey Process.............................................................................................................................................. 32
Thermal Assessment Section 2........................................................................................................... 33 2.1 Observations ............................................................................................................................................ 33
Figure 2.1.1 – Dense Cabling Restricting Server Air Flow............................................................................... 34 Figure 2.1.2 – Diagram of a True Hot/Cold Aisle Configuration....................................................................... 35 Floor Characteristics ........................................................................................................................................ 35 Ceiling............................................................................................................................................................... 36 Figure 2.1.3 – Wall Penetrations in Above Ceiling Plenum ............................................................................. 36
3
Air Conditioning ................................................................................................................................................ 36 Table 2.1.1 CRAC Unit Properties ................................................................................................................... 37
2.2 CFD Study................................................................................................................................................. 38 Figure 2.2.1 – As-Is Floor Plan......................................................................................................................... 39 Figure 2.2.2 – Data Center Rack Inlet and Exhaust Plan ................................................................................ 40 Figure 2.2.3 – Simulated Server Exhaust Airflow............................................................................................. 41 Figure 2.2.4 – Simulated Return CRAC Air...................................................................................................... 42
2.3 – Thermal Conclusions.......................................................................................................................... 43 Figure 2.3.1 – Short Circuiting Exhaust Air ...................................................................................................... 45 Table 2.3.1 Field Temperature Measurements ................................................................................................ 46
2.4 – Thermal Recommendations ............................................................................................................. 47 Thermal Assessment Section 3........................................................................................................... 48
3.1 Data Center As-Is Solution................................................................................................................... 48 Liebert Recommended Solution 1 .................................................................................................................... 48 Figure 3.1.1 – Solution 1 Plan .......................................................................................................................... 48 Liebert Recommended Solution 2 .................................................................................................................... 49 Figure 3.1.2 – Solution 2 Plan .......................................................................................................................... 49 Figure 3.1.3 – As-Is Worst Case Temperatures (6ft.) ...................................................................................... 50 Figure 3.1.4a – Solution 1 – Without Blank Plates (6ft.) .................................................................................. 51 Figure 3.1.4b – Solution 1 – Blank Plates Added (6ft.) .................................................................................... 51 Figure 3.1.5a – Solution 2 – Without Blank Plates (6ft.) .................................................................................. 52 Figure 3.1.5b – Solution 2 – Blank Plates Added (6 ft.) ................................................................................... 52 Figure 3.1.6a – Solution 1 – Hot/Cold Aisle w/out Blank Plates (6ft.) .............................................................. 53 Figure 3.1.6b – Solution 1 – Hot/Cold Aisle w/Blank Plates (6ft.) .................................................................... 53 Figure 3.1.7a – Solution 2 – Hot/Cold Aisle w/out Blank Plates (6ft.) .............................................................. 54 Figure 3.1.7b – Solution 2 – Hot/Cold Aisle w/Blank Plates (6ft.) .................................................................... 54 Figure 3.1.8 – Solution 1 – Complete with New Supply Grilles (6ft.) ............................................................... 55 Figure 3.1.9 – Solution 2 – Complete with New Supply Grilles (6ft.) ............................................................... 56 Figure 3.1.10 – Data Center with the Addition of a Second CRAC Unit Only.................................................. 57
3.2 Liebert Recommended Data Center Expansion Solution ........................................................... 58 Expansion in Current Data Center ................................................................................................................... 58 Figure 3.2.1 – Solution 1 with 25% Load Increase........................................................................................... 58 Figure 3.2.2 – Solution 2 with 25% Load Increase........................................................................................... 58 Phase 1 Expansion - Opening Adjacent Area.................................................................................................. 59 Figure 3.2.3 – Phase 1 Expansion - Isometric ................................................................................................. 59 Figure 3.2.4 – Phase 1 Results ........................................................................................................................ 60 Phase 2 Expansion - Filling Adjacent Area ...................................................................................................... 61 Figure 3.2.5 – Phase 2 Expansion - Isometric ................................................................................................. 61 Figure 3.2.6 – Phase 2 Results ........................................................................................................................ 62 Phase 3 Expansion – Refill Old Data Center, Introduce High Density Racks ................................................. 63 Figure 3.2.7 – Phase 3 Expansion - Isometric ................................................................................................. 63 Figure 3.2.8 – Phase 3 Expansion Results (1 of 2).......................................................................................... 64 Figure 3.2.8 – Phase 3 Expansion Results (2 of 2).......................................................................................... 65
Thermal Assessment Section 4........................................................................................................... 66 4.1 – Liebert HVAC Preventive Maintenance Worksheet .................................................................. 66 4.2 – Appendix ................................................................................................................................................ 70
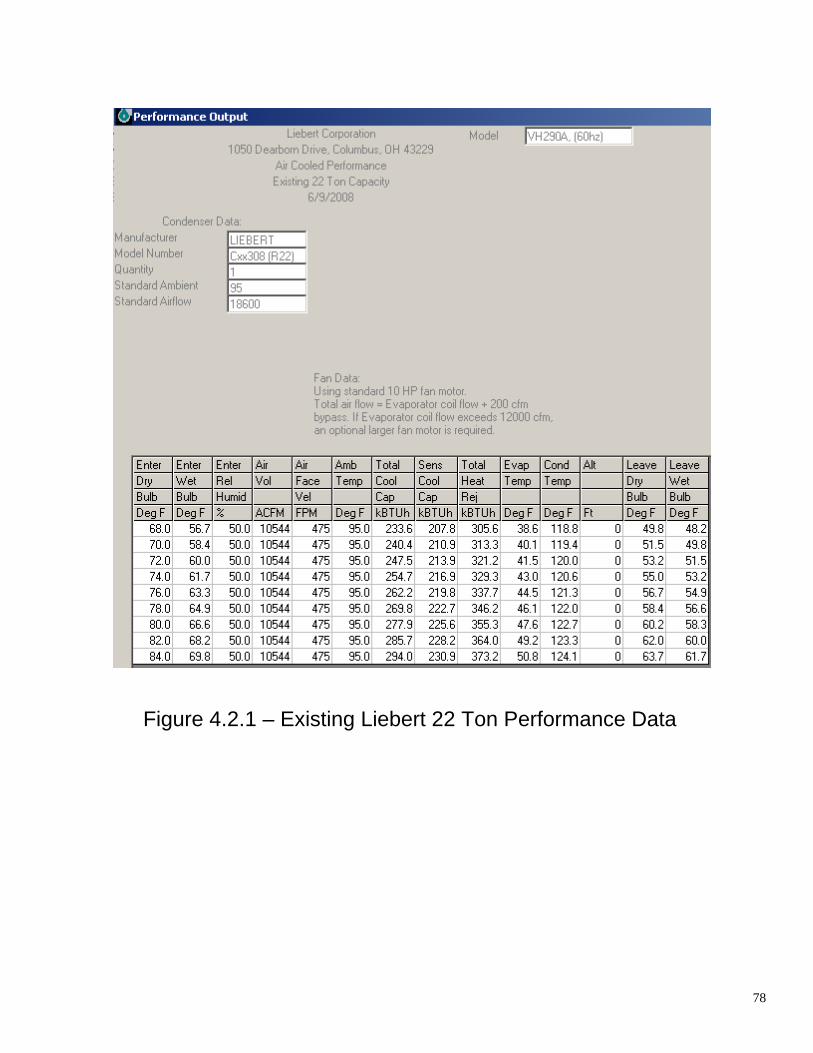
Table 4.2.1 Equipment Summary..................................................................................................................... 70 Figure 4.2.1 – Existing Liebert 22 Ton Performance Data............................................................................... 78 Figure 4.2.2 – Existing Aaon 25 Ton Rooftop Performance Data.................................................................... 79
33
Thermal Assessment Section 2
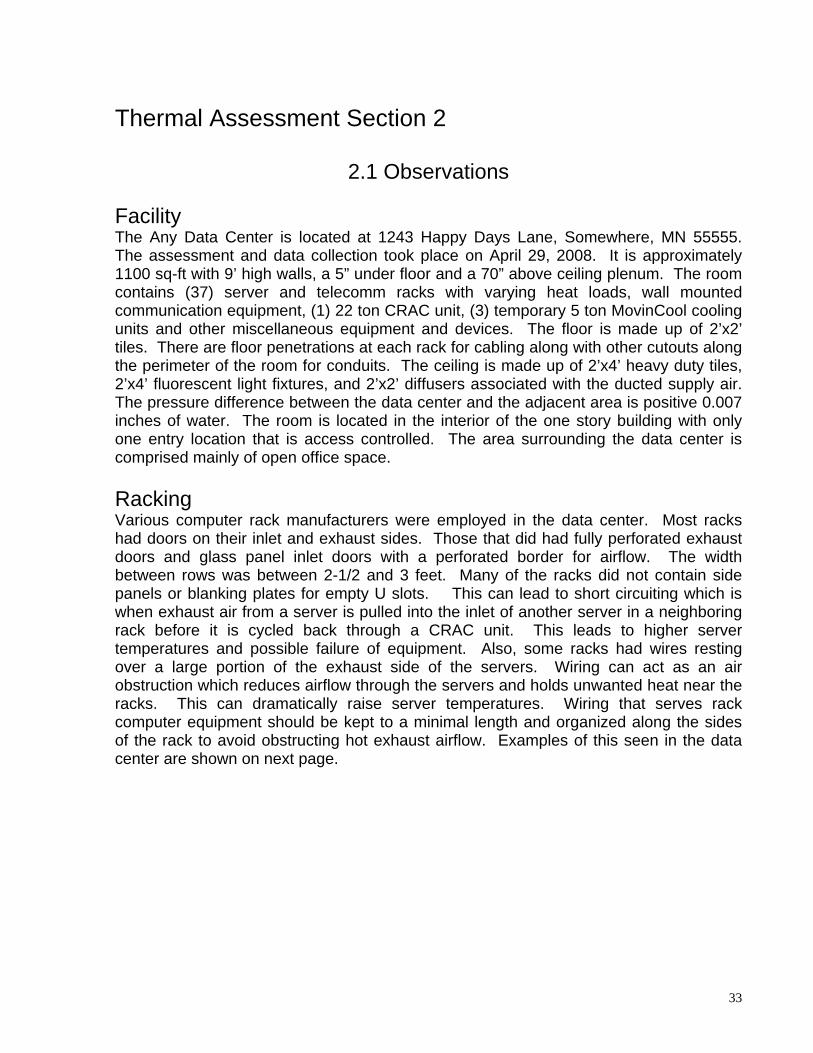
2.1 Observations Facility The Any Data Center is located at 1243 Happy Days Lane, Somewhere, MN 55555. The assessment and data collection took place on April 29, 2008. It is approximately 1100 sq-ft with 9’ high walls, a 5” under floor and a 70” above ceiling plenum. The room contains (37) server and telecomm racks with varying heat loads, wall mounted communication equipment, (1) 22 ton CRAC unit, (3) temporary 5 ton MovinCool cooling units and other miscellaneous equipment and devices. The floor is made up of 2’x2’ tiles. There are floor penetrations at each rack for cabling along with other cutouts along the perimeter of the room for conduits. The ceiling is made up of 2’x4’ heavy duty tiles, 2’x4’ fluorescent light fixtures, and 2’x2’ diffusers associated with the ducted supply air. The pressure difference between the data center and the adjacent area is positive 0.007 inches of water. The room is located in the interior of the one story building with only one entry location that is access controlled. The area surrounding the data center is comprised mainly of open office space. Racking Various computer rack manufacturers were employed in the data center. Most racks had doors on their inlet and exhaust sides. Those that did had fully perforated exhaust doors and glass panel inlet doors with a perforated border for airflow. The width between rows was between 2-1/2 and 3 feet. Many of the racks did not contain side panels or blanking plates for empty U slots. This can lead to short circuiting which is when exhaust air from a server is pulled into the inlet of another server in a neighboring rack before it is cycled back through a CRAC unit. This leads to higher server temperatures and possible failure of equipment. Also, some racks had wires resting over a large portion of the exhaust side of the servers. Wiring can act as an air obstruction which reduces airflow through the servers and holds unwanted heat near the racks. This can dramatically raise server temperatures. Wiring that serves rack computer equipment should be kept to a minimal length and organized along the sides of the rack to avoid obstructing hot exhaust airflow. Examples of this seen in the data center are shown on next page.
34
Figure 2.1.1 – Dense Cabling Restricting Server Air Flow
Approximately 18% of the racks in the data center were experiencing inlet temperatures above 77 degrees F. Any air above 77 degrees F supplying rack equipment is considered a “hot spot” and can have a very negative effect on the performance and life of the data center’s servers. The largest contributing factor to this is the layout of the data center. Currently a hot/cold aisle configuration is not being used. When this system is not implemented, short circuiting of air is almost always present. This is when hot exhaust air from servers is directed into the inlet of other servers either in neighboring racks or within the same rack before it is returned back to the CRAC unit. Short circuiting significantly raises temperatures seen by server inlets. In this particular situation, hot air is being short circuited up to four times! Air is moving through servers in Row B directly through Row C, through Row D and finally through Row E because of rack configuration. See Figure 2.3.1 for an illustration of this. Liebert recommends that hot and cold aisles are utilized throughout the data center to ensure that cool CRAC air is being provided to each server inlet. This will help eliminate hot spots in the data center and improve both server and CRAC unit efficiency and uptime. Below is an illustration of the preferred rack arrangement.
35
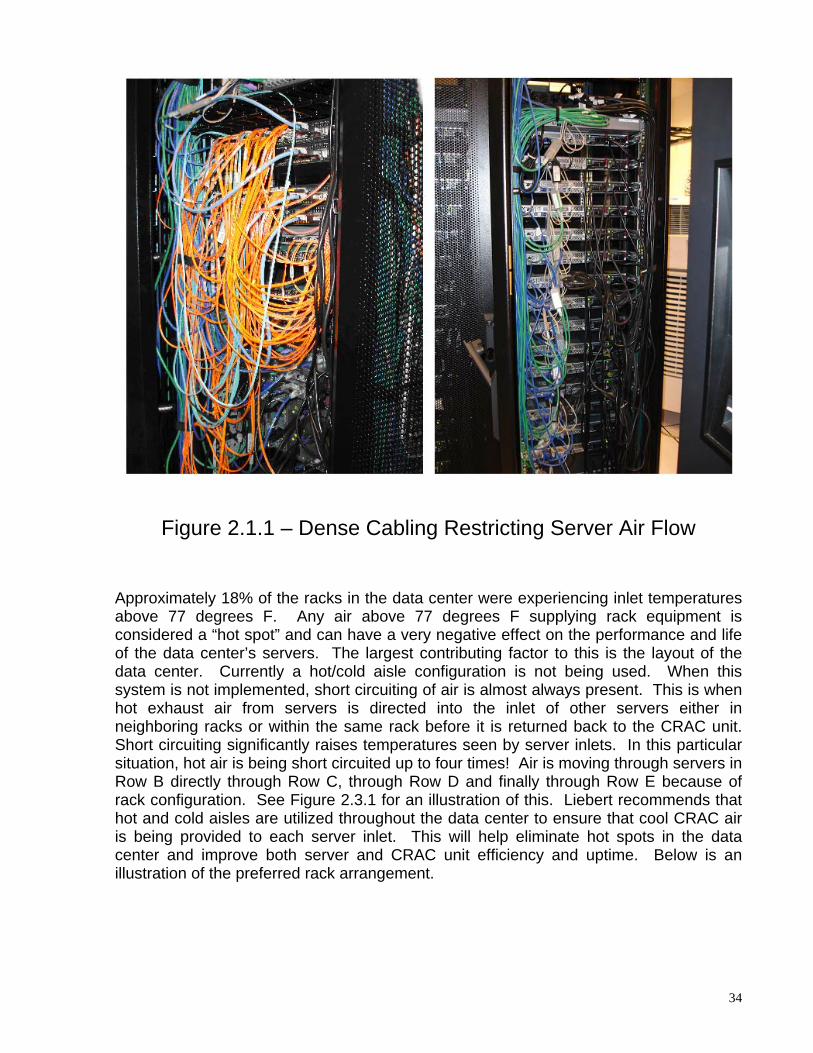
Figure 2.1.2 – Diagram of a True Hot/Cold Aisle Configuration
One of the most important things shown in this diagram is the location of the CRAC units at the end of the hot aisles. By having the CRAC units located here, the exhaust air can rise freely to the level of the CRAC unit’s intakes while not being pulled into the intakes of the computer equipment. As most racks in the data center have room for additional equipment, there is the potential for higher heat loads being incorporated into the data center. As more computer equipment is added to this area or new, faster, and higher watt density equipment replaces existing equipment, higher rack temperatures are to be expected if changes to the availability of airflow are not made. This availability could be in the form of changes to the current airflow configuration or additions of more or newer cooling means. Nearly every rack in the data center has its own cable floor opening. These raised floor openings not only allow cable to pass through but also air. This does not present any problems now due to the fact that there is no under floor airflow in the room. However, it is something that should be considered for the future during the data center expansion. Unaccounted air flow through cable penetrations presents a problem when trying to balance the air within the data center. Cable openings in the raised floor should be as small as possible or sealed up to ensure CRAC air is being directed to the appropriate locations.
Floor Characteristics The raised floor is 5” high and consists of 2’x2’ floor tiles. There is no system of tile designation present. The under floor in the data center is not currently used as a supply air plenum for cooling the server racks. Rather, it is only used for routing cable to power the equipment inside the racks. Consequently, there were no perforated floor tiles for air flow but there were some openings in the floor (e.g. gaps between the floor tiles and the wall and cable openings under racks) which can compromise the vapor barrier of the room. When data centers share air with outside areas, air with uncontrolled levels of
36
humidity are able to mix with data center air which can negatively affect the security of the equipment in the room. The under floor cabling is very dense and in several areas it takes the entire depth of under floor space. Along with cabling, the under floor is also occupied by metal boxes, outlet boxes and CRAC unit supply/return lines.
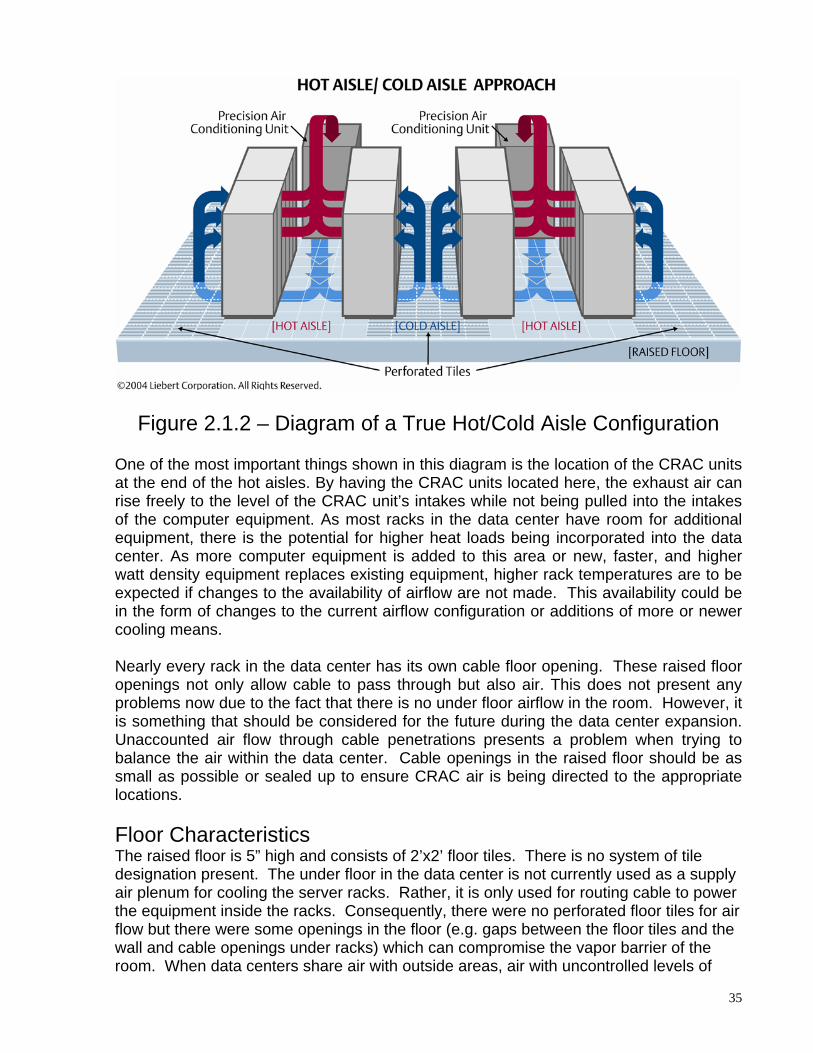
Ceiling The data center has a dropped ceiling that utilizes 2’x4’ heavy duty tiles with recessed lighting fixtures. The above ceiling is very congested with insulated ductwork coming from the 22 ton CRAC unit within the room and a 25 ton rooftop unit being ducted down. The ceiling holds (22) 2’x4’ fluorescent lighting fixtures and (13) 2’x2’ air grilles. Each lighting fixture contains (3) 32 W bulbs which adds a heat load to the room that must be accounted for also. The total lighting heat load for the room is 2.1 kW. There were some issues with vapor barrier integrity within the above ceiling plenum. Any hole or unsealed penetration in the wall is a path for air to enter the data center from neighboring areas. This unwanted air does not have temperature and humidity controls that meet the demands of data center conditions. Examples found in the above ceiling plenum have been recorded and are shown below.
Figure 2.1.3 – Wall Penetrations in Above Ceiling Plenum Air Conditioning (1) 22 ton Liebert Deluxe up flow unit is located inside the data center and (1) 25 ton Aaon rooftop unit is ducted down from the roof into common ductwork. These two units provide temperature and humidity control to the room. There are also (3) temporary 5 ton MovinCool units that are being used to supplement the room cooling. These units were shut off while room and rack temperatures were taken. The pre-filters on the 22 ton CRAC unit are showing signs of dirt which adds external static pressure to the unit and reduces unit airflow.
Opening in Above Ceiling Drywall
37
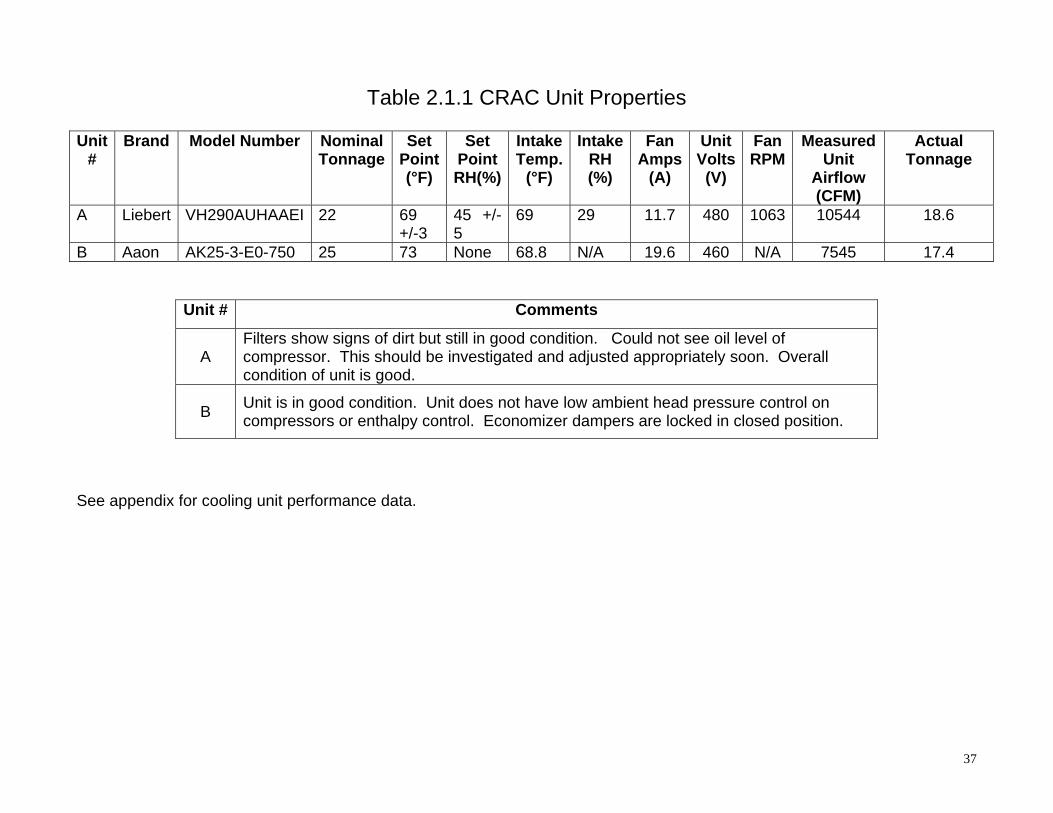
Table 2.1.1 CRAC Unit Properties
Unit
# Brand Model Number Nominal
TonnageSet
Point (°F)
Set Point RH(%)
Intake Temp.
(°F)
Intake RH (%)
Fan Amps
(A)
Unit Volts (V)
Fan RPM
Measured Unit
Airflow (CFM)
Actual Tonnage
A Liebert VH290AUHAAEI 22 69 +/-3
45 +/-5
69 29 11.7 480 1063 10544 18.6
B Aaon AK25-3-E0-750 25 73 None 68.8 N/A 19.6 460 N/A 7545 17.4 See appendix for cooling unit performance data.
Unit # Comments
A Filters show signs of dirt but still in good condition. Could not see oil level of compressor. This should be investigated and adjusted appropriately soon. Overall condition of unit is good.
B Unit is in good condition. Unit does not have low ambient head pressure control on compressors or enthalpy control. Economizer dampers are locked in closed position.
38
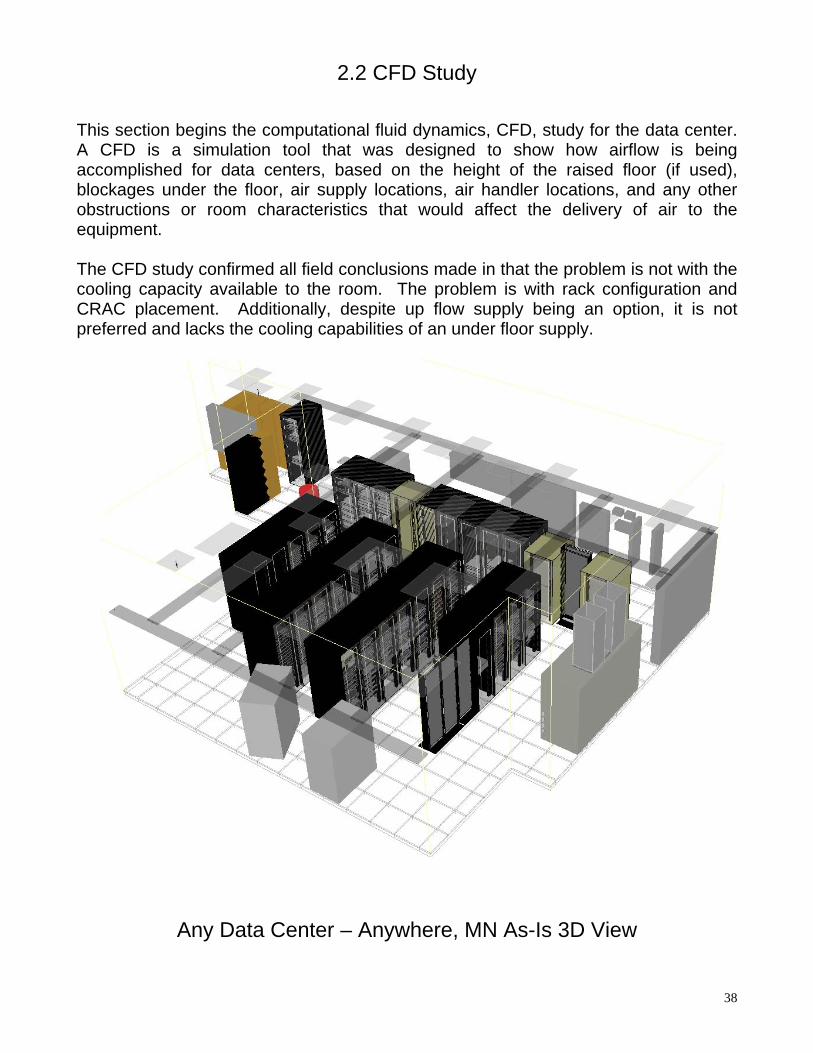
2.2 CFD Study This section begins the computational fluid dynamics, CFD, study for the data center. A CFD is a simulation tool that was designed to show how airflow is being accomplished for data centers, based on the height of the raised floor (if used), blockages under the floor, air supply locations, air handler locations, and any other obstructions or room characteristics that would affect the delivery of air to the equipment. The CFD study confirmed all field conclusions made in that the problem is not with the cooling capacity available to the room. The problem is with rack configuration and CRAC placement. Additionally, despite up flow supply being an option, it is not preferred and lacks the cooling capabilities of an under floor supply.
Any Data Center – Anywhere, MN As-Is 3D View
39
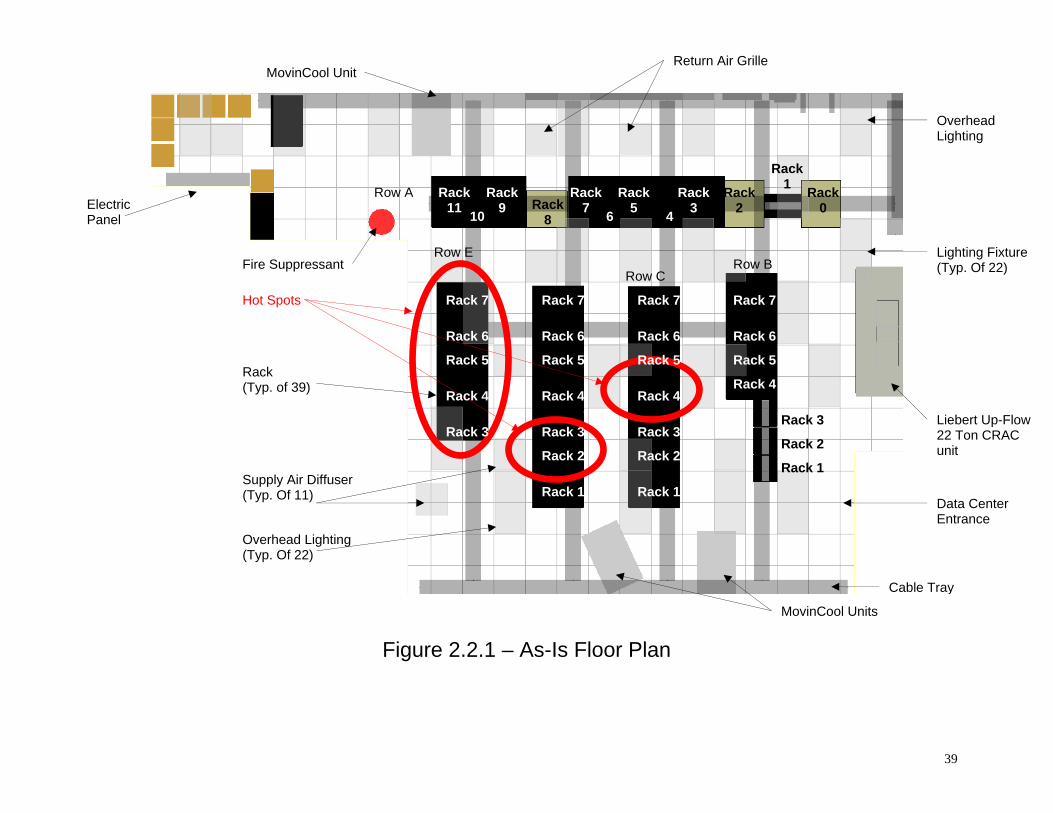
Figure 2.2.1 – As-Is Floor Plan
Supply Air Diffuser (Typ. Of 11)
Lighting Fixture (Typ. Of 22)
Return Air Grille
Cable Tray
Liebert Up-Flow 22 Ton CRAC unit
Rack (Typ. of 39)
Electric Panel
Hot Spots
Data Center Entrance
Row A
Row BRow C
Rack 7
Row E
MovinCool Unit
MovinCool Units
Overhead Lighting
Overhead Lighting (Typ. Of 22)
Rack 6
Rack 5
Rack 4
Rack 3
Rack 7
Rack 6
Rack 5
Rack 4
Rack 3
Rack 2
Rack 1
Rack 7
Rack 6
Rack 5
Rack 4
Rack 3
Rack 2
Rack 1
Rack 7
Rack 6
Rack 5
Rack 4
Rack 3
Rack 2
Rack 1
Rack 11 10
Rack 9 Rack
8
Rack 7 6
Rack 5 4
Rack 3
Rack 2
Rack 1 Rack
0
Fire Suppressant
40
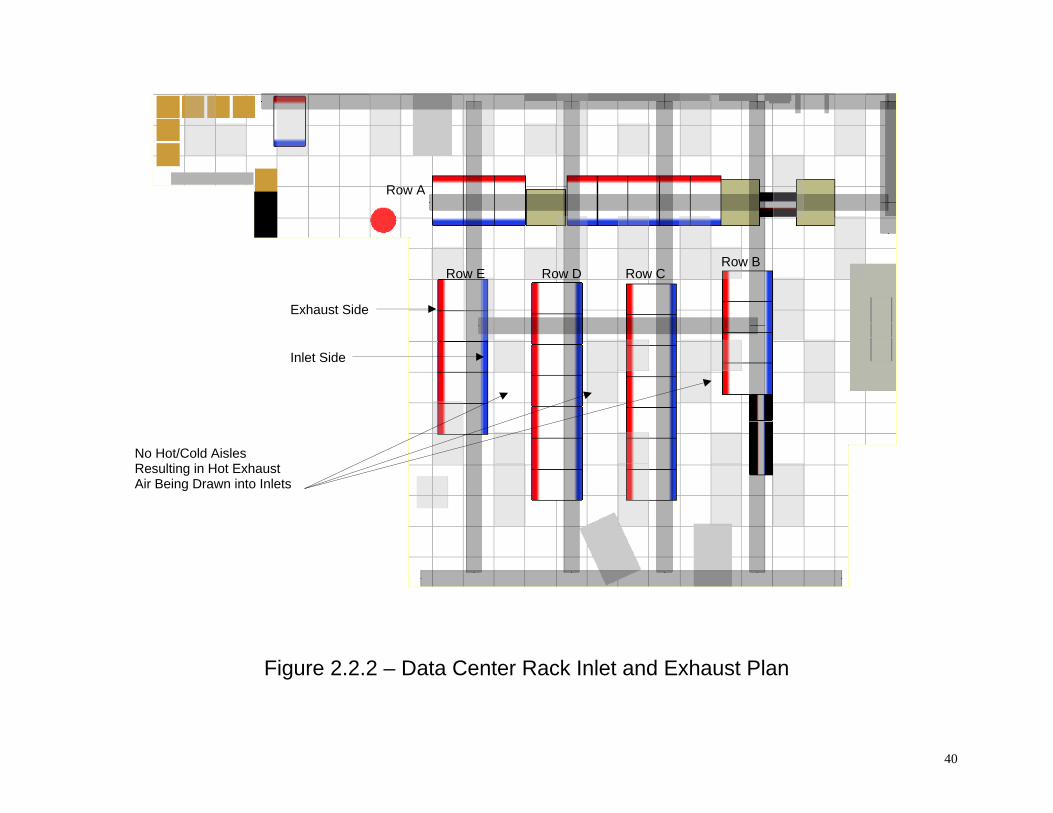
Figure 2.2.2 – Data Center Rack Inlet and Exhaust Plan
Exhaust Side
Inlet Side
No Hot/Cold Aisles Resulting in Hot Exhaust Air Being Drawn into Inlets
Row A
Row BRow CRow DRow E
41
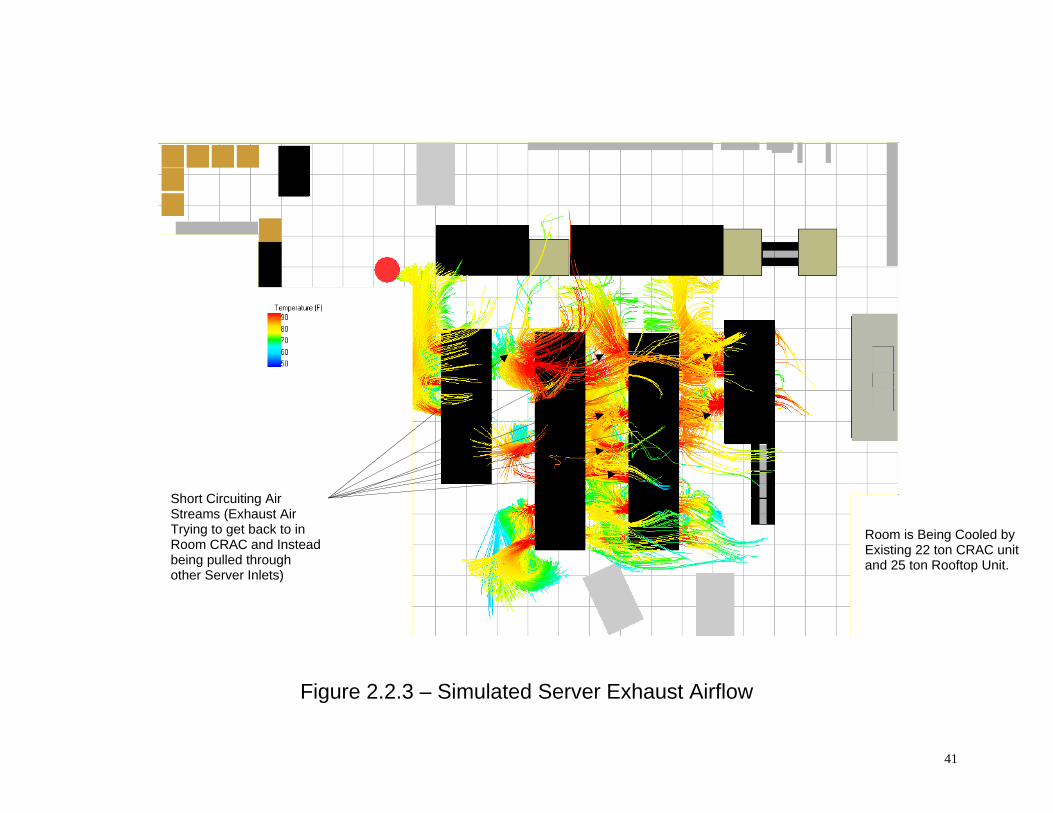
Figure 2.2.3 – Simulated Server Exhaust Airflow
Short Circuiting Air Streams (Exhaust Air Trying to get back to in Room CRAC and Instead being pulled through other Server Inlets)
Room is Being Cooled by Existing 22 ton CRAC unit and 25 ton Rooftop Unit.
42
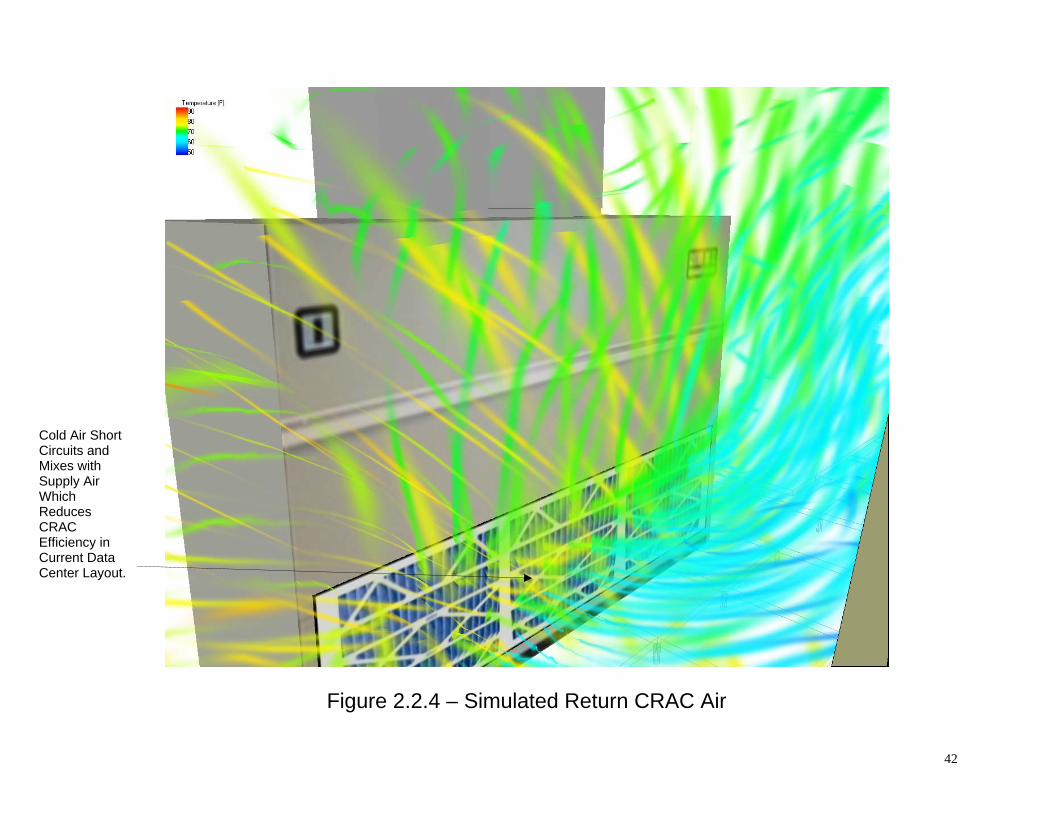
Figure 2.2.4 – Simulated Return CRAC Air
Cold Air Short Circuits and Mixes with Supply Air Which Reduces CRAC Efficiency in Current Data Center Layout.
43
2.3 – Thermal Conclusions The electrical power level being used for the server racks was 73.91 kW. This value was calculated using (2) 3 phase UPS units, the first one with phase 1 = 208 V / 192 A, phase 2 = 208 V / 214 A, and phase 3 = 208 V / 188 A, and the second one with phase 1 = 208V / 6.1 A, phase 2 = 208 V / 5.9 A, and phase 3 = 208 V / 9.5 A. This value does not include the power used by the (22) 3 bulb fluorescent lights (32 Watts/bulb). The data center lighting creates an additional load of 2.11 kW. Therefore, the total heat needing to be removed in the data center is approximated at (73.91 kW + 2.11 kW =) 76.02 kW. Examining the results of the data center energy analysis, the total heat load is 76.02 kW and the maximum nameplate cooling capacity is 158.22 kW (45 Tons) given both the CRAC unit located in the room as well the rooftop unit are on and operating at maximum efficiency. However, these cooling units are not accounting for the entire load in the data center. This results in high server inlet temperatures being seen throughout because of poorly configured racks and a CRAC unit unable to effectively return room air. Another important consideration dealing with the available cooling for the data center is the weather conditions. The day of the assessment the outdoor temperatures were in the mid to upper 50s (degrees F) with approximately 50% relative humidity which requires minimal additional conditioning from the rooftop unit. In more severe conditions experienced during the summer months, hot and humid outside air will only reduce the available cooling capacity for the data center. ASHRAE’s Design Consideration for Datacom Equipment Centers recommends inlet temperatures between 68 and 77 deg. F with a maximum temperature to the computer equipment of 90 deg. F for Class 1 - Data Center Processing Environments (ASHRAE, 2004h). The rack with designation E5 experienced the highest measured inlet temperature at its top of 85.7 deg. F. There are several factors within the data center that contributed to these elevated inlet temperatures. First, rack E5 is located at the opposite end of the room from the CRAC unit. Because of this, exhaust air cannot be returned to the CRAC unit as efficiently as it should and becomes stagnant. This allows for nearby servers, including those in E5 to recycle hot exhaust air. Additionally, rack E5, as well as all of row E is backed up very close to a wall. When the exhaust air leaves the racks, it is forced up the wall. This air then can travel over top of the racks and be pulled back into the server inlets. Finally, the current aisle configuration is also greatly contributing to the hot temperatures seen at the inlet of rack E5. All of the hot exhaust air leaving the racks of row D is being forced directly to the inlets of row E. Approximately 18% of all the racks had high inlet temperatures above the recommended 77 deg. F. Computer equipment allowed to operate above the maximum inlet air temperature range may see problems arise like shortened life, equipment failure, decreased performance, etc. Hot spots are caused by the inability of the air to cool the equipment either by insufficient air flow or intake air temperatures that are too high to change the equipment temperature effectively. Consequently, there is no redundancy in the room which is well known as emergency cooling units are currently assisting to manage the data center heat load. Vapor barrier integrity of the data center is fair. There are many spots where wall penetrations are sealed well ensuring no air transfer between the data center and exterior areas with less
44
control of temperature and humidity. However, there are also several areas that compromise the vapor barrier within the data center. There are some unsealed penetrations in the above ceiling which decrease the ability of the CRAC unit to maintain the set point humidity level. Also, there are no baseboards between the floor and the wall. It is good practice to have baseboards to reinforce the vapor barrier to safeguard against any unintentional or unknown wall penetrations. Similarly, the recessed lighting in the drop ceiling contains holes in the fixtures which are a place for air of varying temperature and humidity to enter the data center. A rooftop unit provides considerably less control in maintaining the room at a specific temperature and humidity. It is very important to match the set point of this unit to that of the CRAC to ensure the two units are not competing against each other. The Any Data Center did not follow a hot/cold aisle configuration. All of the rack exhausts faced neighboring rack inlets. This prohibits hot air from effectively returning to the cooling units and more importantly allows short circuiting of warmer air back into the rack inlets in the same area. In the current layout, air is being pulled through up to four rows of racks before it is ever returned to the CRAC unit! When the exhaust from one rack becomes the intake air for another, problems arise very quickly. Another cause of short circuiting air is the narrow aisles between racks. A significant amount of air is being forced through these areas from both CRAC supply as well as the fans in the servers to meet the demand of the heat load. When there is limited area for this to happen, high generalized air velocities occur which creates low pressures. As a result, exhaust air from other areas of the room is forced into the aisle often replacing the much needed cold supply air. The recommended aisle width is 4 ft. A simulated illustration of this can be seen below where air is moving both straight through series of racks as well as back over the tops of racks to the same inlet areas.
45
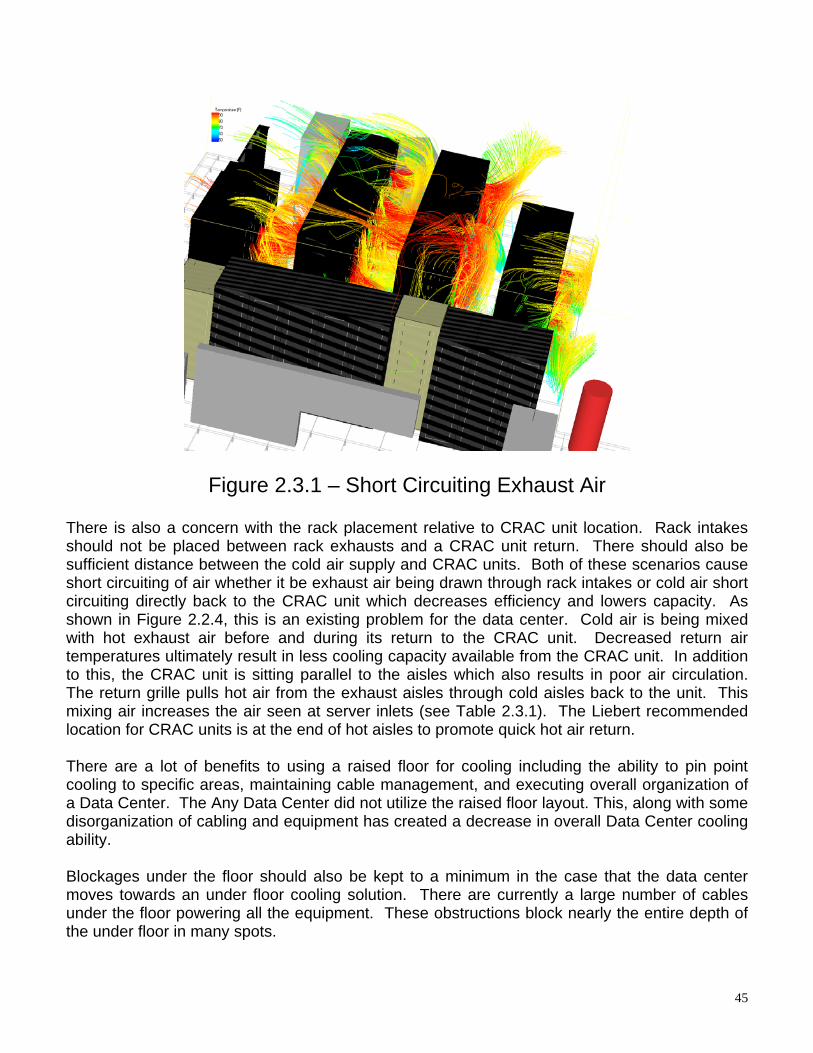
Figure 2.3.1 – Short Circuiting Exhaust Air
There is also a concern with the rack placement relative to CRAC unit location. Rack intakes should not be placed between rack exhausts and a CRAC unit return. There should also be sufficient distance between the cold air supply and CRAC units. Both of these scenarios cause short circuiting of air whether it be exhaust air being drawn through rack intakes or cold air short circuiting directly back to the CRAC unit which decreases efficiency and lowers capacity. As shown in Figure 2.2.4, this is an existing problem for the data center. Cold air is being mixed with hot exhaust air before and during its return to the CRAC unit. Decreased return air temperatures ultimately result in less cooling capacity available from the CRAC unit. In addition to this, the CRAC unit is sitting parallel to the aisles which also results in poor air circulation. The return grille pulls hot air from the exhaust aisles through cold aisles back to the unit. This mixing air increases the air seen at server inlets (see Table 2.3.1). The Liebert recommended location for CRAC units is at the end of hot aisles to promote quick hot air return. There are a lot of benefits to using a raised floor for cooling including the ability to pin point cooling to specific areas, maintaining cable management, and executing overall organization of a Data Center. The Any Data Center did not utilize the raised floor layout. This, along with some disorganization of cabling and equipment has created a decrease in overall Data Center cooling ability. Blockages under the floor should also be kept to a minimum in the case that the data center moves towards an under floor cooling solution. There are currently a large number of cables under the floor powering all the equipment. These obstructions block nearly the entire depth of the under floor in many spots.
46
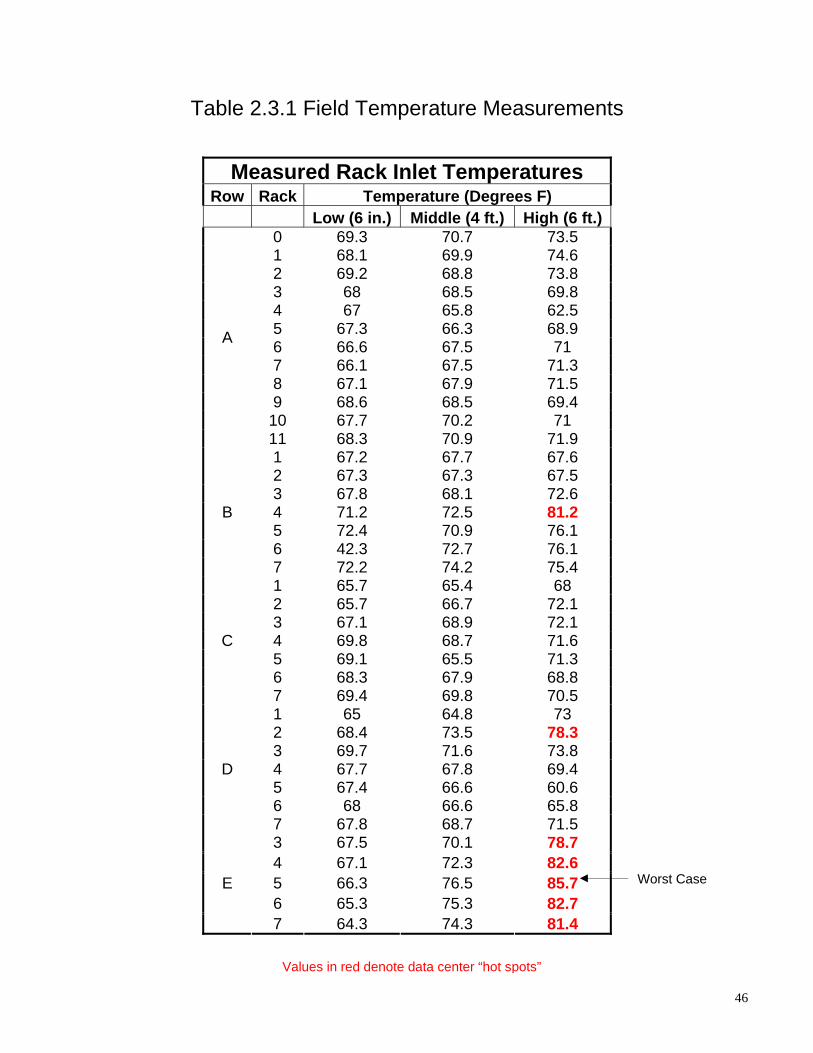
Table 2.3.1 Field Temperature Measurements
Measured Rack Inlet Temperatures Row Rack Temperature (Degrees F)
Low (6 in.) Middle (4 ft.) High (6 ft.) 0 69.3 70.7 73.5 1 68.1 69.9 74.6 2 69.2 68.8 73.8 3 68 68.5 69.8 4 67 65.8 62.5 5 67.3 66.3 68.9 6 66.6 67.5 71 7 66.1 67.5 71.3 8 67.1 67.9 71.5 9 68.6 68.5 69.4 10 67.7 70.2 71
A
11 68.3 70.9 71.9 1 67.2 67.7 67.6 2 67.3 67.3 67.5 3 67.8 68.1 72.6 4 71.2 72.5 81.2 5 72.4 70.9 76.1 6 42.3 72.7 76.1
B
7 72.2 74.2 75.4 1 65.7 65.4 68 2 65.7 66.7 72.1 3 67.1 68.9 72.1 4 69.8 68.7 71.6 5 69.1 65.5 71.3 6 68.3 67.9 68.8
C
7 69.4 69.8 70.5 1 65 64.8 73 2 68.4 73.5 78.3 3 69.7 71.6 73.8 4 67.7 67.8 69.4 5 67.4 66.6 60.6 6 68 66.6 65.8
D
7 67.8 68.7 71.5 3 67.5 70.1 78.7 4 67.1 72.3 82.6 5 66.3 76.5 85.7 6 65.3 75.3 82.7
E
7 64.3 74.3 81.4
Worst Case
Values in red denote data center “hot spots”
47
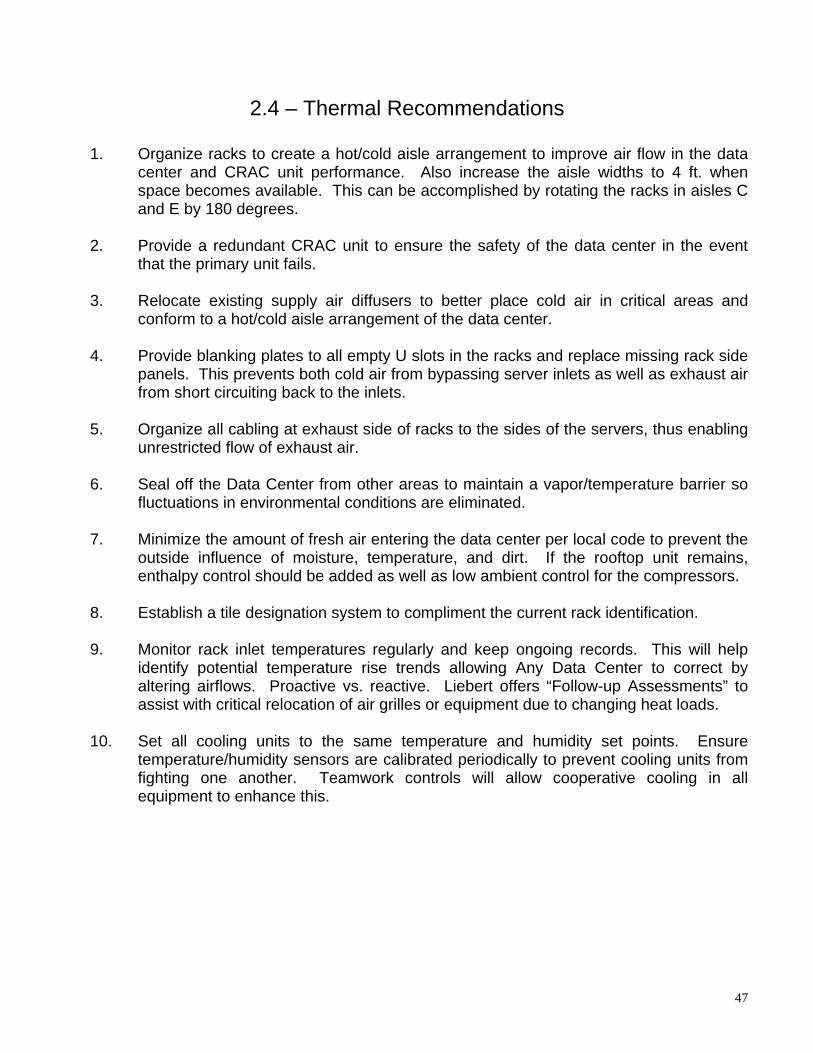
2.4 – Thermal Recommendations
1. Organize racks to create a hot/cold aisle arrangement to improve air flow in the data center and CRAC unit performance. Also increase the aisle widths to 4 ft. when space becomes available. This can be accomplished by rotating the racks in aisles C and E by 180 degrees.
2. Provide a redundant CRAC unit to ensure the safety of the data center in the event
that the primary unit fails.
3. Relocate existing supply air diffusers to better place cold air in critical areas and conform to a hot/cold aisle arrangement of the data center.
4. Provide blanking plates to all empty U slots in the racks and replace missing rack side
panels. This prevents both cold air from bypassing server inlets as well as exhaust air from short circuiting back to the inlets.
5. Organize all cabling at exhaust side of racks to the sides of the servers, thus enabling
unrestricted flow of exhaust air.
6. Seal off the Data Center from other areas to maintain a vapor/temperature barrier so fluctuations in environmental conditions are eliminated.
7. Minimize the amount of fresh air entering the data center per local code to prevent the
outside influence of moisture, temperature, and dirt. If the rooftop unit remains, enthalpy control should be added as well as low ambient control for the compressors.
8. Establish a tile designation system to compliment the current rack identification.
9. Monitor rack inlet temperatures regularly and keep ongoing records. This will help
identify potential temperature rise trends allowing Any Data Center to correct by altering airflows. Proactive vs. reactive. Liebert offers “Follow-up Assessments” to assist with critical relocation of air grilles or equipment due to changing heat loads.
10. Set all cooling units to the same temperature and humidity set points. Ensure
temperature/humidity sensors are calibrated periodically to prevent cooling units from fighting one another. Teamwork controls will allow cooperative cooling in all equipment to enhance this.
48
Thermal Assessment Section 3
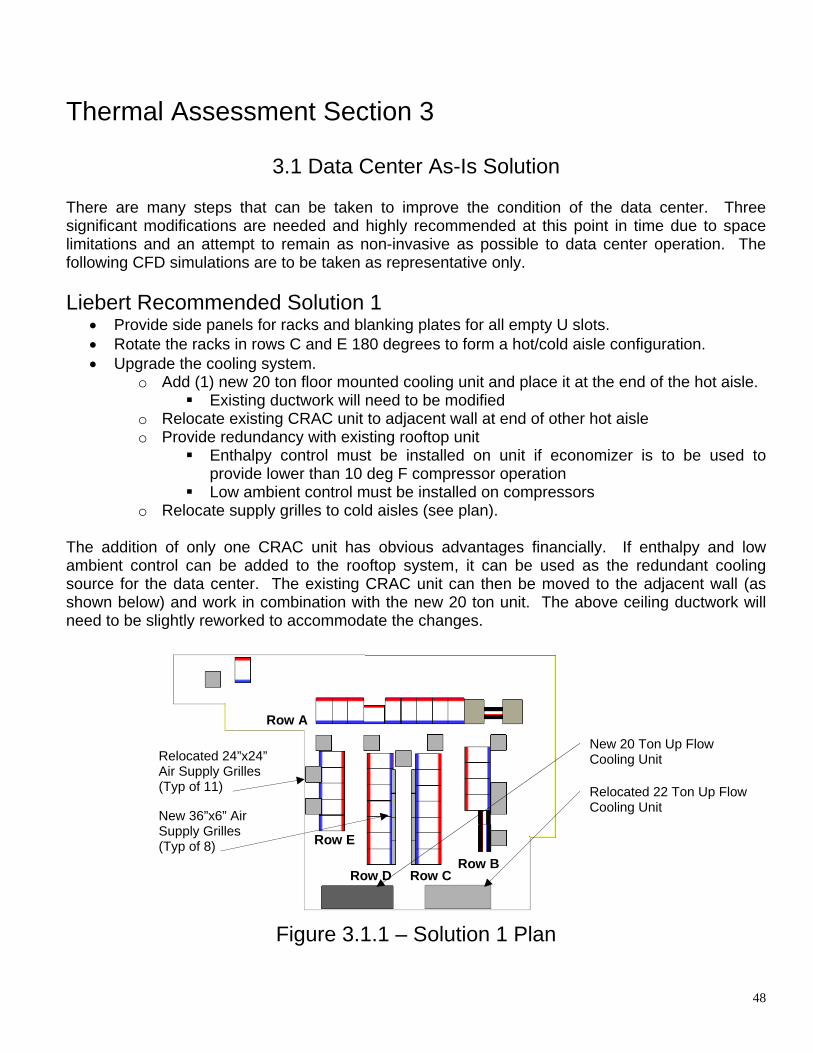
3.1 Data Center As-Is Solution There are many steps that can be taken to improve the condition of the data center. Three significant modifications are needed and highly recommended at this point in time due to space limitations and an attempt to remain as non-invasive as possible to data center operation. The following CFD simulations are to be taken as representative only. Liebert Recommended Solution 1
• Provide side panels for racks and blanking plates for all empty U slots. • Rotate the racks in rows C and E 180 degrees to form a hot/cold aisle configuration. • Upgrade the cooling system.
o Add (1) new 20 ton floor mounted cooling unit and place it at the end of the hot aisle. Existing ductwork will need to be modified
o Relocate existing CRAC unit to adjacent wall at end of other hot aisle o Provide redundancy with existing rooftop unit
Enthalpy control must be installed on unit if economizer is to be used to provide lower than 10 deg F compressor operation
Low ambient control must be installed on compressors o Relocate supply grilles to cold aisles (see plan).
The addition of only one CRAC unit has obvious advantages financially. If enthalpy and low ambient control can be added to the rooftop system, it can be used as the redundant cooling source for the data center. The existing CRAC unit can then be moved to the adjacent wall (as shown below) and work in combination with the new 20 ton unit. The above ceiling ductwork will need to be slightly reworked to accommodate the changes.
Figure 3.1.1 – Solution 1 Plan
New 36”x6” Air Supply Grilles (Typ of 8)
Relocated 24”x24” Air Supply Grilles (Typ of 11)
New 20 Ton Up Flow Cooling Unit
Relocated 22 Ton Up Flow Cooling Unit
Row A
Row BRow CRow D
Row E
49
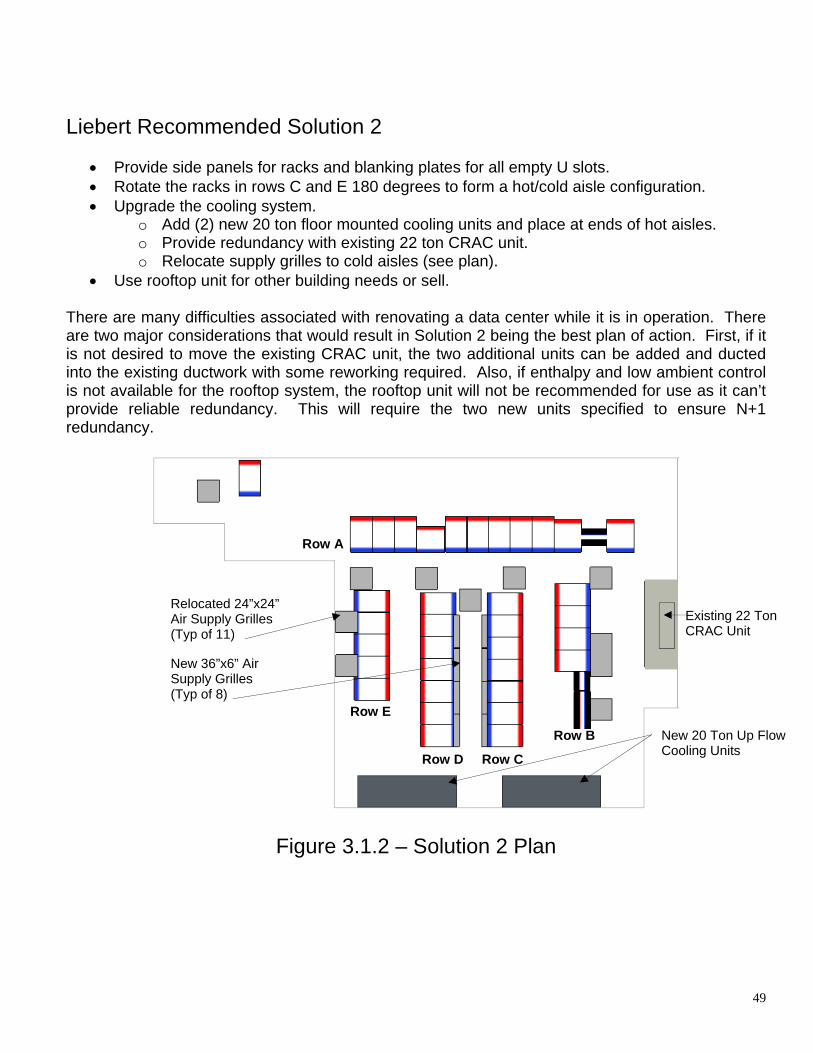
Liebert Recommended Solution 2
• Provide side panels for racks and blanking plates for all empty U slots. • Rotate the racks in rows C and E 180 degrees to form a hot/cold aisle configuration. • Upgrade the cooling system.
o Add (2) new 20 ton floor mounted cooling units and place at ends of hot aisles. o Provide redundancy with existing 22 ton CRAC unit. o Relocate supply grilles to cold aisles (see plan).
• Use rooftop unit for other building needs or sell. There are many difficulties associated with renovating a data center while it is in operation. There are two major considerations that would result in Solution 2 being the best plan of action. First, if it is not desired to move the existing CRAC unit, the two additional units can be added and ducted into the existing ductwork with some reworking required. Also, if enthalpy and low ambient control is not available for the rooftop system, the rooftop unit will not be recommended for use as it can’t provide reliable redundancy. This will require the two new units specified to ensure N+1 redundancy.
Figure 3.1.2 – Solution 2 Plan
Relocated 24”x24” Air Supply Grilles (Typ of 11)
New 36”x6” Air Supply Grilles (Typ of 8)
New 20 Ton Up Flow Cooling Units
Existing 22 Ton CRAC Unit
Row A
Row B
Row CRow D
Row E
50
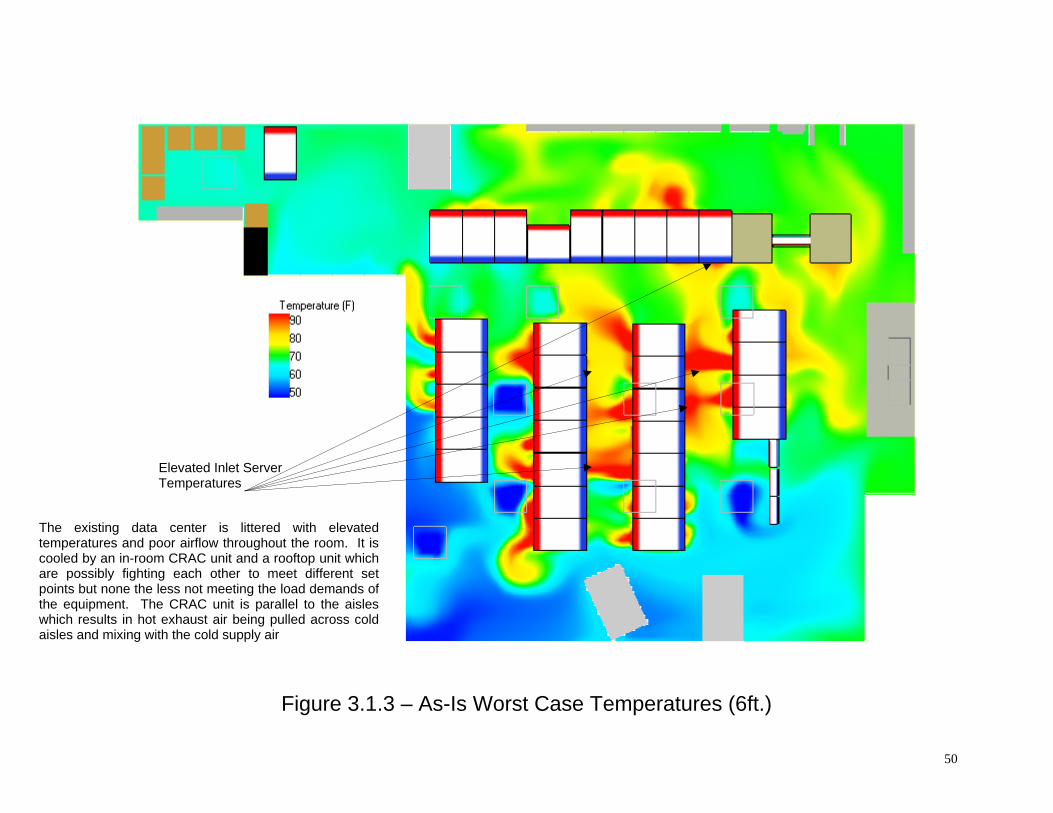
Figure 3.1.3 – As-Is Worst Case Temperatures (6ft.)
Elevated Inlet Server Temperatures
The existing data center is littered with elevated temperatures and poor airflow throughout the room. It is cooled by an in-room CRAC unit and a rooftop unit which are possibly fighting each other to meet different set points but none the less not meeting the load demands of the equipment. The CRAC unit is parallel to the aisles which results in hot exhaust air being pulled across cold aisles and mixing with the cold supply air
51
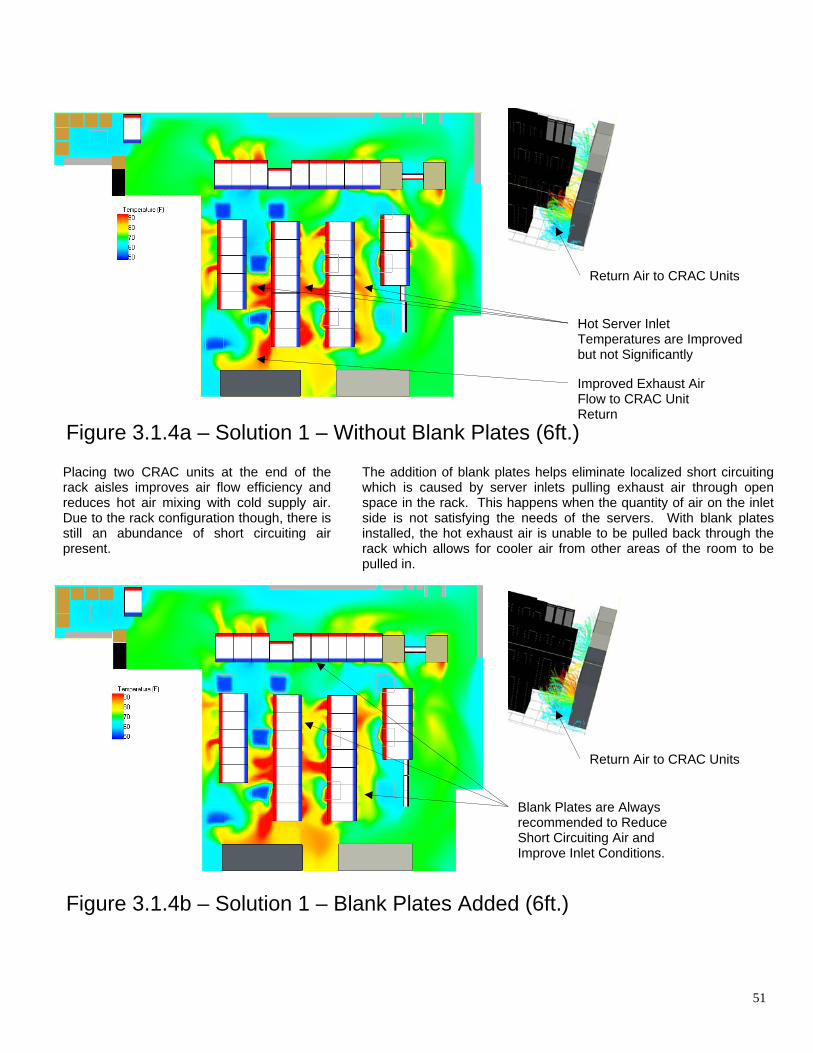
Figure 3.1.4a – Solution 1 – Without Blank Plates (6ft.)
Figure 3.1.4b – Solution 1 – Blank Plates Added (6ft.)
Improved Exhaust Air Flow to CRAC Unit Return
Hot Server Inlet Temperatures are Improved but not Significantly
Return Air to CRAC Units
Blank Plates are Always recommended to Reduce Short Circuiting Air and Improve Inlet Conditions.
Return Air to CRAC Units
Placing two CRAC units at the end of the rack aisles improves air flow efficiency and reduces hot air mixing with cold supply air. Due to the rack configuration though, there is still an abundance of short circuiting air present.
The addition of blank plates helps eliminate localized short circuiting which is caused by server inlets pulling exhaust air through open space in the rack. This happens when the quantity of air on the inlet side is not satisfying the needs of the servers. With blank plates installed, the hot exhaust air is unable to be pulled back through the rack which allows for cooler air from other areas of the room to be pulled in.
52
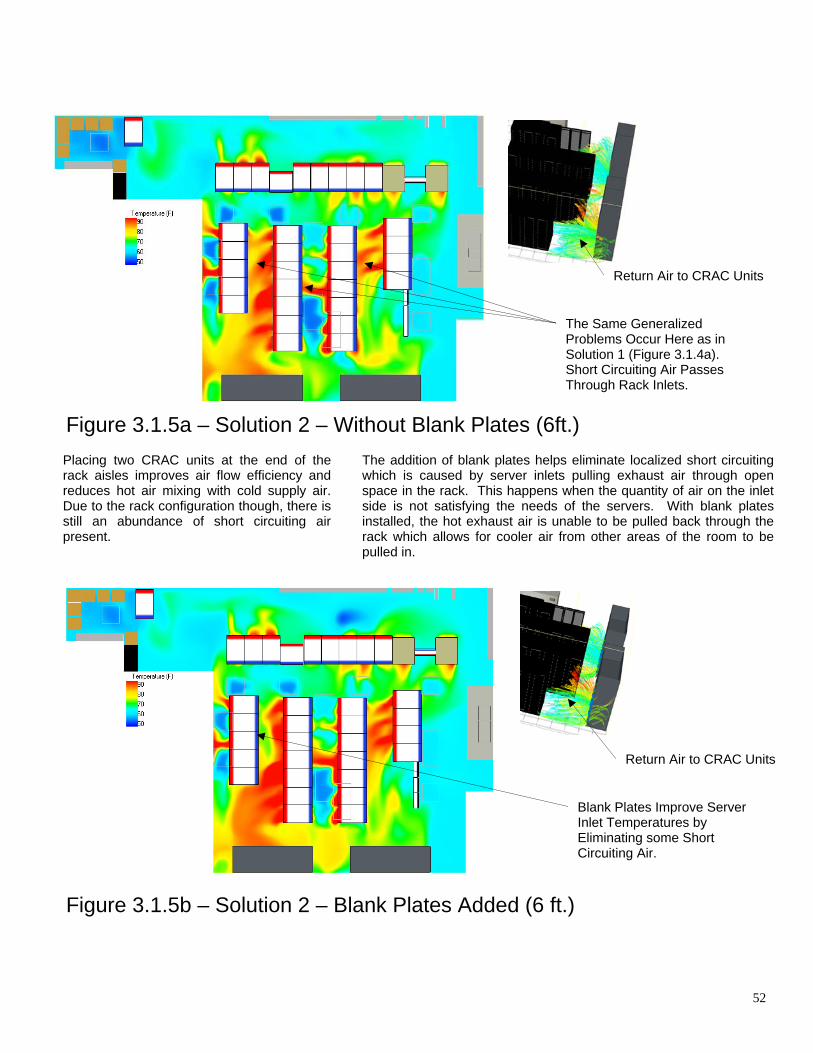
Figure 3.1.5a – Solution 2 – Without Blank Plates (6ft.)
Figure 3.1.5b – Solution 2 – Blank Plates Added (6 ft.)
Return Air to CRAC Units
Blank Plates Improve Server Inlet Temperatures by Eliminating some Short Circuiting Air.
Return Air to CRAC Units
The Same Generalized Problems Occur Here as in Solution 1 (Figure 3.1.4a). Short Circuiting Air Passes Through Rack Inlets.
Placing two CRAC units at the end of the rack aisles improves air flow efficiency and reduces hot air mixing with cold supply air. Due to the rack configuration though, there is still an abundance of short circuiting air present.
The addition of blank plates helps eliminate localized short circuiting which is caused by server inlets pulling exhaust air through open space in the rack. This happens when the quantity of air on the inlet side is not satisfying the needs of the servers. With blank plates installed, the hot exhaust air is unable to be pulled back through the rack which allows for cooler air from other areas of the room to be pulled in.

53
Figure 3.1.6a – Solution 1 – Hot/Cold Aisle w/out Blank Plates (6ft.)
Figure 3.1.6b – Solution 1 – Hot/Cold Aisle w/Blank Plates (6ft.)
The Hot/Cold Aisle Arrangement Improves Flow. There is Still Some Short Circuiting Around The Aisle with This Solution.
Return Air to CRAC Units
Blank Plates Reduce the Presence of Hot Air in the Cold Aisle.
Return Air to CRAC Units
Reconfiguring the rack layout to a hot/cold aisle arrangement provides immense improvements to data center efficiency. The hot exhaust air is isolated away from server inlets much more efficiently, especially with blank plates installed on all empty U slots. In this layout, air supply grilles can be relocated to provide cold air only where it is needed.
54
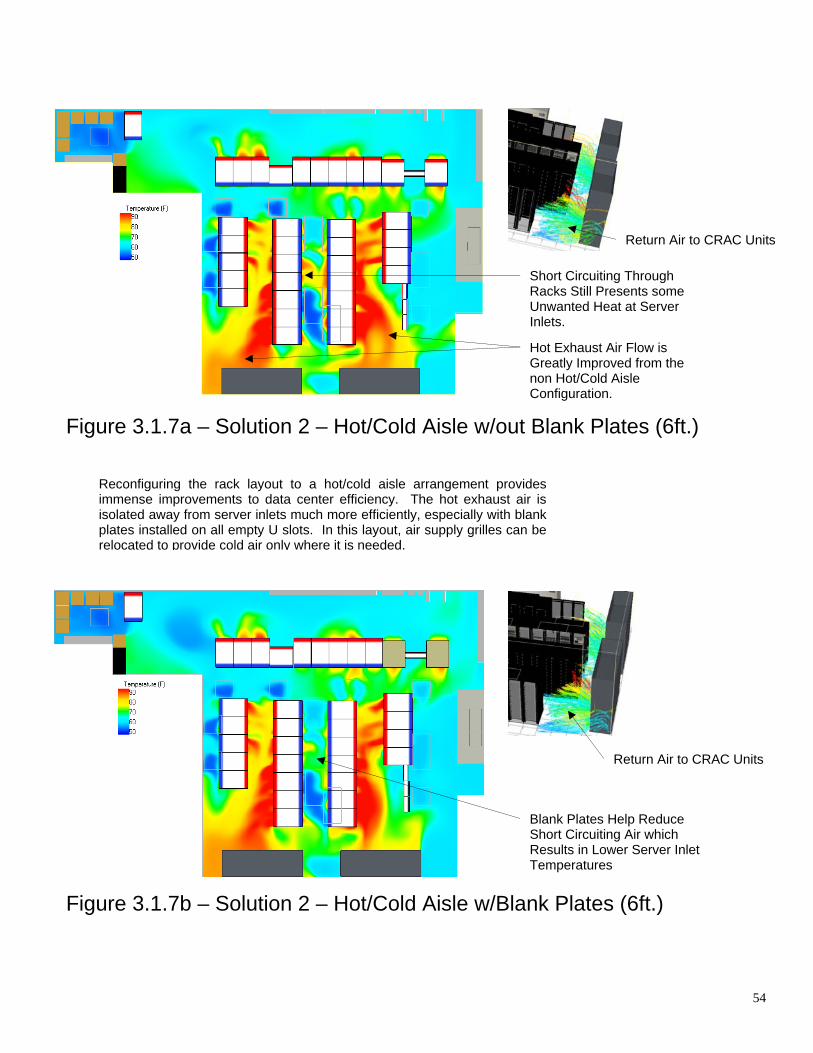
Figure 3.1.7a – Solution 2 – Hot/Cold Aisle w/out Blank Plates (6ft.)
Figure 3.1.7b – Solution 2 – Hot/Cold Aisle w/Blank Plates (6ft.)
Hot Exhaust Air Flow is Greatly Improved from the non Hot/Cold Aisle Configuration.
Short Circuiting Through Racks Still Presents some Unwanted Heat at Server Inlets.
Return Air to CRAC Units
Blank Plates Help Reduce Short Circuiting Air which Results in Lower Server Inlet Temperatures
Return Air to CRAC Units
Reconfiguring the rack layout to a hot/cold aisle arrangement provides immense improvements to data center efficiency. The hot exhaust air is isolated away from server inlets much more efficiently, especially with blank plates installed on all empty U slots. In this layout, air supply grilles can be relocated to provide cold air only where it is needed.
55
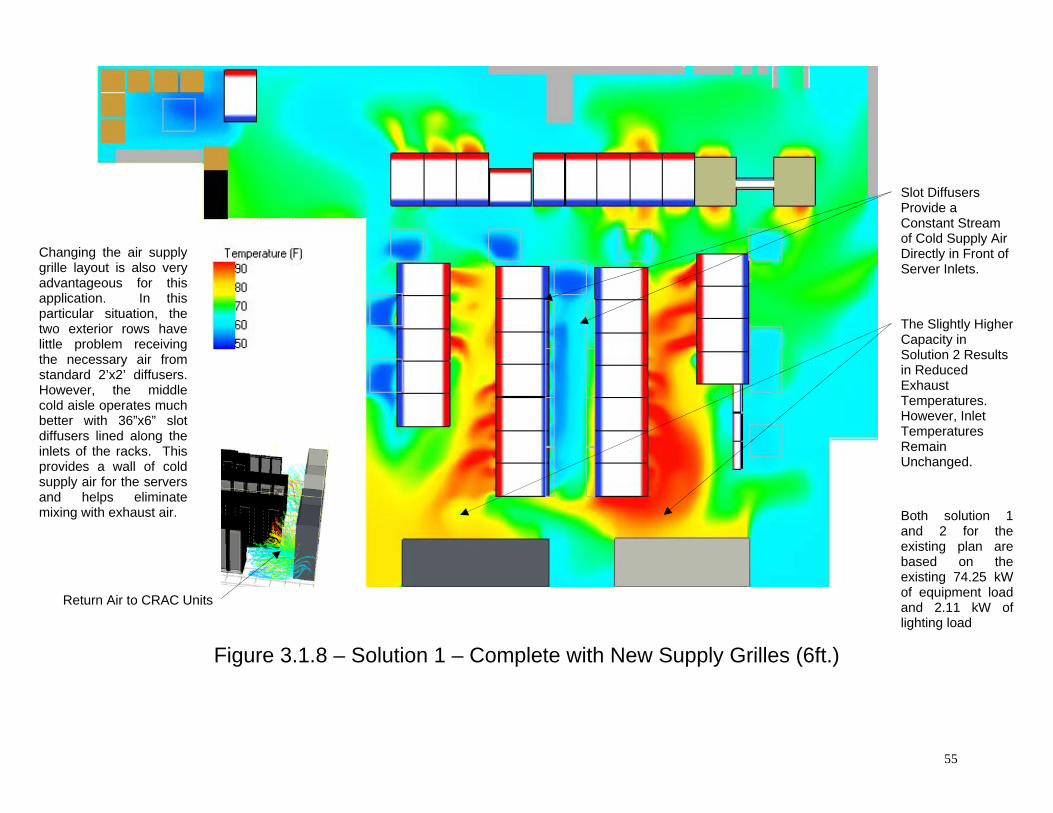
Figure 3.1.8 – Solution 1 – Complete with New Supply Grilles (6ft.)
Slot Diffusers Provide a Constant Stream of Cold Supply Air Directly in Front of Server Inlets.
Return Air to CRAC Units
The Slightly Higher Capacity in Solution 2 Results in Reduced Exhaust Temperatures. However, Inlet Temperatures Remain Unchanged.
Changing the air supply grille layout is also very advantageous for this application. In this particular situation, the two exterior rows have little problem receiving the necessary air from standard 2’x2’ diffusers. However, the middle cold aisle operates much better with 36”x6” slot diffusers lined along the inlets of the racks. This provides a wall of cold supply air for the servers and helps eliminate mixing with exhaust air. Both solution 1
and 2 for the existing plan are based on the existing 74.25 kW of equipment load and 2.11 kW of lighting load
56
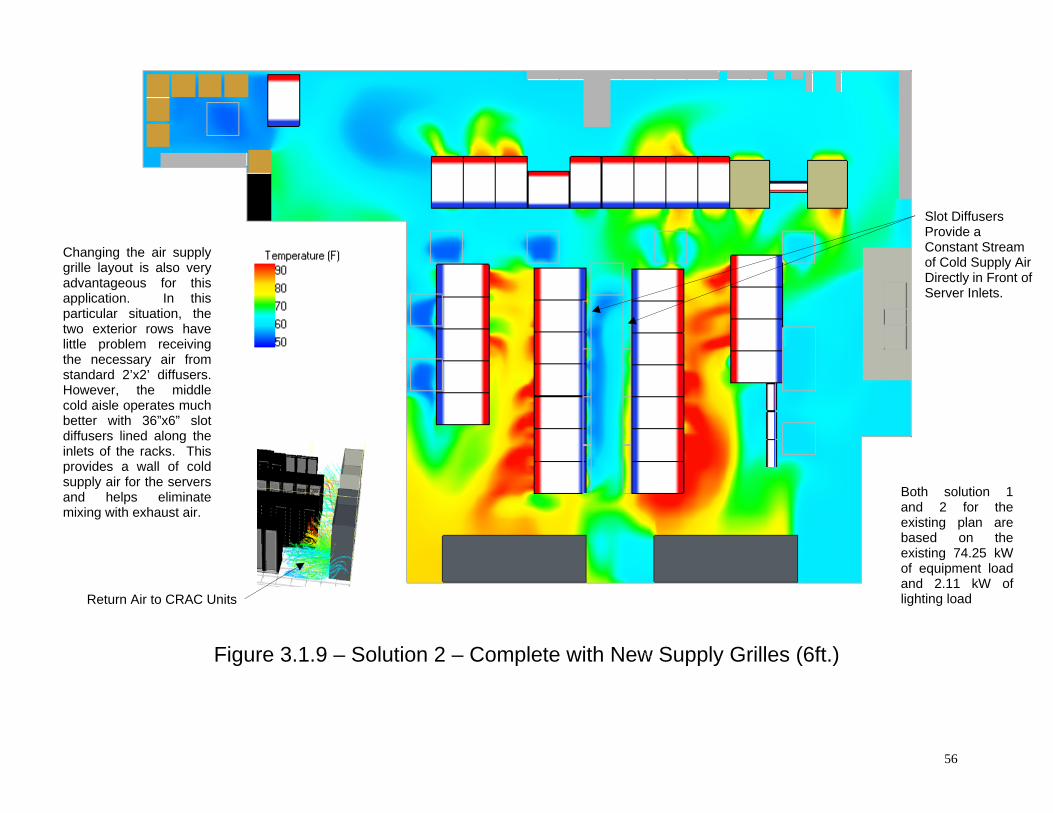
Figure 3.1.9 – Solution 2 – Complete with New Supply Grilles (6ft.)
Slot Diffusers Provide a Constant Stream of Cold Supply Air Directly in Front of Server Inlets.
Return Air to CRAC Units
Changing the air supply grille layout is also very advantageous for this application. In this particular situation, the two exterior rows have little problem receiving the necessary air from standard 2’x2’ diffusers. However, the middle cold aisle operates much better with 36”x6” slot diffusers lined along the inlets of the racks. This provides a wall of cold supply air for the servers and helps eliminate mixing with exhaust air.
Both solution 1 and 2 for the existing plan are based on the existing 74.25 kW of equipment load and 2.11 kW of lighting load
57
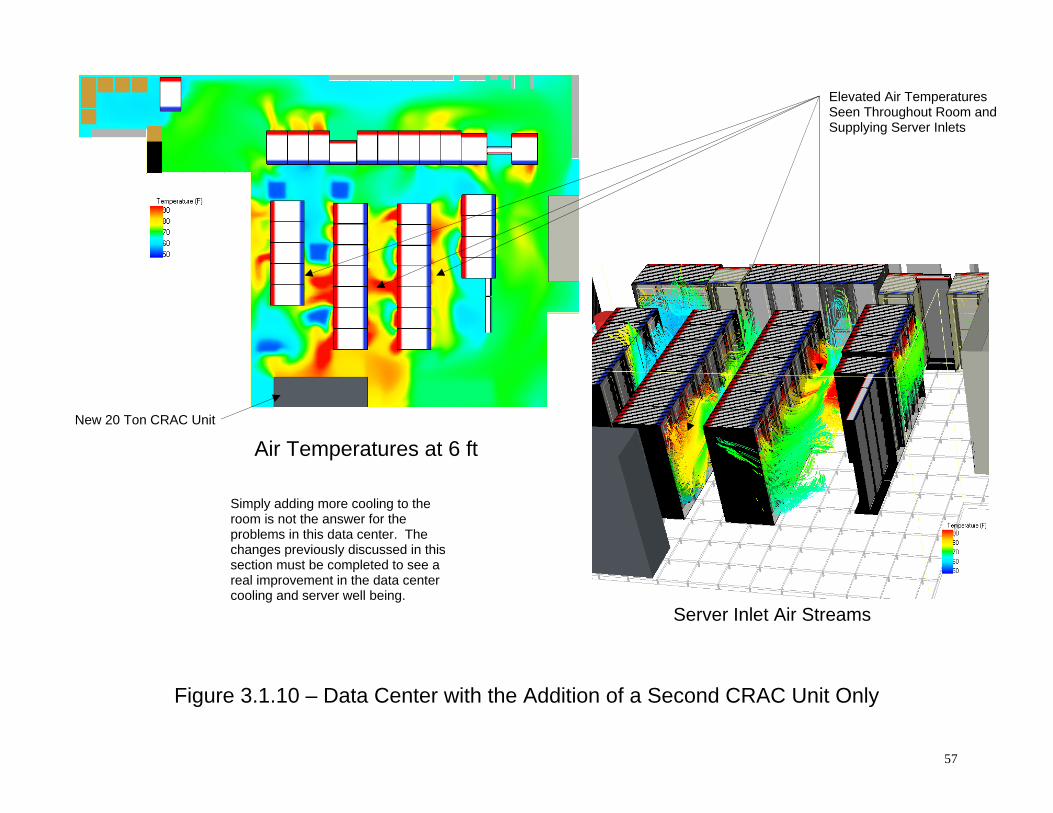
Figure 3.1.10 – Data Center with the Addition of a Second CRAC Unit Only
Air Temperatures at 6 ft
Server Inlet Air Streams
Elevated Air Temperatures Seen Throughout Room and Supplying Server Inlets
Simply adding more cooling to the room is not the answer for the problems in this data center. The changes previously discussed in this section must be completed to see a real improvement in the data center cooling and server well being.
New 20 Ton CRAC Unit
58
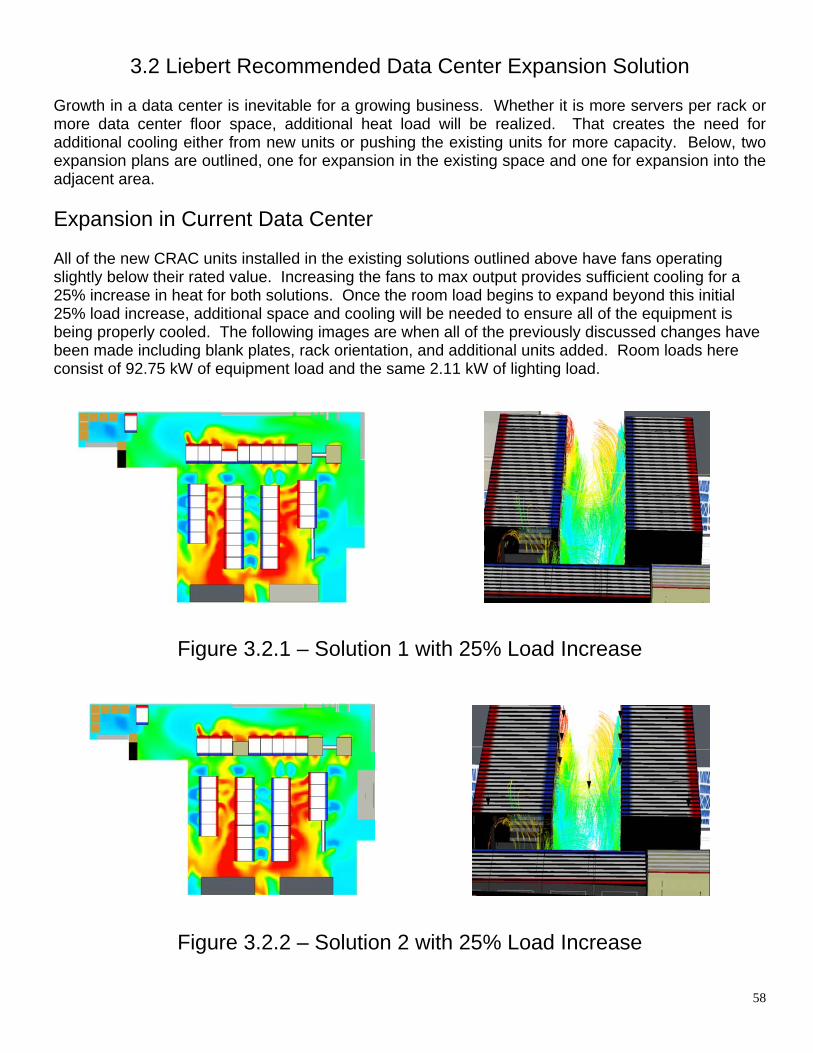
3.2 Liebert Recommended Data Center Expansion Solution Growth in a data center is inevitable for a growing business. Whether it is more servers per rack or more data center floor space, additional heat load will be realized. That creates the need for additional cooling either from new units or pushing the existing units for more capacity. Below, two expansion plans are outlined, one for expansion in the existing space and one for expansion into the adjacent area. Expansion in Current Data Center All of the new CRAC units installed in the existing solutions outlined above have fans operating slightly below their rated value. Increasing the fans to max output provides sufficient cooling for a 25% increase in heat for both solutions. Once the room load begins to expand beyond this initial 25% load increase, additional space and cooling will be needed to ensure all of the equipment is being properly cooled. The following images are when all of the previously discussed changes have been made including blank plates, rack orientation, and additional units added. Room loads here consist of 92.75 kW of equipment load and the same 2.11 kW of lighting load.
Figure 3.2.1 – Solution 1 with 25% Load Increase
Figure 3.2.2 – Solution 2 with 25% Load Increase
59
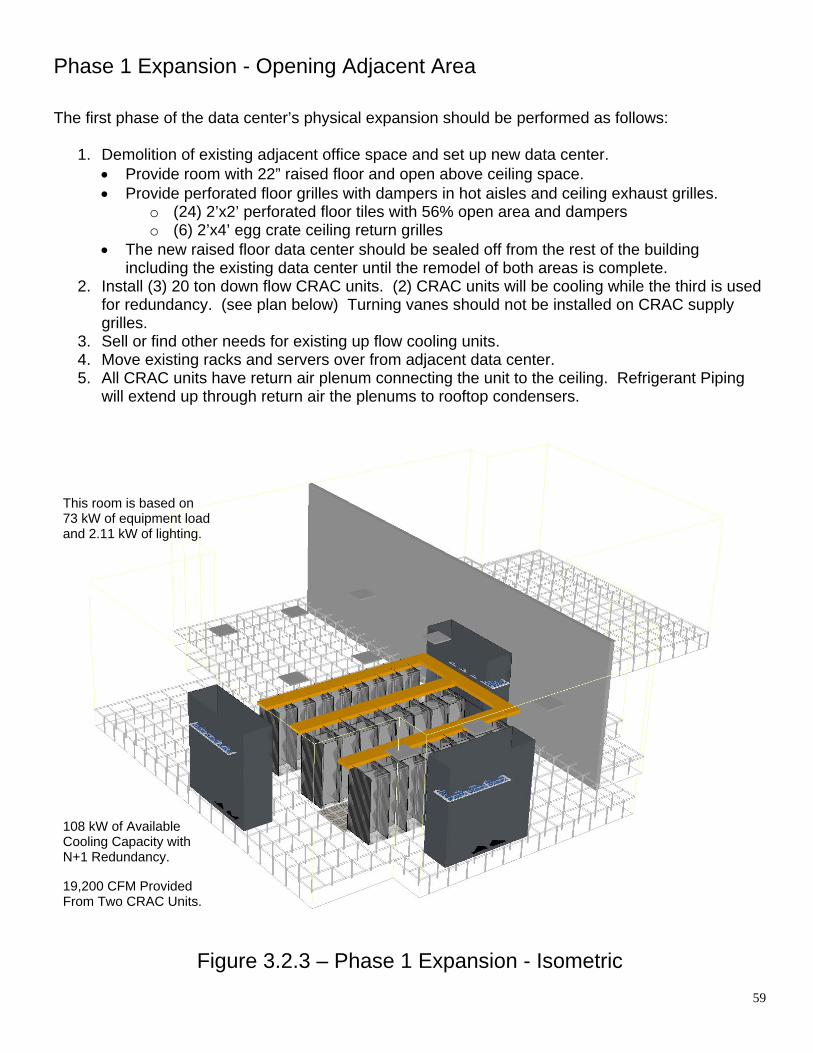
Phase 1 Expansion - Opening Adjacent Area The first phase of the data center’s physical expansion should be performed as follows:
1. Demolition of existing adjacent office space and set up new data center. • Provide room with 22” raised floor and open above ceiling space. • Provide perforated floor grilles with dampers in hot aisles and ceiling exhaust grilles.
o (24) 2’x2’ perforated floor tiles with 56% open area and dampers o (6) 2’x4’ egg crate ceiling return grilles
• The new raised floor data center should be sealed off from the rest of the building including the existing data center until the remodel of both areas is complete.
2. Install (3) 20 ton down flow CRAC units. (2) CRAC units will be cooling while the third is used for redundancy. (see plan below) Turning vanes should not be installed on CRAC supply grilles.
3. Sell or find other needs for existing up flow cooling units. 4. Move existing racks and servers over from adjacent data center. 5. All CRAC units have return air plenum connecting the unit to the ceiling. Refrigerant Piping
will extend up through return air the plenums to rooftop condensers.
Figure 3.2.3 – Phase 1 Expansion - Isometric
This room is based on 73 kW of equipment load and 2.11 kW of lighting.
108 kW of Available Cooling Capacity with N+1 Redundancy.
19,200 CFM Provided From Two CRAC Units.
60
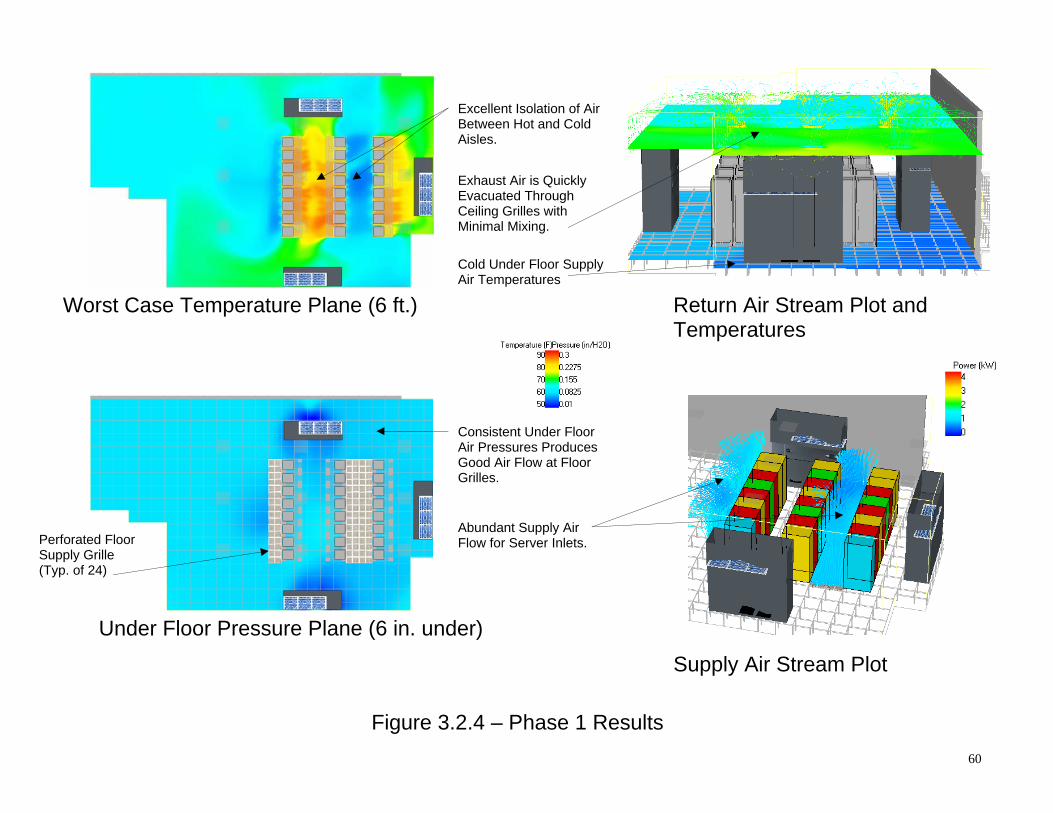
Figure 3.2.4 – Phase 1 Results
Worst Case Temperature Plane (6 ft.)
Under Floor Pressure Plane (6 in. under)
Return Air Stream Plot and Temperatures
Supply Air Stream Plot
Excellent Isolation of Air Between Hot and Cold Aisles.
Exhaust Air is Quickly Evacuated Through Ceiling Grilles with Minimal Mixing.
Cold Under Floor Supply Air Temperatures
Consistent Under Floor Air Pressures Produces Good Air Flow at Floor Grilles.
Abundant Supply Air Flow for Server Inlets. Perforated Floor
Supply Grille (Typ. of 24)
61
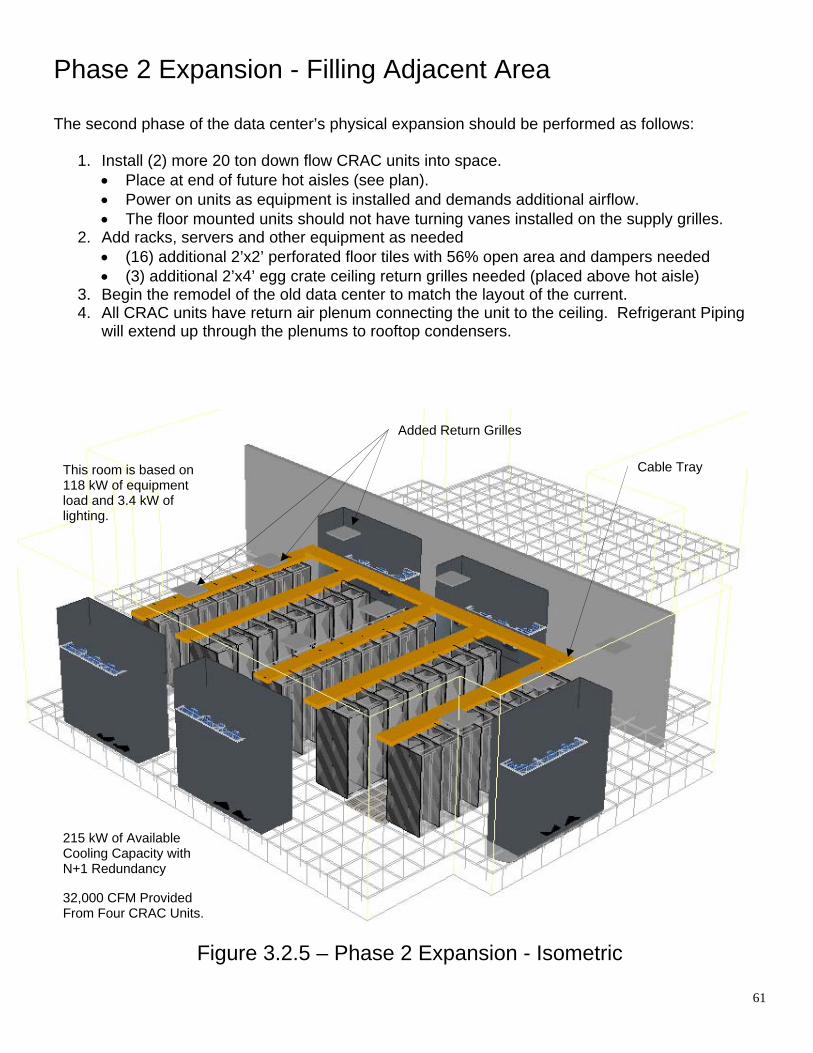
Phase 2 Expansion - Filling Adjacent Area The second phase of the data center’s physical expansion should be performed as follows:
1. Install (2) more 20 ton down flow CRAC units into space. • Place at end of future hot aisles (see plan). • Power on units as equipment is installed and demands additional airflow. • The floor mounted units should not have turning vanes installed on the supply grilles.
2. Add racks, servers and other equipment as needed • (16) additional 2’x2’ perforated floor tiles with 56% open area and dampers needed • (3) additional 2’x4’ egg crate ceiling return grilles needed (placed above hot aisle)
3. Begin the remodel of the old data center to match the layout of the current. 4. All CRAC units have return air plenum connecting the unit to the ceiling. Refrigerant Piping
will extend up through the plenums to rooftop condensers.
Figure 3.2.5 – Phase 2 Expansion - Isometric
This room is based on 118 kW of equipment load and 3.4 kW of lighting.
215 kW of Available Cooling Capacity with N+1 Redundancy
32,000 CFM Provided From Four CRAC Units.
Cable Tray
Added Return Grilles
62
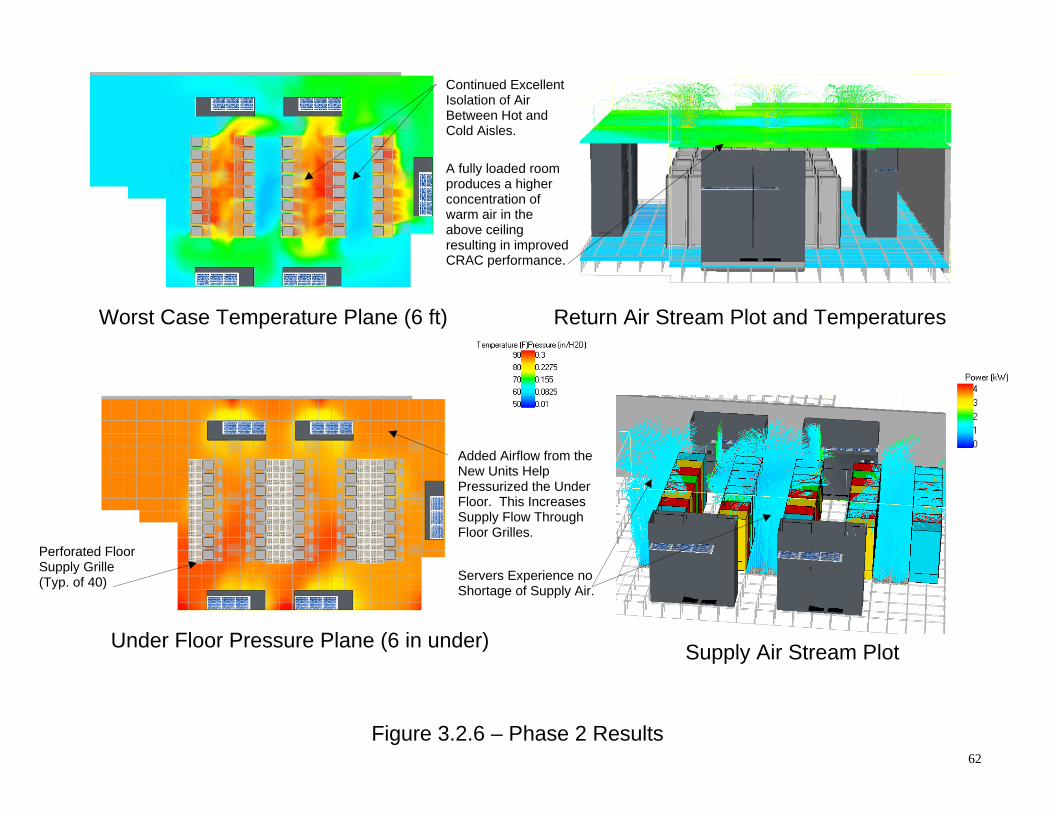
Figure 3.2.6 – Phase 2 Results
Worst Case Temperature Plane (6 ft) Return Air Stream Plot and Temperatures
Under Floor Pressure Plane (6 in under) Supply Air Stream Plot
Continued Excellent Isolation of Air Between Hot and Cold Aisles.
A fully loaded room produces a higher concentration of warm air in the above ceiling resulting in improved CRAC performance.
Added Airflow from the New Units Help Pressurized the Under Floor. This Increases Supply Flow Through Floor Grilles.
Servers Experience no Shortage of Supply Air.
Perforated Floor Supply Grille (Typ. of 40)
63
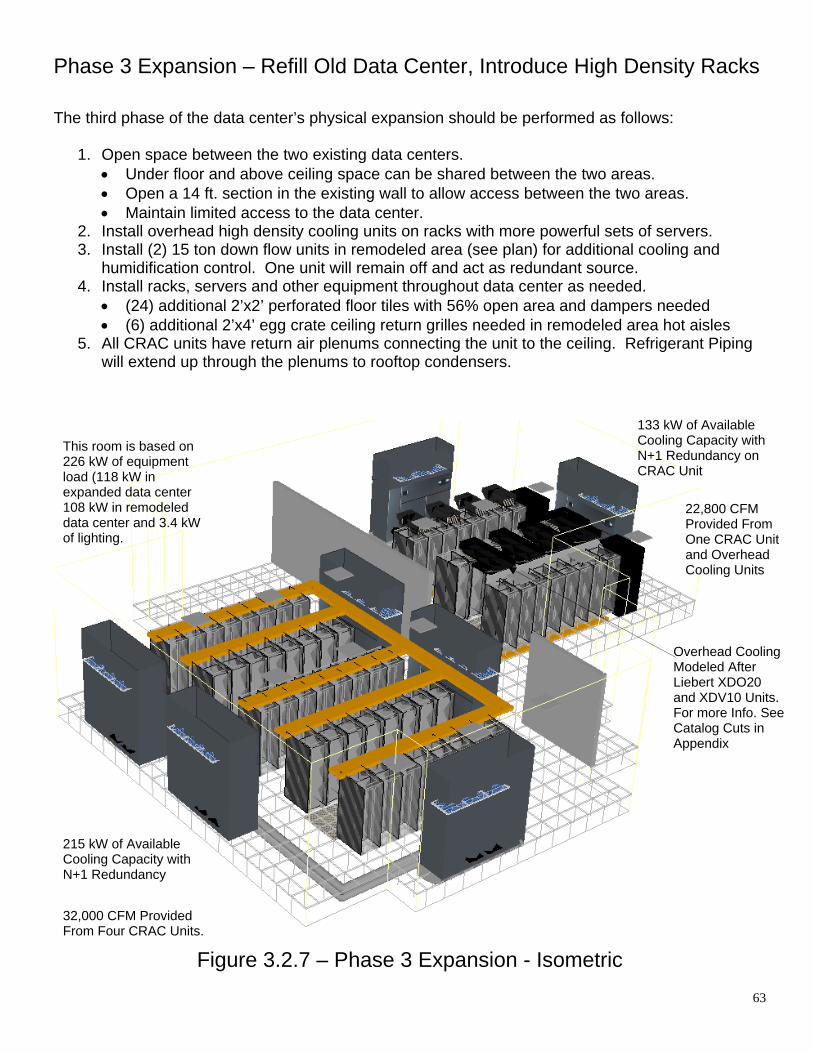
Phase 3 Expansion – Refill Old Data Center, Introduce High Density Racks The third phase of the data center’s physical expansion should be performed as follows:
1. Open space between the two existing data centers. • Under floor and above ceiling space can be shared between the two areas. • Open a 14 ft. section in the existing wall to allow access between the two areas. • Maintain limited access to the data center.
2. Install overhead high density cooling units on racks with more powerful sets of servers. 3. Install (2) 15 ton down flow units in remodeled area (see plan) for additional cooling and
humidification control. One unit will remain off and act as redundant source. 4. Install racks, servers and other equipment throughout data center as needed.
• (24) additional 2’x2’ perforated floor tiles with 56% open area and dampers needed • (6) additional 2’x4’ egg crate ceiling return grilles needed in remodeled area hot aisles
5. All CRAC units have return air plenums connecting the unit to the ceiling. Refrigerant Piping will extend up through the plenums to rooftop condensers.
Figure 3.2.7 – Phase 3 Expansion - Isometric
This room is based on 226 kW of equipment load (118 kW in expanded data center 108 kW in remodeled data center and 3.4 kW of lighting.
215 kW of Available Cooling Capacity with N+1 Redundancy
133 kW of Available Cooling Capacity with N+1 Redundancy on CRAC Unit
32,000 CFM Provided From Four CRAC Units.
22,800 CFM Provided From One CRAC Unit and Overhead Cooling Units
Overhead Cooling Modeled After Liebert XDO20 and XDV10 Units. For more Info. See Catalog Cuts in Appendix
64
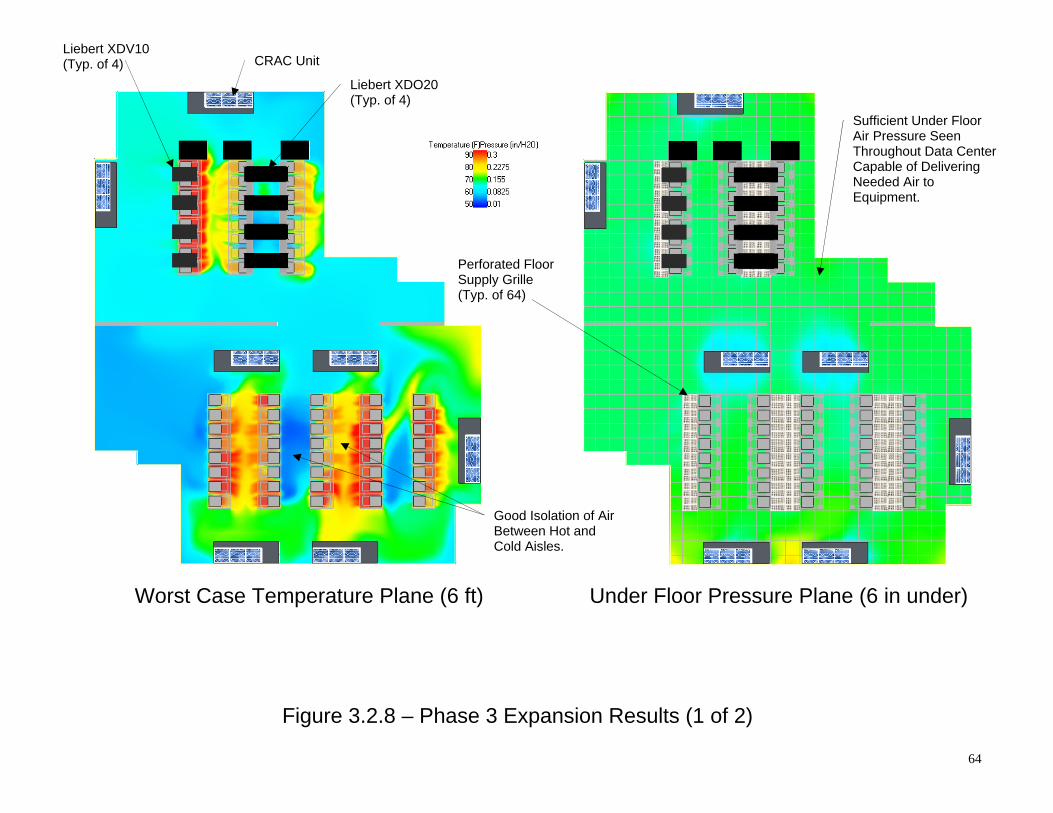
Figure 3.2.8 – Phase 3 Expansion Results (1 of 2)
Worst Case Temperature Plane (6 ft) Under Floor Pressure Plane (6 in under)
Good Isolation of Air Between Hot and Cold Aisles.
Sufficient Under Floor Air Pressure Seen Throughout Data Center Capable of Delivering Needed Air to Equipment.
Liebert XDO20 (Typ. of 4)
Liebert XDV10 (Typ. of 4)
Perforated Floor Supply Grille (Typ. of 64)
CRAC Unit

65
Figure 3.2.8 – Phase 3 Expansion Results (2 of 2)
Return Air Stream Plot and Temperatures
Supply Air Stream Plot Supply Air Stream Plot
Combined Room Loads Deliver an Overall Effective Set of Return Air Temperatures to Cooling Units.
Abundant Cold Supply Air Available For Equipment Cooling.
66
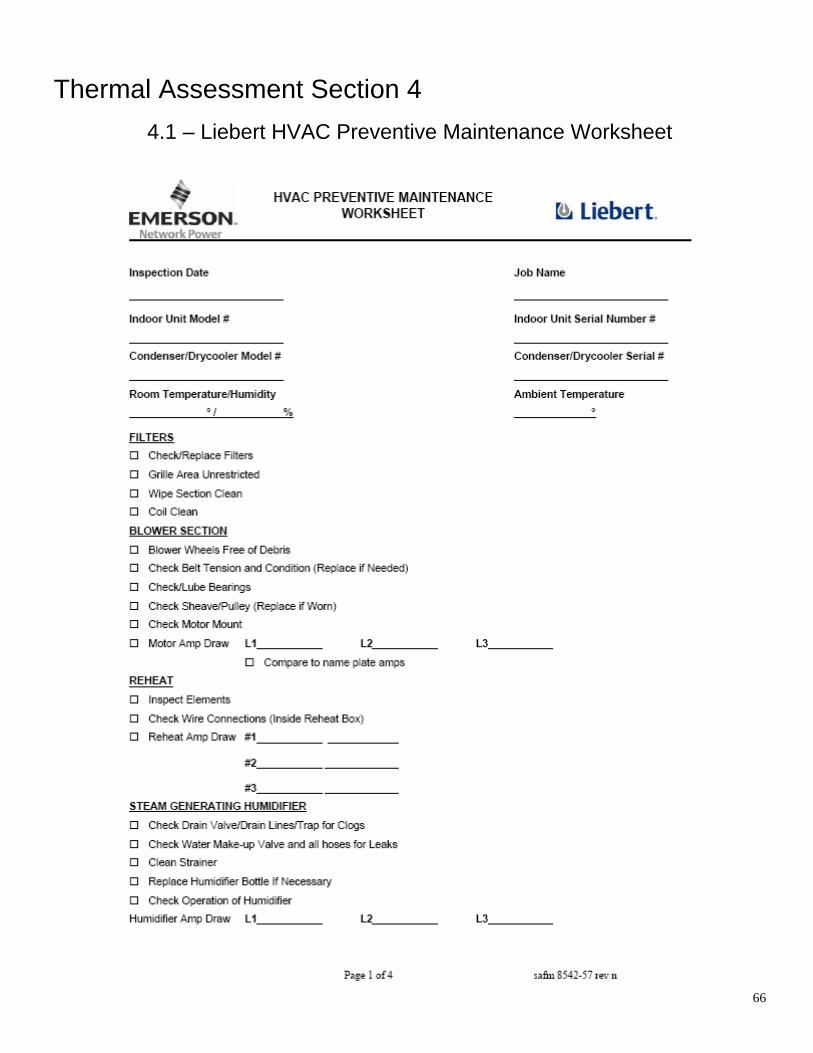
Thermal Assessment Section 4
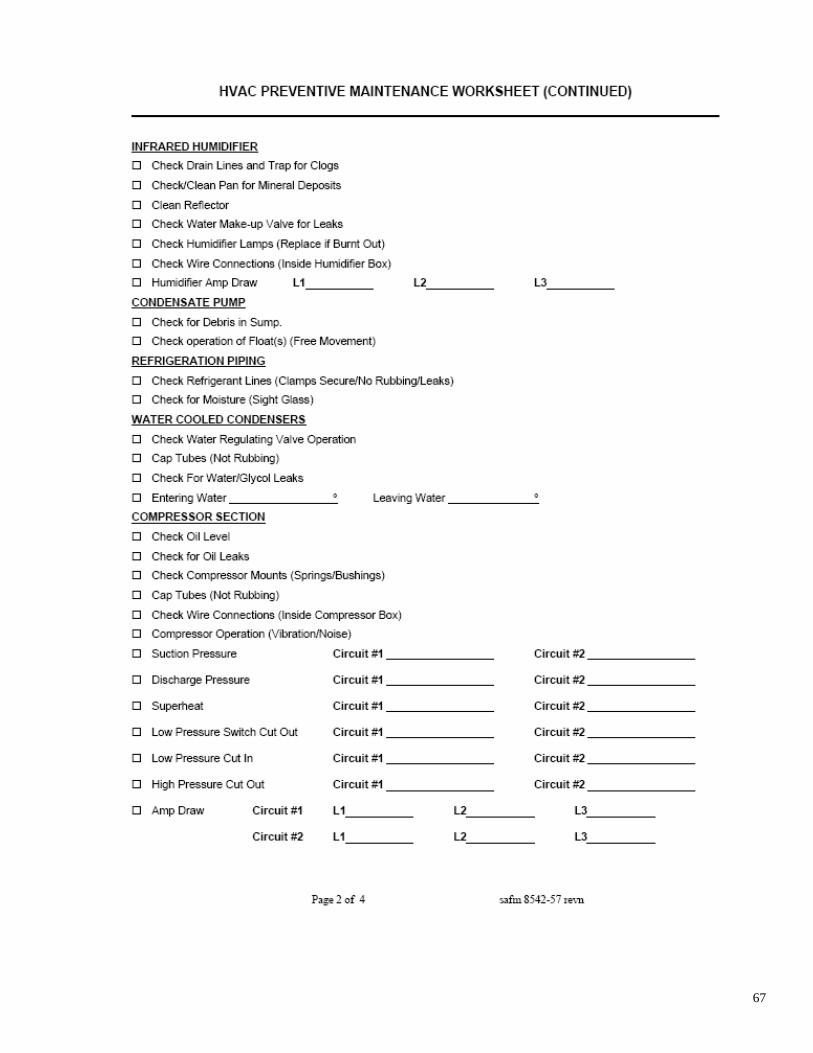
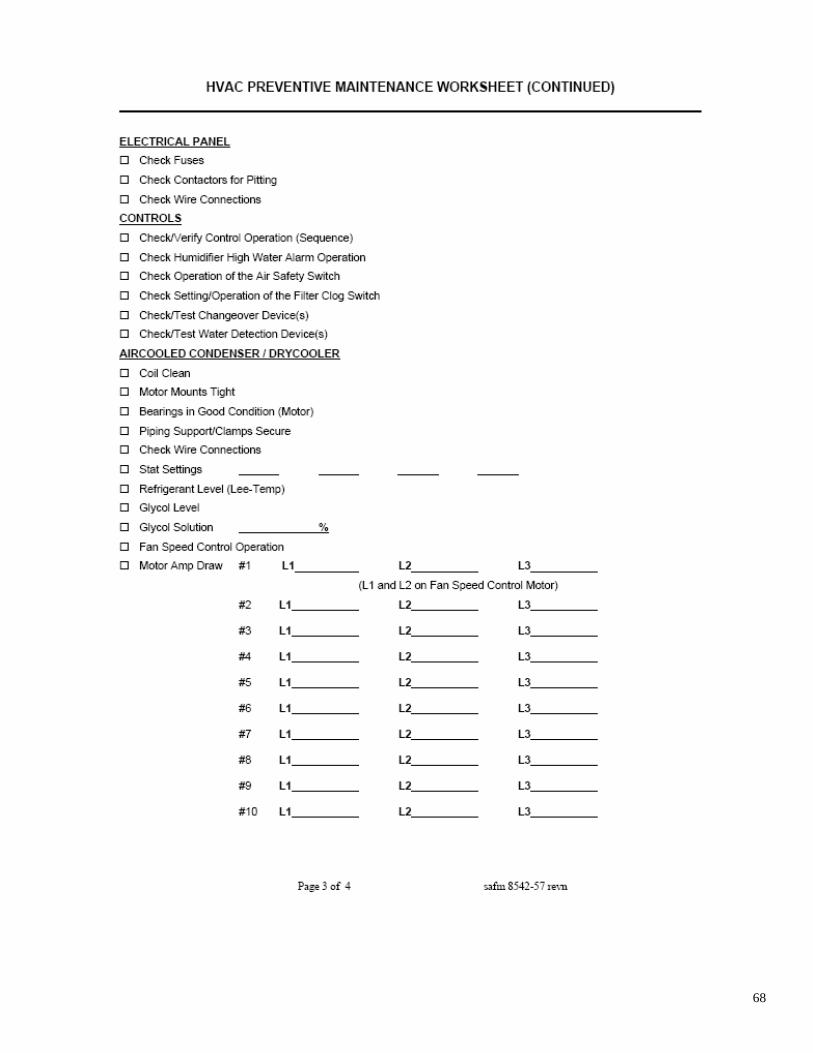
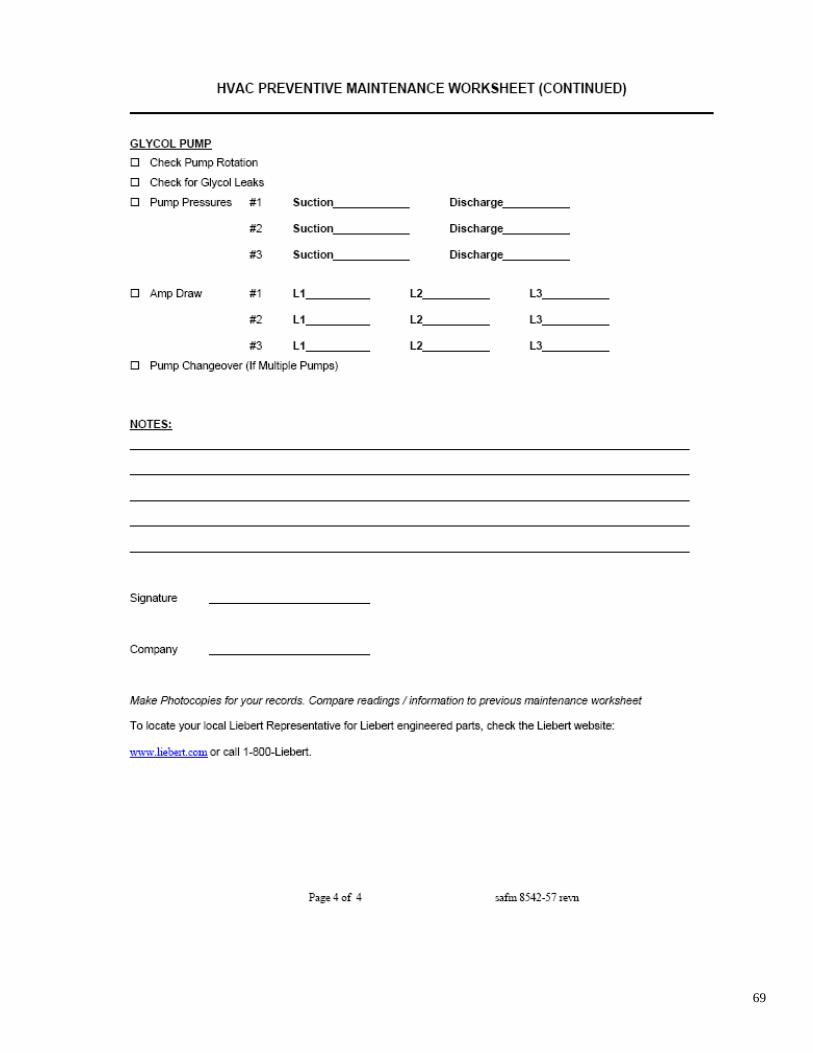
4.1 – Liebert HVAC Preventive Maintenance Worksheet
67
68
69
70
4.2 – Appendix
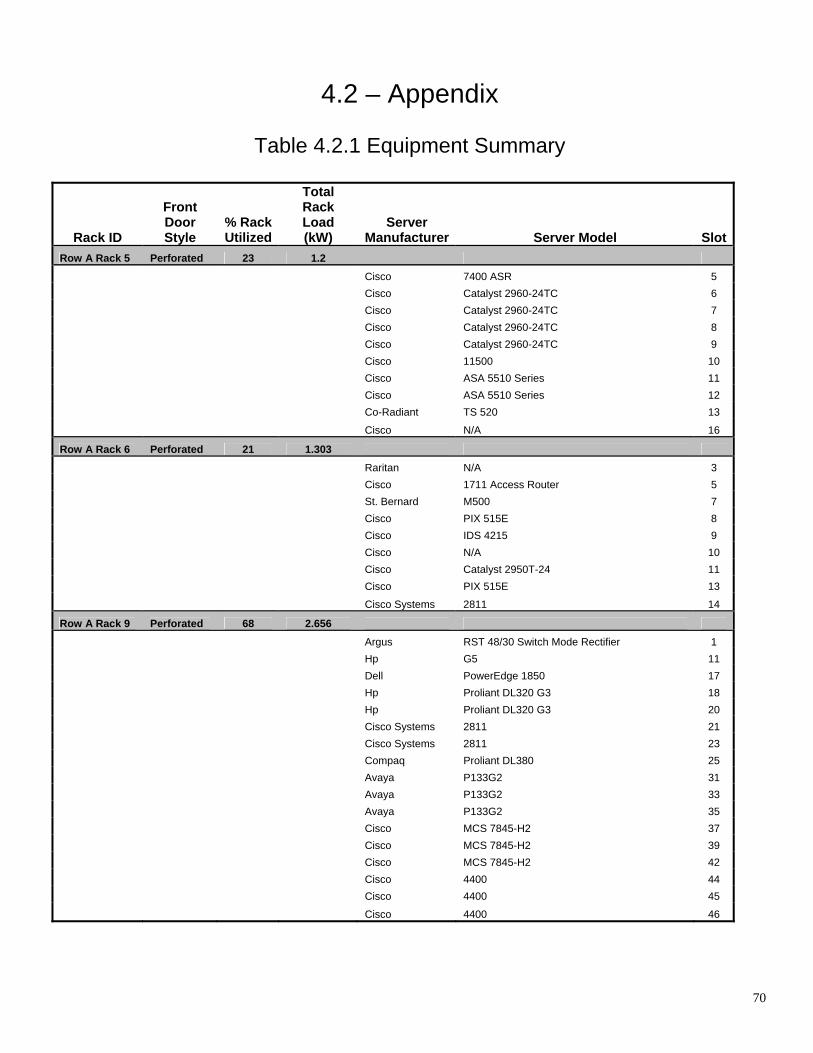
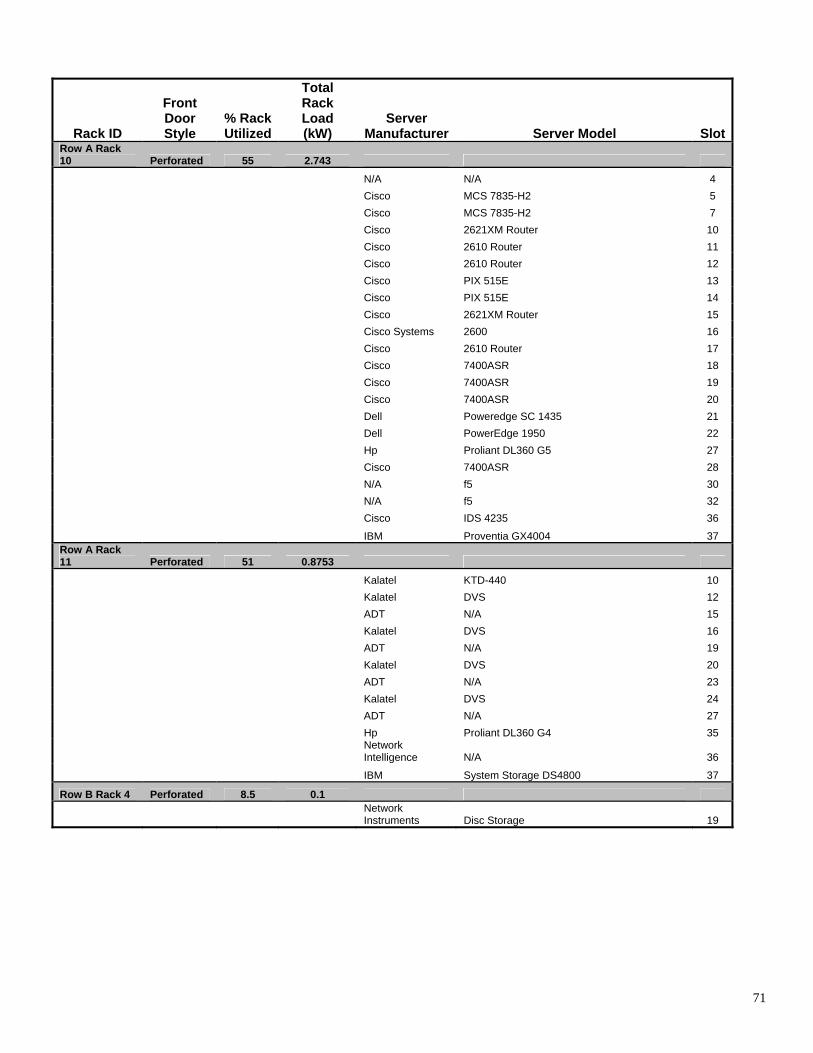
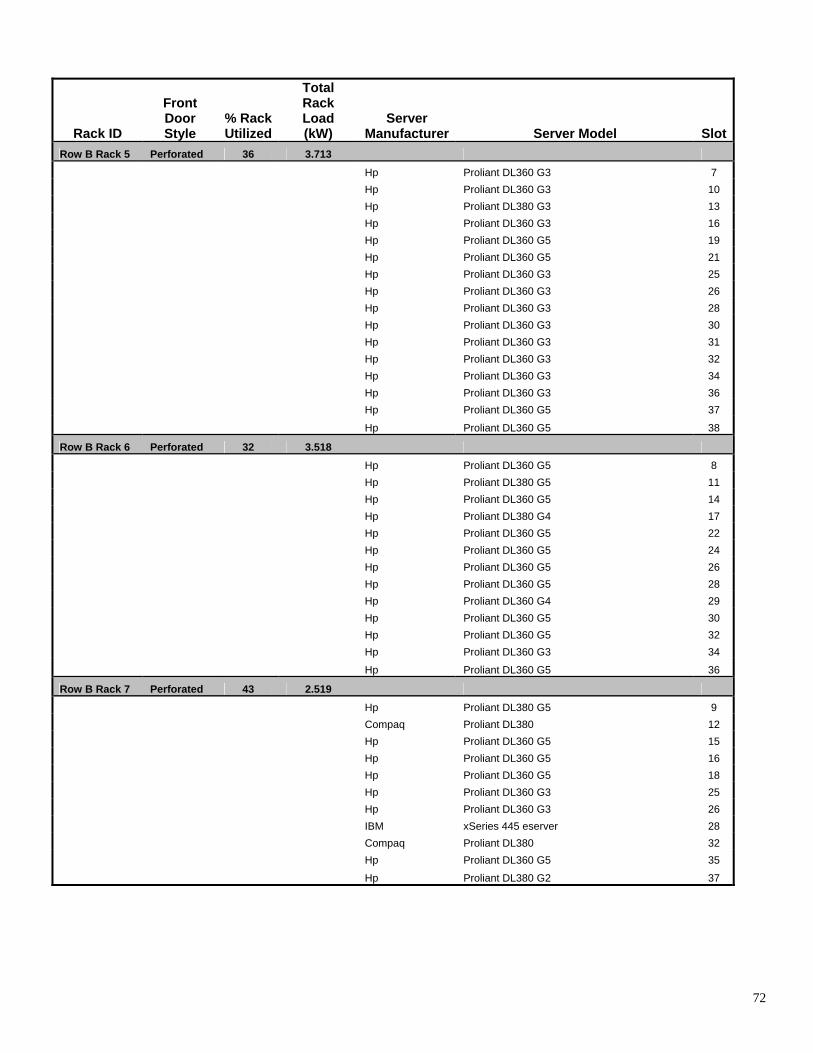
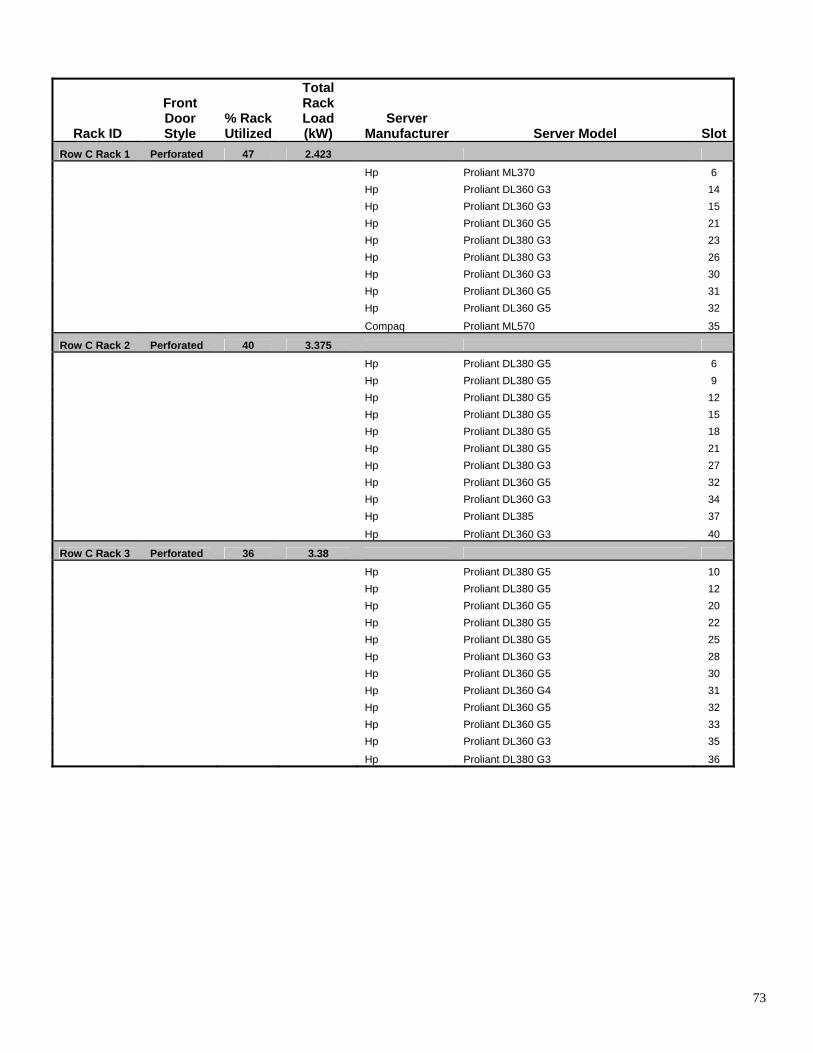
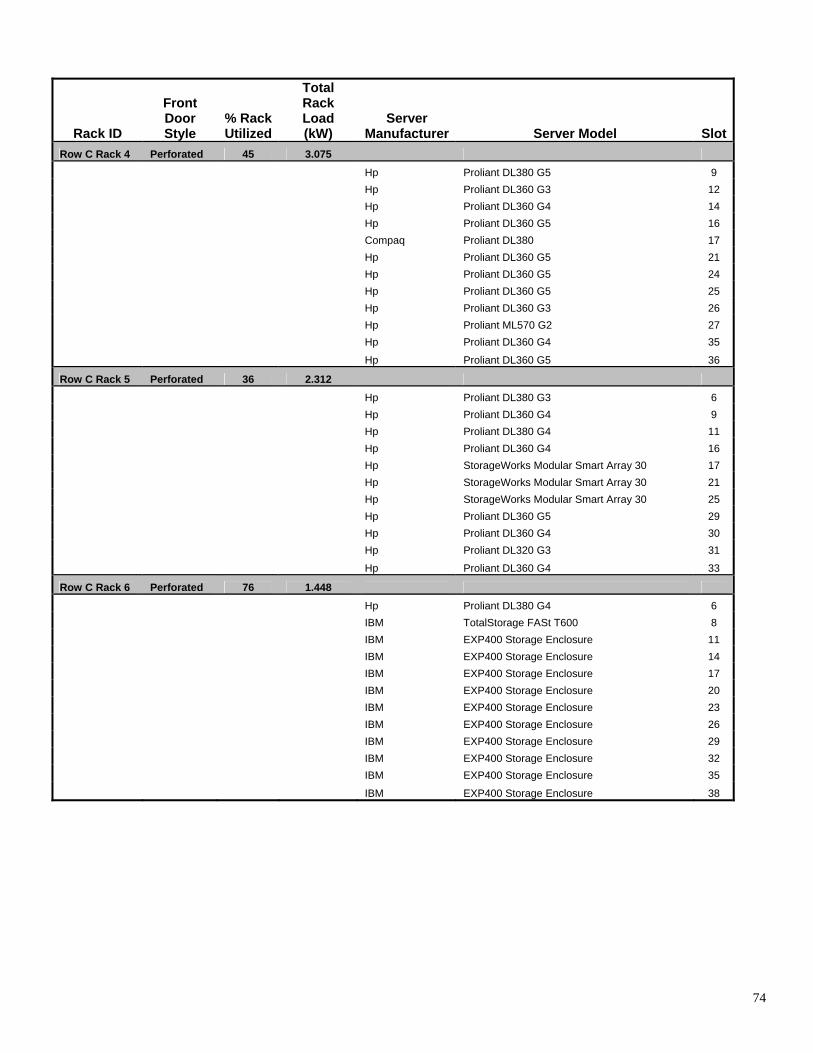
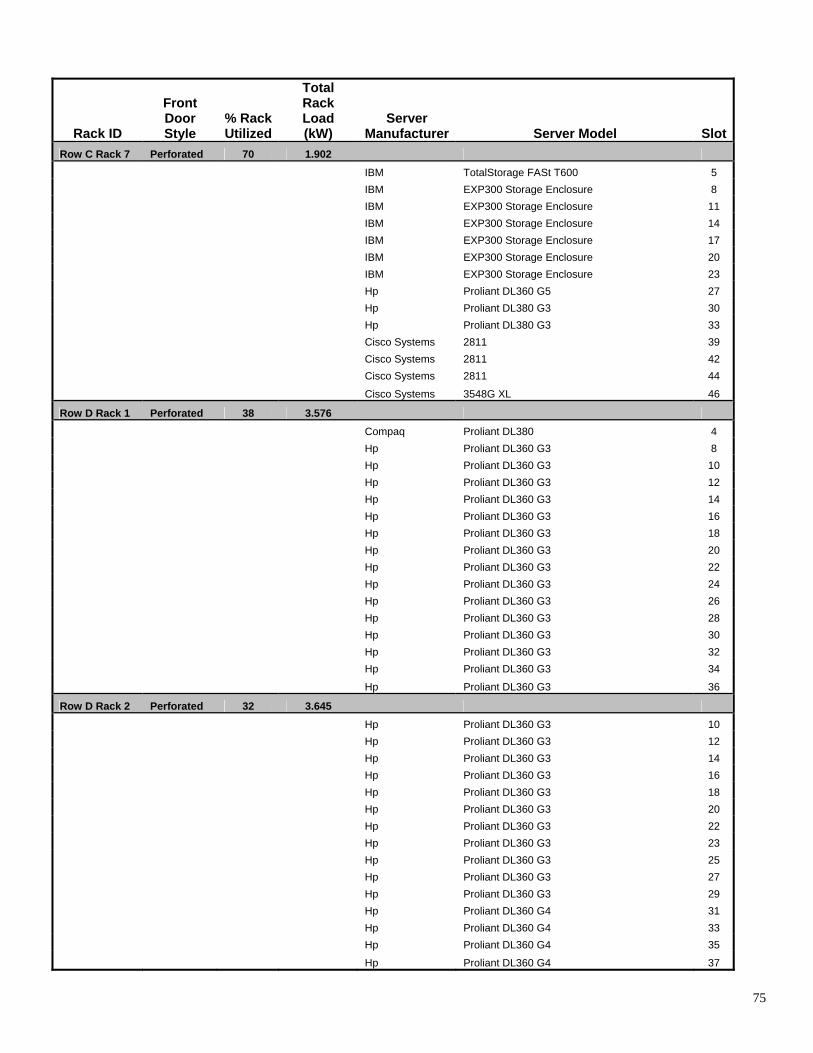
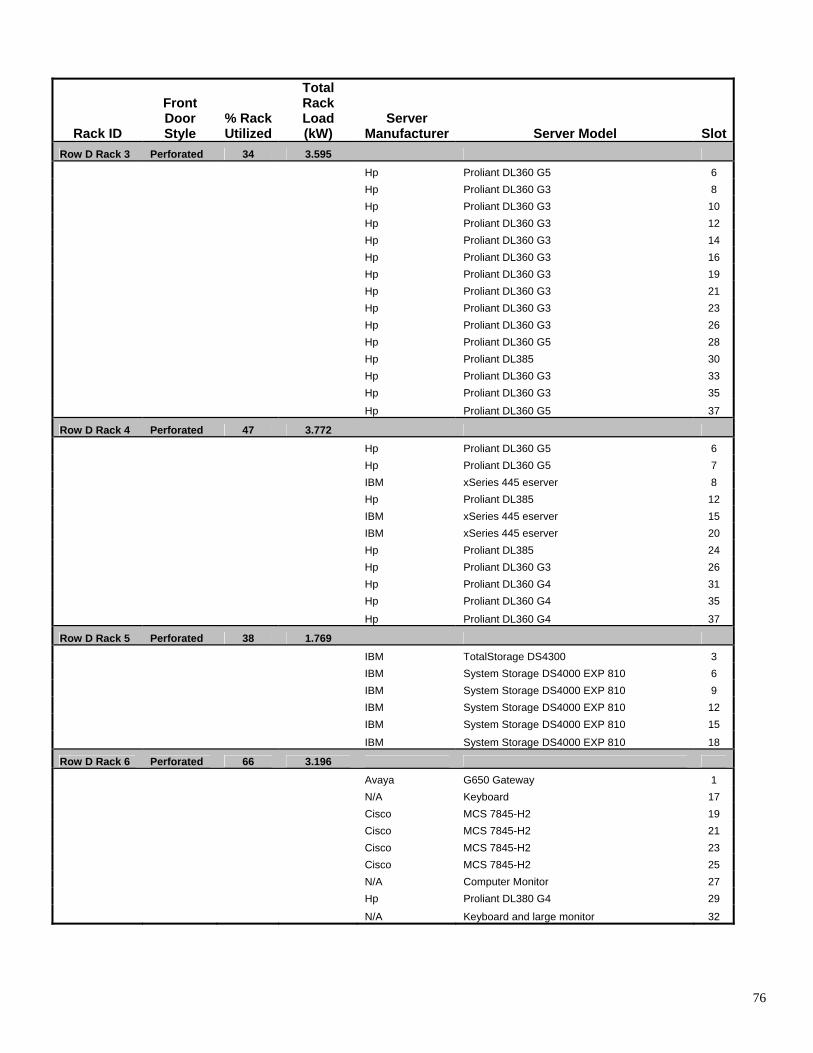
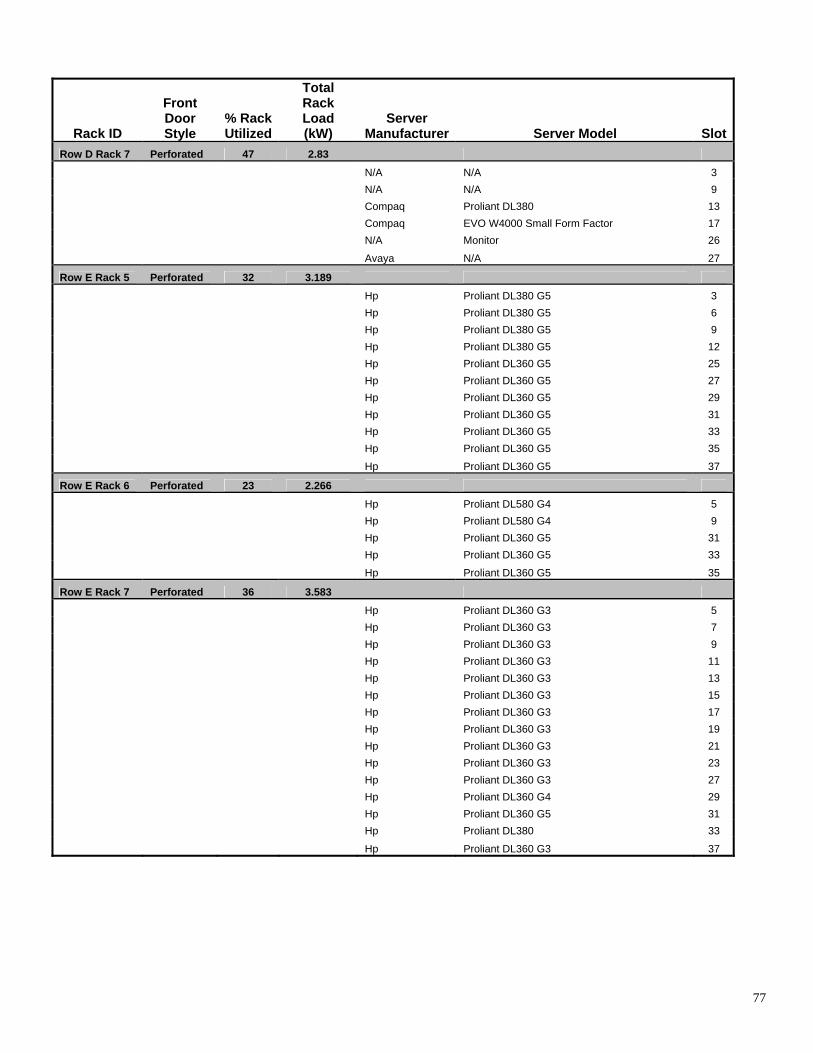
Table 4.2.1 Equipment Summary
Rack ID
Front Door Style
% Rack Utilized
Total Rack Load (kW)
Server Manufacturer Server Model Slot
Row A Rack 5 Perforated 23 1.2 Cisco 7400 ASR 5 Cisco Catalyst 2960-24TC 6 Cisco Catalyst 2960-24TC 7 Cisco Catalyst 2960-24TC 8 Cisco Catalyst 2960-24TC 9 Cisco 11500 10 Cisco ASA 5510 Series 11 Cisco ASA 5510 Series 12 Co-Radiant TS 520 13
Cisco N/A 16
Row A Rack 6 Perforated 21 1.303 Raritan N/A 3 Cisco 1711 Access Router 5 St. Bernard M500 7 Cisco PIX 515E 8 Cisco IDS 4215 9 Cisco N/A 10 Cisco Catalyst 2950T-24 11 Cisco PIX 515E 13
Cisco Systems 2811 14
Row A Rack 9 Perforated 68 2.656 Argus RST 48/30 Switch Mode Rectifier 1 Hp G5 11 Dell PowerEdge 1850 17 Hp Proliant DL320 G3 18 Hp Proliant DL320 G3 20 Cisco Systems 2811 21 Cisco Systems 2811 23 Compaq Proliant DL380 25 Avaya P133G2 31 Avaya P133G2 33 Avaya P133G2 35 Cisco MCS 7845-H2 37 Cisco MCS 7845-H2 39 Cisco MCS 7845-H2 42 Cisco 4400 44 Cisco 4400 45
Cisco 4400 46
71
Rack ID
Front Door Style
% Rack Utilized
Total Rack Load (kW)
Server Manufacturer Server Model Slot
Row A Rack 10 Perforated 55 2.743 N/A N/A 4 Cisco MCS 7835-H2 5 Cisco MCS 7835-H2 7 Cisco 2621XM Router 10 Cisco 2610 Router 11 Cisco 2610 Router 12 Cisco PIX 515E 13 Cisco PIX 515E 14 Cisco 2621XM Router 15 Cisco Systems 2600 16 Cisco 2610 Router 17 Cisco 7400ASR 18 Cisco 7400ASR 19 Cisco 7400ASR 20 Dell Poweredge SC 1435 21 Dell PowerEdge 1950 22 Hp Proliant DL360 G5 27 Cisco 7400ASR 28 N/A f5 30 N/A f5 32 Cisco IDS 4235 36
IBM Proventia GX4004 37 Row A Rack 11 Perforated 51 0.8753 Kalatel KTD-440 10 Kalatel DVS 12 ADT N/A 15 Kalatel DVS 16 ADT N/A 19 Kalatel DVS 20 ADT N/A 23 Kalatel DVS 24 ADT N/A 27 Hp Proliant DL360 G4 35
Network Intelligence N/A 36
IBM System Storage DS4800 37
Row B Rack 4 Perforated 8.5 0.1
Network Instruments Disc Storage 19
72
Rack ID
Front Door Style
% Rack Utilized
Total Rack Load (kW)
Server Manufacturer Server Model Slot
Row B Rack 5 Perforated 36 3.713 Hp Proliant DL360 G3 7 Hp Proliant DL360 G3 10 Hp Proliant DL380 G3 13 Hp Proliant DL360 G3 16 Hp Proliant DL360 G5 19 Hp Proliant DL360 G5 21 Hp Proliant DL360 G3 25 Hp Proliant DL360 G3 26 Hp Proliant DL360 G3 28 Hp Proliant DL360 G3 30 Hp Proliant DL360 G3 31 Hp Proliant DL360 G3 32 Hp Proliant DL360 G3 34 Hp Proliant DL360 G3 36 Hp Proliant DL360 G5 37
Hp Proliant DL360 G5 38
Row B Rack 6 Perforated 32 3.518 Hp Proliant DL360 G5 8 Hp Proliant DL380 G5 11 Hp Proliant DL360 G5 14 Hp Proliant DL380 G4 17 Hp Proliant DL360 G5 22 Hp Proliant DL360 G5 24 Hp Proliant DL360 G5 26 Hp Proliant DL360 G5 28 Hp Proliant DL360 G4 29 Hp Proliant DL360 G5 30 Hp Proliant DL360 G5 32 Hp Proliant DL360 G3 34
Hp Proliant DL360 G5 36
Row B Rack 7 Perforated 43 2.519 Hp Proliant DL380 G5 9 Compaq Proliant DL380 12 Hp Proliant DL360 G5 15 Hp Proliant DL360 G5 16 Hp Proliant DL360 G5 18 Hp Proliant DL360 G3 25 Hp Proliant DL360 G3 26 IBM xSeries 445 eserver 28 Compaq Proliant DL380 32 Hp Proliant DL360 G5 35
Hp Proliant DL380 G2 37
73
Rack ID
Front Door Style
% Rack Utilized
Total Rack Load (kW)
Server Manufacturer Server Model Slot
Row C Rack 1 Perforated 47 2.423 Hp Proliant ML370 6 Hp Proliant DL360 G3 14 Hp Proliant DL360 G3 15 Hp Proliant DL360 G5 21 Hp Proliant DL380 G3 23 Hp Proliant DL380 G3 26 Hp Proliant DL360 G3 30 Hp Proliant DL360 G5 31 Hp Proliant DL360 G5 32
Compaq Proliant ML570 35
Row C Rack 2 Perforated 40 3.375 Hp Proliant DL380 G5 6 Hp Proliant DL380 G5 9 Hp Proliant DL380 G5 12 Hp Proliant DL380 G5 15 Hp Proliant DL380 G5 18 Hp Proliant DL380 G5 21 Hp Proliant DL380 G3 27 Hp Proliant DL360 G5 32 Hp Proliant DL360 G3 34 Hp Proliant DL385 37
Hp Proliant DL360 G3 40
Row C Rack 3 Perforated 36 3.38 Hp Proliant DL380 G5 10 Hp Proliant DL380 G5 12 Hp Proliant DL360 G5 20 Hp Proliant DL380 G5 22 Hp Proliant DL380 G5 25 Hp Proliant DL360 G3 28 Hp Proliant DL360 G5 30 Hp Proliant DL360 G4 31 Hp Proliant DL360 G5 32 Hp Proliant DL360 G5 33 Hp Proliant DL360 G3 35
Hp Proliant DL380 G3 36
74
Rack ID
Front Door Style
% Rack Utilized
Total Rack Load (kW)
Server Manufacturer Server Model Slot
Row C Rack 4 Perforated 45 3.075 Hp Proliant DL380 G5 9 Hp Proliant DL360 G3 12 Hp Proliant DL360 G4 14 Hp Proliant DL360 G5 16 Compaq Proliant DL380 17 Hp Proliant DL360 G5 21 Hp Proliant DL360 G5 24 Hp Proliant DL360 G5 25 Hp Proliant DL360 G3 26 Hp Proliant ML570 G2 27 Hp Proliant DL360 G4 35
Hp Proliant DL360 G5 36
Row C Rack 5 Perforated 36 2.312 Hp Proliant DL380 G3 6 Hp Proliant DL360 G4 9 Hp Proliant DL380 G4 11 Hp Proliant DL360 G4 16 Hp StorageWorks Modular Smart Array 30 17 Hp StorageWorks Modular Smart Array 30 21 Hp StorageWorks Modular Smart Array 30 25 Hp Proliant DL360 G5 29 Hp Proliant DL360 G4 30 Hp Proliant DL320 G3 31
Hp Proliant DL360 G4 33
Row C Rack 6 Perforated 76 1.448 Hp Proliant DL380 G4 6 IBM TotalStorage FASt T600 8 IBM EXP400 Storage Enclosure 11 IBM EXP400 Storage Enclosure 14 IBM EXP400 Storage Enclosure 17 IBM EXP400 Storage Enclosure 20 IBM EXP400 Storage Enclosure 23 IBM EXP400 Storage Enclosure 26 IBM EXP400 Storage Enclosure 29 IBM EXP400 Storage Enclosure 32 IBM EXP400 Storage Enclosure 35
IBM EXP400 Storage Enclosure 38
75
Rack ID
Front Door Style
% Rack Utilized
Total Rack Load (kW)
Server Manufacturer Server Model Slot
Row C Rack 7 Perforated 70 1.902 IBM TotalStorage FASt T600 5 IBM EXP300 Storage Enclosure 8 IBM EXP300 Storage Enclosure 11 IBM EXP300 Storage Enclosure 14 IBM EXP300 Storage Enclosure 17 IBM EXP300 Storage Enclosure 20 IBM EXP300 Storage Enclosure 23 Hp Proliant DL360 G5 27 Hp Proliant DL380 G3 30 Hp Proliant DL380 G3 33 Cisco Systems 2811 39 Cisco Systems 2811 42 Cisco Systems 2811 44
Cisco Systems 3548G XL 46
Row D Rack 1 Perforated 38 3.576 Compaq Proliant DL380 4 Hp Proliant DL360 G3 8 Hp Proliant DL360 G3 10 Hp Proliant DL360 G3 12 Hp Proliant DL360 G3 14 Hp Proliant DL360 G3 16 Hp Proliant DL360 G3 18 Hp Proliant DL360 G3 20 Hp Proliant DL360 G3 22 Hp Proliant DL360 G3 24 Hp Proliant DL360 G3 26 Hp Proliant DL360 G3 28 Hp Proliant DL360 G3 30 Hp Proliant DL360 G3 32 Hp Proliant DL360 G3 34
Hp Proliant DL360 G3 36
Row D Rack 2 Perforated 32 3.645 Hp Proliant DL360 G3 10 Hp Proliant DL360 G3 12 Hp Proliant DL360 G3 14 Hp Proliant DL360 G3 16 Hp Proliant DL360 G3 18 Hp Proliant DL360 G3 20 Hp Proliant DL360 G3 22 Hp Proliant DL360 G3 23 Hp Proliant DL360 G3 25 Hp Proliant DL360 G3 27 Hp Proliant DL360 G3 29 Hp Proliant DL360 G4 31 Hp Proliant DL360 G4 33 Hp Proliant DL360 G4 35
Hp Proliant DL360 G4 37
76
Rack ID
Front Door Style
% Rack Utilized
Total Rack Load (kW)
Server Manufacturer Server Model Slot
Row D Rack 3 Perforated 34 3.595 Hp Proliant DL360 G5 6 Hp Proliant DL360 G3 8 Hp Proliant DL360 G3 10 Hp Proliant DL360 G3 12 Hp Proliant DL360 G3 14 Hp Proliant DL360 G3 16 Hp Proliant DL360 G3 19 Hp Proliant DL360 G3 21 Hp Proliant DL360 G3 23 Hp Proliant DL360 G3 26 Hp Proliant DL360 G5 28 Hp Proliant DL385 30 Hp Proliant DL360 G3 33 Hp Proliant DL360 G3 35
Hp Proliant DL360 G5 37
Row D Rack 4 Perforated 47 3.772 Hp Proliant DL360 G5 6 Hp Proliant DL360 G5 7 IBM xSeries 445 eserver 8 Hp Proliant DL385 12 IBM xSeries 445 eserver 15 IBM xSeries 445 eserver 20 Hp Proliant DL385 24 Hp Proliant DL360 G3 26 Hp Proliant DL360 G4 31 Hp Proliant DL360 G4 35
Hp Proliant DL360 G4 37
Row D Rack 5 Perforated 38 1.769 IBM TotalStorage DS4300 3 IBM System Storage DS4000 EXP 810 6 IBM System Storage DS4000 EXP 810 9 IBM System Storage DS4000 EXP 810 12 IBM System Storage DS4000 EXP 810 15
IBM System Storage DS4000 EXP 810 18
Row D Rack 6 Perforated 66 3.196 Avaya G650 Gateway 1 N/A Keyboard 17 Cisco MCS 7845-H2 19 Cisco MCS 7845-H2 21 Cisco MCS 7845-H2 23 Cisco MCS 7845-H2 25 N/A Computer Monitor 27 Hp Proliant DL380 G4 29
N/A Keyboard and large monitor 32
77
Rack ID
Front Door Style
% Rack Utilized
Total Rack Load (kW)
Server Manufacturer Server Model Slot
Row D Rack 7 Perforated 47 2.83 N/A N/A 3 N/A N/A 9 Compaq Proliant DL380 13 Compaq EVO W4000 Small Form Factor 17 N/A Monitor 26
Avaya N/A 27
Row E Rack 5 Perforated 32 3.189 Hp Proliant DL380 G5 3 Hp Proliant DL380 G5 6 Hp Proliant DL380 G5 9 Hp Proliant DL380 G5 12 Hp Proliant DL360 G5 25 Hp Proliant DL360 G5 27 Hp Proliant DL360 G5 29 Hp Proliant DL360 G5 31 Hp Proliant DL360 G5 33 Hp Proliant DL360 G5 35
Hp Proliant DL360 G5 37
Row E Rack 6 Perforated 23 2.266 Hp Proliant DL580 G4 5 Hp Proliant DL580 G4 9 Hp Proliant DL360 G5 31 Hp Proliant DL360 G5 33
Hp Proliant DL360 G5 35
Row E Rack 7 Perforated 36 3.583 Hp Proliant DL360 G3 5 Hp Proliant DL360 G3 7 Hp Proliant DL360 G3 9 Hp Proliant DL360 G3 11 Hp Proliant DL360 G3 13 Hp Proliant DL360 G3 15 Hp Proliant DL360 G3 17 Hp Proliant DL360 G3 19 Hp Proliant DL360 G3 21 Hp Proliant DL360 G3 23 Hp Proliant DL360 G3 27 Hp Proliant DL360 G4 29 Hp Proliant DL360 G5 31 Hp Proliant DL380 33
Hp Proliant DL360 G3 37
78
Figure 4.2.1 – Existing Liebert 22 Ton Performance Data
79
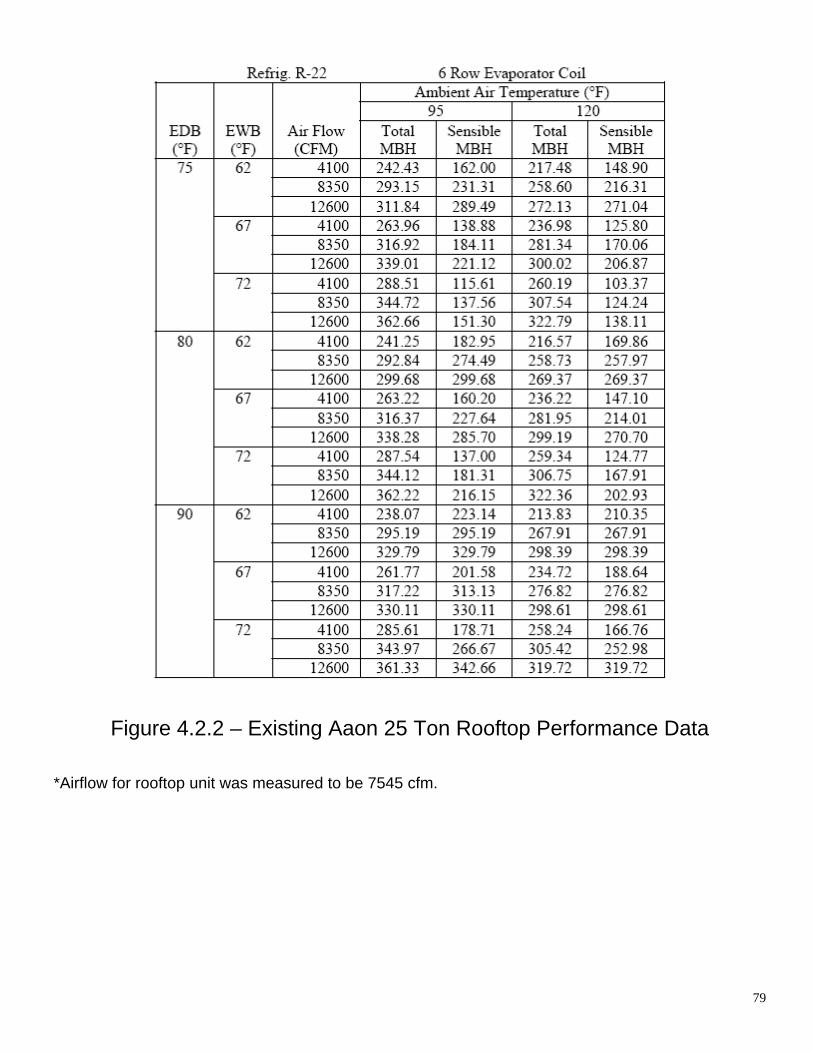
Figure 4.2.2 – Existing Aaon 25 Ton Rooftop Performance Data
*Airflow for rooftop unit was measured to be 7545 cfm.
80
Disclaimer: “Liebert” will be used in reference to Emerson Network Power and “Site” will be used in reference to the Customer’s Data Center Location.
• Data Collection o The data used in this report is Site, date, and time specific o The amount of data collected is dependant on the conditions of the
Site Access to different areas of the Site Relative safety concerns of Liebert Time constraints imposed by the Customer if applicable The nature of the report previously agreed upon by the
Customer and Liebert • Accuracy of Data
o No field collected data is 100% accurate o Liebert will do everything in its power to accurately read
measurements o Liebert will not be held responsible for future comparisons of report
findings and actual data measured o The recommendations from Liebert are based on past experience,
computer simulations, and/or recommendations from experts on Data Center Assessments
Liebert does not accept any responsibility or liability in any manner for how this report is used by the Customer.
If the Customer has any questions about the results presented in this report, they should please contact the Liebert representative who prepared the Data Center Assessment Report.