electronic supporting information … supporting information electrochemically grown nanoporous mno...
TRANSCRIPT
1
Electronic Supporting Information
Electrochemically grown nanoporous MnO2 nanowall forest on
porous carbon substrate with enhanced capacitance through
faster ionic and electrical mobility
Bihag Anothumakkool, Sreekumar Kurungot
Physical & Materials Chemistry Division, CSIR-National Chemical Laboratory,
Pune-411008, Maharashtra, India.
Phone: 91-20-25902566, Fax: 91-20-25902636
E-mail: [email protected]
Experimental section:
Materials: Manganese acetate (MnAc2), ammonium acetate (NH4Ac) and sodium sulfate
(Na2SO4) were purchased from Rankem Chemicals. All the chemicals were used as received
without any further purification. Carbon paper having a thickness of 0.3 mm was purchased
from Toray.
Preparation MnO2 coated carbon paper: Electrochemical synthesis was carried out in Bio-
Logic SP-300 Potentio-Galvanostat using 3-electrode systems in which carbon paper was
used as the working electrode, Pt was used as the counter electrode and Ag/AgCl was used as
the reference electrode. Deposition was carried out in a solution containing 0.1 M (0.49 g)
Mn(Ac)2 and 0.1 M (0.154 g) NH4Ac salt in 20 ml of deionized water. 1 cm2 area of carbon
paper was kept exposed to electrolyte and the remaining part was masked using Kapton
adhesive tape. Experiments were carried out at a constant potential of 0.6 V Vs Ag/AgCl for
Electronic Supplementary Material (ESI) for Chemical Communications.This journal is © The Royal Society of Chemistry 2014
2
different time intervals. Carbon paper was dipped in ethanol before electro-deposition to
enhance the hydrophilic nature. After the deposition, the electrode was washed and dried at
60 oC.
The amount of MnO2 deposited was calculated by using Faraday’s law of electrolysis:
W =Charge passed (C) ∗ 87(Mol. weight of MnO2)
96 485 ∗ 2 (no electron released per MnO2)
For comparison purpose, MnO2/CNF was also prepared. In a typical experiment, 100 mg of
CNF and 150 mg of KMnO4 were dispersed in 40 mL water using a probe sonicator. The
solution was poured into a hydrothermal bomb and was kept at 140 oC for 24 h followed by
filtration. Filtrate was washed and kept for drying at 60 oC.
Characterisation
Structure and morphology of the materials were analyzed using Nova Nano SEM 450 and
Quanta™ Scanning Electron Microscope. High-resolution transmission electron microscope
(HR-TEM) was carried out in Tecnai-T 30 at an accelerated voltage of 300 kV. The X-ray
diffraction patterns of the prepared specimens were done using PAN X’pert Pro instrument,
data collection was done at a scan rate of 1.5 o/min using Cu Kα radiation. Raman analysis
was carried out on Horiba Jobin Yvon Inverted LabRAM HR800 VIS-NIR using 632 nm
solid-state diode laser beams. X-ray Photoelectron Spectroscopic (XPS) measurements were
carried out on a VG Micro Tech ESCA 300° instrument at a pressure of > 1 x 10⁻⁹
Torr (pass
energy of 50 eV, electron take off angle of 60o and the overall resolution of ~ 0.1 eV).
Nitrogen adsorption-desorption experiments were conducted at 77 K using Quantachrome
Quadraorb automatic volumetric instrument. Before gas adsorption measurements, the
sample was activated at room temperature (for 24 h) and 100 ºC (for 36 h) under ultrahigh
vacuum (10-8 mbar) for overnight. The deposited MnO2 was carefully scratched from the
carbon surface and analyzed for gas adsorption, except in the experiments as shown in SI,
Figure S9 and Figure S2b, where the gas adsorption was done on the carbon paper. Surface
area is calculated from the N2-adsorption isotherm up to 0.3 relative pressures. Pore size
distribution is calculated by the DFT method.
Electrochemical Characterization: All the electrochemical studies were carried out in a
BioLogic SP-300 Potentio-Galvanostat. Metal crocodile clips were used for the required
3
electrical contacts from the electrodes. Cyclic Voltammetry (CV) was carried out in a 3-
electrode setup where MnO2 coated carbon paper was used as a working electrode and
Ag/AgCl was used as a reference electrode and Pt mesh as counter electrode. The CV
measurements were taken at different scan rates from 10 to 1500 mV/s by maintaining a
potential window between 0 to 1 V Vs Ag/Agcl. Mass specific capacitance of MnO2 is
calculated from the CV using the following equation1
𝑄(𝑐ℎ𝑎𝑟𝑔𝑒) =∫ ( )
-------------------- (1)
Where
𝐸 − 𝐸 = Potential window
m = Weight of the MnO2 coated in one of the electrodes (g)
= Scan rate (mV/s)
Capacitance is calculated from the chrono charge discharge method using the following
equation
C = (
∗ )-------------------------- (3)
Where
Δt = Discharge time
= Potential window
I = Constant current used for charging and discharging
M = Weight of active electrode material in the electrode.
The charge-discharge measurement was done at different current densities (1 to 100 A/g) in
the same potential range which was used for CV. Cycling stability was done by chrono
charge-discharge method at 5 A/g current density for 1000 continuous cycles. Coulombic
efficiency is calculated during the charge-discharge cycling by taking the percentage of
charging time coulombs by discharge coulombs. Electrochemical impedance (EIS) analysis
was carried out from 106 Hz to 0.01 Hz frequency against the open circuit potential with a
sinus amplitude of 10 mV (Vrms = 7.07 mV). All the EIS data were analyzed using an EC-
Lab Software V10.19.
Asymmetric capacitor was assembled by using activated carbon (AC) as the negative
electrode and MnO2/carbon paper as the positive electrode. AC was made into a paste with
conducting carbon and binder in a ratio of 80:15:5 in N-methyl 2-pyrrolidone. The above
made paste was brush coated to the carbon paper with an area of 1 cm2
and the loading was
4
adjusted according to the specific capacitance of AC (180 F/g). Measurements were carried
out in 1M Na2SO4
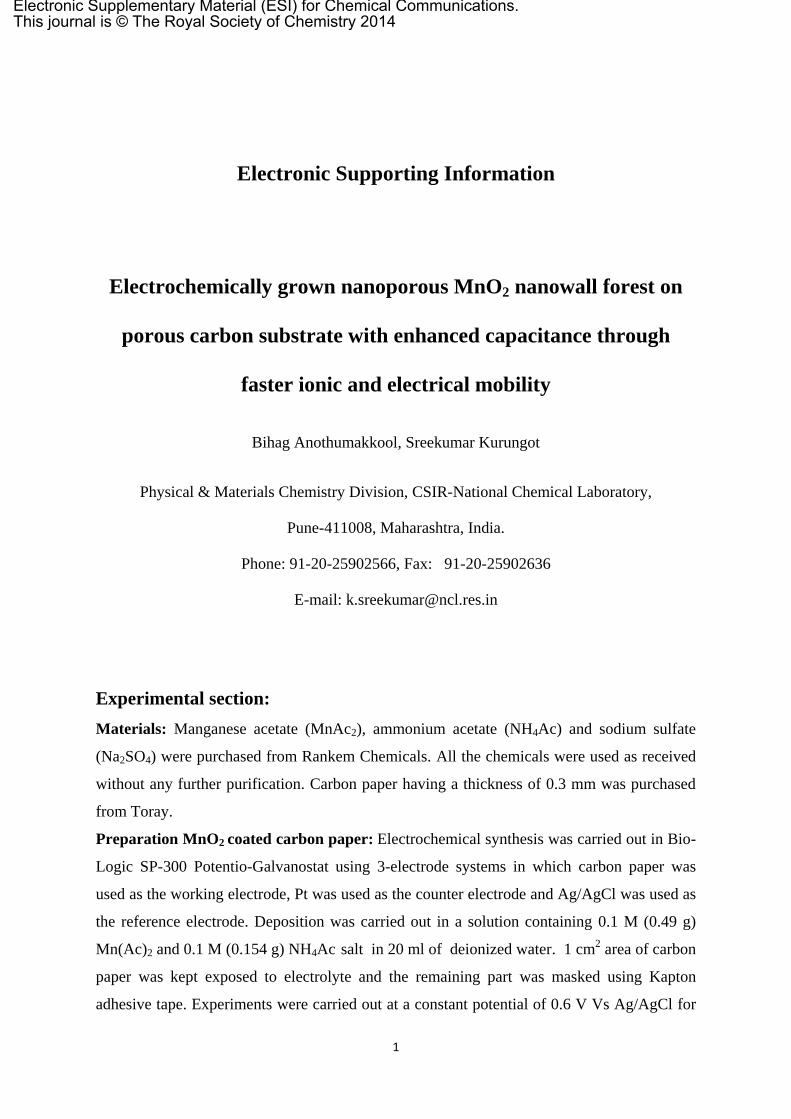
Figure S1: a) EDAX elemental mapping of the MnO2 nanowalls, b) EDAX spectra and the
table indicating the % of elements present in the area of Figure S1a.
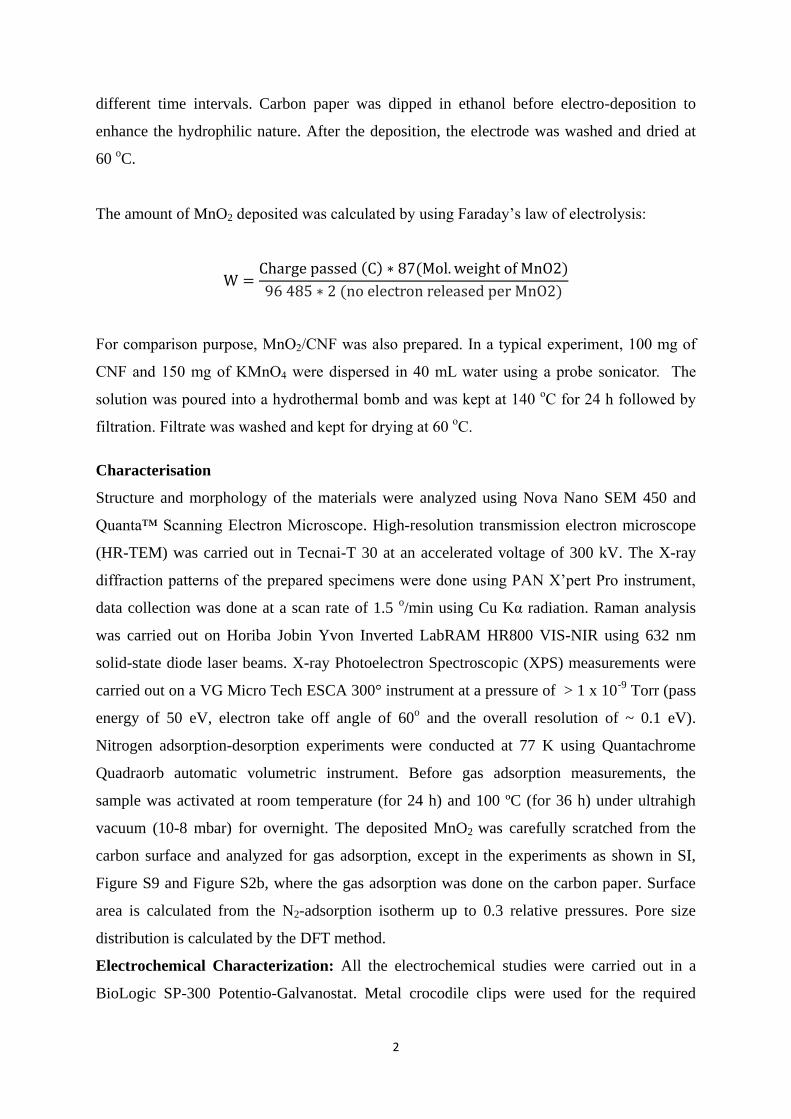
Figure S2: a) SEM images of the carbon fiber paper with zoomed images of a single fiber in
the inset, b) nitrogen adsorption isotherm of the carbon fiber paper and c) charge-discharge
profile of bare carbon fiber paper.
SEM image of the carbon fiber paper clearly indicate the smooth fibers with 5-7 µm diameter
(Figure S2a). Inset of Figure S2a show a single fiber indicating the smooth surface. BET
surface area measurement shows merely 1 m2/g surface area for the paper which indicates
there is now pores at nano regime (Figure S2b). Figure S2c also includes the charge-
discharge profile of bare carbon paper which shows a capacitance of 40 µF/cm2 and thus
negligible contribution from the support towards the total capacitance. Thus, highly porous
5
carbon paper compared to a plane current collector helps for the high mass loading of MnO2
but at the same time it gives adequate conducting support.
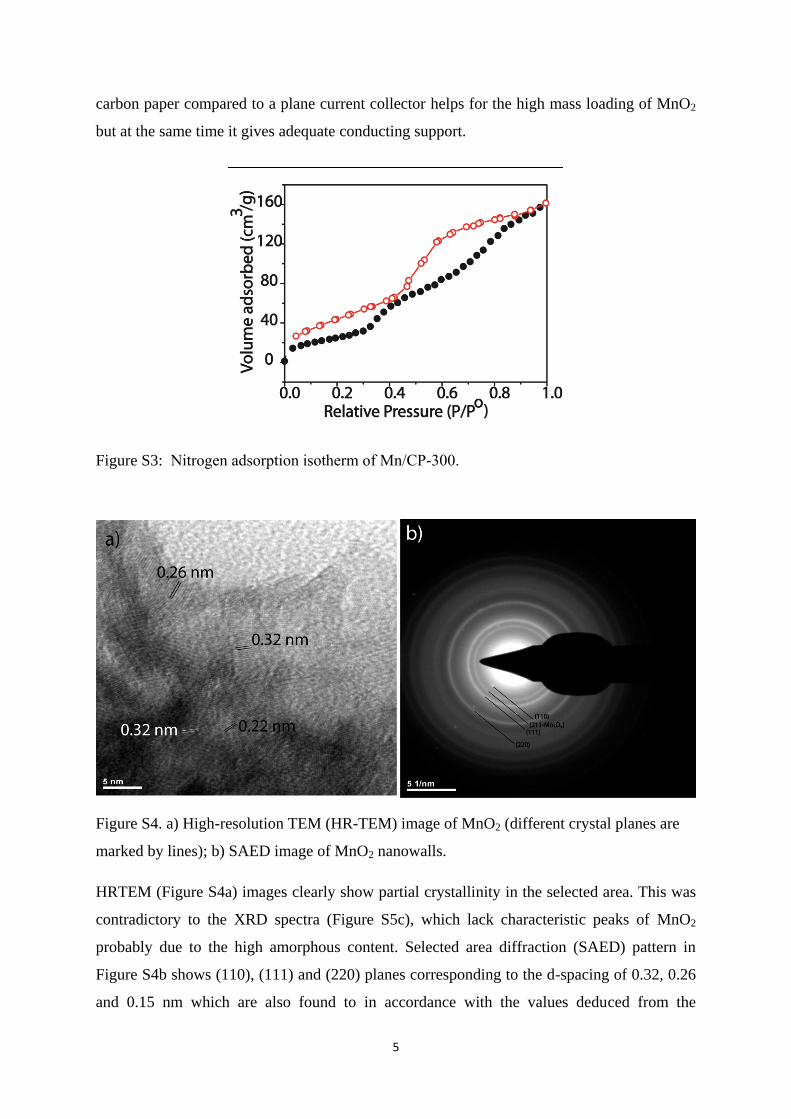
Figure S3: Nitrogen adsorption isotherm of Mn/CP-300.
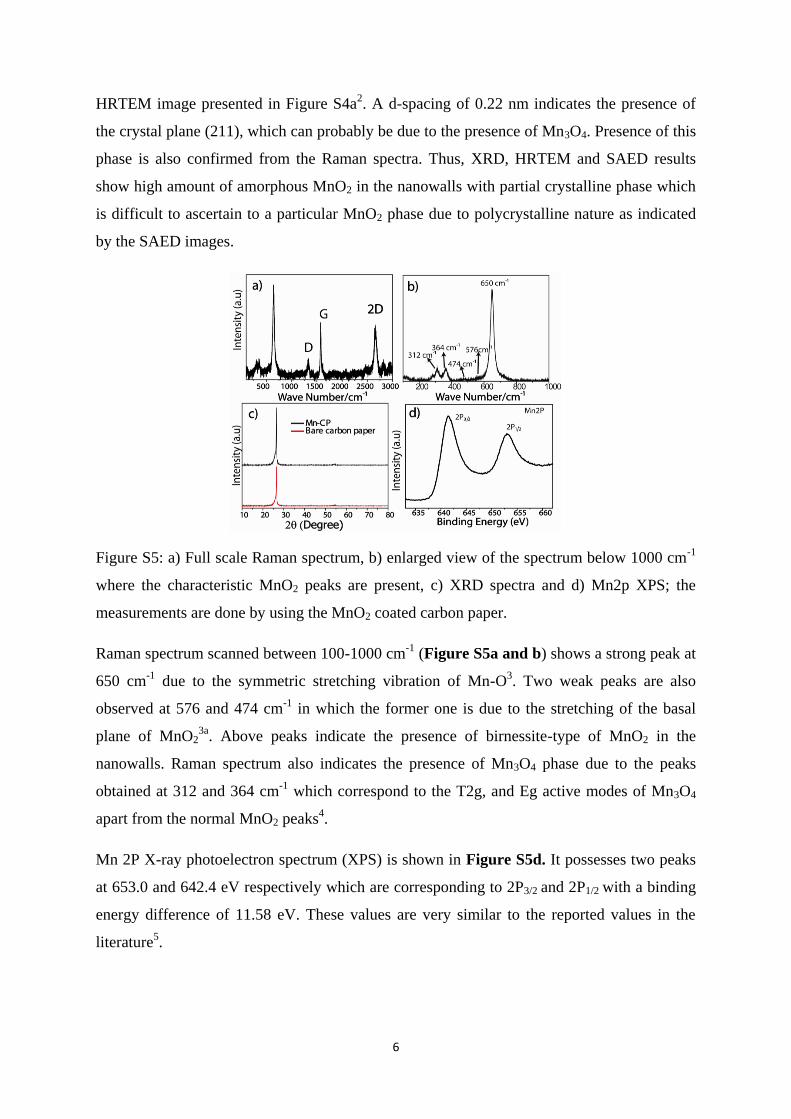
Figure S4. a) High-resolution TEM (HR-TEM) image of MnO2 (different crystal planes are
marked by lines); b) SAED image of MnO2 nanowalls.
HRTEM (Figure S4a) images clearly show partial crystallinity in the selected area. This was
contradictory to the XRD spectra (Figure S5c), which lack characteristic peaks of MnO2
probably due to the high amorphous content. Selected area diffraction (SAED) pattern in
Figure S4b shows (110), (111) and (220) planes corresponding to the d-spacing of 0.32, 0.26
and 0.15 nm which are also found to in accordance with the values deduced from the
6
HRTEM image presented in Figure S4a2. A d-spacing of 0.22 nm indicates the presence of
the crystal plane (211), which can probably be due to the presence of Mn3O4. Presence of this
phase is also confirmed from the Raman spectra. Thus, XRD, HRTEM and SAED results
show high amount of amorphous MnO2 in the nanowalls with partial crystalline phase which
is difficult to ascertain to a particular MnO2 phase due to polycrystalline nature as indicated
by the SAED images.
Figure S5: a) Full scale Raman spectrum, b) enlarged view of the spectrum below 1000 cm-1
where the characteristic MnO2 peaks are present, c) XRD spectra and d) Mn2p XPS; the
measurements are done by using the MnO2 coated carbon paper.
Raman spectrum scanned between 100-1000 cm-1
(Figure S5a and b) shows a strong peak at
650 cm-1
due to the symmetric stretching vibration of Mn-O3. Two weak peaks are also
observed at 576 and 474 cm-1
in which the former one is due to the stretching of the basal
plane of MnO23a
. Above peaks indicate the presence of birnessite-type of MnO2 in the
nanowalls. Raman spectrum also indicates the presence of Mn3O4 phase due to the peaks
obtained at 312 and 364 cm-1
which correspond to the T2g, and Eg active modes of Mn3O4
apart from the normal MnO2 peaks4.
Mn 2P X-ray photoelectron spectrum (XPS) is shown in Figure S5d. It possesses two peaks
at 653.0 and 642.4 eV respectively which are corresponding to 2P3/2 and 2P1/2 with a binding
energy difference of 11.58 eV. These values are very similar to the reported values in the
literature5.
7
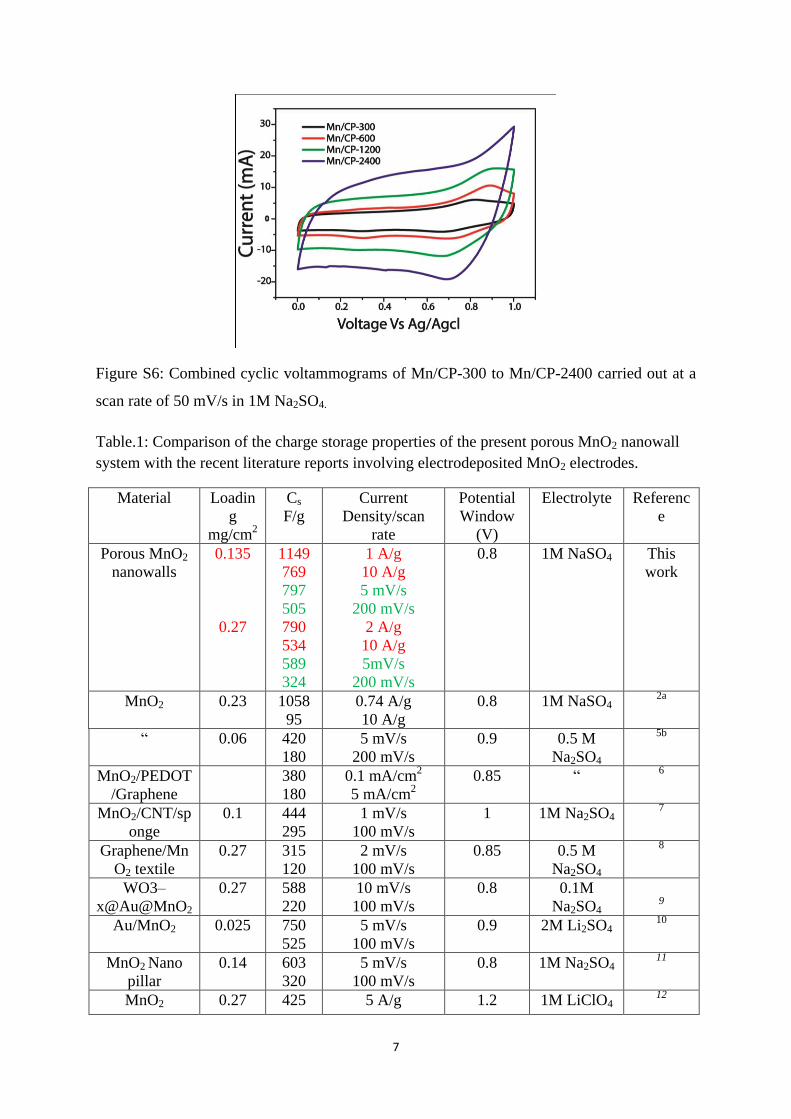
Figure S6: Combined cyclic voltammograms of Mn/CP-300 to Mn/CP-2400 carried out at a
scan rate of 50 mV/s in 1M Na2SO4.
Table.1: Comparison of the charge storage properties of the present porous MnO2 nanowall
system with the recent literature reports involving electrodeposited MnO2 electrodes.
Material Loadin
g
mg/cm2
Cs
F/g
Current
Density/scan
rate
Potential
Window
(V)
Electrolyte Referenc
e
Porous MnO2
nanowalls
0.135
0.27
1149
769
797
505
790
534
589
324
1 A/g
10 A/g
5 mV/s
200 mV/s
2 A/g
10 A/g
5mV/s
200 mV/s
0.8 1M NaSO4 This
work
MnO2 0.23 1058
95
0.74 A/g
10 A/g
0.8 1M NaSO4 2a
“ 0.06 420
180
5 mV/s
200 mV/s
0.9 0.5 M
Na2SO4
5b
MnO2/PEDOT
/Graphene
380
180
0.1 mA/cm2
5 mA/cm2
0.85 “ 6
MnO2/CNT/sp
onge
0.1 444
295
1 mV/s
100 mV/s
1 1M Na2SO4 7
Graphene/Mn
O2 textile
0.27 315
120
2 mV/s
100 mV/s
0.85 0.5 M
Na2SO4
8
WO3–
x@Au@MnO2
0.27 588
220
10 mV/s
100 mV/s
0.8 0.1M
Na2SO4
9
Au/MnO2 0.025 750
525
5 mV/s
100 mV/s
0.9 2M Li2SO4 10
MnO2 Nano
pillar
0.14 603
320
5 mV/s
100 mV/s
0.8 1M Na2SO4 11
MnO2 0.27 425 5 A/g 1.2 1M LiClO4 12
8
nanofiber/carb
on cloth
300 40 A/g
MnO2/Ti
nitride nanotu
be coaxial
arrays
0.06 681 2 A/g 0.8 5a
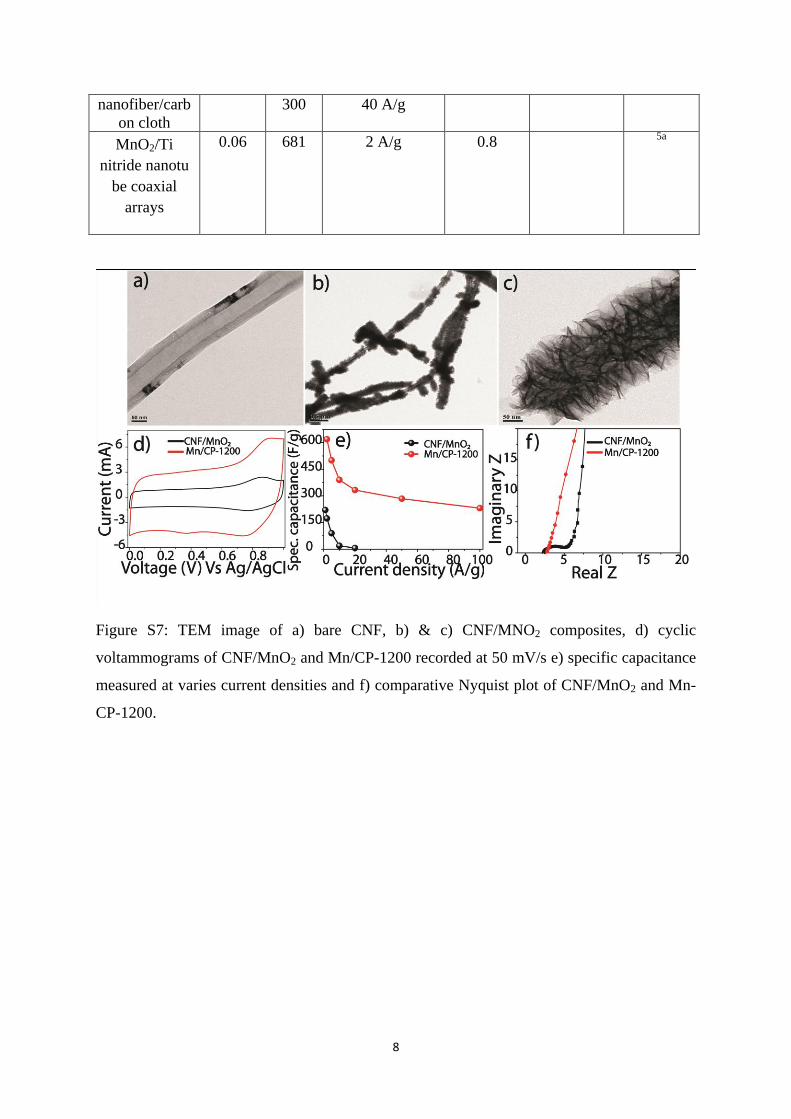
Figure S7: TEM image of a) bare CNF, b) & c) CNF/MNO2 composites, d) cyclic
voltammograms of CNF/MnO2 and Mn/CP-1200 recorded at 50 mV/s e) specific capacitance
measured at varies current densities and f) comparative Nyquist plot of CNF/MnO2 and Mn-
CP-1200.
9
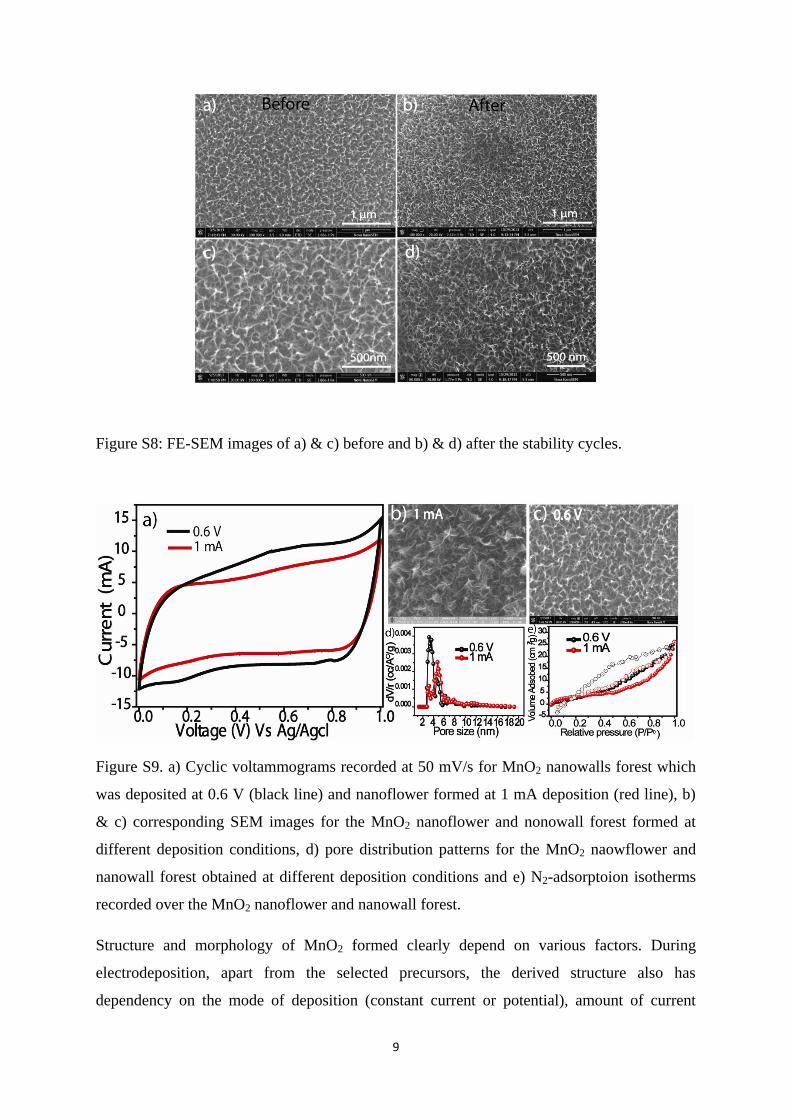
Figure S8: FE-SEM images of a) & c) before and b) & d) after the stability cycles.
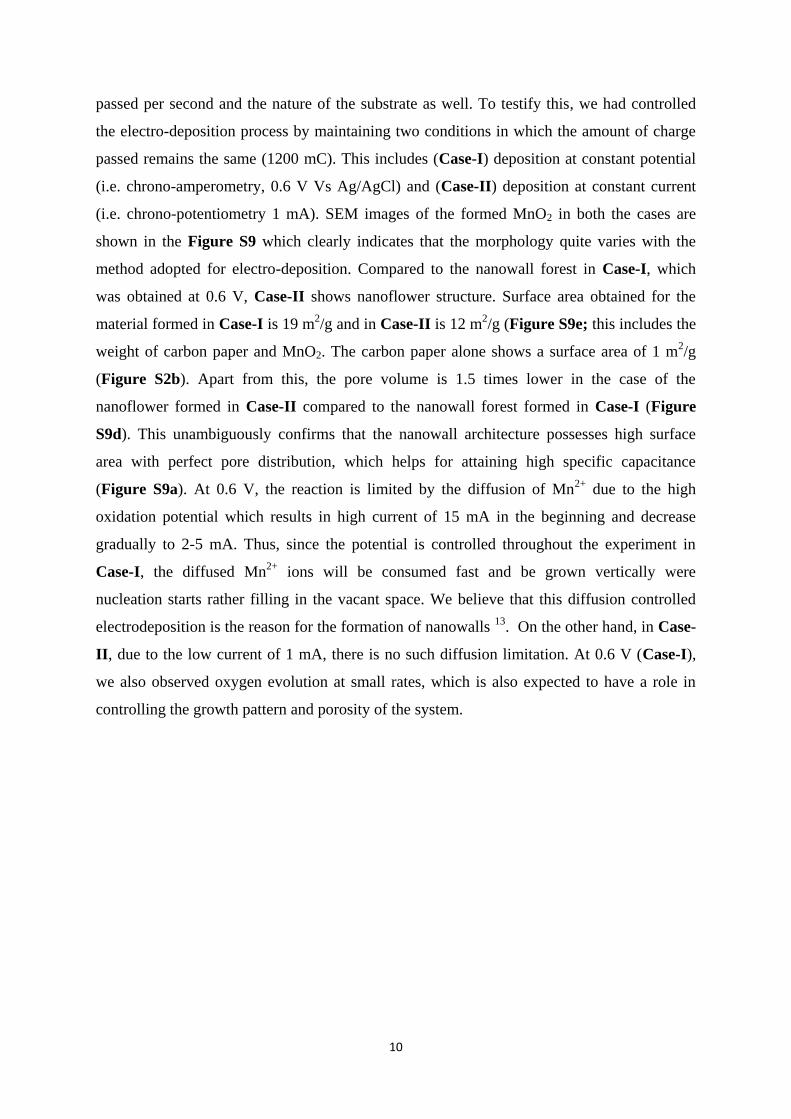
Figure S9. a) Cyclic voltammograms recorded at 50 mV/s for MnO2 nanowalls forest which
was deposited at 0.6 V (black line) and nanoflower formed at 1 mA deposition (red line), b)
& c) corresponding SEM images for the MnO2 nanoflower and nonowall forest formed at
different deposition conditions, d) pore distribution patterns for the MnO2 naowflower and
nanowall forest obtained at different deposition conditions and e) N2-adsorptoion isotherms
recorded over the MnO2 nanoflower and nanowall forest.
Structure and morphology of MnO2 formed clearly depend on various factors. During
electrodeposition, apart from the selected precursors, the derived structure also has
dependency on the mode of deposition (constant current or potential), amount of current
10
passed per second and the nature of the substrate as well. To testify this, we had controlled
the electro-deposition process by maintaining two conditions in which the amount of charge
passed remains the same (1200 mC). This includes (Case-I) deposition at constant potential
(i.e. chrono-amperometry, 0.6 V Vs Ag/AgCl) and (Case-II) deposition at constant current
(i.e. chrono-potentiometry 1 mA). SEM images of the formed MnO2 in both the cases are
shown in the Figure S9 which clearly indicates that the morphology quite varies with the
method adopted for electro-deposition. Compared to the nanowall forest in Case-I, which
was obtained at 0.6 V, Case-II shows nanoflower structure. Surface area obtained for the
material formed in Case-I is 19 m2/g and in Case-II is 12 m
2/g (Figure S9e; this includes the
weight of carbon paper and MnO2. The carbon paper alone shows a surface area of 1 m2/g
(Figure S2b). Apart from this, the pore volume is 1.5 times lower in the case of the
nanoflower formed in Case-II compared to the nanowall forest formed in Case-I (Figure
S9d). This unambiguously confirms that the nanowall architecture possesses high surface
area with perfect pore distribution, which helps for attaining high specific capacitance
(Figure S9a). At 0.6 V, the reaction is limited by the diffusion of Mn2+
due to the high
oxidation potential which results in high current of 15 mA in the beginning and decrease
gradually to 2-5 mA. Thus, since the potential is controlled throughout the experiment in
Case-I, the diffused Mn2+
ions will be consumed fast and be grown vertically were
nucleation starts rather filling in the vacant space. We believe that this diffusion controlled
electrodeposition is the reason for the formation of nanowalls 13
. On the other hand, in Case-
II, due to the low current of 1 mA, there is no such diffusion limitation. At 0.6 V (Case-I),
we also observed oxygen evolution at small rates, which is also expected to have a role in
controlling the growth pattern and porosity of the system.
11
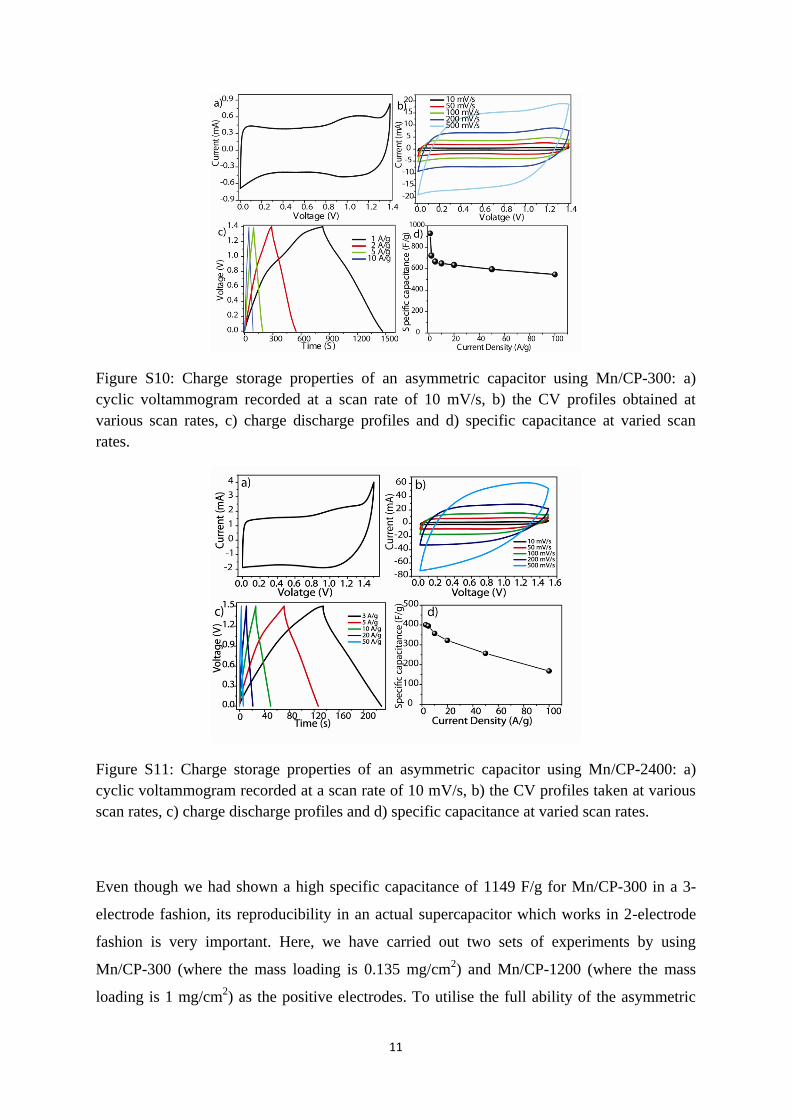
Figure S10: Charge storage properties of an asymmetric capacitor using Mn/CP-300: a)
cyclic voltammogram recorded at a scan rate of 10 mV/s, b) the CV profiles obtained at
various scan rates, c) charge discharge profiles and d) specific capacitance at varied scan
rates.
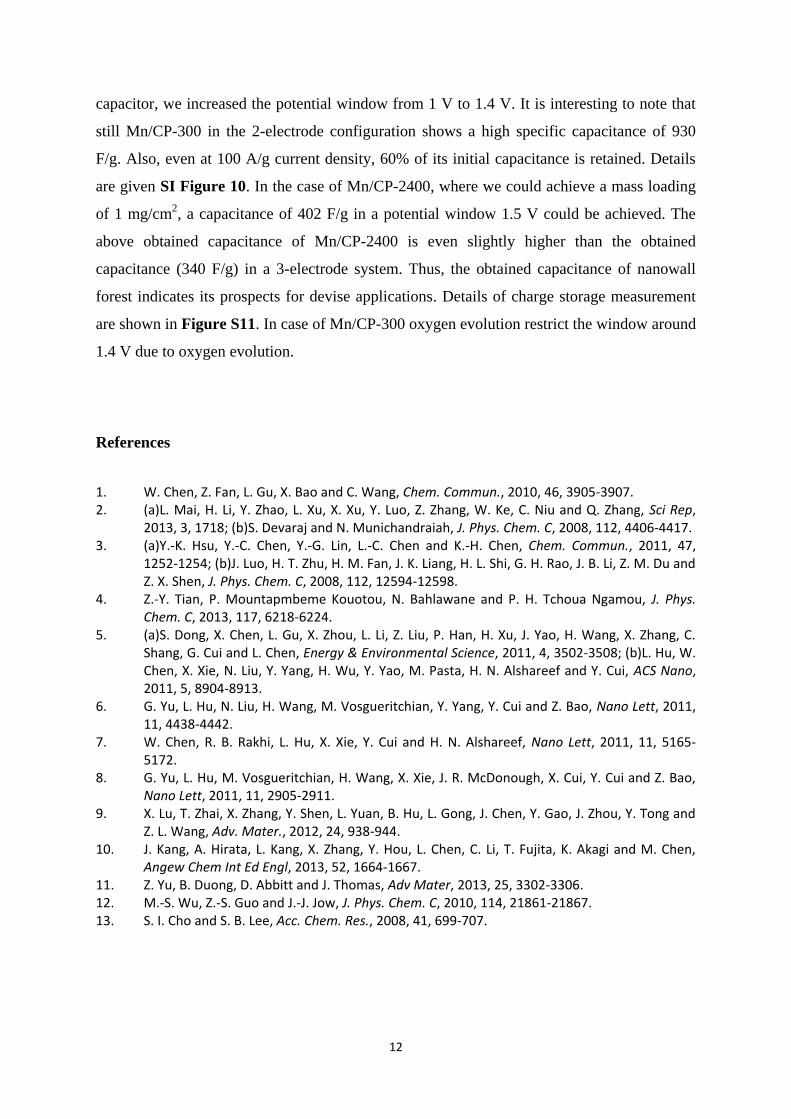
Figure S11: Charge storage properties of an asymmetric capacitor using Mn/CP-2400: a)
cyclic voltammogram recorded at a scan rate of 10 mV/s, b) the CV profiles taken at various
scan rates, c) charge discharge profiles and d) specific capacitance at varied scan rates.
Even though we had shown a high specific capacitance of 1149 F/g for Mn/CP-300 in a 3-
electrode fashion, its reproducibility in an actual supercapacitor which works in 2-electrode
fashion is very important. Here, we have carried out two sets of experiments by using
Mn/CP-300 (where the mass loading is 0.135 mg/cm2) and Mn/CP-1200 (where the mass
loading is 1 mg/cm2) as the positive electrodes. To utilise the full ability of the asymmetric
12
capacitor, we increased the potential window from 1 V to 1.4 V. It is interesting to note that
still Mn/CP-300 in the 2-electrode configuration shows a high specific capacitance of 930
F/g. Also, even at 100 A/g current density, 60% of its initial capacitance is retained. Details
are given SI Figure 10. In the case of Mn/CP-2400, where we could achieve a mass loading
of 1 mg/cm2, a capacitance of 402 F/g in a potential window 1.5 V could be achieved. The
above obtained capacitance of Mn/CP-2400 is even slightly higher than the obtained
capacitance (340 F/g) in a 3-electrode system. Thus, the obtained capacitance of nanowall
forest indicates its prospects for devise applications. Details of charge storage measurement
are shown in Figure S11. In case of Mn/CP-300 oxygen evolution restrict the window around
1.4 V due to oxygen evolution.
References
1. W. Chen, Z. Fan, L. Gu, X. Bao and C. Wang, Chem. Commun., 2010, 46, 3905-3907. 2. (a)L. Mai, H. Li, Y. Zhao, L. Xu, X. Xu, Y. Luo, Z. Zhang, W. Ke, C. Niu and Q. Zhang, Sci Rep,
2013, 3, 1718; (b)S. Devaraj and N. Munichandraiah, J. Phys. Chem. C, 2008, 112, 4406-4417. 3. (a)Y.-K. Hsu, Y.-C. Chen, Y.-G. Lin, L.-C. Chen and K.-H. Chen, Chem. Commun., 2011, 47,
1252-1254; (b)J. Luo, H. T. Zhu, H. M. Fan, J. K. Liang, H. L. Shi, G. H. Rao, J. B. Li, Z. M. Du and Z. X. Shen, J. Phys. Chem. C, 2008, 112, 12594-12598.
4. Z.-Y. Tian, P. Mountapmbeme Kouotou, N. Bahlawane and P. H. Tchoua Ngamou, J. Phys. Chem. C, 2013, 117, 6218-6224.
5. (a)S. Dong, X. Chen, L. Gu, X. Zhou, L. Li, Z. Liu, P. Han, H. Xu, J. Yao, H. Wang, X. Zhang, C. Shang, G. Cui and L. Chen, Energy & Environmental Science, 2011, 4, 3502-3508; (b)L. Hu, W. Chen, X. Xie, N. Liu, Y. Yang, H. Wu, Y. Yao, M. Pasta, H. N. Alshareef and Y. Cui, ACS Nano, 2011, 5, 8904-8913.
6. G. Yu, L. Hu, N. Liu, H. Wang, M. Vosgueritchian, Y. Yang, Y. Cui and Z. Bao, Nano Lett, 2011, 11, 4438-4442.
7. W. Chen, R. B. Rakhi, L. Hu, X. Xie, Y. Cui and H. N. Alshareef, Nano Lett, 2011, 11, 5165-5172.
8. G. Yu, L. Hu, M. Vosgueritchian, H. Wang, X. Xie, J. R. McDonough, X. Cui, Y. Cui and Z. Bao, Nano Lett, 2011, 11, 2905-2911.
9. X. Lu, T. Zhai, X. Zhang, Y. Shen, L. Yuan, B. Hu, L. Gong, J. Chen, Y. Gao, J. Zhou, Y. Tong and Z. L. Wang, Adv. Mater., 2012, 24, 938-944.
10. J. Kang, A. Hirata, L. Kang, X. Zhang, Y. Hou, L. Chen, C. Li, T. Fujita, K. Akagi and M. Chen, Angew Chem Int Ed Engl, 2013, 52, 1664-1667.
11. Z. Yu, B. Duong, D. Abbitt and J. Thomas, Adv Mater, 2013, 25, 3302-3306. 12. M.-S. Wu, Z.-S. Guo and J.-J. Jow, J. Phys. Chem. C, 2010, 114, 21861-21867. 13. S. I. Cho and S. B. Lee, Acc. Chem. Res., 2008, 41, 699-707.