evaluation of the properties of electrochemically
TRANSCRIPT

Evaluation of the Properties of Electrochemically Activated Water on Different
Salt Compositions and its Capabilities as an Antimicrobial, Cleaning, and
Allergen Control Solution.
A THESIS SUBMITTED
TO THE FACULTY OF
UNIVERSITY OF MINNESOTA
BY
DANIEL MARINO
IN PARTIAL FULFILLMENT OF THE REQUIREMENTS
FOR THE DEGREE OF
MASTER OF SCIENCE
JOELLEN M. FEIRTAG, ADVISOR
DECEMBER, 2016

© Daniel Marino 2016

i
ACKNOWLEDGEMENTS
I would like to acknowledge my advisor, Dr. Joellen Feirtag, for taking me in,
teaching me how interesting food safety is, and making me appreciate
microbiology.
I want to thank all of the members of the Feirtag lab, past and present, for always
willing to help out in a time of need and for all their support and encouragement.
I also want to thank my friends for always being there to support me and for their
understanding when I would disappear for days when lab work piled up.
Finally, I want to thank all of the friends and colleagues I have made here at the
University of Minnesota. All the fun times we had getting to know each other and
all of the time spent commiserating when nothing was going right in the lab made
my time at the U truly enjoyable.

ii
iii
DEDICATION
I want to dedicate my thesis to my parents due to their endless support during my
academic pursuits.
I also want to dedicate this thesis to all the teachers and mentors I have had since
the start of my academic career. They fostered my love of science and pushed me
to become the scientist I am today.
iv
ABSTRACT
Electrochemically Activated (ECA) water has received high amounts of attentions
as a novel sanitizer that has potent antimicrobial capabilities as well as being safe to
handle. Although it also has cleaning capabilities, those are often overlooked due to how
well it performs as an antimicrobial.
The present study was performed to improve the knowledge of ECA water as a
cleaner and other potential roles in the food industry. The first experiment investigated
various different salts used to produce ECA water and showed that NaCl and KCl created
strong and usable cleaners and sanitizers.
The second experiment attempted to understand how dilute ECA water could be
before antimicrobial and cleaning capabilities were lost. Due to the strength of ECA
water in both of these uses, the solutions could withstand large dilutions.
The third experiment attempted to see if ECA water could successful be used as
an allergen control system. The findings showed that ECA water was successful in
removing allergens from stainless steel and tile but struggled on plastic and rubber
surfaces.
The last experiment was aimed at applying ECA water into a processing system.
The data showed that seeds contaminated with Salmonella could be soaked for 12 hours
and receive a ~5 log10 reduction in bacterial load.

v
TABLE OF CONTENTS
Contents
ACKNOWLEDGEMENTS .............................................................................................................. i
DEDICATION ................................................................................................................................ iii
ABSTRACT. ................................................................................................................................... iv
TABLE OF CONTENTS ................................................................................................................. v
LIST OF TABLES ......................................................................................................................... viii
LIST OF FIGURES .........................................................................................................................ix
CHAPTER 1: ................................................................................................................................... 2
INTRODUCTION TO ELECTROCHEMICALLY ACTIVATED WATER ............................ 3
Production of ECA Water ..................................................................................................... 5
How It Works ........................................................................................................................ 7
Effect of Chlorine Species ..................................................................................................... 7
Effect of Oxidation Reduction Potential ............................................................................... 9
Effects of pH and Hydrogen Bubbles .................................................................................... 9
Disadvantages of ECA Water .............................................................................................. 10
APPLICATIONS OF ECA WATER IN THE FOOD INDUSTRY ......................................... 11
Fruits and Vegetables .......................................................................................................... 12
Eggs and Poultry ................................................................................................................. 13
Seafood ................................................................................................................................ 14
FOOD SANITATION AND CLEANING ............................................................................... 15
Cleaning and Sanitizing ....................................................................................................... 16
Why Do We Clean and Sanitize? ........................................................................................ 17
Foodborne Soils ................................................................................................................... 19
Foodborne Microorganisms ................................................................................................. 21
Current Methods of Cleaning and Sanitizing ...................................................................... 24
What a Cleaning Compound Should Be .............................................................................. 24
Types of Cleaning Compounds ........................................................................................... 26
Current Sanitizing Methods ................................................................................................. 29
Common Chemical Sanitizers ............................................................................................. 31
ALLERGEN CONTROL IN THE FOOD INDUSTRY .......................................................... 34

vi
Considerations for Prevention of Allergen Cross Contact in a Food Plant ......................... 36
Cleaning as an Allergen Control Measure ........................................................................... 37
Verification and Validation of Allergen Cleaning .............................................................. 38
CHAPTER 2: ................................................................................................................................. 41
INTRODUCTION .................................................................................................................... 42
MATERIALS AND METHODS ............................................................................................. 44
Electrochemically Activated Water Production: ................................................................. 44
Free Available Chlorine, ORP, and pH Testing: ................................................................. 44
Cleaning Effectiveness Factor ............................................................................................. 45
ATP Cleaning Verification .................................................................................................. 45
Antimicrobial Capabilities ................................................................................................... 46
Statistical Analysis .............................................................................................................. 47
RESULTS ................................................................................................................................. 48
DISCUSSION ........................................................................................................................... 51
CHAPTER 3: ................................................................................................................................. 57
INTRODUCTION .................................................................................................................... 58
METHODS AND MATERIALS ............................................................................................. 59
Electrochemically Activated Water Production .................................................................. 59
Free Available Chlorine, ORP, and pH Testing .................................................................. 59
Antimicrobial Capabilities ................................................................................................... 60
ATP Cleaning Verification .................................................................................................. 60
Statistical Analysis .............................................................................................................. 61
RESULTS ................................................................................................................................. 62
DISCUSSION ........................................................................................................................... 63
CHAPTER 4 …………………………………………………………………………………………………………………………….66
INTRODUCTION .................................................................................................................... 67
MATERIALS AND METHODS ............................................................................................. 69
Electrochemically Activated Water Production .................................................................. 69
Free Available Chlorine, ORP, and pH Testing .................................................................. 69
Big 8 Allergen Preparation .................................................................................................. 69
Inoculation of Food Contact Surfaces ................................................................................. 70
Statistical Analysis .............................................................................................................. 70

vii
RESULTS ................................................................................................................................. 71
DISCUSSION ........................................................................................................................... 74
Chapter 5: …………………………………………………………………………………………………………………………….77
INTRODUCTION .................................................................................................................... 78
MATERIALS AND METHODS ............................................................................................. 80
Electrochemically Activated Water Production .................................................................. 80
Free Available Chlorine, ORP, and pH Testing .................................................................. 80
Seeds .................................................................................................................................... 80
Bacteria Culture Preparation ............................................................................................... 80
Inoculation of Seeds and Testing of ECA Water ................................................................ 81
Statistical Analysis .............................................................................................................. 81
RESULTS ................................................................................................................................. 82
DISCUSSION ........................................................................................................................... 83
LITERATURE CITED .................................................................................................................. 86

viii
LIST OF TABLES
Table 1. Common Names for Acidic ECA Water ........................................................................... 5
Table 2. Summary of Published Lowest Observed Adverse Effect Levels for Food Allergens .... 35
Table 3. Amount of Salt Used in Each ECA Water Solution ........................................................ 44
Table 4. pH, ORP, and FAC content of NEW and AlEW solutions .............................................. 48
Table 5. Calculated Cleaning Effectiveness Factor (CEF) for AlEW Solutions ........................... 49
Table 6. Average and Percent ATP RLU Reductions after Treatment with AlEW solutions ....... 49
Table 7. Average log10 reductions after treatment with NEW solutions ........................................ 50
Table 8. ECA Water Mixture Composition ................................................................................... 59
Table 9. Average Log10 Reduction after Treatment with ECA Water Mixtures ............................ 62
Table 10. Average ATP Reduction after Treatment with ECA Water Mixtures on Four Surfaces.
....................................................................................................................................................... 62
Table 11. pH and ORP of AlEW Used in Allergen Removal Experiment .................................... 71
Table 12. Comparison of p Values from Cochran's Q tests ........................................................... 73
Table 14. Average log10 Reduction After Treatment with NEW on Four Different Seeds ........... 82

ix
LIST OF FIGURES
Figure 1. Schematic of Electrolyzed Water Generator (Huang et al 2008) ................................ 6
Figure 2. Abundance of Hypochlorous Acid based on pH of solution (Su et al. 2007). ..............32
Figure 3. Comparison of Fifteen Allergen Removal Trials on 316 Stainless Steel Using Water and
AlEW .............................................................................................................................71
Figure 4. Comparison of Fifteen Allergen Removal Trials on Ceramic Tile Using Water and
AlEW .............................................................................................................................72
Figure 5. Comparison of Fifteen Allergen Removal Trials on HDPE Plastic Using Water and
AlEW .............................................................................................................................72
Figure 6. Comparison of Fifteen Allergen Removal Trials on RMV Rubber Using Water and
AlEW .............................................................................................................................73

2
CHAPTER 1:
Literature Review

3
INTRODUCTION TO ELECTROCHEMICALLY ACTIVATED WATER
Electrochemically activated water (ECA) is being implemented in many
industries as on-site production of both a cleaner and a sanitizer (Huang et al. 2008). The
process of making ECA water leads to the production of two different solutions: Acidic
Electrolyzed Water (AEW), which passes through the anode and is a sanitizing solution,
and Alkaline Electrolyzed Water (AlEW), which passes through the cathode and is a
cleaning solution (Su et al. 2007). As a potent yet safe-to-handle sanitizer, the AEW
solution has been easily applied into various industries (Hricova et al. 2008). The AlEW
solution has not seen as widespread use and has been considered a waste stream in the
process, but current research, including the present study, has demonstrated that the
AlEW can have various uses within the food industry.
The concept of ECA water was originally developed in Russia as a water
decontamination and regeneration process (Huang et al. 2008). This technology was
successful due to its ability to provide an effective antimicrobial for many different
microbes (Huang et al. 2008). It quickly spread to other industries as an efficient
disinfectant, particularly as a way to quickly disinfect medical instruments. It was soon
adapted by Japan and saw widespread use, including home-use versions (Hricova et al.
2008)
With further improvements and miniaturization of the electrolyzing system, ECA
water has been applied to various fields and has shown great potential as a non-thermal
treatment for bacterial control due to its strong efficacy and low chemical impact on the
environment as well as the users’ health (Su et al. 2007; Huang et al. 2008; Hricova et al.

4
2008). Additional research has shown the cidal capabilities of ECA water on various
microorganisms such as fungi, viruses, algae, and protozoans (Huang et al. 2008). Most
research at this point has focused either on a dip method (5 or 15 minute dips) or a spray
method (15 second spray). These two methods best reflect that potential integration that
ECA water would have in the food and agriculture industry (Hricova et al. 2008). The
efficacy of ECA water in a processing environment remains to be seen but the literature
results indicate a promising incorporation.
The major disadvantage of ECA water is its short shelf life. It only appears to last
a week if exposed to the air, due to the evaporation of chlorine lowering the concentration
of hypochlorous acid in solution, and about one month if it is sealed in a closed container,
as the loss of chlorine gas is slowed and the method of chlorine loss is thought to change
to disproportionation of chlorine rather than evaporation (Su et al. 2007). But the main
advantage of implementing ECA water technology into food plants, is that it can be
produced on site when needed, and therefore, used fresh. It eliminates the storage of
dangerous chemicals.
Although ECA water is the most common name, there is a myriad of others that
are used. Electrolyzed Oxidizing (EO) water, Acidic Electrolyzed (AEW, AcEW), and
Redox water are also common terms for ECA water (Huang et al. 2008). It is important to
note that all these various names correspond to slightly different versions of ECA water
but they all function the same way. The main differences are the settings on the
electrolysis machine which leads to minute changes in the cleaning and sanitizing
solutions. Commercialized names such as Miracle Liquid, Magic Water, and Functional

5
Water have led to further confusion (Huang et al. 2008). Table 1 shows a variety of
commonly used names for ECA water.
Table 1. Common Names for Acidic ECA Water
Other Names for Acidic Electrolyzed Water
Acidic oxidizing water, acidic electrolyzed water, aqua oxidation water, chlor-
aquaeous water, electrolyzed sodium chloride, electrolyzed oxidizing water, functional
water, redox water, sterilox water, superoxide water, magic water, miracle liquid
Production of ECA Water
ECA water is produced by passing a dilute salt solution (0.5% to 2% NaCl)
through an electrolytic cell (Su et al. 2007). Depending on the system that is being used,
the salt solution is prepared prior to electrolysis or the system itself creates it from tap
water and a saturated salt solution. Within the cell, the anode and the cathode are
replaced by a membrane (Figure 1). As direct current voltage is applied to the cell, the
negatively charged ions in the solution (primarily Cl- and OH-) are attracted to the anode
and begin to be oxidized to form various compounds such as oxygen gas, chlorine gas,
hypochlorite ion, hypochlorous acid, and hydrochloric acid, while the positively charged
ions in the solution (Na+ and H+) move towards the cathode to be reduced and produce
hydrogen gas and sodium hydroxide (Su et al. 2007). The AEW solution has a pH of 2 to
3, an oxidation-reduction rate (ORP) of >1,100 mV, and a free available chlorine content

6
of 10 to 90 ppm (Huang et al. 2008). The AlEW solution has a pH of 10 to 13 and an
ORP of -800< mV (Huang et al. 2008). The two solutions are produced simultaneously.
Figure 1. Schematic of Electrolyzed Water Generator (Huang et al. 2008)
As more research is done, new variations of ECA water systems are beginning to
arise. Although most current ECA water systems contain a membrane that separates the
anode and the cathode chambers, a new type of system removes this membrane and
allows for the free migration of HCl and NaOH from each side (Hricova et al. 2008). The
removal of the membrane allows for the production of Neutral Electrolyzed Water
(NEW) as well as the Alkaline Electrolyzed Water. Neutral Electrolyzed Water differs
from AEW in that it has a pH of 6 to 7 and an ORP of ~700 (Huang et al. 2008). The
primary compound in the solution is also slightly different. While in AEW, the
predominant species is the hypochlorite ion, in NEW the predominant species is

7
hypochlorous acid (HOCl-). Although NEW has been shown to be effective against a
wide variety of foodborne pathogens, its efficacy has not been extensively studied. The
main benefits of NEW are that it does not contribute to the rusting of equipment or
irritation of hands as aggressively as AEW due to its near neutral pH, and its
antimicrobial properties can last about twice as long in open and closed containers due to
the stability of hypochlorous acid compared to hypochlorous ions (Abadias et al. 2008).
In addition to the presence of a membrane, various systems also allow you to vary the
concentration of NaCl, the amperage applied to the cell, the time of electrolysis, and the
water flow rate (Su et al. 2007). All of these can have an impact on the pH, ORP, and
FAC content of the AEW, NEW, and AlEW.
How It Works
It’s these various parameters that give the sanitizing and cleaning solutions their
efficacy. AlEW effectiveness is due to its relatively low ORP and the presence of
hydrogen nanobubbles which increase the surfactant effect when removing soils from
surfaces (Su et al. 2007, Takenouchi 2010). The efficacy of AEW and NEW is still up for
debate, however. Although we are able to control the various parameters of AEW and
NEW, there is no consensus as to what provides its effectiveness as a sanitizer. The two
predominant explanations are centered on its extreme ORP and the presence of HOCl-
(Su et al. 2007; Huang et al. 2008; Hricova et al. 2008).
Effect of Chlorine Species
8
Chlorine is one of the most commonly used sanitizers in the food industry and it’s
well known that hypochlorous acid is one of its most effective forms. Hypochlorous acid
works by penetrating the cell membrane and interacting with specific enzymes within the
cell to hinder cellular respiration. The concentration of hypochlorous acid in ECA water
has shown a positive correlation with its antimicrobial ability (Su et al. 2007). Further
research has shown that while other components being held constant, the chlorine content
was the sole component that determined bacteria elimination demonstrating complete kill
at levels above 1.0ppm (Park et al. 2004). The loss of chlorine over time and its effect on
antibacterial efficacy also provide further evidence to hypochlorous acid being the reason
for ECA water’s antimicrobial capabilities. Due to the presence of chlorine ions (Cl-),
hypochlorous acid will breakdown into chlorine gas which is lost to the air.
𝐻𝑂𝐶𝐿 + 𝐶𝑙− + 𝐻+ ↔ 𝐻2𝑂 + 𝐶𝑙2
Reaction 1. The loss of Hypochlorous Acid is increased with a higher concentration of
chlorine ions.
It’s thought that this is the reason that ECA water loses antimicrobial activity over
time and why NEW is able to last for a longer period of time as the reaction rate is
slowed when the pH is near neutral. When in a closed container, the breakdown is most
likely due to chlorine disassociation rather than chlorine gas formation, this occurs at a
much slower rate. This is why ECA water should either be used immediately or kept in a
closed container.
9
Effect of Oxidation Reduction Potential
Oxidation-Reduction Potential (ORP) also plays a large role in the antimicrobial
capabilities of ECA water. Anaerobic bacteria require a high ORP to function (+200 to
+800 mV) while anaerobic bacteria require a low ORP (-40 to -400 mV) (Su et al. 2007).
The extremely high ORP of AEW and NEW (~1,150mV) creates a very inhospitable
environment for bacterial growth. The ORP can directly damage the outer and inner
membranes of various bacterial at this level allowing for hypochlorous acid (independent
of concentration) to go into the cell to kill it (Liao et al. 2007). Additionally, at high
levels, ORP can directly influence cell signaling and induce apoptosis and necrosis within
the cell (Su et al. 2007). At this point, there is not sufficient data to clearly point to ORP
or hypochlorous acid as the main source of ECA water’s antimicrobial capabilities. It is
also likely that rather than acting individually, there is a synergistic effect between the
two components which allows ECA water to achieve its high antimicrobial ability in
comparison to hypochlorous acid solutions and solutions with high ORP (Su et al. 2007).
Effects of pH and Hydrogen Bubbles
There are two other factors that contribute to the antimicrobial activity: pH and
hydrogen bubble presence. The pH in acidic electrolyzed water does provide an extra
level of antibacterial capability as most bacteria can only grow in the pH range of 4 to 8
(Park et al. 2004). The low pH makes it difficult for most bacteria to survive and further
weakens them and makes them susceptible to hypochlorous acid and the ORP. In neutral
electrolyzed water, pH does not play a role as the neutral pH does not affect most
bacteria. However, NEW does have the benefit of having an increased concentration of

10
hydrogen nanobubbles present (Su et al. 2007). The hydrogen bubbles are formed during
the formation of sodium hydroxide and are one of the elements that give alkaline
electrolyzed water its cleaning efficacy. As NEW is made by essentially mixing AEW
and AlEW, the hydrogen bubbles are transferred to the NEW. These bubbles are small
enough (between 10 and 1000 nm in diameter) that they are able to penetrate the cell
membrane of most microbes allowing for even further penetration of hypochlorous acid
into the cell (Su et al. 2007). This can account for the similar sanitizing effect of AEW
and NEW even though their pH values are different. There is currently not a lot of
research that would definitely indicate that the hydrogen nanobubbles play a predominant
role but its role has been heavily suggested.
Disadvantages of ECA Water
Some of the major issues with electrolyzed water are its dependence on surface
structure to provide the most effective kill. Rico et al. (2008) showed much greater log
reductions of E. coli O157:H7 on shredded lettuce than baby carrots due to the smoother
surface of the lettuce. Injured sites on fruits and vegetables also provide a better
environment for the bacteria to attach and grow due to the increase in nutrient availability
(Okull and Laborde 2004). The injured on produce also protect the bacteria as the AEW
and NEW are not able to fully act upon them. Another disadvantage of ECA water is that
the presence of protein can reduce the effectiveness of AEW (Bonde et al. 1999).
Additionally, as previously mentioned, AEW can last about one month at full efficacy,
while NEW can last for about two months in an open container. This is assuming they are
in a closed container as leaving them open severely shortens the shelf life of the sanitizer.

11
AlEW is more stable and can last over a month in a sealed container (Su et al. 2007). On
a business side, the most predominant downside is the high startup cost of the generator
(Huang et al. 2008). This can range from a few thousand dollars to a few hundred
thousand dollars.
APPLICATIONS OF ECA WATER IN THE FOOD INDUSTRY
Electrolyzed water has been successfully implemented into various industries.
AEW has been applied pre-harvest into the irrigation systems of citrus groves to contain
waterborne pathogens like Phytophthora spp. and Fusarium spp (Aday 2016). Both types
of organisms were killed upon introduction of AEW with a chlorine content of 150ppm.
Even with such thorough kill, there was no chlorine-induced phytotoxicity in the growing
plant (Aday 2016). Within the food industry, AEW has seen great success as a sanitizer
being able to easily reduce pathogenic contamination. One of the most successful
applications has been as a spray sanitizer for fresh produce (Huang et al. 2007).
Depending on the product, ECA water performed similarly or better than commercially
available sanitizers. Research has shown that AEW can be used as an effective sanitizer
on fresh-cut carrots, bell peppers, spinach, Japanese radish, and potatoes (Huang et al.
2006). They were able to show an average bacterial reduction of 2.6 logs CFU/g and
showed no discoloration or otherwise negative effects on the produce. Koseki et al.
(2004) showed that applying AEW instead of water in cucumber and lettuce washing
procedures showed a 2 log greater reduction than their standard washing procedures.

12
Fruits and Vegetables
Sprouts have also shown to benefit from AEW usage. Sprouts have been linked
with various food-borne illness outbreaks (Kumar et al. 2006). They are produced in
warm and humid conditions which allow pathogens to easily grow thus increasing the
risk of infection. Reports of alfalfa sprouts exceeding 10^6 CFU/g indicate the potential
hazard that sprouts carry (Kumar et al. 2006). The traditional treatment to reduce sprout
contamination is to treat the seeds with 20,000 mg/L Ca(OCl)2. This, however, drew
concern due to worker safety concerns as well as reduced germination rates (lowering
them from 95% to 70%) (Kim et al. 2003). Application of AEW reduced the
concentration of E. coli O157:H7 by 1.05 log CFU/g after a 2 minute treatment and by
2.72 log CFU/g after a 60 minute treatment. The AEW also did not cause any visible
damage to the sprouts nor did it affect it's germination rates. The addition of sonication to
the AEW treatment further increased its effectiveness leading to a 5.01 log CFU/g
reduction of E. coli (Kumar et al. 2006).
Fruits have also shown to be a suitable platform for the use of AEW. It has been
used to delay postharvest decay in peaches and could have potential as an alternative to
liquid sterilants (Al-Haq et al. 2002). Electrolyzed water has also been used to inactivate
E. coli O157:H7 on cantaloupes as well as fresh cut apples and has met promising
success (Graça et al. 2011). Additionally, AEW has been used to successfully control the
presence of patulin, a mycotoxin produced by Penicillium expansum (Okull and Laborde
2004). A rinse with AEW containing 60 ppm of chlorine decreased viable spore
populations of P. expansum by over 4 logs. It is important to note that this research found
that electrolyzed water was not able to control brown rot in wounded fruits but it was able
to reduce the overall disease incidence. While electrolyzed water has seen successful use

13
in smooth-skinned fruit, fruit with more uneven skin has posed a greater challenge.
Studies by Koseki et al (2004), showed that AEW was only able to reduce surface aerobic
mesophiles by one log CFU/g on strawberries. The researchers attributed these results to
the uneven surface of the strawberry due to the achenes, the seeds on the exterior of the
fruit that are present.
Eggs and Poultry
The poultry industry has also seen various benefits through the application of
electrolyzed water. One common use is for the disinfection of egg shells. Egg shells can
serve as a carrier for various human pathogens due to the fecal matter being present in the
nesting place, the wash water, and in the packaging processing (Cao et al. 2009). The
shells can easily be contaminated with E. coli O157:H7, Salmonella spp., Listeria
monocytogenes, and Yersinia enterocolitica (Cao et al. 2009). Traditionally, the
pathogens are eliminated using formaldehyde and glutaraldehyde gas or hydrogen
peroxoide but these can pose serious risk to humans as well as chickens. Russell (2003)
found that spraying with AEW can completely eliminate S. Typhymurium, St. aureus,
and L. monocytogenes that would be present on the shells as well as reducing E. coli
O157:H7 and Yersenia enterocolitica presence. A large number of outbreaks in the
poultry industry have been linked to Campylobacter jejuni and thus they have turned to
chlorine rinses as a preventative measure (Cao et al. 2009). Park et al. (2002) showed that
that replacing AEW containing 50ppm of chlorine for water during the poultry washings
lead to a complete inactivation of C. jejuni. While chemical antimicrobials have lowered
the presence of C. jejuni, they do come with downsides such as chemical residues,
discoloration of carcasses and high cost.

14
There have also been several outbreaks directly connected with poultry
consumption. In most of these outbreaks, C. jejuni was the pathogen present in the
chicken (Park et al. 2002).The common method to deal with C. jejuni is to use chlorine
rinses on the chicken carcasses but this has led to several issues such as chlorine residues
left on the carcass, carcass discoloration, and high costs and low effectiveness (Melo et
al. 2013). Other pathogens, such as Escherichia coli O157:H7, S. enteritidis, and L.
monocytogenes, have also posed problems for the problems for the poultry industry as
well, so researches have also looked for solutions to address these as well. In 2002, Park
et al. showed that dipping chicken wings in AEW water for ten seconds showed a
complete elimination of C. jejuni (7.5 log CFU/ml). Fabrizio et al. (2002) showed that
AEW could be used to prevent the growth of Salmonella spp. during storage of the
chicken carcasses. It showed the same effectiveness as the more commonly used methods
such as ozonated water, and acetic acid washes.
Seafood
One of the predominant food safety concerns regarding seafood is Vibrio
parahaemolyticus due to its resistance to various common prevention methods and its
presence in a variety of seafood, such as cod, sardines, clams, shrimps, and oysters
(Huang et al. 2006). Various outbreaks in 2015 highlight the danger that Vibrio
parahaemolyticus can pose (Liu et al. 2006). Various treatments have been implemented
with varying degrees of success. Mahmoud et al. (2004) examined the use of AEW on
filleted carp. The carp fillets were inoculated with various strains of bacteria. A 15-
minute dip in AEW reduced the total population of aerobic bacteria by 2.8 log units. Ren
15
and Su (2006) showed that raw oysters subjected to a 10 dip AEW showed a reduction of
over 6.6 log units. Additionally, further holding in AEW showed increasing results.
Extended holdings (exceeding 12 hours) were shown to have detrimental effects on the
oysters. Ratana-Arporn and Jommark (2014) showed that NEW showed great promise in
removing various pathogens (Vibrio parahaemolyticus, Vibrio vulnificus, S. Enteritidis,
E. coli) in shrimp. A 15-minute dip in NEW containing 50ppm of chlorine showed a
complete elimination for V. parahaemolyticus, V. vulnificus, S. Enteritidis, and E. coli.
Additionally, there seemed to be no sensory changes on the shrimp. AEW has also been
used to extend the shelf life of certain fish during refrigeration and freezing. Huang et al.
(2006) showed that using AEW increased the shelf life of yellow-fin tuna by a few days,
maintaining hygienic quality and freshness of the tuna meat.
FOOD SANITATION AND CLEANING
One of the major issues when in the food industry is the proper cleaning and sanitation of
food and food production facilities. With the constant growth of the food industry and
new regulations that are imposed by governments throughout the world, sanitation and
cleaning have received a large focus on research. More effective and safer methods are
constantly being sought out. Prior to even using cleaning and sanitizing solutions, food
sanitation begins with the design and layout of the food production facility. Although
food plants are designed to be hygienic, it is often up to the workers to ensure that it
remains that way which leads to the reliance of cleaning and sanitizing products to ensure
that equipment and the food coming out of them remains hygienic (Berk 2013). Various
products and technologies have been developed and applied to varying amounts of

16
success but a perfect cleaner and sanitizer has not been developed yet (and likely never
will due to the nature of the problem).
Cleaning and Sanitizing
While cleaning and sanitizing are sometimes used interchangeably, they are
different in actuality. Cleaning is defined as the removal of any soils (soils are defined as
any material in the wrong place, usually made up of dirt, dust, and scraps of food) from a
surface, while sanitizing is defined as the killing of any pathogenic bacteria from a
surface (Grinstead 2009). When sanitizing, it is possible for other non-pathogenic
bacteria to remain in the surfaces. Due to their joined nature, cleaning and sanitizing
often occur subsequently. Cleaning can be considered one of the first steps when it comes
to sanitizing as leftover soils can provide a suitable harbor for pathogenic bacteria to
grow and proliferate (Gould and Gould 2001).
Cleaning and sanitation can be thought of as a combination of various scientific
disciplines due to place in food. It can directly deal with physical, chemical, biological,
and microbial principles of food, environment, and health. Due to the complexity that it
entails, sanitation should be thought of as a system of practices rather than an individual
action. Proper sanitation must be observed through the entirety of a products production
cycle, from the raw ingredients until the final product. Research has shown that some
hazards (particularly bacterial hazards) cannot be contained at a single point in the
production cycle (de Oliveira et al. 2016).

17
Most modern food safety professionals embrace the idea of a food safety
management system composed of various aspects. Among these aspects are having
prerequisite programs in place, current good manufacturing practices (cGMPs), a Hazard
Analysis of Critical Control Points (HACCP) plan, and a recall procedure, among others.
Sanitation plays a central role in all of these aspects (Gould 1994). Proper cleaning is part
of cGMPs, it can be a way to control hazards in a HACCP plan, and can be a primary
culprit should a recall happen; thus it is important to understand why cleaning and
sanitizing occur and how to best go about them. One of the main factors in food safety is
that rather than being a list that people check off, it must be thought of as a behavior-
based system that is constantly evolving and changing (Sun and Ockerman 2005). If
those who are implementing it do not understand all of these aspects involved, it can
place certainty in a catastrophe happening.
Why Do We Clean and Sanitize?
Most food industries have a sanitation program in place. The sanitation program
lays out a plan on how to practice sanitation effectively as most people would consider
sanitation and cleaning to be very important. Although sanitation programs are usually
very straightforward and easy to follow, it is important to understand why they were
created in the first place and the various benefits that they bring about to the company or
process.
One of the primary reasons for a company to have a sanitation program is rather
simple: they have to. Federal regulations have become fairly strict on what food
production facilities must maintain as a sanitation and cleaning standard (de Oliveira et
al. 2016). New regulations such as the FDA’s Food Safety Modernization Act (FSMA)

18
have expanded and delineated what companies must do. FSMA aims to give a clear
definition as to what food safety must look like in a production facility and proper
cleaning and sanitation are two main components of the FDA’s ideal food safety plans.
Another reason to have a sanitation program is to prevent any potential catastrophe from
occurring due to a company’s product. There are almost ten million cases of foodborne
illnesses every year and this is likely an underestimate due to a large percentage of cases
that go unreported (Scallan et al. 2011).
Preventing foodborne illnesses is another primary reason to implement a strict
sanitation program. The vast majority of the almost ten million cases of foodborne are
preventable with proper sanitation and handling of the food and the food processing
facility (Scallan et al. 2011). Preventing an outbreak is of utmost importance to food
companies as they can be costly both in terms of money and consumer trust. A
contemporary example is Chipotle Mexican Grill. After a few foodborne outbreaks they
have lost a large chunk of their market share showing their income being reduced by
almost 50% and the consumer trust of their product at an all-time low (Willoughby
2015). It is estimated that it will take several years for Chipotle to bounce back to their
pre-outbreak numbers. Chipotle has become a cautionary tale for many food distributors
as they aim to have fresh and organic products that can be produced in a safe manner at a
large scale. In addition, the implementation of an effective sanitation plan increases the
quality and confidence of your company. Customer relations improve as they are able to
trust the product and employee morale is boosted knowing that they work in a safe
environment.

19
Another important reason for proper sanitation is to improve the quality of the
food product. Even if foods do not cause illness when eaten, improper sanitation can
leave enough bacteria to spoil the food affecting its color, texture, smell, and flavor (Berk
2013). Consumers treat defects in the food as a sign of low quality so it is in the food
producer’s best interest to adhere to their sanitation plan in order to ensure the highest
quality of food. Additionally removing spoilage bacteria can enhance the shelf life of
most products allowing it to be sold for a longer amount of time while still maintaining
the appropriate quality (Holah 2014). Cleaning can also lower energy costs by allowing
machinery to operate more efficiently as well as create a safer workplace environment by
making it less likely for workers to have falls or accidents due to slippery conditions.
Foodborne Soils
As previously mentioned, the main purpose of cleaning and sanitizing is to
remove any soils or pathogenic bacteria that are present in order to ensure that the
product being made is of high quality and safe to the consumer. In order to understand
how to properly apply cleaning and sanitization practices, it is imperative that one
understands what types of soils and bacteria are present in their facility as they all require
slightly different methods of intervention.
There are a myriad of different types of soils that all act differently and thus can
require different conditions (type of cleaner and temperature) (Berk 2013). The variety of
different soils makes a “perfect” cleaner almost impossible. Some soils require opposite
characteristics in order to be cleaned. For example, a cleaner that excels at cleaning
water-soluble soils would not be ideal to use with soils that are not water-soluble. It’s

20
also common for a food facility to have to deal with more than one type of soil at a time,
especially if they run multiple products (Berk 2013).
Another aspect that must be considered is the type of surface that the soil is
attached to. The surface type can directly affect the types of soils that are present, how
strongly they are attached, and the necessary cleaning compound to properly and safely
remove them (Holah 2014). Soil is especially difficult to remove from cracks, crevices,
and other uneven surfaces. The easiest soils to remove are those that are present on
smooth and non-porous surfaces.
Soil attachment to a surface is influenced by a number of chemical properties,
such as surface tension, wetting power, and reactivity, and physical characteristics, such
as particle size, density, and shape (Brougham 2011). Soils are sometimes held on by
adhesion forces and more soils can be bonded to the surface activity of the adsorbed
particles. An effective cleaner would overcome the adhesion force through the use of a
surfactant that lowers the surface energy of the soil and additionally weakens the
interaction of the soil and the surface it is attached to. Environmental humidity and time
of contact can also affect the adhesion strength of the soil (Kakurinov 2014). Higher
humidity lowers the strength of the adhesion to the surface and the higher contact time
increases the strength of the bond between the surface and the soil.
In addition to soils, biofilms bear mentioning. Although comprised of various
bacteria, a biofilm is composed of various layers forming matrices which strengthen the
attachment to the surface they are on. There are several types of pathogenic and spoilage
bacteria that can form biofilms, among them Listeria monocytogenes, Shigella species,

21
Salmonella enterica, and Escherichia coli (Grinstead 2009). The biofilm provides
bacteria with a safe haven that protects them from sanitizers and other types of
antimicrobial agents. Foods that come into contact with biofilms can easily be
contaminated by the pathogenic and spoilage bacteria. The removal of biofilms is
complex as it requires heat, mechanical force, and a combination of cleaning and
sanitizing compounds in order to ensure complete removal (Grinstead 2009).
Foodborne Microorganisms
Understanding the microorganisms that are present is also a large part of a proper
and comprehensive cleaning plan. Every food product must be wary about some form of
microorganism affecting the quality and safety of the product. Whether it is from
pathogenic bacteria, molds, yeast, or viruses, every food product is susceptible to one
form or another. Thus understanding the hazards of the product being made is imperative
to proper cleaning and sanitization.
Food provides a great breeding ground for microbes due to the various nutrients
that are present (Holah 2014). By controlling the presence of microbes, food stays
acceptable for a longer period of time and foodborne illness is less likely. Proper cleaning
and sanitation during food processing, preparation, and serving is imperative in
controlling food spoilage and controlling the incidence of pathogenic bacteria. The two
most common microorganisms in food are bacteria and fungi (Holah 2014). Although
fungi are less common than bacteria, they are still prevalent and require careful planning
especially with certain food products. Fungi can be broken down into two major groups:
molds, which are multicellular, and yeasts, which are usually unicellular (Holah 2014).
Viruses and parasites can also be present in food. Viruses tend to be carried from person

22
to person but food can act as a carrier if it is handled by an unhealthy person not
following good manufacturing practices. Parasites, such as trichinosis, can also be present
in food but are not common. They are easily killed with proper cooking and do not
multiply in food (Kakurinov 2014). It is important to understand under what conditions
each of the various microorganisms can thrive and grow in. These parameters can then be
controlled in order to minimize the amount of microorganisms present.
Molds are able to survive in a large range of pH and temperatures in comparisons
to yeasts and bacteria (Guentzel et al. 2011). While most molds prefer a pH of 7, they are
able to withstand acidic (0) and alkaline (8) pH. Similarly, while molds prefer room
temperature in order to grow they are able to grow below freezing temperatures as well.
Molds are also able to grow in a wide range of water activity. The minimum water
activity (Aw) for the majority of molds is .90, but there are some types of molds that are
able to grow in Aw of as low as 0.60 (Berk 2013; Holah 2014). Due to this, foods that are
low in water activity are more likely to spoil from molds than they are from yeasts and
bacteria.
Compared to molds, yeasts are far less hearty and take much longer to grow (the
average doubling time is about 2 to 3 hours). Based on this, it is often estimated that it
takes a food 40 to 60 hours to be spoiled from yeast starting with a concentration of one
yeast cell per gram of food, this is considered an average concentration in food if there
are yeast present (Berk 2013). Similarly to molds, yeasts prefer an Aw range near .90 to
grow optimally but there are a handful of exceptions that are able to grow below .90 even
as low as .60. Yeasts are confined to a small pH range however. Yeasts thrive in a pH
range of 4.0 to 4.5 and when taken outside of this range, their ability to grow is greatly

23
hindered (Berk 2013). Due to this, the foods that are most likely to spoil from yeasts are
acidic foods particularly those that are vacuum packaged and those that have high sugar
contents, as this acts as a food source for the yeast.
Viruses and parasites bear mentioning although controlling parameters to lower
their prevalence is close to impossible due to their extreme variety. It is important to note
that viruses (Norovirus specifically) account for over 5 million cases of foodborne
illnesses a year (Scallan et al. 2011). The most effective way of controlling viruses and
parasites is to ensure that proper food handling procedures are being followed as viruses
are often introduced by a human host into the food (a sick employee for example) and
most parasites are easily destroyed with proper cooking (Gould 1994). Although various
microorganisms are destroyed when cooked to a certain temperature, the food producer
cannot rely on the consumer to ensure proper cooking. It is up to the producer to reduce
the number of microorganisms below the safety threshold in order to ensure the safety of
the consumer.
Bacteria are perhaps the most common and most well-known food safety
problem. While not all bacteria are pathogenic, there are many that can accelerate the
decomposition of food causing it to spoil in a shorter amount of time. They are one of the
main causes of foodborne illness. Salmonella spp. are responsible for over one million
cases each year, Campylobacter spp. account for another almost one million cases, and
Clostridium perfringens and botulinum account for another almost two million cases
(Scallan et al. 2011). The silver lining is that although there are over three million cases
of bacteria-linked foodborne illnesses only about 9,000 (only 0.3%) result in death.
Although this number is small, it is an unfortunate truth that all of these deaths could
24
have been prevented with proper cleaning and sanitizing techniques to remove the
presence of any pathogenic bacteria.
Current Methods of Cleaning and Sanitizing
As previously mentioned, proper sanitizing is a two-step process made of up of
cleaning, to remove any foreign soils, and sanitizing, to remove any microbiological
organisms present. If any soil is remaining after cleaning, it can provide protection for the
microbes making the sanitization not work as intended. Due to the large variety of
surfaces present in a food production facility, a lot of care must be taking into selecting
the proper cleaning compound and sanitizing methods. Cleaning itself can be further
broken down into a two-step system involving two different cleaners due to the large
variety of soil types that exist and the proper conditions that it takes to remove them
(Buckley 2015).
What a Cleaning Compound Should Be
To properly select what cleaning compounds should be used, it is important to
understand how soils attach to surfaces and how the cleaning compounds work. Soils
attach to surfaces through various different chemical and physical forces depending on
the characteristics of the soil (Berk 2013). A proper cleaning compound must act against
these forces to disturb them and allow for easy removal of the soil. There are two main
ways that cleaning compounds work. They lower the energy of the bonds between the
soil and the surfaces so the soil can be easily loosed and removed and they suspend any
particles in solution so that they can be flushed away (Berk 2013).

25
A proper cleaning solution has three main tasks. First it must effectively separate
the soil from the surface material. Although soil separation can occur through mechanical
means (high pressure wash or scrubbing), the cleaner can also contribute through
chemical means by affecting the soil directly or indirectly. An example of a direct effect
would be the reaction of an alkali cleaner with a fatty acid to form a soap that is easily
removed; an example of an indirect mean would be surfactants reducing the surface
tension to allow for easy removal (Berk 2013). The effectiveness of the cleaning
compound can usually be enhanced through increased temperature of the water used or
through the addition of further mechanical action.
The second task is to disperse the soil into the cleaning solution. This allows for
the soil to be easily washed away (de Oliveira et al. 2016). The main concern here is to
choose a cleaning solution that has the correct solubility for the soil types present. This is
why most cleaning steps use at least two different types of cleaners in order to remove all
the soils present. There are some soils that will not be soluble in any form of cleaning
solutions and these pose a challenge for the sanitation process. In these cases, mechanical
action was being introduced in order to break down the soil into small enough particles
that can be carried by the cleaning solution.
The final task is to prevent the redisposition of the soil onto the surface. This can
be achieved through a few different ways. The complete dispersion of the soil in the
cleaning solution can aid with the removal as the soil is not able to reach the surface
again. The adsorption of surfactants can make it impossible for soil to redeposit itself
onto the surface due to the change in electrical charge on the particles (Berk 2013). This
also prevents the aggregation of the particles and makes disposal of the cleaning solution
26
much easier. The surfactants are also attached to the surface which further prevents the
soil particles from reattaching due to the repulsion effect (Berk 2013).
Any cleaning compound should at least be able to achieve these three tasks with
at least some success. If it is not able to do any of these tasks, then the cleaning
compound cannot be considered usable. Although cleaning compound choice is
important, successful cleaning is defined by a cohesive system of choices including water
quality, procedures, force applied, and temperature of the cleaner (Berk 2013).
Types of Cleaning Compounds
The vast majority of cleaning compounds function by lowering the surface
tension between the soil and the surface allowing for the soil to be washed away (Berk
2013). The most common and well known example of this is soap. Soap has been
successfully used to clean for hundreds of years. It’s able to suspend the soil particles
allowing for easy removal. This suspension is called an emulsification and the ability to
create one is the basis for a large number of cleaning compounds.
Although there is a large variety of cleaning compounds, the majority can be
placed into one of two main categories: alkaline cleaning compounds and acidic cleaning
compounds (Berk 2013). It should be noted that most cleaning compounds are blends of
consisting of various products.
Alkaline cleaners fall within the pH range of 7 to 14. There are three main
subcategories of alkaline cleaners: strong, heavy-duty, and mild. Strong alkaline cleaners
are categorized due to their ability to dissolve various soils as well as their corrosiveness.
They are considered hazardous to use as they can quickly burn the skin without proper

27
protective equipment, their fumes can also cause respiratory tract damages. These
cleaners are used to remove heavy soils such as those present in commercial ovens or
smokehouses as they can easily remove the soils created in those conditions (Kakurinov
2014). Due to the hazards associated with strong alkaline cleaners, they tend to see more
use in clean-in-place (CIP) systems as those require little personnel contact. Common
examples would be concentrated sodium hydroxide and silicate solutions with high
nitrous oxide to silicon dioxide ratios. Silicon dioxide can also be added to sodium
hydroxide to lower its corrosiveness allowing for use with a wider variety of surfaces
(Berk 2013).
Heavy-duty alkaline cleaners can be thought of as a step down from strong
alkaline cleaners. Their dissolving powers are not as strong but they are only slightly to
noncorrosive and are much safer to handle (Berk 2013). Prolonged contact should still be
avoided and personal protective equipment should still be worn but there is no risk of an
instant burn in comparison to strong alkaline cleaners. There are a variety of common
active ingredients in heavy-duty alkaline cleaners such as sodium metasilicate, sodium
hexametaphosphate, sodium pyrophosphate, sodium carbonate, and trisodium phosphate
(Berk 2013). Sodium carbonate is more commonly used as it can act as a buffer and is of
relatively low cost (Brougham 2011). Heavy-duty cleaners are commonly used in CIP
systems as they can still be hazardous but they do see some use in manual applications.
They are particularly good at removing fat deposits (Berk 2013). Sulfites can also be
added to these cleaners to lessen the impact they have on metal surfaces that are easily
corroded.

28
Mild alkaline cleaners do not see a lot of use in production facilities. They are
mostly reserved for hand-cleaning areas that are only lightly soiled. These compounds
have low hazards associated with them and are of relatively low cost. Common examples
include sodium sesquicarbonate, tetrasodium pyrophosphate, and alkyl aryl sulfonates
(Berk 2013). One specific mild alkaline cleaner that should be mentioned is alkaline
electrolyzed water. Although the active ingredient is sodium hydroxide, it is present in a
low concentration and the solution itself poses no hazards to the person using it.
Additionally, it has the dissolving power of a heavy-duty alkaline cleaner yet a much
lower corrosiveness (Huang et al. 2006).
Acidic cleaning compounds are defined by having a pH range between 7 and 0. In
comparison to alkaline cleaning compounds, they are much better at removing mineral
scale deposits (which can be formed by some alkaline cleaner) (Berk 2013). Acidic
cleaning compounds tend to only be used for very specific purposes and are unable to
effectively remove most soils unlike alkaline cleaning compounds so they are not
recognized as effective, all-purpose cleaners (Berk 2013). There are only two
subcategories of acid cleaning compounds in comparison to alkaline compounds three:
strongly acidic and mildly acidic.
Strongly acidic cleaners are extremely potent and are corrosive to concrete,
metals, and fabrics. These can pose strong hazards due to the danger of skin contact and
to their ability to produce toxic gases when heated (Berk 2013). These types of cleaners
are often used to remove encrusted matter and mineral scale on processing equipment.
Common strongly acidic cleaners used in food plants include hydrochloric, hydrofluoric,
sulfuric, and phosphoric acids (Brougham 2011). Of those, phosphoric acid sees the most

29
use as it has relatively low corrosive properties, can be used on various surfaces, and can
be used in manual cleaning as well (Berk 2013).
Mildly acidic cleaning compounds are only slightly corrosive and may cause
allergenic reactions in some people (Berk 2013). They can attack the skin and eyes so
protective equipment must be used in conjunction. Some examples of commonly used
mildly acidic cleaners include hydroxyacetic, acetic, and gluconic acids (Berk 2013).
More often than not, wetting agents and corrosion inhibitors will be added in order to
improve the effectiveness of the cleaner. The main benefit of the mildly acidic cleaners is
that they can be readily used with manual cleaning as they are not as hazardous as the
strongly acidic cleaners (Holah 2014).
In addition to acidic and alkaline cleaners, there is a third category of cleaning
compounds called synthetic detergents. They function similarly to soap as they can
emulsify fats, oils, and grease but they have the major benefit of not forming soap scum
(Holah 2014). With normal soaps, scum is formed when the cleaner is exposed to hard
water. In hard water, the hydrophilic ends of the soap react with the minerals to create an
undesired white solid. Synthetic cleaners do not have this effect and they are effective in
lowering the surface tension of the solution, promoting wetting of soil particles, and
suspending the soil particles in solution to facilitate removal (Holah 2014).
Current Sanitizing Methods
After properly cleaning a surface from soils, the next remaining step is to remove
all microbial organisms to ensure the safety of any food product that comes in contact
with that surface. Soils can directly impact the majority of sanitizing methods leading to

30
an incomplete removal of microorganisms and potentially endangering the consumer.
There are three major types of sanitizing methods used in the food industry currently:
thermal, radiation, and chemical sanitizing (Berk 2013).
Thermal sanitation, although perhaps the most common form of sanitation, is the
relatively inefficient due to the high amount of energy required to properly remove
microbial agents (Gould and Gould 2001). Its efficiency is directly tied to the temperature
and time maintained during the sanitation process. In order to guarantee the removal of
microorganisms, the proper temperature and time must be achieved throughout the
equipment otherwise dead spots may form where microorganisms may proliferate (Gould
and Gould 2001).
The two major sources for thermal sterilization are steam and hot water. Although
it is possible to sanitize with steam, there are a number of downsides to it. It requires a
large amount of energy and it is ineffective in comparison to other methods. Those
working with it may confuse steam with water vapor causing the temperatures to not be
high enough to sterilize (de Oliveira et al. 2016). It’s also not possible to use on various
surfaces due to the probability of condensation occurring and lowering the effectiveness
of the sterilization treatment. The immersion of smaller components into hot water is
another common sterilization technique. In this method, the water must be kept above
80°C in order to remove microbial activity (Berk 2013). The biocidal activity at this
temperature is thought to come from the denaturation of various proteins in the cell. This
is often the choice when it comes to food-contact surfaces although spores may survive
for over an hour at the regularly used temperatures.

31
Radiation sanitizing is another method that is employed in food production
facilities. It works by subjecting a surface or food product to ultraviolet light with a
wavelength of 2,500 A in order to destroy microorganisms (Berk 2013). Although
effective on fruits, vegetables, and spices, there are some downsides that hold it back.
The rays must directly contact the microorganisms in order to have any effect and thus it
can lead to incomplete sterilization when uneven surfaces are present. The main
drawback is the public perception of radiation. Studies have shown most people will shy
away from products marked as being irradiated due to the implication that radiation has
(Berk 2013).
Chemical sanitizers make up the bulk of the sanitizing methods used in the food
industry. There is a wide variety of chemical sanitizers varying in chemical composition
and activity. Different production conditions directly affect what chemical sanitizer
should be used in order to maximize its efficiency. There are various properties that an
ideal chemical sanitizer should have: rapid kill of most microbes, resistant to
environment, nontoxic, safe to handle, easy to use, cheap, readily available, etc. There is
no perfect sanitizer but there is one test that every chemical sanitizer must meet. The
sanitizer efficiency test states that a sanitizer must be able to produce a 99.999% (5 log)
kill of 75 million to 125 million E. coli and S. Aureus within 30 seconds at 20°C (Berk
2013). The various varieties of chemical sanitizers are often grouped up by the active
ingredient in them.
Common Chemical Sanitizers
Chlorine-based sanitizers are some of the more popular kinds. Liquid chlorine,
hypochlorites, and chloramines have all found success as sanitizers although their

32
antimicrobial activity can vary (Berk 2013). Hypochlorous acid is the most effective
antibacterial form of chlorine based compounds. It is over 80 times more effective than
the hypochlorite ion. The method of activity for chlorine based compounds has not been
fully determined yet but there are some proposed methods that seem most likely. The
most common theory is that hypochlorous acid can kill microbial cells by inhibiting
glucose oxidation as it oxidizes the sulfhydryl groups in various enzymes that are
important to carbohydrate metabolism (Su et al. 2007). Other methods such as disruption
of protein synthesis, reactions with nucleic acids, oxygen uptake inhibition, and
chromosomal aberrations have all been suggested but researchers have not come to a
definitive conclusion. When chlorine is mixed with water, it’s hydrolyzed to from
hypochlorous acid which can readily dissociate into hydrogen ions and hypochloride
ions. Due to this, chlorine based compounds are most effective at lower pH ranges as
hypochlorous acid predominates. This is one of the reasons Neutral Electrolyzed Water
has received further attention in addition to its milder treatment of surfaces. Figure 2
shows the ranges at which each chlorine species is dominant.
Figure 2. Abundance of Hypochlorous Acid based on pH of solution (Su et al. 2007).

33
Iodine-based sanitizers are also commonly used. The most common compounds
include iodophors, alcohol-iodine solutions, and aqueous iodine solutions. Alcohol-iodine
and aqueous iodine solutions are typically used as skin disinfectants, while iodophors are
used to disinfect equipment and surfaces as well as act as a skin antiseptic (Berk 2013).
The main benefit to iodine sanitizers is their lack of effect on the skin making them rather
safe to use. Iodine compounds tend to cost more than chlorine and have been known to
produce off-flavors in certain products. Other disadvantages include their vulnerability to
high heat, iodine compounds vaporize above 50°C lowering their effectiveness, their low
efficacy against spores and phages, and their sensitivity to pH changes (Berk 2013). The
main use iodine-based sanitizers see is during hand-dipping operations and food handling
equipment in food processing facilities.
Quaternary ammonium compounds, or “quats” as they are commonly called, are
frequently used to clean various surfaces in food plants (Berk 2013). Quats are
considered natural wetting agents and have strong surfactant capabilities. They are
considered especially effective against L. monocytogenes and can inhibit mold growth
(Holah 2014). Their method of action is not entirely understood but it is postulated that
quats work through enzyme inhibition and membrane disruption. Compared to chlorine
and iodine cleaners, quats act in a different manner. They form a bacteriostatic film after
being applied to a surface and selectively destroy microorganisms in that film. They are
unable to destroy spores but they are able to hinder their growth and they are more
resistant to soils being present than either of the other two chemical sanitizers (Berk
2013). Quats are also noncorrosive, nonirritating, and leave no smell or off-flavors. Their

34
main disadvantage is their limited effectiveness. They are ineffective against most gram-
negative microbes with the exception of Salmonella and Escherichia coli (Berk 2013).
ALLERGEN CONTROL IN THE FOOD INDUSTRY
Food allergy encompasses a wide variety of disorders that results from a negative
immune response to certain dietary antigens in some foods. They can be as mild as a
small rash to as extreme as potential death depending on the severity of the allergy. It has
been estimated that up to 15 million Americans and over 200 million people worldwide
suffer from some form of a food allergy (Boye and Godefroy 2010). Most allergies are
developed during early childhood and while some of the population outgrow their
allergy, many of them suffer for their entire lives (Verhoeckx et al. 2015). Researchers
have shown that one in every 13 children is affected by a food allergy and that the
economic impact of children’s food allergies is almost $25 billion dollars (Boye and
Godefroy 2010). There are eight foods, the so called Big Eight, which account for over
90% of all food allergies: milk, eggs, peanuts, tree nuts, soy, wheat, fish, and shellfish
(Coutts et al. 2005). There is currently no cure for any food allergy and the only treatment
is for the consumer to completely abstain from eating the food that causes the allergic
reaction. In order to completely eliminate the allergen from their diet, the consumer must
be sure that there is no chance that allergens could have been introduced into their food.
Some requirements for mandatory food allergen declarations have been
established under the Food Allergen Labeling and Consumer Protection Act. These
usually require a warning on the packaging stating that the product either contains or
might have been in contact with a suspected allergen (Crevel et al. 2014). Most
manufacturers would rather avoid having such a warning on their packaging so strict

35
allergen prevention programs have been established. One of the main problems is that
allergenic reactions can vary wildly from person to person. One individual may
experience a reaction at 200 ppm of an allergen while another may experience it at only
20 ppm (Crevel et al. 2014). The FDA published a report showing the range of the lowest
observed adverse effect levels for various allergens (Table 2) (FDA 2006). These present
a wide range in which an allergen can elicit an allergic reaction.
Table 2. Summary of Published Lowest Observed Adverse Effect Levels for Food Allergens
Food Range of LOAELs (μg)
Egg 130 to 1,000
Peanut 250 to 10,000
Milk 360 to 3,600
Treet Nuts 20 to 750
Soy 8,800 to 522,000
Fish 1,000 to 100,000
Another problem is that allergen cross-contamination can occur at any point in the food
chain. From the fields to storage to deliver to receiving to processing, at any point it is
possible for allergens to come in contact with a product (Coutts et al. 2005). Under most
circumstances, good agricultural and manufacturing practices should ensure the highest
standard of sanitation and segregation eliminating any risk of cross-contact. Food
manufacturers must also make sure that their suppliers are following allergen prevention
programs and that they inform the manufacturers of any changes in formulations (Crevel
et al. 2014). The storage of allergen ingredients in the manufacturing plant can also lead
to unintended cross-contact leading to another possible way for allergens to be introduced
36
to a product (Spanjersberg et al. 2007). There are cases where cross-contact is
unavoidable and the food manufacturer must perform a thorough risk analysis and the
results clearly communicated with the public.
Considerations for Prevention of Allergen Cross Contact in a Food Plant
One of the consideration is the material that was used to make the equipment.
Although historically the materials would change depending on the nature of the food
facility (bakery equipment vs cheese making), most equipment now is made of stainless
steel (Spanjersberg et al. 2007). There are various kinds of stainless steel, some
containing extra components such as molybdenum to increase corrosion resistance, which
allows for the food plant to choose the most suited stainless steel for their product type.
Stainless steel can also hold up to varies cleaning compounds which can facilitate the
removal of the allergenic proteins from the various food processing surfaces
(Spanjersberg et al. 2007).
The design of the equipment itself is also important to consider. Every part of the
equipment should be cleanable in order to remove any dead spots where allergens or
potentially bacteria can sit and harbor. All equipment should meet this standard
especially if they are a CIP piece of equipment (Verhoeckx et al. 2015). The
arrangement of the plant for is also important especially in plants that run more than one
type of product. They should be able to segregate allergen-containing product from those
that contain no allergen or those that contain a different allergen. The layout should also
minimize any movement of materials and personnel between the different established
zones (Cochrane and Skrypec 2014).
37
The implementation of a proper allergen prevention plan is also a key
consideration. The allergen plan must be well thought and use a risk-based analysis in
order to ensure proper application. Additionally, the company must adhere to any
statutory regulations set forth by their governing body, whether it is Food and Drug
Administration (FDA), the US Department of Agriculture (USDA) or the USDA Food
Safety and Inspection Service, a company must first and foremost meet the criteria set
forth by these agencies (Cochrane and Skrypec 2014). A proper HACCP plan would
ensure that allergen risks are minimized and effectively controlled. While some
manufacturers might opt to simply label the potential allergens present in their products,
there are various others that would prefer to eliminate the risk completely.
Cleaning as an Allergen Control Measure
As previously explained, cleaning removes unwanted matter, such as dirt, food
material, microbes, solids, and grease from food surfaces. Although allergen cleaning
involves the complete removal of allergenic proteins, it is not feasible for a food
production facility to base their entire cleaner choice on removing allergen (Boye and
Godefroy 2010). The cleaning procedures they create are based on removing all food-
related debris from the processing area. There are various factors influencing the
appropriate selection of a cleaning process. The soil’s constitution, the solubility, and the
food processing conditions can all impact the decision making process.
Proteins are difficult to remove and once exposed to heat, they can denature and
become even harder to remove as they can undergo cross-linking reactions (Berk 2013).
They traditionally require a complex cleaning process in order to fully remove the

38
proteins from the surface (Holah 2014). Carbohydrates can also be difficult to remove as
they may require alkaline or acidic cleaners (Berk 2013). Although water alone can
remove some soils it is often used in conjunction with a detergent in order to facilitate the
removal of any soils.
Verification and Validation of Allergen Cleaning
While proper cleaning is the best way to remove allergens, it is important that the
cleaning is constantly verified and that the original method is validated to ensure that it
actually removes all potential allergens. Validation is the most important step as it shows
the effectiveness of the allergen cleaning process. In order to properly validate a cleaning
procedure, the ‘worst-case’ scenario should be mimicked (Hirst and Miguel 2015). This
ends up being the most complex product that requires the most difficult cleaning
processes with the highest concentration of allergen. The idea being that if the ‘worst-
case’ scenario is cleaned than all other scenarios should not pose a problem. After that
product is produced, the line and equipment undergo the cleaning method that is being
validated and a second product that does not contain the allergen is passed through (Hirst
and Miguel 2015). The product and the equipment is then checked for allergen residue, if
it is a negative result, it shows that the cleaning successfully removed the allergen below
the threshold of validation test you are using, a positive result would show that allergenic
compounds are still present (Hirst and Miguel 2015).
The most common validation test is an enzyme-linked immunosorbent assay
(ELISA) for the specific allergenic protein. This can be a complex process as the ELISA
kits can experience some variability depending on the antibodies used (Poms et al. 2004).

39
Other methods such as total protein tests, such as cupric ion reduction or Coomassie Blue
dye color changes, are based on the idea that most allergenic reactions are caused by
proteins (Rimbaud et al. 2010). Unfortunately they can take a long time to work and rely
on a proper separation of the allergenic protein from the product which can often be
problematic in complex food products. ATP Bioluminescence has also been used as a
successful surrogate for other tests although it is not specific because the test works by
reacting with all the ATP present on the surface regardless of its source. These tests,
often in the form of a swab, function on the principle that bacteria and food soils all
deposit ATP onto a surface. If the ATP level is below a specific threshold, which often
varies depending on the manufacturer of the ATP Bioluminescence kit, then the surface
can be declared clean and free of allergens (Powell and Attwell 1997). The main benefit
of this test, aside from its relatively low cost, is the time it takes to process a sample. It
only takes about 30 seconds for an ATP swab to be processes and a result to be delivered.
The main drawback is that is has no specificity for allergens (Hawronskyj and Holah
1997). Additionally there is no direct correlation between ATP level and protein content,
so while a test may read high it is entirely possible that there is no allergenic protein
present (Attwell 1997).
A more common validation method is the use of Allergenic Protein Swabs. These
have a higher threshold for allergenic protein (meaning they are less sensitive) but they
can detect any type of allergenic protein. They can be as sensitive as 3ug of protein which
is comparable to ELISA tests although they are not able to discern between different
protein types (Hattersley et al. 2014). The threshold of 3ug is below most of the LOAELs
for allergens so the assumption is that if there is no protein present, there must be no

40
allergen present. They are also considerably cheaper and easier to use than ELISA kits.
These swabs work on a principle that is similar to total protein tests. Once the suspected
area is swabbed, the swab is combined with a reagent that comes in the self-contained
swab kit. Heat is applied through a heating block or a water bath and the solution changes
color from clear to a darker color, the color intensity is correlated to the amount of
protein present, although any color is indicative of a failed test. Similarly to other tests,
protein swabs cannot quantify the amount of protein present, however due to their low
threshold if the test is positive for protein presence this test has become widely used in
the industry.
One of the main aspects of any validation should be a physical check of all
possible direct and indirect food contact surfaces present in the product line. This tends to
be the longest and most time-consuming step as it consists of a thorough check of the
production line. It is impossible to check whether the allergen removal was successful
after every single cleaning procedure. In order to mediate this, most food processing
facilities use a “visually clean” procedure (Berk 2013). As the name suggests, the idea is
that if it looks clean then we can assume that it is clean. This choice makes it easier on
the cleaning and sanitation personnel and makes transitioning much easier. Hot spots can
be identified during these processes. Hot spots, like pumps, dead ends, valves, and
sensors, are areas of the production line where allergens could easily be stashed and be
unreachable by conventional means (Berk 2013).
41
CHAPTER 2:
The Use of Different Salts on the Efficacy of Electrochemically Activated
Water as a Cleaner and Sanitizer

42
INTRODUCTION
Electrochemically activated (ECA) water has seen a large amount of
success as both a cleaner and sanitizer for the food industry. The ease of
implementation, on-site production, low cost, higher efficacy against most
pathogens and food soils has also aided in increasing its use throughout the food
industry (Huang et al. 2008; Issa-Zacharia et al. 2011; Rahman et al. 2016). It is
also seen as more environmentally friendly due to the lower amount of chlorine
that is used in comparison to other chemicals (Park et al. 2004; Meireles et al.
2016). ECA water uses a maximum of 200 parts per million of chlorine, most of it
in the form of hypochlorous acid which is readily broken down, while other
cleaners can use up to 10 times that concentration (Huang et al. 2008).
While lowering the use of chlorine would be important in improving the
environmental impact of cleaning and sanitizing chemicals, a complete
elimination would be the ideal end goal. Additionally, while the sodium
hydroxide in Alkaline Electrolyzed Water (AlEW) poses no real danger due to its
low concentrations, there are other compounds that could potentially work better
depending on what type of soil must be cleaned (Su et al. 2007).
The purpose of this study was to test other salts in place of sodium
chloride (NaCl) to produce ECA water and test the efficacy of both cleaning and
sanitizing using the two solutions from the NaCl ECA water, as well as bleach as
the controls. This will allow us to determine the efficacy differences between the
use of the different electrolytes (salts) to understand potentially the differences
due to the chemical changes in the cleaning and sanitizing solutions produces.

43
While other researchers have looked at other chemicals to create different
types of ECA water, they didn’t look at the efficacy across various food products
(Fukuzaki et al. 2004). This study will look at three specific aspects of cleaning
and sanitizing in the food industry: 1) examine the AlEW solutions cleaning
power by using the Standard Test Method for Evaluating the Effectiveness of
Cleaning Agents (ASTM Test G122 - 96(2015) e1). The test gives a numerical
value on a cleaning solutions ability to remove soil. This value allows for direct
comparison of the cleaning ability between various cleaning solutions. 2) A “field
test” using common food soils on stainless steel, a common food contact surface.
The cleaning capability of each of the AlEW solutions will be tested and verified
using an ATP Cleaning Verification System from 3M; 3) We will compare the
antimicrobial efficacies of the Neutral Electrolyzed Water (NEW) solutions as a
“quick” sanitizer (a sanitizer that can achieve a five log10 reduction under 60
seconds) in a static system against three common foodborne pathogens:
Salmonella enterica, Escherichia coli O157:H7, and Listeria monocytogenes.
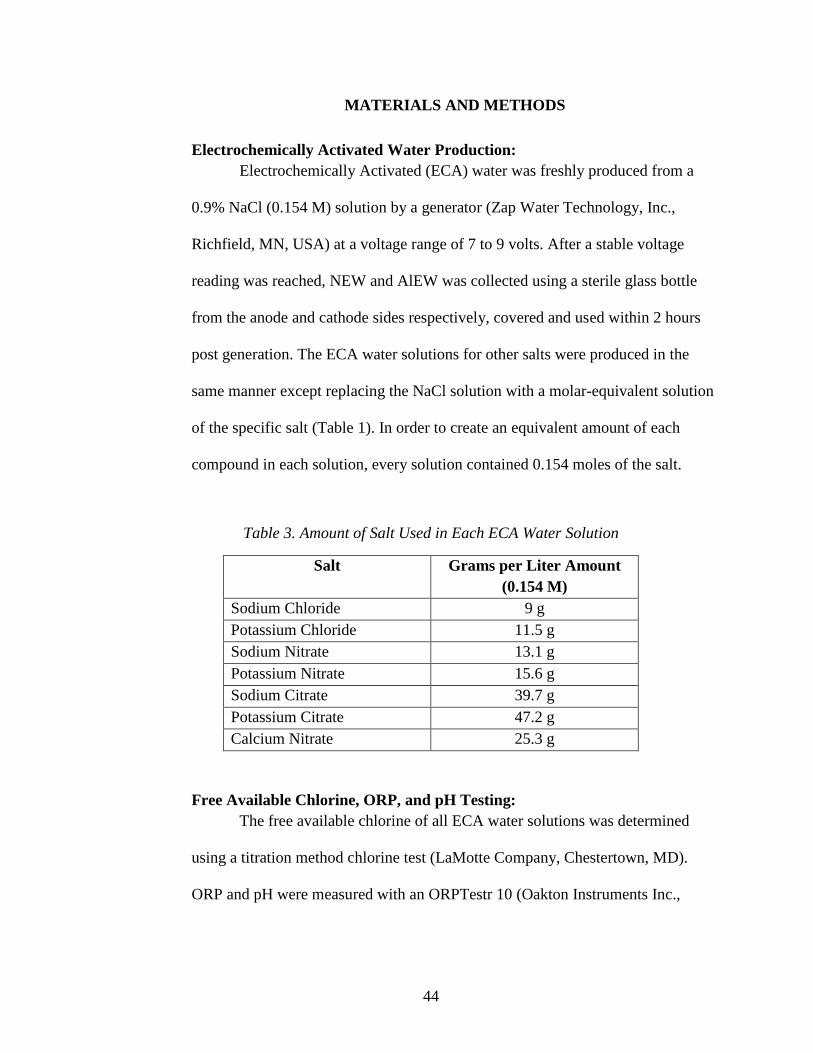
44
MATERIALS AND METHODS
Electrochemically Activated Water Production:
Electrochemically Activated (ECA) water was freshly produced from a
0.9% NaCl (0.154 M) solution by a generator (Zap Water Technology, Inc.,
Richfield, MN, USA) at a voltage range of 7 to 9 volts. After a stable voltage
reading was reached, NEW and AlEW was collected using a sterile glass bottle
from the anode and cathode sides respectively, covered and used within 2 hours
post generation. The ECA water solutions for other salts were produced in the
same manner except replacing the NaCl solution with a molar-equivalent solution
of the specific salt (Table 1). In order to create an equivalent amount of each
compound in each solution, every solution contained 0.154 moles of the salt.
Table 3. Amount of Salt Used in Each ECA Water Solution
Salt Grams per Liter Amount
(0.154 M)
Sodium Chloride 9 g
Potassium Chloride 11.5 g
Sodium Nitrate 13.1 g
Potassium Nitrate 15.6 g
Sodium Citrate 39.7 g
Potassium Citrate 47.2 g
Calcium Nitrate 25.3 g
Free Available Chlorine, ORP, and pH Testing:
The free available chlorine of all ECA water solutions was determined
using a titration method chlorine test (LaMotte Company, Chestertown, MD).
ORP and pH were measured with an ORPTestr 10 (Oakton Instruments Inc.,

45
Vernon Hills, IL) and a pHTestr 10 (Oakton Instruments Inc.), respectively. All
tests were done immediately after ECA water solution production.
Cleaning Effectiveness Factor
The Standard Test Method for Evaluating the Effectiveness of Cleaning
Agents (ASTM G122 - 96(2015) e1) was followed. A solution of 10g of 80/20
ground beef in 250mL of distilled water was blended together to produce a slurry.
Stainless steel coupons (1 cm in diameter and approximately 0.7 mm in thickness)
were weighed and dipped in the beef slurry. The coupons were removed and
allowed to dry for 1 hour at room temperature. The coupons were placed into a
beaker containing 200mL of each of the ECA water cleaning solutions and
agitated using a stir bar set to low (60 RPM) for 5 minutes. The coupons were
removed and allowed to dry overnight at room temperature. The final weight was
measured. Eleven replications were conducted for each salt solution. The
Cleaning Effectiveness Factor (CEF) was then calculated using the equation for
Cleaning Effectiveness Factor (Cleaning Power) shown below.
𝐶𝐸𝐹 =𝑀𝑎𝑠𝑠 𝑜𝑓 𝐶𝑜𝑛𝑡𝑎𝑚𝑖𝑛𝑎𝑛𝑡 𝑅𝑒𝑚𝑜𝑣𝑒𝑑
𝑀𝑎𝑠𝑠 𝑜𝑓 𝐶𝑜𝑛𝑡𝑎𝑚𝑖𝑛𝑎𝑛𝑡 𝐴𝑝𝑝𝑙𝑖𝑒𝑑
Equation 1. Cleaning Effectiveness Factor equation
ATP Cleaning Verification
Two ml of the beef slurry, as described above, was evenly spread over a 3
X 3 inch 304 stainless steel surface. The surface was allowed to dry and an initial
ATP test was done on various spots on the surface using 3M ATP CleanTrace
Swabs (3M, Minneapolis, MN). The surface was then cleaned until visibly

46
cleaned using a rag and the AlEW solution (Table 3). A final ATP test was done
on various spots to quantify the amount of soil removed. This was repeated with
every AlEW solution. The test was also repeated fifteen times and on three other
surfaces: tile, high-density polyethylene (HDPE) plastic and synthetic nylon-
reinforced rubber.
Antimicrobial Capabilities
Bacteria Culture Preparation:
Bacterial strains of Salmonella enterica (ATCC 14028), Escherichia coli
O157:H7 (ATCC 43890), and Listeria monocytogenes (ATCC 19115) were
obtained from the University of Minnesota culture collection of environmental
isolates. For each strain, a loop of glycerol-culture from -60°C storage was
inoculated and transferred three consecutive times in tryptic soy broth (BD,
Franklin Lakes, NJ) and inoculated at 37°C at 24h intervals.
Experimental Conditions (Adapted from AOAC MB-05-13: Dilution Method for
Testing Disinfectants)
One mL of the bacterial culture was placed into 9mL of saline solution
(0.9% NaCl) in a 10mL test tube. One mL of NEW solution was added to the test
tube, vortexed for five seconds, and using a micropipette 1 mL was plated onto
3M Aerobic Plate Count (APC) plates. This was repeated for each bacterium with
each NEW solution and with deionized water as a control. The plates were
incubated at 37°C for two days and enumerated. Bacterial counts as CFU were
calculated per ml and the data were transformed to logarithm base 10. Fifteen
replicates were conducted for each bacterium.

47
Statistical Analysis
All data was analyzed for significance using a one-way ANOVA on Microsoft
Excel (Microsoft, Seattle, WA) using XLStats Analytical Software Package
(Addinsoft, Coppel, TX).

48
RESULTS
Table 4. pH, ORP, and FAC content of NEW and AlEW solutions
Neutral Electrolyzed Water* Alkaline Electrolyzed
Water*
Salt pH ORP1
(mV)
FAC2
(ppm)
pH ORP
(mV)
Sodium Chloride 6.52 ±
0.14
643 +
11
213 ±
24
11.03 ± 0.12 -622 ± 15
Potassium
Chloride
6.64 ±
0.21
635 ±
21
222 ±
17
11.12 ± 0.13 -670 ± 22
Sodium Nitrate 7.02 ±
0.11
151 ± 6 0 11.09 ± 0.09 -638 ± 17
Potassium Nitrate 6.99 ±
0.24
173 ± 4 0 10.97 ± 0.10 -624 ± 11
Sodium Citrate 7.10 ±
0.19
166 ± 8 0 11.04 ± 0.07 -633 ± 13
Potassium Citrate 6.94 ±
0.14
174 ± 4 0 11.01 ± 0.11 -664 ± 9
Calcium Nitrate 7.11 ±
0.15
168 ± 6 0 11.09 ± 0.09 -638 ± 17
*Values are mean ± s.d. of four repeated measurements.
1ORP: oxidation–reduction potential. 2FAC: free available
chlorine.

49
Table 5. Calculated Cleaning Effectiveness Factor (CEF) for AlEW Solutions
Salt Used Cleaning Effectiveness Factor
Sodium
Chloride
0.965A ± 0.01
Potassium
Chloride
0.956 A ± 0.008
Sodium
Nitrate
0.951 A ± 0.16
Potassium
Nitrate
0.949 A ± 0.019
Sodium
Citrate
0.948 A ± 0.018
Potassium
Citrate
0.942 A ± 0.013
Calcium
Nitrate
0.767 B ± 0.052
*Values are mean ± s.d. of fifteen repeated measurements. Entries in a given
column with the same letter are not significantly different (ANOVA, P ≥ 0.05).
Table 6. Average and Percent ATP RLU Reductions after Treatment with AlEW solutions
Salt Used ATP RLU Count Reduction ATP Percent Reduction
Sodium
Chloride
2718A ± 30 93%
Potassium
Chloride
2708A ± 38 92%
Sodium
Nitrate
2634B ± 69 90%
Potassium
Nitrate
2621B ± 59 89%
Sodium
Citrate
2654B ± 68 91%
Potassium
Citrate
2646B ± 64 90%
Calcium
Nitrate
2564C± 121 87%
*Values are mean ± s.d. of fifteen repeated measurements. Entries in a given column
with the same letter are not significantly different (ANOVA, P ≥ 0.05).

50
Table 7. Average log10 reductions after treatment with NEW solutions
Pathogen Used Sodium
Chloride
Potassium
Chloride
Sodium
Nitrate
Potassium
Nitrate
Sodium
Citrate
Potassium
Citrate
Calcium
Nitrate
E. coli
O157:H7
6.8 A ±
0.21
6.8 A ±
0.21
0.94 B ±
0.13
1.0 B ±
0.20
0.90 B ±
0.18
1.1 B ±
0.19
1.0 B ±
0.19
Salmonella
enterica
6.5 A ±
0.12
6.5 A ±
0.09
0.56 B ±
0.10
0.50 B ±
0.11
0.60 B ±
0.11
0.53 C ±
0.09
0.55 B ±
0.12
Listeria
monocytogenes
6.9 A ±
0.16
7.0 A ±
0.19
0.59 C ±
0.17
0.53 C ±
0.18
0.87 B ±
0.11
0.95 B ±
0.09
0.58 C ±
0.11
*Values are mean ± s.d. of fifteen repeated measurements. Entries in a
given column with the same letter are not significantly different
(ANOVA, P ≥ 0.05).

51
RESULTS AND DISCUSSION
In this study, six different salts were used to determine the differences
between ECA water solutions when NaCl is not used. To test the differences, the
new ECA water solutions were tested for the antimicrobial and cleaning
properties and compared to traditional ECA water made using NaCl. These six
salts were selected for two main reasons. The primary reason is their availability
in the food industry (Albarracín et al. 2011). One of the goals of this study was to
find an alternative to NaCl that would be easily implemented and thus the
availability of all these salts as well as their safety were one of the main reasons
they were chosen. The second reason was their similarity to chemical similarity to
NaCl and the potential compounds they would form in the electrolysis process.
Sodium chloride forms sodium hydroxide in alkaline electrolyzed water and
hypochlorous ions in the neutral electrolyzed water (Su et al. 2007). We assumed
that the compounds containing potassium would form potassium hydroxide and
the compound containing calcium would form calcium hydroxide in the alkaline
electrolyzed water. Additionally, we assumed that the presence of nitrate would
lead to the formation of nitric acid and the presence of citrate would form citric
acid.
The first step was to determine all the physicochemical properties of the
new solutions. Each salt was used to make two different solutions, the neutral
electrolyzed water (NEW) which is the antimicrobial solution and the alkaline
electrolyzed water (AlEW) which is the cleaning solution. Table 3 shows the pH,
oxidation reduction potential (ORP), and chlorine content of each solution. The

52
first notable observation is that only potassium chloride made a NEW solution
that had similar properties to one made from sodium chloride. The other five salts
did not have a high ORP value, which is one of the key components of the
antimicrobial ability of the solution (Su et al. 2007), and did not contain any
chlorine (as to be expected). Although not a definitive test, this definitely points
to the possibility of viable antimicrobial solutions only being able to form in the
presence of chlorine ions. Additionally, the pH of the chloride salt solutions was
slightly lower but not significantly so. With regards to the AlEW, all of the salts
formed similar solutions. They all showed a high pH around 11 and an ORP level
around -600 which are the two factors that heavily contribute to AlEW's cleaning
capabilities (Su et al. 2007). This can be explained due to the fact that all of the
salts used contained either sodium or potassium (with the exception of calcium
citrate). It can be assumed that the electrolysis processes formed NaOH or KOH
in all of the trials creating very similar solutions.
The newly formed solutions were also tested for their antimicrobial
properties in vitro. The NEW solutions were added to bacterial cultures to
determine the overall reduction on three different pathogens. This data is shown
in Table 6. This experiment showed that the presence of chlorine is necessary in
order to form a functional antimicrobial through the electrolysis processes.
Sodium Chloride and Potassium Chloride both created a statistically similar
antimicrobial solution which showed greater than 5 log reductions across the three
pathogens tested. The other six salts behaved no different than water when it came
to antimicrobial capabilities. The success of potassium chloride can be explained

53
due to its similarity to sodium chloride. The presence of the chloride ions lead to
the formation of hypochlorous ions (similar to when NaCl is used) which is one of
the main components in traditional NEWs antimicrobial capabilities.
Our original reasoning for choosing the other salts was that the formation
of nitric and citric acid could potentially create antimicrobial properties similar to
traditional NEW as those two acids are known to have antimicrobial properties (In
et al. 2013; Reighard and Schoenfisch 2015). The results from the ECA solutions
produced with the other salts did not show antimicrobial activity. This could
potentially be explained by the following: 1) the nitric acid formed during the
electrolysis process is only produced in a small amount. A small amount of nitric
acid in water will readily convert to nitric oxide which bubbles out of solution
rather quickly effectively leaving the solution to be water (Zacharia and Deen
2005). In the case of the ECA water produced using the citrate salt, the
electrolysis reaction does not occur. Citrate is a very strong chelating agent so it
will readily combine with anything present in the water before it will combine
with the free hydrogen to form citric acid (Lin et al. 2004). Citrate also poses an
issue if it was used with water with large concentration of metal ions and it will
almost instantaneously form complexes with them (Kazimierczak et al. 2014).
The next two experiments revolved around understanding the cleaning
capabilities of the alkaline electrolyzed water solutions formed through the
electrolysis process. The cleaning power experiment was used to determine a
baseline number that could be used to compare across the cleaners. Cleaning
power gives a measure of the intrinsic cleaning ability that a cleaner has (ASTM
54
2016). This is done by testing how much soil the cleaner can remove when
applying minimal external force. As seen in Table 4, the majority of the AlEW
solutions had similar cleaning power with the exception of calcium nitrate, this is
due to calcium hydroxide not being a strong cleaner when compared to sodium
hydroxide or potassium hydroxide (Türkün and Cengiz 1997). It should be noted
that the cleaning power of AlEW made with sodium chloride was statistically
higher than all of the other AlEW solutions. Further experiments are needed to
determine why AlEW has a higher cleaning power than the solution made from
the other salts used. One explanation could be that potassium ions are more
reactive, and therefore, the potassium hydroxide that is formed is not as stable as
the sodium hydroxide. It is also possible that potassium hydroxide is not able to
interact with soils as well as sodium hydroxide. The cleaning power of most of
the solutions are quite strong as common industrial cleaners have cleaning powers
of 0.97-0.98 which is slightly higher than the electrolyzed water solutions but
with a much higher safety risk (Smith 1970).
The second cleaning ability experiment tried to quantify each solution’s
ability to clean. In order to determine this, ATP Cleaning Verification was used as
this method is commonly employed to verify cleaning in the food processing
industry (Powell and Attwell 1997; Hawronskyj and Holah 1997). The data
shown in Table 5 shows the ATP count reduction as well as the percent ATP
reduction after treatment with the alkaline electrolyzed water solutions. The
sodium chloride solution had the highest reduction but all other salt solutions
performed rather similarly (with the exception of the calcium nitrate solution).

55
Similar to the cleaning power experiment, the sodium chloride solution was better
at removing soil but the reason is not obvious. Further experiments would have to
be conducted in order to elucidate the reason as to why. The sodium and
potassium hydroxide content of each solution may differ depending on the salt
that was used. If there are significant differences in the NaOH and KOH content
that would explain the differences in cleaning ability. There may also be intrinsic
cleaning capability differences between sodium hydroxide and potassium
hydroxide. Additionally, potassium hydroxide has been shown to require higher
temperatures in order to be an efficient cleaner and the experiment was performed
at room temperature (Smith 1970).
Our study have shown that potassium chloride forms neutral electrolyzed
water and alkaline electrolyzed water that is extremely similar in antimicrobial
and cleaning ability to the one produced with sodium chloride. The price of
potassium chloride makes using it more prohibitive as it can cost almost 50%
more than sodium chloride (Huang et al. 2008; Rahman et al. 2016). Additionally,
the hydroxides formed also perform differently when subjected to heat. Adding
heat to potassium hydroxide has been shown to improve its ability to remove fat
and grease while sodium hydroxide does not show the same increase (Smith
1970). The other salts did not have any antimicrobial capabilities but created
usable cleaners as they were unable to form any antimicrobial compounds through
the electrolysis. At this time, there is no benefit over using any other salt besides
sodium chloride as it outperformed all of the other salts. Further experiments
would look into the antimicrobial capabilities of the sodium chloride and
56
potassium chloride solutions on more complex situations. Although they should
not perform any different as the active ingredient in both would be hypochlorous
acid, it should be tested as the experiments have shown that there are some minute
differences between the two solutions.

57
CHAPTER 3:
Investigating the Effect of Combining Alkaline and Neutral Electrolyzed on
Antimicrobial and Cleaning Properties

58
INTRODUCTION
Electrochemically activated water has seen implementation in a small
number of food production facilities throughout the United States (Huang et al.
2008; Rahman et al. 2016). The main hurdle when it comes to implementing an
ECA water system into a facility is educating the workers and the management on
the benefits and proper usage of ECA water. When properly implemented ECA
water provides a very cheap (1.5 cents per gallon), safe (can be used with minimal
personal protective equipment), and efficient cleaner (Rahman et al. 2016).
One of the main issues that production facilities with ECA water systems
run into is focusing solely on one of the two solutions produced by the system.
Most facilities will focus on the Acidic Electrolyzed Water (AEW) (or Neutral
Electrolyzed Water (NEW) depending on their set up) and end up ignoring the
various capabilities that Alkaline Electrolyzed Water (AlEW) possesses (Huang et
al. 2008; Hricova et al. 2008). There are various reasons for this ranging from not
understanding the capabilities of AlEW as well as being satisfied with their
current cleaning methods even if changing to ECA water can provide lower costs
and better employee safety. Regardless of the reason, this essentially turns AlEW
into a waste stream.
This study attempts to minimize the waste stream that AlEW could
potentially become by combining AlEW with AEW (or NEW) and investigating
the change in efficacy. The antimicrobial capability of the solutions was tested as
well as the cleaning efficacy. Various combinations of AlEW and AEW were
made to determine at what point the efficacy is completely lost.

59
METHODS AND MATERIALS
Electrochemically Activated Water Production
Electrochemically activated water was freshly produced from a 0.9% NaCl (0.154
mol) solution by a generator (Zap Water Technology, Inc., Richfield, MN, USA)
at a voltage range of 7 to 9 volts. After a stable voltage reading was reached,
NEW solution and AlEW solution was collected using a sterile glass bottle from
the anode and cathode sides respectively, covered and used within 2 hours post
generation. To create the various mixtures, the NEW and AlEW were mixed in
various ratios shown in Table 8.
Table 8. ECA Water Mixture Composition
Solution
Name
Percent NEW Percent AlEW
NEW 100% 0%
80/20 80% 20%
60/40 60% 40%
50/50 50% 50%
40/60 40% 60%
20/80 20% 80%
AlEW 0% 100%
Free Available Chlorine, ORP, and pH Testing
The free available chlorine of all ECA water solutions was determined
using a titration method chlorine test (LaMotte Company, Chestertown, MD).
ORP and pH were measured with an ORPTestr 10 (Oakton Instruments Inc.,
Vernon Hills, IL) and a pHTestr 10 (Oakton Instruments Inc.), respectively. All
tests were done immediately after ECA water solution production.

60
Antimicrobial Capabilities
Bacteria Culture Preparation:
Bacterial strains of Salmonella enterica (ATCC 14028), Escherichia coli
O157:H7 (ATCC 43890), and Listeria monocytogenes (ATCC 19115) were
obtained from the University of Minnesota culture collection of environmental
isolates. For each strain, a loop of glycerol-culture from -60°C storage was
inoculated and transferred three consecutive times in tryptic soy broth (BD,
Franklin Lakes, NJ) and inoculated at 37°C at 24h intervals.
Experimental Conditions (Adapted from AOAC MB-05-13: Dilution Method for
Testing Disinfectants)
One mL of the bacterial culture was placed into 9mL of saline solution
(0.9% NaCl) in a 10mL test tube. One mL of NEW solution was added to the test
tube, vortexed for five seconds, and using a micropipette 1 mL was plated onto
3M Aerobic Plate Count (APC) plates. This was repeated for each NEW/AlEW
mixture and with deionized water as a control. The plates were incubated at 37°C
for two days and enumerated. Bacterial counts as CFU were calculated per ml and
the data were transformed to logarithm base 10. Fifteen replicates were
conducted for each bacterium.
ATP Cleaning Verification
Two ml of the beef slurry, as described in the previous experiment, was evenly
spread over a 3 X 3 inch 304 stainless steel surface. The surface was allowed to
dry and an initial ATP test was done on various spots on the surface using 3M

61
ATP CleanTrace Swabs (3M, Minneapolis, MN). The surface was then cleaned
until visibly cleaned using a rag and the NEW/AlEW solution (Table 8). A final
ATP test was done on various spots to quantify the amount of soil removed. This
was repeated with every NEW/AlEW solution. The test was repeated on ceramic
tile, HDPE plastic, and synthetic nylon-reinforced rubber fifteen times per
solution.
Statistical Analysis
All data was analyzed for significance using a one-way ANOVA on Microsoft
Excel (Microsoft, Seattle, WA) using XLStats Analytical Software Package
(Addinsoft, Coppel, TX).

62
RESULTS
Table 9. Average Log10 Reduction after Treatment with ECA Water Mixtures
Pathogen NEW 80/20 60/40 50/50 40/60 20/80 AlEW
E. coli O157:H7 6.90A ±
0.29
6.88A ±
0.17
6.45B ±
0.16
6.03C ±
0.18
5.52C ±
0.18
2.95D ±
0.17
1.95D ±
0.19
Salmonella
enterica
6.99 A ±
0.22
6.92 A ±
0.14
6.47 B ±
0.13
5.99 C ±
0.12
5.24C ±
0.17
2.88 D ±
0.18
1.97 D ±
0.17
Listeria
monocytogenes
6.79 A ±
0.22
6.81 A ±
0.14
6.33 B ±
0.18
5.98 C ±
0.22
5.16 C ±
0.18
2.87 D ±
0.17
1.84 D ±
0.15
*Values are mean ± s.d. of fifteen repeated measurements. Entries in a given row with the same letter are
not significantly different (ANOVA, P ≥ 0.05).
Table 10. Average ATP Reduction after Treatment with ECA Water Mixtures on Four
Surfaces.
Mixture
Used
Stainless Steel Ceramic Tile HDPE Plastic RMV Rubber
RLU
Reduction
Avg. %
Reduction
RLU
Reduction
Avg. %
Reduction
RLU
Reduction
Avg. %
Reduction
RLU
Reduction
Avg. %
Reduction
NEW
2564 A ±
108
85.1% 2573 A ±
121
85.7% 2591 A ±
104
83.7% 2541 A ±
104
83.2%
80/20
2558 A ± 77
85.4% 2560 A ± 67
86.1% 2596 A ± 88
84.1% 2577 A ± 95 82.9%
60/40
2635 B ±
63
87.5% 2651 B ±
56
88.4% 2615 B ±
50
86.2% 2622 B ± 54 87.9%
50/50
2619B ± 71 87.1% 2637 B ± 56
89.5% 2632 B ± 64
86.1% 2596 B ± 44 88.3%
40/60
2674 B ±
31
87.9% 2683 B ±
32
89.9% 2678 B ±
27
90.2% 2674 C ± 29 90.1%
20/80
2704D ± 47 92.1% 2693 C ± 22
93.5% 2710 C ± 43
91.2% 2705 C ± 42 89.7%
AlEW 2734 D± 34 91.5% 2722 C ±
35
93.1% 2716 C ±
38
91.7% 2730 D ± 44 90.3%
*Values are mean ± s.d. of fifteen repeated measurements. Entries in a given column with the same letter are not significantly
different (ANOVA, P ≥ 0.05).

63
DISCUSSION
The purpose of this study was to determine the effect of combining the
ECA solutions (NEW and AlEW) on their antimicrobial and cleaning capabilities.
In most food industry applications, only the NEW solution has been used for
sanitation as it has been well researched. The AlEW solution, which is the
cleaning solution, is often treated as a waste stream and discarded. Therefore, if
combining the NEW and AlEW solutions demonstrates similar antimicrobial and
cleaning effects, it would allow the combined solutions to be used in a one-step
cleaning and sanitation as well as reduce waste.
The antimicrobial testing confirmed that when there was a greater amount
of the NEW solution the mixture demonstrates a higher kill on the three
pathogens tested. It is important to note that even a small addition of NEW
created a huge jump in antimicrobial capabilities. Using only AlEW solution there
was a 1.95 log kill, whereas when the solutions were combined at 20/80 percent
demonstrated a 1 log increase (Table 9). In addition, an increase from 20/80 to
40/60 demonstrated an increase of greater than 2.5 logs. Further dilution of
AlEW to the NEW only marginally added to the antimicrobial capabilities. The
40/60 mixture had greater than a 5 log kill which tends to be the standard in
microbial reduction of pathogens required in the food industry. These results point
to possible success if using the mixtures demonstrate antimicrobial activity.
One of the major issues in using the NEW solution as a sanitizer is that it
can be less effective when there is a high concentration of protein or fat present as
these can inactivate the hypochlorous acid, which is the active agent for

64
antimicrobial ability (Su et al. 2007). It is possible that by introducing a cleaner in
the form of electrolyzed solution containing sodium hydroxide, through AlEW,
the inhibition of antimicrobial activity by the presence of organic material would
be reduced and the combined solution would clean and sanitize.
The testing for cleaning ability demonstrated when there was a greater
amount of AlEW in the mixture the better a cleaner the solution was. This can be
attributed to a higher concentration of sodium hydroxide being present as well as
the lower ORP value which helps with removing soils from surfaces (Su et al.
2007). The differences between seemed to follow a pattern (Table 9). As
expected, the higher the concentration of AEW present in the mixture the higher
its ability to act as an antimicrobial. The data did demonstrate a reduction in
antimicrobial activity when going from 40% AEW to 20% AEW. It is possible
that in-between those percentages there is a gradual drop but no other mixtures
see that same kind of difference. The pH of the solution may affect the formation
of hypochlorous acid at that concentration thus lowering its ability to act as an
effective antimicrobial. There did not appear to be a statistical difference with
regards to the cleaning surface as compared to the literature (Holah 2014). It
would expected that the tile and stainless steel surfaces should have the greatest
reduction in microbial population, with plastic and rubber surfaces with less due
to the porosity of the surfaces. Future experiments should look at various types of
soil as that can also impact the ability for a cleaner to efficiently remove soils.
Temperature could also play a role in soil removal. In the present study, we
maintained the mixtures at room temperature to eliminate any extra variables but

65
temperature has shown to affect cleaning compounds (Smith 1970). It should be
noted that the soil removal using NEW, which was demonstrate to show the least
removal, are still considered to be a good cleaner (Berk 2013). This makes all the
mixtures viable as cleaners in a food industry setting with higher ATP reduction
showing a better cleaner.
This study has demonstrated that mixing the NEW and AlEW solutions
can create a functional cleaner and sanitizer that retains both of their individual
properties, albeit to a lesser extent. By using the 40/60 mixture, which showed a
greater than 5 log kill as well as removing soil, companies could potentially use a
large majority of their AlEW waste stream and extend their supply of cleaner and
sanitizer saving both money as well as providing less chemicals deposited in the
waste water.
66
CHAPTER 4
Use of Alkaline Electrolyzed Water (AlEW) to Remove Allergens from
Common Food Contact Surfaces

67
INTRODUCTION
Over 15 million Americans have some type of a food allergy and
estimated that 1 in every 13 children under the age of 18 suffers from food
allergies (Coutts et al. 2005; Boye and Godefroy 2010; Cochrane and Skrypec
2014; Verhoeckx et al. 2015). While food allergies can vary in severity, but they
can prove to be fatal to certain individuals. Food products contaminated with
allergens from unclean surfaces has become a major concern and is now required
to be addressed in the facilities HACCP and allergen prevention plans as a hazard
that needs to be controlled in the food processing facility (Boye and Godefroy
2010; Crevel et al. 2014). While allergen warnings on packages can help the
consumer avoid any potential exposure, in 2015 there were 58 product recalls due
to undeclared allergens present in the product, either through allergen containing
ingredients that weren’t put on the label or from unclean surfaces that
contaminated the food (Maberry 2016). This affected over 10 million pounds of
food, and was the number one reason for food product recalls in 2015 (Maberry
2016). As of July 1st 2016, there have already been over 100 recalls due to
undeclared allergens (USDA 2016, FDA 2016) (USDA 2016).
While most people think that recalls are due to bacteria or extraneous
material, the data has shown an increasing trend that allergens have become the
number one reason for recalls (Food Safety News2013). Control plans in which
the potential allergens have been identified as a hazard most likely to occur need
to be put in place such that the manufacturing lines are effectively cleaned to
remove any allergen contamination that may be present (Crevel et al. 2014).
68
Studies have shown that shared production equipment can be a serious problem
(Röder et al. 2008). With proper cleaning between product changes and analytical
testing to verify cleaning efficiency, allergen sanitation procedures can be
established and precautionary labeling can be avoided. Other studies have shown
that airborne dust and particles can be one source of allergen cross-contamination,
however, studies have shown that it is dependent on the allergen type and high fat
allergen-containing products will adhere to surfaces rather than be aerosolized
(Röder et al. 2010).
The aim of this research was to demonstrate that Alkaline Electrolyzed
Water (AlEW) would be an effective solution in removing all allergenic residues
of any of the "Big 8" allergens from four common food contact surfaces: 316
stainless steel, high density polyethylene plastic, ceramic tile, and food grade
RMV (rubber modified vinyl) rubber. Although AlEW has been shown to remove
some allergenic residues previously, an in-depth look at the big 8 allergens has
not been done (Coutts et al. 2005). Additionally, previous research has only
looked at stainless steel as a surface. AlEW has begun to see adoption due to its
low cost, safety, and ease of use. Demonstrating that it can remove a large variety
of allergens from various food contact surfaces would make AlEW one of the
most versatile cleaners currently in use.

69
MATERIALS AND METHODS
Electrochemically Activated Water Production
Electrochemically activated water was freshly produced from a 0.9% NaCl
(0.154 mol) solution by a generator (Zap Water Technology, Inc., Richfield, MN,
USA) at a voltage range of 7 to 9 volts. After a stable voltage reading was
reached, Neutral Electrolyzed Water (NEW) and Alkaline Electrolyzed Water
(AlEW) was collected using a sterile glass bottle from the anode and cathode
sides respectively, covered and used within 2 hours post generation.
ORP, and pH Testing
ORP and pH were measured with an ORP meter (ORPTestr 10, Oakton
Instruments Inc., Vernon Hills, IL) and a pH meter (pHTestr 10, Oakton
Instruments Inc.), respectively. All tests were done immediately after ECA water
solution production.
Big 8 Allergen Preparation
Peanut butter, almond butter, soy flour, wheat flour, fish sauce, dried milk
powder, eggs, and shrimp were all purchased from a local grocery store. Peanut
butter, almond butter, eggs, and fish sauce were used as is to inoculate the food
contact surface. The soy flour, wheat flour, and dried milk powder were combined
with water (5 grams to 100mL of water and stirred using a stir rod for 30 seconds)
to form a slurry to be used to inoculate the food contact surfaces. The shrimp was
mixed with water (5 grams to 100mL of water) and blended for one minute in a
blender to form a paste to be used to inoculate the food contact surfaces.

70
Inoculation of Food Contact Surfaces
The allergen to be tested was spread over a 3x3in square of the food
contact surface (stainless steel; rubber; plastic; tile). Two grams of the individual
allergens were spread into a thin layer onto the surface and allowed to dry for 1
hour. An initial test using 3M Allergen swabs was done to ensure that enough
allergen was deposited onto the food contact surface. The surface was then
cleaned using a clean cloth rag and 500mL of AlEW until visibly clean, allowed
to dry for 1 hour, and tested again with 3M Allergen swabs.
Statistical Analysis
All data was analyzed for significance using a Cochran’s Q Test on Microsoft
Excel (Microsoft, Seattle, WA) using XLStats Analytical Software Package
(Addinsoft, Coppel, TX).

71
RESULTS
Table 11. pH and ORP of AlEW Used in Allergen Removal Experiment
pH ORP1 (mV)
11.03 ± 0.12 -622 ± 15
*Values are mean ± s.d.. of four repeated measurements. 1ORP: oxidation–reduction potential.
Figure 3. Comparison of Fifteen Allergen Removal Trials on 316 Stainless Steel
Using Water and AlEW
0
10
20
30
40
50
60
70
80
90
100
Peanut Soy Fish Wheat TreeNut
Dairy Eggs Shrimp
Per
cen
tage
of
Succ
efu
l Alle
rgen
R
emo
val T
rial
s
Allergen
AlEW
Water

72
Figure 4. Comparison of Fifteen Allergen Removal Trials on Ceramic Tile Using
Water and AlEW
Figure 5. Comparison of Fifteen Allergen Removal Trials on HDPE Plastic Using
Water and AlEW
0
10
20
30
40
50
60
70
80
90
100
Peanut Soy Fish Wheat TreeNut
Dairy Eggs Shrimp
Per
cen
tage
of
Succ
esfu
l Alle
rgen
R
emo
val T
rial
s
Allergen
AlEW
Water
0
10
20
30
40
50
60
70
80
90
100
Peanut Soy Fish Wheat TreeNut
Dairy Eggs Shrimp
Per
cen
tage
of
Succ
esfu
l Alle
rgen
R
emo
val T
rial
s
Allergen
AlEW
Water

73
Figure 6. Comparison of Fifteen Allergen Removal Trials on RMV Rubber Using
Water and AlEW
Table 11. Comparison of p(< 0.05) Values from Cochran's Q tests
Allergen
Food Contact
Surface
Peanut Soy Fish Wheat Tree
Nut
Dairy Eggs Shrimp
316 Stainless Steel 0.005 0.035 0.002 0.317 0.034 0.034 0.014 0.059
Tile 0.011 0.005 0.035 0.034 0.058 0.003 0.005 0.007
Plastic 0.025 0.132 0.414 0.248 0.132 0.18 0.102 0.366
Rubber 0.034 0.206 0.008 0.096 0.049 0.317 0.005 0.102
*Bolded cells indicate statistical difference (p <0.05) between water and AlEW cleaning
0
10
20
30
40
50
60
70
80
90
100
Peanut Soy Fish Wheat TreeNut
Dairy Eggs Shrimp
Per
cen
tage
of
Succ
esfu
l Alle
rgen
R
emo
val T
rial
s
Allergen
AlEW
Water

74
DISCUSSION
Alkaline electrolyzed water (AlEW) is a very efficient cleaner and the
purpose of this study was to determine if it would be effective in removing
allergens from food contact surfaces. Allergens are one of the biggest issues in the
food industry (Verhoeckx et al. 2015) and ensuring that they can be effectively
removed from common food contact surfaces allows for the minimization of
potential cross contamination of non-allergenic products. To best simulate a food
processing plant, four different surfaces (stainless steel, tile, plastic, and rubber)
were tested. To determine if the allergen was effectively removed from the
surfaces 3M Allergen Swabs (3M, Minneapolis, MN) were used. The swabs have
a detection limit of 3 ng/g. There is no set limit of allergen that would be
allowable that dictates whether an allergic reaction occurs, it is specific to each
individual (Hattersley et al. 2014). However, literature has shown that that 3 ng/g
can be used as a standard as it can elicit an allergic reaction in most individuals
suffering from certain food allergies and is below the threshold for others
ensuring that if the 3M Allergen Swab shows that a surface is clean, there is
almost no chance for an allergic reaction to be induced in an individual
(Spanjersberg et al. 2007).
Prior to the experiment, we predicted that surface type would play a key
role on whether the allergen would be removed from the surface. Stainless steel
and tile have both been shown to be very easy to clean due to their lack of porous
features that would allow dirt and soils to penetrate the surface deeper than the
cleaner could get to. In comparison, plastic and rubber are both very porous and

75
can be very difficult to clean efficiently. The hydrophilicity of stainless steel and
ceramic tiles also increase their ability to be cleaned in comparison to the more
hydrophobic plastic and rubber. Rubber and plastic often require strong cleaners
as well as physical force to clean properly (Gould and Gould 2001). Since
allergen removal requires effective cleaning (Wang et al. 2010), we predicted that
ceramic tile would be the easiest surface to keep allergen free, with stainless steel
close behind, and HDPE plastic and RMV rubber both being equally difficult to
remove. Additionally, we predicted that the allergen type could potentially play
some role in how difficult it would be to remove it. This is especially true due to
the different consistencies of the pastes of each allergen, however, by cleaning the
surface to a visible clean we determined that this would provide a good
comparison. This ensured that any large amounts of protein were removed and it
is also similar to the cleaning that would be done in a food processing facility
(Boye and Godefroy 2010).
We demonstrated that on average, AlEW performed better than water
(control) as an allergen remover. Our study did show differences in removal of
allergens from the different surfaces (Figures 4 - 7). As can be seen in Table 12,
there are combinations of allergen and surface type that did not demonstrate a
greater amount of allergen removal using the AlEW. Stainless steel and tile both
showed greater allergen removal with both water and AlEW, when compared to
the plastic and rubber. With respect to the different allergens there did not seem
to be any clear pattern. The allergen removal ability for each allergen varied
across the different surfaces. For example, when using AlEW, the fish allergen

76
was completely removed from stainless steel but only showed complete removal
70% of the time when cleaned from ceramic tile. Similarly, on the HDPE plastic
surface, there was no difference between all allergens in regards to removal.
Further experiments would have to be conducted to determine how the type of
surface effects different allergens when attempting to remove them using various
cleaners.
Overall, the experiment demonstrated that AlEW can be used as an
effective cleaner to remove allergens on stainless steel and tile. Its success in
removing the allergens from rubber was less effective and the removal of
allergens from HDPE plastic surfaces using both water and AlEW was the least
effective. This may be due to a large amount of micro-abrasions that are present
in the surface of the plastic due to use. Almost any use of force on HDPE plastic
will create micro-abrasions due to the relative softness of the HDPE material, the
allergens can become lodged in the abrasions and not removed through standard
cleaning (Kane et al. 2001). Temperature may also play a role in increasing the
effectiveness of the cleaning solutions. Further experiments where the
temperature of the cleaner is changed could be done to further test the ability of
AlEW as a viable allergen control cleaner.
Further testing should be conducted using the AlEW solution made from
different salts, as demonstrated in Chapter 2, to determine if these salts provide a
better cleaning to remove the allergens from the different surfaces. The results in
Chapter 2 showed that potassium chloride formed a suitable alternative to sodium
chloride AlEW that would warrant testing.
77
Chapter 5:
Using Neutral Electrolyzed Water as a Pathogen Control Step on Various Seed
Types

78
INTRODUCTION
Electrochemically Activated (ECA) Water has seen a surge of implementation
across various food production facilities. The low cost of use combined with its efficacy
and safety make it one of the most useful sanitizers currently available (Hricova et al.
2008). There has been a great deal of research conducted on Acidic Electrolyzed Water
(AEW). Neutral Electrolyzed Water (NEW) is starting to see more uses and more
research has been done on it to better understand its capabilities.
In recent years, there has been a flood of new seed-based products introduced to
the retail market (Tamber et al. 2016). Due to the success of marketing chia seeds as a
super food, various other seeds have seen a large boost in sales. Flax and sunflower seeds
have been implemented more and more into product formulations to great success but
one of the main deterrents is the possibility of the seeds carrying Salmonella cells in a dry
state. When exposed to water, these could potentially grow and become a potential source
of foodborne illness (Kumar et al. 2006; Tamber et al. 2016). There have been various
recalls due to the presence of Salmonella in chia, flax, and sunflower containing products
(Tamber et al. 2016).
While previous research has shown that NEW is effective against the majority of
pathogens commonly present in foods, these studies are often done on food contact
surfaces or the product is dipped into a NEW solution to eliminate the pathogens (Huang
et al. 2008). The research on the food contact surfaces has shown promise yet the
“dipping” research has not flourished as NEW losses its antimicrobial ability over time
and the dipping solution can begin to harbor pathogens. The use of flax, chia, and

79
sunflower seeds provides a difficult food for NEW to work on due to the oily nature of
the food product. Chlorine species (main constituents of NEW is hypochlorous acid) tend
to break down and become inefficient in the present of oils (Su et al. 2007). Additionally,
many uses of these seeds require a soaking step prior to using them. The use of NEW
water during this processing step could potentially reduce or eliminate the potential
pathogens on seeds.
The ability of chia seeds to form a gel when water is added has been one of the
reasons they have seen such explosive use in the past few years. A new use that has just
recently been used is creating cracker-like snacks by mixing various seeds along with
chia seeds to create a gel and then allowing that gel to dry. This creates a firm and dry
cracker-like snack that requires can be categorized as vegan and raw. This new snack
became the basis for this experiment due to the lack of any form of kill step in the
process. Because the chia and other seeds must be soaked together, using NEW instead of
water to soak them could potentially act as a kill step.
The purpose of this study was to evaluate the effectiveness of NEW on
eliminating Salmonella enterica from four different kinds of seeds. The seeds will be
soaked for varying amounts of time (0, 1, 6, and 12 hours) to determine if length of
soaking plays a role in the efficacy of the sanitizers.

80
MATERIALS AND METHODS
Electrochemically Activated Water Production
Electrochemically activated water was freshly produced from a 0.9% NaCl (0.154
mol) solution by a generator (Zap Water Technology, Inc., Richfield, MN, USA) at a
voltage range of 7 to 9 volts. After a stable voltage reading was reached, Neutral
Electrolyzed Water and Alkaline Electrolyzed Water was collected using a sterile glass
bottle from the anode and cathode sides respectively, covered and used within 2 hours
post generation.
Free Available Chlorine, ORP, and pH Testing
The free available chlorine of all ECA water solutions was determined with a
chlorine test kit and using manufacturer instructions (LaMotte Company, Chestertown,
MD). ORP and pH were measured with an ORP meter (ORPTestr 10, Oakton
Instruments Inc., Vernon Hills, IL) and a pH meter (pHTestr 10, Oakton Instruments
Inc.), respectively. All tests were done immediately after ECA water solution production.
Seeds
Chia, sunflower, yellow flax, and brown flax seeds were all received from a local
seed processing company. The seeds were visibly inspected to make sure no mold or
extraneous material was present. Seeds were stored in closed, plastic containers until the
experiments were conducted.
Bacteria Culture Preparation
Salmonella enterica (ATCC 14028) were obtained from the University of
Minnesota culture collection of environmental isolates. For each strain, a loop of

81
glycerol-culture from -60°C storage was inoculated and transferred three consecutive
times in tryptic soy broth (BD, Franklin Lakes, NJ) and inoculated at 37°C at 24h
intervals.
Inoculation of Seeds and Testing of ECA Water
Five grams of seeds were added into a 100ml Erlenmeyer flask. A micropipette
was then used to transfer 1mL from the bacteria solution onto the seeds inoculating them
with ~107 CFU/g. The seeds were then swirled in the flask for 30 seconds to coat the
seeds in the bacterial solution and allowed to dry for one hour at room temperature while
in the flask. After one hour, 100mL of Neutral Electrolyzed Water was added and the
flask was swirled by hand for 30 seconds. The seeds were allowed to rest for either 0, 1,
6, or 12 hours. After the time had elapsed, the seeds were removed from the flask and
placed on a sterile stainless steel pan and dried for one hour at room temperature. The
seeds were then placed in a stomacher bag and stomached for two minutes in 50mL of
0.9% saline solution. The solution was plated onto 3M Aerobic Plate Count (APC) plates
(3M, Minneapolis, MN). The plates were incubated at 37°C for 24 hours and enumerated.
Statistical Analysis
All data was analyzed for significance using a one-way ANOVA on Microsoft
Excel (Microsoft, Seattle, WA) using XLStats Analytical Software Package (Addinsoft,
Coppel, TX).

82
RESULTS
Table 13. pH, ORP, and Chlorine for NEW Solution
Neutral Electrolyzed Water
pH ORP1
(mV)
FAC2
(ppm)
6.52± 0.14 -29.7 ± 1.7 213 ± 24
*Values are mean ± s.d. of four repeated measurements.
1ORP: oxidation–reduction potential. 2FAC: free available chlorine.
Table 14. Average log10 Reduction after Treatment with NEW on Four Different Seeds
Avg. Log Reduction After Different Treatment Lengths with NEW Across Different Seeds
Seed Type 0 Hour 1 Hour 6 Hours 12 Hours
Yellow Flax 1.37A±0.064 1.44A±0.13 1.84A±0.17 4.76A±0.21
Brown Flax 1.31A±0.077 1.45A±0.11 1.87A±0.15 4.69A±0.15
Sunflower 1.20A±0.051 1.36A±0.13 1.85A± 0.14 4.37B±0.17
Chia 1.21A±0.087 1.38A±0.10 1.56B±0.11 4.78A±0.14
*Values are mean ± s.d. of fifteen repeated measurements. Entries in a given column with the
same letter are not significantly different (ANOVA, P ≥ 0.05).

83
DISCUSSION
The application of ECA water into a food processing system has been
successfully used in bread making to increase the elasticity of the dough by increasing the
solubility of the gluten subunits allowing for a more stable gluten matrix (Huang et al.
2008), it's been shown to increase the protein content of tofu by increasing the solubility
of the soy protein (Hricova et al. 2008), and it has been shown to have a direct effect on
the texture of Udon noodles making them harder and springier (Issa-Zacharia et al. 2011).
However, it has never been used in tandem as an in-processing control step for bacteria.
The experiment described here is based on the processing step for a raw and vegan
cracker-like snack made out of chia and other seeds. Normally, the seeds are soaked in
water for 12 hours in order to swell and germinate. This causes them to form a gel and,
once dried, form a crisp cracker-like snack.
Recalls of various seed types due to the presence of Salmonella have been
increasing (Tamber et al. 2016). Being able to control the pathogen at various steps in the
processing would be an effective control point for the safety of the product. The results of
this study demonstrated that regardless of seed type, using NEW can have a significant
reduction on pathogen presence given enough time.
The 12 hour soak in NEW showed the greatest bacterial load especially in all seed
types as can be seen in Table 12. This is likely due to the extra time allowing the
hypochlorous ions to further penetrate the seed to remove more bacteria. The 0 hour, 1
hour, and 6 hour time points were all relatively the same. The increase in log10 reduction
from 6 hours to 12 hours can be explained by the extra time giving the NEW more
opportunity to act upon the bacteria. Although usually thought of as an instant sanitizer, a
sanitizer that can achieve a 5 log10 reduction in 10 seconds or less (Su et al. 2007), NEW

84
can have troubles when the surface is high in fat. This can account for the low bacterial
reduction during the shorter time soaks. Fat can react with the hypochlorous ions
preventing them from acting upon the bacteria. Although most of the fat and oil content is
present inside the seed in the germ, most seeds also have some oil present in the seed
coat. Since most seeds can be up to 50% oil (Tamber et al. 2016), it was to be expected
that the 0 hour and one hour time points would have a low reduction, however, it was
surprising that the 6 hour time point also had low bacterial reduction. The additional six
hours produced a 3 log10 increase in reduction which was unexpected. Due to the lack of
sampling between 6 and 12 hours, we can’t determine if this is a steady or sharp rise in
bacterial reduction. Future experiments would add extra time points to elucidate how the
bacterial reduction progresses over time.
In regards to seed type, there were no significant differences between the four
seed types in this experiment except for the chia seed reduction at 6 hours and the
sunflower reduction at 12 hours. This was unexpected as due to the fact that chia seeds
release a glycoprotein when soaked in water. The proteins could directly interact with
the hypochlorous acid and other chlorine species by lowering the effective amount
present.
This experiment showed that NEW can be used as an effective kill step if seeds
are soaked for long enough. The time points chosen in this experiment were determined
through conversation with food manufactures. This means that the 12 hours soaking
would be beneficial to the production process. Further soaking could possibly show a
larger reduction but it would not meet the industry needs now. Soaking for any further
would also promote germination which could potentially hinder the effect that the NEW

85
has on the seeds and bacteria. More experiments would be needed to test that hypothesis
as well as to determine at what point the antimicrobial reduction is the highest.
The next step would be to use the NEW in the actual production of the cracker-
like snack to see if there are any sensory differences. Another important factor that
should be considered is the amount of chlorine present after soaking. Due to NEW being
a chlorine-based cleaner, it is possible that enough residual chlorine may have been left
on the seeds to cause some concern. The chlorine content of NEW can be controlled
when it is made but having a high chlorine content, which could increase its antimicrobial
capabilities, could potentially leave chlorine residue on the seeds. Variations also exist
between NEW systems so the chlorine content would not be uniform across
manufacturers (Huang et al. 2008; Hricova et al. 2008).
Future work would involve more elaborate processes, such as making the NEW
an actual part of the product rather than an aid. Although there are various difficulties
surrounding this from the potential texture and taste differences, it is an unexplored
avenue of research and having a built-in pathogen control step that does not require an
outside process could potentially simplify control measures for pathogens especially for
products that are raw. It could also be used as a universal way to control pathogens on
seeds that are meant to be consumed raw such as those in trial mixes.

86
LITERATURE CITED
Abadias M, Usall J, Oliveira M, et al (2008) Efficacy of neutral electrolyzed water (NEW) for
reducing microbial contamination on minimally-processed vegetables. Int J Food
Microbiol 123:151–158. doi: 10.1016/j.ijfoodmicro.2007.12.008
Aday MS (2016) Application of electrolyzed water for improving postharvest quality of
mushroom. LWT - Food Sci Technol 68:44–51. doi: 10.1016/j.lwt.2015.12.014
Albarracín W, Sánchez IC, Grau R, Barat JM (2011) Salt in food processing; usage and
reduction: a review. Int J Food Sci Technol 46:1329–1336. doi: 10.1111/j.1365-
2621.2010.02492.x
Al-Haq MI, Seo Y, Oshita S, Kawagoe Y (2002) Disinfection effects of electrolyzed oxidizing
water on suppressing fruit rot of pear caused by Botryosphaeria berengeriana. Food Res
Int 35:657–664. doi: 10.1016/S0963-9969(01)00169-7
Barroso AKM, Torres AG, Castelo-Branco VN, et al (2014) Brown and golden flaxeed: chemical
and functional properties of the seeds and the cold-pressed oils/ Linhaca marrom e
dourada: propriedades quimicas e funcionais das sementes e dos oleos prensados a frio.
Cienc Rural 44:181+.
Berk Z (2013) Chapter 28 - Cleaning, Disinfection, Sanitation. In: Food Process Engineering and
Technology (Second Edition). Academic Press, San Diego, pp 637–650
Bonde MR, Nester SE, Khayat A, et al (1999) Comparison of Effects of Acidic Electrolyzed
Water and NaOCl on Tilletia indica Teliospore Germination. Plant Dis 83:627–632. doi:
10.1094/PDIS.1999.83.7.627
Boye JI, Godefroy SB (2010) Allergen management in the food industry. Wiley, Hoboken, NJ
Brougham P (2011) 28 - Design, installation and operation of cleaning and disinfectant chemical
storage, distribution and application systems in food factories. In: Hygienic Design of
Food Factories. Woodhead Publishing, pp 647–669
Buckley JA (2015) Food safety regulation and small processing: A case study of interactions
between processors and inspectors. Food Policy 51:74–82. doi:
10.1016/j.foodpol.2014.12.009
Cao W, Zhu ZW, Shi ZX, et al (2009) Efficiency of slightly acidic electrolyzed water for
inactivation of Salmonella enteritidis and its contaminated shell eggs. Int J Food
Microbiol 130:88–93. doi: 10.1016/j.ijfoodmicro.2008.12.021
Cochrane S, Skrypec D (2014) Chapter eight - Food Allergen Risk Management in the Factory –
From Ingredients to Products A2 - Madsen, Charlotte Bernhard. In: Crevel RWR, Mills
C, Taylor SL (eds) Risk Management for Food Allergy. Academic Press, San Diego, pp
155–166
Coutts J, Nicholls D, Rogers A, Fielder R (2005) Management of food allergens. Food Sci
Technol 19:44.

87
Crevel RWR, Baumert JL, Baka A, et al (2014) Development and evolution of risk assessment
for food allergens. Food Chem Toxicol 67:262–276. doi: 10.1016/j.fct.2014.01.032
de Oliveira CAF, da Cruz AG, Tavolaro P, Corassin CH (2016) Chapter 10 - Food Safety: Good
Manufacturing Practices (GMP), Sanitation Standard Operating Procedures (SSOP),
Hazard Analysis and Critical Control Point (HACCP) A2 - Barros-Velázquez, Jorge. In:
Antimicrobial Food Packaging. Academic Press, San Diego, pp 129–139
Fabrizio KA, Sharma RR, Demirci A, Cutter CN (2002) Comparison of electrolyzed oxidizing
water with various antimicrobial interventions to reduce Salmonella species on poultry.
Poult Sci 81:1598–1605.
Fukuzaki S, Hiratsuka H, Takehara A, et al (2004) Efficacy of Electrolyzed Water As a Primary
Cleaning Agent. Biocontrol Sci 9:105–109. doi: 10.4265/bio.9.105
Gould WA (1994) CHAPTER 1 - THE IMPLICATIONS OF CURRENT GOOD
MANUFACTURING PRACTICES (CGMP’S) AND FOOD PLANT SANITATION. In:
Current Good Manufacturing Practices/food Plant Sanitation (Second Edition).
Woodhead Publishing, pp 1–5
GOULD WA, GOULD RW (2001) CHAPTER 11 - Food Plant Sanitation. In: Total Quality
Assurance for the Food Industries (Third Edition). Woodhead Publishing, pp 101–111
Graça A, Abadias M, Salazar M, Nunes C (2011) The use of electrolyzed water as a disinfectant
for minimally processed apples. Postharvest Biol Technol 61:172–177. doi:
10.1016/j.postharvbio.2011.04.001
Grinstead D (2009) 12 - Cleaning and sanitation in food processing environments for the
prevention of biofilm formation, and biofilm removal. In: Biofilms in the Food and
Beverage Industries. Woodhead Publishing, pp 331–358
Guentzel JL, Callan MA, Liang Lam K, et al (2011) Evaluation of electrolyzed oxidizing water
for phytotoxic effects and pre-harvest management of gray mold disease on strawberry
plants. Crop Prot 30:1274–1279. doi: 10.1016/j.cropro.2011.05.021
Hattersley S, Ward R, Baka A, Crevel RWR (2014) Advances in the risk management of
unintended presence of allergenic foods in manufactured food products – An overview.
Food Chem Toxicol 67:255–261. doi: 10.1016/j.fct.2014.01.036
Hawronskyj J-M, Holah J (1997) ATP: A universal hygiene monitor. Trends Food Sci Technol
8:79–84. doi: 10.1016/S0924-2244(97)01009-1
Hirst B, Miguel SJ (2015) 16 - Validation, standardisation and harmonisation of analytical
methods and test kits for detecting allergens in food A2 - Flanagan, Simon. In:
Handbook of Food Allergen Detection and Control. Woodhead Publishing, pp 295–309
Holah JT (2014) 9 - Cleaning and disinfection practices in food processing. In: Hygiene in Food
Processing (Second edition). Woodhead Publishing, pp 259–304
Hricova D, Stephan R, Zweifel C (2008) Electrolyzed water and its application in the food
industry. J Food Prot 71:1934–1947.

88
Huang Y-R, Hsieh H-S, Lin S-Y, et al (2006) Application of electrolyzed oxidizing water on the
reduction of bacterial contamination for seafood. Food Control 17:987–993. doi:
10.1016/j.foodcont.2005.07.003
Huang Y-R, Hung Y-C, Hsu S-Y, et al (2008) Application of electrolyzed water in the food
industry. Food Control 19:329–345. doi: 10.1016/j.foodcont.2007.08.012
In Y-W, Kim J-J, Kim H-J, Oh S-W (2013) Antimicrobial Activities of Acetic Acid, Citric Acid
and Lactic Acid against Shigella Species. J Food Saf 33:79–85. doi: 10.1111/jfs.12025
Issa-Zacharia A, Kamitani Y, Miwa N, et al (2011) Application of slightly acidic electrolyzed
water as a potential non-thermal food sanitizer for decontamination of fresh ready-to-eat
vegetables and sprouts. Food Control 22:601–607. doi: 10.1016/j.foodcont.2010.10.011
Kakurinov V (2014) Food Safety Assurance Systems: Cleaning and Disinfection A2 -
Motarjemi, Yasmine. In: Encyclopedia of Food Safety. Academic Press, Waltham, pp
211–225
Kane R, Hildebrand P, Wojitas P, Feirtag J (2001) Delamintation in High Density Polyethylene
Surfaces and the Influence of Multilayered Upper Surfaces n the Deteriotation Process.
Dairy Food Environ Sanit 21:742–748.
Kazimierczak H, Ozga P, Słupska M, et al (2014) Electrodeposition of Sn-Mn Layers from
Aqueous Citrate Electrolytes. J Electrochem Soc 161:D309–D320. doi:
10.1149/2.003406jes
Kim C, Hung Y-C, Brackett RE, Lin C-S (2003) Efficacy of Electrolyzed Oxidizing Water in
Inactivating Salmonella on Alfalfa Seeds and Sprouts. J Food Prot 66:208–214.
Koseki S, Yoshida K, Isobe S, Itoh K (2004) Efficacy of acidic electrolyzed water for microbial
decontamination of cucumbers and strawberries. J Food Prot 67:1247–1251.
Kumar M, Hora R, Kostrzynska M, et al (2006) Inactivation of Escherichia coli O157:H7 and
Salmonella on Mung Beans, Alfalfa, and Other Seed Types Destined for Sprout
Production by Using an Oxychloro-Based Sanitizer. J Food Prot 69:1571–1578.
Liao LB, Chen WM, Xiao XM (2007) The generation and inactivation mechanism of oxidation–
reduction potential of electrolyzed oxidizing water. J Food Eng 78:1326–1332. doi:
10.1016/j.jfoodeng.2006.01.004
Liu C, Duan J, Su Y-C (2006) Effects of electrolyzed oxidizing water on reducing Listeria
monocytogenes contamination on seafood processing surfaces. Int J Food Microbiol
106:248–253. doi: 10.1016/j.ijfoodmicro.2005.06.020
Mahmoud BSM, Yamazaki K, Miyashita K, et al (2004) Decontamination effect of electrolysed
NaCl solutions on carp. Lett Appl Microbiol 39:169–173. doi: 10.1111/j.1472-
765X.2004.01557.x
Meireles A, Giaouris E, Simões M (2016) Alternative disinfection methods to chlorine for use in
the fresh-cut industry. Food Res Int 82:71–85. doi: 10.1016/j.foodres.2016.01.021

89
Melo RT, Nalevaiko PC, Mendonça EP, et al (2013) Campylobacter jejuni strains isolated from
chicken meat harbour several virulence factors and represent a potential risk to humans.
Food Control 33:227–231. doi: 10.1016/j.foodcont.2013.02.032
Mohammadabadi T, Mesgaran MD, Nasiri M., Chaji M (2010) The effect of high fat sunflower
meal treated with formaldehyde and sodium hydroxide on milk yield and composition of
Holstein dairy cows. Adv Anim Biosci 1:289–289. doi: 10.1017/S2040470010004322
Okull DO, Laborde LF (2004) Activity of Electrolyzed Oxidizing Water Against Penicilium
expansum in Suspension and on Wounded Apples. J Food Sci 69:FMS23-FMS27. doi:
10.1111/j.1365-2621.2004.tb17872.x
Park H, Hung Y-C, Brackett RE (2002) Antimicrobial effect of electrolyzed water for
inactivating Campylobacter jejuni during poultry washing. Int J Food Microbiol 72:77–
83. doi: 10.1016/S0168-1605(01)00622-5
Park H, Hung Y-C, Chung D (2004) Effects of chlorine and pH on efficacy of electrolyzed water
for inactivating Escherichia coli O157:H7 and Listeria monocytogenes. Int J Food
Microbiol 91:13–18. doi: 10.1016/S0168-1605(03)00334-9
Poms RE, Klein CL, Anklam E (2004) Methods for allergen analysis in food: a review. Food
Addit Contam 21:1–31. doi: 10.1080/02652030310001620423
Powell SC, Attwell RW (Department of BS (1997) The use of ATP-bioluminescence as an
objective measure of food hygiene standards.
Rahman S, Khan I, Oh D-H (2016) Electrolyzed Water as a Novel Sanitizer in the Food Industry:
Current Trends and Future Perspectives. Compr Rev Food Sci Food Saf 15:471–490. doi:
10.1111/1541-4337.12200
Ratana-Arporn P, Jommark N (2014) Efficacy of neutral electrolyzed water for reducing
pathogenic bacteria contaminating shrimp. J Food Prot 77:2176–2180. doi:
10.4315/0362-028X.JFP-14-161
Reighard KP, Schoenfisch MH (2015) Antibacterial Action of Nitric Oxide-Releasing Chitosan
Oligosaccharides against Pseudomonas aeruginosa under Aerobic and Anaerobic
Conditions. Antimicrob Agents Chemother 59:6506–6513. doi: 10.1128/AAC.01208-15
Ren T, Su Y-C (2006) Effects of electrolyzed oxidizing water treatment on reducing Vibrio
parahaemolyticus and Vibrio vulnificus in raw oysters. J Food Prot 69:1829–1834.
Rico D, Martín-Diana AB, Barry-Ryan C, et al (2008) Use of neutral electrolysed water (EW) for
quality maintenance and shelf-life extension of minimally processed lettuce. Innov Food
Sci Emerg Technol 9:37–48. doi: 10.1016/j.ifset.2007.05.002
Rimbaud L, Heraud F, La Vieille S, et al (2010) Quantitative Risk Assessment Relating to
Adventitious Presence of Allergens in Food: A Probabilistic Model Applied to Peanut in
Chocolate. Risk Anal 30:7–19. doi: 10.1111/j.1539-6924.2009.01322.x

90
Röder M, Baltruweit I, Gruyters H, Ibach A, Mucke I, Mattisek R (2010) Allergen Sanitation in
the Food Industry: A Systematic Industrial Scale Approach to Reduce Hazelnut Cross-
Contamination on Cookies. J Food Prot 73:1671-9
Röder M, Baltruweit I, Gruyters H, Ibach A, Mucke I, Mattisek R (208=08) Pilot Plant
Investigations on Cleaning Efficiencies to Reduce Hazelnut Cross-Contamination in Industrial
Manufacture of Cookies. J Food Prot. 71: 2263-71.
Russell SM (2003) The effect of electrolyzed oxidative water applied using electrostatic spraying
on pathogenic and indicator bacteria on the surface of eggs. Poult Sci 82:158–162.
Sandoval-Oliverost M, Paredes-Lopez O (2013) Isolation and Characterization of Proteins from
Chia Seeds (Salvia Hispanica L.). J Agric Food Chem 193–201.
Scallan E, Hoekstra RM, Angulo FJ, et al (2011) Foodborne illness acquired in the United States-
-major pathogens. Emerg Infect Dis 17:7+.
Smith GV (1970) An Evaluation of the Elevated Temperature, Tensile, and Creep-rupture
Properties of Wrought Carbon Steel. ASTM International
Spanjersberg MQI, Kruizinga AG, Rennen MAJ, Houben GF (2007) Risk assessment and food
allergy: the probabilistic model applied to allergens. Food Chem Toxicol 45:49–54. doi:
10.1016/j.fct.2006.07.018
Su Y-C, Liu C, Hung Y-C (2007) Electrolyzed Water: Principles and Applications. In: New
Biocides Development. American Chemical Society, pp 309–322
Sun Y-M, Ockerman HW (2005) A review of the needs and current applications of hazard
analysis and critical control point (HACCP) system in foodservice areas. Food Control
16:325–332. doi: 10.1016/j.foodcont.2004.03.012
Tamber S, Swist E, Oudit D (2016) Physicochemical and Bacteriological Characteristics of
Organic Sprouted Chia and Flax Seed Powders Implicated in a Foodborne Salmonellosis
Outbreak. J Food Prot 79:703–709. doi: 10.4315/0362-028X.JFP-15-529
Türkün M, Cengiz T (1997) The effects of sodium hypochlorite and calcium hydroxide on tissue
dissolution and root canal cleanliness. Int Endod J 30:335–342.
Verhoeckx KCM, Vissers YM, Baumert JL, et al (2015) Food processing and allergenicity. Food
Chem Toxicol 80:223–240. doi: 10.1016/j.fct.2015.03.005
Wang X, Young O a., Karl D p. (2010) Evaluation of Cleaning Procedures for Allergen Control
in a Food Industry Environment. J Food Sci 75:T149–T155. doi: 10.1111/j.1750-
3841.2010.01854.x
Willoughby J (2015) Spice Fades at Chipotle. Barron’s 95:20.
Zacharia IG, Deen WM (2005) Diffusivity and solubility of nitric oxide in water and saline. Ann
Biomed Eng 33:214–222.

91
(2006) The Role of HACCP in Sanitation. In: Principles of Food Sanitation. Springer US, pp 99–
115
(2016) A Look Back at 2015 Food Recalls. In: Food Saf. Mag.
http://www.foodsafetymagazine.com/enewsletter/a-look-back-at-2015-food-recalls/.
Accessed 10 Aug 2016
Current Recalls and Alerts. http://www.fsis.usda.gov/wps/portal/fsis/topics/recalls-and-public-
health-alerts/current-recalls-and-alerts. Accessed 10 Aug 2016
(2013) Undeclared Allergens Top Reason for Second-Quarter Recalls. In: Food Saf. News.
http://www.foodsafetynews.com/2013/08/undeclared-allergens-top-reason-for-second-
quarter-recalls/. Accessed 10 Aug 2016