electronic supplementary information - rsc.org · 5000 bp 2000 bp 850 bp 400 bp (a) 1 2 5000 bp ......
TRANSCRIPT

1
Electronic Supplementary Information
Watasemycin biosynthesis in Streptomyces venezuelae:
thiazoline C-methylation by a type B radical-SAM
methylase homologue
Yuki Inahashi,‡ab Shanshan Zhou,‡a Maureen J. Bibb,c Lijiang Song,a
Mahmoud M. Al-Bassam,§c Mervyn J. Bibb,*c and Gregory L. Challis*a
aDepartment of Chemistry, University of Warwick, Gibbet Hill, Coventry, CV4 7AL,
United Kingdom.
bKitasato Institute for Life Sciences, Kitasato University, 5-9-1, Shirokane, Minato-ku,
Tokyo, Japan.
cDepartment of Molecular Microbiology, John Innes Centre, Norwich, NR4 7UH, UK
‡ These authors contributed equally.
§ Current address: Department of Bioengineering, University of California, San
Diego, USA.
* Correspondence authors. Prof. Mervyn J. Bibb: phone, +44 (0) 1603 450776; fax,
+44 (0) 1603 450778; email, [email protected]
Prof. Gregory L. Challis: phone, +44 (0) 2476 574024; fax, +44 (0) 2476 524112;
email, [email protected].
Electronic Supplementary Material (ESI) for Chemical Science.This journal is © The Royal Society of Chemistry 2017

2
Contents
1. Sequence analysis of the sven0503-sven0517 gene cluster…………...………………3
2. Experimental procedures and additional data……………………………………...….4
2.1 Strains and plasmids used in this study…………………………………………...4
2.2 PCR targeting …………………………………………………………………….5
2.3 Intergeneric conjugation from E. coli to S. coelicolor M1152……………………6
2.4 Isolation and structure characterisation of thiazostatin and watasemycin……….6
2.5 Synthesis of pyochelin and isopyochelin ……………………………...………….9
2.6 LC-MS analyses………………………………………………...……...………...13
2.7 Analysis of the expression profiles of genes flanking the cluster……......………...19
3. References…………………………………………………….…………….……….20

3
1. Sequence analysis of the sven0503-sven0517 gene cluster
Table S1. Proposed functions of proteins encoded by genes in the watasemycin
biosynthetic gene cluster.
Gene (accession
number)
Size
(bp) Homologue (accession number); origin
Identity/
similarity
(%)
Proposed function
sven0503 (CCA53790) 1250 SCAB1361 (CBG67360); S. scabies 87.22 44/51 AMP-ligase
sven0504 (CCA53791) 1247 Na+/H+ antiporter (WP_032767693);
Streptomyces sp. CNS654 88/91 Na+/H+ antiporter
sven0505 (CCA53792) 1947 SCAB1371 (CBG67361); S. scabies 87.22 59/80 AfsR-family
regulator
sven0506 (CCA53793) 1365 SCAB1381 (CBG67362); S. scabies 87.22 61/82 Salicylate synthase
sven0507 (CCA53794) 690 SCAB1401 (CBG67364); S. scabies 87.22 57/74 TetR-family
regulator
sven0508 (CCA53795) 1212 Trans-acting enoyl reductase (AEV87025);
Actinoplanes sp. SE50/110 36/46 Reductase
sven0509 (CCA53796) 687 SCAB1401 (CBG67364); S. scabies 87.22 70/88 TetR-family
regulator
sven0510 (CCA53797) 1602 SCAB1411 (CBG67365); S. scabies 87.22 71/79 Salicyl-AMP-ligase
sven0511 (CCA53798) 801 SCAB1421 (CBG67366); S. scabies 87.22 55/63 Thioesterase
sven0512 (CCA53799) 4545 SCAB1481 (CBG67372); S. scabies 87.22 59/68 NRPS
sven0513 (CCA53800) 1710 SCAB1431 (CBG67367); S. scabies 87.22 69/82 ABC transporter
permease/ATPase
sven0514 (CCA53801) 1842 SCAB1441 (CBG67368); S. scabies 87.22 68/79 ABC transporter
permease/ATPase
sven0515 (CCA53802) 1605 Radical SAM domain protein (AEV87031);
Actinoplanes sp. SE50/110 65/77
Radical SAM
methyltransferase
sven0516 (CCA53803) 1227 Trans-acting enoyl reductase (AEV87025);
Actinoplanes sp. SE50/110 48/56 Reductase
sven0517 (CCA53804) 5481 SCAB1471 (CBG67371); S. scabies 87.22 47/59 NRPS

4
2. Experimental procedures and additional data
2.1 Strains and plasmids used in this study
Table S2. Strains used in this study.
Strain Characteristic Reference
Escherichia coli
BT340 DH5α/pCP20 1
BW25113 K-12 derivative: ∆araBAD, ∆rhaBAD 2
ET12567 dam, dcm, hsdM, hsdS, hsdR, cat, tet 3
Streptomyces venezuelae
ATCC 10712 Wild type strain 4
Streptomyces coelicolor
M1152 M145 ∆act ∆red ∆cpk ∆cda rpoB[C1298T] 5
M1152/SV-2_E03::SspI SV-2_E03::SspI in øC31 attB This study
M1152/SV-2_E03::SspI/∆sven0508 SV-2_E03::SspI/∆sven0508 in øC31 attB (∆sven0508) This study
M1152/SV-2_E03::SspI/∆sven0515 SV-2_E03::SspI/∆sven0515 in øC31 attB (∆sven0515) This study
M1152/SV-2_E03::SspI/∆sven0516 SV-2_E03::SspI/∆sven0516 in øC31 attB (∆sven0516) This study
Table S3. Plasmids used in this study.
Plasmid Characteristic Reference
SuperCosI neo, bla Stratagene
pIJ10702 bla, aac(3)IV, oriT, øC31 int-attP 6
pIJ773 pBS SK+ containing cassette P1-FRT-oriT-aac(3)IV-FRT-P2 7
pIJ790 λ-RED (gam, bet, exo), cat, araC, rep101ts 7
pUZ8002 tra, neo, PR4 8
SV-2_E03 SuperCosI containing thiazostatin biosynthetic gene cluster This study
SV-2_E03/∆sven0508 SV-2_E03 in-frame deletion of sven0508 This study
SV-2_E03/∆sven0515 SV-2_E03 in-frame deletion of sven0515 This study
SV-2_E03/∆sven0516 SV-2_E03 in-frame deletion of sven0516 This study
SV-2_E03::SspI SV-2_E03 with pIJ10702 backbone This study
SV-2_E03::SspI/∆sven0508 SV-2_E03/∆sven0508 with pIJ10702 backbone This study
SV-2_E03::SspI/∆sven0515 SV-2_E03/∆sven0515 with pIJ10702 backbone This study
SV-2_E03::SspI/∆sven0516 SV-2_E03/∆sven0516 with pIJ10702 backbone This study
5
2.2 PCR targeting
PCR targeting was performed as reported by Gust et al.7 PCR-targeting primer pairs
were used to amplify an apramycin resistance cassette containing flippase
recombination enzyme (FLP) recognition sites from pIJ773 (Table S3). The resulting
cassettes were introduced into Escherichia coli BW25113/pIJ790/SV-2_E03 to delete
sven0508, sven0515 and sven0516 in SV-2_E03 by double homologous recombination.
The cosmids were introduced into E. coli BT340 and the resulting strains incubated at
42 °C to induce expression of the FLP recombinase. The FLP-mediated excision of the
apramycin resistance cassette yielded cosmids SV-2_E03/∆sven0508, SV-
2_E03/∆sven0515 and SV-2_E03/∆sven0516, containing in-frame ‘scar’ sequences. The
integrity of the cosmids was confirmed by PCR analysis using the appropriate primer
pairs listed in Table S4 (Figure S1). Derivatives capable of integrating into the
chromosome of Streptomyces hosts (SV-2_E03::SspI/∆sven0508, SV-
2_E03::SspI/∆sven0515 and SV-2_E03::SspI/∆sven0516) were made by targeting the
cosmids with a 5.2-kb SspI fragment from pIJ10702, carrying an apramycin resistance
gene, oriT, a øC31 attP site and an integrase gene (int).
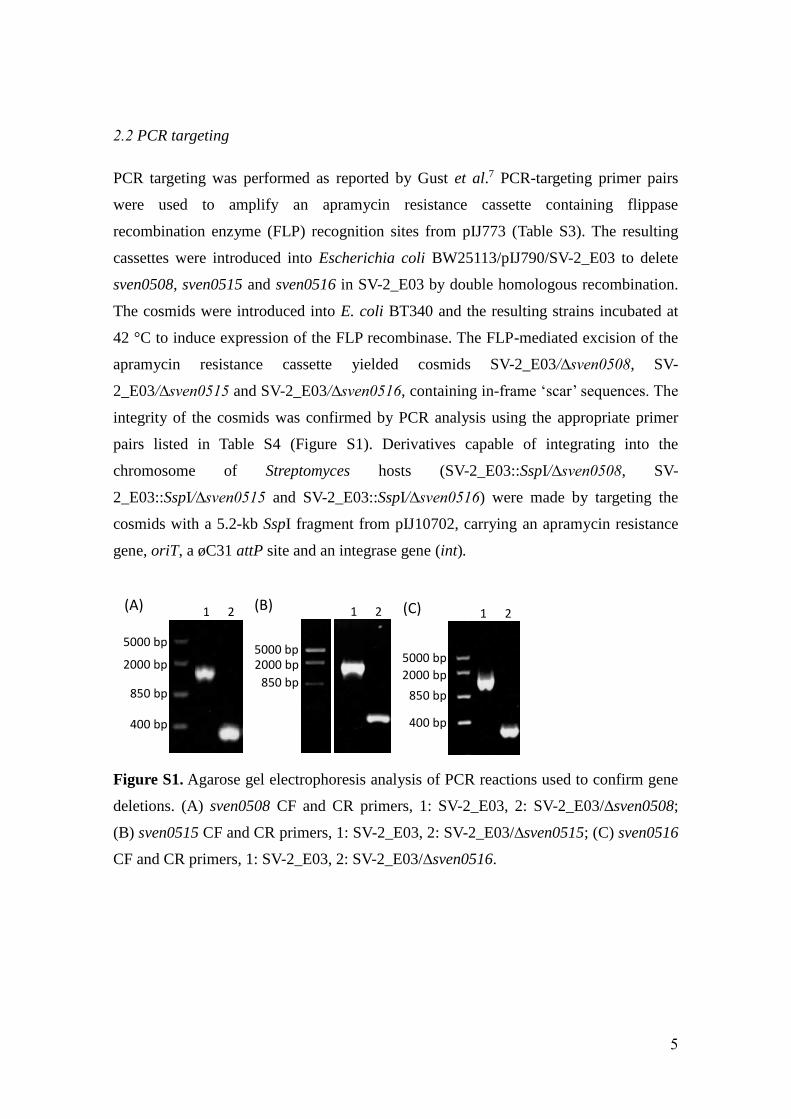
Figure S1. Agarose gel electrophoresis analysis of PCR reactions used to confirm gene
deletions. (A) sven0508 CF and CR primers, 1: SV-2_E03, 2: SV-2_E03/∆sven0508;
(B) sven0515 CF and CR primers, 1: SV-2_E03, 2: SV-2_E03/∆sven0515; (C) sven0516
CF and CR primers, 1: SV-2_E03, 2: SV-2_E03/∆sven0516.
5000 bp
2000 bp
850 bp
400 bp
(A) 1 2
5000 bp 2000 bp
850 bp
(B) 1 2
5000 bp
2000 bp
850 bp
400 bp
(C) 1 2

6
Table S4. Primers used in this study.
2.3 Intergeneric conjugation from E. coli to S. coelicolor M1152
Integrative cosmids were introduced into E. coli ET12567/pUZ8002 by electroporation.
An ampicillin-resistant colony containing each of the cosmids was used to transfer the
plasmid from E. coli to S. coelicolor M1152 by intergeneric conjugation on SFM agar
(soyflour 2.0%, mannitol 2.0%, agar 2.0%, tap water) following the method of Kieser et
al.9 This procedure yielded the following apramycin resistant exconjugants: S.
coelicolor M1152/SV-2_E03::SspI, S. coelicolor M1152/ SV-2_E03::SspI/∆sven0508,
S. coelicolor M1152/SV-2_E03::SspI/∆sven0515 and S. coelicolor M1152/ SV-
2_E03::SspI/∆sven0516.
2.4 Isolation and structural characterisation of thiazostatin and watasemycin
S. coelicolor M1152/SV-2_E03::SspI was cultured in 2 L of YD medium (yeast extract
1.0%, glucose 1.0%) shaken at 180 rpm and 30 °C for 5 days. The culture broth was
separated from the mycelium by centrifugation at 5,000 rpm and added to 30 mL of
Diaion HP-20 (Sigma), pre-swollen with ethanol. The resulting mixture was shaken at
Primer Sequence
PCR-targeting
sven0508 F CTCGGCGGGCGGCGGCCCCACCCGGGAGAACACGCATGAATTCCGGGGATCCGTCGACC
sven0508 R TCCGCCGCCGCCCGGCCCCGGCACCGGCCGTCCCGCTCATGTAGGCTGGAGCTGCTTC
sven0515 F GGCGGTCACGACCTCACCACAGGAGAGCTGGAACGCGTGATTCCGGGGATCCGTCGACC
sven0515 R CGGCCCGCCGCGCCGCCCTGCTCCTCCGCTCCCGGTTCATGTAGGCTGGAGCTGCTTC
sven0516 F GCCGTGGCCCGCGCACTGCTCGCGGAGGACGGCCGGTGAATTCCGGGGATCCGTCGACC
sven0516 R AGCCCGCCGCGCCGTCGCGCCGCCGACCGGAAGACGTCATGTAGGCTGGAGCTGCTTC
Confirmation of gene-deletion
sven0508 CF CACCCAGCGCGAGCAGGTCTTC
sven0508 CR GGTGCGTCGGGTCTGAGGTGTC
sven0515 CF GATCTGAGGCGCGGAGAATC
sven0515 CR TGGAGGAAGGGTGTGCTCTG
sven0516 CF TGTGCGACCCGGTCTGAAC
sven0516 CR CCGCGACATGACCGACTACTG

7
180 rpm for 2 hours. The resin was packed in a column and washed with 100 mL of
50% methanol, and then eluted with 200 mL of methanol. The eluate was concentrated
in vacuo, and the residual aqueous solution was extracted with ethyl acetate. The ethyl
acetate extract was concentrated to dryness in vacuo and the residue (45 mg) was
purified by HPLC on an Agilent C18 column (21 x 100 mm) connected to an Agilent
1100 instrument, eluting with 50% acetonitrile/0.1% formic acid at 5 mL/min and
monitoring absorbance at 210 nm. The fractions eluting at 16.8, 20.1, 24.5 and 27.0
minutes were adjusted to pH 7.0 with 1 M Na2CO3 and concentrated in vacuo to remove
acetonitrile. The resulting solutions were adjusted to pH 5.0 with HCl and extracted
with ethyl acetate. Each organic extract was concentrated to dryness in vacuo to yield
wataemycin A (5 mg), thiazostatin B (1 mg), watasemycin B (5 mg) and thiazostatin A
(1 mg). The 1H NMR spectra (400 MHz) of these compounds are shown in Figures S2-
S5.
Figure S2. 1H NMR spectrum of thiazostatin A (in CD3OD).
O
OH
S
N
S
N
OH
H
Me
Me
8
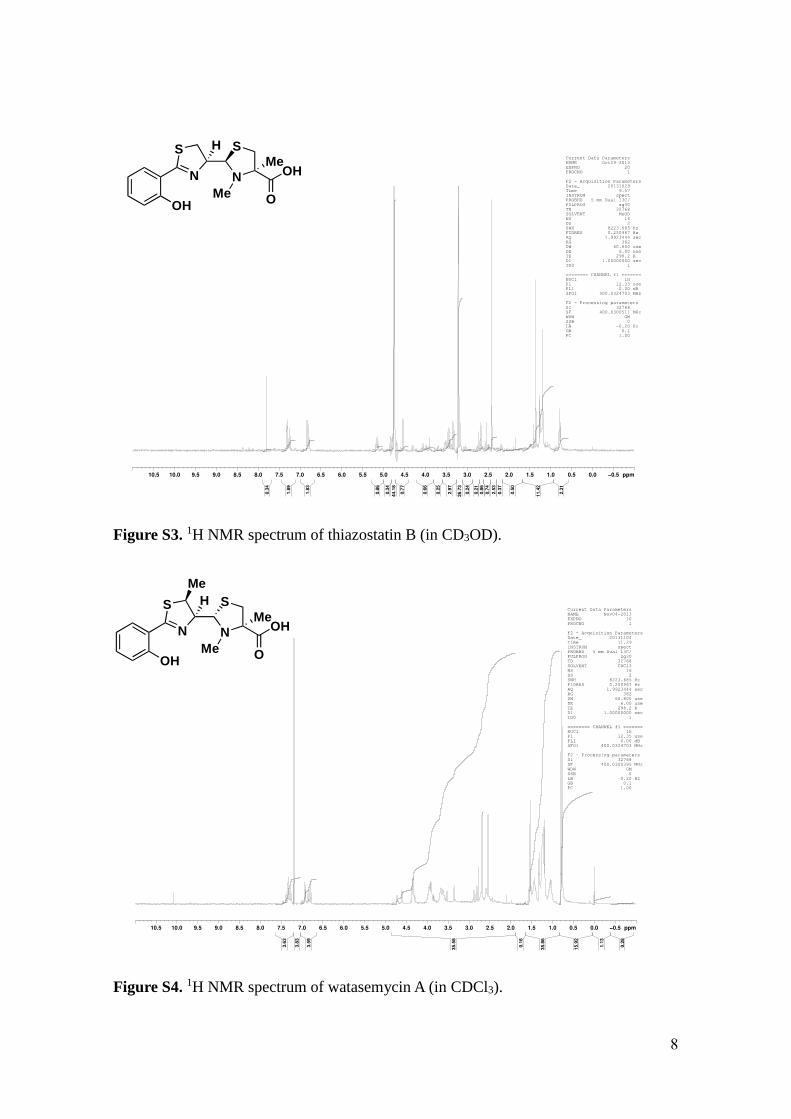
Figure S3. 1H NMR spectrum of thiazostatin B (in CD3OD).
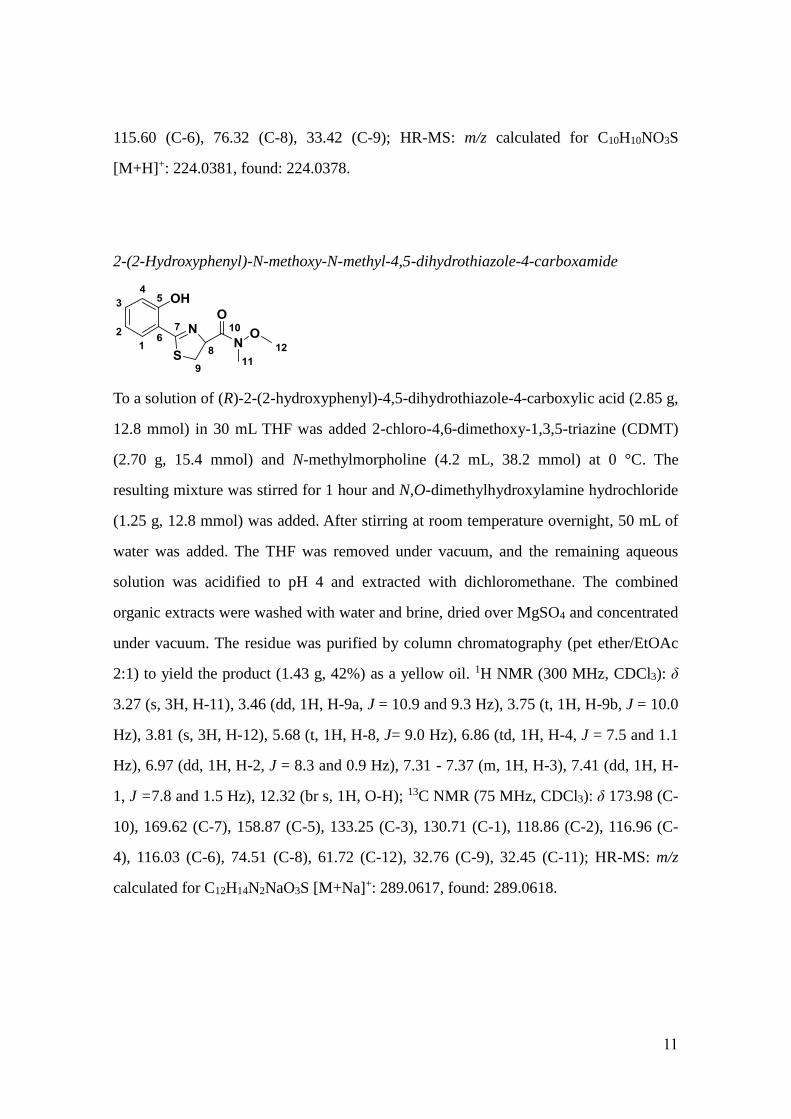
Figure S4. 1H NMR spectrum of watasemycin A (in CDCl3).
O
OH
S
N
S
N
OH
H
Me
Me
O
OH
S
N
S
N
OH
H
Me
Me
Me

9
Figure S5. 1H NMR spectrum of watasemycin B (in CDCl3).
2.5 Synthesis of pyochelin and isopyochelin
General information
All chemicals were purchased from commercial sources and were used as received. 1H
and 13C NMR spectra were measured at 300 MHz and 75 MHz, respectively. All
chemical shifts are given as δ values in ppm with reference to residual chloroform (δH
7.26), the central peak of chloroform-d (δC 77.00) or DMSO-d6 (δC 39.52), as
appropriate. Data for 1H NMR spectra are reported as follows: chemical shift (δ, ppm),
multiplicity (s = singlet, t = triplet, dd = doublet of doublets, td = triplet of doublets, m
= multiplet, br = broad), integration, assignment and coupling constant (Hz). HRMS
spectra were measured on a Bruker MaXis impact mass spectrometer. Melting points
were measured using a Stuart SMP10 melting point apparatus and are uncorrected.
The synthetic route employed is outlined in Scheme S1.10
O
OH
S
N
S
N
OH
H
Me
Me
Me

10
Scheme S1. Route employed for the synthesis of pyochelin and isopyochelin.
(R)-2-(2-Hydroxyphenyl)-4,5-dihydrothiazole-4-carboxylic acid
A solution of 2-hydroxy-2-benzonitrile (1.90 g, 16.0 mmol) and L-cysteine (3.86 g, 31.9
mmol) in a 1:1 (v/v) mixture of methanol and phosphate buffer pH 6.4 (75 mL) was
stirred under an argon atmosphere at 50 °C for 4 days. A precipitate formed that was
removed by filtration and the filtrate was concentrated under vacuum. 20 mL of water
and 10 mL of 1 M HCl solution was added to the aqueous residue and the mixture was
extracted with dichloromethane. The combined organic layers were washed with water
and brine, dried over MgSO4 and concentrated under vacuum. The residue was
recrystallized using a mixture of ethanol and hexane to yield the product (2.85 g, 80%)
as a yellow solid, mp 114 - 116 °C. 1H NMR (300 MHz, CDCl3): δ 3.61 - 3.73 (m, 2H,
H-9), 5.42 (dd, 1H, H-8, J = 9.3 and 8.1 Hz), 6.86 - 6.92 (m, 1H, H-4), 7.03 (dd, 1H, H-
2, J = 8.3 and 0.6 Hz), 7.35 - 7.39 (m, 1H, H-3), 7.43 (dd, 1H, H-1, J = 8.0 and 1.4 Hz),
10.79 (br s, 2H, O-H and COO-H); 13C NMR (75 MHz, (CD3)2SO): δ 172.71 (C-10),
171.29 (C-7), 158.38 (C-5), 133.72 (C-3), 130.53 (C-1), 119.34 (C-2), 116.87 (C-4),
11
115.60 (C-6), 76.32 (C-8), 33.42 (C-9); HR-MS: m/z calculated for C10H10NO3S
[M+H]+: 224.0381, found: 224.0378.
2-(2-Hydroxyphenyl)-N-methoxy-N-methyl-4,5-dihydrothiazole-4-carboxamide
To a solution of (R)-2-(2-hydroxyphenyl)-4,5-dihydrothiazole-4-carboxylic acid (2.85 g,
12.8 mmol) in 30 mL THF was added 2-chloro-4,6-dimethoxy-1,3,5-triazine (CDMT)
(2.70 g, 15.4 mmol) and N-methylmorpholine (4.2 mL, 38.2 mmol) at 0 °C. The
resulting mixture was stirred for 1 hour and N,O-dimethylhydroxylamine hydrochloride
(1.25 g, 12.8 mmol) was added. After stirring at room temperature overnight, 50 mL of
water was added. The THF was removed under vacuum, and the remaining aqueous
solution was acidified to pH 4 and extracted with dichloromethane. The combined
organic extracts were washed with water and brine, dried over MgSO4 and concentrated
under vacuum. The residue was purified by column chromatography (pet ether/EtOAc
2:1) to yield the product (1.43 g, 42%) as a yellow oil. 1H NMR (300 MHz, CDCl3): δ
3.27 (s, 3H, H-11), 3.46 (dd, 1H, H-9a, J = 10.9 and 9.3 Hz), 3.75 (t, 1H, H-9b, J = 10.0
Hz), 3.81 (s, 3H, H-12), 5.68 (t, 1H, H-8, J= 9.0 Hz), 6.86 (td, 1H, H-4, J = 7.5 and 1.1
Hz), 6.97 (dd, 1H, H-2, J = 8.3 and 0.9 Hz), 7.31 - 7.37 (m, 1H, H-3), 7.41 (dd, 1H, H-
1, J =7.8 and 1.5 Hz), 12.32 (br s, 1H, O-H); 13C NMR (75 MHz, CDCl3): δ 173.98 (C-
10), 169.62 (C-7), 158.87 (C-5), 133.25 (C-3), 130.71 (C-1), 118.86 (C-2), 116.96 (C-
4), 116.03 (C-6), 74.51 (C-8), 61.72 (C-12), 32.76 (C-9), 32.45 (C-11); HR-MS: m/z
calculated for C12H14N2NaO3S [M+Na]+: 289.0617, found: 289.0618.

12
2-(2-Hydroxyphenyl)-4,5-dihydrothiazole-4-carbaldehyde
To a solution of 2-(2-hydroxyphenyl)-N-methoxy-N-methyl-4,5-dihydrothiazole-4-
carboxamide (0.45 g, 1.7 mmol) in 20 mL dry Et2O at -20 °C was added LiAlH4 (0.19 g,
5.0 mmol). The resulting mixture was stirred at -20 °C until the starting material had
been consumed, and 2 mL methanol, 20 mL saturated NH4Cl solution and 10 mL 5%
(v/v) H2SO4 solution were successively added. The organic phase was collected and the
aqueous phase was extracted with dichloromethane. The combined organic extracts
were washed with brine, dried over MgSO4 and concentrated under vacuum to yield the
crude aldehyde (0.21 g, 60%) as a yellow oil. The aldehyde was unstable and therefore
immediately used in the next step without further purification. HR-MS: m/z calculated
for C10H10NO2S [M+H]+: 208.0427, found: 208.0432.
Pyochelin/neopyochelin
To a solution of 2-(2-hydroxyphenyl)-4,5-dihydrothiazole-4-carbaldehyde (25 mg, 0.12
mmol) in a mixture of 5 mL ethanol and 1.3 mL water was added CH3COOK (82 mg,
0.84 mmol) and the hydrochloride salt of L-N-methylcysteine (30 mg, 0.17 mmol).
After stirring at room temperature for 24 hours, 15 mL of water was added and the
mixture washed with hexane. The aqueous phase was acidified to pH 5 and extracted
with EtOAc. The ethyl acetate extract was washed with brine, dried over MgSO4 and
concentrated under vacuum to yield pyochelin/neopyochelin as a yellow solid
consisting of four inseparable diastereomers that were subjected directly to comparative
LC-MS analyses.
13
Isopyochelin
The same procedure as that employed for the synthesis of pyochelin/neopyochelin was
utilized, except that L- and D-2-methylcysteine were used in place of L-N-
methylcysteine. In both cases and inseparable mixture of four diastereomeric products
was obtained that was subjected directly to LC-MS analyses.
2.6 LC-MS analyses
Sample preparation
Strains of S. coelicolor M1152/SV-2_E03::SspI and the ∆sven0508, ∆sven0515 and
∆sven0516 mutants were grown in liquid YD medium. Seed cultures were prepared in
50 mL of YD medium inoculated with 20 μL of spores. After incubation for 2 days at
180 rpm and 30 °C, 2% of this culture was used to inoculate 250 mL Erlenmeyer flasks,
each containing 50 mL of YD medium. The resulting cultures were grown for 5 days at
180 rpm and 30 ºC. An equal volume of ethanol was added to each culture and the
resulting mixtures were shaken for 1 hour at 180 rpm. The insoluble materials were
pelleted at 13200 rpm for 10 min and the supernatant was passed through a 0.4 μm filter
immediately prior to LC-MS analysis.
For the experiment in which the extract of the ∆sven0515 mutant was fed to the
∆sven0516 mutant, a 5-day-old culture (50 mL) of the ∆sven0515 mutant was first
centrifuged at 5,000 rpm for 10 min to remove the mycelium. Then the supernatant was
acidified with 1M HCl to pH 5.0 and extracted with EtOAc. The EtOAc extract was
dried over MgSO4 and concentrated under vacuum. The residue containing the
metabolites from the culture of the ∆sven0515 mutant was dissolved in 3 mL of YD
medium and fed to a 50 mL culture of the ∆sven0516 mutant, which had been incubated
for 1 day after inoculation with 2% of the seed culture. The resulting culture was grown
for 4 days at 180 rpm and 30 °C, and extracts for LC-MS analyses were prepared as
described above.

14
Instrumentation and elution conditions
LC-MS analyses were performed on a Dionex Ultimate 3000 RS UHPLC instrument
equipped with ZORBAX Eclipse Plus C18 column (2.1 × 100 mm, 1.8 μm) coupled to a
Bruker MaXis Impact mass spectrometer [ESI in positive ion mode; full scan 50-2500
m/z; end plate offset, -500 V; capillary, -4500 V; nebulizer gas (N2), 1.4 bar; dry gas
(N2), 8 L/min; dry temperature, 200 °C]. The solvents used for elution of the column
were as follows: solvent A, 0.1% formic acid in water; solvent B, 0.1% formic acid in
acetonitrile. The elution profile was as follows: 0-5 min, 5% B; 5-17 min, linear
gradient from 5% B to 100% B; 17-22 min, 100% B; 22-25 min, linear gradient from
100% B to 5% B; 25-34 min, 5% B. The flow rate was 0.2 mL/min. The mass
spectrometer was calibrated with 10 mM sodium formate at the beginning of each run.
An Agilent 1260 Infinity HPLC coupled to a Bruker AmaZon X mass spectrometer [ESI
in positive ion mode; full scan 100-3000 m/z; end plate offset, -500 V; capillary, -4500
V; nebulizer gas (N2), 10 p.s.i.; dry gas (N2), 4 L/min; dry temperature, 180 °C] was
used for the analysis of isopyochelin samples on a homochiral stationary phase.
Synthetic isopyochelin and the ethanol extract of the S. coelicolor M1152/SV-
2_E03::SspI culture broth were analyzed on a ChiralPAK IE analytical column (4.6 ×
150 mm, 5 μm) in reverse phase mode. The solvents used for elution of the column
were as follows: solvent A, 0.1% formic acid in water; solvent B, 0.1% formic acid in
acetonitrile. The elution profile was as follows: 0-5 min, 20% B; 5-30 min, linear
gradient from 20% B to 100% B; 30-35 min, 100% B; 35-40 min, linear gradient from
100% B to 20% B. The flow rate was 0.8 mL/min.
Results of analyses
Metabolites with molecular formulae corresponding to pyochelin in the ethanol extract
of the S. coelicolor M1152/SV-2_E03::SspI culture broth had different retention times
from the four synthetic stereoisomers of pyochelin (Figure S6).

15
Figure S6. Extracted ion chromatograms at m/z = 325.0675, corresponding to [M+H]+
for pyochelin/isopyochelin from the ethanol extract of the S. coelicolor M1152/SV-
2_E03::SspI culture broth (A) and the synthetic mixture of pyochelin and neopyochelin
(B). Peak doubling results from epimerization at C-2", which gives rise to two
diastereomers for each compound.
LC-MS analyses on a homochiral stationary phase established the absolute
configuration at C-4" of isopyochelin (Figure S7). Two of the synthetic stereoisomers of
isopyochein derived from D-2-methylcysteine had the same retention times as the
natural product. This indicates that the stereochemistry at C-4" of isopyochelin
corresponds to D-2-methylcysteine and thus is S.
Figure S7. Extracted ion chromatograms at m/z = 325.0 (corresponding to [M+H]+ for
isopyochelin) from LC-MS analyses on a homochiral stationary phase of: (A) Synthetic
stereoisomers of isopyochelin derived from L-2-methylcysteine; (B) the ethanol extract

16
of the S. coelicolor M1152/SV-2_E03::SspI culture broth; (C) a mixture of the above
two samples; (D) Synthetic stereoisomers of isopyochelin derived from D-2-
methylcysteine; (E) a mixture of the samples in B and D. Natural isopyochelin exists as
a mixture of two diastereomers as a result of rapid epimerization at C-2".
Analysis of ethanol extracts of the ∆sven0508 and ∆sven0516 mutant strains
Figure S8. Extracted ion chromatograms at m/z = 339.0832 (A), 353.0988 (B),
210.0583 (C), 224.0740 (D) and 325.0675 (E), corresponding to [M+H]+ for
thiazostatin, watasemycin, aerugine, pulicatin and isopyochelin, respectively, from LC-
MS analyses of the ethanol extract of the ∆sven0508 mutant culture broth. Peak
doubling results from epimerization at C-2", which gives rise to two diastereomers for
thiazostatin, watasemycin and isopyochelin. The chromatograms show that production
of all of the 2-hydroxyphenylthiazoline-containing metabolites was unaffected by
deletion of sven0508.

17
Figure S9. Extracted ion chromatograms at m/z = 339.0832 (A), 353.0988 (B),
210.0583 (C), 224.0740 (D) and 325.0675 (E), corresponding to [M+H]+ for
thiazostatin, watasemycin, aerugine, pulicatin and isopyochelin, respectively, from LC-
MS analyses of the ethanol extract of the ∆sven0516 mutant culture broth. The
chromatograms show that production of all of the 2-hydroxyphenylthiazoline-
containing metabolites is abolished by the deletion of sven0516.
LC-MS/MS analysis of thiazostatin, watasemycin and their putative methyl ester
derivatives
An additional peak with a retention time of approximately 21.5 minutes can be observed
in the extracted ion chromatograms at m/z = 353.0988, corresponding to [M+H]+ for
watasemycin, from LC-MS analyses of the ethanol extract of S. coelicolor M1152/SV-
2_E03::SspI and the ∆sven0515 mutant (Figures 5B and 7B in the main manuscript).
Comparative LC-MS/MS analyses of thiazostatin, watasemycin and this additional
compound indicate that it is the methyl ester of thiazostatin (Figure S10). Similarly, the
methyl ester of watasemycin can also be observed in the ethanol extract of S. coelicolor

18
M1152/SV-2_E03::SspI (Figure S10).
Figure S10. Spectra from LC-MS/MS analyses of thiazostatin, watasemycin and their
putative methyl ester derivatives.

19
2.7 Analysis of the expression profiles of genes flanking the cluster
Figure S11. Microarray expression profiles of the genes flanking the watasemycin
biosynthetic gene cluster (sven0498–sven0502, top; sven0519–sven0527, bottom). Basal
levels of expression are observed throughout growth in both the S. venezuelae wild type
strain (left panel) and the bldM mutant (right panel). The y-axis represents normalized
transcript abundance.

20
3. References
(1) P. P. Cherepanov and Wackernagel, Gene., 1995, 158, 9-14.
(2) K. A. Datsenko and B. L. Wanner, Proc. Natl. Acad. Sci. USA., 2000, 97, 6640-
6645.
(3) D. J. MacNeil, K. M. Gewain, C. L. Ruby, G. Dezeny, P. H. Gibbons and T.
MacNeil, Gene., 1992, 111, 61-68.
(4) C. Stuttard, J. Gen. Microbiol., 1982, 128, 115-121.
(5) J. P. Gomez-Escribano and M. J. Bibb, Microb. Biotechnol., 2011, 4, 207-215.
(6) S. Boakes, J. Cortés, A. N. Appleyard, B. A. Rudd and M. J. Dawson, Mol.
Microbiol. 2009, 72, 1126-1136.
(7) B. Gust, G. Chandra, D. Jakimowicz, T. Yuqing, C. J. Bruton and K. F. Chater, Adv.
Appl. Microbiol. 2004, 54, 107-128.
(8) M. S. Paget, L. Chamberlin, A. Atrih, S. J. Foster, M. J. Buttner, J. Bacteriol. 1999,
181, 204-211.
(9) T. Kieser, M. J. Bibb, M. J. Buttner, K. F. Chater and D. A. Hopwood, Practical
Streptomyces genetics. John Innes Foundation, Norwich, United Kingdom. 2000.
(10) A. Zamri and M. A. Abdallah, Tetrahedron. 2000, 56, 249-256.