electronic spectroscopy of transient species in plasma
TRANSCRIPT

Electronic Spectroscopy of Transient Species
in Plasma Discharges
Inauguraldissertation
Zur Erlangung der Würde eines Doktors der Philosophie vorgelegt der
Philosophisch-Naturwissenschaftlichen Fakultät der Universität Basel
von
Pawel Cias aus Konskie (Polen)
Basel, 2004

Genehmigt von der Philosophisch-Naturwissenschaftlichen Fakultät
auf Antrag der
Herren Professoren John P. Maier und Jakob Wirz
Basel, den 10 Juni 2004
Prof. Dr. Marcel Tanner
Dekan

- Ile razy zaczna cie napastowac podobne mysli, idz do której z naszych swiatyn i
przypatrz sie jej scianom zatloczonym obrazami ludzi, zwierzat, drzew, rzek, gwiazd -
zupelnie jak ten swiat, na ktorym zyjemy. Dla prostaka figury podobne nie maja zadnej
wartosci i moze niejeden zapytywal: na co one? Po co rzezbia je z tak wielkim nakladem
pracy? Ale medrzec ze czcia zbliza sie do tych figur i ogarnawszy je spojrzeniem czyta w
nich historie dawnych czasow albo tajemnice madrosci.
- Whenever these thoughts start to haunt you, go to some of our temples and look
carefully at its walls overcrowded with pictures of people, animals, trees, rivers, stars -
exactly like the world we live on. For the simpleton these figures are worthless and
perhaps not one of them was asking: What are they for? Why are they carved with such
an effort? But a wise man approaches them with honor. He sweeps them with his eyes
and reads the stories of remote times or the secrets of wisdom.
Boleslaw Prus,
Pharaoh


Acknowledgements It gives me great pleasure to acknowledge the help and support that I have
received during the preparation of this thesis:
I would like to thank Prof. John P. Maier for giving me the opportunity to work in
his group. The excellent working environment and the essential resources to learn and do
research during the period of my study are greatly acknowledged. I would also like to
thank Prof. Jakob Wirz for his courteously agreement to act as my co-referee.
I am also particularly indebted to PD Dr. Harold Linnartz for his guidance and
invaluable assistance for the first 2.5 years of my study.
I express my profound gratitude to Tomasz Motylewski for familiarizing me with
the experiment and sharing his deep knowledge with me. Similar thanks are directed to
Olga Vaizert-Peter.
I would like to express my appreciation to Mitsunori Araki for an invaluable
help; and to my colleagues from the crds-lab: Alexey Denisov and Elena Achkasova for
very nice collaborative work.
I would like to also thank Lucia Grüter and Patrick Furrer for their fruitful
cooperation.
I am also grateful to the people who were technically involved in the experiment
for their effort and patience. The generous offer of their experience and knowledge is
most deeply appreciated. My special thanks are especially directed to Karl Mutschler
from the mechanical workshop for his service and extraordinary skills in constructing
sophisticated technical devices; and to Georg Holderied for his help on the field of the
electronics. I also feel especially indebted to Jacques Lecoultre not only for synthesizing
huge amounts of exotic isotopic substances, which were used in the experiments, but also
for priceless lessons and showing me that studio photography is not always so easy as it
sometimes seems to be.

I am happy to acknowledge the aid of Esther Stalder and Daniela Tischauser from
the secretary office for their invaluable assistance in making my life easier. Die
uneingeschränkte Hilfe Meiner G...en Sekretärin ist besonders geschätzt!
I am also very grateful to Marek Tulej and Marek Mac for introducing me into the
complicated world of dark triplet states (30-90-2.70 type) and so called "vein
excitations".
I would also like to express my thanks to Jan Fulara and Przemyslaw Kolek for
their help and interesting discussions.
My friends Lukasz Chacaga, Joanna Banas and Olga Kondrateva are sincerely
thanked for their remote but invaluable spiritual and mental support.
I would also like to express my gratitude to Katarzyna Kita Tokarczyk and
Bogdan Tokarczyk. They are openly thanked for a nice and very friendly “Structure”.
Arkadiusz Welman and Ivan Schnitko are thanked for the mutual hours spent on
the improvement of the body and the soul by means of an iron equipment.
Roxana Stoenescu and Petre Birza are thanked for a touch of the mysterious
Romanian Spirit they brought.
I would like to express my thanks to Jennifer van Wijngaarden, Stephanie Dion
and Alexander Kabanov for the linguistic corrections of the manuscript.
I would like to direct my special thanks to Dragana Zivkovic for the magnificent
esthetic values she provided.
As the list of the people to whom I am indebted seems to be endless, at the end I
would like to thank ALL the good folks who helped me do this job.
The Swiss National Science Foundation and the City of Basel are thanked for the
financial support.
Pawel Cias

Contents
0. Introduction 5
0.1.Motivation and objectives of this thesis 5
0.2. Structure of the manuscript 6
1. History and a brief description of Diffuse Interstellar Bands 7
1.1. Parameters of DIBs 9
1.2. Doppler splitting 10
1.3. Dependence on reddening 11
1.4. Skin phenomenon 12
1.5. Families of DIBs 12
1.6. Spacings 14
1.7. Review of proposed carriers 14
1.7.1. Solid particles 15
1.7.2. Free molecules 16
1.7.3. Polycyclic aromatic hydrocarbons 17
1.7.4. Carbon chains 19
1.7.5. Fullerenes 21
1.7.6. Porphyrins 22
1.7.7. Conclusions about carriers 23
1.8. Relations between the continuous extinction and DIBs 24
References 28
2. Supersonic jet phenomenon and its application in spectroscopy of
transient radical species 31
2.1. Circular nozzles 33
2.2. Planar nozzles 33
2.3. Continuous and pulsed jets description 34
2.3.1. Continuous Jets at Low Pressure (P1 ~ 10-3 - 10-4 Torr) 35
2.3.2. Pulsed Jet and Beams (P1 ~ 10-4 - 10-6 Torr) 38

2.3.2.1.Alternative Approach Based on the Creation of a Free-Jet
Zone o Silence in a Relatively High-pressure Environment
(P1 ~ 10-2 – 1 Torr) 38
2.4. Spectroscopy of cold radicals 41
References 43
3. Cavity ringdown method - principles and applications 47
3.1. Principles of cavity ringdown 49
3.2. Applications of cavity ringdown method 52
Appendix to chapter 3 53
References 60
4. Experiment 63
4.1. Lasers 63
4.1.1. Calibration 65
4.2. CRD cavity 66
4.2.1. Mirrors 67
4.3. Detection system 67
4.4. Data acquisition system 68
4.5. The vacuum chamber 68
4.6. Discharge source 68
4.6.1. Heating system for B3 production 69
4.6.2. Gas mixing system 69
4.6.3. High voltage power supply 71
References 72
5. Studies of HC2nH+ species 73
5.1. Matrix studies 76
5.2. Gas-phase study of the pentaacetylene cation 78
References 83
6. Boron and its clusters 85
6.1. Experimental and theoretical studies of small boron clusters 86
6.2. Experimental and theoretical studies of the triatomic boron-rich
clusters 94
6.3. Theoretical and experimental studies of B3 and its ions 96
6.3.1. Gas-phase study of cyclic B3 100
Appendix to chapter 6 115
References 118
7. Summary 123
8. Publications 125
9. Curriculum vitae of the author 149


0. Introduction
0. 1. Motivation and objectives of this thesis
The first major objective of this work is to expand previous measurements carried
out by means of pulsed cavity ringdown experiment toward longer carbon chains of
astrophysical relevance. So far cavity ringdown spectroscopy in a supersonic slit jet
plasma has been applied to obtain gas phase electronic spectra of a broad range of pure
and substituted carbon species. The electronic spectra of the linear chains of the
following species were already measured and analyzed: Cn, C2nH, NC2nN+, HC2nN,
NC2n+1N, HC2nH+. As the direct absorption measurement does not distort either the shape
nor the intensity ratios of measured bands these spectra can be easily used for comparison
with diffuse interstellar bands (DIBs). Because these comparisons were not successful so
far (no exact match laboratory spectra with DIBs was found), a further effort had to be
put in the search of the molecules that could be a carrier of these mysterious interstellar
bands. Because recent studies showed that probability of finding the potential carrier is
higher in the case of the longer chains, it seemed quite reasonable to try to look for it in
the mentioned before group of carbon chains with higher number of carbon atoms.
Especially tempting appeared the idea of obtaining the spectrum of pentaacetylene
cation as the matrix experiment results showed that its origin band fits the technical and
optical possibilities of the pulsed CRD experimental set-up. The spectrum of HC10H+
could be then compared with the astrophysical data in order to check if there is some
match with DIBs or not.
The second major part of this work deals with the search for the gas-phase
electronic spectrum of the cyclic B3 molecule. The molecule is of interest because several
of the excited electronic states are degenerate in D3 symmetry. As a consequence, this
should undergo the Jahn-Teller effect. The spectrum of B3 was already measured in neon

matrix and it showed a complex vibronic structure. Unfortunately, the resolution of the
matrix spectra is not sufficient for deep analysis of that effect. Thus a high resolution
spectrum in the gas phase is required. As a gaseous precursor could not be used for the
production of B3, there was a need for a modification of the experimental set-up.
This studies on HC10H+ and the technical development of the apparatus leading to
the obtaining and analyzing of the cyclic boron trimer gas-phase spectrum will be
described in detail later.
0. 2. Structure of the manuscript
In the first chapter the brief description of the diffuse interstellar bands is
presented. It gives a summarized state of knowledge about DIBs and a brief compilation
of the present hypotheses concerning their possible carriers.
The second chapter is devoted to the supersonic jet technique. The theoretical
principles, origin, further development and variety of its applications in the gas phase
spectroscopy are briefly described.
The third chapter describes physical principles, origin and applications of cavity
ringdown spectroscopy. It shows that this method is a powerful and effective tool in
varied branches of modern spectroscopy.
The next chapter covers the description of the experimental set-up used for
present studies. At first, the principles of operation are shortly described then the whole
set-up is depicted in technical detail.
In the next chapters the results attained by means of cavity ringdown are
presented. The brief reviews of carbon cation chains (HCnH+), pure boron clusters (Bn)
and boron reach clusters studies are presented. They are followed by the results
concerning CRD investigations of the HC10H+ and B3 species.
The last chapter presents a summary of this work.

CHAPTER 1
1. History and a brief description of Diffuse Interstellar Bands The discovery of visible diffuse absorption bands in stellar spectra dates back to
the pioneering years of stellar spectroscopy. In 1922 the original report on the discovery
of two spectral features, centred near 5780 Å and 5797 Å in spectra of some spectroscopic
binaries was published by Heger [1]. These discovered features were considered as
interstellar ones, however, it was only in the 1930s when the works of Merrill [2-4]
confirmed this hypothesis. He demonstrated that these puzzling features did not
participate in the velocity variations of spectroscopic binaries and furthermore their
strength increased with distance and with the degree of the interstellar reddening of the
star that furnished the background continuum. That evidence was reinforced by the work
of Beals, Blanchet [5], Baker [6], and especially by the extensive study of the feature
centred at 4428 Å by Duke [7]. These stationary features were named Diffuse Interstellar
Bands (DIB). The term diffuse reflects the common characteristic of all known features;
namely their profiles are conspicuously broader than those of interstellar atomic, ionic or
molecular lines. This broadening of the profiles of DIBs is presumably due to unresolved
rotational structure, possibly compounded by lifetime broadening of the upper states.
However, it must be emphasized that they are usually narrower than broad lines
originating in atmospheres of fast rotating stars. There exists a great variety in their
profiles and intensities so they can not be readily described, classified, or characterized.
To the present day no reliable identification of the DIB carriers has been found. Many
carriers have been proposed over the years but none of them has withstood general
scrutiny. They ranged from dust grains, to free molecules of very different sizes and

structures, even to the hydrogen negative ion [8]. There is a respectable body of opinion
that a single carrier can not be responsible for all DIBs. However, it is very hard to
estimate how many carriers can produce the observed DIBs. The problem is further
complicated by the fact that to this day it is still impossible to find any laboratory
spectrum of any substance which would match the astrophysical spectra. The most
convenient for study are DIBs observed in spectra of the slightly reddened, bright stars.
These stars are most likely to be obscured by single clouds and one can presume
that the obscuring medium is homogeneous, i.e., characterized by narrow range of
physical parameters (temperature, column density, velocity, inner structure, shape and
size of dust grains, chemical composition, etc). Bright, near-by stars obscured by one
cloud would be the most appropriate candidates for the study of DIBs, however, number
of such stars is limited. It is essential to mention that accessible early types stars are
usually either very distant or slightly reddened, thus the molecular features of spectra are
either formed in several clouds along any sightline or are too weak to be measured with
proper precision. When several clouds are situated along a sightline, astronomers get the
"average spectra" and their interpretation is difficult. The next problem which must be
taken under consideration is contamination of interstellar spectra with so called "telluric
lines". They are lines and bands of the atmospheric origin. Many of DIBs occur in
regions masked by atmospheric O2 and H2O lines, so overlying atmospheric structure has
to be properly removed. In order to do it, one has to divide a given spectrum by a
spectrum of the standard star (e.g. unreddened αPeg or αCyg stars). The number of
known DIBs keeps growing. The first survey of DIBs was published in 1937 [9]. In the
year of 1975 the major survey of DIBs was published by Herbig [10]. It contained 39
DIBs (twenty of them were observed for the first time) detected in the range of 4400-
6700 Å. All these features were clearly seen in the spectrum of the heavily reddened star
HD183143. The replacement of photographic emulsion by solid state detectors (CCD) for
stellar spectroscopy has resulted in the detection of many new DIBs. Set of few features
known in 1930s got much bigger and now the number of DIBs is around of three
hundred. In his new survey [11] Herbig placed over 130 features and Krelowski et al.
[14] added to this wealth of data yet another 52 weak DIBs. As was said before, there

exist about 300 DIBs, however, existence of some of them is not sufficiently proved. On
the other hand, many features still wait for their discovery.
1.1. Parameters of DIBs The main parameters describing DIBs are:
λ - the wavelength of the feature (approximately central wavelength of
band in Å),
Ac - the central depth of the band (described by percent of the continuum
level),
FWHM - the full width (in Å) of the band at its half-maximum,
Wλ - the equivalent width in Å or mÅ, ( it describes width of a
hypothetical line of the same area, of a rectangular profile, and normalized
to unity). The ratio of equivalent width reflects the ratio of the oscillator
strength when DIBs are due to one carrier.
The profiles of the majority of DIBs are relatively narrow (their FWHM is usually
of the order of few Å), however wider bands also can be found in some spectra. The
broad 6177 DIB (FWHM ~ 30 Å) in the spectrum of HD183143 star may serve as an
example. Most of the DIBs are located in the wavelengths longer than 4430 Å. The
central depths of majority of DIBs are of the order of 1-2 % of continuum but there are
few exceptions, e.g. the central depth of 5780 DIB in some spectra reaches 30%. The
parameters describing DIBs are not stable and vary from one line of sight to another.
Jenniskens and Desert in their survey of DIBs [73] showed that value of the equivalent
width may change drastically. For the strong 5780 DIB it varies from 0.11 (target star -
HD30614) to 0.72 (target star HD183143). It should be noted that there are also
differences in values of the parameters obtained by different authors. Comparison of
equivalent widths of DIBs collected by Jenniskens and Desert with the data of Herbig
shows a small systematic difference.

5770 5780 5790 5800 5810
HD 149757 (ζOph)
.
5797
5780
HD 147165 (σSco)
λ [A]
Figure 1.1. DIBs 5780 and 5797 in the spectra of HD 149757 and HD 147165 stars.
These bands appeared in the table of the stellar features published by Heger in 1922 [1],
and were regarded as “possibly stationary”. (Spectra marked by appropriate target stars.)
1.2. Doppler splitting The problem of the profile determination arose after the CCD new detectors were
widely applied to record astrophysical spectra. The high resolution and S/N spectra
revealed that the Doppler effect changes the DIB profiles. The broad profiles of the bands
are only slightly altered and only in the case of very sharp DIBs the Doppler splitting can
be observed.
In 1982 Herbig and Soderblom [15] have shown the composite profiles of 6196
and 6614 DIBs and proved that the Doppler splitting may change the profiles of these
narrow bands. There is a great diversity in the velocities and physical properties of the
interstellar clouds. That is why the interstellar features in the spectra of distant, heavily
reddened stars are permanently contaminated with the Doppler splitting. For example it
was observed in the case of the 6196 Å band in the HD102997 spectrum. It was shown
that this splitting follows the splitting of the interstellar line D1 (line of neutral sodium).
Precise analysis of the profile of this interstellar atomic line has shown that this star is

obscured by at least seven clouds. The Doppler modification of the 6196 DIB profile is
not strictly followed by the same splitting as at in the D1 line. It may indicate that the
carrier of the 6196 DIB is not present in all these clouds containing neutral sodium.
In spite of the fact that astronomers do not really know a true distribution of the
DIB carriers in the individual clouds, precise analysis of the interstellar lines is a very
useful method of determination of alteration in the DIB profiles.
The sodium D1 and D2 lines are very strong and sharp, and that makes them
especially handy in the perplexing task of estimating the number of clouds between a
target star and an observer. It is established that the Doppler splitting is one of the proofs
that DIBs are the features of the interstellar origin. The Doppler effect is not one and only
cause of broadening of DIBs. In 1992 Porceddu et al. [16] found the exceptionally broad
profiles of 5780 DIB in the spectra of the stars belonging to the Orion Trapezium. The
broadening of the bands in this case would have not been explained by the Doppler
effect. It seems that a matter surrounding these stars differs substantially in physical and
chemical properties from that producing normal diffuse interstellar bands.
1.3. Dependence on reddening The first careful correlation analysis of dependence of the DIB strength on
reddening was carried out by Deeming and Walker in 1967 [17]. They studied DIB 4428.
The similar work was done by Murdin [18] for DIB 6283. It appeared that the
dependence of one upon the other is not tight.
The advent of digital detectors in the 1980s revolutionized subject of gathering
reliable data, however, this major step in the precision of the DIB spectroscopy did not
greatly reduce the scatter around a mean regression line relating the DIB strength to
colour excess. Nonetheless, it has reinforced the finding that the two are, in the mean,
proportional one to another. Despite this dispersion, dependence obtained during the
study shows clearly that when E(B-V) diminishes to zero, the strength of DIBs does the
same. The colour excess, called also the reddening is defined as a difference in value of
extinction measured in two photometrical bands, e.g. B and V (4400 Å and 5500 Å,

respectively). It is the most popular and convenient quantity characterizing the interstellar
matter.
1.4. Skin phenomenon Snow and Cohen were the first to indicate that stars seen through very dense
clouds have DIBs weaker than would be expected from their colour excess. In 1974 they
concluded that formation of the carrier is inhibited in cloud interiors [19].
This effect known as the "skin phenomenon" is conspicuous, e.g. in heavily
obscured stars of the Cyg OB2 association. The study of the DIB behaviour in dense
clouds was also carried out by Adamson et al. [20]. They observed the number of stars of
different degrees of extinction through the Taurus clouds. The precise investigations of 6
DIBs showed that their normalized equivalent widths (i.e. W/E(B-V) ) fell progressively
below the diffuse-cloud value as the extinction increased. Adamson et al. believed that
this result can be explained only by the concentration of the DIB carriers in the surface
layers of the clouds, possibly due to the reduction of the ambient radiation field in the
cloud interiors. It is very interesting that the concentration of neutral hydrogen also
diminishes as we go towards the centre of the cloud. Since the DIB strength is correlated
to the concentration of neutral hydrogen, it seems that the idea of the "skin effect" is well
supported. On the other hand, there exist stars whose spectra have DIBs stronger than
expected (when inferred from their colour excess). These observations still can not find
any reasonable explanation.
1.5. Families of DIBs The fluctuations in the individual bands strength from one line of sight to another
(Figure 1.1.) once again indicate that more than one carrier of DIBs is involved. The first
indication of a pattern in these discrepancies was published by Chlewicki et al. in 1986
[21]. They observed a number of early type stars in 3OB associations and divided DIBs
into two classes:

I. 5797 and 5850 (well correlated with colour excess),
II. 5780, 6195, 6203, 6269 and 6283 (which showed much weaker dependence on
colour excess, but the good correlation with each other).
Krelowski and Walker defined so called families of DIBs, i.e., sets of features
observed always together and with the same strength ratios [22]. Each group of related
bands ought to be responsible for one carrier so such a division into families seemed very
helpful in the eventual identification of that substance. Nevertheless, the correlations
between the DIBs are not always tight and convincing.
The groupings proposed by Krelowski and Walker are:
I. Broad and shallow DIBs 4428, 6177, and probably 4882,
II. Relatively symmetric DIBs 4763, 4780, 5362, 5449, 5487, 5780, 6195, 6203,
6269, 6283,
III. Asymmetric DIBs 4726, 5545, 5797, 5849, 6376, 6613, and possibly 5494,
5508, 6379.
They were based on only four stars and not on an analysis of their mutual correlations.
Josefatsson and Snow on the basis of 59 stars carried out an analysis of the mutual
correlations, and of the individual correlations with E/(B-V). The region 5690-5870 Å
was investigated [23].
Despite such an impressive examination of a large body of data, they did not
provide any stronger evidence for the existence of families. They defined only three
classes of DIBs:
I. The narrow DIBs 5780, 5797 and 5849 (correlated with each other and with
colour excess),
II. Broad bands 5778, 5844 (well correlated with each other but very poorly with
E/(B-V) ),
III. 5705 (poorly correlated with other DIBs and with colour excess).
The survey of the measurements of stronger DIBs done by Mouton et al. [24]
clearly suggests that usually any pair of two DIBs is correlated up to some degree. (The
degree of correlation is higher when the widths of two features are similar.) It ought to be
mentioned that one has to be very cautious in such a kind of classification. Josefatsson

and Snow placed 5780 and 5797 DIBs into the same family while Krelowski and Walker
put them into two different classes. Generally, the limited amount of high quality spectra
makes the list of the "family members" very unstable.
1.6. Spacings
The frequency analysis of the wavenumber spacings of DIBs, in search for
preferential level separations, did not produce any useful information. Partly because of
the concentration of DIBs in certain wavelength regions, and partly because of the gaps
in spectra caused by atmospheric and interstellar interferences. Search for the vibrational
sequences of the type ν' 0 did not produce any convincing results either [8]. The only
regularities that have been found so far in the DIBs spectra are those noticed by Herbig in
the short series of weak, approximately equally spaced DIBs in the 6800 Å region [25],
and the similar sequence near 5780 Å recognized by Jenniskens and Desert [26].
Although such regularities may turn out to be helpful, there is no strong evidence that
these sequences exist for real. The proper investigations are complicated by the possible
existence of multiple overlapping features which makes any results not convincing.
←
1.7. Review of the proposed carriers
One carrier can not be responsible for all known DIBs. That fact is widely
accepted, however, the open questions are: how many carriers may be involved in
producing all of the DIBs, and what is the phase of that mysterious substance. Dust grains
or free molecules were usually proposed as the potential carriers of DIBs, however, now
it seems that scientist should search for the carriers somewhere "in between." The
carriers may be crucially important in interstellar chemistry: they may constitute a
significant fraction of all chemically bonded matter in the interstellar gas, and many may
be molecules larger than any so far identified. Nowadays it is believed that they are long
carbon chains or polycyclic aromatic hydrocarbons. Although additional theory and

astronomical observations are needed, the identity of the carriers is now essentially a
problem in laboratory astrophysics. Here is a brief review of the proposed carriers. Some
of them are rather outdated and gone into oblivion, while others (e.g. carbon chains or
PAHs) are still intensively studied and investigated as the potential carriers of DIBs.
However, even in that case, no convincing proof had been found so far.
1.7.1. Solid particles It has long been known that some solids, such as crystals doped with metal ions,
can produce narrow absorption lines at low temperatures. In 1979 Duley [27] studied the
spectra of Cr3+ ions in MgO crystals, for which certain transitions between levels of the
ground state were expected to produce narrow lines in the 7000 Å region. However, no
interstellar lines at these wavelengths have been found [8], and in fact there is no
evidence that interstellar crystalline MgO exists in the quantity required [28-29].
The ion Fe3+ also has been proposed as a potential carrier of few stronger DIBs
[30], however, mineral in which they were doped (garnet) is an implausible constituent of
the interstellar grains because of the conditions under which it is formed on the Earth
[31]. A more appealing idea was that the DIB carriers might be dispersed as an impurity
through the spherical dust particles and the electric field of the crystal lattice in which
such an atom would be imbedded could shift and split the atom's energy levels. It should
be noticed that such theories do not specify what the impurity atom might be. In 1969
Duley and Graham [32] carried out experiments in which Ca atoms in a matrix of solid
benzene produced a broad absorption feature near 4500 Å. (Ca resonance line is located
at 4227 Å). The molecules of Ca2 in benzene and other hydrocarbons showed a variety of
absorptions, some of which lie not far from the positions of known DIBs. All these
laboratory experiments, however, produce absorption bands which are much broader than
the broadest DIBs. These nonconclusive experimental data are not the only reason to
doubt that DIBs originate in the dust grains. Lack of tight correlation between the
strength of DIBs and colour excess suggests that the grains of different sizes should be
involved in producing DIBs. On the other hand it stands in contradiction to well proved
constancy of the DIB profiles in many different interstellar environments. Furthermore,

the absence of the detectable change in interstellar polarization across some of stronger
DIBs shows that these features do not originate in the aligned grains responsible for
polarization of light in the optical region [33].
1.7.2. Free molecules The detection of the first interstellar diatomic molecules (CN and CH) came few
years after the interstellar origin of DIBs was demonstrated. Stimulated by that discovery,
a number of the specific molecular carriers were proposed. Some of these proposals were
based on near-agreement with gas-phase laboratory wavelengths, while others have come
from a less direct reasoning. The list of specific molecules that had been suggested is
very long, however, none of these have received enthusiastic support. Table 1.1. contains
some examples of molecules suggested as the potential carriers of DIBs. The reason to
favour gas-phase molecular carriers is the possibility of explanation of the difusseness of
DIBs. It is very reasonable to suspect that the widths of DIBs represent the unresolved
rotational structure. If so, then excited rotational levels of the lower state must remain
populated at temperatures and densities of diffuse clouds. Danks and Lambert [34]
estimated such closely spaced rotational levels of a hypothetical, large molecule and
came to conclusion that such conditions would be met for the lowest 10-20 levels. So
they tried to reproduce the observed profiles of the relatively narrow DIBs at 5780 Å and
5797 Å. The attempt to fit the contour of the much broader 4428 Å turned out to be
unsuccessful. The second explanation of the widths of DIBs could be that the upper
energetic states of the molecule have very short lifetime. In 1955 Herzberg [35] remarked
that the ionization potentials of negative ions such as O- or C- are low enough so the
preionization transitions would occur in the optical region, but the laboratory experiments
carried out by Ensberg and Jefferts in 1979 [36] found no transitions of O- or C- at the
wavelengths of several prominent DIBs.

Molecule Author and year of publication.
CO2 Swings, 1937
Na2, NaK Saha, 1937
(O2)2 McKellar, 1960
NH4 Herzberg, 1955
O-, C- Herzberg, 1955
CH4+ Herzberg, 1955
H- Rudkjobing, 1969
HCOOH+ Herzberg, 1988
Table 1.1. Free molecules considered as the potential carriers of DIBs.
Herzberg also mentioned the possibility that the predissociation of some
polyatomic molecules could produce diffuse bands in the optical region, however, the
predissociation itself would have to destroy the absorber. To maintain its sufficient
concentration, a fast process of recombination would have to exist. Unfortunately under
interstellar conditions no efficient process of such a recombination had been known. This
difficulty became less severe when the importance of the very rapid ion-molecule
reactions for interstellar chemistry was recognized.
1.7.3. Polycyclic aromatic hydrocarbons
In the 1980s many specialists proposed polycyclic aromatic hydrocarbons (PAHs)
as potential carriers of DIBs. This idea was put forward independently by Van der Zwet
and Allamandola [37] and by Leger and d'Hendecourt [38]. The possibility of ionized
PAHs being the carriers of DIBs was proposed by Crawford, Tielens and Allamandola
[39]. The essential points that make PAHs very promising molecules are:
- the survivability of the larger PAHs molecules against photodissociation in the
interstellar radiation field,

- abundance of carbon in the interstellar medium sufficient enough to account for
the DIB strength,
- neutral, and particularly ionized PAHs are known for the strong electronic
transitions in the optical region.
The efforts to obtain astronomically relevant data are nowadays mostly focused
on the investigations of the following molecules:
- naphthalene (C10H8) and its cation (C10H8+),
- pyrene (C16H10) and its cation (C16H10+),
- phenantrene cation (C14H10+),
- coronene (C24H12) and its cation (C24H12+),
- ovalene (C32H14) and its cation (C32H14+).
Neutral naphthalene does not absorb in the visible region, but the cation produces
series of bands, the strongest at 6741 Å, followed by weaker features at 6520 Å and 6151
Å [40]. However, none of the more prominent DIBs are matched by these peaks obtained
in the laboratory. In 1999 Romanini et al. obtained the first gas-phase electronic
absorption spectrum of an ionized naphthalene. This study showed that there is no
correspondence between the DIBs and strong absorption bands of C10H8+ [41].
Neutral pyrene also does not absorb in the visible region, however, its cation
exhibits more promising possibility. In the neon matrix the spectrum is dominated by a
strong absorption band centred at 4395 Å, while in the argon matrix this peak is slightly
shifted longward to 4435 Å. Although this result is interesting (very good coincidence of
latter peak with 4428 DIB), one should be cautious in interpretations. Authors of the
experiment were inclined to state that this coincidence might be due to chance [40].
Absorption spectra of coronene, ovalene, and their cations have been described by
Ehrenfreund et al. in 1992 [42]. Similar experiments were carried out by Salama and
Allamandola in 1993 for phenantrene cation [43]. Unfortunately, none of the features
found in the optical region match any of the DIBs wavelengths. All those investigations
focused on specific PAHs, but in the interstellar clouds a mixture of compounds might
be expected as well. Taking that fact into account Ehrenfreund et al. examined the

absorption spectrum of a neutral coal pitch extract deposited in a solid neon matrix [44].
This material was distilled from coal, and consisted of a mixture of about 150 different
aromatic molecules among which compounds such as CmHn (where m = 14-24, and n =
10-14) were present in percentages of 2% or more. Only few discrete bands were found
between 3800 and 4700 Å, and there were no convincing coincidences with known DIBs.
This result is interesting, however, it stands in contradiction to the results of the earlier
works that firmly showed that PAHs' ions are expected to have the strong transitions in
the optical region. Sarre suggested that negative ions of PAHs might be also responsible
for the DIB origin [45]. Supporting calculations made by Lepp and Dalgarno [46] showed
that in the cloud interiors, negative PAHs' ions might be comparable in abundance with
neutral PAHs. This calculations depend on an assumed value for the rate of cosmic-ray
ionization, which provides the free electrons. However, there is a strong objection to that
idea. Namely, as Snow and Cohen noted, the DIB concentration is lowest in cloud
interiors [19]. Nevertheless, the laboratory studies of the spectra of some plausible anion
of PAHs might be very interesting.
1.7.4. Carbon chains In 1977 Douglas suggested that polycarbon chains such as C5 , C7 and C9 might
survive under interstellar conditions [47]. He remarked that the means by which it might
happen is the internal conversion. That process enables the radiationless transition to take
place from the excited level to vibrational levels of the same or another electronic state,
following which the absorber returns to the ground state by a series of infrared
transitions. Douglas also suggested that such carbon chains should produce strong diffuse
absorption bands in the 4000-5000 Å region. The hypothesis that carbon chains might be
a carrier of some of the DIBs was strongly supported by the fact that these species fulfill
the requirements which are imposed on the potential carrier. The advantages of this
hypothesis are following:
- the carriers are associated with stable molecules, which are composed of one of
the most abundant element in the interstellar space

- carbon chains absorb in the visible region
- these species exist at least in some interstellar regions
These suggestions were firstly pursued in the laboratory by Kratschmer, Sorg, and
Huffman in 1985 [48] and subsequently by Kurtz and Huffman in 1990 [49]. Carbon
molecules obtained by vaporization of graphite (Cn , where n = 4-9) and then deposited
into a cold argon matrix produced a series of absorption bands centred at 2471 Å (the
strongest), 3079, 3490, 4470 Å (weaker) and 4930, 5860 Å (very weak). Since the matrix
shift estimated by Kratschmer et al. is about 50 Å, the band 4470 Å matches DIB 4428
very well.
In 1998 Tulej et al. measured the gas-phase electronic spectra of several carbon
chain anions [50]. They obtained spectra of C6-, C7
-, C8-, and C9
- containing many narrow
bands which appear to match some DIBs. Most intriguing coincidence was found for the
bands of C7- anion and several DIBs where the DIBs have similar widths and relative
intensities. However, new data obtained by McCall et al. in 2001 showed that C7- must be
rejected as a potential carrier of DIBs [51]. There were strong chemical arguments
against this hypothesis: chemical models of Ruffle et al [52] were unable to reproduce
necessary abundance of C7-, even with the most favorable assumptions. New
measurements of DIBs positions showed that the origin band of C7- does not match 6270
DIB either in wavelength or profile. Some vibronic bands also do not match perfectly
DIBs. Additionally, one of the DIBs, attributed to the vibronic band of C7- turned out to
be a stellar line.
Mitchell and Huntress went a bit further and proposed hydrocarbon chain
molecules of up to C12Hm (where m was unspecified) as the species that might be
responsible for at least some of the DIBs [53]. Laboratory investigations of the analogous
molecules were also carried out by Motylewski et al. Using the cavity ring down
spectroscopy combined with the supersonic slit nozzle discharge they obtained spectra of
C8H and C10H chains. Although numerous absorption bands were observed, their
coincidence with known DIBs is not too convincing [54]. In 1994 Freivogel et al.
obtained the spectra of carbon-chain anions [55]. The CnHm- anions (where n = 14, 16
and m < 3) spectra show many correspondences with some of the DIBs. Particularly

striking are coincidences in the region 7000-8000 Å where nine bands match very well
DIBs listed by Herbig and Leka [8]. However, it must be again emphasized that with the
accuracy of measurements of the matrix and astrophysical spectra these overlaps may be
only coincidences.
In 2004 Maier et al. [56] summarized the current situation in the context of
laboratory studies carried out in recent years on not only bare carbon chains, but also
their ions and simple derivatives containing hydrogen or nitrogen. The results of their
analysis led to interesting conclusions about the role of carbon chains as potential carriers
of the diffuse interstellar bands. First, it was suggested that the abundance and oscillator
strength of shorter chains (approximately up to 10 atoms) are too small to account for the
stronger DIBs. Second, because of the electronic configurations of these open-shell
species, the lowest energy - transition does not have a large oscillator strength but the
higher energy one in the UV does, and the chains would have to be prohibitively long for
these absorptions to shift into the DIB 4000 - 9000 A wavelength region. The exceptions
are closed-shell systems such as the odd-numbered bare carbon chains, and the ones in
the C15 - C31 size range that have their very strong transitions in this region.
1.7.5. Fullerenes
After the laboratory detection of fullerene C60 in 1985, the extensive study of that
large molecule started to take place. Because of the readiness with which fullerens can be
produced under a variety of laboratory conditions, it seemed reasonable that such
molecules could also occur in the interstellar medium. For this reason Kroto et al. [57]
speculated that fullerene C60 might be the potential carrier. This idea was very appealing
because such heavy molecules could easily explain the broadening of DIBs. Their small
rotational constants make it possible for a large number of rotational levels to be
populated at interstellar temperatures. Thus their absorption bands would appear as
diffuse and unresolved. Unfortunately, the laboratory experiments carried out by Leach et
al. [58] showed that there is no agreement in position between the laboratory spectrum of
C60 and the known DIBs.

Ballster, Antoniewicz, and Smoluchowski proposed that DIBs can be produced by
the resonance lines of common neutral atoms (e.g. Si or Mg) trapped in the C60 cages
[59]. These resonance lines would be shifted to the longer wavelengths on account of the
depression of the upper state by the electric field of the cage. Since the ionization
potential of C60 is about 7.6 eV, so most of these molecules should be singly ionized
under interstellar conditions. That is why the cation C60+ also has been proposed as the
DIB carrier. Unfortunately, Fulara et al. showed that there is no laboratory evidence for
the strong C60+ transitions between about 3100 and 9000 Å, so this cation can not be
responsible for DIBs in the optical region [60].
In the early 1990s it was also suggested that C60Hm (where m ≥ 1) might be an
appropriate molecule, but the spectrum of C60H2 obtained by Henderson and Cahill
showed that there are no significant differences from that of pure C60 [61]. However,
McIntosh and Webster have estimated that under interstellar conditions m may be
somewhere between about 10 and 30 [62], therefore potential spectra would be changed
more radically, but to this day no laboratory spectra of such species are known.
1.7.6. Porphyrins One of the more unusual proposals as to the identity of the DIB carrier was
advanced by Johnson in 1972 [63]. He suggested that bis-pyridyl-magnesium-tetrabenz-
porphyrin (MgTBPp) might be the feasible molecule. In his experiment (the MgTBPp
molecule was suspended in a frozen hydrocarbon matrix) he obtained the spectrum
containing three strong absorption bands centred at 4428 Å, 6284 Å, and 6174 Å that
matched very well the prominent DIBs. Johnson claimed that the wavelengths of 25
DIBs could be reproduced by transitions between the vibronic levels of that molecule.
Similar work was done for H2TBP and MgTBP molecules [64]. The drawback of these
schemes is that temperature of the interstellar medium is much lower than those required
to make such an excitation possible.
In 1980 Donn and Khanna [65] repeated the laboratory experiments of Johnson.
They confirmed the existence of strong absorption bands near 4400 Å and 6300 Å,
however, the band centred at 6174 Å was not detected. Despite these results, authors of

the experiment were inclined to state that such a complicated molecule as MgTBPp could
not form and survive under interstellar conditions, particularly at the temperatures
required by Johnson's hypothesis. In 1993 Miles and Sarre noted [66] that molecule of
dihydroporphyrin (C20N4H16) has a strong electronic transition that in the supersonic jet
lies at about 6284 Å which matches very well the 6283 DIB. In a polystyrene matrix, the
same feature occurs at 6381 Å, and by applying the same matrix shift to a number of
weaker bands, Miles and Sarre found a near agreement with the wavelengths of the 6177
and 6010 DIBs.
1.7.7. Conclusions about carriers
This brief review of the proposed carriers clearly indicates that despite intensive
astrophysical observations and laboratory study all of them may be regarded as mere
"putative" ones. It must be emphasized, however, that of all proposed carriers two of
them seem to outrun the rest in feasibility. Namely, carbon chains and polycyclic
aromatic hydrocarbons. It is now clear that the DIBs can not be explained by the early
concept of a single carrier owing to the large number of bands detected and the lack of
correlation between the bands. The present consensus, based on high-resolution
astronomical observations, is that the carriers are large carbon-bearing gas phase
molecules in either the neutral or/and ionized forms and that these molecular carriers are
part of an extended size distribution of the interstellar dust. At the moment it is difficult
to say which group of the molecules could be really responsible for DIBs (PAHs or
carbon chains), however, it looks like they should be involved into the “business” of
DIBs carriers. They both are relatively large carbon-containing molecules with a variety
of the intense absorption bands in the IR-VIS region and both are ubiquitous in diffuse
interstellar clouds. It should not be forgotten, however, that the high density of DIBs in
the optical region makes any accidental coincidence very possible. It becomes even more
conspicuous when one takes into account both the tolerance of a wavelength match, as
well as the uncertainties in the DIB wavelengths themselves. So one should be cautious
in formulating radical conclusions as to what molecules the DIBs carriers really are. It

seems that the only reasonable and undoubted conclusion in this matter is a humble
statement that the full solution of this intriguing problem is still down the road.
1.8. Relations between the continuous extinction and DIBs
The extinction produced by interstellar matter refers to the combined effects of the
scattering and absorption of electromagnetic radiation by the matter along sight lines
through the interstellar space. The interstellar extinction curve depicts the absorption and
scattering due to various interstellar dust components and spans from the near infrared to
the far ultraviolet (Figure 1.2.).
It is described by the equation:
F(λ) = E ( λ-V) / E ( B-V),
Where:
F(λ) - normalized extinction,
E ( λ-V) - colour excess
E ( B-V) - colour excess
Customary the value of the interstellar extinction is plotted against the inverted
wavelength, i.e., 1/ λ which is expressed in µm-1.
The average interstellar extinction curve for the diffuse cloud medium exhibits a
nearly linear rise from 1 µm-1 to the 2.25 µm-1 "knee" where the slope changes. In the
ultraviolet region there is a pronounced extinction bump near 4.6 µm-1 (2175 Å) followed
by the broad minimum and the steep non-linear rise in extinction to the shortest
wavelengths. For wavelengths shorter than ca. 5500 Å, the interstellar extinction curve
exhibits considerable variations in the shape from one line of sight to another. In addition,
the strength variations and the width (FWHM) of the 2175 Å bump has been observed to
vary by more than a factor of two from 360 Å to 770 Å with the average width about 480

Å. In contrast, the central position of the bump does not change so drastically. The most
extreme variations in extinction value are found in the far ultraviolet region.
0 2 4 6 8
0
Ext
inct
ion
1 / λ [µm -1]
Figure 1.2. The interstellar extinction curve observed in the spectrum of HD149757 star.
The different models of the interstellar dust were developed to account for the
extinction curve. The long wavelength extinction usually is explained by the absorption
and scattering from classical Van de Hulst [67] grains which size is about 0.1-0.2 µm. In
the model of Hong and Greenberg [68], they consist of silicate cores and a mantle of
material which absorbs strongly in the visual region. In 1989 Duley et al. proposed
condensations of carbon atoms into an amorphous carbon directly from the gas phase on
the silicate grains [69]. Jenniskens and Greenberg analysed the parameters of 115
ultraviolet extinction curves [70] published by Aiello et al. [71]. They decomposed them
into the linear rise, bump, and the far ultraviolet rise. These analyses did show that a
shape of the extinction curve up to 6000 Å is determined by the big grains absorbing in
the optical region. At about 6000 Å particles responsible for the linear rise start to affect
the extinction curve. They must have sizes as small as about 0.01µm or less because at
short wavelengths the extinction of the classical grains saturates. The 2175 Å bump is
usually explained by the amorphous carbon grains or their mixtures with larger
molecules.

Large molecules like PAHs also have been proposed as the carriers of the bump as
well as more general molecules containing alkene and alkyne bands [72]. Linear
polyynes and cyanopolyynes should in principle be regarded as good candidates for the
ultraviolet interstellar absorption. In particular, polyynes C8H2, C10H2, and
cyanopolyynes HC7N, HC9N and HC11N have a strong absorption line close to the region
of 2000-2200 Å. Unfortunately, all these molecules have strong vibrationally allowed
bands in the near ultraviolet region which would make difficult a good fitting of the
strong interstellar maximum at 2175 Å without undesirable absorptions at shorter
wavelengths. The carrier of the far ultraviolet non-linear rise has not yet been identified,
however, its correlation with CH abundance has been reported [73].
The interstellar extinction law has been shown to be not identical toward different
lines of sight. The varying shape of the 2175 Å bump and the strongly variable slope at
the far ultraviolet segment suggest varying physical properties of the interstellar clouds.
In 1988 Krelowski and Westerlund noticed that spectra of two stars, σSco and ζOph,
showing very different ratios of the strong DIBs 5780 and 5797, are associated with very
different shapes of vacuum ultraviolet extinction curves [74].
Figure 3.1. The spectrum of DIBs (Ref. 76).

The curves of ζOph type is characterized by the steep far ultraviolet rise while in
those of σSco type such a rise is not observed. It may suggest that carriers of the narrow
5797 DIB are related in some way to the carrier of the far ultraviolet extinction rise.
However, statements made by the authors are only qualitative ones. Similar relationship
between the strength of DIBs and the ultraviolet extinction curve behavior was found in
the case of 5844 Å band [75]. A couple of lists of Diffuse Interstellar Bands have been
made over the years. The most important and reliable catalog is published in the review
of Jenniskens and Desert [76]. This thorough catalog was updated by discoveries of
Krelowski et al. [77] and Jenniskens et al [78]. The results of this work can be found on
the internet [79]. Another survey of DIBs with precise wavelengths can be found on the
website of Galazutdinov [80].

References [1] M.L. Heger (1922), Lick. Obs. Bull., 10,146
[2] P.W. Merrill (1934), PASP, 46, 206
[3] P.W. Merrill et al. (1937), ApJ, 86, 174
[4] P.W. Merrill, O.C. Wilson (1938), ApJ, 87, 9
[5] C.S. Beals, G.H. Blanchet (1937), PASP, 49, 224
[6] E.A. Baker (1949), Edinburgh. Pub., 1, 15
[7] D. Duke (1951), ApJ, 113, 100
[8] G.H. Herbig, K.D. Leka (1991), ApJ, 382, 193
[9] P.W.Merrill, R.F. Sanford, O.C. Wilson, G.G. Burwell (1937), ApJ, 86, 274
[10] G.H. Herbig (1975), ApJ, 196, 129
[11] G.H. Herbig (1995), ARA&A, 33, 19
[14] J. Krelowski, C. Sneden, D. Hiltgen (1995), Planet. Sci., 43, 1195
[15] G.H. Herbig, D.R. Soderblom (1982), ApJ, 252, 610
[16] I. Porceddu, P. Benvenuti, J. Krelowski (1992), AAp, 260, 391
[17] T.J. Deeming, G.A.H. Walker (1967), ZsfAp, 66, 175
[18] P. Murdin (1972), MNRAS, 157, 461
[19] T.P. Snow, J.G. Cohen (1974), ApJ, 194, 313
[20] A.J. Adamson, D.C.B. Whittet, W.W. Duley (1991), MNRAS, 252, 234
[21] G. Chlewicki, G.P. van der Zwet, L.J. van Ijzendoorn, J.N. Greenberg (1986),
ApJ, 305, 455
[22] J. Krelowski, G.A.H. Walker (1987) ApJ, 312, 860
[23] K. Josafatsson, T.P. Snow (1987) ApJ, 319, 436
[24] C. Moutou, J. Krelowski, L. d'Hendecourt, J. Jamroszczak (1999) AAp, 351, 680
[25] G.H. Herbig, (1988), ApJ, 331, 999
[26] P. Jenniskens, F.X. Desert (1993), AAp, 274, 465
[27] W.W. Duley (1979), ApJ, 227, 824
[28] D. Massa, B.D. Savage, E.L. Fitzpatric (1983), ApJ, 266, 622
[29] J.A. Nuth, B. Donn (1984), ApSpSci., 103, 357
[30] J. Dorschner (1970), AN, 292, 107

[31] J. Dorschner (1971), Natue Phys. Sci., 231, 124
[32] W.W. Duley, W.R.M. Graham (1969), Nature, 224, 785
[33] A.J. Adamson, D.C.B. Whittet (1992), ApJ, 398, L69
[34] A.C. Danks, D.L. Lambert (1976), MNRAS, 174, 571
[35] G. Herzberg, (1955), Mem. Soc. Roy. Sci. Liege, 15, 291
[36] E.S. Ensberg, K.B. Jefferts (1979), ApJ, 195, L89
[37] G.P. van der Zwet, L. J. Allamandola (1985), AAp, 146, 76
[38] A.Leger, L. d'Hendecourt (1985), AAp, 146, 81
[39] M.K. Crawford, A.G. Tielens, L.J. Allamandola (1985), ApJ., 293, L45
[40] F. Salama, L. J. Allamandola (1992), ApJ, 395, 301
[41] D. Romanini, L. Biennier, F.Salama, A. Kachanov, L.J. Allamandola, F. Stoeckel,
(1999) Chem. Phys. Lett. 303, 165
[42] P. Ehrenfreund, L. d'Hendecourt, L. Verstraete, A. Leger, W. Schmit, D. Defourneau
(1992a), AAp, 259, 257
[43] F. Salama, L. J. Allamandola (1993), J.Chem.Soc. Faraday Trans., 89, 2277
[44] P. Ehrenfreund, L. d'Hendecourt, C. Joblin, A. Leger (1992b), AAp, 266, 429
[45] P.J. Sarre (1980), J.Chem. Phys., 77, 769
[46] S. Lepp, A. Dalgarno (1988), ApJ, 324, 553
[47] A.E. Douglas (1977), Nature, 269, 130
[48] W. Kratschmer, N. Sorg, D.R. Huffman (1985), Surf. Sci., 156, 814
[49] J. Kurtz, D.R. Huffman (1990), J. Chem. Phys., 92, 30
[50] M. Tulej, D.A. Kirkwood, M. Pachkov, J.P. Maier (1998), ApJ, 506, L69
[51] B. J. McCall, J. Thorburn, L. M. Hobbs, T. Oka, D. G. York, (2001) ApJ, 559, L49
[52] D. P. Rufle, R. P. A. Bettens, R. Terzieva, E. Herbst, (1999) ) ApJ, 523, 678
[53] G.F. Mitchell, W.T. Jr. Huntress (1979), Nature, 278, 722
[54] T. Motylewski, H. Linnartz, O. Vaizert, J.P. Maier, G.A. Galazutdinov, F.A.
Musaev, J. Krelowski, G.A.H. Walker, D.A. Bohlender (2000), ApJ . 531, 312
[55] P. Freivogel, J. Fulara, J.P. Maier (1994), ApJ, 431, L151
[56] J. P. Maier, G. A. H. Walker, D. A. Bohlender (2004), ApJ, 602, 286
[57] H.W. Kroto, J.R. Heath, S.C. O'Brien, R.F. Curl, R.E. Smalley (1985), Nature, 318,
162

[58] S. Leach et al. (1992), Chem. Phys., 160, 451
[59] J.L. Ballster, P.R. Antoniewicz, R. Smoluchowski (1990), ApJ, 356, 507
[60] J. Fulara, M. Jakobi, J.P. Maier (1993), Chem. Phys. Lett., 211, 227
[61] C.C. Henderson, P.A. Cahill (1993), Science, 259, 1885
[62] A. McIntosh, A. Webster (1992), MNRAS, 255, 37P
[63] F.M. Johnson (1972), Ann. Bull. N.Y. Acad. Sci., 187, 186
[64] F.M. Johnson (1991), B.A.A.S., 23, 933
[65] B. Donn, R.K. Khanna (1980), Ap. Sc. Sci., 68, 19
[66] J.R. Miles, P.J. Sarre (1993), JChem. Soc. Faraday. Trans., 89, 2269
[67] H.C. Van de Hulst (1957), Scattering by small particles, New York: J.Wiley
[68] S.S. Hong, J.M. Greenberg (1980), A&A, 88, 194
[69] W.W. Duley, A.P. Jones, D.A. Williams (1989), MNRAS, 236, 709
[70] P. Jenniskens, J.M. Greenberg (1993), A&A, 274, 439
[71] S. Aiello, B. Barsella, G. Chlewicki, J.M. Greenberg, P. Patriarci, M. Perinotto
(1988), A&AS, 73, 195
[72] M. Braga, S. Larsson, A. Rosen, A. Volosov (1991), A&A, 245, 232
[73] P. Jenniskens, P. Ehrenfreund, F. X. Desert (1992), A&A, 265, 1
[74] J. Krelowski, B. Westerlund (1988), A&A, 190, 339
[75] J. Krelowski, T. P. Snow, J. Papaj, C.G. Seab, B. Wszolek (1993), ApJ, 419, 692
[76] P. Jenniskens, F.-X. Desert (1994), AApS, 106, 39
[77] J. Krelowski, C. Sneden, D. Hiltgen, (1995) Planet. Space. Sci. 43, 1195
[78] P. Jenniskens, I. Porceddu, P. Benvenuti, F.-X. Desert, (1996) A&A 313, 649
[79] http://leonid.arc.nasa.gov/DIBcatalog.html
[80] http://www.sao.ru/hq/coude/DIBwavelength.htm

CHAPTER 2
2. Supersonic jet phenomenon and its application in
spectroscopy of transient radical species
The emission or absorption spectra of large organic molecules are usually broad
and their structure is not always clear. This is caused primarily by two factors. One of
them is Doppler broadening. Another one is high population of excited rovibronic levels
in the ground electronic state of the molecule at high temperature. The result is a
spectrum that is congested and difficult to interpret. In order to cope with this problem,
there is a tendency toward measurements of spectra of isolated molecules which are
cooled to a very low temperature. The excellent tool that provides for extensive cooling
of translational and internal degrees of freedom of molecular gases is a supersonic free
expansion. In this method a neutral carrier gas containing vapour of the substance of
interest is expanded into the vacuum chamber through a nozzle. As a result of the
adiabatic expansion of the gas (at pressure p0 and temperature T0) into the vacuum,
conversion of internal energy of the gas into kinetic energy takes place. This leads to
sharpening of the Maxwell-Boltzman distribution of molecular velocities and to
translational cooling to temperature T. Hence, the Doppler broadening is significantly
reduced. The cooling of large molecules in the supersonic jet is effective when the
diameter of the nozzle is relatively large with respect to the mean free path of the
molecules.
Owing to partial cooling of rotational and vibrational degrees of freedom of the
molecules, only the lowest rovibronic levels in the ground electronic state are populated.
This simplifies the spectra enormously as the number of lines is noticeable reduced. With
a very effective cooling most “hot transitions” do not take place and as a result the
analysis of the spectra is much easier.

The parameters of state of an ideal gas expanding under adiabatic conditions are
given by the equation:
TT
pp
M
0 0
1
0
1 2 1
1 12
=
=
= +
−
−− −
κκ
κρρ
κ( )
Where:
M - the Mach number,
T0 - the initial temperature in the nozzle,
p0 - the initial pressure of gas in the nozzle,
ρ0 - the initial density of gas in the nozzle,
κ - cp / cv (cp , cv - heat capacities at constant pressure and constant volume,
respectively).
T, p, ρ, and M are the parameters at a given point of the jet.
Free jet expansions prove useful in producing interesting radicals which are
usually transient species and can not be produced effectively by other methods. Low
densities attained in jet allow these unstable molecules to survive long enough for
studying. The radicals and ions prepared in nozzle expansions are amenable to
investigation by a range of spectroscopic techniques, ranging from optical spectroscopy
with high dispersion grating instruments and photographic plate detection to mixed
optical-microwave spectroscopy with modern klystrons and lasers. A long-lasting
problem in analyzing spectra is that of locating each band origin, corresponding to the
energy of the transition if the molecule were not rotating or vibrating. These band origins
are more easily identified in spectra of very cold molecules Many examples of spectral
structure simplifying upon cooling of rotations can be found in the review papers of
Engelking [1] and Levy [2].
Studeis carried out by Kantrowitz [3] showed that low rotational and translational
temperatures could be attained without necessarily aggregating molecules or quenching
internal vibrations. It was also recognized that the translational velocity distribution
would become narrow, with the overall bulk motion away from the nozzle becoming a bit
over the initial speed of sound in the preexpanded gas. This was a significant
improvement in molecular beam characteristics over that available with an effusive
source, since a narrow velocity distribution could be achieved automatically, without
having to introduce a mechanical velocity selector in the beam path. Several proposals
were made to utilize an expansion for a molecular beam source [4-6].
2.1. Circular nozzles
Most studies use an unconstrained free jet expanding into a vacuum chamber from
a circular hole, without introducing skimmers for separating out a free molecular beam.
Since most researchers do not have infinite pumping speed available, the jet expands into
a low pressure. Much work has been done on the aerodynamics of a similar situation, a
rocket exhaust plume at high altitude [7, 8]. A good deal of theoretical and experimental
work on axial symmetric jets has been summarized by Love [9].
Many of the theoretical predictions of flow structure have been experimentally
confirmed by methods of shock visualization and Pitot tube pressure measurement.
Recently, optical tomography of Cl2 expansions using arc lamp UV sources have directly
confirmed predictions of the density distribution in the flow [10].
The basic structure of the expansion consists of subsonic hydrodynamic flow on
the high-pressure side of the nozzle toward the constricting throat. At the throat, the flow
conditions becomes sonic and, subsequently, supersonic in the expansion into the
vacuum. More detailed description of the circular nozzle can be found in the next
subchapters.
2.2. Planar nozzles
Nozzle geometry need not be cylindrically symmetric about the flow axis.
Recently, planar nozzle geometries have been introduced to attempt to match the
properties of the expansion to the needs of the spectroscopist. The engineering literature

refers to these as "slot" nozzles; molecular spectroscopists lean toward the term "slit"
nozzles.
Flows from slit nozzles have been experimentally studied [11] and summarized
[12]. The density in an expansion from a thin slit falls off only inversely with distance
from the nozzle, leading to milder cooling over longer dimensions than in a jet from a
circular nozzle. This has been useful in reducing the rate of cooling [13].
On first examination, a planar jet would appear to offer the advantage of a longer
path length for absorption studies, which have now been conducted over the
electromagnetic spectrum from IR [14] to VIS-UV [15]. A careful study of this question
by Veeken and Reuss [16] shows that the column density along a path parallel to the long
dimension of the slit increases by only 17% over that offered by a circular nozzle
operating at the same mass throughput. Column densities of molecules is not the major
advantage of a planar nozzle.
Veeken and Reuss point out a more subtle advantage of the slit nozzle. Because
the velocity components parallel to the long dimension are more uniform and smaller, the
resulting Doppler line width is correspondingly narrower. This has two effects: first,
individual spectral lines can be better resolved; second, the optical density at the line
maximum increases. Thus, the slit nozzle is preferable for high resolution measurements.
While slit nozzles have been predominantly used for studies of stable molecules
and clusters, investigators studying molecular ions at high resolution [17] have shown the
suitability of planar nozzles also for ion spectroscopy [18].
2.3. Continuous and pulsed jets description
The description of molecular beams from nozzle sources cannot be separated from
free-jet behavior, since the properties of jets are skimmed and reflected in those of beams.
Moreover, free jets and nozzle beams are often encountered in the same fields of basic
and applied research: studies of translational, rovibrational, and even electronic
relaxation, atomic and molecular spectroscopy, scattering processes in gas-gas, gas-
photon, or gas-surface interactions, gas or isotope separation by aerodynamic or laser
methods, gas dynamic or chemical lasers, condensation phenomena, physics and

chemistry of van der Waals complexes or clusters, nuclear fusion, molecular beam
epitaxy, flow phenomena, aerospace studies, etc. In most of these important applications,
it is of interest to obtain, as much as possible, narrow velocity spreads (or very low
temperatures) in the jet or the beam, high density or intensity in the molecular beam, and
a variable kinetic energy from the thermal to the electronvolt range. All these jet and
beam characteristics can be improved by increasing the quantity P0D* where P0 is the
nozzle stagnation pressure and D* is the nozzle diameter. This product represents the
total number of two-body collisions undergone by a given molecule during the expansion
process and, consequently, characterizes the degree of cooling. The extent of this flow
cooling may also be limited by the formation of unwanted van der Waals complexes
determined by the number of three-body collisions scaling roughly as P02D*. Also the
nozzle stagnation temperature T0 and the nozzle shape, governing together with D* the
expansion rate, allow one to control the condensation process.
2.3.1. Continuous Jets at Low Pressure (P1 ~ 10-3 - 10-4 Torr)
The pioneering experimental work on continuous jets and beams is due to Becker
and co-workers [19]. Much credit for their development at low pressure P1 must go to
Fenn and his associates [20, 21]. Their nozzle skimmer system can be operated easily
with any gas at any temperature, due to relatively weak disturbances from the background
gas and the skimmer. Nevertheless, the small mass throughput acceptable by diffusion
pumps, or cryopumps, limits the quantity P0D* and, consequently, the jet and beam
performance. This pumping problem is encountered mainly with pure or seeded light
gases, also with most of the common gases (in particular if heating is used to prevent
condensation), and finally in cluster beam generation. On the contrary, for a number of
gases expanded from room temperature, the extent of cooling is not limited by pumping
requirements but by the onset of formation of undesirable van der Waals complexes (∝
Po2D*). At least in this case, Fenn's technique is certainly appropriate.
A schematic diagram of the free-jet and molecular beam source of the Fenn type
is presented in Figure 2.1. Due to the decrease of the collision frequency in the jet of
relatively low density, the transition from continuum to free molecular flow (xS)max

occurs and the expansion becomes frozen [20, 21] at a distance from the nozzle much
smaller (< 1/10) than the distance
XM = 0.67D*(P0/P1)1/2 (1)
at which the Mach disk of a free jet shock wave structure would be formed in a
continuum flow field obtained with the same nozzle and expansion ratio (see in Figure 1
the virtual Mach disk location). Because of the limitations mentioned above, these low
density continuous systems are not easily perfected but they are sufficient for a wide
variety of applications.
The region available for spectroscopic purposes within the isentropic expansion
core typically starts around 5-10 nozzle diameters downstream from the nozzle and
extends to the mach disk. For example, for an expansion of 1000 Torr into a chamber of
0.1 Torr out of a nozzle of 0.1-mm diameter, one expects to find the mach disk at 6.7 mm
downstream. Thus, a 5-mm long region, extending between 1 and 6 mm downstream
from the nozzle is available. Only moderate vacua are needed whenever experiments are
conducted here, in the core of the expansion in front of the nozzle, and for these cases a
mechanical blower pump, as pioneered by Campargue [22] is often the choice of
pumping apparatus. Some experiments involve actual molecular beams, requiring
chamber pressures 10-6 Torr or lower. These high vacua are most easily achieved with
diffusion pumps. Although the volume throughput of a diffusion pump is large, the
overall mass throughput is limited, and many diffusion pumped expansions have pulsed
nozzles, first pioneered by Gentry [23, 24].

Virtual Mach disc located with xm
up to 100 cm from the nozzle
Onset of background
gas penetration
P2 ~ 10-6 Torr
P0 D*
P1 ~ 10-3 –10-4 Torr
(xs)max
S1 S2
Figure 2.1. Schematic diagram of a continuous nozzle beam source operated at low
background pressure in the expansion chamber (Fenn type).
Onset of background gas penetration
(xs)max
P0
D*
P1 ~ 0.25 Torr P2 ~ 10-5 Torr
Xm = 0.67D* (P0 /P1)1/2
Zone of silence
Figure 2.2. Schematic diagram of a nozzle beam source operated by skimming in
the region of overexpansion of a free jet zone of silence (Campargue type).

Infrequent, short, gas pulses allow low ultimate pressures to be attained without
overloading the average pumping speed. Pulse duration must be sufficient to allow
development of hydrodynamic flow through the nozzle; the time required to establish
steady flow has been investigated by Saenger and Fenn [25].
2.3.2. Pulsed Jet and Beams (P1 ~ 10-4 - 10-6 Torr)
In the absence of limitations due to condensation effects, the conventional
approach to the pumping problem can be improved significantly by the use of a pulsed
nozzle [26]. Thus, the gas flows only during the pulses into an expansion chamber
sufficiently large and continuously evacuated by a large diffusion pump, or cryopump, in
order to ensure that the warm background gas does not disturb the cold pulsed jet.
Consequently, the pumping capacity determines the repetition rate but does not affect the
expansion.
The advantages of pulsed jets and beams are due to their economical properties
(gas consumption, pumping speed) and very high performance in particular in beam
intensity and low temperature. Nevertheless, they may present a few drawbacks linked to
their limited duty cycle, relatively large physical size, possible lack of stability and
reproducibility, etc. Also pulsed nozzles are not operated at high temperatures in the
present state of the art. However, preliminary experiments have been performed in our
laboratory by operating a high-temperature, high-pressure source with a pulsed valve
located in the downstream vicinity of the nozzle orifice.

2.3.2.1. Alternative Approach Based on the Creation of a Free-
Jet Zone o Silence in a Relatively High-pressure Environment
(P1 ~ 10-2 – 1 Torr).
In the nozzle beam method developed at Saclay [27-32] the interaction of the
supersonic flow with the ambient gas produces a well-defined free-jet shock wave
system. Such a structure was observed recently by using electron beam fluorescence
equipment available in the SR3 wind tunnel of the Laboratoire d'Aerothermique at
Meudon [33]. This flow visualization has been obtained for helium by operating nozzle
skimmer device in the wind tunnel with the same pressures P0, P1, and P2 (in the post-
skimmer region) as used at Saclay for achieving maximum helium beam performance at
room temperature [31, 32].
For a given pressure ratio P0/P1, the shock waves are fixed in place as P1
decreases, but their thickness (approximately several mean free paths of the molecules
under the post-shock conditions) increases to form a diffuse system which finally
vanishes at low pressures, P1 10≤ -3 Torr, as used in the conventional molecular beam
sources (Figure 2.1). In this case, the effect of the background gas on the jet molecules is
simple scattering [20] which affects the largest part of the jet. Also scattering is possible
when a shock barrel is present but diffuse enough for allowing penetration of the
background molecules mainly into the final stages of the free-jet expansion [28-30]. It
has been found that this invasion effect is strongly mass selective in favour of the light
species of a gas mixture surrounding the shock wave structure [28, 29]. This is the basic
principle of the jet membrane process for gas and isotope separation [34, 35].
At sufficiently high pressures P0 and P1, the cold isentropic core of the jet appears
to be completely unaffected by the warm background gas along the total length XM, as
defined by relation (1), from the nozzle to the Mach disk [28, 30] Thus, the supersonic
expansion produced in such a created zone of silence is exactly the same as that obtained
in the ideal conditions as a perfect vacuum. Also, as shown clearly by flow visualization,

the jet is overexpanded upstream of the Mach disk down to densities which are
considerably less than the background gas density outside the shock structure. This offers
the possibility of achieving extremely low temperatures (to 6 × 10 –3 K) in very compact
systems.
This alternative approach for improving the nozzle beam technique has appeared
initially from our semiempirical relation [28, 31] giving the experimental conditions for
maximum beam intensity (Figure 2.2):
(Xs/D*)max = 0.125[(1/ Kn0)(P0/P1)]1/3 (2)
where Xs/D* is the nozzle-skimmer distance in D* units, Kn0 = λ0/D* is the nozzle
Knudsen number, and λ0 is the nozzle stagnation mean free path. Also at the distance
(Xs/D*)max appears the limit of the zone of silence, as indicated by the onset of
background gas penetration into the stream tube subtended by the skimmer orifice.
Obviously this distance from the nozzle must be increased as much as possible for
extending the cooling in the undisturbed part of the jet and the skimmed molecular beam
[36].
At constant nozzle flow rate (∝ P0D*2) and background pressure P1, the
volumetric pumping speed in the nozzle chamber
S1 P∝ 0D*2 /P1 ∝ XM (3)
also is constant and relation (2) can be rewritten for a given gas in the form:
(Xs/D*)max ∝ [P0D*(P0 /P1)]1/3 ∝ 1/ D* (4)
which confirms the virtue of using miniature nozzles.
Finally, for a given gas, nozzle, and pumping speeds S1, it is easily found that
(Xs/D*)max ∝ (P02
/P1)1/3 (5)

This simplification shows clearly the effect of increasing the absolute pressures
on the effective length of the zone of silence and finally on the jet and beam performance
[30, 32]. The great interest of this approach results from its possibility of eliminating the
background gas disturbance and extending the flow cooling by the same way. Also, for a
given pump size, operation in the range of 10-1 to 1 Torr (at a density much higher than in
the terminal part of the jet due to the overexpansion leads to an increase of several orders
of magnitude in the nozzle mass flow rate (P0 D*2) over that traditionally available.
In conclusion, the free jet zone of silence appears as an extremely efficient way
for cooling continuously with the only limit due to condensation. In particular, helium
free jets provide ideal media largely used for simplifying the laser spectroscopy of
molecules which are cooled with He in the gas phase to extremely low temperature [37-
40]. The exploration of only the supercooled and undisturbed core of the jet is possible
and the shock waves do not affect the propagation of light. On the contrary, as shown
below, skimming very high Mach numbers in a free-jet zone of silence (Figure 2.2.) is
technically much more difficult than skimming in the Fenn free jets (Figure 2.1.). This
difficulty has limited the application of the nozzle beam technique developed at Saclay.
Also this was the reason why very high Mach numbers (~180) predicted and obtained
already in 1968 in He free jets were not measured until 1974 by the molecular beam time-
of-flight (TOF) technique [31], after successively different improvements in optimising
the geometry of the skimmer were performed.
2.4. Spectroscopy of cold radicals
Radicals and molecular ions are among the most chemically reactive species
known and play a key role in chemistry ranging from the upper atmosphere [41-43] to
molecular synthesis in the interstellar medium [44-46]. The vast majority of chemical
reactions proceed via elementary reactions involving highly unstable transients such as
radical and molecular ions. This has stimulated longstanding efforts toward developing
high resolution spectroscopic tools for detailed characterization of these highly reactive
species in the gas phase [47-54]. Generally speaking, two universal experimental
problems to overcome are first generation of sufficient densities for detection (such

transient species are usually very difficult to maintain at sufficient concentrations to
probe experimentally) and second successful extraction and analysis of high resolution
spectra in the presence of much higher concentrations of precursor molecules.
The most widely tools used for generation of transient radical species have been
based on electrical discharges. Several groups have exploited these methods to study a
variety of small radicals with coherent light sources from the microwave to the ultraviolet
spectral region [55-57]. Of particular interest has been the application of direct absorption
laser techniques for high-resolution spectroscopy of radicals/molecular ions present in
electrical discharges, where these reactive molecules can be maintained at relatively high
steady state concentrations.
A promising technique has been the combination of an electrical discharge and a
supersonic expansion. Such discharge expansion sources provide an extremely powerful
tool for ion or radical spectroscopy under jet-cooled conditions. The method was initially
pioneered by Engelking and coworkers [58], who developed a sharp tungsten tip 'Corona'
discharge ionization source behind the pinhole of a continuous wave (cw) expansion
nozzle. These Corona sources yield appreciable densities of rotationally cold radicals
(with Trot < 15 K) at the expansion orifice, which simplifies the spectroscopic analysis
and has proved useful for a variety of emission and laser-induced fluorescence studies
[1].
The problem of low densities of radical species, which made direct absorption
difficult to observe was significantly reduced by development discharge methods
allowing relatively high densities of species to be achieved. These discharge sources of
radicals combined the long path length of a slit with the high densities accessible in a
pulsed supersonic expansion. The examples of such sources can be found in the works of
Davis et al. [59, 60] and Anderson et al. [61].
On the other hand the applications of more and more sensitive methods of probing
radicals under laboratory conditions increased noticeably the number of very interesting
results. So far, high resolution laser spectroscopic studies have been successfully
performed on an impressively large class of important molecular ions and radicals [62].
Among the various methods of high resolution study of transient radical and molecular
ion species [63-65], electric discharge sources combined with supersonic expansion and

sensitive detection methods have played an especially important role [66]. The further
progress in the study of transient species came with the invention and development of
sensitive method – cavity ringdown. Especially their combination with a pulsed slit
nozzle appeared to be very fruitful in the studies of the unstable species. Detailed
description of the method and its applications is given in the next chapters.
References
[1] P. C. Engelking, Chem. Rev. 91 (1991) 399
[2] D. H. Levy, Ann. Rev. Phys. Chem. 31 (1980) 197
[3] A. Kantrowitz, J. Chem. Phys. 14 (1945) 150
[4] A. Kantrowitz, J. Grey, Rev. Sci. Instrum. 22 (1951) 328
[5] G. B. Kistiakowsky, P. Schlichter, Rev. Sci. Instrum. 22 (1951) 333
[6] J. B. Fenn, J. Deckers, Rev. Sci. Instrum. 34 (1963) 96
[7] T. C. Adamson, Jr., in "Supersonic Flow Chemical Processes and Radiative
Transfer", D. B. Olfe and V. Zakkay, Eds., Pergamon, New York, 1964, p 177
[8] J. Bowyer, L. D'Attorre, and H. Yoshihara, in "Supersonic Flow Chemical Processes
and Radiative Transfer", D. B. Olfe and V. Zakka , Eds., Pergamon, New York, 1964,
p 201
[9] E. S. Love, "Experimental and Theoretical Studies of Axi-symmetric Free Jets",
NASA TR R-6, 1959
[10] G. W. Faris, R. L. Byer, Opt. Lett. 11(1986) 413
[11] A. E. Beylich, Z. Flugwiss, Weltraumforsch. 3 (1978) 48
[12] O. F. Hagena, Surf. Sci. 106 (1981) 101
[13] M. Silkes, C. Jouvet, S. A. Rice, Chem. Phys. Lett. 87 (1982) 515
[14] C. M. Lovejoy, D. J. Nesbitt, J. Chem. Phys. 86 (1987) 3151
[15] A. Amirav, J. Jortner, J. Chem. Phys. 82 (1985) 4378
[16] K. Veeken, J. Reuss, Appl. Phys. B 38 (1985) 117
[17] I. W. Milkman, J. C. Choi, J. Hardwick, J. T. Moseley, J. Chem. Phys., 86 (1987)

1679
[18] I. W. Milkman, J. C. Choi, J. Hardwick, J. T. Moseley, Rev. Sci. Instrum. 59 (1988)
508
[19] E. W. Becker and K. Bier, Z . Naturforsch. A , 9, 975 (1954); K. Bier and O. F.
Hagena, "Rarefied Gas Dynamics", 3rd Symposium, Vol. I, J. A. Laurmann, Ed.,
Academic Press, New York, 1963.
[20] J. B. Fenn, J. Deckers, "Rarefied Gas Dynamics", 3rd Symposium, Vol. I, J. A.
Laurmann, Ed., Academic Press, New York, 1963; J. B. Fenn, J. B. Anderson,
"Rarefied Gas Dynamics", 4th Symposium, Vol. 11, J. H. De Leeuw, Ed., Academic
Press, New York, 1966; J. B. Anderson, R. P. Andres, J. B. Fenn, G. Maise,
"Rarefied Gas Dynamics", 4th Symposium, Vol. 11, J. H. De Leeuw, Ed., Academic
Press, New York, 1966
[21] J. B. Anderson in "Molecular Beams and Low Density Gasdynamics", P. P.
Wegener, Ed., Marcel Dekker, New York, 1974
[22] R. Campargue, J. Phys. Chem. 88 (1984) 4466
[23] W. Gentry, C. F. Giese, Rev. Sci. Instrum. 49 (1978) 595
[24] W. Gentry, C. F. Giese, J. Chem. Phys. 67 (1977) 5389
[25] K. L. Saenger, J. B. Fenn, J. Chem. Phys., 79 (1983) 6043
[26] K.Bier and 0. F. Hagena, "Rarefied Gas Dynamics", 4-th Symposium, Vol. 11, J. H.
De Leeuw, Ed., Academic Press, New York, 1966; W. R. Gentry and C. F. Giese,
Rev. Sci. Instrum. 49 (1978) 595; M. G. Livermann, S. M. Beck, D. L. Monts, and
R. E. Smalley, "Rarefied Gas Dynamics", 11-th Symposium, Vol. 11, R. Campargue,
Ed., CEA, Paris, 1979
[27] R. Campargue, Rev. Sci. Instrum. 35 (1964) 111
[28] R. Campargue, Thesis, Paris, (1970)
[29] R. Campargue, J. Chem. Phys., 52 (1970) 1795
[30] R. Campargue and J. P. Breton, Entropie, 42 (1971) 18
[31] R. Campargue, A. Lebehot, "Rarefied Gas Dynamics", 9th Symposium, Vol. 11, M.
Becker and M. Fiebig, Eds., DFVLR Press, Porz-Wahn, F.R.G., 1974
[32] R. Campargue, A. Lebehot, and J. C. Lemonnier, "Rarefied Gas Dynamics", 10-th
Symposium, Vol. 11, J. Leith Potter, Ed., AIAA, New York, 1977

[33] G. Dupeyrat, Thesis, Paris, 1979
[34] R. Campargue, J. B. Anderson, J. B. Fenn, B. B. Hamel, E. P. Muntz, J. R. White in
"Nuclear Energy Maturity", P. Zaleski, Ed., Pergamon Press, Oxford, 1975
[35] J. W. Brook, V. S. Calia, E. P. Muntz, B. B. Hamel, P. B. Scott, T. L. Deglow, J.
Energy 4 (1980) 199
[36] H. Ashkenas and F. S. Sherman, "Rarefied Gas Dynamics", 4-th Symposium, Vol.
11, J. H. De Leeuw, Ed., Academic Press, New York, 1966
[37] R. E. Smalley, D. H. Levy, and L. Wharton, Laser Focus, 40, Nov. (1975)
[38] R. E. Smalley, L. Wharton, and D. H. Levy, J. Chem. Phys. 63 (1975) 4977
[39] D. H. Levy, L. Wharton, and R. E. Smalley in "Chemical and Biochemical
Applications of Lasers'', C. B. Moore, Ed., Academic Press, New York, 1977;
[40] D. H. Levy, Annu. Rev. Phys. Chem. 31 (1980) 197
[41] E.E. Ferguson, Acc. Chem. Res. 14 (1981) 327
[42] C.A. Smith, L.T. Molina, J.J. Lamb, M.J. Molina, Intern. J. Chem. Kinetics 16
(1984) 41
[43] S. Solomon, R.R. Gareia, R.S. Rowlans, D.J. Weubbles, Nature 321 (1986) 755
[44] E. Herbst, W. Klemperer, Astrophys. J. 185 (1973) 505
[45] T. Oka, M.J. Jogod, J. Chem. Soc. Faraday Trans. 89 (1993) 2147
[46] O.L. Polyansky, B.M. Dinelli, C.R. Le Sueur, J. Tennyson, J. Chem. Phys. 102
(1995) 9322
[47] T. A. Miller, Ann. Rev. Phys. Chem. 27 (1976) 127
[48] R. J. Saykally, R. C. Woods, Ann. Rev. Phys. Chem. 32 (1981) 403
[49] T.J. Sears, J. Chem. Soc. Faraday Trans. 832 (1987) 111.
[50] E. Hirota, Int. Rev. Phys. Chem. 8 (1989) 171
[51] P.F. Bernath, Ann. Rev. Phys. Chem. 41 (1990) 91
[52] E. Hirota, Annual Reports, The Royal Society of Chemistry Section C, (1994)
[53] P. Davies, Spectrochim. Acta Part A 55 (1999) 1987
[54] E.J. Bieske, O. Dopfer, Chem. Rev. 100 (2000) 3963
[55] E. Hirota, Chem. Rev. 92 (1992) 141
[56] P. F. Bernath, Ann. Rev. Phys. Chem. 41 (1990) 91
[57] C. Demuynck, J. Mol. Spectrosc. 168 (1994) 215

[58] P.C. Engelking, Rev. Sci. Instr. 57 (1986) 2274
[59] S. Davis, D. T. Anderson, G. Duxbury, D. J. Nesbitt, J. Chem. Phys. 107 (1997)
5661
[60] S. Davis, M. Fárník, D. Uy D. J. Nesbitt, Chem. Phys. Lett. (2001) 23
[61] D.T. Anderson, S. Davis, T.S. Zwier and D.J. Nesbitt , Chem. Phys. Lett. 258 (1996)
207
[62] M.E. Jacox, Vibrational and electronic energy levels of polyatomic transient
molecules, American Chemical Society and American Institute of Physics,
Gaithersburg, MD, 1994, in: J.P. Maier (Ed.), Ion and Cluster Ion Spectroscopy and
Structure, Elsevier, Amsterdam, (1989) 483.
[63] H. Petek, D.J. Nesbitt, P.R. Ogilby, C.B. Moore, J. Phys. Chem. 87 (1983) 5367
[64] D.W. Kohn, H. Clausberg, P. Chen Rev. Sci. Instrum. 63 (1992) 4003
[65] H. Linnartz, D. Verdes, T. Speck, Rev. Sci. Instrum. 71 (2000) 1811
[66] P.B. Davies, Chem. Soc. Rev. 24 (1995) 151

CHAPTER 3
3. Cavity ringdown method - principles and applications
The study of molecular absorption and emission of radiation is of a great
importance in modern science. Much of information about the geometrical and electronic
structure of various molecules and molecular clusters comes from optical absorption
studies performed on either bulk samples or, more recently, in molecular beam
expansions. In some cases, especially involving small diatomic and triatomic species,
emission measurements can be more sensitive since the appearance of a tiny signal is
measured rather than a small change in a large one. The most established techniques for
making such measurements are laser-induced fluorescence (LIF) and resonance-enhanced
multiphoton ionization (REMPI), and both have been employed successfully in a large
number of studies. Unfortunately for many applications involving large polyatomic
molecules absorption measurements are potentially superior to those based on emission,
due to rapid internal conversion, predissociation, or other dynamical processes which
significantly reduce the emission quantum yield. Even for small systems, the vibronic
band intensities are often contaminated by intramolecular relaxation dynamics; in such
cases, these techniques cannot be used for reliable intensity measurements. For clusters
that exhibit rapid photofragmentation, depletion spectroscopy can be employed quite
effectively to measure their vibronic structure, but again, dynamic effects complicate the
interpretation of spectra. The problem is that direct absorption methods are generally
orders of magnitude less sensitive than those based on emission, therefore, difficult to
apply to transient species, such as clusters or radicals.

For many applications, such as atmospheric pollution studies or flame probing the
use of direct absorption measurements is often impractical since the absorbing species is
present only in trace amounts or the sample path-length is pretty short. In the limit of
weak absorption, the transmitted optical intensity decreases exponentially with absorption
path length according to Lambert-Beer’s law:
I=I0e-σnl where:
σ- wavelength dependent absorption cross section proportional to the transition
dipole moment,
n - volume density of molecules,
l - absorption path-length
The ability to measure the I/I0 ratio with a high accuracy typically limits the
measurement to minimum losses of 0.01 – 0.001 %. In addition such precision absorption
measurements require very sophisticated optical systems and sources which have a stable
output intensities. Usually the high stability is obtained using several types of continuous
lasers used in experimental configurations which employ some form of frequency
modulation to discriminate against the low frequency noise. The examples are infrared
lasers [1-5], diode lasers [6] and tunable cw dye lasers [7].
When it comes to the experimental systems based on pulsed lasers the same
degree of accuracy of the measurement has not yet been possible. The pulse to pulse
amplitude variation of most pulsed laser sources is around 10% which requires a greater
detector dynamic range and this way reducing the effective signal resolution. In addition,
the short pulse widths of such lasers (10-30 ns) makes it very difficult to modulate the
frequency for differential analysis. Because of this limitations, sensitive absorption
measurements have not been made over the full spectral range accessible using nonlinear
frequency conversion techniques.
For the applications in which fluorescence emission analysis is not practical, some
means of increasing the sensitivity of absorption detection is required. Lambert-Beer’s
law says that in the limit of very weak absorption, when the density of the sample is low,

the signal can be increased proportionally by lengthening the absorption path for example
using a multipass configuration. However, in practice getting more than 100 passes is not
possible as the light beam diverges and gets weaker with every reflection [8-12].
The problem is more severe in the case of other applications e.g., molecular beams
where the geometrical cross-sections are really small. Here the same small volume has to
be repeatedly probed. Although several innovative examples of optical multipass systems
suitable for the molecular beams have been proposed [3, 12, 13], most of them allow only
a few passes and even the most promising designs can not give more than 100 [12]. The
situation changed drastically in 1988 when O’Keffe and Deacon reported the invention of
a new technique which allows an increase of several orders of magnitude in sensitivity
over existing methods for the wide spectral region accessible with tunable pulsed lasers.
The method is based not on the measurement of the absorbed signal strength, but upon
the measurement of the decay rate of a light pulse confined to a highly reflective closed
optical cavity [14]. The principles of the new method henceforth called cavity ringdown
are described below.
3.1. Principles of cavity ringdown
The method is based on measurement of the time rate of decay of a pulse of light
trapped in a high reflectance optical cavity. In practice, pulsed laser light is injected into
an optical cavity that is formed by a pair of highly reflective plano-concave mirrors (R >
99.9 %, f=100cm). The small amount of light that is trapped inside the cavity reflects
back and forth between the two mirrors, with a small fraction transmitting through each
mirror with each pass. The resultant transmission of the circulating light is monitored at
the output mirror as a function of time and allows the decay time of the cavity to be
determined. This signal has an envelope which is simply a first order decay exp[-t/τ]. The
time required for the cavity to decay to 1/e of the initial output pulse is called the "cavity
ringdown" time.

It can be easily seen that the ring down time, τ, is determined by the following
equation:
τ = )1( lRc
dα+−
where:
d - the optical length of the cavity,
c - the speed of light,
R - the averaged reflectivity of the two mirrors
α l – the absorbance for a sample present in the cavity with absorption coefficient
α and length l.
The idea of the cavity ringdown method is described graphically in the Figure 3.1.
When no absorbing medium is present in the cavity the ringdown time is a
function of only the mirror reflectivities (R) and cavity dimensions (d). The absorption
αl = 0 and as a result τ is relatively long (black line in the figure). When the molecule
absorbs the laser light the ringdown time decreases and it depends on the absorbance of a
medium which is present in the cavity. The exponential decay is much stepper because
the product αl is not equal 0 anymore (red line in the figure). Absolute absorption
intensities are obtained by subtracting the base-line transmission of the cavity, which is
determined when the laser wavelength is off-resonance with all molecular transitions. As
the ring down time reflects the rate of absorption rather than the magnitude of the
absorption and as such it has important advantages compared with conventional
absorption techniques. The method is immune to pulse-to-pulse fluctuations in the laser
power and the very long absorption pathlengths that are obtained by confining the light
pulse several microseconds in the cavity make this technique ideal to study unstable
species.

Figure 3.1. The principles of cavity ringdown method. d l
τ = d / c ( 1 - R +
5 1 0 1 5 2 0 2 5
T im e µ s
Inte
nsity
α l )
Detector
Detector

3.2. Applications of cavity ringdown method
Cavity ring down method was applied to study of the radicals produced in the
discharge sources. In 1996 Kotterer et al. reported experiments where they comprised a
hollow cathode discharge within a cavity ringdown system. Using this approach the A 2Π
- X 2Σg- (6-0) transition of N2
+ [15] and the 2Π - X 2Π transition of C6H were measured
[16].
As the cavity ringdown measurements have proved very effective in the detection
of carbon chains, the results of the method have been of astrophysical relevance. It has
been suggested that carbon chains may be potential carriers of some of the diffuse
interstellar bands [17]. Following that suggestion and arguments by Douglas [18] this
concept have been supported by the detection of molecules with a charbon-chain skeleton
in dense interstellar clouds by microwave spectroscopy. However, the ultimate test could
be only made by comparing the astronomical data with spectra measured in the
laboratory under conditions which closely imitate those in the interstellar medium. This
could be done by means of cavity ringdown method. The experimental set-up which
could be use for this studies was described by Motylewski and Linnartz [19]. It consisted
of a standard cavity ringdown unit sampling the plasma generated in a pulsed supersonic
slit jet expansions. In 2000 Motylewski et al. compared the laboratory gas-phase spectra
of neutral and cationic linear carbon-chain radicals they measured with astronomical
diffuse interstellar bands [20]. The origin bands of the strong electronic transitions of the
studied species, C2nH (n=3-6), HC2nH+ (n=2-4), NC2n-2N+ (n=3, 4), did not coincide with
detectable DIBs, except for HC2n-1N+ (n=3), which possibly matches a weak feature. The
profile change and the shift of the maxima of the absorption bands with temperature were
also illustrated.

Appendix to chapter 3
Numerous researchers have employed and developed cavity ringdown technique
for various purposes, including the spectroscopic study of molecules and clusters. Shortly
after the initial gas cell measurements of O'Keefe and Deacon [14], cavity ringdown was
developed for molecular beam spectroscopy by O'Keefe et al. [21]. In this work, vibronic
spectra were obtained for a variety of transition metal clusters, including the copper
dimer and trimer systems. In this application of cavity ringdown to the study of laser-
generated molecular beams, several potential difficulties were addressed. The transient
nature of the molecular beam, high plasma density, and large shot to shot fluctuations
typical of laser vaporization sources were of primary concern. Although these factors did
in fact limit the attainable sensitivity to 5-10 ppm (fractional absorption) per pass, this
work demonstrated the suitability of the ringdown technique for molecular beam
spectroscopy and underscored the potential of the method for other applications. These
molecular beam investigations have since been extended to include a number of metal
cluster and metal silicide studies.
The next application of the ringdown technique was demonstrated in 1991 by
Benard and Winker [22], who utilized a novel variation of the approach to detect either
the optical gain or loss in a laser-induced chemical reactor. In that experiment, the active
volume of a CO2 laser pumped-flow reactor was situated at the center of a confocal
ringdown cavity (d = 50 cm), at right angles to both the gas flow and CO2 laser pump
axes. The ringdown measurement was performed with an excimer-pumped dye system
and detected with a fast photodiode and oscilloscope at the exit mirror. A delay between
the photolysis laser and ringdown probe laser facilitated buildup of a population inversion
in BiF before spectral interrogation.
In 1993 Yu and Lin [23] reported the first development of the ringdown technique
for kinetics studies. In that work, phenyl radical was generated by laser photolysis of
nitrobenzene, followed by spectral interrogation with the pulsed cavity ringdown
technique. The exponential decay of the photolyzed product was accounted for by
replacing the absorption term in the ringdown expression with an absorption

(concentration) exponential decay factor given by A = Ao exp(-k't'), where k' is the
pseudo-first-order decay constant of phenyl and t' is the time after firing of the photolysis
laser. The absolute values of the second-order rate constants were then determined from
the slopes of the linear k' vs concentration plots. The validity of this approach stemmed
largely from the fact that the lifetime of the photolyzed product (5-10 ms) was orders of
magnitude longer than the associated ringdown times (ca. 25 µs). Lin and co-workers
have tested the accuracy of the cavity ringdown approach described above for kinetics
studies by measuring the rate constant of the NH2 + NO reaction via the NH2 absorption
spectrum at 537 nm [24]. These studies have since been extended to include the C6H5 +
NO C→ 6H5NO reaction [23], wherein the C6H5 absorption band at 505 nm was
monitored, the C6H5 + CCl4 reaction (in the presence of O2) wherein the C6H5O2 product
was investigated via its 510 nm absorption band [25] and further experiments of the NH2
+ NO reaction, again studied via the NH2 absorption at 537 nm [26]. The experiments of
Lin and co-workers demonstrated the feasibility of using the ringdown method for
kinetics studies. In theory, this approach could be extended to faster kinetics processes
than those explored above, as long as the chemical dynamics are significantly slower than
the fitted time region of the ringdown decay. This same application of cavity ringdown
for kinetics studies has also been recently implemented by Zhu and Johnston [27] for
studying the reaction of vinoxy radical with molecular oxygen.
Romanini and Lehmann [28, 29] have used cavity ringdown to obtain overtone
spectra of HCN in static gas cells, in search of chaotic behavior in highly excited
vibrational states. In these experiments, the cavity ringdown spectral intensities for the
HCN (105) overtone were found to be different from those obtained in photoacoustic
studies, but were in agreement with ab initio calculations. In these experiments, a novel
boxcar scheme was utilized to measure the ringdown signal, and a Brillouin cell was
located before the cavity to reject the input laser ASE, which in some cases could
otherwise lead to a reduction in the extracted absorption intensities.
Meijer et al. [30] have extended cavity ringdown into the UV in a study of the 300
nm band of OH obtained in a small Bunsen burner flame. Absorption spectra were
obtained with a multimode dye laser (~1.2 GHz bandwidth) and used to calculate the
temperature of an atmospheric pressure methane-air flame. Mirror reflectivities used in

that work were ca. 99.5%, resulting in very fast decay times and subsequent lower
sensitivity. In the case of flame spectroscopy, small ringdown cavities combined with
small burner dimensions helped to minimize thermal lensing effects (e.g., beam walking),
which can significantly degrade cavity alignment. These effects are more severe at
shorter wavelengths since they are dominated by nonresonant processes that typically
scale exponentially with frequency. In this same study, experiments were performed
wherein narrow band (~5 MHz) cw laser light was coupled into cavities of on- and off-
confocal geometry, which revealed the transverse and longitudinal mode structure of the
ringdown cavity. The researchers then measured the visible absorption spectrum of iodine
with a pulsed laser and nonconfocal cavity geometry and interpreted the absence of
distorted or missing spectral features as being explicitly due to the near-continuous mode
spectrum of the cavity.
Meijer and co-workers have since utilized the cavity ringdown method for the
detection of trace species in the gas phase [31] and have also used the absorption
measurements in a static gas cell to determine the absolute transition strength of the 206
nm Cameron band of CO [32]. Boogaarts and Meijer [33] have also used ringdown
spectroscopy in conjunction with a mass spectrometer and laser desorption apparatus to
estimate the number density of desorbed diphenylamine molecules.
Zalicki et al. [34] have employed cavity ringdown to detect the methyl radical in a
hot filament flow reactor via the 216 nm band. The spatial dependence of the methyl
concentration in the vicinity of the filament was derived from the associated intensity of
the absorption spectrum. In this work, an absorption sensitivity of 20 ppm was reported,
and the broad vibronic band spectra obtained exhibited a signal to noise ratio roughly
four times better than that of previous conventional absorption measurements and
comparable to that obtained in atmospheric pressure flames with the method of
degenerate four wave mixing (DFWM) reported by Sick and co-workers [35]. These flow
reactor studies were further employed to gain insight into the chemistry of diamond film
growth.
Scherer et al. [36] have extended cavity ringdown into the 1.6 and 3.3 µm regions
of the mid-infrared. In that work, a single mode optical parametric oscillator (OPO) laser
system was employed to obtain Doppler limited spectra in static gas cells. In these

studies, the high mirror reflectivities (R > 99.95%) allowed a sensitivity of better than 3
ppm (fractional absorption per pass) to be obtained. Comparison of IR-cavity ringdown
overtone spectra of acetylene obtained in the 1.6 µm region with state-of-the-art
photoacoustic data demonstrated nearly 1 order of magnitude greater sensitivity for IR-
cavity ringdown. IR-cavity ringdown has also been implemented by Scherer et al. as a
nonintrusive diagnostic of chemical species in low pressure flames in the 1.6-4 µm region
[37]. In this work, sensitivity, spectral congestion in high-temperature hydrocarbon flame
environments, and the ability to operate in moderately sooting flames was explored.
Additionally, comparison of the IR-cavity ringdown flame spectra to those obtained by
other infrared methods demonstrated at least 1 order of magnitude greater sensitivity for
IR-cavity ringdown. Cavity ringdown has also been used by Scherer and Rakestraw to
determine the HCO radical concentration in a low pressure flame [38].
Engeln and Meijer [39] have reported the combination of visible cavity ringdown
with a Fourier transform (FT) spectrometer. In this demonstration, broadband laser light
is first coupled into the ringdown cavity and then directed into a commercial FT
instrument. Obtaining an interferogram in combination with the intensity decay of the
resonator allows a spectrum to be obtained with comparable sensitivity to that of
currently available FT systems that employ multipass configurations.
Giles et al. [40] have used cavity ringdown method to obtain the doubly forbidden 3∆-X 1 Σ vibronic transitions in diacetylene in the 396-342 nm region, and Pearson et al.
[41] have employed cavity ringdown for the study of the J-dependent line broadening in
the A-X system of HNO.
These and some other applications of cavity ringdown technique are discussed in
more details in the review article published in 1997 [42].
In 1998 Berden et al. applied cavity ringdown in the environment that is usually
difficult to access, e.i., high magnetic field [43]. They recorded the rotationally resolved
spectra of the b 1 Σ+g (v=0) - X 3 Σ-
g (v=0) band of molecular oxygen in magnetic fields up
to 20 T. Measurements were performed in a 3-cm-long cavity, placed in the
homogeneous field region inside a Bitter magnet. Cavity ringdown absorption spectra
were measured with linearly and circularly polarized light, leading to different ∆M
selection rules in the molecular transition, thereby aiding in the assignment of the spectra.

Dispersion spectra were obtained by recording the rate of polarization rotation, caused by
magnetic circular birefringence, using the polarization-dependent CRD detection scheme.
Similar experiments have been carried out by Romanini et al. in 1999 [44] but the
studied species was naphthalene cation. It was produced in a slit jet coupled with an
electronic discharge, and cavity ring down was used to obtain its absorption spectrum in
the region 645–680 nm. Two of the strongest C10H8+ bands previously characterized by
matrix isolation spectroscopy were found, both with a fractional blue shift of about 0.5%.
This was the first gas-phase electronic absorption spectrum of an ionized polycyclic
aromatic hydrocarbon (PAH) and opened the way for a direct comparison of laboratory
PAH spectra with the diffuse interstellar bands. These experimental results represented an
important step in the spectroscopy of large aromatic ions or radicals in the gas phase.
In 2003 Bieniier et al. obtained the gas-phase electronic absorption spectra of the
naphthalene and acenaphthene cations in the visible range in a free jet planar expansion
using the same approach [45]. The direct absorption spectra of two out of four bands
measured of the gas-phase cold naphthalene cation along with the gas-phase vibronic
absorption spectrum of the cold acenaphthene cation were reported for the first time. This
experiment enabled the intrinsic band profiles to be measured, a key requirement for
astrophysical applications.
Interesting applications of cavity ringdown was described in 2002 by Brown et al.
[46]. They used this method to the simultaneous concentration measurement of nitrate
radical, NO3, and dinitrogen pentoxide, N2O5 in the ambient atmosphere. The sensitivity
for detection of both NO3 and N2O5 was very high (comparable to or better than previous
measurements) and time resolution was significantly better. Furthermore, direct
measurement of N2O5 represented a previously unavailable capability. Concentrations of
both species were measured simultaneously in two separate flow systems and optical
cavities pumped by the same pulsed dye laser at 662 nm. One of the flow systems
remained at ambient temperature for detection of NO3, while the other was heated to 80
°C to induce thermal decomposition of N2O5 providing a measurement of the sum of the
NO3 and N2O5 concentrations. In this experiment for the first time NO3 was measured in
the tropospheric concentration.

Recently cavity ringdown method was used in the studies of photochemically
relevant triplet species [47]. Despite their importance, molecular triplet states have
received relatively little attention in spectroscopic studies. This was primarily due to the
challenge of detecting the spin-forbidden Tn ← S0 transitions. Drucker et al. overcame
these difficulties by applying the CRD method. They measured the vibronically resolved
singlet-triplet spectra of some organic compounds (acrolein, diacetylene, butadiene and
some of the cyclic enones). This success underscored the versatility of the CRD
technique in cases where a very high sensitivity is needed.
In 1997 Romanini et al. employed for the first time a commercial tunable CW
single-frequency laser to demonstrate a new version of the cavity ringdown experiment
[48]. They measured a section of the weak acetylene overtone transition near 570 nm, and
compared to existing photoacoustic data. Their high quality and reproducible Doppler-
limited spectra displayed showed that the CW cavity ringdown is as good as a pulsed
CRD. Most interesting applications of CW-CRDS include high resolution spectroscopy at
low pressure, sub-Doppler absorption spectroscopy in a supersonic jet, and trace-gas
detection using compact diode laser sources. In another experiment they also proved that
even the broad and weak absorption bands could be measured by means of CW-CRDS. It
was demonstrated by the obtaining the absolute absorption spectrum of a weak and broad
overtone transition in CHF3 [49].
In 1998 He et al. demonstrated the extension of diode laser CW-cavity ringdown
spectroscopy into the 1300 nm region, with a simple scheme for frequency matching the
cavity [50]. The technique had a very high instrumental resolution in the sub-MHz range
and was extremely sensitive. In their work they measured the Σ – Σ band ν1+3ν3 of N2O
around 7780 cm-1. The obtained spectra had a well-defined and reproducible baseline,
which was important for quantitative measurements and for observing very weak
absorbances. Absorption bands of CHCl3 between 7700 and 7750 cm-1 have also been
observed. While the assignment for CHCl3 must remain preliminary, they demonstrated
once again that the cavity ringdown technique provides both high resolution and absolute
frequency and intensity accuracy.
CW cavity ringdown method was also successfully applied to measure electronic
spectra of cold carbon chain radicals at very high spectral resolutions. In 2002 Birza et al.

recorded the rotationally resolved origin band spectrum of the A 2Πg - X 2Πu electronic
spectrum of triacetylene cation [51]. The spectrum was recorded before, using both
pulsed cavity ringdown and cw frequency plasma modulation approaches [52]. The
experiment showed that the achievable resolution attained using CW-CRD method is
significantly higher.
All of these studies have clearly established the widespread applicability of cavity
ringdown for sensitive spectroscopic measurements and foreshadow the increased use of
this rapidly developing technique. Cavity ringdown is a direct absorption technique and is
therefore relatively free from the complications and limitations associated with the
molecular internal conversion and excited state predissociation. As a result the method
can be used for studying also systems comprising larger number of atoms. The most
compelling attributes of the method are its simplicity and versatility, combined with an
extraordinarily high sensitivity. This brief description of wide applications of CRD
method shows clearly that the last word has not yet been said.

References
[1] A. S. Pine, W. L. Lafferty, J. Chem. Phys. 78 (1983) 2154
[2] N. Ohashi, A. S. Pine, J. Chem. Phys. 81 (1984) 73
[3] Z. S. Huang, K. W. Jucks, R. E. Miller, J. Chem. Phys. 85 (1986) 3338
[4] C. M. Lovejoy, M. D. Schuder, D. J. Nesbitt, Chem. Phys. Lett. 127 (1986) 374
[5] G. T. Fraser, A. S. Pine, W. L. Lafferty, R. E. Miller, J. Chem. Phys. 87 (1987) 1502
[6] C. Yamada, K. Nagai, E. Hirota, J. Mol. Spectrosc. 85 (1981) 416
[7] H. Petek, D. J. Nesbitt, D. C. Darwin, C. B. Moore, J. Chem. Phys. 86 (1987) 1172
[8] J. W. White, J. Opt. Soc. Am, 32 (1942) 285
[9] D. R. Herriot J. Schulte, Appl. Opt. 4 (1965) 883
[10] A. R. W. McKeller, N. Rich, V. Soots, Appl. Opt. 9 (1970) 222
[11] W. R. Trutna, L. R. Byer, Appl. Opt. 19 (1980) 301
[12] P.G. Lethbridge, A. J. Stace, Rev. Sci. Instrum. 58 (1987) 2238
[13] T. E. Gough, G. Gravel, Rev. Sci. Instrum. 52 (1981) 802
[14] A. O’Keefe, D. A. G. Deacon, Rev. Sci. Instrum. 59 (1988) 2544
[15] M. Kotterer, J. Conceicao, J.P. Maier, Chem. Phys. Lett. 259 (1996) 233
[16] M. Kotterer, J.P. Maier, Chem. Phys. Lett. 266 (1997) 342
[17] The Diffuse Interstellar Bands, eds. A. G. G. M. Tielens and T. Snow, Kluwer,
Dordrecht (1995)
[18] A. E. Douglas, Nature 269 (1977) 130
[19] T. Motylewski, H. Linnartz, Rev. Sci. Instrum. 70 (1999) 1305
[20] T. Motylewski, H. Linnartz, O. Vaizert, J.P. Maier, G. A. Galazutdinov, F. A.
Musaev, J. Krelowski, G. A. H Walker, D. A. Bohlender, ApJ, 531 (2000) 312
[21] A. O'Keefe, J. J. Scherer, A. L. Cooksy, R. Sheeks, J. Heath, R. J. Saykally, Chem.
Phys. Lett. 172 (1990) 214
[22] D. J. Benard, K. B. Winker, J. Appl. Phys. 69 (1991) 2805
[23] T. Yu, M. C. Lin, J. Am. Chem. Soc. 115 (1993) 4371
[24] T. Yu, M. C. Lin, J. Phys. Chem., 98 (1994) 2105
[25] T. Yu, M. C. Lin, J. Phys. Chem. 98 (1994) 9697

[26] E. W. Diau, T. Yu, M. A. G. Wagner, M. C. Lin, J. Phys. Chem. 98 (1994)
4034
[27] L. Zhu, G. Johnston, J. Chem Phys. 99 (1995) 15114
[28] D. Romanini, K. K. Lehmann, J. Chem. Phys. 99 (1993) 6287
[29] D. Romanini, K. K. Lehmann, J. Chem. Phys. 102 (1995) 633
[30] G. Meijer, M. G. H. Boogaarts, R. T. Jongma, D. H. Parker, A. M. Wodtke,
Chem. Phys. Lett. 217 (1994) 112
[31] R. T. Jongma, M. G. H. Boogaarts, I. Holleman, G. Meijer, Rev. Sci.
Instrum. 66 (1995) 2821
[32] R. T. Jongma, M. G. H. Boogaarts, G. Meijer, J. Mol. Spectrosc. 165 (1994) 303
[33] M. G. H. Boogaarts, G. Meijer, J. Chem. Phys. 103 (1995) 5269
[34] P. Zalicki, Y. Ma, R. N. Zare, E. H. Wahl, T. G. Owano, J. S. Harris, C. H. Kruger,
Chem. Phys. Lett. 234 (1995) 269
[35] V. Sick, R. L. Farrow, Opt. Lett. 11 (1995) 111
[36] J. J. Scherer, D. Voelkel, D. J. Rakestraw, J. B. Paul, C. P.Collier, R. J. Saykally, A.
O'Keefe, Chem. Phys. Lett. 245 (1995) 273
[37] J. J. Scherer, D. Voelkel, D. J. Rakestraw, Appl. Phys. B: Lasers Opt. 64 (1997) 699
[38] J. J. Scherer, D. J. Rakestraw, Chem. Phys. Lett. 265 (1997) 169
[39] R. Engeln, G. Meijer, Paper presented at the 51st Ohio State University Symposium
on Molecular Spectroscopy, 1996.
[40] B. Giles, C. A. Arrington, F. C. Hagemeister, T. S. Zwier, Paper presented at the
51st Ohio State University Symposium on Molecular Spectroscopy, 1996.
[41] J. Pearson, A. J. Orr-Ewing, M. N. R. Ashfold, R. N. J. Dixon, Chem. Soc., Faraday
Trans. 92 (1996) 1283
[42] J. J. Scherer, J. B. Paul, A. O’Keefe, R. J. Saykally, Chem. Rev. 97 (1997) 25
[43] G. Berden, R. Engeln, P. C. M. Christianen, J. C. Maan, G. Meijer, Phys. Rev. A 58
(1998) 3114
[44] D. Romanini, L. Biennier, F. Salama, A. A. Kachanov, L. J. Alalmandola, F.
Stoeckel, Chem. Phys. Lett. 303 (1999) 165
[45] L. Biennier, F. Salama, L. J. Alalmandola, J. Chem. Phys. 118 (2003) 7863
[46] S. S. Brown, H. Stark, S. J. Ciciora, R. J. McLaughlin, A. R. Ravishankara, Rev.

Sci. Instrum. 73 (2002) 3291
[47] S. Drucker, J. L. Van Zanten, N. D. Gagnon, E. J. Gilles, N. R. Pillsbury, J. Mol.
Struct. in press
[48] D. Romanini, A. A. Kachanov, N. Sadeghi, F. Stoeckel, Chem. Phys. Lett. 264
(1997) 316
[49] D. Romanini, A. A. Kachanov, F. Stoeckel, Chem. Phys. Lett. 270 (1997) 546
[50] Y. He, M. Hippler, M. Quack, Chem. Phys. Lett. 289 (1998) 527
[51] P. Birza, T. Motylewski, D. Khoroshev, A. Chirocolava, H. Linnartz, J.P. Maier,
Chem. Phys., 283 (2002) 119.
[52] D. Pfluger, T. Motylewski, H. Linnartz, W.E. Sinclair, J.P. Maier, Chem. Phys.
Lett. 329 (2000) 29

CHAPTER 4
4. Experiment
The experimental set-up consists of a standard cavity ring down unit sampling the
plasma generated in a pulsed supersonic slit jet expansion. The latter is located in a large
stainless-steel cross-piece, evacuated by a roots blower system. The tunable radiation is
generated by an excimer pumped dye laser system. The light exiting the ring down cavity
is detected by a photodiode. This signal is displayed on a 300 MHz 8-bit digital
oscilloscope. A spectrum is recorded by measuring τ as function of the wavelength of the
laser (running at 30 Hz). Typically 45 ring down events are averaged at each wavelength
before the digitized data are downloaded to a workstation, that is also used to control the
scanning procedure. The main layout of the experimental set-up is shown in Figure 4.1
and the detailed description of main parts of it is given below.
4.1. Lasers As a source of the tunable light the SCANmate 2E laser (Lambda Physik) was
used. It offered a tuning range from about 340 nm to 900 nm using a variety of dyes. As a
solvent methanol (Fluka, “rein”) and DMSO (Merck, “for synthesis”, dried with
molecular sieves) were used. The dye laser was pumped by a pulsed 308 nm XeCl
excimer laser (COMPEX 110 Lambda Physik) with the energy of the pulse around 120
mJ. The resulting power depended strongly on the used dye, range, alignment and
presence of an etalon in the oscillator cavity. Typical value of output energy was ~0.5 - 3.0 mJ. The linewidth (FWHM) of the dye laser was about 0.1 - 0.15 cm-1 without
intracavity etalon and ~ 0.04 cm-1 with the etalon inserted into the cavity.


The laser was tuned by turning the diffraction grating (and optionally also the
etalon). The SCANmate was communicating with the computer via a multimode optics
fiber interface using Lambda Physic protocol. The commands were sent by the
“scanmate” program delivered by Lamda Physik running under DOS 6.22. To attain
greater flexibility and immunity instead of serial connection (RS 232) TCP/IP Ethernet
connection was used. The “scanmate” program was run in a DOS emulator environment
running under Linux. It received commands via a virtual serial port connected to an
intermediate Linux process rgpib_svc (remote GPIB server) which in turn communicated
with the scan control program lcmeter using TCP/IP/RPC pcontrol. Etalon scans require
manual finding of the etalon so called “normal positions” and synchronizing the etalon
with the grating set to the desired wavelength. During this alignment the spectral purity
of the generated laser light was optimized by a monitor etalon. (One looked through the
monitor etalon at the laser light dispersed through a lens and cast on a sheet of white
paper.) Both etalon single mode operation and the intensity of ASE (amplified
spontaneous emission) could be checked easily this way.
The output beam from the dye laser was directed into the chamber by a special
optical system consisting of two prisms and a telescope (Two CC lenses with f=150mm).
The telescope was equipped with the 100 µm pinhole. Such a system allowed the laser
beam to be spatially filtered only for TEM00 mode and focused exactly inside the cavity
where absorption process took place.
4.1.1. Calibration
Mainly two independent methods were used to calibrate the wavelength. A
reference most frequently used was the absorption spectrum of I2 vapor. The spectrum of
I2 was measured simultaneously with the CRD spectrum. Approoximately 10 % of the
laser light was reflected through a beamsplitter towards a 1 m long cell filled with
saturated I2 vapor at room temperature. Before the beam entered the cell it passed
through a neutral filter, passing ~0.5-5% of the light to avoid power saturation of
absorption lines. The light was detected by a Hamamatsu ST336-44BQ photodiode which

was connected to the second channel of a digital LeCroy 9310 oscilloscope (1MΩ input
impedance) in parallel with a 100 nF capacitor and the 330 Ω resistor. The capacitor was
necessary to elongate the detected pulse to the time scale of 10-20 µs comparable with
the ring-down signal recorded on the first input of the oscilloscope and to avoid signal
saturation.
Iodine absorption spectrum could be observed in the range of 490 - 650 nm. The
recorded I2 spectra were loaded into the xmgr program and shifted together until
measured iodine spectrum overlaped with the “reference I2 spectrum”. The reference
spectrum was generated by iod.perl program from a list of the lines positions and
intensities [2]. The accuracy of the iodine calibration was around 0.1 cm-1 for low
resolution spectra and 0.01-0.02. cm-1 for the high resolution (with the intracavity etalon).
Outside of the range of 490 - 650 nm I2 lines were to weak to be detected. Hence,
other calibration methods had to be used. In most cases absorption lines of excited rare
gas atoms (He, Ne) could be found in the vicinity (a few nm distance) of the region to be
calibrated. Usually lines on both sides of the calibrated region were used and the
spectrum was corrected by the average shift of the atomic absorption lines measured in
the supersonic expansion excited by the discharge. The resulting accuracy of this
calibration was ~0.3 cm-1.
4.2. CRD Cavity The high finesse optical cavity is the most characteristic of the CRDS experiment.
It consisted of two plano-concave dielectrically coated mirrors facing each other. The
mirror housings of the cavity mirrors were connected with flexible bellows to the
opposite sides of the cross piece, defining a closed cavity of 52 cm in length. In order to
protect the mirrors against the dust, a stream of helium was injected into the mirror holder
forming very effective “helium curtains”. The stream gas was flushing out the mirror and
as a result a deposition of contaminants on the surface was significantly prevented. The
flow was regulated manually to obtain a pressure in the vacuum chamber at the level of
~0.02 mbar. The alignment of the mirrors was achieved by adjusting high precision

threaded screws. Two tilted quartz windows were fixed outside the cavity to seal the
chamber.
4.2.1. Mirrors
The most important part of the cavity, high reflectivity dielectric mirrors, were
manufactured by Research Electro Optics Inc, Boulder, Colorado USA. The radius of the
curvature of the mirrors used in the experiments was 1 m and diameter 7.75 mm
(diameter of coated surface minimum 5 mm). The thickness of the quartz mirror substrate
was 4 mm. The width of the multiple dielectric layers is matched to cause positive
interference of light reflected from them for a given wavelength range (up to 10% from
the specified wavelength). The reflectivity coefficient of the mirrors used in the
experiments was around 99.98 - 99.998 %. It depended on the wavelength and the type of
the mirror. Such high reflectivity could not be achieved using metal mirrors. Still another
advantage of dielectric mirrors is very low absorption. The light which was not reflected,
passed through the mirror.
4.3. Detection system
As a light detector a broad band UV-VIS-NIR silicon photodiode (ST336-44BQ
Hamamatsu) was used. The sensitivity of the diode was in the range 190-1100 nm and the
active area was 3.6x3.6 mm. In order to increase the signal a fast, low noise amplifier
LM6365N was applied. In order to cut off the light coming from the plasma and decrease
the amplified spontaneous emission level, the filter (transmission λ0 ± 20 nm) was placed
in front of the photodiode. The signal was recorded on a 300 MHz digital oscilloscope
(LeCroy 9310) where the digitalization of the data took place. 45 laser shots were
averaged by the oscilloscope and transmitted via GPIB to a PC computer.

4.4. Data acquisition system
The system of three PC computers was used to run the whole experiment. The
CRDS machine was used for main control of the experiment and the data storage. Work
of the laser was controlled by PC-107sm. For the triggering and pressure control PC-
107motyl was responsible. The software used for the triggering, data acquisition, laser
scanning control and steering the experiment was written by Motylewski and is described
in details in his Ph. D. thesis [2].
4.5. The vacuum chamber The vacuum chamber consisted of a large stainless-steel cross-piece (30 cm in
diameter and about 20 dm3 capacity) evacuated by a roots blower system with a total
pumping capacity of 2775 m3/h. The pressure attained in the chamber without the plasma
was at the level of ~5.0 * 10-3 mbar. The working pressure in the chamber varied from
~0.08 to ~0.25 mbar. The stability of the plasma could be monitored visually through a
pyrex window (25 cm in diameter) installed on the one of the sides of the cross piece.
4.6. Discharge source The carbon chain radicals were produced in a pulsed slit nozzle incorporating a
discharge in a high pressure expansion. The orifice was made of two sharp stainless steel
jaws forming the actual slit (30 mm × 300 mm), a ceramic insulator, a grounded metal
plate and another ceramic insulator. Both insulators and metal parts were mounted to the
body of the nozzle with electrically isolated screws. A pulsed negative voltage (ranging
from -350 to -1000V) was applied to both jaws via two separate 3.8 kΩ ballast resistors
(max. current ~ 300 mA.) The duration of a discharge and gas pulses were 100 - 300 µs
and 1.1 ms, respectively. The inner metal plate was grounded while the body floated. The
latter was important in order to shield the pulsed valve from internal high voltage arcing.
It furthermore prohibited carbon dust formation inside the body. A multichannel system

inside the nozzle regulated the gas flow towards the slit which significantly reduced the
Doppler broadening. The distance of the slit nozzle to the optical axis was regulated
manually during jet operation and varied from 2 to 10 mm via a translation stage.
4.6.1. Heating system for B3 production.
The B3 molecules were produced in the source which was modified because the
gaseous gas precursor could not be used in this case. As the solid sample (decaborane,
Strem, 98% purity) was used, the heating oven had to be implemented. It consisted of a
cylindrical metal reservoir (8 mm in diameter and 20 mm in length) which was placed
into the main steel body of the oven (19 mm in diameter and 74 mm in length). The
perforation (2 µm pore size) on the bottom of the reservoir allowed an undisturbed flow
of the carrier gas. The main body of the oven was heated with a heating system. It
consisted of a metal sleeve coiled inside with a coaxial resistant wire. The temperature
was set via an external power supply and controlled with a thermocouple. Analogous
heating system was used to heat the pulsed valve. The latter had to be heated to avoid the
condensation of the boron species in the valve and on the internal edges of the slit nozzle.
The transmission of the heat through the metal elements was high enough to maintain the
whole production system (the oven, the valve and the body of the nozzle) at the
appropriate temperature (~80 °C). The temperature of the valve was also controlled with
another thermocouple. The detailed scheme of the source of B3 is shown in Figure 4.2.
4.6.2. Gas mixing system
The gas mixtures passing through the discharge were prepared in a convenient on-line
mixing system. It consisted of a 3.2 dm3 steel chamber with an electronic pressure meter
and three input magnetic valves. Gas bottles were used to supply the input lines with
appropriate gases.

1
2 3
4
5 6
7
8
9
10
11
Figure 4.2. Cross section of the high pressure slit nozzle discharge used for the
production of the B3 molecules. The orifice consist of two ceramic insulators (2), a metal
plate that is grounded (4), two sharp stainless steel jaws (3) that form the actual slit
30mm 300µm. Both insulators and metal parts are mounted to the body of the nozzle
(6) by electrically isolated screws (1). The floating body of the nozzle is connected to an
electromagnetic pulsed valve (7). A small plastic poppet (5) controls the gas flow into the
nozzle volume. The valve is connected to the oven (9) where the sample basket filled
with decaborane is inserted (10). Both the oven and the valve are heated by two
independent electric heating systems (8). The system is supplied with the carrier gas
(Ne) entering the source through the inlet (11).
×

Usually they were the 1% mixtures of C2H2 or C2D2 and pure helium, argon or
neon as a carrier gas. The mixing ratio of the gases was equal to the relative frequency of
the pulses opening each input valve. The gas pulse duration was supposed to be set
manually in such a way that the equal amount of gas entered the chamber in a single
pulse of each valve [2]. Typical backing pressure used during the experiments was ~10
bar.
4.6.3. High voltage power supply
The Velonex 345-F high voltage power supply was used to ignite the discharge.
The potential applied to the electrodes was controlled by setting an HV pulse amplitude
knob. Usually it ranged from –350 to –1000 V. Resistors of 3.8 kΩ were used to limit the
maximum current (~300 mA). Duration of a single pulse was 100 - 300 µs.

References
[1] T. Motylewski, H. Linnartz, Rev. Sci. Instrum. 70 (1999) 1305
[2] T. Motylewski, Ph. D. Thesis, University of Basel (2001)

CHAPTER 5 5. Studies of HC2nH+ species
Polyynes and their derivatives have been under examination because they are
present in the interstellar medium. It was also proposed that some of polyynes may be
responsible for the origin of the diffuse interstellar bands [2-5]. They are also considered
as an important intermediate species in plasmas, combustion [1], and interstellar gas-
phase ion-molecule reaction schemes. It is important to study electronic transitions of
these species in order to understand their role in such environments.
They are open-shell HC2nH+ species with 2Π ground state arising from π3
configuration. 2Π – X 2Π electronic transitions due to the π-π promotion in these species
have strong absorptions in the region observed DIBs, i.e., 400-900 nm. The strong
electronic transitions have 2Πu – X 2Πg symmetry and shift to the red with increasing
number of carbon atoms. Members of the series HC2nH+ (n = 2, 3, 4) have been a subject
of previous spectroscopic studies in the gas phase. In 1952 Schueler and Reinbeck
obtained the first electronic spectrum of a polyacetylene cation [6]. It was assigned by
Callomon to the A 2Πu – X 2Πg electronic origin band transition of diacetylene cation [7].
This provided the first example of the emission spectrum of an organic cation comprised
of more than three atoms. It was also rotationally resolved and analyzed, however,
absolute numbering remained ambiguous which led to uncertainty in the derived
constants. The situation changed in 1986 when Kuhn et al. discussed and established the
absolute rotational numbering of HC4H+ and DC4D+ [8]. It was done by recording the
A 2Πu – X 2Πg emission spectrum of the diacetylene and dideuteroacetylene cations at
low rotational temperature (~10 K) by means of a supersonic jet expansion. A mixture of
diacetylene (or dideuteroacetylene) and helium was expanded through a nozzle into
vacuum. The supersonic jet was struck by an electron beam and the resulting
fluorescence was detected. This led to an observation of the lowest Q-branch transitions.
Their position enabled to choose unambiguously from the two possible sets of rotational

constants. The latter were also obtained anew by analysis of the rotational resolved
structure of the origin band in the A 2Πu – X 2Πg laser excitation spectra of HC4H+ and
DC4D+. Rotational analysis was carried out by the direct approach whereby the lines
positions were fitted to the eigenvalues of an appropriate Hamiltonian matrix [9].
Lecoultre at al. reported the complete rs structure of the diacetylene cation in the
X 2Πg and A 2Πu electronic states [10]. The bond-lengths in the X 2Πg and A 2Πu
electronic states were inferred using the method of Kraitchman. The method allows the
determination of the position of an atom in a molecule from spectroscopic measurements
on its isotopic species [11]. In order to do it, the rotational constants of the isotopic
derivatives where the carbon atoms have been substituted by 13C have to be known. It
was attained by recording the rotationally resolved origin bands in the A 2Πu – X 2Πg
laser excitation spectra of H-13C-C-C-C-H+ and H-C-13C-13C-C-H+ and their subsequent
analysis. From the determined rotational constants as well as from those known for
HCCCCH+, DCCCCD+, all the bond-lengths in the two electronic states have been
inferred. Calculated bond-lengths changes stay in agreement with the study of the Frank
Condon factors in the photoelectron spectrum of diacetylene [12] and molecular orbital
considerations of the electronic structure [13].
Vaizert et al. also studied HCCCCD+ by means of spectroscopy [14]. The
HCCCCD+ cations were produced in a high pressure planar plasma expansion by
discharging a gas pulse of HCCH/DCCD mixture in argon in the throat of the slit nozzle
[15]. The spectrum was measured using cavity ring down spectroscopy. The analysis of
the spectra allowed an accurate determination of the rotational parameters. The change in
the overall length of the diacetylene cation upon electronic excitation was calculated
using the metod of Kraitchman. Resulting H-H distance in the ground and excited states
were in good agreement with the previous isotopic studies [10].
The A 2Πg – X 2Πu band system of triacetylene cation was first detected by their
emission spectra of molecular beams excited by controlled electron impact in 1976 by
Allan et al. [16]. The identification of the transition was compared with the photoelectron
spectrum of triacetylene [13] and the emission spectrum of diacetylene cation [7]. The
lifetimes of the lowest vibrational level of the A 2Πg excited state have been also
measured. In 1984 more information on the HC6H+ was obtained when the emission and

laser excitation spectra of A 2Πg – X 2Πu transition of the rotationally and vibrationally
cooled HC6H+ in the gas phase was recorded in analyzed by Klapstein et al. [17]. The
emission was excited by electron impact of a seeded supersonic free jet and the
fluorescence by laser excitation of the cations formed by Penning ionization in a liquid
nitrogen cooled environment. The resolution of the spectra was better than the former one
[16] and this made the vibronic analyses possible. The vibrational frequencies of the
totally symmetric fundamentals could be inferred for the triacetylene cation in the X 2Πu
and A 2Πg states.
The spectrum of the A 2Πg – X 2Πu origin band system of HC6H+ and its isotopic
derivatives: HC6D+ and DC6D+ have been also studied at Doppler-limited resolution
using frequency modulation absorption spectroscopy by Sinclair et al. [18]. The ions
were generated in a liquid nitrogen cooled hollow cathode discharge incorporated in a
White cell. A discharge modulation in combination with the frequency modulation
technique enhanced the sensitivity of the detection and improved significantly signal-to-
noise ratio. Analysis of the rotational structure provided information on the geometry of
triacetylene cation together with accurate spin-orbit interaction constants in the two
electronic states. Further improvement in the quality of the spectra was possible when
frequency modulation absorption technique was combined with a supersonic jet [19].
The tetraacetylene cation was first studied in 1976 in the gas phase through the He
58.4 nm excited photoelectron spectrum of the neutral parent. This study identified the
four low 2Π states [20]. Electron impact excitation of the neutral tetraacetylene in an
effusive source resulted in an observation of the origin band of the A 2Πu – X 2Πg
emission [16]. The rotationally resolved A 2Πu – X 2Πg electronic origin band spectrum
of HC8H+ and its deuterated derivative DC8D+ has been recorded in the gas phase by
applying both using frequency modulation absorption spectroscopy in a liquid nitrogen
cooled hollow cathode discharge and cavity ring down spectroscopy in a supersonic
planar plasma [21]. The frequency modulation spectrum was obtained at a high
resolution, however determination of an unambiguous numbering in the rotational
structure was not possible. The problem was solved when the cavity ringdown spectrum
was obtained. It was measured with low resolution but changes in the rotational profile

on cooling the ions to very low rotational temperatures (~15 K) allowed the appearance
of the prominent Q-branch to be identified and the absolute numbering to be established.
5.1. Matrix studies
In 1994 Freivogel et al measured in the visible and near infrared region
absorption spectra for a series of mass selected HC2nH+ systems (n = 2, 3, 4, 5, 6, 7, 8)
isolated in neon matrices at 5 K [22]. The species were produced in a hot-cathode
discharge of 30% diacetylene in helium. Subsequently they were deflected, mass-selected
in a quadrupole mass filter and trapped in neon matrices where they were characterized
through their electronic absorption spectra. Positions of A 2Π – X 2Π origin bands as well
as fundamental vibrational frequencies in the excited state have been obtained.
Assignment of band carriers (n = 2, 3, 4) displayed in Figure 5.1 has been determined
from experimental and theoretical considerations. Further evidence for their identity was
provided by comparison with the gas-phase data. Laser induced fluorescence and
emission spectra of diacetylene, triacetylene and tetraacetylene cations were known [16]
and agreed quite well with matrix isolation data of the respective mass selected systems.
In each case, the gas to neon matrix shift of the band origin was less than one percent of
the transition frequency. The correlation between the carbon chain length and the
positions of the band origin maxima was also found. It was clearly visible that the origin
bands for this set of spectra are shifted by ~100 nm to longer wavelength with each
addition of a CC unit. Smith et. al also carried out the matrix study of polyacetylene
cations [23]. The species were produced in an electric discharge of acetylene diluted in
the matrix gas. Well resolved laser excitation and fluorescence spectra of tri- and
tetraacetylen cations were analyzed and compared with available gas phase data, as well
as with mass selected matrix results mentioned before [22].

4 8 0 5 2 0 5 6 0 6 0 0 6 4 0
0 . 0
0 . 6
1 . 200 0
Abs
orba
nce
H C 6 H +
6 0 0 6 4 0 6 8 0 7 2 0 7 6 0
0 . 0
0 . 7
1 . 400 0
Abs
orba
nce
H C 8 H +
6 8 0 7 2 0 7 6 0 8 0 0 8 4 0 8 8 0
0 . 0
0 . 3
0 . 6
00 0
Abs
orba
nce
W a v e le n g t h [ n m ]
H C 1 0 H +
Figure 5.1. The spectra of the A 2Π - X 2Π transitions of tri-, tetra-, and pentaacetylene cations recorded in the 5 K neon matrices [Ref. 22].

The observed differences in spectra (broader line-widths in the mass selected
studies) could be explained with a help of inhomogeneous effects and matrix damage
caused by the bombardment with the high energy ionic species.
Sobolewski and Adamowicz calculated the absorption spectra corresponding to
the transitions to the lowest electronically excited states of the HC2nH+ species (n=2, 3, 4)
using the second order perturbation theory [24]. They used the theoretical scheme which
was based on the complete-active-space self-consistent-field (CASSCF) method, with
remaining dynamic electron correlation effects added in the subsequent step with the use
of the second-order perturbation theory with the CASSCF wave function as the reference
state (CASPT2) [25]. These ab initio calculations confirmed previous results that the
ground states of the polyacetylene cations have the 2Π symmetry and the oscillator
strength for the dipole allowed transitions from 2Π state is relatively high (f > 10 –2 for
the strongest bands). Energy of the lowest dipole allowed transitions they calculated
coincided quite well with the experimental observations. When it comes to the next
member in the series, HC10H+, the density functional theory calculations (DFT) were
performed in 1998 by Betowski et al. [26] and predicted the linear structure for this
molecule.
5.2. Gas-phase study of the pentaacetylene cation
As it was mentioned before, carbon chains are quite feasible candidates for carrier
of diffuse interstellar bands. This hypothesis is especially rational for longer molecules
[27]. Therefore it seemed reasonable to check if absorption bands of the HC2nH+ species
(with high n) match some DIBs. Former studies, described earlier in this chapter, showed
that in the case of HC4H+, HC6H+ and HC8H+ such a match was not observed. The next
molecule in the series, e. i., HC10H+ was a more promising chain as a longer one. On the
other hand, it was clear that the resolution of the laser used in the experiment will not
yield the rotationally resolved spectrum. (The rotational constant B was much smaller
than the resolution of the laser.) Despite this fact it was clear that one should observe two
separate bands of the two spin-orbit components. Another difficulty was linked up with

the region in which HC10H+ absorbs. The origin band of pentaacetylene cation lies in the
IR region and it caused some technical problems with the alignment of the laser system.
Also the performance of the dye left much to be desired. In spite of these problems, based
on the work of Freivogel et al. [22], the search for the gas-phase observations of
pentaacetylene cation could be started. The matrix spectrum of HC10H+ comprise a strong
origin band around 12143 cm-1 and a series of weaker bands corresponding to vibrational
excitation in the upper electronic state. The gas-phase experiment was focused on the
investigation of the origin band. These investigations turned out to be successful and the
origin band of HC10H+ in the gas phase was finally recorded. The results of this study are
presented below.

Electronic Gas-Phase Spectrum of the Pentaacetylene Cation†
P. Cias, O. Vaizert, A. Denisov, J. Mes,§ H. Linnartz, # and J. P. Maier*Department of Chemistry, Klingelbergstrasse 80, CH 4056 Basel, Switzerland
ReceiVed: February 27, 2002; In Final Form: June 25, 2002
The origin band of the A2Πu-X2Πg electronic transition of the linear pentaacetelyne cation, HC10H+, andisotopic derivatives, HC10D+ and DC10D+, has been recorded in the gas phase. The absorption spectrum wasobserved by cavity ring down spectroscopy through a supersonic planar plasma expansion. The spectrumcomprises both spin-orbit components with resolved P- and R-branches. Contour fits allow the determinationof ground and excited state spectroscopic constants.
Introduction
The polyacetylene cations, HCnH+, are open-shell specieswith a 2Π ground state. The strong electronic transitions have2Πu-X2Πg symmetry and shift to the red with increasingnumber of carbon atoms. Rotationally resolved electronic spectrahave been recorded previously in the gas phase for the evenmembers withn ) 2 at 255.7 nm,1 n ) 4 at 507.0 nm,2,3
n ) 6 at 600.4 nm,4,5 andn ) 8 at 707.1 nm.6 Little is knownon the next member in the series, the pentaacetylene cationHC10H+. Density functional theory calculations7 and ion chro-matography8 predict a linear structure. It was shown thatHC10H+ is formed in an ion trap upon collision activatedprocesses on polycyclic aromatic hydrocarbons.9 Furthermore,this cation may be of interest from an astrophysical point ofview. It has been argued that electronic transitions of carbonchains may be among the carriers of unidentified absorptionfeatures in diffuse interstellar clouds.10 Particularly longer chainsare of interest as these are expected to be photo stable.
The first experimental observation of the A2Πu-X2Πg
electronic spectrum of HC10H+ was in a neon matrix using massselective deposition;11 the transition was found to comprise astrong origin band around 823.3 nm and a series of weaker bandscorresponding to vibrational excitation in the upper electronicstate. In the case of the smaller polyacetylene cations, thetransitions in the gas phase are typically blue-shifted 100-130cm-1 with respect to the matrix value, that is, the unperturbedorigin band of HC10H+ is expected between 814.5 and816.5 nm.
Experiment
The wavelength range around 815.5 nm was scanned usingcavity ring down (CRD) spectroscopy. CRD has become apowerful tool for the study of the structural and dynamicalproperties of molecules in the gas phase.12 One of the reasonsfor this success is the conceptual simplicity of a CRD experi-ment. A small fraction of laser light is coupled into an optical
cavity of lengthL consisting of two mirrors with a reflec-tivity close to unity. The light leaking out of the cavity hasan envelope, which is simply a first-order exponential decay,exp(-t/τ). The ring down time,τ, reflects the rate of absorptionrather than its magnitude, and as such the method is independentof power fluctuations. In addition, very long absorption pathlengths are obtained by confining light tens of microseconds tothe cavity. A spectrum is recorded by measuringτ as functionof the laser frequency.
In the present experiment, a standard pulsed CRD spectrom-eter with a resolution of 0.15 cm-1 is used to sample a pulsedsupersonic plasma, generated by discharging a mixture of 0.3%HCCH (or DCCD or both) in He (-600 V, 100 mA) in thethroat of a 300 mm× 300 µm multichannel slit nozzlegeometry.13 This system combines high molecular densities andrelatively large absorption path lengths with an effectiveadiabatic cooling. The best S/N ratios are found when the CRDbeam intersects the expansion 3 mm downstream from thenozzle orifice. The light exiting the optical cavity is focusedvia a narrow band-pass filter onto a broad band Si photodiodeand is monitored by a fast oscilloscope. Typical ring down timesamount toτ ) 50 µs. For a cavity of lengthL ) 52 cm, this isequivalent to approximately 29 000 passes through the plasmaor an effective absorption path length of 865 m. The presentdata set is calibrated via the internal reference system of thedye laser, yielding an absolute accuracy on the order of0.5 cm-1 around 815 nm.
Results and Discussion
For an A2Πu-X2Πg electronic transition of a linear molecule,one expects to observe two separate bands (each consisting ofa P-, Q-, and R-branch) of the two spin-orbit transitionsA2Π3/2-X2Π3/2 and A2Π1/2-X2Π1/2. The intensity ratio of thetwo bands is determined by the spin-orbit temperature (Tso)and the spin-orbit splitting in the ground state (A′′). The latteris expected to be close to the value found for the tri- andtetraacetylene cations,-31 cm-1. The minus sign indicates thatthe ground state is invertedsas was observed for the smallerpolyacetylene chains5,6si.e., theΩ ) 3/2 component is belowΩ ) 1/2. The separation between the two bands in the spectrumis given by the difference in spin-orbit constants in excitedand ground state (∆A ) A′ - A′′) and is expected to be on theorder of 3 cm-1.
The origin band in the A2Πu-X2Πg electronic transition ofHC10H+ is shown in the left part of Figure 1. The band contour
† Part of the special issue “Jack Beauchamp Festschrift”.* To whom correspondence should be addressed. E-mail: J.P.Maier@
unibas.ch.§ Visiting scientist, Laser Centre, Department of Physics and Astronomy,
Vrije Universiteit, De Boelelaan 1081, NL 1081 HV Amsterdam, TheNetherlands
# Address from 01/09/2002: Department of Physical Chemistry, VrijeUniversiteit, De Boelelaan 1083, NL 1083 HV Amsterdam, The Netherlands.
9890 J. Phys. Chem. A2002,106,9890-9892
10.1021/jp020558o CCC: $22.00 © 2002 American Chemical SocietyPublished on Web 08/10/2002

of both spin-orbit components is visible, even though there issome overlap with the absorption lines of another species,presumably C2. The band is not rotationally resolved be-cause the rotational constant of HC10H+ is on the order of0.01 cm-1 and the best laser resolution obtained with an internaletalon was 0.035 cm-1. In addition, lifetime broadening mightoccur as result of intramolecular processes. It is possible,however, to interpret the band contours in terms of unresolvedP-, Q- and R-branch contours of the A2Π3/2-X2Π3/2 andA2Π1/2-X2Π1/2 electronic transitions. This is demonstrated inthe figure with stick diagrams.
The observed rotational profiles were simulated to determinethe band origin position and to estimate the spectroscopicconstants, using PGopher.14 The ground state spin-orbit splittingis assumed to be similar to that found for the tri- andtetraacetylene cations,-31 cm-1. The intensity ratio of the twospin-orbit bands yieldsTso ) 45(5) K, which will be close tothe rotational temperature,Trot. This value is higher than thatin previous experiments (e.g., ref 15) and a direct consequenceof measuring closer to the slit nozzle orifice; further down-stream the shoulder at lower energy disappears and only theA2Π3/2-X2Π3/2 band is observed. The ground-state rotationalconstantB′′ ) 0.009 88 cm-1 is calculated from a recent abinitio density functional theory geometry optimization thatgives H-C1 ) 1.068 Å, C1-C2 ) 1.219 Å, C2-C3 )1.330 Å, C3-C4 ) 1.240 Å, C4-C5 ) 1.311 Å, and C5-C6) 1.246 Å,7 reflecting a single-triple bond alternation.16 Agood simulation is obtained for an origin band value ofT0 )12 260.4(5) cm-1, blue-shifted 117 cm-1 with respect to thematrix value and with excited-state valuesA′ ) -28 cm-1 (i.e.,∆A ) 3 cm-1) and B′ ) 0.009 82 cm-1. The latter value isexpected to be accurate to within a few percent. The ratioB′′/B′ ) 1.007 is close to unity; for a chain as long as HC10H+,only a minor change in molecular geometry is expected uponelectronic excitation. For smaller chains, the effect is morepronounced. This can be seen from Table 1 in which the param-eters of a number of polyacetylene cations HCnH+ are compared.
For larger n, the rotational constantsB decrease, the ratioB′′/B′ decreases as well, and there is a monotonic shift of theorigin band to the red. The oscillator strength increases withn,which holds promise for the extension of the experimentalapproach to measure the electronic spectrum of even longerspecies.
Figure 1. A smoothed laboratory spectrum of the A2Πu-X2Πg electronic origin band transition of HC10H+ (left side) and DC10D+ (right side)recorded in absorption using cavity ring down spectroscopy with 0.15 cm-1 resolution. Both spin-orbit components are visible, as can be concludedfrom the stick diagram. The latter shows the simulation for a rotational temperature ofTrot ) 45 K and molecular parameters as listed in Table 1.The dashed line shows the simulation for the unresolved spectrum.
TABLE 1: Comparison of the Spectroscopic Constants ofLinear Chains HCnH+, DCnD+, and HCnD+a
HCnH+
n ) 4b n ) 6c n ) 8d n ) 10e,f
T0 19 722.610(2) 16 654.6873(3) 14 143.1815(5) 12 260.4(5)B′′ 0.146 888(22) 0.044 594(3) 0.019 078(9) 0.009 88(3)B′ 0.140 083(22) 0.043 792(3) 0.018 867(9) 0.009 82(3)B′′/B′ 1.049 1.018 1.011 1.007A′′ -33.5(1.9) -31.40(28) (-31) (-31)A′ -31.1(2.0) -28.41(28) (-28) (-28)∆A 3 3
HCnD+
n ) 4g n ) 6c n ) 8g n ) 10f
T0 19 731.725(2) 16 670.6168(3) 14 156.3(3) 12 270.6(5)B′′ 0.136 599(30) 0.042 573(8)B′ 0.130 469(30) 0.041 815(8)B′′/B′ 1.047 1.018A′′ (-33.3) -32.37(56)A′ (-31.1) -29.42(56)∆A 2.2
DCnD+
n ) 4b n ) 6c n ) 8d n ) 10f
T0 19 740.683(2) 16 686.5100(3) 14 169.5243(3) 12 280.8(5)B′′ 0.127 403(24) 0.040 701(9) 0.017 648(6) 0.009 23(5)B′ 0.121 831(25) 0.039 980(9) 0.017 452(6) 0.009 17(5)B′′/B′ 1.046 1.018 1.011 1.007A′′ -33.3(2.0) -31.31(49) (-31) (-31)A′ -31.1(2.0) -28.40(49) (-28) (-28)∆A 3 3
a All values are in cm-1. b Reference 2.c Reference 3.d Reference4. e Reference 6.f This work. g Reference 19.
Spectrum of the Pentaacetylene Cation J. Phys. Chem. A, Vol. 106, No. 42, 20029891

A confirmation of the assignment of the observed 815.5 nmband to the pentaacetylene cation is provided by the detectionof this transition in the partially (HC10D+) and fully deuterated(DC10D+) species. The latter is shown in the right part ofFigure 1, approximately 20 cm-1 blue-shifted with respect tothe HC10H+ band. A good simulation of the observed spectrumis obtained forB′′ ) 0.009 23(5) cm-1, B′ ) 0.009 17(5) cm-1,andT0 ) 12 280.8(5) cm-1 (Figure 1). The corresponding stickdiagram is shown as well. The spectrum of the monodeuteratedchain, HC10D+, has been observed at 12 270.6(5) cm-1 but israther weak, and a contour simulation is not possible. Table 1summarizes the determined spectroscopic constants for chainsHCnD+ and DCnD+, with n ) 4, 6, 8, and 10.
This work presents the electronic spectrum of the largestpolyacetylene cation measured in the gas phase so far. Never-theless, a comparison with the hitherto reported diffuse interstel-lar bands in the near infrared17,18 shows that there is noabsorption apparent at the position of the origin band in theelectronic spectrum of HC10H+.
Acknowledgment. This work has been supported by theSwiss National Science Foundation, Project 20.63459.00, andthe Bundesamt fu¨r Bildung und Wissenschaft, Project 01.0299.H.L. thanks support of FOM (Fundamental Onderzoek derMaterie).
References and Notes
(1) Cha, C.; Weinkauf, R.; Boesl, U.J. Chem. Phys.1995, 103, 5224.(2) Callomon, J. H.Can. J. Phys.1956, 34, 1046.
(3) Lecoultre, J.; Maier, J. P.; Ro¨sslein, M.J. Chem. Phys.1988, 89,6081.
(4) Sinclair, W. E.; Pfluger, D.; Linnartz, H.; Maier, J. P.J. Chem.Phys.1999, 110, 296.
(5) Pfluger, D.; Motylewski, T.; Linnartz, H.; Sinclair, W. E.; Maier,J. P.Chem. Phys. Lett.2000, 329, 29.
(6) Pfluger, D.; Sinclair, W. E.; Linnartz, H.; Maier, J. P.Chem. Phys.Lett. 1999, 313, 171.
(7) Betowski, L. D.; Winnik, W.; Marcus, A. B.; Pyle, S. M.Int. J.Mass Spectrosc.1998, 173, 27.
(8) Lee, S.; Gotts, N.; von Helden, G.; Bowers, M. T.J. Phys. Chem.A 1997, 101, 2096.
(9) Pyle, S. M.; Betowski, L. D.; Marcus, A. B.; Winnik, W.; Brittain,R. D. J. Am. Soc. Mass. Spectrom.1997, 8, 183.
(10) Tielens, A. G. G. M., Snow, T. P., Eds. Laboratory studies ofproposed carriers.The diffuse interstellar bands; Kluwer Academic Publish-ers: Dordrecht, Netherlands, 1995; pp 175-238.
(11) Freivogel, P.; Fulara, J.; Lessen, D.; Forney, D.; Maier, J. P.Chem.Phys.1994, 189, 335.
(12) O’Keefe, A.; Deacon, D. A. G.ReV. Sci. Instrum.1988, 59, 2544.(13) Motylewski, T.; Linnartz, H.ReV. Sci. Instrum.1999, 70, 1305.(14) Western, C. M.PGOPHER; School of Chemistry, University of
Bristol: Bristol, U.K., 1994 and 1998.(15) Linnartz, H.; Motylewski, T.; Vaizert, O.; Maier, J. P.; Apponi,
A. J.; McCarthy, M. C.; Gottlieb, C. A.; Thaddeus, P.J. Mol. Spectrosc.1999, 197, 1.
(16) A nearly identical value is found when extrapolating the valuesavailable for the rotational constants of the di-, tri- and tetraacetylenecations.
(17) Jenniskens, P.; Desert, F.-X.Astron. Astrophys.1994, 106, 39.(18) Galazutdinov, G. A.; Musaev, F. A.; Krelowski, J.; Walker,
G. A. H. Publ. Astron. Soc. Pac.2000, 112, 648.(19) Vaizert, O.; Furrer, P.; Cias, P.; Linnartz, H.; Maier, J. P.J. Mol.
Spectrosc.2002, 214, 94.
9892 J. Phys. Chem. A, Vol. 106, No. 42, 2002 Cias et al.

References [1] K. H. Homann, Angew. Chem. Intern. Ed. 7 (1968) 414
[2] M.B. Bell, P. A. Feldman, S. Kwok, and H. E. Matthews, Nature 295 (1982) 389
[3] W. Kraetschmer, J. Chem. Soc. Faraday. Trans. 89 (1993) 2285
[4] J. Fulara, D. Lessen, P. Freivogel and J. P. Maier, Nature 366 (1993) 439
[5] A. E. Douglas, Nature 269 (1977) 130
[6] H. Schueler, L. Reinbeck, Z. Naturforsch. 7a (1952) 285
[7] J. H. Callomon, Can. J. Phys. 34 (1956) 1046
[8] R. Kuhn, J. P. Maier, M. Ochsner, Mol. Phys. 59 (1986) 441
[9] R. N. Zare, A. R. Schmeltekopf, W. J. Harrop, D. L. Albritton, J. Mol. Spec. 46,
(1973) 37
[10] J. Lecoultre, J. P. Maier, M. Roesslein, J. Chem. Phys. 89 (1988) 6081
[11] J. Kraitchman, Am. J. Phys. 21, (1953) 17
[12] J. Schaeublin, PhD thesis, University of Basel, 1972
[13] F. Brogli, E. Heilbronner, V. Hornung, E. Kloster-Jensen Helv. Chim. Acta 56
(1973) 2171
[14] O. Vaizert, P. Furrer, P. Cias, H. Linnartz, J.P. Maier, J. Mol. Spec. 214, (2002) 94
[15] T. Motylewski, H. Linnartz, Rev. Sci. Instrum. 70 (1999) 1305
[16] M. Allan, E. Kloster-Jensen, J.P. Maier, Chem. Phys. 17 (1976) 11
[17] D. Klapstein, R, Kuhn, J.P. Maier, M. Ochsner, W. Zambach, J. Phys. Chem, 88
(1984) 5176
[18] W.E. Sinclair, D. Pfluger, H. Linnartz, J. P. Maier, J. Chem. Phys 110 (1999) 296
[19] D. Pfluger, W.E. Sinclair, H. Linnartz, J. P. Maier, Chem. Phys. Lett. 313 (1999)
171
[20] M. Allan, E. Heilbronner, E. Kloster-Jensen, J. P. Maier, J. Chem. Phys. Lett. 41
(1976) 228
[21] D. Pfluger, T. Motylewski, H. Linnartz, W.E. Sinclair, J. P. Maier, Chem. Phys.
Lett. 329 (2000) 29
[22] P. Freivogel, J. Fulara, D. Lessen, D. Forney, J. P. Maier, Chem. Phys. 189 (1994)
335

[23] A. M. Smith, J. Agreiter, M. Haertle, C. Engel, V.E. Bondybey, Chem. Phys. 189
(1994) 315
[24] A. Sobolewski, L. Adamowicz, J. Chem. Phys. 102 (1994) 394
[25] K. Andersson, P.-A. Malmqvist, B. O. Roos, A. J. Sadlej, K. J. Wolinski, J. Phys.
Chem. 94 (1990) 5483
[26] L. D. Betowski, W. Winnik, A. B. Marcus, S. M. Pyle, Int. J. Mass. Spectrosc. 173
(1998) 27
[27] J. P. Maier, G. A. H. Walker, D. A. Bohlender, ApJ 602 (2004) 286

CHAPTER 6 6. Boron and its clusters
Studies of boron clusters and boron-rich materials are currently active areas of
both experimental and theoretical study. These systems have many important
technological applications, including thermally and chemically stable insulators, high
modulus boron fiber composites [1], high temperature semiconductor devices, refractory
and thermoelectric materials [2, 3]. Boron chemistry is also of interest in the search for
high performance propellants. In particular, the large heat of combustion and the low
atomic mass contribute to the interest in boron and boron-containing compounds as high
energy density fuels [4-7]. Despite these important technological applications, a number
of experimental and theoretical studies of boron clusters is rather limited.
Boron is isovalent with Al, yet the atomic and electronic structures of the two
elements are entirely different. Al is a nearly free-electron metal where the valence
electrons are delocalized and the solid phase is face centered cubic. Boron-rich solids, on
the other hand, are composed of the 12-atom clusters of boron having the structure of
icosahedron [8]. Boron’s small covalent radius and electron deficiency result in formation
of materials involving strong bonds delocalized over several nuclei. The electronic
structure of B is characterized by three-center bonding, where three boron atoms share a
common pool of charge. It is well known that in covalently bonded materials, the
bonding charges are centered between two atoms. Thus the electronic structure of boron
is intermediate between covalent and metallic bonding. This behavior renders boron-rich
solids some unusual properties. For example, they range from the conducting materials
(B1-xCx) to insulating ones (B12P2) [9].
6.1. Experimental and theoretical studies of small boron
clusters

In the line of boron clusters its dimer can be considered as the smallest one in the
series of Bn. In contrast to other stable first-row homonuclear diatomics, little is known
about the B2 molecule. Its first spectroscopic observation was reported in 1940 by
Douglas and Herzberg. In a discharge in helium with a trace of BCl3 they measured the 3Σu
- - X 3Σg- emission transition of B2 in the UV region [10]. The absence of a Q-branch
and an intensity alteration in the fine structure corresponded to the parallel transition
involving a Σ state. On the basis of the molecular orbital theory this so called Douglas-
Herzberg emission system was assigned to a 3Σu- - X 3Σg
- transition. This contention was
confirmed in 1976 when Graham and Weltner observed this system in an absorption in
solid argon at 4-10 K. In their experiment they evaporated elementary boron from a thin-
wall tantalum cell. The produced vapor was deposited with argon onto a CaF2 window.
This matrix experiment showed that this transition indeed involved the ground electronic
state. However, no ESR spectrum was observed, therefore no definitive determination of
the multiplicity of the ground state existed [11]. In 1982 Bredohl et al. recorded the 3Σu- -
X 3Σg- emission spectrum of B2 at a higher resolution and observed the spin-spin fine
structure [12] confirming the assignment of Douglas and Herzberg. The ESR spectrum of
the matrix-isolated B2 obtained by Knight et al. in 1987 [13] also substantiated the former
X 3Σg- assignment of Douglas and Herzberg.
In 1992 Brazier and Carrick reported the observation of several new electronic
transitions of the B2 molecule. They obtained the spectra by using a corona excited
supersonic expansion source [14]. A sample of diborane was seeded in helium which was
expanded through a gas nozzle. The DC electric discharge through the throat of the
nozzle served to both dissociate the precursor and electronically excite the product
molecules. The UV and visible spectra showed six separate electronic transitions, five of
which were not known previously. Two of these bands, designated (2) 3Πu – (1)3Πg and
(1)1∆u – b1∆g, have been fully analyzed by moderate resolution spectra. For these four
new electronic states the bond-lengths were determined and compared with theoretically
calculated values. The experimental bond-lengths and the tra1nsition energies matched
with the theoretical calculations carried out by Langhoff and Bauschlicher [15]. In 1995

the same method was used to obtain the emission spectra of the (1) 1Σu+ - (1) 1Σg
+
electronic transition of B2 [16]. The emission spectra of 0-0, 1-1, 2-2, 3-3, and 4-4
vibrational bands have been recorded and analyzed. Bond-lengths were calculated for
both states and corresponded to theoretical calculations of Langhoff and Bauschlicher
[15].
In 1994 Brazier and Carrick improved their experiment by an implementation of
the Fourier transform spectrometer [17]. It increased spectral resolution of the system
significantly and provided the capability to resolve the structure of the lowest rotational
lines of (2) 3Πg – A 3Πu electronic transition of B2. A full rotational analysis of the 0-0,
0-1, 1-0 and 1-3 bands has been performed. The good match between the experiment and
theory has allowed the authors to make a definitive assignment of the observed transition.
They also observed a strong perturbation of the (2) 3Πg state by (1) 3Πg.
In 2000 Tam et al. reported a couple of absorption spectra of laser ablated boron
species trapped in rare gas matrices [18]. In their experiments they used a rotating boron
target as a source of the molecules. However, the way in which they produced the matrix
varied as their apparatus evolved. In one experiment the laser ablation of the boron
species and the matrix deposition were performed in the same vacuum chamber. In
another experiment the laser ablation process took place in the different vacuum chamber
than the matrix deposition. The advantage of the second approach was to enhance the
control over the ablation process. One of the bands they recorded was well known as the
Douglas-Herzberg system. Less progression in the 260-300 nm region was assigned to
the (2) 3Πu – X3Σg- transition of B2. They also observed a new progression of strong
peaks in the region of 180-200 nm which could be due to B2 molecules, however, it was
not assigned.
There were also theoretical studies of B2. In 1978 an accurate ab initio
configuration interaction calculation carried out by Dupuis and Liu [19] has established
that the ground electronic state of B2 is of 3Σg- symmetry, and that the Douglas–Herzberg
emission system near 320 nm is due to transitions from the second 3Σu- to the X 3Σg
- state.
The lowest 5Σu- state, suggested by previous calculations as the ground state [20, 21], was
found about 1300 cm–1 above the 3Σg- state. The assignment of the Douglas–Herzberg
transition was based on the correspondence between calculated and observed molecular

constants. Further confirmation of this assignment was seen in the close agreement
between calculated and observed isotope shifts and intensity distributions. Electronic
wavefunctions and potential curves for 3Σu-, 3Σg
- and 5Σu- states of B2 were calculated
using the multiconfiguration self-consistent field and the configuration interaction
methods.
Langhoff and Bauschlicher calculated the spectroscopic constants of B2 by using
an extensive Gaussian basis set and multiference configuration interaction approach [15].
They wanted to characterize the spectroscopy and the nature of the bonding in various
electronic states of B2. The singlet, triplet and quintet states of B2 below ~45000 cm–1
have been studied. The analysis of the calculated potential curves and their comparison
with those of Al2 [22] showed that B2 shows stronger bonding than Al2. It is consistent
with the bond-lengths and weaker bonding in Al2 resulting from the reduced overlaps.
Examinations and theoretical studies on small boron clusters larger than two
atoms, however, are rather rare. In 1981 Whiteside determined ground electronic states,
geometries and atomization energies for B2, B4 and B6 using self-consistent field
configuration interaction calculations [23]. Another theoretical study of the neutral B4
carried out by Koutecky et al. [24] gave similar results. In 1984 Lunell’s studies have
also probed properties of the capped pentagon structure of B6 but have not attempted to
optimize the geometry [25]. B12 has been also the subject of several theoretical studies
[26]. In 1988 Hanley et al. reported the set of ab initio calculations for both neutral and
ionic Bn (n=1-6) [27]. Their calculations took the lowest energy geometries for the
neutral boron clusters obtained by Whiteside [23] and reoptimized them for the cations
with the 6-31G* basis set. B2+, B3
+ and B4+ were optimized again with the 6-31G* basis
and total energies were obtained by configuration interaction. In the case of B5+ they took
the linear, symmetric pentagon, square pyramid and bipyramid structures as starting
geometries for optimization. The B6+ geometry was derived by optimizing the bond-
lengths of neutral B6 structure for B6+. To check the accuracy of their calculations they
have recalculated the total energies for B2, B3, B4 and B6 using Whiteside’s geometries
[23].
It was observed that these two methods usually corresponded one to another. The
B5 geometry was obtained from the local optimization of calculated here B5+ structure.

Finally the bond-lengths, spin states, spectroscopic state assignment, and total energies
for Bn (n=1-6) and Bn+ (n=1-6) were obtained. They are given in Table 6.1.
Parent Bondlength Ground Total energy (Hartree)
cluster (Å) state Whiteside [Ref. 23] Hanley et al.
6-31G* 6-31G* 6-31G*/CI
B2 1.60 3Σg- -49.0753 -49.0765 -49.2273
B2+ 2.00 2Πu -48.7687 -48.9000
B3 1.57 2A1’ -73.7721 -73.7402 -73.9101
B3+ 1.53 1A2
’’ -73.4270 -73.5574
B4 1.51 1Ag -98.4240 -98.4302 -98.5623
B4+ 1.53 2Ag -98.1327 -98.2444
B5 1.75 2E’ -122.9088
B5+ 1.75 1A1
’ -122.6662
B6 1.62 1A1 -147.6569 -147.6629
B6+ 1.62 2A1 -147.3547
Table 6.1. Calculated boron cluster properties and total energies [Ref. 27].
In 1997 Niu et al. performed the calculations using ab initio molecular orbital
theory (based on both, density functional formalism and quantum chemical methods) [9].
The equilibrium geometries, binding energies, ionization potentials, fragmentation
patterns, and electronic structure of neutral and charged boron clusters containing up to
six atoms were being calculated.

1 2 3 b b a α1
α α2 a a c 4 5 6 a 7 8 a 9 10 a b c c a b Figure 6.1. Calculated geometries of Bn neutral clusters [Ref. 9].

For the calculation of the total energies, electronic structure and equilibrium
geometries they have chosen two different approaches: the HF method followed by a
correction through Möller-Plesset fourth order perturbation theory and density functional
method with generalized gradient approximation. The equilibrium geometries as well as
the geometries of some isomers of neutral Bn clusters (n=2-6) calculated at MP4 level are
shown in Figure 6.1. and all geometrical parameters for neutral boron clusters are given
in Table 6.2. Results for most of these geometries were also tested using the GGA level
of theory under the B3LYP scheme. The equilibrium geometries (with the exception of
B5) and spin multiplicities of clusters using both methods corresponded with each other.
The geometrical parameters, i. e., bond-lengths and bond angles as well as the binding
energies corresponded as well. Systematic increase in binding energy as a function of the
cluster size was observed in both methods.
Cluster Geometrya Bond-lengths (Å) Bond angles (°)
MP4 B3LYP MP4 B3LYP
B2 1 a=1.55 a=1.56
B3 2 a=1.52 b=1.52 a=1.52 b=1.52 α=60.0 α=60.0
B4 3 a=1.79, b=1.51,
c=1.51
a=1.82, b=1.51,
c=1.51
α1=α2=53.6
β=180.0
α1=α2=52.8
β=180.0
B5 4 a=1.09, b=1.16 a=1.09, b=1.16
5 a=1.53 a=1.58
B6 6 a=1.39, b=0.89 a=1.37, b=0.92
7 a=1.52 a=1.52
8 a=1.36, b=0.98
9 a=1.49, b=4.63,
c=1.57
β=90.1
10 a=1.53, b=3.00,
c=1.60
β=84.1
Table 6.2. Geometrical parameters for neutral Bn clusters [Ref. 9]. a see Figure 6.1.

The study confirmed the spin triplet configuration of the ground state of the B2
molecule. The structure of B3 is an equilateral triangle with a bond-length 1.52 Å at the
MP4 level of theory. This is in agreement with the results obtained by Ray et al. [28] and
Hanley et al. [27]. The geometry of B4 which was calculated by Niu et al. differs
significantly from those of Ray et al. which can be explained by a less extensive choice
of the basis functions (3-21G*). The geometry of B4 calculated here is a rhombus
whereas those calculated before is a linear chain [28]. Hanley et al. obtained the rhombus
structure for the B4 molecule, as well. For the B5 molecule two isomers were identified
among which the triangular bipyramid is more stable using MP4 theory. The equilibrium
structure of B6 is a pentagonal pyramid, however, others isomers were also found i. e.,
hexagonal, octahedral, the “boat” and the “chair” structures. The calculation of
geometries shown that the electronic structure of boron is not typical. If the bonding in Bn
clusters would have been a two-centered covalent bond, the octahedral structure would
have been the ground state. It is also visible that that the seed for an icosahedric growth
pattern is shown at the B6 cluster stage. It can be finally concluded that the special
chemistry which governs the electronic structure of boron-rich solids is also present in
small boron clusters.
As an electron is removed from a cluster, the redistribution of charges causes the
neutral structure to relax. The difference in the total energy between the neutral and
cationic cluster in their respective ground states is the adiabatic ionization potential and
was measured by Haneley et al. [27] for boron clusters. They also observed that the
fragmentation of Bn+ clusters for n < 6 proceeded by the emission of a B+ cation, while in
larger clusters the charge resided on the Bn-1+ fragment. The geometries of Bn
+ clusters
(n=2-6) were optimized again at the MP4 and B3LYP level of theory [29]. Both methods
once again yielded identical geometries and spin multiplication as in the case of the
neutral clusters. The schematic equilibrium geometries of the boron-cluster cations are
presented in Figure 6.2. and the geometrical parameters for cationic boron clusters are
given in Table 6.3.
The comparison of the structures of the neutral and corresponding cationic
clusters showed that there is a little change among the geometries of neutral and charged
dimers, trimers und tetramers.

I II III b a b α1 α a α2 a c IV V VI a b c a a Figure 6.2. Calculated geometries of Bn
+ clusters [Ref. 9]. Cluster Geometrya Bond-lengths (Å) Bond angles (°)
MP4 B3LYP MP4 B3LYP
B2+ I a=1.75 a=1.80
B3+ II a=1.60 b=1.60 a=1.55 b=1.55 α=60.0 α=60.0
B4+ III a=1.98, b=1.55,
c=1.55
a=2.00, b=1.54,
c=1.54
α1=α2=50.5
β=180.0
α1=α2=49.5
β=180.0
B5+ IV a=1.57 a=1.54
B6+ V a=1.55 a=1.54
VI a=1.67, b=1.60,
c=1.69
a=1.64, b=1.65,
c=1.67
β1 =149.2,
β2=149.2
β1 =110.1,
β2=110.1
Table 6.3. Geometrical parameters for Bn+ clusters [Ref. 9]. a see Figure 6.2.

The significant changes occur in B5 and B6 when an electron is removed. The
planar structures are preferred by the cations. It is observed, however, that B-B bond
remains close to the one in the neutral clusters in all cases.
As a cluster is doubly ionized, the added repulsion between the two added
positive charges tends do destabilize the cluster. This destabilization force is the strongest
for the smallest clusters. The calculations at the MP4 level of the theory showed that the
doubly charged clusters Bn2+ are all linear chains.
6.2. Experimental and theoretical studies of the triatomic boron-rich clusters
The spectroscopic studies of the triatomic clusters containing boron started in the
1960s. In 1962 Varhaegen et al. first observed BC2 in a mass spectrometric study of the
vapor over solid boron carbide at about 2300 K [30, 31]. The principal vapor species
were B, BC, BC2 and B2C. In 1970 Easley and Weltner studied the vapor in equilibrium
with solid boron carbide at 2600 K with X-band ESR spectroscopy and concluded that
their spectrum of BC2 was in accordance with a linear B-C-C structure, corresponding to
a 2Σ ground state [32]. The ab initio studies carried out by Thomson [33] predicted the
B-C-C structure to be more stable than C-B-C, however these studies was restricted to the
linear isomers. In 1989 Knight et al. did the laser ablation experiment, which indicated
that BC2 actually had the nonlinear symmetric structure C-B-C [34]. Recently Martin et
al. in the combined ab initio and pulsed laser evaporation studies concluded, that
although the global minimum structure of BC2 is predicted to be an asymmetric triangle,
the vibrational averaged structure is an isosceles triangle with a strong symmetric
stretching frequency near 1200 cm-1. They observed a 1:4 doublet at 1232.5 and 1194.6
cm-1, with the first band dominating the boron-10 experiments, which they tentatively
assigned to the cyclic BC2. This assignment could not be completely confirmed due to the
lack of 13C isotopic data. In 1996 Presilla-Marquez et al. measured a spectrum of BC2
trapped in argon matrices at 10 K using Fourier transform infrared spectrometer [7]. BC2
was produced by vaporization boron/carbon mixtures around 3000 K. Analysis of the
spectra combined with the predictions of density functional theory calculations resulted

in the assignment of the band previously observed by Martin et al. The band was
attributed to the ν2 fundamental of cyclic BC2, which was effectively symmetric. The
assignment was supported by 10B, 11B and 13C isotopic data (a complete set of measured
isotopic shifts) and corresponded to the theoretical predictions.
In 1999 B2C was studied in an argon matrix [35] and the vibrational spectrum has
been observed by Fourier transform infrared spectroscopy. The measured absorption
frequencies of the three boron isotopomers of B2C matched the ab initio predictions of
the ν1 (a1) fundamental of cyclic symmetric B2C. The distribution of isotopomers of B2C
matched those of B2C2 in three matrices with different isotopic compositions which
confirmed the assignment of the band observed at 1392.8 cm-1 to the ν1 (a1) fundamental
of B2C.
The geometry of the B2C molecule was calculated in 1994 by Martin and Taylor
[36]. The potential energy surface for the ground state has been investigated using full-
valence complete active space SCF (CASSCF), augmented by coupled cluster
[CCSD(T)] and multiference treatments. The ground state of B2C is a very stable ring
with two electron π systems. The first excited state is linear B-C-B (1Σg+), which is
biconfigurational due to a (4σg) - (3σu) near degeneracy. In the same work Martin and
Taylor calculated also anharmonic spectroscopic constants for B2C and some isotopomers
which can be useful in further investigations.
Knight et al. [37] used a laser vaporization matrix isolation electron spin
resonance (ESR) apparatus to study the B-N-B radical. The radical has been generated by
the laser vaporization of solid boron nitride and isolated in neon, argon, and krypton
matrices at 4 K for detailed ESR investigations. The ESR experimental results and
theoretical calculations conducted at the CI level showed that B-N-B has an X2Σu+ ground
electronic state with a linear centrosymmetric structure. Roland and Wynne [38]
described photoionization and photofragmentation of BxNy clusters generated by laser
vaporization of boron nitride followed by supersonic expansion. Thompson et al. [39, 40]
studied the infrared spectra of reaction products of laser ablated boron atoms with
ammonia, during condensation with excess argon at 10 K. They observed cyclic and

symmetric linear B2N together with a series of hydrogen - boron - nitrogen containing
species. Asmis et al. [41-44] used a negative ion tandem time-of-flight photoelectron
spectrometer to determine adiabatic detachment energies and vibrational frequencies for
several low-lying electronic states of BN, B2N, and B3N. In particular Asmis et al. found
no evidence for a low-lying cyclic isomer of B2N [43]. They reassigned the matrix IR
spectra of Andrews and co-workers [39, 40, 45] to the 2Σu+ ground state of linear B2N.
Interesting calculations of boron-nitrogen clusters were also carried out in 1989
by Martin et al. They computed a number of different structures and states of B2N and
BN2 [46]. Optimum geometries and harmonic spectra were obtained at the HF/6-31G*
level of theory. The relative stability of the isomers was determined using full fourth-
order Moller-Plesset theory. B2N has a symmetric linear arrangement in its 2Σu+ ground
state with an extremely low bending frequency (73 cm–1), and an unusually low vertical
ionization potential (6.75 eV). Its asymmetric stretching (2021 cm–1) is found to be
extremely intense (8782 km mol–1). BN2 has four rather closely spaced states, of which an
isosceles triangle is the absolute minimum (2A1 state). However, at high temperatures, an
asymmetric linear arrangement (2Π state) is of equal importance.
6.3. Theoretical and experimental studies of B3 and its ions
There are few theoretical ab initio calculations of the structure and electronic
properties of the B3 molecule [27, 46-49]. All of them predicted the ground state structure
of B3 to be an equilateral triangle (D3h ) with 2A1' symmetry. Some of the vibrational
modes of this molecule in the near infrared and visible regions have been also calculated
[46, 48].
A computational study of the structure and properties of the ground and low-
lying excited electronic states of the B3+ molecule was also carried out in 2001 by Yang
et. al [50]. They used sophisticated methods and large basis sets, including the Quadratic
CI calculation and cc-pVQZ basis sets. Their results showed that the equilibrium
geometry for the singlet 1A'1 ground state of B3+ is an equilateral triangle (D3h). However,

it is also found that the energies of state 3A''2 and state 1A'1 alternate when the
optimization was performed at different computational levels. This indicated that it is
difficult to distinguish these two states only by their total energies. Fortunately, the
present calculated harmonic vibrational frequencies are obviously different. As a result,
they may be used to identify the ground state 1A'1 from the 3A''2 state. The dissociation
energies were also computed at a different level and compared with the other theoretical
and experimental work [9, 27].
Despite the growing interest in the structures and energetics of the boron trimer,
not many experiments were done. Although the ground-state structures and electronic
properties of many metal trimers are known, those of B3 have not been established
experimentally for many years. For the first time B3 was observed in 1992 by Hamrick et
al. [51]. They obtained highly resolved electron-spin-resonance spectrum of boron trimer
in rare gas matrices at 3-30 K. The analysis of the spectra allowed the properties of the
lowest electronic state to be determined. Comparison of the experimental results and
theoretical calculations indicated that B3 has tree equivalent nuclei e. i., D3h symmetry. It
was also confirmed that B3 has 2A1' ground state. In 1996 Li et al. obtained the matrix
isolation infrared spectra of B3 in the range from 400 to 5000cm-1 [52]. The boron
samples were laser-vaporized and trapped in solid argon at 4 K. The absorption spectra
were measured using a Fourier transform infrared spectrometer. In this experiment
authors observed the ground-state vibrational frequencies which were attributed to the
degenerate mode (e') 11B and 10B isotopomers. The experimental data corresponded to the
former calculations [46].
In 2003 B3 and B3- were also studied using photoelectron spectroscopy and ab
initio calculations [53]. Vibrationally resolved photoelectron spectra were observed for
B3- at three photon energies (355, 266, and 193 nm), and the electron affinity of B3 was
measured to be 2.82 ± 0.02 eV. An unusually intense peak due to two-electron transitions
was observed in the 193-nm spectrum of B3- at 4.55 eV and its origin was theoretically
characterized, suggesting strong electron correlation effects in the boron trimer. They
again confirmed that both B3- and B3 are aromatic systems with D3h symmetry.
In 2003 Wyss et al. reported the experiment in which for the first time the
electronic absorption spectra of B3- and B3 have been measured in neon matrices [54].

The B3- anions were produced in a cesium sputter ion source that had been built originally
for the production of carbon anions. A boron-carbide (B4C) rod or pressed pure boron
powder were used as sputter targets. The ions produced in the source were guided by an
electrostatic lens system into a quadrupole mass analyzer, where the B3- anions were
selected and then codeposited with excess of neon onto a rhodium coated sapphire plate at
a temperature of 6 K. A band system with origin at 21412 cm-1 was observed and
assigned as the 1E'- X 1A1' electronic transition of the cyclic anion. After photobleaching,
the 1 2E' - X 2A1' and 2 2E' - X 2A1' band systems of neutral cyclic B3 were observed.
They start around 13587, 21828 cm-1, respectively. The vibrational structure which
appears in the observed electronic spectra, is associated with excitation of the two normal
modes, ν1 (a1'), ν2 (e'), in the upper electronic states, because at 6 K the population is
essentially in the vibrationless level of the ground state. Since the upper electronic states
of B3 and B3- have E' symmetry they are subject to Jahn–Teller distortions which may
cause complex vibrational pattern. The second system of B3, assigned to the 2 2E' - X 2A1'
transition, has the most simple pattern. It starts with the origin band at 21828 cm-1 and a
seemingly regular progression mode is discernible with two spacings that are the same
within the error limit. As the origin band is dominant, no large geometry change is
expected on passing from the ground to the excited electronic state. In contrast, the
vibronic structure of the first system of B3 assigned to the 1 2E' - X 2A1' transition,
indicates a strong Jahn–Teller distortion. The excitation of the degenerate ν2 (e'), Jahn–
Teller active mode is evident. The two transition systems are not only very different in
complexity but they also show quite different intensities. The spectra indicate an
absorbance ratio of one order of magnitude in favor of the second band. The absorption
spectrum of B3-, assigned to the 1 1E' - X 1A1' transition, shows a complexity similar to
the lower transition of B3.

Figure 6.3. Electronic absorption spectra of 2 2E' - X 2A1' origin band of B3 and 1E' - X 1A1' electronic transition of B3
- recorded in a 6 K matrix [Ref. 54].
Figure 6.4. The absorption spectrum of the 1 2E' - X 2A1' electronic transition of B3 recorded in a 6 K matrix [Ref. 54].

The patterns of these two systems are complicated and a sensible assignment can
only be made on a theoretical base. The spectra are shown in Figures 6.3. and 6.4.
Transition energies, Jahn-Teller distortion energies and equlibrium geometries for
the 1 2A1', 1 2E' and 2 2E' states have been calculated using multireference configuration
interaction ab initio method. This helped provide symmetry assignments and an
interpretation of the complex vibronic structure (due to Jahn –Teller effect) observed in
the excited electronic state 1 2E' of B3. The calculated vibrational energies and intensities
closely reproduced the complex vibrational structure observed in this state. On the other
hand, the calculations confirmed that 2 2E' state should undergo only a relatively weak
Jahn–Teller distortion as the stabilization and localization energies were quite low. The
short progression with an observed frequency of 981 cm–1 also corresponded well to the
theoretical frequency of 973 cm–1.
6.3.1. Gas-phase study of cyclic B3
Despite good experimental results and large scale ab initio calculations, it is clear
that the full analysis of the complex vibronic structure of the spectrum requires theory
developments as well as high resolution gas-phase measurements. Although this kind of
studies are inherently complicated and perplexing (difficulty in production of the
appropriate amount of B3 in the gas phase), high sensitivity of cavity ringdown method
and good efficiency of the slit nozzle discharge source seemed to be a very promising
tool in the pursuit of the high resolution spectrum of the B3 molecule. The goal was really
tempting because this spectrum could shed new light on the structure of this interesting
cyclic trimer. The search for the 1 2E' - X 2A1' and 2 2E' - X 2A1' bands was carried out
and was finally successful in the second case. Despite many efforts, the 1 2E' - X 2A1'
electronic transition of B3 could not be observed in the gas phase. The latest studies of the
gas-phase spectrum of the 2 2E' - X 2A1' electronic origin band of cyclic boron trimer are
presented below.

1
Gas phase detection of cyclic B3: 2 2E'← X 2A1' electronic origin band
P. Cias, M. Araki, A. Denisov and J.P. Maier
Department of Chemistry, University of Basel, Klingelbergstrasse 80,
CH-4056 Basel, Switzerland
Abstract
The rotationally resolved origin band in the 2 2E' ← X 2A1' electronic spectrum of cyclic B3
has been observed by cavity ring down spectroscopy in the gas phase. The B3 molecule was
generated in a supersonic planar plasma containing decaborane (B10H14) and neon as a
carrier gas. The rotational structure pattern is that of a cyclic molecule. It is analyzed
assuming an equilateral triangle in both electronic states. The band origin is determined to be
21853.52 cm-1, and the bond-lengths 1.60377(106) Å in the ground and 1.61907(96) Å in the
excited electronic state are inferred from analysis of the rotational structure.
Corresponding author:
Prof. J. P. Maier
Department of Chemistry
University of Basel
Klingelbergstrasse 80
CH 4056 Basel
Switzerland
Phone: +41-61-2673826, Fax: +41-61-2673855
E-mail: [email protected]

2
I. INTRODUCTION
Well resolved absorption and emission spectra of cyclic trimers have been reported
only for few species, including, Al3,1 Li3,2 Cu3,3 H3+,4 and Na3.5 As the small boron
molecules have applications in industry as chemical insulators, explosives, semiconductors
and high energy density materials, their structure is of relevance.6-7 The boron trimer has
been investigated only in rare gas matrices. First came the electron-spin-resonance
observation which showed that B3 contains an unpaired electron and that the three nuclei are
equivalent.8 The infrared spectrum of B3 was also observed,1 and recently the 2 2E' ← X 2A1'
electronic transition of B3 in a neon matrix was identified using a mass selective approach.9
However, there is no spectroscopic information on the boron trimer B3 in the gas phase.
There is interest in the spectrum of cyclic B3 because several of the excited electronic
states are degenerate in D3h symmetry. According to the Jahn-Teller theorem, there exists at
least one vibrational mode that removes the electronic degeneracy and results in the
stabilization of the lowest component by lowering the symmetry of the equilibrium structure.
Most recent theoretical calculations on B3 predicted an equilateral structure (D3h) with an
2A1' electronic symmetry in the electronic ground state and an obtuse triangle (C2v) with an
apex angle ≥ 60º for the 2 2E' excited electronic state.8,10,11 However, a low stabilization
energy (difference between the conical intersection and the minima) compared with zero
point energy for the 2 2E' state is reported.9 Therefore the B3 molecule can be considered to
have D3h symmetry in the 2 2E' state as an effective structure and the
2 2E' ← X 2A1' electronic system can be considered as a quasi “D3h - D3h” transition.
In the present work we report the observation of the rotationally resolved origin band
of the 2 2E' ← X 2A1' electronic spectrum of B3. The analysis of the spectrum gives an
estimate of the molecular geometry; the first gas phase structural determination.

3
II. EXPERIMENT
This consists of a standard cavity ring down set-up sampling a plasma generated in a
pulsed supersonic slit jet expansion.12 A small fraction of pulsed laser light from a tunable
dye laser is coupled into an optical cavity consisting of two highly reflective mirrors
(R > 99.99%). The fraction of light leaking out of the cavity has an envelope which is a first
order exponential decay, exp(-t/τ). The ring down time, τ, reflects the absorption coefficient.
A spectrum is recorded by measuring τ as function of the wavelength of the laser (running
at 30 Hz). 45 ring down events are averaged at each wavelength before the digitized data are
downloaded to a workstation. The ~ 0.05 cm-1 linewidth of the laser was attained with an
internal etalon.
The pulsed slit jet system is located in a vacuum chamber evacuated by a roots
blower. The plasma is produced in a nozzle incorporating a discharge in the high pressure
expansion. The orifice comprises a metal plate anode and two sharp stainless steel cathodes
that form the actual slit (30 mm × 300 µm). A pulsed negative voltage (-800 V / 100 mA
and 100 µs in duration) is applied. The geometry of the orifice is such that the discharge is
confined upstream of the supersonic expansion. To produce B3, solid B10H14 is heated in the
oven to 70 ± 10 ºC with neon as a carrier gas at a backing pressure of 10 bar. In order to
avoid condensation inside the source, the valve and body of the nozzle are heated as shown
in Figure 1. The B3 molecules are efficiently produced at a distance 5 mm down-stream from
the slit. The spectrum is calibrated via the neon atomic lines that are observed in the jet
expansion.
III. RESULTS
The 2 2E'← X 2A1' electronic spectrum of B3 was initially identified in absorption in
a 6 K neon matrix using mass selection with origin band located at 21828 cm-1.9 Based on

4
this the band was sought in the gas phase. The absorption signal was subsequently found
near 21900 cm-1 (Figure 2) and the observed profile of the band, ~25 cm-1 in width, was in a
good agreement with preliminary simulations. No other signal could be detected within
± 300 cm-1 from the observed band. Though the spectrum visually appears “noisy” (typical
S/N of at least 5) all the peaks are genuine. This is shown by the top trace which is an
independent recording of this part of the band. Corresponding traces were obtained for other
regions proving that all the lines given in Tables 1 and 3 are real.
The spectrum exhibits rotationally resolved P and R branches slightly blended with
strong neon atomic lines. The Q-branch is not visible due to a complex splitting and
blending with an intense neon line. Actually, it is a composition of four spectra, as two boron
isotopes are present. Because the natural isotopic abundance of 11B:10B in the precursor is
4:1, the relative concentration of the two isotopomers 33B3:32B3 (two equivalent structures of
10B11B2) should be 4:3. The peaks in the spectra of 31B3 and 30B3 could not be assigned due
to their small abundance. As a result, the observed spectrum is essentially an overlap of the
two isotopomers 33B3 and 32B3.
The B3 cyclic molecule in the excited degenerate state should undergo a deformation
due to the Jahn-Teller effect, however, the distortion from an equilateral triangle can be
neglected as a result of low stabilization energy (merely 39 cm-1 compared with a zero-point
energy (1522 cm-1) in the 2 2E'' state9). A similar situation was encountered for the cyclic
C3H radical, where deformations of the C2v structure were neglected due to small energy
differences between the Cs and C2v forms.13 Therefore it is reasonable to assume that the
effective symmetry of the 2 2E' state is D3h for the analysis of the rotational structure in the
observed spectrum.
The measured positions of the 33B3 lines are given in Table 1. The spectral line
frequencies were analyzed using a conventional Hamiltonian for a symmetric top molecule.
In order to analyze the imperfectly resolved rotational spectrum it was assumed that the

5
structure of the B3 molecule has D3h symmetry in both states. This way the number of
spectroscopic parameters could be reduced to 3; the bond-lengths r', r'' and band origin T00
were then determined directly from a least-squares fit to the line positions.
The results for the 33B3 molecule are listed in Table 2. The determined bond-lengths
(r0) are 2% longer than the calculated ones (re) 9 in both the ground and excited states. In the
ground state this is because of zero-point vibrations as the analysis assumes a negligible
inertial defect. The difference in the excited state is additionally caused by imperfections of
the simple model used (assuming an equilateral triangle θ = 60º and ignoring the Jahn-Teller
effect) and anharmonicity of the potential.
The observed rotational profile was also simulated with the obtained molecular
constants using the program WANG.14 The simulated spectrum of 33B3 is shown in Figure 2.
Best agreement with the experiment was attained with a rotational temperature of 30 K. A
linewidth of 0.05 cm-1 was used for the simulation, though in the observed spectrum it is
larger due to Doppler and/or lifetime broadening.
In the case of the 32B3 isotopomer the simulation was based on the same geometry
and temperature parameters as inferred for 33B3 but using a conventional Hamiltonian of an
asymmetric top molecule. It was also assumed that only the B2 – A1 transition, which is a-
type, occurs. The rotational constants used for the 32B3 molecule were A : B : C = 1.2696 :
1.1906 : 0.6144 cm-1 for the ground, and 1.2457 : 1.1682 : 0.6029 cm-1 for the excited state.
The spectrum of 32B3 was then shifted by –1.94 cm-1 (from T00 of 33B3) to get the best
agreement with the observation (Figure 2). The isotopic shift of –1.94 cm-1 is reasonable for
an origin band.
In all, 34 rotational transitions were assigned; 14 of them are attributed to the 33B3
molecule and the rest to 32B3 (Table 3). The presented rotational assignment and molecular
structure of the B3 molecule should be considered as tentative, because the insufficient S/N
ratio of the spectrum decreases the accuracy of the molecular structure determination. Lines

6
of 31B3 (approximately 19 % of the 33B3 intensity) disturb the line profiles of 32B3 and 33B3
transitions. There are few unassigned lines, few missing ones, and some are obscured by
intense neon atomic lines (Figure 2). However, the consistency of the whole analysis is
sufficient to conclude that the observed rotationally resolved spectrum is indeed the
2 2E' ← X 2A1' transition of the cyclic B3 molecule, and leads to the first structural
information in the gas phase.
ACKNOWLEDGMENTS
This work has been supported by the Office of Aerospace Research and Development and
the Swiss National Science Foundation (project no. 200020-100019).

7
REFERENCES
1 S. Li, R.J. Van Zee and W. Weltner, Chem. Phys. Lett. 262, 298 (1996).
2 M. Keil, H.-G. Kraemer, A. Kudell, M. A. Baig, J. Zhu, W. Demtroeder, and W. Meyer,
J. Chem. Phys. 113, 7414 (2000).
3 A. O’Keffe, J. J. Scherer, A. L. Cooksy, R. Sheeks, J. Heath, and R. J. Saykally, Chem.
Phys. Lett. 172, 214 (1990).
4 A. R. W. McKellar and J. K. G. Watson, J. Mol. Spectrosc. 191, 215 (1998).
5 H. A. Eckel, J. M. Gress, J. Biele, and W. Demtroeder, J. Chem. Phys. 98, 135 (1993).
6 L. Hanley, J. L. Whitten, and S. L. Anderson, J . Phys. Chem. 92, 5803 (1988).
7 J. D. Presilla-Marquez, C. W. Larson, and P. G. Carrick, J. Chem. Phys. 105, 3398 (1996).
8 Y. M. Hamrick, R.J. Van Zee, and W. Weltner, J. Chem. Phys. 96, 1767 (1992).
9 M. Wyss, E. Riaplov, A. Batalov, J. P. Maier, T. Weber, W. Meyer, and P. Rosmus,
J. Chem. Phys. 119, 9703 (2003).
10 R. Hernandez and J. Simons, J. Chem. Phys. 94, 2961 (1991).
11 J. M. L. Martin, J. P. Francois, and R. Gijbels, J. Chem. Phys. 90, 6469 (1989).
12 H. Linnartz, T. Motylewski, and J. P. Maier, J. Chem. Phys. 109, 3819 (1998).
13 S. Yamamoto and S. Saito, J. Chem. Phys. 101, 5484 (1994).
14 D. Luckhaus and M. Quack, Mol. Phys. 63, 745 (1989).

8
Table 1
Frequencies (in cm-1) and assignments in the 2 2E'← X 2A1' absorption spectrum of 33B3.
N K ν obs ν cal νobs - νcal
1 1 - 2 2 21850.374 21850.543 -0.169 a
2 2 - 3 3 21849.223 21849.296 -0.073 3 3 - 4 4 21848.070 21848.027 0.043 4 4 - 5 5 21846.731 21846.736 -0.005 6 6 - 7 7 21844.118 21844.086 0.032 7 7 - 8 8 21842.710 21842.727 -0.017
1 1 - 0 0 21855.230 21855.305 -0.075 2 2 - 1 1 21856.499 21856.440 0.059 3 3 - 2 2 21857.600 21857.552 0.048 4 4 - 3 3 21858.629 21858.642 -0.013 5 5 - 4 4 21859.690 21859.710 -0.020 8 8 - 7 7 21862.770 21862.778 -0.008 9 9 - 8 8 21863.713 21863.756 -0.043
10 10 - 9 9 21864.749 21864.712 0.037
a Not included in the least squares fit.

9
Table 2
Bond-lengths and spectroscopic constants of the 33B3 molecule inferred from the partial
rotational analysis of the 2 2E' ← X 2A1' electronic origin band.a
2A1' 2 2E'
Obs. Cal. c Obs. Cal. c
r0 (Å) 1.60377(106) 1.61907(96)
θ0 (º) 60.0 b 60.0 b
re (Å) 1.5706 1.5955
θ0 (º) 60.0 60.8
T00 (cm-1) 21853.52 d 22723
B (cm-1) 1.19064(157) e 1.16825(138) e
C (cm-1) 0.59532(79) e 0.58412(69) e
a The numbers in parentheses represent the one standard deviation derived from the least
square fitting. A rms of the fitting is 0.043 cm –1.
b Fixed.
c Reference 9.
d Error of calibration is around 0.01 cm–1.
e The rotational constants were calculated from the determined molecular structures.

10
Table 3
Frequencies (in cm-1) and assignments in the 2 2E'← X 2A1' absorption spectrum of 32B3.a
N Ka Kc ν obs ν cal νobs - νcal
2 1 2 - 3 1 3 21847.197 -0.023 2 0 2 - 3 0 3
21847.174 21847.183 -0.009
3 1 3 - 4 1 4 21845.877 -0.018 3 0 3 - 4 0 4
21845.859 21845.876 -0.017
4 1 4 - 5 1 5
4 0 4 - 5 0 5 21844.525 21844.544 -0.019
5 1 5 - 6 1 6
5 0 5 - 6 0 6 21843.220 21843.188 0.032
6 1 6 - 7 1 7
6 0 6 - 7 0 7 21841.821 21841.809 0.012
7 1 7 - 8 1 8
7 0 7 - 8 0 8 21840.420 21840.407 0.013
4 1 4 - 3 1 3 21856.832 0.011 4 0 4 - 3 0 3
21856.843 21856.833 0.010
5 1 5 - 4 1 4
5 0 5 - 4 0 4 21857.952 21857.934 0.018
6 1 6 - 5 1 5
6 0 6 - 5 0 5 21859.041 21859.013 0.028
7 1 7 - 6 1 6
7 0 7 - 6 0 6 21860.125 21860.068 0.057
a The assignment and calculated frequencies were derived on the assumption that the bond-
lengths of 32B3 and 33B3 are equal, and the isotopic shift is –1.94 cm–1.

11
Figure captions
Figure 1
Schematic diagram of the source used to produce B3. Decaborane was heated up to
70 ± 10 °C in the oven. Neon at a backing pressure of 10 bar was used as a carrier gas.
The pulsed plasma was produced by a slit nozzle to which the high voltage was applied.
Figure 2
Rotationally resolved 2 2E'← X 2A1' electronic origin band of B3 in the gas phase measured
by cavity ring down spectroscopy through a supersonic planar plasma. The two upper traces
are independent recordings to show that the peaks are real and not noise. The three bottom
traces are the simulated patterns 33B3 + 32B3 (in ratio 4:3), 32B3 and 33B3. The two strong
lines off scale belong to neon. Bands marked with * are unassigned. Lines in the simulation
for which counterparts in the spectrum could not be found are marked with “+”.

.
.
. .
heaters
Oven
Fig. 1 − Cias et al.
discharge Slit nozzle
andsystem
Plasma
Gas inlet (Ne)
General valve
Sample basketElectric

21830 21840 21850 21860 21870
Frequency
258 81
6
3
25 3
P
P
R
R
B3
B3+ B
3
Experiment
33
32
+ + +
++
cm−1
** *
Fig. 2 − Cias et al.
32
B3
33

Appendix to chapter 6
Considerable interest has been aroused recently also in the chemistry of mixed
boron-carbon-nitrogen compounds. The reason is that some special B, C, N
compounds were found to show superhardness. These are for example carbon nitride
(CN) [55] or boron nitride (BN) [56, 57]. Because hardness is a very important material
property which is essential to many high-performance engineering applications, the study
of these compounds is of great technological importance. Boron carbide (BC) has
potential in such diverse applications such as control rods in nuclear fission reactions
[58], target tiles in nuclear fusion reactions [59, 60] and protective coating of carbon fiber
materials against atomic oxygen in spacecrafts [61]. They also have a number of highly
desirable mechanical, thermal, electrical, and optical properties [57, 62]. In addition,
boron-nitrogen clusters have received attention because the existence of fullerens
analogues involving boron and nitrogen atoms [63, 64]. In fact boron nitride is a
structural analog to carbon, exhibiting bond-length, long-order parameters, and lattice
constants to be very similar to those of carbon [57, 65].
The first spectroscopic studies of the smallest in the series of the boron-carbon
clusters, diatomic radical BC were reported in 1988 by Knight et al. [34]. They measured
ESR spectra of BC in rare gas matrices at 4 K. The B12C and B13C molecules were
produced by the laser vaporization of pressed mixtures of B/12C and B/13C mounted in
the conventional high temperature oven for thermal outgassing. A quadrupole mass
spectrometer was employed to monitor the laser vaporized products during the matrix
trapping experiment. The study of the diatomic radical BC confirmed previous theoretical
predictions of a 4Σ– electronic ground state. The nuclear hyperfine interactions (A tensors)
obtained for 11B, 10B, and 13C from the electron spin resonance (ESR) measurements were
compared with extensive ab initio CI calculations. The BC molecule is one of the first
examples of a small high spin radical for such an in-depth experimental–theoretical
comparison. The electronic structure of BC obtained from an analysis of the nuclear
hyperfine interaction was compared to that obtained from a Mulliken-type population

analysis conducted on a CI wave function which yielded Aiso and Adip results. They
corresponded to the observed values.
In 1998 the vibrational spectra of linear BC3 and B2C2 in an argon matrix have
been observed for the first time by infrared spectroscopy [66]. Mixtures of boron and
carbon powder were vaporized to 3000 K. BC3 was produced during codeposition of the
vapors with argon onto a CsI substrate maintained at 10 K. B2C2 was observed only after
annealing the matrices. Frequencies measured at 2002.1 and 1512.5 cm – 1 have been
assigned to the ν1 (σ) and ν2(σ) B–C stretching fundamentals of linear BC3 and a
frequency measured at 955.0 cm – 1 has been assigned to the ν3(σu ) stretching
fundamental of linear symmetric BC2B. These assignments were based on FTIR
measurements of the majority of the BC3 and B2C2 isotopomer frequencies and are
consistent with the results ab initio study.
Different techniques have been applied to study boron-nitrogen clusters. Becker et
al. used laser ionization mass spectrometry to study the formation of BnNm+ clusters ions
in a laser plasma [67, 68]. They observed that for BnNm-1+ and BnNm-2
+ cluster ions there
is an alternating abundance distribution with the higher intensities of the cluster ions with
the odd number of atoms. Hassanzadeh, Andrews and co-workers carried out a reaction
of the boron and nitrogen atoms in nitrogen or argon matrices [45, 69]. They identified B-
B-N-N, cyclic B2N, B-N-B, N-N-B-N, and B-N-B-N from mixed isotopic patterns, and
isotopic shifts, using Fourier transform infrared spectroscopy and ab initio calculations.
In 1992 Martin et al. have studied the lowest Σ and Π states of the BN molecule
using multireference configuration interaction and averaged coupled-pair functional
methods and large atomic natural orbital basis sets, as well as several coupled cluster
methods [70]. Their best calculations strongly supported a Π ground state, but the Σ
state was found to lie only 381±100 cm higher. The Σ state wave function exhibits
strong multireference character and, consequently, the predictions of the perturbationally-
based single-reference CCSD(T) coupled cluster method were not as reliable in this case
as the multireference results. The best theoretical predictions for the spectroscopic
1 + 3
3 1 +
–1 1 +

constants of BN corresponded to the experiment for the Π state, but strongly suggested a
misassignment of the fundamental vibrational frequency for the Σ state.
3
1 +

References
[1] M. S. Reisch Chem. Eng. News. Feb 2, 9 (1987) Technical Bulletin Avco Textron
Division
[2] O. Mishima, J. Tanaka, S. Yamaoka, O. Fukunaga, Science 238 (1987) 181
[3] D. Emin, Phys. Today, Jan. 55 (1987) Novel Refractory Semiconductors ; Extended
Abstracts of Material Research Society, Spring Meeting
[4] D. Meinkohn, Comb. Flame 59 (1985) 225
[5] L. Pasternack, Comb. Flame 90 (1992) 259
[6] N. Presser, A. T. Pritt, Jr., Proceedings of the High Energy density Materials
Contractors Conference, edited by W. J. Lauderdale and W. A. Sowell, USAF
Astronautics Laboratory, Edwards AFB, CA (1987)
[7] J. D. Presilla-Marquez, C. W. Larson, P. G. Carrick, C. M. Rittby, J. Chem. Phys. 105
(1996) 3398
[8] D. Emin, Boron Hydride Chemistry, edited by E. L. Mutterties (Academic, New
York, 1975)
[9] J. Niu, B. K. Rao, P. Jena, J. Chem. Phys. 107 (1997) 132
[10] A. E. Douglas, G. Herzberg, Can. J. Res. 18 (1940) 165
[11] W. R. M. Graham, W. Weltner, J. Chem. Phys. 65 (1976) 1516
[12] H. Bredohl, I. Dubois, P. Nzohabonayo, J. Mol. Spec. 93 (1982) 281
[13] L. B. Knight, Jr., B. W. Gregory, S. T. Cobranchi, D. Feller, E. R. Davidson, J. Am.
Chem. Soc. 109 (1987) 3521
[14] C. R. Brazier, P. G. Carrick, J. Chem. Phys. 96 (1992) 8684
[15] S. R. Langhoff, C. W. Bauschilcher Jr., J. Chem. Phys. 95 (1991) 5882
[16] M. E. DeRose, P. G. Carrick, C. R. Brazier, J. Mol. Spec. 174 (1995) 379
[17] C. R. Brazier, P. G. Carrick, J. Chem. Phys. 100 (1994) 7928
[18] S. Tam, M. Macler, M. E. DeRose, M. E. Fajardo, J. Chem. Phys. 113 (2000) 9067
[19] M. Dupuis, B. Liu, J. Chem. Phys. 68 (1978) 2902
[20] A. A. Padgett, V. Griffing, J. Chem. Phys. 30 (1959) 1286
[21] C. F. Bender, E.R. Davidson, J. Chem. Phys. 46 (1967) 3313
[22] S. R. Langhoff, C. W. Bauschilcher Jr., J. Chem. Phys. 92 (1990) 1879

[23] R. A. Whiteside, Ph. D. Thesis, Carnegie Mellon University, Pittsburgh (1981)
[24] J. Koutecky, G. Pachcioni, G. H. Jeung, E. C. Hass, Surf. Sci. 156 (1985) 651
[25] S. Lunell, Surf. Sci. 141 (1984) 199
[26] R. Hoffman, M. Gouterman, J. Chem. Phys. 36 (1962) 2189
[27] L. Hanley, J. L. Whitten, and S. L. Anderson, J . Phys. Chem. 92 (1988) 5803
[28] A. K. Ray, I. A. Howard, K. M. Kanal, Phys. Rev. B 45 (1992) 14247
[29] Frisch, M. J.; Trucks, G. W.; Schlegel, H. B.; Scuseria, G. E.; Robb, M. A.;
Cheeseman, J. R.; Zakrzewski, V. G.; Montgomery, J. A., Jr.; Stratmann, R. E.;
Burant, J. C.; Dapprich, S.; Millam, J. M.; Daniels, A. D.; Kudin, K. N.; Strain, M.
C.; Farkas, O.; Tomasi, J.; Barone, V.; Cossi, M.; Cammi, R.; Mennucci, B.; Pomelli,
C.; Adamo, C.; Clifford, S.; Ochterski, J.; Petersson, G. A.; Ayala, P. Y.; Cui, Q.;
Morokuma, K.; Malick, D. K.; Rabuck, A. D.; Raghavachari, K.; Foresman, J. B.;
Cioslowski, J.; Ortiz, J. V.; Stefanov, B. B.; Liu, G.; Liashenko, A.; Piskorz, P.;
Komaromi, I.; Gomperts, R.; Martin, R. L.; Fox, D. J.; Keith, T.; Al-Laham, M. A.;
Peng, C. Y.; Nanayakkara, A.; Gonzalez, C.; Challacombe, M.; Gill, P. M. W.;
Johnson, B. G.; Chen, W.; Wong, M. W.; Andres, J. L.; Head-Gordon, M.; Replogle,
E. S.; Pople, J. A. Gaussian 98, revision A.7; Gaussian, Inc.: Pittsburgh, PA, 1998.
[30] G. Verhaegen, F. E. Stafford, M. Ackerman, J. Drowart, Nature 193 (1962) 1280
[31] G. Verhaegen, F. E. Stafford, J. Drowart, J. Chem. Phys. 40 (1964) 1622
[32] W. C. Easley, W. Weltner, Jr. J. Chem. Phys. 52 (1970) 1489
[33] C. Thomson, J. Chem. Phys. 58 (1973) 216
[34] L. B. Knight, Jr., S. T. Cobranchi, J. T. Petty, and E. Earl, D. Feller and E. R. Davidson, J. Chem. Phys. 90 (1989) 690
[35] C. W. Larson, J. D. Presilla-Marquez, J. Chem. Phys. 111 (1999) 1988
[36] J. M. L. Martin, P. R. Taylor, J. Chem. Phys. 100 (1994) 9002
[37] L. B. Knight, Jr., D. W. Hill, T. J. Kirk, C. A. Arrington, J. Phys. Chem. 96
(1992) 555
[38] P. A. Roland, J. J. Wynne, J. Chem. Phys. 99 (1993) 8599
[39] C. A. Thompson and L. Andrews, J. Am. Chem. Soc. 117 (1995) 10125
[40] C. A. Thompson, L. Andrews, J. M. L. Martin, J. El-Yazal, J. Phys. Chem. 99
(1995) 13839

[41] K. R. Asmis, T. R. Taylor, D. M. Neumark, Chem. Phys. Lett. 295 (1998) 75
[42] K. R. Asmis, T. R. Taylor, D. M. Neumark, Eur. Phys. J. D 9 (1999) 257
[43] K. R. Asmis, T. R. Taylor, D. M. Neumark, J. Chem. Phys. 111 (1999) 8838
[44] K. R. Asmis, T. R. Taylor, D. M. Neumark, J. Chem. Phys. 111 (1999) 10491
[45] L. Andrews, P. Hassanzadeh, T. R. Burkholder, J. M. L. Martin, J. Chem. Phys. 98
(1993) 922
[46] J. M. L. Martin, J. P. Francois, R. Gijbels, J. Chem. Phys. 90 (1989) 6469
[47] F. Marinelli, A. Pellegatti, Chem. Phys. Lett. 158 (1989) 545
[48] R. Hernandez and J. Simons, J. Chem. Phys. 94 (1991) 2961
[49] I. A. Howard, A. K. Ray, Z. Phys. D 42 (1997) 299
[50] C. L. Yang, Z. H. Zhu, J. Mol. Struct. 571 (2001) 225
[51] Y. M. Hamrick, R.J. Van Zee, and W. Weltner, J. Chem. Phys. 96 (1992) 1767
[52] S. Li, R.J. Van Zee and W. Weltner, Chem. Phys. Lett. 262 (1996) 298
[53] H.-J. Zhai, L.-S. Wang, A. N. Alexandrova, A. I. Boldyrev, V. G. Zakrzewski, J .
Phys. Chem. A 107 (2003) 9319
[54] M. Wyss, E. Riaplov, A. Batalov, J. P. Maier, T. Weber, W. Meyer, and P. Rosmus,
J. Chem. Phys. 119 (2003) 9703
[55] C. M. Niu, Y. Z. Lu, C. M. Lieber, Science 261 (1993) 334
[56] A. Meller in Gemelin’s Handbook of Inorganic Chemistry, 8-th ed., 3-rd
supplement: Boron compounds (Springer, Berlin, 1988)
[57] J.J. Pouch, S. A. Alterovitz, Synthesis and properties of Boron Nitride, Trans Tech,
Zurich, (1990)
[58] F. Kaminaga, S. Sato, Y. Okamoto, J. Nucl. Sci. Tech. 29 (1992) 121
[59] J. P. Coad, B. Farmery, J. Linke, E. Wallura, J. Nucl. Mater 200 (1993) 389
[60] T. Shikama, M. Fujitsuka, H. Araki, T. Noda, J. Nucl. Mater 191 (1992) 611
[61] B. M. Swinyard, J. Spacecr. Rockets, 28 (1991) 730
[62] P. B. Mirkarimi, K. F. McCarty, D. L. Medlin, Mater. Sci. Eng. R. 21 (1997) 47
[63] O. Stephan, Y. Bando, A. Loiseau, F. Willaime, N. Shramchenko, T. Tamiya, T
Sato, Appl. Phys. A: Mater. Sci. Process. 67 (1998) 107
[64] D. Golberg, Y. Bando, O. Stephan, K. Kurashima, Appl. Phys. Lett. 73 (1998) 2441
[65] X. Blasé, A. Rubio, S. G. Louie, M. L. Cohen, Europhys. Lett. 28 (1994) 335

[66] J. D. Presilla-Marquez, P. G. Carrick, C. W. Larson, J. Chem. Phys. 110 (1999) 5702
[67] S. Becker, H.-J. Dietze, Int. J. Mass Spectrom. Ion Processes, 73 (1986) 157
[68] S. Becker, H.-J. Dietze, G. Kessler, H.-D. Bauer, W. Pompe, Z. Phys. B: Condens.
Matter 81 (1990) 47
[69] P. Hassanzadeh and L. Andrews, J. Phys. Chem. 96 (1992) 9177
[70] J. M. L. Martin, T. J. Lee, G. E. Scuseria, P. R. Taylor, J. Chem. Phys. 97 (1992)
6549

CHAPTER 7 Summary The work was focused on the spectroscopic study of carbon chain species as well
as small boron clusters in the gas phase. The experimental apparatus was built before,
however, in order to produce boron species. The source had to be modified as in this case
a solid sample of precursor had to be used. Up to now the apparatus could be used to
study the electronic transitions of variety of the species producing only by discharging a
suitable gas precursor. The heating system built for this purpose worked flawlessly and
the first gas-phase electronic spectrum of B3 could be obtained. This experiment showed
that solid-state precursors can be also used for the production of the exotic species in the
gas phase, which increases significantly the potential of the CRD experiment. The heated
source can be promising for further studies of the bare carbon chains C6+, C7
+ and C9+.
Their spectra were already measured in the neon matrix and solid precursor
(perchloronaphtalene) was used in this case. Since C10Cl8 worked very well in the matrix
experiment, it seems reasonable to assume that in the CRD experiment this precursor
could work as well.
As mentioned before, cavity ringdown spectroscopy combined with a supersonic
slit jet plasma have been applied to obtain gas-phase spectra of the variety of carbon
chain species. They ranged from rather short ones like HC4H+, to relatively long such as
HC10H+. Most of them are linear, however, spectra of the nonlinear carbon chains were
also measured (C4H4+, C6H4
+ and C8H4+). High sensitivity of the cavity ringdown method
and low temperature attained in a jet, in many cases allowed to obtain and analyze
rotationally resolved electronic spectra. One of the main results of the work was
obtaining the electronic spectrum of the pentaacetylene cation. It turned out to be the
largest polyacetylene cation measured in the gas phase so far. Astrophysical relevance of

the HC10H+ was considered, however, the work showed that HC10H+ can not be a carrier
of the DIBs. There was no match with the hitherto reported diffuse interstellar bands in
the near infrared.
Apart from carbon chain species, the spectrum of the cyclic B3 molecule was also
measured. It was the first detection of this molecule in the gas phase. The analysis of the
rotational structure of the spectrum allowed the geometry of the molecule to be inferred,
which turned out to be the first structural information on cyclic boron trimer in the gas
phase.

8. Publications.

! " #
!"#$
$% " &''$( ) * & " &''$
+,
-* , , . . , -,
. / -- - -* +, . '' &&%&0$ *$
' ''&0112 ' ''&00% *$ +, *- , . *
- . , ,/ , , * , 3**
&''$ 4 5 6 ,
7 *, - , ., , ,, . , 6,*8 9$&: -, 9;%: , 91$': , . - +, - -- * / , )* * *- ./ -,3 , - -, .3 - 9$$;$2: - , 3 3
- . , , * *<. / - * , - . * - = 9$$>:? +, -3 , * * , $$ , 9$0: 7 , . 3 - , &$ /,
% , . . @ * *3/ -- 9$%: , > /. .- 90: 5) * . , 3 8- , & - /,,- , . . *8 9$1: 7 , . .- 3 A 8 -3- / - . / .- &&00 *$ & +, . -- 3** , 7 , /< , . , . , / * / / 9&': +,/ -* , B ,/ - =
? , / -3, =$
? , / 3, 3 =$
? @* *- , 8-* * .3 C -* /
0 5-*. &''$
,* , 2 =&''$? %1;1&
///*DD-
- , @8B E2$3>$3&>0%
% $$& ,F., = ?
'''13&>$2D'$DG 3 * &''$ 4 5 6 ,
77B 5 ' ' ' 1 3 & > $ 2 = ' $ ? ' ' % 0 & 3 0

, & /, 3*3* +,- - -3, / - . /, ,- ./ , 7 , - , )* * , , -,-*
+, & * . ,,, ,, - - =-$'' * %'' $' . .< -3
? 'H D *8 ,, * '' * * +, , / - , . . . 9&$: *- , $';' I . , / +, * - /, , 8-3 --8* % ** /3* . , - , .* ='' *$ . / ,? +- 2 / , /, +,. , . -* 7 2%01&% * +, * , /,/,, , . C . * '$ *$
22831 22832 22833 22834
5 15 25
cm1
20 10
@ $ 7 , -- , . ,
-* & ,/ * .- .
/ -- ,, - - -* = & I? +, - . . .-
. & ,/ , / , '$ *$ ,
& * , - .. . , . * /,,
3** * = 8?
1' ' (# ' ) ( * +,-. /0/,

7 @ $ =-- ? , . ,
3 ,/ +, -* *.- , 3 , 3 > 90: 0 920: , /, . 20$ ' * , - ,/ 3 ., - . . . & ,/ ,/ @ $ , & * J ., -4, - , ) 3 , . , *3** 1 = $ 2 $ 8- ' /, $? +, - . . A , , . * 23*. $ @ $ 7 $0 , ., $% , ., ,. . & +, . 2 * ,*- * / 7 - 3- , . - C </ , -;- - ., . , - - * )3 , / 13 +, , *3
. . , * , . @ , / )8 , * , 3> ='> *$ 9&&:? / -* '2$' *$ +, , . -* / -, 9&: +, / ) ''
' ' -* +, ) ,
* , ''$ *$ 7 K *- , ) +, +. $+,
'' $''0> A *
, , , - 83 +, *-. , , - > =$''$?L> =$''>'? 0 =$''2? 90: +, ) . '' &&%&0$ *$ +, * . , /, /,, ,. C . * +, . 1 *$ , . , . .3 , *8 >' *$ *3- /, -., - . * 9&2:+, ) . * , *
M , . , 9&': , ,
, ** , - +, ** +. $ ,-
' ) . ,
* ' , )
, - ,
, / , * )
$ +, - , ) - ,
8 = 90:?& /, - . C
+. $
*- , 8-* , -- ,
=*$?
48-* +,
3*8. ! -,
'' && 00=&? && %&0=$?
'$ &2 >10%=&? &2 01$=$?
=
? ''&0%0 '''$2 ''$1'
=
$ ? ''&01' '''$1 ''$1&
' ''&011=2?
' ''&00%=?
9&':. 9$1: +, /<
' (# ' ) ( * +,-. /0/, 1$

* +, *- , 3** -. , &&00 *$ . . , *8 -* 9$1: ,, , , *+, . /< 9&': - , / /
, - -3,
$ . ,,
, - / . / ) / * , , +, - 8-* ,/)* , - , , ,, - - - * , * /, , . , 3> 0 * . , / /,, , < &B$ - 3 N . 83- , - - .* -. * 3** +, 8- - 90: 7 ,/3 , K < - C , , . . 6 ,
. 3 8 -. , . , -- =. $$' 9$1:? , . . +,/ , * /< . , -, &201$$ *$ +, - . C $1% *$ , -- , $1>$ *$ , *8 9$1:
+, /< , . -- . , 5/ 5 @ N &'3>21'' O ,< L # 5*, 4 6 . - , *8 - -. 9&2:
9$: " # " , ,* $'& =$11%? 2>&
9&: 7 *< # @ 7 *< 5 I,
5-<34. ! # O I,* " ,*
, $'% =$11%? $'$&1
9: + + 5 L# *< " ,* , $'%
=$11%? $''$%
92: L 6 # #, +, " ,* ,
$$& =&'''? $'$21
9: L A + #/< O4 5 "
# ,* , &1 =&'''? &1
9>: # < @ !, # +N # ,< " #
@ L $$ =&'''? %
90: + #/< # O 4 -
" # " ,* , $$2 =&''$? 01$%
9%: + 6 L @ !, " # " ,* ,
$$2 =&''$? &&'%
91: P 5L *,K , ,* ,* ,
=&''$? $2'
9$': P 5L *,K " , ,* $' =&''$?
>&0
9$$: # +N L I</ # ,< " #
-, " '> =$11%? >1
9$&: L 6 # #, +, -, "
&1 =$111? >$
9$: + #/< " # !
! @ # " I/< ! O<
L 6, -, " $ =&'''? $&
9$2: 6, + 6 5-,* 0
=&''$? 02
9$: # ! " , 3
-, =$11%? $
9$>: #6 6 "I! O @ * #" +
-, " '% =$11%? &%>
9$0: #6 6 @ * #" + # #,
!. +, -, " 2% =$110? >$
9$%: # #, O , #" + +,
-, " 5-- 5 $&1 =&'''? >$$
9$1: # 5*, 4 +,* ! 5,* 64
O 4 6 . " ,* , $%2 =$112? &
9&': " + L #<N ,* , '
=$111? 2$
9&$: + #/< 5 7* 0' =$111?
$'
9&&: L ! # #, " -- +,
-, " 2' =&'''? &%>
9&: # O 5, ,* M 6
MI ! 4 $112 $11%
9&2: # 5*,3!<, # # @</<
I 4 6 . ,* , =.* ?
+, . . . .
-. * * , .
1& ' (# ' ) ( * +,-. /0/,

JOURNAL OF CHEMICAL PHYSICS VOLUME 116, NUMBER 3 15 JANUARY 2002
Rotationally resolved A 2Pu]X 2Pg electronic transition of NC 6N¿
H. Linnartz,a) D. Pfluger, O. Vaizert, P. Cias, P. Birza, D. Khoroshev, and J. P. MaierInstitute for Physical Chemistry, Klingelbergstrasse 80, CH-4056 Basel, Switzerland
~Received 17 August 2001; accepted 23 October 2001!
The rotationally resolvedA2Pu←X2Pg electronic origin band spectrum of dicyanodiacetylenecation, NC6N
1, has been recorded in the gas phase using frequency-production double modulationspectroscopy in a liquid nitrogen cooled hollow cathode discharge and cavity ring downspectroscopy in a supersonic plasma. The analysis of the complementary results provides accuratemolecular parameters for the two spin-orbit components in both electronic states. ©2002American Institute of Physics.@DOI: 10.1063/1.1427710#
av,-
uocoat
thn-molto
e
nse
enth
-ryfo
etia
na
ave
lede--e
u-fastf theonlikehe
terolu-
lute
e
ed.
fre’’
of
ein-ula-th
pin-
I. INTRODUCTION
In recent years several cyanopolyacetylene radic(HCnN) have been studied by Fourier transform microwaspectroscopy1,2 and, following their laboratory detectionspecies as large as HC11N have been identified by radio astronomy in the interstellar medium.3 The dicyano derivatives(NCnN) may be comparably abundant in space, but aresuitable for microwave detection due to absence of a dipmoment. In this case accurate spectroscopic informationbe obtained from high resolution studies of vibrationalelectronic transitions in the gas phase. The latter are avable for a series of carbon chain radicals. Examples arenonpolar NC5N ~Ref. 4! and HC7H,5,6 as well as chains thawere already detected in dense interstellar clouds sucHC6N ~Ref. 6! and C6H.7 These species are formed in iomolecule reactions and consequently spectroscopic infortion on carbon chain ions is needed as well, but high restion data are rare and pure rotational spectra are limitedfew species.8
This is particularly true for the~di!cyanopolyacetylenecations. Electronic spectra have been recorded in nmatrices for NC2nN1 (n52 – 6) and HC2n11N1 (n52 – 6).9–12 Following these and low resolution emissiostudies13–15 the rotationally resolved electronic gas phaspectrum of the cyanodiacetylene (HC5N
1) and dicy-anoacetylene (NC4N
1)16 as well as the cyanotriacetylen(HC7N
1)17 were reported. In the present work the rotatioally resolved spectrum of the next larger member indicyano-series, NC6N
1, is presented. The results are compared with the results of density functional theocalculations18 and the spectroscopic parameters availablethe iso-electronic chains HC7N
1 ~Ref. 17! and HC8H1.19
II. EXPERIMENT
The spectra are recorded using two complementaryperimental approaches. These are frequency producdouble modulation~FPM! spectroscopy of a static plasmgenerated in a discharge cell (Trot;150 K! and cavity ring-down ~CRD! spectroscopy sampling a supersonic pla
a!Electronic mail: [email protected]
9240021-9606/2002/116(3)/924/4/$19.00
Downloaded 27 Feb 2002 to 131.152.105.107. Redistribution subject to
lse
n-leanril-he
as
a-u-a
on
-e
r
x-on
r
plasma (Trot515 K!, yielding spectra with significantly dif-ferent rotational profiles. Both experimental techniques hbeen described. In the FPM experiment20 mixtures of 0.5%–0.6% cyanogen/He are discharged in a liquid nitrogen coohollow cathode incorporated into a White-type multiple rflection cell (L tot;100 m!. Production modulation is obtained by applying a rectified 17 kHz ac voltag~2500 to 700 V!. The laser beam is electro-optically modlated at a radio frequency of 192 MHz and detected by aphotodiode. Subsequent phase sensitive demodulation ohigh frequency portion of the signal during a producticycle gives absorption bands that have a derivativeshape. The resolution is Doppler limited and typically of torder of 550 MHz.
In the CRD setup21 the NC6N1 radicals are formed by a
discharge through a high pressure gas pulse~typically 100mA at 21000 V for a 12 bar backing pressure! of an 0.2%cyanogen/He mixture in the throat of a 3 cm3300 mmmultilayer slit nozzle device. A standard CRD spectromeis used to detect the signals in direct absorption. The restion is limited by the bandwidth of the laser to;0.035 cm21.In both experiments iodine spectra are used for an absofrequency calibration.
III. RESULTS AND DISCUSSION
An overview scan of theA2Pu←X2Pg electronic originband transition of NC6N
1 recorded by FPM in the dischargcell is shown in Fig. 1. In the range 15 240–15 248 cm21
approximately 200 individual absorption lines are resolvThese transitions belong to theP-, Q- andR-branches of twosubbands corresponding to the parallelA2P3/2←X2P3/2 andA2P1/2←X2P1/2 electronic transitions. The intensity ratio othe two bands is determined by the ‘‘spin-orbit temperatuand the value of the spin-orbit splitting (A9) in the groundstate. The latter is estimated from previous studies to bethe order of 240(5) cm21,16 the minus indicating thatthe V53
2 spin-orbit component is lower in energy than thV51
2. At the high ambient temperature in the cell both sporbit components are equally intense. The rotational poption is distributed over many levels and the intensity of boQ-branches and transitions starting from lowJ-levels is low.Clear band heads, however, are missing. Moreover, the s
© 2002 American Institute of Physics
AIP license or copyright, see http://ojps.aip.org/jcpo/jcpcr.jsp

n
925J. Chem. Phys., Vol. 116, No. 3, 15 January 2002 A2Pu←X2Pg transition
FIG. 1. Rotationally resolved fre-quency production double modulatioabsorption spectrum of theA2Pu
←X2Pg electronic origin band ofNC6N
1 measured in a liquid-nitrogencooled hollow cathode discharge (Trot
;150 K!. The P-, Q- and R-branchesof the A2P3/2←X2P3/2 and A2P1/2
←X2P1/2 subbands are indicated.
lil.eed
nio
t
s
r-
d
h
in
ts
85
orbit components overlap as the difference in spin-orbit sptings in ground and excited state,DA, appears to be smalAll these factors together lead to ambiguity in the assignmof the rotational lines. What is missing is a clearly definstarting point. This is provided by the jet spectrum.
In Fig. 2 part of the spectral region of Fig. 1 is showThe spectrum is recorded by CRD in the plasma expansOnly the lower subband,A2P3/2←X2P3/2, is clearly visiblenow, as the population of the upper spin-orbit componenlow. Besides unresolvedP- and R-branches,22 a clearQ-branch is observed starting at 15 245.46~3! cm21. Thisbranch is not visible in Fig. 1, but the CRD position allowthe assignment of transitions belonging to theA2P3/2
←X2P3/2 subband within61 J quantum numbering in theFPM spectrum. The band gap is;10B @with B;0.019 cm21
~Ref. 18!# reflecting that the lowest rotational transitions co
Downloaded 27 Feb 2002 to 131.152.105.107. Redistribution subject to
t-
nt
.n.
is
respond toP( 52) andR( 3
2). Adjacent transitions are separateby ;2B. In this way more than 80~40! transitions have beenassigned inP(R)-branch of theA2P3/2←X2P3/2 band withJ-values up to 90.5.23 These values are then fitted witPGopher24 usingn0 , B09 , B08 , D09 andD08 as variables yield-ing a rms of 0.002 cm21. The resulting constants are listedTable I. The value forB0950.018 753 3(55) cm21 is close tothe Be-value of 0.018 67 cm21 as obtained from densityfunctional calculations.18 A simulation using these constanproves that the stronger feature in Fig. 1 at 15 247.23~3!cm21 corresponds to theR-branch band head of theA2P3/2
←X2P3/2 system. A similar feature is observed at 15 247.cm21 and is tentatively assigned to theR-branch band headof the second spin-orbit system.
The lines that are left over are mainly due to theV512
e
pin-in
FIG. 2. Cavity ring down absorption spectrum of thA2P3/2←X2P3/2 electronic origin band of NC6N
1, re-corded through a supersonic plasma. The second sorbit component is not visible at the low temperaturethe jet (Trot;15 K!. The Q-branch position is used toassign the FPM spectrum.
AIP license or copyright, see http://ojps.aip.org/jcpo/jcpcr.jsp

v.1tatentrosp
ft
fo
rss
at
-ty-
are
to
m-
for9
-
f
926 J. Chem. Phys., Vol. 116, No. 3, 15 January 2002 Linnartz et al.
component. The rotational assignment is problematic nowinformation on theQ-branch of theA2P1/2←X2P1/2 band ismissing. The difference between the band heads, howeindicates that theQ1/2-branch is expected around 15 246cm21. In addition, only minor differences between the rotional constants for the two spin-orbit systems are expecIn previous studies transitions originating from differespin-orbit components were fitted with one single set oftational parameters.7,16,19In the present experiment this turnout not to be possible. However, as long as the effect of suncoupling is small, i.e., 2BJ!uAu, B is best replaced byeffective parametersBeff(
2P1/2) and Beff(2P3/2). In second
order perturbation theory the differenceDBeff is given by
DBeff52B2
A, ~1!
where A5A22B.25 A is expected to be of the order o240(5) cm21 ~Ref. 16! which puts an additional constrainto the fit. The line positions and most likely assignment
TABLE I. Molecular constants~in cm21! for the A2P3/22X2P3/2 and forthe A2P1/22X2P1/2 electronic origin band transition of NC6N
1. The mo-lecular parameters for theA2Pu←X2Pg electronic origin band transition othe iso-electronic HC7N
1 ~Ref. 17! and HC8H1 ~Ref. 19! species are listed
for comparison.
NC6N1 HC7N
1 HC8H1
V53/2 V51/2 V53/2 V53/2 and 1/2
B09 0.018 753 3~55! 0.018 707~19! 0.018 966 5~71! 0.019 077 9~93!D09 6.7(15).1029 6.2(38).1029
B08 0.018 558 5~56! 0.018 565~19! 0.018 773 1~72! 0.018 867 3~94!D08 7.1(16).1029 8.3(39).1029
DB 20.00019 20.00014 20.00019 20.00021
DA 1 0.56 22.04 23.00n0 15 245.737~1! 14 925.423~4! 14 143.1815~5!
Downloaded 27 Feb 2002 to 131.152.105.107. Redistribution subject to
as
er,
-d.
-
in
r
transitions belonging to theA2P1/2←X2P1/2 system areavailable from~Ref. 26!. The resulting molecular parameteare given in Table I. The quality of the fit will be worse aonly a few transitions share a common level~rms ;0.004cm21!.26 Nevertheless, using Eq.~1! an A9-value between215 and232 cm21 is calculated.27 The simulation confirmsthat the band head position coincides with the feature15 247.85 cm21.
The spectral features of NC6N1 are expected to be quali
tatively similar to those of the iso-electronic cyanotriacelene cation17 and tetraacetylene cation.19 The molecular pa-rameters of theA2Pu←X2Pg electronic origin bands ofthese two ions are listed in Table I as well. These bandsshifted to lower energy, by 320 cm21 for HC7N
1 and by1103 cm21 for HC8H
1. The DA value of HC7N1 ~22.04
cm21! is comparable to that of HC8H1 ~23.00 cm21!, but
the corresponding value for NC6N1 is significantly smaller
and, moreover, is positive~10.56 cm21!. This value, how-ever, is very close to theDA510.53 cm21 found forNC4N
1.16 There it was concluded that this anomaly is duea spin-orbit induced interaction of the upperA2P1/2 elec-tronic state with another low lying electronic state, presuably of 2S character, whereas theA2P3/2 state is not af-fected. This becomes clear from the different valuesDB5B082B09 : for the V5 3
2 component a value of 0.000 1cm21 is found, similar to the values determined for HC7N
1
~0.000 19 cm21! and HC8H1 ~0.000 21 cm21!, but for V51
2
the value decreases to 0.000 14 cm21. The second-order spinorbit contribution to the rotational constant for aP state isgiven by28,29
B(2)5SnÞ0
4B2
E002En
0. ~2!
With uDEu540 cm21 this givesB(2);0.000 04 cm21, i.e., anunperturbed value forDB of 0.000 18 cm21, close to thevalue of the other spin-orbit component.
In the case of NC4N1 it was also found that the
2S22P interaction removes the degeneracy of thee- and
eho
FIG. 3. High J-level transitions withtheir typical 1f derivative line shapesrecorded in the FPM experiment. Thsimulated spectrum is shown for botspin-orbit components. There is nevidence forL-doubling~see the text!.
AIP license or copyright, see http://ojps.aip.org/jcpo/jcpcr.jsp

heve
i
nath
b,
b,
.
P.
.
n-
t.
em.
, J.
r,
ys.
f re-
lineieved
ore
,
927J. Chem. Phys., Vol. 116, No. 3, 15 January 2002 A2Pu←X2Pg transition
f-symmetry, resulting in a resolvableL-doubling. This effectis not observed here. In Fig. 3 part of theP-branch range forhigh J-levels in both spin-orbit components is shown. Tsimulated spectrum is given as well. Clearly, there is no edence forL-doubling within the experimental resolution: thsize of the splitting would have beenJ-dependent and theexpected 2:1 spin-statistical alternation is lacking. Thisalso expected: the rotational constant of NC6N
1 is 2.5 timessmaller than that of NC4N
1 ~;0.044 cm21! and since theL-type doubling constantsp andq are proportional toB andB2, respectively, splittings will be considerably smaller.
ACKNOWLEDGMENTS
This work has been supported by the Swiss NatioScience Foundation, Project No. 20-63459.00. One ofauthors~H.L.! also acknowledges support from FOM~Fun-damenteel Onderzoek der Materie!.
1M. C. McCarthy, J. U. Grabow, M. J. Travers, W. Chen, C. A. Gottlieand P. Thaddeus, Astrophys. J.494, L231 ~1998!.
2M. C. McCarthy and P. Thaddeus, Chem. Soc. Rev.30, 177 ~2001!.3M. B. Bell, P. A. Feldman, M. J. Travers, M. C. McCarthy, C. A. Gottlieand P. Thaddeus, Astrophys. J.483, L61 ~1997!.
4H. Linnartz, O. Vaizert, P. Cias, L. Gru¨ter, and J. P. Maier, Chem. PhysLett. 345, 89 ~2001!.
5C. D. Ball, M. C. McCarthy, and P. Thaddeus, J. Chem. Phys.112, 10149~2000!.
6O. Vaizert, T. Motylewsi, M. Wyss, E. Riaplov, H. Linnartz, and J.Maier, J. Chem. Phys.114, 7918~2001!.
7H. Linnartz, T. Motylewski, O. Vaizert, J. P. Maier, A. J. Apponi, M. CMcCarthy, C. A. Gottlieb, and P. Thaddeus, J. Mol. Spectrosc.197, 1~1999!.
8C. A. Gottlieb, A. J. Apponi, M. C. McCarthy, P. Thaddeus, and H. Linartz, J. Chem. Phys.113, 1910~2000!.
Downloaded 27 Feb 2002 to 131.152.105.107. Redistribution subject to
i-
s
le
9J. Agreiter, A. M. Smith, M. Ha¨rtle, and V. Bondybey, Chem. Phys. Let225, 87 ~1994!.
10D. Forney, P. Freivogel, J. Fulara, and J. P. Maier, J. Phys. Chem.102,1510 ~1995!.
11J. Agreiter, A. M Smith, and V. Bondybey, Chem. Phys. Lett.241, 317~1995!.
12A. M. Smith, J. Agreiter, and V. Bondybey, Chem. Phys. Lett.244, 379~1995!.
13E. Kloster-Jensen, J. P. Maier, O. Marthaler, and M. Mohraz, J. ChPhys.71, 3125~1979!.
14G. Bieri, E. Kloster-Jensen, S. Kvisle, J. P. Maier, and O. MathalerChem. Soc., Faraday Trans.76, 676 ~1980!.
15J. P. Maier, L. Misev, and F. Thommen, J. Phys. Chem.86, 54 ~1982!.16W. E. Sinclair, D. Pfluger, and J. P. Maier, J. Chem. Phys.111, 9600
~1999!.17W. E. Sinclair, D. Pfluger, D. Verdes, and J. P. Maier, J. Chem. Phys.112,
8899 ~2000!.18S. Lee, J. Phys. Chem.100, 13959~1996!.19D. Pfluger, T. Motylewski, H. Linnartz, W. E. Sinclair, and J. P. Maie
Chem. Phys. Lett.329, 29 ~2000!.20W. E. Sinclair, D. Pfluger, H. Linnartz, and J. P. Maier, J. Chem. Ph
110, 296 ~2000!.21T. Motylewski and H. Linnartz, Rev. Sci. Instrum.70, 1305~1999!.22No rotational resolution has been obtained, presumably because o
sidual Doppler broadening.23See EPAPS Document No. E-JCPSA6-116-004204 for a list with
positions and observed-calculated values. This document may be retrvia the EPAPS homepage~http://www.aip.org/pubserv/epaps.html! orfrom ftp.aip.org in the director /epaps/. See the EPAPS homepage for minformation.
24C. M. Western, School of Chemistry, University of Bristol, UKPGOPHER, 1994 and 1998.
25H. W. Kroto, Molecular Rotation Spectra~Wiley, New York, 1975!,p. 232.
26See Ref. 23.27Shifting the rotational assignment by61 J gives values of27 and
2115 cm21.28J. H. van Vleck, Rev. Mod. Phys.23, 213 ~1951!.29R. F. Curl, Mod. Phys.9, 585 ~1965!.
AIP license or copyright, see http://ojps.aip.org/jcpo/jcpcr.jsp


JOURNAL OF CHEMICAL PHYSICS VOLUME 118, NUMBER 23 15 JUNE 2003
High-resolution electronic spectroscopy of a nonlinear carbon chainradical C 6H4
¿
Mitsunori Araki,a) Harold Linnartz,b) Pawel Cias, Alexey Denisov, Jan Fulara,Anton Batalov, Ivan Shnitko, and John P. MaierDepartment of Chemistry, Klingelbergstrasse 80, CH-4056 Basel, Switzerland
~Received 19 March 2003; accepted 27 March 2003!
A high-resolution gas-phase spectrum of a molecular absorption band around 604 nm is assigned asdue to an electronic transition of a nonlinear C6H4
1 planar species starting from its2A9 electronicground state. The spectrum is observed in direct absorption by cavity ringdown spectroscopythrough a supersonic planar discharge through a mixture of acetylene in helium. The spectrum hasa clear rotational andK-type structure. This allows an accurate determination of theB and Crotational constants and an estimate for theA rotational constant in ground and electronically excitedstates. The resolved spectrum of the fully deuterated species C6D4
1 has been obtained as well. Theresults are compared both to the outcome ofab initio geometry optimizations and low-resolutionabsorption spectra in 6 K neon matrices obtained after mass-selective deposition. ©2003American Institute of Physics.@DOI: 10.1063/1.1575736#
rh
dthe
o
I
taitioueuna
f ad
rvf
hyrol-ste
w-
m is
.heition
re--
ins isc-theosees:
usesicge
-
r ofanxi-
ble
g-wn
, D
I. INTRODUCTION
In recent years many experimental studies have beenported presenting high-resolution spectra of pure and higunsaturated carbon chain radicals. Microwave,1 infrared,2
and UV–VIS spectra3,4 are available both from matrix angas-phase studies, all of them having in common thatmajor part of the observed geometries is linear. Even for vlong chains, such as HC22H ~Ref. 5! and HC17N ~Ref. 6!,linear structures have been found. Theoretical studies, hever, predict for longer chains cyclic structures as well.7 Inthe case of C13, for example, theory8 predicts a cyclicground-state structure, but the experimentally observedspectrum is clearly that of a linear chain.9 A reason for thisdiscrepancy might be simply that the experimentechniques—supersonic jet expansions or matrix deposexperiments—favor the production of linear species, becalarge-amplitude bending motions~that are necessary to closthe ring! are frozen in the production process. A similar sitation might apply to the interstellar medium, where malinear carbon chain species already have been identifiedthe number of cyclic structures is still rather limited.10
In this work the electronic spectrum of a member oso-far-unstudied class of carbon chain radicals is presentenonlinear and noncyclic species. The spectrum was obsemore or less accidentally around 604 nm when scanningcoincidences with diffuse interstellar band features in adrocarbon plasma. The observed spectrum has a cleartional andK-type structure. Simulation of the spectrum alows an accurate determination of the molecular constantthe carrier. Study of the partially and completely deuteraspecies gives information on the number of~equivalent! hy-
a!Author to whom correspondence should be addressed. Fax:141 612673855. Electronic mail: [email protected]
b!Present address: Department of Physical Chemistry, Vrije UniversiteitBoelelaan 1083, NL 1081 HV Amsterdam, the Netherlands.
10560021-9606/2003/118(23)/10561/5/$20.00
Downloaded 06 Nov 2003 to 131.152.105.85. Redistribution subject to A
e-ly
ery
w-
R
ln
se
-ynd
: aedor-ta-
ofd
drogen atoms. Final identification becomes possible folloing semiempirical andab initio geometry optimizations for anumber of species. These indicate that the band at 604 ndue to the carbon chain cation C6H4
1 with a nonlinearH–CwC–CwC–CHvCH2
1 planar molecular geometryThis is confirmed by the observation of their transition in tabsorption spectrum obtained after mass-selective deposof C6H4
1 ions generated in a hydrocarbon plasma in a 6 Kneon matrix.
Spectroscopic data for species of the form C6H4~1! are so
far missing. Only a photodissociation study has beenported in which C6H4
1 was generated following a ring opening reaction in cyanobenzene.11 In the latter study geometryoptimizations are reported usingMNDO calculations, whichresult in a series of equilibrium structures for the cationwhich the heat formation of the possible acyclic structureabout 150 kJ mol21 lower than that of benzene-type strutures. Among these is a geometry that is confirmed inpresent study, a linear noncyclic structure that is very clto the geometry proposed for the neutral speci1-hexene-3,5-diyne.12,13
II. EXPERIMENT
The experimental method has been described andcavity ringdown~CRD! spectrometer sampling a supersonplanar plasma.14 The plasma is generated by a discharthrough a gas pulse~2300 V, 30 Hz repetition rate! of a0.5% C2H2 ~and/or C2D2) in He mixture with a backing pressure of 10 bars in the throat of a 3 cm3100 mm multilayerslit nozzle geometry. Rotational temperatures of the orde20–40 K are routinely achieved. The nozzle is mounted inoptical cavity where the expansion is intersected appromately 2 mm downstream by the pulsed light of a tunadye laser~resolution 0.15 cm21!. The light leaking out of thecavity is detected with a photodiode, and the resulting rindown event is used as input for a standard ringdoe
1 © 2003 American Institute of Physics
IP license or copyright, see http://ojps.aip.org/jcpo/jcpcr.jsp

eranm
60a
yte
th-
e
e-
e
tedicalved.her
ber
rota-
ver-ut
isher
with
indi-
Theder
lf
di-
-
toin
s
-fo
b
10562 J. Chem. Phys., Vol. 118, No. 23, 15 June 2003 Araki et al.
analysis.15 A spectrum is recorded by determining an avaged ringdown time as a function of the laser frequencycalibrated by simultaneously recording an iodine spectru
III. RESULTS AND DISCUSSION
The CRD gas-phase spectrum of the band aroundnm is shown in Fig. 1. A series of overlapping rotationtransitions is observed as well as aK-type structure (K50 – 7), typical for a nonlinear species. Using C2D2 insteadof C2H2 yields a 67 cm21 blueshifted spectrum with nearlidentical spectral features, as shown in Fig. 2. This indicathat the carrier is of the form CnHm or CnHm
1/2 .16 In orderto determine the values forn and m, a C2H2/C2D2 mixturehas been used. A low-resolution scan, in which mainlystrong peaks forK50 and 1 will be visible, gives five broadbands including bands originating from fully H-~16 546cm21! and fully D- ~16 613 cm21! substituted species. Threremaining bands located at 16 500 cm21 ~a!, 16 560 cm21
~b!, and 16 595 cm21 ~c! are due to partially deuterated spcies. From this it can be concluded thatm54: thea, b, andc bands correspond to species with one, two, and thre
FIG. 1. Band observed at 604 nm using CRD spectroscopy through apersonic planar plasma expansion. The rotational andK-type structure that isobserved experimentally~top trace! can be simulated with a rotational temperature of 40 K, using constants derived from geometry optimizationsthe nonlinear planar and noncyclic C6H4
1 carbon chain cation~secondtrace!. The assignment is indicated in the figure and further illustratedstick diagrams of each individualKa . Lines marked with3 are due toanother carrier.
Downloaded 06 Nov 2003 to 131.152.105.85. Redistribution subject to A
-d.
4l
s
e
D
atoms, respectively. The one-, two-, and threefold-deuteraspecies should have four, six, and four peaks by statistarguments, but three, four, and three peaks are obserThis indicates that two of the four hydrogen atoms are ratsimilar.
The rotational analysis of the spectra with C2H2 andC2D2 as precursors allows the determination of the numof carbon atoms (n) in the chain. The stick diagrams~Fig. 1!show how the observed spectrum can be dissected intotional transitions belonging to individualK values. ThePbranch consists of a series of transitions that are closely olapping, causing some fluctuations in overall intensity, bwhich give a good indication for the value ofB9 (C9). Thechange in rotational constants upon electronic excitationreflected by a change of line distances, particularly for higJ levels on theP branch and gives values forB8 (C8). TheR-branch region consists of a series of unresolved bandsclear bandheads corresponding toK50 – 7 as indicated inFig. 1. The distance between the bandheads is a goodcation for the valueDA2DB5(A92A8)2(B92B8), andthe intensity ratio can be used to estimateA9. TheQ-branchbands are rather weak and cannot be assigned directly.overall pattern indicates a rotational temperature of the orof 40~5! K.
The spectra of CnH4~1! (CnD4
~1!) can now be rather welreproduced with rotationalB andC constants of the order o0.045 cm21 ~0.040 cm21! and anA constant of approxi-mately 1.2 cm21 ~0.9 cm21! using WANG.17 In view of theavailable constants for different kinds of carbon chain racals determined in previous studies18–20 this makes it verylikely that n56 or 7. Therefore possible equilibrium structures have been calculated for isomers of C6H4
~1! andC7H4
~1! ~and fully deuterated isotopes! using MOPAC
~Ref. 21! ~PM3/UHF!. The structure that gets closestthe observations is that of the nonlinear chaH–CwC–CwC–CHvCH2
1 ~Fig. 3! for which A951.230cm21, B950.0465 cm21, andC950.0448 cm21. This struc-
u-
r
y
FIG. 2. Spectrum for the fully deuterated C6D41 species, blueshifted by
approximately 67 cm21 with respect to the C6H41 cation. Lines marked with
3 are due to another carrier.
IP license or copyright, see http://ojps.aip.org/jcpo/jcpcr.jsp

etofein
d
f
Thlote
ll
rot
rsn
vese
a
an-on-notor aherallyw
oniontois
ell-
of
asentopy
,4-eetertheat 6
no-
red
onetotheant
ise.
ithnm
and
pedureThis04d
-thear
10563J. Chem. Phys., Vol. 118, No. 23, 15 June 2003 Spectroscopy of a carbon chain
ture corresponds to one of the geometries calculatedRef. 11 and is close to the previously proposed geomof the neutral C6H4. Other isomeric structures yield setssubstantially different constants, particularly for thfully deuterated species, whereas the correspondD–CwC–CwC–CDvCD2
1 gives A950.889 cm21, B950.0414 cm21, and C950.0395 cm21, close to the simu-lated values for the spectrum observed here.
In order to improve the geometry optimizationab initiocalculations have been performed usingGAMESS.22 In previ-ous work ROHF/6-31G** calculations have been reporteon the isomerization of C4H4 radical cations.23 An identicalmethod is applied here to C6H4
1. Rotational constants oC6H4
1 were determined using theab initio optimized struc-ture with bond lengths and angles as indicated in Fig. 3.resulting constants are summarized in Table I and are cto the MOPAC results, as may be expected. The simulaspectrum, using theab initio results, is plotted in Fig. 1 bothas stick diagrams for individualK values and as an overaspectrum with an assumed resolution of 0.05 cm21. The cal-culated and observed spectra match very well apart fminor intensity deviations and a few lines that may belonganother carrier.
At this stage, however, two points remain unclear. Fiit is not possible to discriminate between the neutral acationic species from the rotational analysis alone. Howethe neutral C6H4 is a closed-shell system and as a conquence it is unlikely that a strong electronic band is found
FIG. 3. Optimized molecular structure of C6H41 usingab initio calculations.
The bond lengths are given in Å.
TABLE I. Observed and calculated molecular constants of C6H41 and
C6D41.
C6H41 C6D4
1
Obs.a Ab initiob Obs.a Ab initiob
A9 1.24 1.217 0.89 0.889B9 0.0467 0.0471 0.0416 0.0420C9 0.0449 0.0453 0.0400 0.0401A8–A9 0.0767 0.0450B8 0.0452 0.0403C8 0.0434 0.0387(A8–A9) – (B8–B9)c 0.0782 0.0463T00 16 544.980 16 611.91
aExpected errors of the rotational constants are 0.1 cm21 in A and 0.001cm21 in B and C, whereas 0.0006 cm21 and 0.001 cm21 for B–C and(A8–A9) – (B8–B9). Expected errors ofT00 are 0.01 cm21 for C6H4
1 and0.1 cm21 for C6D4
1.bEquilibrium values.cAssumingB8–B95C8–C9.
Downloaded 06 Nov 2003 to 131.152.105.85. Redistribution subject to A
inry
g
esed
mo
t,dr,-t
a rather low energy of 604 nm. In this case electronic trsitions are expected in the UV. Indeed, the experimental cditions are in favor of a charged species. Second, it isclear whether the band observed here is the origin bandband that involves excitation of a vibrational mode in tupper electronic state—even though such bands are generather weak;3 i.e., the origin band may be redshifted by a fethousands cm21. The change in rotational constants upelectronic excitation is minor and reflects a small elongatof the molecule in the upper electronic state. It is hardconclude from these values that no vibrational excitationinvolved. However, the present band is close to the wstudied and closely relatedA 2)g–X 2)u electronic originband transition of the linear triacetylene cation (C6H2
1) thathas been located at 600 nm.24 In analogy with the lattersystem, which is due to a transition from apg
4pu3 to a
¯pg3pu
4 configuration, it is very likely that the upper statethe observed band of the nonlinear C6H4
1 will have 2A9symmetry. In this case the origin band of C6H4
1 is expectedto be rather close to that of C6H2
1, as is observed.Proof comes from a mass-selective matrix study that w
performed following the gas phase analysis. This experimcombines mass selection and matrix isolation spectroscand has been described.25 The C6H4
1 (C6D41) cations were
produced from a phenylacetylene–deuterated-2hexadiyne–! helium mixture in a hot cathode dischargsource. A 90° deflector and a quadrupole mass spectromare used to steer the ion beam onto the matrix, wheremass-selected ions are codeposited with excess of neonK. The absorption spectra are recorded by guiding mochromatized light~0.1 nm bandpass! through the matrix ontoa photomultiplier. The resulting spectra for matrices prepawith mass of C6H4
1 or C6D41 are shown in Fig. 4. Two
strong bands are observed, one around 609 nm andaround 585 nm, for C6H4
1. No strong bands are observedlower energy; i.e., the band at 609 nm corresponds toorigin band. The main structures to the blue of the dominpeaks~609 nm for C6H4
1 and 606 nm for C6D41) are matrix
artifacts, site structure. The 114 cm21 blueshift of the gas-phase spectrum with respect to the matrix band at 609 nmtypical for a chain of this size and in this frequency regim3
The band at 585 nm is due to another isomer of C6H41, since
the relative intensity of the two bands varies strongly wdifferent precursors. Upon deuteration the band at 609shifts by 62~3! cm21 to the blue—i.e., close to the 67 cm21
shift observed in the gas phase upon deuteration. The bobserved at 585 nm in the matrix only shifts 17~3! cm21
upon deuteration. Subsequent neutralization of the trapspecies by irradiation of the matrix with a medium-pressmercury lamp leads to the disappearance of both bands.confirms that the carrier of the 609 nm matrix and the 6nm gas-phase carrier is a C6H4
1 cation, as was concludefrom the gas-phase spectrum.
IV. ASTROPHYSICAL RELEVANCE
All the spectroscopic information is in favor of the identification of the band observed at 604 nm as due to2A9–X 2A9 electronic origin band transition of the nonline
IP license or copyright, see http://ojps.aip.org/jcpo/jcpcr.jsp

.thorth
sti-lls
lar
the
ofon
604
of
en
nal
nd
d J.
b,
cal,
M.
ys.
M.
ese
, J.
J.
d-
l
sses
ed
. T
nd
d
10564 J. Chem. Phys., Vol. 118, No. 23, 15 June 2003 Araki et al.
planar H–CwC–CwC–CHvCH21 carbon chain cation
The inferred rotational constants may guide a search forspecies by millimeter-wave spectroscopy to allow a maccurate geometry determination. This is of interest asnumber of microwave studies of carbon chain cations israther limited.26 It furthermore would make a radioastronomical search for this species in dense intersteclouds possible. The optical spectrum obtained here allowcomparison with the available lists of diffuse interstel
FIG. 5. Artificial DIB spectrum~Ref. 27! in the 604 nm range~lowest trace!and the simulated C6H4
1 spectra for 10, 40, and 150 K~upper three traces!.
FIG. 4. Electronic absorption spectra of C6H41 ~upper trace! and C6D4
1
~lower trace! measured in 6 K matrices after codeposition of mass-selectcations with excess of neon. The bands at 609 nm of C6H4
1 and at 606 nmof C6D4
1 correspond to the gas-phase spectra shown in Figs. 1 and 2weaker bands at 600 and 591 nm for C6H4
1 and 599 and 590 nm for C6D41
~indicated bys! exhibit an identical chemical behavior as the 609 nm baon C6H4
1 and the 606 nm band on C6D41 and are due to transitions to
vibrationally excited levels in the upper2A9 state. The bands at 585.3 an584.7 nm of C6H4
1 and C6D41 are due to another isomer.
Downloaded 06 Nov 2003 to 131.152.105.85. Redistribution subject to A
iseell
ara
band ~DIB! positions.27,28 A comparison with the hithertoreported DIBs shows that there exists an overlap betweenband observed around 16 545 cm21 and a broad DIB@fullwidth at half maximum~FWHM! ;14 cm21# reported at16 537.3 cm21. In order to check whether this discrepancy8 cm21 might be due to a temperature effect, a comparishas been made between an artificial DIB spectrum in thenm range and the C6H4
1 spectrum for low~10 K!, interme-diate ~40 K!, and high~150 K! temperatures~Fig. 5!. Al-though it is clear that for higher temperatures the spectrumthe nonlinear C6H4
1 might start filling up the broadbandaround 16 545 cm21, it is hard to account for the differencin intensity of theP andR branches. This is not reflected ithe DIB spectrum.
ACKNOWLEDGMENTS
This work has been supported by the Swiss NatioScience Foundation~Project No. 20-63459.00!. M.A. thanksthe Foundation for Promotion of Astronomy in Japan, aH.L. thanks FOM~Fundamenteel Onderzoek der Materie!.
1M. C. McCarthy and P. Thaddeus, Chem. Soc. Rev.30, 177 ~2001!.2A. van Orden and R. J. Saykally, Chem. Rev.98, 2313~1998!.3J. P. Maier, J. Phys. Chem. A102, 3462~1998!.4H. Linnartz, D. Pfluger, O. Vaizert, P. Cias, P. Birza, D. Khoroshev, anP. Maier, J. Chem. Phys.116, 924 ~2002! and references therein.
5T. Pino, H. B. Ding, F. Guthe, and J. P. Maier, J. Chem. Phys.114, 2208~2001!.
6M. C. McCarthy, J. U. Grabow, M. J. Travers, W. Chen, C. A. Gottlieand P. Thaddeus, Astrophys. J. Lett.494, L231 ~1998!.
7K. Aoki and S. Ikuta, J. Mol. Struct.: THEOCHEM310, 229 ~1994!.8J. M. L. Martin, J. P. Francois, R. Gijbels, and J. Almlo¨f, Chem. Phys.Lett. 187, 367 ~1991!.
9T. F. Giesen, A. Vanorden, H. J. Hwang, R. S. Fellers, R. A. Provenand R. J. Saykally, Science265, 756 ~1994!.
10P. Thaddeus and M. C. McCarthy, Spectrochim. Acta, Part A57, 757~2001!.
11W. J. van der Hart, E. Oosterveld, T. A. Molenaar-Langeveld, and N.M. Nibbering, Org. Mass Spectrom.24, 59 ~1989!.
12C. A. Arrington, C. Ramos, A. D. Robinson, and T. S. Zwier, J. PhChem. A103, 1294~1999!.
13T. Bohm-Gossl, W. Hunsmann, L. Rohrschneider, W. Schneider, andZiegenbein, Chem. Ber.96, 2504~1963!.
14T. Motylewski and H. Linnartz, Rev. Sci. Instrum.70, 1305~1999!.15A. O’Keefe and D. A. G. Deacon, Rev. Sci. Instrum.59, 2544~1998!.16The density of anions in the plasma is generally low, and therefore th
are not considered.17D. Luckhaus and M. Quack, Mol. Phys.63, 745 ~1989!.18P. Cias, O. Vaizert, A. Denisov, J. Mes, H. Linnartz, and J. P. Maier
Phys. Chem. A106, 9890~2002!.19H. Linnartz, D. Pfluger, O. Vaizert, P. Cias, P. Birza, D. Khorosev, and
P. Maier, J. Chem. Phys.116, 924 ~2002!.20M. C. McCarthy, M. J. Travers, A. Kovacs, C. A. Gottlieb, and P. Tha
deus, Astrophys. J.113, 105 ~1997!.21J. J. P. Stewart, computer codeMOPAC, a semiempirical molecular orbita
program, QCPE, 455, 1983; version 6.0, 1990.22M. W. Schmidt, K. K. Baldridge, J. A. Boatz,et al. J. Comput. Chem.14,
1347 ~1993!.23G. Koster and W. J. van der Hart, Int. J. Mass Spectrom. Ion Proce
163, 169 ~1997!.24M. Allan, E. Kloster-Jensen, and J. P. Maier, Chem. Phys.17, 11 ~1976!.
he
IP license or copyright, see http://ojps.aip.org/jcpo/jcpcr.jsp

h
n- fre-
10565J. Chem. Phys., Vol. 118, No. 23, 15 June 2003 Spectroscopy of a carbon chain
25P. Freivogel, J. Fulara, D. Lessen, D. Forney, and J. P. Maier, Chem. P189, 335 ~1994!.
26C. A. Gottlieb, A. J. Apponi, M. C. McCarthy, P. Thaddeus, and H. Linartz, J. Chem. Phys.113, 895 ~2000!.
Downloaded 06 Nov 2003 to 131.152.105.85. Redistribution subject to A
ys.27P. Jenniskens and F.-X. De´sert, Astron. Astrophys., Suppl. Ser.106, 39~1994!.
28S. O. Tuairisg, J. Cami, B. H. Foing, P. Sonnentrucker, and P. Ehrenund, Astron. Astrophys., Suppl. Ser.142, 225 ~2000!.
IP license or copyright, see http://ojps.aip.org/jcpo/jcpcr.jsp


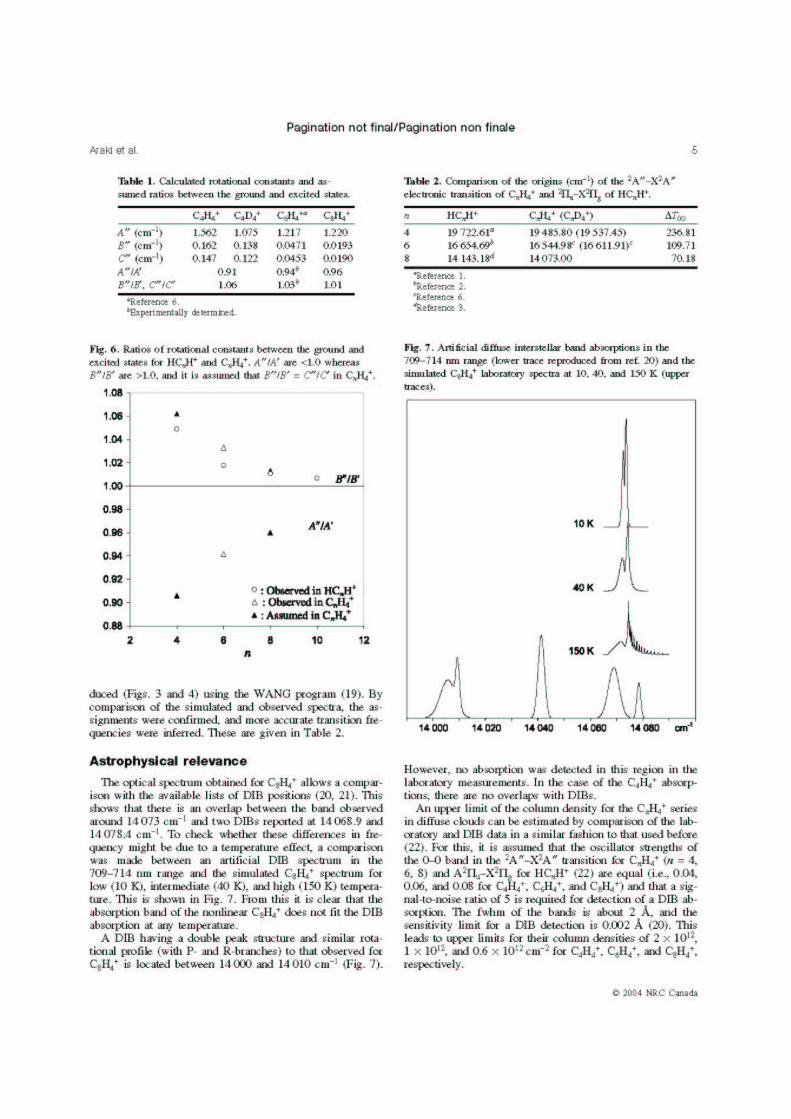


Curriculum Vitae Personal information Name Pawel Cias
Place of birth Konskie, Poland
Nationality Polish
Marital status Single
Education
Primary School No. 2, Konskie
Secondary Technical School, Konskie
1994 – 2000 Jagiellonian University, Department of Chemistry, Krakow, Poland
MSc title in Chemistry
2000 – 2004 University of Basel, Department of Chemistry, Switzerland
Ph.D. work in the group of Prof. John. P. Maier
List of publications 1. Rotationally resolved A 3Σu
- – X 3Σg- electronic transition of NC5N.
H. Linnartz, O.Vaizert, P. Cias, L. Grueter, J.P. Maier, Chem. Phys. Lett. 345
(2001) 89.
2. Rotationally resolved A 2Πu – X 2Πg electronic transition of NC6N+.
H. Linnartz, D. Pfluger, O. Vaizert, P. Cias, P. Birza, D. Koroschev, J.P. Maier, J.
Chem. Phys. 116 (2002) 924.
3. Rotationally resolved A 2Πu – X 2Πg electronic transition of HC4D+.
O. Vaizert, P. Furrer, P. Cias, H. Linnartz, J.P. Maier, J. Mol. Spec. 214, (2002) 94.

4. Electronic gas-phase spectrum of pentaacetylene cation.
P. Cias, O. Vaizert, A. Denisov, J. Mes, H. Linnartz, J.P. Maier, J. Phys. Chem. 106,
(2002) 9890.
5. High resolution electronic spectroscopy of a nonlinear carbon chain radical C6H4+.
M. Araki, H. Linnartz, P. Cias, A. Denisov, J. P. Maier, J. Chem. Phys. 118 (2003)
10561.
6. Electronic spectroscopy of the nonlinear carbon chains C4H4+ and C4H8
+.
M. Araki, P. Cias, A. Denisov, J. Fulara, J. P. Maier, Can. J. Chem. 82 (2004) 1.
7. Gas phase detection of cyclic B3: 2 2E’ – X 2E1’ electronic origin band.
P. Cias, M. Araki, A. Denisov, J. P. Maier, J. Chem. Phys. (submitted).
8. New laboratory data of a molecular band at 4429 Å.
M. Araki, H. Linnartz, P. Kolek, H. Ding, A. Denisov, A. Boguslavskiy, T. W.
Schmidt, T. Motylewski, P. Cias, J. P. Maier, ApJ. (submitted).