transient infrared spectroscopy of charge …
TRANSCRIPT

The Pennsylvania State University
The Graduate School
Department of Chemistry
TRANSIENT INFRARED SPECTROSCOPY OF CHARGE TRANSPORT IN
EMERGING PHOTOVOLTAIC MATERIALS
A Dissertation in
Chemistry
by
Kwang Seob Jeong
2013 Kwang Seob Jeong
Submitted in Partial Fulfillment
of the Requirements
for the Degree of
Doctor of Philosophy
December 2013

ii
The dissertation of Kwang Seob Jeong was reviewed and approved* by the following:
John B. Asbury
Associate Professor of Chemistry
Dissertation Advisor
Chair of Committee
David L. Allara
Distinguished Professor of Chemistry and Professor of Polymer Science
Mark Maroncelli
Professor of Chemistry
JianXu
Associate Professor of Engineering Science and Mechanics
Barbara J. Garrison
Shapiro Professor of Chemistry
Head of the Department of Chemistry
*Signatures are on file in the Graduate School
iii
ABSTRACT
Colloidal quantum dot (CQD) photovoltaic and organic photovoltaic (OPV) materials are
promising alternative light absorbers for solar cells. Both CQD photovoltaics and OPVs can be
fabricated on flexible substrates using low-cost solution cast fabrication methods at room
temperature. Although intense research has been done for the last two decades in both materials,
photophysical events underlying the device performance remain unclear. Here, the origin of the
charge transport state in PbS CQD solids was explored and identified. The charge transport state
was investigated using various optical and electrical methods: ultrafast transient infrared
spectroscopy (UFIR), microsecond transient infrared spectroscopy (TRIR), steady state
absorption spectroscopy, steady state photoluminescence emission spectroscopy, temperature
dependent TRIR, temperature dependent transient photoconductivity and temperature dependent
transient short-circuit current measurements. Furthermore, it was found that the mobility-lifetime
product, which is dependent on the surface passivation strategy, significantly influences the
device performance in CQD solar cells.
Additionally, it was examined how the dielectric permittivity influences the photophysics
in organic photovoltaic materials in conjunction with device performance. The experiments
revealed that the increase of dielectric permittivity leads to enhancement of the mobility-lifetime
product. For efficient conversion of excitons into charge carriers, it was suggested that high
surface area between electron donor and acceptor materials is necessary. The findings provide
better understanding of the fundamental properties of CQD and OPV materials and suggest
pathways to improve the efficiency of solar cell based on these materials.

iv
TABLE OF CONTENTS
List of Figures......... ................................................................................................................. vi
List of Tables ........................................................................................................................... xi
List of Abbreviations.................................................................................................................xii
Acknowledgements .................................................................................................................. xiii
Chapter 1 Introduction ............................................................................................................. 1
1.1 Motivation .................................................................................................................. 1 1.2 Basics of Solar Cells .................................................................................................. 2 1.3 Reference ................................................................................................................... 9
Chapter 2 Experimental methods ............................................................................................. 10
2.1 Sample preparation .................................................................................................... 10 2.2 Ultrafast transient infrared spectroscopy (UF-IR, Figure 2-1) .................................. 11 2.3 Microsecond transient infrared spectroscopy (TRIR, Figure 2-2) ............................. 12 2.4 Temperature dependent microsecond transient infrared spectroscopy ...................... 12 2.5 Organic photovoltaic material film ............................................................................ 13 2.6 Dispersive infrared spectroscopy ............................................................................... 13 2.7 Dielectric spectroscopy .............................................................................................. 13 2.8 Steady-state UV/Vis/NIR absorption spectroscopy ................................................... 14 2.9 Time Correlated Single Photon Counting (TCSPC) .................................................. 15 2.10 Steady-state photoluminescence spectroscopy......................................................... 16 2.11 Reference ................................................................................................................. 20
Chapter 3 Origin of sub-gap state and its role in charge transport in lead sulfide colloidal
quantum dot solid ............................................................................................................. 21
3.1 Introduction ................................................................................................................ 22 3.2 Result and Discussion ................................................................................................ 27 3.3 Conclusion ................................................................................................................. 34 3.4 Reference ................................................................................................................... 55
Chapter 4 Enhancement of mobility-lifetime product in PbS colloidal quantum dot solid. .... 58
4.1 Introduction ................................................................................................................ 59 4.2 Results and Discussion ............................................................................................... 60 4.3 Conclusion ................................................................................................................. 65 4.5 Reference ................................................................................................................... 76

v
Chapter 5 ATOMIC LIGAND PASSIVATED LEAD SULFIDE COLLOIDAL
QUANTUM DOT SOLID ............................................................................................... 78
5.1 Introduction ................................................................................................................ 79 5.2 Result and discussion ................................................................................................. 80 5.3 Conclusion ................................................................................................................. 86 5.4 Reference ................................................................................................................... 99
Chapter 6 Improvement of charge transport in organic photovoltaic materials by tuning
dielectric properties .......................................................................................................... 101
6.1 Introduction ................................................................................................................ 101 6.2 Results and Discussion ............................................................................................... 103 6.3 Conclusion ................................................................................................................. 108 6.4 Reference ................................................................................................................... 118
Chapter 7 Conclusion ............................................................................................................... 121
7.1 Summary .................................................................................................................... 121 7.2 Future direction .......................................................................................................... 122
7.2.1 Bias controlled transient two dimensional infrared spectroscopy
(BT2DIR) ......................................................................................................... 122 7.2.2 Time-resolved photoluminescence spectroscopy (TRPL) ...................................... 125 7.3Reference .................................................................................................................... 130
Appendix .................................................................................................................................. 131
Extension power law fit function ..................................................................................... 131

vi
LIST OF FIGURES
Figure 1-1. Schematic illustration of a p-n junction. ............................................................... 6
Figure 1-2. Forward (IF) and reverse (IR) bias in a p-n junction. ............................................. 7
Figure 1-3. J-V characteristic of a solar cell in the dark and under illumination ..................... 8
Figure 2-1. Ligand structure .................................................................................................... 17
Figure 2-2. Ultrafast transient infrared spectroscopy (UFIR) .................................................. 18
Figure 2-3. Microsecond transient infrared spectroscopy (TRIR) ........................................... 19
Figure 3-1. Electronic energy states of atom, semiconducting quantum dot and bulk
materials are illustrated. ................................................................................................... 35
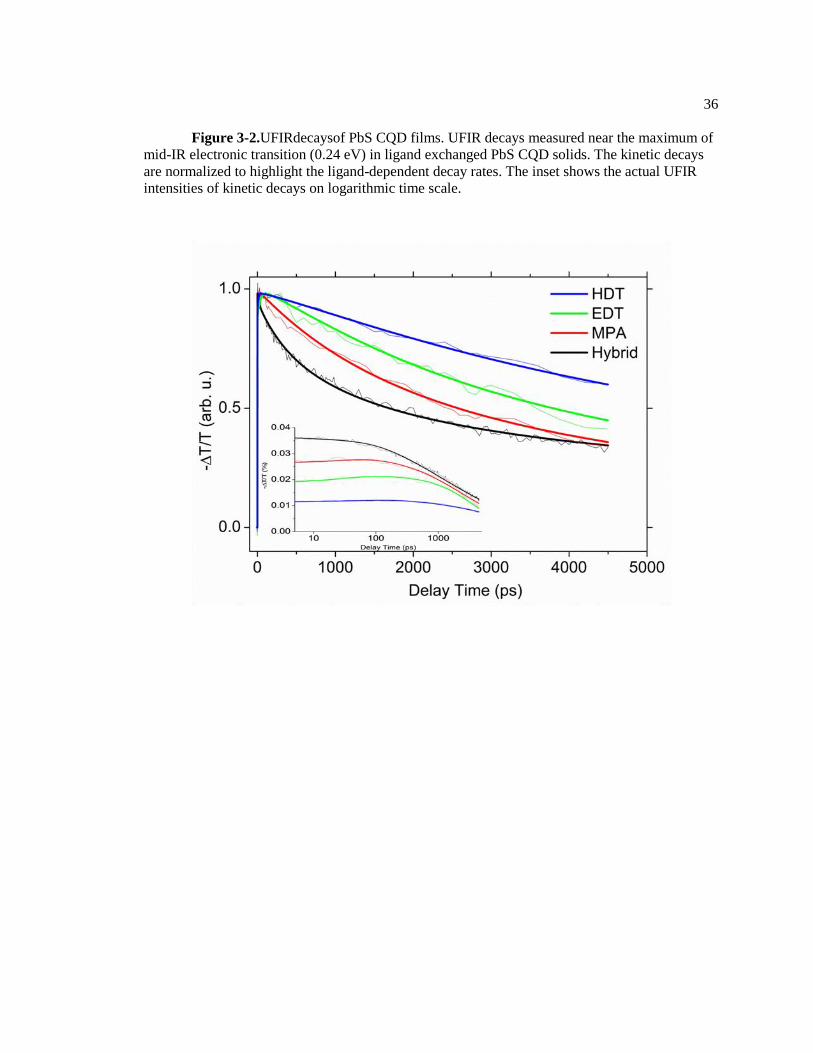
Figure 3-2.UFIRdecaysof PbS CQD films. UFIR decays measured near the maximum of
mid-IR electronic transition (0.24 eV) in ligand exchanged PbS CQD solids. The
kinetic decays are normalized to highlight the ligand-dependent decay rates. The
inset shows the actual UFIR intensities of kinetic decays on logarithmic time scale. ..... 36
Figure 3-3.Mid-IR probe frequency dependent UFIR kinetic decays. UFIR rising curves
were measured at 0.24 and 0.33 eV. The rise times follows the instrument response
functions at both probe energies. ..................................................................................... 37
Figure 3-4. Temperature dependent UFIR decays of hybrid capped PbS CQD film. .............. 38
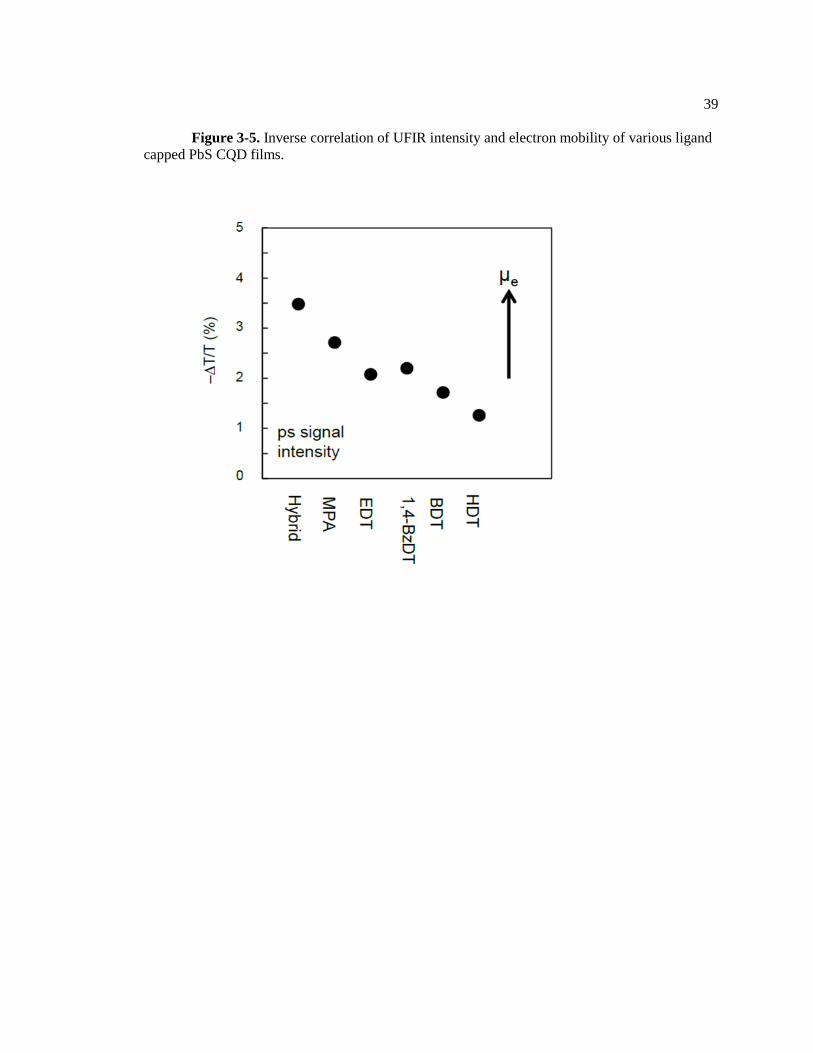
Figure 3-5. Inverse correlation of UFIR intensity and electron mobility of various ligand
capped PbS CQD films. ................................................................................................... 39
Figure 3-6. Transport-limited Auger recombination ................................................................ 40
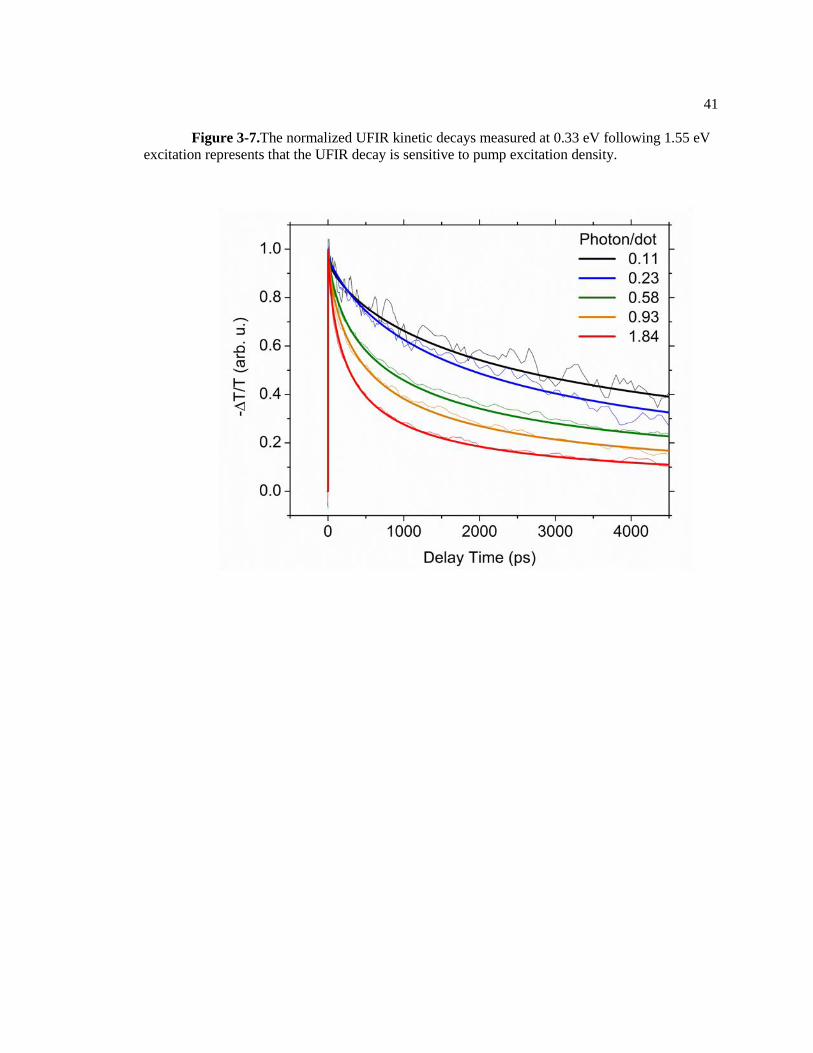
Figure 3-7.The normalized UFIR kinetic decays measured at 0.33 eV following 1.55 eV
excitation represents that the UFIR decay is sensitive to pump excitation density. ........ 41
Figure 3-8. Mid-IR absorption and PL emission spectra of four different size
dots.ΔsindicatesStokes-shift energy which is a energy difference between the
excitonic absorption peak and the excitonic PL emission peak. ...................................... 42
Figure 3-9. Mid-IR absorption spectra for four different size hybrid capped PbS CQD
films. Bottom panels represent second derivation applied mid-IR absorption spectra
providing three common excitonic peaks (red curves). ................................................... 43
Figure 3-10. TRIR spectra measured 0.5 µs after photoexcitation for four different size
hybrid capped PbS CQD films. ........................................................................................ 44
Figure 3-11. Comparison of mid-IR transition energies (blue squares) to the sum of
Stokes-shift energy and 1Se-1Pe transition energy. The mid-IR transition energy

vii
quantitatively matches to the sum of Stokes-shift energy and 1Se-1Pe transition
energy. .............................................................................................................................. 45
Figure 3-12. Ligand dependent photoluminescence spectra of PbS CQD films. HDT >
EDT > MPA >Br . ............................................................................................................ 46
Figure 3-13.Comparison PL intensity to TRIR intensity. The quantitative agreement
between PL intensity and TRIR intensity indicates that the same populations of
photoexcited electrons are responsible for both mid-IR and PL transitions. ................... 47
Figure 3-14.Anti-correlation between UFIR and TRIR intensity with various ligand
passivation strategy. ......................................................................................................... 48
Figure 3-15.Temperature dependent TRIR provides activation energy of charge transport.
Decay rate of TRIR in logarithm scale is plotted as a function of time. From the
Arrhenius plots, the obtained activation energies are 8, 47 and 16 meV for 0.93, 1.30
and 1.46 eV bandgap energy hybrid capped PbS CQD film. ........................................... 49
Figure 3-16. Energy diagram of PbS CQD solid. .................................................................... 50
Figure 3-17(A) Origin of sub-gap transport state.Band structure diagram is plotted on the
basis of density functional calculations indicating distinct states of different
symmetry in the 1S state manifolds. Cartoons in the left side shows 1Se even (blue
top), 1Sh odd (red bottom), 1Se odd (blue top) and 1Sh even (red bottom). (B)
Localized trap states at surface of PbS CQD. .................................................................. 51
Figure 3-18. Reduction of photovoltage by Stokes shift increase. .......................................... 52
Figure 3-19.Transport activation energy related to polydispersity of CQDs. The half
widths at half maximum of the first exciton peaks of 0.93 and 1.46 eV bandgap
energy PbS CQD are compared.. ..................................................................................... 53
Figure 4-1. Molecular structure of ligands: Oleic acid (OA), Ethanedithiol (EDT) and 3-
mercaptopropionic acid (MPA)........................................................................................ 66
Figure 4-2. Infrared spectra of oleic acid (OA), 3-mercaptopropionic acid (MPA),
ethanedithoil (EDT), propanedithiol (PrDT), butanedithiol (BDT), pentanedithiol
(PnDT), hexanedithiol (HDT), 1,2-benzenedithiol (1,2-BzDT) and 1,4-
benzenedithiol (1,4-BzDT) capped PbS CQD films. ....................................................... 67
Figure 4-3. Scanning transmission electron microscopy (STEM) images of EDT capped
PbS CQD and MPA capped PbS CQD films. Average interparticle distance for the
EDT capped film and the MPA capped film are 2.1 nm and 1.8 nm, respectively. ......... 68
Figure 4-4. Microsecond transient infrared (TRIR) spectra of EDT capped PbS film
(green) and MPA capped PbS film (blue). The narrow vibrational features result
from ligands that are electronically perturbed by charges carriers. The broad
absorption features corresponds to subgap-to-1Pe transition. .......................................... 69

viii
Figure 4-5. Microsecond transient infrared spectra of various ligand capped PbS films.
The microsecond transient infrared spectra is strongly dependent upon the ligand
passivation. The maximum transition energy shift is about 0.13 eV and the area of
the spectra is correlated to the length of ligand. ............................................................... 70
Figure 4-6.Excitonic absorption peaks of 3-mercaptopropionic acid (MPA), ethanedithoil
(EDT), propanedithiol (PrDT), butanedithiol (BDT), pentanedithiol (PnDT),
hexanedithiol (HDT), 1,2-benzenedithiol (1,2-BzDT) and 1,4-benzenedithiol (1,4-
BzDT) capped PbS CQD films. The bandgap energy is dependent on ligand
passivation and the maximum shift is ~0.07 eV. ............................................................. 71
Figure 4-7.Mid-IR transition and bandgap correlation data. The scattered dots of various
ligand capped PbS CQD film implies the mid-IR transition is not strongly dependent
on quantum confinement. ................................................................................................. 72
Figure 4-8. TRIR decays of the EDT capped film (green) and the MPA capped film
(blue). The MPA capped film has lower lifetime by a factor of 3 in comparison to
the EDT capped film. ....................................................................................................... 73
Figure 4-9. Id-Vg curves for minority carriers (electrons) in the EDT and MPA capped
PbS Films. The mobility was measured using the ion-gel field-effect transistor
geometry. The inset is the magnified Id-Vg curve for the EDT capped PbS film for
clarity. .............................................................................................................................. 74
Figure 5-1. Atomic ligand passivation. Cd2+
cations of Cd-TDPA passivate S2-
dangling
bonds of PbS CQD at S1 step and the OA is replaced by bromide using CTAB at S2
step. .................................................................................................................................. 87
Figure 5-2. Infrared spectra of PbS CQDs before and after ligand exchange. ......................... 88
Figure 5-3. Scanning transmission electron microscopy (STEM) images of oleic acid
capped PbS CQD (A), EDT capped PbS CQD (B), MPA capped PbS CQD (C) and
Br capped PbS CQDs (D). From the images, the interparticle distances of each
samples were measured: 2.1 nm of EDT capped PbS CQD; 1.8 nm MPA capped
PbS CQD; 1.0 nm Br capped PbS CQD. ......................................................................... 89
Figure 5-4. Near-infrared absorption spectra of oleic acid capped PbS CQD and
transmission spectra for Br, Cl and I capped PbS CQD film. .......................................... 90
Figure 5-5. Near-infrared absorption spectra of Br, MPA, 1,4-BzDT, BDT and EDT
capped PbS CQD films. As decreasing ligand size, bandgap peak becomes broaden
and red-shifted. ................................................................................................................. 91
Figure 5-6. Id-Vg (black) and C-Vg (red) curves of hybrid capped PbS CQD film. ................. 92
Figure 5-7. Charge Extraction via a Linearly Increasing Voltage (CELIV) measurement
of Br capped PbS CQD film. Dielectric constant of the Br capped PbS CQD film
was measured to be 25±2. ............................................................................................... 93

ix
Figure 5-8. Transient infrared spectra of Br, MPA and EDT capped PbS CQD films at 0.5
µs after photoexcitation with 532 nm pump pulse. .......................................................... 94
Figure 5-9. The average decay times of the trap-to-band transitions in PbS CQD films are
strongly correlated with the average mid-infrared transition energies ............................. 95
Figure 5-10.The mobilities of electrons in PbS CQD films are also strongly correlated
with the average mid-infrared transition energies. ........................................................... 96
Figure 5-11. Microsecond transient infrared spectra of halide capped PbS CQD film (Br,
Cl and I) ........................................................................................................................... 97
Figure 6-1.Structure of M-TQ1, Lithium Bis(Trifluoromethanesulfonyl)Imide (LiTFSI)
and Phenyl-C61-Butyric-Acid-Methyl Ester (PCBM). .................................................... 109
Figure 6-2. Real dielectric functions (A) and real impedance functions (B) of M-TQ1
(red), 0.010 Li+/O (black), 0.015 Li+/O (green) doped M-TQ1 films............................. 110
Figure 6-3. Source-drain current, ISD, versus gate voltage, Vg, measured in thin films of
M-TQ1 doped with various concentrations of LiTFSI. The off current at positive
gate voltage increases substantially with lithium ion doping. .......................................... 111
Figure 6-4. Charge recombination kinetics decays of 1:1 by mass of M-TQ1 PCBM
polymer blend doped with various concentrations of lithium ions. The transient
signal arises from the polaron absorption in the polymer phase measured at 1700 cm-
1, shaded region within the inset. The gray curve represents the instrument response
function (IRF) used to deconvolute the kinetic decays. The data indicate slower
charge recombination dynamics with increasing lithium ion concentration. ................... 112
Figure 6-5.(A)Li ion dependent mobility and bimolecular recombination lifetime of M-
TQ1 polymer film.(B)Both the hole mobility and recombination lifetime give rise to
large increases of the mobility-lifetime product. ............................................................. 113
Figure 6-6.The absorption spectrum of a film of Li-doped M-TQ1 is almost identical to
that of pure M-TQ1. ......................................................................................................... 114
Figure 6-7. Steady-state fluorescence spectra of the pure M-TQ1, 0.010 Li+/O doped M-
TQ1, M-TQ1/PCBM 1:1 blend by mass and 0.010 Li+/O doped M-TQ1/PCBM 1:1
blend by mass. .................................................................................................................. 115
Figure 6-8. Time correlated single photon counting decays of M-TQ1 films in the
presence and absence of lithium ions are displayed. Interestingly, the exciton
lifetime in M-TQ1 is not significantly affected by the presence of Li ions. Addition
of PCBM to the pure polymer film causes a modest decrease in the exciton lifetime. .... 116
Figure 6-9. Energy filtered TEM image of a 1:3by massM-TQ1 PCBM polymer blend.
The image shows a carbon map such that the lighter gray regions correspond to the
PCBM-rich phase and the dark gray correspond to the M-TQ1 domain. The image
represents that M-TQ1 and PCBM undergo macroscopic phase separation. ................... 117

x
Figure 7-1. H-NMR of dimercaptoamid (DMA) ..................................................................... 126
Figure 7-2. Linear infrared spectrum of DMA ........................................................................ 127
Figure 7-3. Broad infrared pump probe spectrum of DMA capped PbS CQD film. ............... 128
Figure 7-4. Device geometry of BT2DIR ................................................................................ 129

xi
LIST OF TABLES
Table 3-1.Activation energies for electron transport states in PbS CQD films. ...................... 54
Table 4-1. Electrical and optical parameters of EDT capped PbS CQD film and MPA
capped PbS CQD film. ..................................................................................................... 75
Table 5-1. X-ray photoelectron spectroscopy (XPS) analysis of elemental atomic
percentage ........................................................................................................................ 98
Table 5-2. Binding energy and dielectric constant correlation ................................................ 98

xii
List of Abbreviation
OA Oleic acid
EDT Ethanedithiol
MPA 3-mercaptopropionic acid
PrDT 1,3-propanedithiol
BDT 1,4-butanedithiol
PnDT 1,5-pentanedithiol
HDT 1,6-hexanedithiol
1,2-BzDT 1,2-benzenedithiol
1,4-BzDT 1,4-benzenedithiol
FET Field-effect-transistor
TFT Thin-film-transistor
TRIR Microsecond Transient Infrared Spectroscopy
UFIR Ultrafast Transient Infrared Spectroscopy
PL Photoluminescence spectroscopy
P3HT Regioregularpoly(3-hexylthiophene)
PCBM Phenyl-C61-butyric acid methyl ester
CQD Colloidal quantum dot
OPV Organic photovoltaic material
TRPL Time-resolved photoluminescence spectroscopy
BT2DIR Bias controlled transient two dimensional infrared spectroscopy

xiii
ACKNOWLEDGEMENTS
First and foremost, I would like to express my sincere and profound gratitude to my
advisor, Prof. John Asbury, for his inspirational guidance and encouragement. Especially, his
consideration and patience helped me to overcome a number of challenges both academically and
personally. I will never forget the prayers you did for me throughout the last five years. I am
blessed to have worked with you.
I also want to thank my committees Prof. Allara, Prof. Maroncelli and Prof. Xu for
insightful suggestions and collaborative works. Your advice and insights broadened my
academic interest and knowledge.
I would like to deeply thank the Asbury group members for fruitful discussion and
enjoyable graduate life. I also desire to express my sincere gratitude to the UP, Timothy, Prisca
and Aquila small groups of Young Kwang Korean Presbyterian Church. The many small group
gathering we had were very meaningful and encouraging.
I wholeheartedly offer my sincere gratitude to my wife, Jihye Kim. She is my best friend
as well as an amazing colleague. Without you, I would not have been able to start and complete
graduate school. It has been such a wonderful time to be with you everywhere and anytime. I
also give thanks to my daughter, Lydia, for all the special memories we had the last two years.
You always make us smile.
I owe a great deal of gratitude to my parents, parents-in-law, my brothers and sister-in-
law for supporting me in any form of cheers and prayers.
Lastly, my utmost gratitude goes to God, who created me and gave me salvation. Without
your guidance, I would not have stood at all. Thanks, God.
1
Chapter 1 Introduction
1.1 Motivation
Global energy consumption has dramatically increased during the last six decades along
with the increase of human population and the rapid economic development. Currently, 15 TW is
consumed to manage the human energy demand, and the global energy consumption is predicted
to be over 30 TW by 2050.1,2
While current energy source mostly relies on fossil fuels,
researchers have turned their attention to environmentally friendly energy sources due to
environmental concerns. Solar energy has been frequently highlighted due to its abundance and
cleanness. 120,000 TW of solar power irradiate the Earth, which is much larger than the human
energy consumption. Currently, silicon is the most commonly used photovoltaic material. Its
power conversion efficiency (PCE) is over 20%3 which is close to the theoretical limit of a single
PN junction solar cell (33.7 %), also known as the Shockley-Queisser limit.4 However, due to
high fabrication costs, there is a demand to replace the silicon solar cell with flexible photovoltaic
materials with lower-cost fabrication methods.
Solution-cast approaches enable solar cells to be deposited on various substrates at room
temperature, enabling low-cost manufacturing. Colloidal quantum dots (CQDs) and organic
photovoltaic (OPV) materials are promising light absorbers to meet the flexibility and low-cost
demands. Both CQD solar cells and OPV solar cells have accomplished dramatic improvement
with the highest power conversion efficiencies (PCE) to date being 7 %5 and 12 %, respectively.
6
However, the underlying principles of how these types of solar cells work remain unclear. In
particular, considering the nanoscale size of the photovoltaic materials, understanding at the
molecular level is critical. In this work, we investigate the fundamental photophysics of CQD
solar cells and OPV solar cells using optical and electrical methods.

2
1.2 Basics of Solar Cells
Solar cells, or photovoltaic devices, are composed of semiconducting materials and
electrodes. Upon photoexcitation above the bandgap of the semiconducting material, the solar
cell material produces charge carriers that flow into their respective electrodes. The performance
of the solar cell device is determined by three types of efficiencies: the photon absorption
efficiency, the photon-to-charge carrier conversion efficiency and the efficiency of charge carrier
transport to the electrodes.
A PN junction consisting of a p-type and an n-type semiconducting material is the
building block of most semiconductor based solar cells (Figure 1-1). The p-type material has
excess holes resulting from p-type doping while the n-type material has excess electrons resulting
from n-type doping at thermal equilibrium. Both p-type and n-type semiconducting materials
have an intrinsic bandgap energy corresponding to the energy difference between the valence
band and the conduction band. Therefore, if a photon with energy larger than the bandgap is
absorbed, electrons in the valence band are excited to the conduction band leaving a hole in the
valence band and producing an exciton, which is a bound electron-hole pair. Then the excitons
are dissociated to generate free electrons and holes.
When the p-type material and the n-type material are brought together, excess electrons
in the n-type material diffuse to the p-type material and the excess holes in the p-type material
diffuse to the n-type material, creating a depletion region. Simultaneously, charges are left in the
semiconducting material and generate an electric field. In other words, when the electrons in the
n-type materials diffuse to the p-type material due to the doping density difference between two
doped materials, positively charged atoms are left behind in n-type material. On the other hand,
negatively charged atoms are left once the holes in p-type material diffuse to the n-type material.
Hence, due to charged atoms in the depletion region, an intrinsic electric field is formed in the
3
direction from the n-type material towards the p-type material. This electric field is known as the
Built-in Electric Field. The energy difference between the quasi-Fermi level of the n-type (EFN)
and the quasi-Fermi level of the p-type (EFP) is the built-in-potential barrier determining the
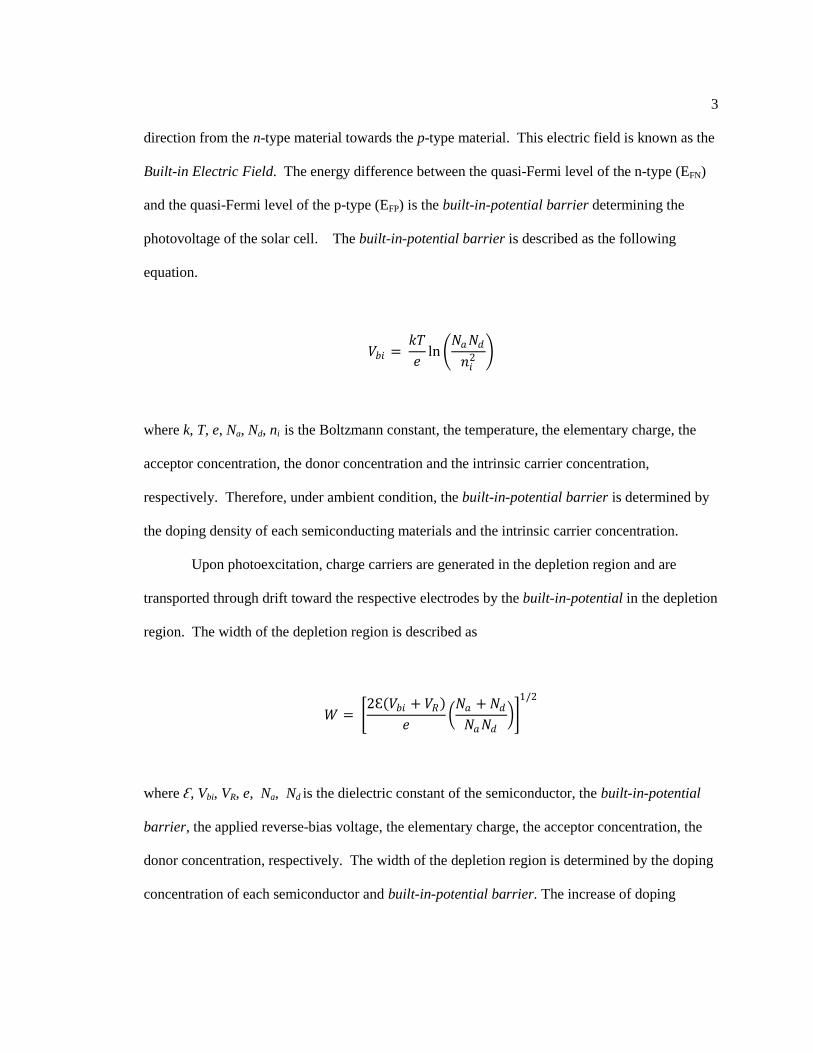
photovoltage of the solar cell. The built-in-potential barrier is described as the following
equation.
𝑉𝑏𝑖 = 𝑘𝑇
𝑒ln
𝑁𝑎𝑁𝑑
𝑛𝑖2
where k, T, e, Na, Nd, ni is the Boltzmann constant, the temperature, the elementary charge, the
acceptor concentration, the donor concentration and the intrinsic carrier concentration,
respectively. Therefore, under ambient condition, the built-in-potential barrier is determined by
the doping density of each semiconducting materials and the intrinsic carrier concentration.
Upon photoexcitation, charge carriers are generated in the depletion region and are
transported through drift toward the respective electrodes by the built-in-potential in the depletion
region. The width of the depletion region is described as
𝑊 = 2Ɛ 𝑉𝑏𝑖 + 𝑉𝑅
𝑒 𝑁𝑎 + 𝑁𝑑𝑁𝑎𝑁𝑑
1/2
where Ɛ, Vbi, VR, e, Na, Nd is the dielectric constant of the semiconductor, the built-in-potential
barrier, the applied reverse-bias voltage, the elementary charge, the acceptor concentration, the
donor concentration, respectively. The width of the depletion region is determined by the doping
concentration of each semiconductor and built-in-potential barrier. The increase of doping

4
density results in the increase of the built-in-potential barrier, but the width of depletion region is
reduced.
Charge carriers are transported via diffusion in the quasi-neutral region where there is no
built-in electric field. Due to the absence of built-in electric field, transport in the quasi-neutral
region is less efficient than in the depletion region because diffusion is less efficient than drift.
Thus, a long diffusion length is critical for efficient charge collection at the electrodes. For
example, when the diffusion length is larger than the difference between the solar cell film
thickness and the depletion width, more photogenerated charges can reach the electrodes. In
contrast, when the diffusion length is smaller than the difference between the solar cell film
thickness and the depletion width, charge carriers are more likely to recombine at recombination
centers in the quasi-neutral region. In this case, charge carriers are not efficiently collected
thereby limiting the power conversion efficiency of the solar cell device. Therefore, intensive
research has been done to enhance the diffusion length of charge carriers. The diffusion length is
described by the following equation.
𝑙𝑑𝑖𝑓𝑓𝑢𝑠𝑖𝑜𝑛 = 𝑘𝑇µτ
𝑒
where µ, τ, k, T, e is the charge carrier mobility, the charge carrier lifetime, Boltzmann constant,
temperature, elementary charge, respectively. As shown in the equation, the diffusion length is
related to the mobility and lifetime of charge carriers.
The solar cell efficiency, also referred to power conversion efficiency (PCE), is obtained
by measuring current density as a function of voltage under illumination. When positive voltage
is applied to the p-type material and negative voltage to n-doped material (Figure 1-2), the bias is
referred to a forward bias. In this case, the quasi-Fermi energy difference between the n-type and
the p-type is reduced since the direction of the applied external electric field is against that of the
intrinsic internal electric field in the depletion region.

5
In contrast, when a reverse bias is applied to the device which is the same direction with
the intrinsic internal electric field, additional voltage difference is added to the built-in-potential
barrier, producing a larger voltage drop and eventually reaching the open circuit voltage (Voc),
one of the important parameters determining solar cell PCE (Figure 1-3). The power conversion
efficiency (η) is described as the below equation.
𝜂(%) = 𝑉𝑜𝑐 𝐽𝑠𝑐𝐹𝐹
𝑃𝑖𝑛𝑐 × 100
where Voc, Jsc, FF, Pinc is the open-circuit voltage, the short-circuit current density, the fill factor
and the incident light intensity, respectively. In the absence of light, the current density remains
zero at negative bias and starts rising when it crosses Voc. However, in the presence of light, the
current density shows negative value at negative voltage and generates an area at the fourth
quadrant. The largest rectangular area corresponds to the maximum power output and the
intercepts of the curve are Jsc and Voc. The solar cell efficiency can be improved by increasing
Voc and/or Jsc. Voc is related to the photovoltage and the Jsc is involved with the charge
collection. Chapter 3 is related to the photovoltage of solar cell device and offers a guideline how
to improve the photovoltage in device by finding the energetic position of the charge transport
state in PbS colloidal quantum dot solar cell. Chapter 4, 5 and 6 involve studies on the
enhancement of diffusion length by changing the fundamental property of colloidal quantum dot
and organic photovoltaic materials. The diffusion length, which is determined by mobility-
lifetime product, is closely related to the charge harvesting determining the device performance.
Therefore, by varying sample condition such as ligand passivation and dielectric permittivity, the
mobility-lifetime product shows improvement, giving rise to the device performance
improvement.

6
Figure 1-1. Schematic illustration of a p-n junction.

7
Figure 1-2. Forward (IF) and reverse (IR) bias in a p-n junction.

8
Figure 1-3. J-V characteristic of a solar cell in the dark and under illumination
9
1.3 Reference
1Graetzel, M.; Janssen, R. A.; Mitzi, A. B.; Sargent, E. H. Materials Interface Engineering for
Solution-processed Photovoltaics. Nature, 2012, 488, 304-312.
2Wadia, C.; Alivisatos, A. P.; Kammen, D. M. Materials Availability Expands the Opportunity
for Large-Scale Photovoltaics Deployment. Environ. Sci. Technol. 2009, 43, 2072-2077.
3Green, M. A.; Emery, K.; Hishikawa, Y.; Warta, W. Solar Cell Efficiency Tables. Prog.
Photovoltaics,2010, 18,144–150.
4 Shockley, W.; Queisser, H. J. Detailed Balance Limit of Efficiency of p-n Junction Solar Cells.
J. Appl. Phys.,1961, 32, 510-519.
5Ip, A. H.; Thon, S. M.; Hoogland, S.; Voznyy, O.; Zhitomirsky, R.; Debnath, R.; Levina, L.;
Rollny, L. R.; Carey, G. H.; Fischer, A.; Kemp, K. W.; Kramer, I. J.; Ning, Z.; Labelle, A. J.; Wei
Chou, K.; Amassian, A.; Sargent, E. H. Hybrid Passivated Colloidal Quantum Dot Solids Nature
Nanotech., 2012, 7, 577-582.
6 www.heliatek.com

10
Chapter 2 Experimental methods
2.1 Sample preparation
PbS colloidal quantum dot films were fabricated on various substrates for the
measurement of UF-IR, TRIR, FET, Dispersive-IR, UV/Vis Absorption, TEM and PCE. The film
fabrication methods are almost identical although the sample substrates are different. Oleic acid
capped PbS CQDs dispersed in octane solution (50 mg/mL) were spun on a substrate at 2500
rpm. Secondly, shorter length ligand solutions such as 10% v/v 3-mercaptopropionic acid (MPA)
methanol solution were deposited on the PbS CQD film and the oleic acid surfactants were
replaced by the shorter organic ligands. Lastly, the ligand exchanged PbS CQD films were rinsed
with methanol and octane. The three steps were iterated for 10 times producing ~250 nm thick
films and this method is referred to as the layer-by-layer method (LBL). Acetonitrile was used as
the solvent for thiol solutions instead of methanol. Ethanedithiol (EDT), propanedithiol (PrDT),
butanedithiol (BDT), pentanedithiol (PnDT), hexanedithiol (HDT), 1,2-benzenedithiol (1,2-
BzDT) and 1,4-benzendithiol (1,4-BzDT) methanol solutions were used (Figure 2-1)
Halide ligand passivation strategy is slightly different from the thiol ligand film
fabrication method. Cd-treated PbS CQDs in octane solution (50 mg/mL) were dispersed on a
substrate and spun for 15 s at 2500 rpm. Cetyltrimethylammonium bromide (CTAB) in methanol
solution (10 mg/mL) was used as the bromide (Br-) source. Due to the slow ligand exchange rate
of CTAB, the CTAB solution was dispersed for 1 min and spun for 3 s. The ligand exchanged
PbS CQD film was rinsed with methanol and spun dry for 10 s. The ligand exchange and rinsing
processes were iterated for 10 times. The layer-by-layer method produced smooth and shiny
bromide capped PbS CQD films.

11
Film fabrication methods are identical for hexadecyltrimethylammonium chloride
(HTAC) and tetrabutylammonium iodide (TBAI) capped PbS CQD film preparation except for
the concentration of the ligand solution; 8.8 mg/mL for HTAC methanol solution and 10.1
mg/mL for TABI methanol solution. The halide ligand passivated PbS CQD films were made at
ambient condition with low relative moisture (<30%). CaF2 and TiO2 were used as substrates for
the microsecond transient infrared spectroscopy and the electrical measurement, respectively.
The hybrid capped PbS CQD film is prepared by following the LBL method. The oleic
acid capped PbS CQD solution (50 mg/mL) was spin-cast at 2500 rpm and 1% v/v 3-
mercaptopropionic acid methanol solution was used for ligand exchange. To note, the inorganic
passivation was performed through CdCl2 pretreatment during PbS CQD synthesis. The CdCl2
pretreatment covers most of Pb2+
empty orbitals at the surface with chloride and the nonbonding
electron orbitals of sulfur with cadmium ions.
2.2 Ultrafast transient infrared spectroscopy (UF-IR, Figure 2-2)
An ultrafast Ti:sapphire laser generates 800 nm wavelength centered pulses with 100 fs
duration at 1 kHz repetition rate and the beam is split by a beam splitter in front of the optical
parametric amplifier (OPA). One beam is used as a pump to photo-excite the CQD films in a
cryostat (Janis) under vacuum, and the other is tuned to mid-IR range (3-6µm) through an OPA
(Quantronix) to be used as a probe. Both pump and probe pulses overlap on the sample with 500
µm and 300 µm beam diameters, respectively. The mid-IR probe pulses reach a 64-element
mercury cadmium telluride (MCT) dual array detector (Infrared Associates, Inc.) to
simultaneously detect 32 probe frequencies through a monochromator (Horiba Jobin-Yvon). All
the instruments are purged with dry air. The experiments were carried out at room temperature
controlled by air handling equipment (Cleanpak).

12
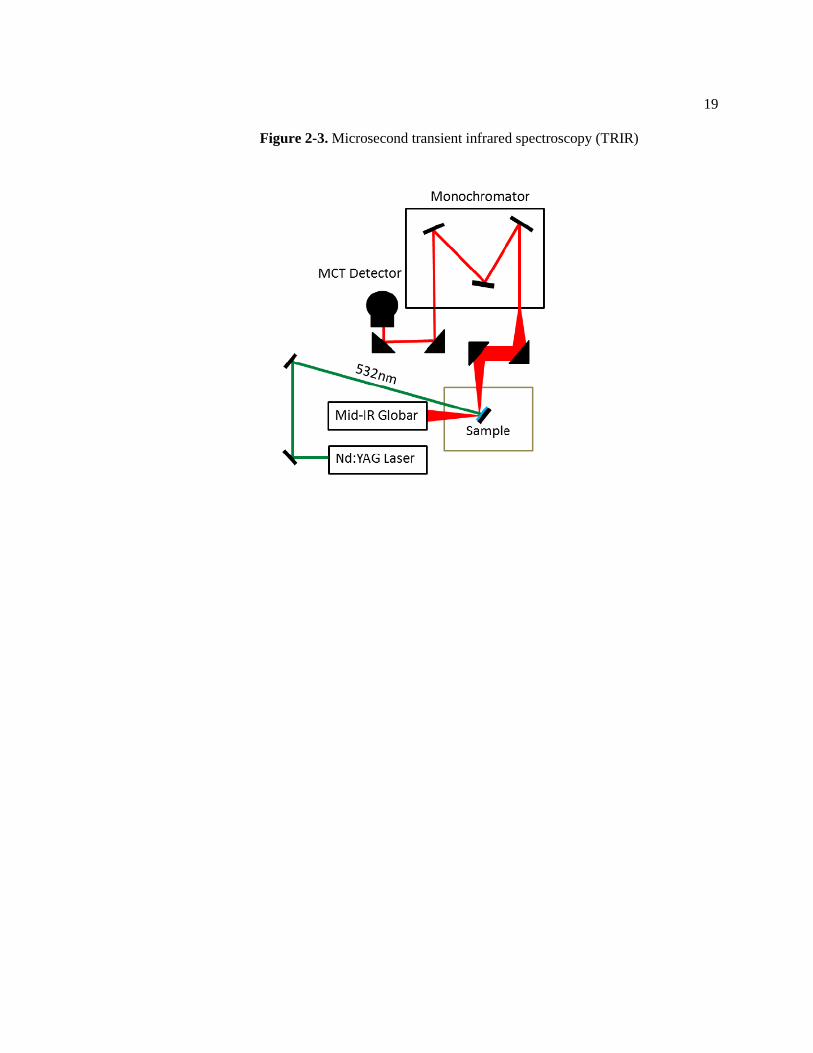
2.3 Microsecond transient infrared spectroscopy (TRIR, Figure 2-3)
A second harmonic (532 nm) pulse generated by a Nd: YAG laser with 10 ns duration was
utilized for photo-excitation of the lead sulfide colloidal quantum dot film. Continuous-wave
infrared probe light emitted from a compact ceramic Globar Light Source (Newport Corp.) was
overlapped with the 532 nm excitation laser pulse of 500µJ/cm2 excitation density corresponding
to less than one photon per dot at the PbS CQD film sample. Both MPA and EDT capped PbS
CQD films were measured at the same excitation density and have similar optical absorptions at
532 nm. The PbS CQD film samples were deposited on a 1 inch protected Al mirror (Thorlabs)
and kept under vacuum at 10-2
Torr inside a vacuum cryostat (Janis). The infrared probe light
interacting with the PbS CQD film sample was reflected and dispersed by a 150 lines/mm grating
inside a monochromator (HORIBA JobinYvon). The stepwise grating guided the corresponding
wavelength infrared light into a 1x1 mm2 mercury cadmium telluride (MCT) single-element
detector. The detected signals were amplified by three orders of magnitude by a preamplifier
with band-pass frequency of 1.5 Hz to 1.0 MHz (Infrared systems Development) and digitized by
a 16-bit 10 MHz computer mounted analog-digital converter (National Instruments).
2.4 Temperature dependent microsecond transient infrared spectroscopy
The temperature dependent microsecond transient infrared spectroscopy was performed
by Jihye Kim in the Asbury group in the Chemistry Department at Penn State University. The
setup is identical to the methods described above, except that the sample was mounted inside a
cryostat (Janis, ST-100) and the temperature was controlled by a temperature controller (Lake
Shore).
13
2.5 Organic photovoltaic material film
Solutions of M-TQ1 and PCBM (1:3 by mass) were prepared in chlorobenzene with a total
concentration of 20 mg/mL and different concentrations of LiTFSI methanol solution were added
to the M-TQ1 and PCBM solution. The polymer blend solution was spun on 1 inch protected Al
mirrors (Thorlabs) at 500 rpm for 200 s under nitrogen atmosphere inside a glovebox.
2.6 Dispersive infrared spectroscopy
Steady state infrared spectroscopy is conducted by using home-built dispersive infrared
spectrometer and Fourier transform infrared spectrometer (Thermo Fisher Scientific, Inc.). The
dispersive infrared spectrometer utilizes a globar infrared ceramic element (6575, Newport)
hitting the sample amounted at a cold finger inside a cryostat (ST-100, Janis). The infrared light
interacting with a sample is dispersed at a grating (150 lines/mm, 5 µm blazed wavelength) inside
a monochromator (Horiba Jobin-Yvon, Inc.) through 0.5 cm size slit and 30 Hz optical chopper
(Newport Corp.). The grating mechanically moves stepwise and corresponding wavelength
infrared light is detected by a single element (1x1mm2) mercury cadmium telluride (MCT)
detector ( Infrared Associates Inc.) connected to a current mode preamplifier (Infrared Systems
Development Corp.). The signal intensity is amplified by about three orders of magnitude by the
preamplifier followed by analogue-to-digital converter (National Instruments Corp.).
2.7 Dielectric spectroscopy
Dielectric spectroscopy was carried by using an Agilent E4980A precision LCR meter in
the Wang group in the Department of Materials Science and Engineering at Penn State
14
University. The drop-casted sample film lies between two brass electrodes to be a sandwich type
cell (electrode-sample film-electrode) in the glovebox. The LCR meter measured the dielectric
constant and impedance functions in the AC field in a frequency range of 2 Hz - 2 MHz and N2
atmosphere was kept during the measurement.
2.8 Steady-state UV/Vis/NIR absorption spectroscopy
The UV/Vis/NIR spectra were obtained with a Beckman DU-520 UV/Vis/NIR
Spectrophotometer (Beckman Coulter Inc.). The UV/Vis/NIR spectrometer comprises of a
tungsten element for visible light and a deuterium element for UV light. A 1200 lines/mm
grating spatially separates the UV/Vis/NIR light and a silicon photodiode detects the
corresponding light. The sample materials are spin coated on 1 inch diameter calcium floride
(CaF2) windows (Red optronics) and a blank calcium floride window was used for background
offset.
*The following experiment were carried out by collaborators.
1) The Sargent group in the Department of Electrical and Computer Engineering at the University
of Toronto in Canada.
Ion-gel Field Effect Transistor (FET) 1
Current-Voltage (I-V) measurement1
Capacitance-Voltage (C-V) measurement1
Steady-state linear infrared spectroscopy1

15
Scanning transmission electron microscopy (STEM)1
X-ray diffraction analysis1
X-ray Photoelectron Spectroscopy1
Carrier extraction by linear increasing voltage (CELIV)1
Temperature-dependent transient photoconductivity measurement2
Temperature-dependent short-circuit current measurement2
2) The Maroncelli group in the Department of Chemistry at the Pennsylvania State
University
2.9 Time Correlated Single Photon Counting (TCSPC)
The time correlated single photon counting (TCSPC) experiment is carried out by Dr.
Minako Kondo in Dr. Mark Maroncelli’s group. A 400 nm laser pulse, generated by the second
harmonic generation of the cavity damped Ti: Sapphire Laser (Coherent Mira 900F) centered at
800 nm with 5.4 MHz repetition rate, was used for exciting sample and the photoluminescence
emission signal was collected by a single monochromator (ISA H10) around the emission
wavelength of 750 nm over a time interval out to 3 ns. The time resolution was determined to be
25 ps(FWHM) by measuring the scattering of the solution. The decay of PL emission as a
function of time was fitted using bi-exponential function convolved with the instrumental
response function. The decay was measured using front-face detection where-in the excitation
light was focusing on the front of the sample surface and the signal was collected from the same
region of the excitation with an angle of ~30⁰ selected to minimize the scattered and reflected
excitation light.

16
2.10 Steady-state photoluminescence spectroscopy
The steady-state visible photoluminescence emission spectra were measured by using the
PL spectrometer (SpexFluorolog 212) in the Maroncelli group. The sample is photo-excited at
400 nm and the fluorescence emission is collected from 350 nm to 1000 nm.
3) The Gomez group in the Department of Chemical Engineering at the Pennsylvania State
University
Thin Film Transistor (TFT)3
Power conversion efficiency (PCE)4
4) The Xu group in department of Engineering Science and Mechanics at the Pennsylvania State
University.
Steady-state photoluminescence emission spectroscopy
Steady-state infrared (IR)photoluminescence (PL) emission measurement was carried out
using a home-built PL spectrometer in the Xu group in the department of engineering science and
mechanics. The quantum dot samples on CaF2 window were excited at 650 nm by cw
semiconductor diode laser (10mW) and PL emission was collected at NIR PMT module (950-
1700 nm, Hamamatsu) through a monochromator (Acton Research Corporation). The 650 nm cw
laser power was 10 mW and the beam diameter was 3 mm, corresponding to ~1 photon per dot
excitation density.

17
Figure 2-1. Ligand structure

18
Figure 2-2. Ultrafast transient infrared spectroscopy (UFIR)
19
Figure 2-3. Microsecond transient infrared spectroscopy (TRIR)

20
2.11 Reference
1Tang,J; Kemp,K. W.; Hoogland, S.; Jeong, K.S.; Liu, H.; Levina, L.; Furukawa, M.; Wang, X.;
Debnath, R.; Cha, D.; Chou, K.W.; Fischer, A.; Amassian, A.; Asbury, J.B.; Sargent, E. H.
Colloidal-quantum-dot photovoltaics using atomic-ligand passivation Nature Mater.2011, 10,
765–771
2 Kemp, K. W.
ǂ; Jeong, K. S.
ǂ; Kim, J.; Voznyy, O.; Hoogland, S.; Thon, S. M.; Ip, A. H.;
Stewart, R. J.; Sargent, E. H.; Asbury, J. B. Dark State Mediate Photocarrier Transport in
Colloidal Quantum Dot Solid Submitted.
3Vakhshouri, K.; Gomez, E. D. Effect of Crystallization Kinetics on Microstructure and Charge
Transport of PolythiophenesMacromol. Rapid Commun.2012, 33, 2133-2137.
4Guo, C.; Lin, Y.; Witman, M. D.; Simth, K. A.; Wang, C.; Hexemer, A.; Strzalka, J.; Gomez, E.
D.; Verduzco, R. Conjugated Block Copolymer Photovoltaics with near 3 % Efficiency through
Microphase Separation Nano Lett.2013, 13, 2957-2963.
21
Chapter 3 Origin of sub-gap state and its role in charge transport in lead sulfide colloidal
quantum dot solid
This chapter was written on the basis of the following manuscript.
Kyle W. Kemp, Kwang S. Jeong, Jihye Kim, OleksandrVoznyy, Sjoerd Hoogland,
Susanna M. Thon, Alex H. Ip, Robert J. Stewart, Edward H. Sargent and John B. Asbury
Stokes Shifted Sub-gap State Mediate Photocarrier Transport in Colloidal Quantum Dot
Solids.
Submitted to Nature Communications.
*The work has been performed through collaboration with Dr. Edward H. Sargent's group in
department of electrical and computer engineering at the University of Toronto in Canada. The
electrical measurements (photoconductivity, short-circuit measurements), photoluminescence of
PbS CQD solution, and density functional theory computational studies were performed by the
Sargent group.

22
3.1 Introduction
Colloidal quantum dots (CQDs) provide unique advantages as photovoltaic materials
because of their size-tunable bandgap.1 The bandgap tunability through varying the nanoparticle
size enables us to utilize most of the solar spectrum including the near infrared range that contains
half of the energy from the sun.2 The tunable bandgap originates from the quantum confinement
of the semiconducting nanoparticle. Figure 3-1 represents the electronic states of a molecule, a
nanocrystal and a bulk material. As the bulk material shrinks its size to nanometer scale, the
continuous bandgap energy states of the material become discrete, similar to molecular electronic
energy states.
The quantum confinement is attributed to the natural length scale of the electron and hole
(Bohr radius) of a nanoparticle being comparable or longer than the physical quantum dot size.
The electronic states of the nanoparticle are analogous to the states in the hydrogen-like model.
Thus the electronic states are named as S, P, D..states. The Bohr radius in a semiconductor is
defined in terms of the Bohr radius of a hydrogen atom, a0,
𝑎𝐵 = Ɛ𝑚
𝑚∗𝑎0
where Ɛ is the dielectric constant of the bulk material, m* is the mass of the atomic particle, and
m is the rest mass of the electron. Due to Coulombic attraction between the electron and hole, the
exciton is regarded as a hydrogen-like bound state. Depending on the size of Bohr radius relative
to the size of nanoparticle, quantum confinement can be classified into three categories.
Strong confinement appears when the quantum dot radius is much smaller than electron
Bohr radius (ae), hole Bohr radius (ah) and exciton Bohr radius (aexc). Lead sulfide (PbS, aexc=
18nm) and lead selenide (PbSe, aexc= 20nm) quantum dots possess strong confinement in general
due to their relatively large Bohr radius. When the nanoparticle radius is smaller than aexc, but
larger than both ae, ah, this is referred to weak confinement regime. Lastly, if the nanoparticle

23
size lies between ae and ah or vice versa and smaller than aexc, an intermediate confinement regime
is observed.3
The bandgap energy of the strongly confined quantum dot was theoretically modeled by
L. Brus in 1984 using the effective mass approximation.1 The model well describes how the
bandgap of the nanoparticle depends on its radius,
𝐸𝑔𝑁𝑃 = 𝐸𝑔 +
ħ2𝜋2
2𝑅2 1
𝑚𝑒𝑓𝑓𝑒 +
1
𝑚𝑒𝑓𝑓 −
1.8𝑒2
Ɛ𝑅
where, Eg, ħ, R,𝑚𝑒𝑓𝑓𝑒 ,𝑚𝑒𝑓𝑓
,e, Ɛ are the bandgap of the bulk material, the reduced Planck
constant, the nanoparticle radius, the effective mass of electron, the effective mass of hole, the
elementary charge and dielectric constant, respectively. This equation starts from the bandgap of
the bulk material, Eg, which is smaller than that of a semiconducting nanoparticle. The second
term corresponds to the quantum confinement energy which is inversely proportional to the
square of the nanoparticle size, and the effective mass of electron and holes. The third term is
involved with Coulomb attraction of the electron and hole pair. This model describes the
bandgap energy of a strongly confined semiconducting nanoparticle.
The effective-mass approximation is useful for estimating the bandgap of a nanoparticle.
However, it does not offer a means of explaining sub-gap states that are placed between the
valence band and the conduction band. In bulk semiconducting material, the perfect periodicity
of the idealized single-crystal lattice is abruptly cut at the surface of material when the
semiconductor is sharply terminated. The abrupt termination of the periodicity of the potential
function gives rise to generation of allowed electronic energy states within the energy bandgap
where no transitions were formally allowed due to the absence of electronic states. Specifically,
at the surface, when assuming that the sp3 hybrid tetrahedral orbitals were used for bonding
between atoms, one of the sp3 orbital is left as a nonbonding orbital without overlapping with the
orbitals of adjacent atom. The nonbonding orbital does not produce any symmetric and anti-

24
symmetric energy splitting as in the case of overlapped orbitals, leading to the nonbonding orbital
being placed between the lower energy level of bonding molecular orbitals and the higher energy
level of antibonding molecular orbitals. The nonbonding orbital is referred to a dangling bond.
Furthermore, the presence of dangling bonds cause reconstruction of the surface structure to
stabilize the surface energy. The effective-mass approximation is not able to properly describe
this surface reconstruction.4 The lack of capability to include the electronic states of surface in
the effective-mass approximation is pronounced in semiconducting quantum dots. The
assumption of the effective mass approximation is that an electron is regarded as a free particle
owing to the large size of bulk material. However, the size of a quantum dot is less than 10 nm,
substantially smaller than that of the bulk material. Therefore, it is not proper assumption to fully
account for the electronic structure of quantum dot which has small size and large surface area.
The tight-binding approximation, alternatively, is based on the linear combination of
atomic orbitals (LCAO) principle applied to solid state materials. The approximation was
introduced to take account properties of nanocrystal surfaces.56
The tight-binding approximation
utilizes the atomic orbitals as base sets and calculates coordination between frontier orbitals of
atoms. Therefore, this approximation is able to include the nonbonding surface orbitals,
distinguishing the potential from that of core atoms of which orbitals have all possible
coordination completed. The tight-binding approximation provides the theoretical background of
the sub-gap electronic states of quantum dots which have been observed by photoluminescence
(PL) emission and electrical measurement.78
Nevertheless, due to its less accuracy of estimating
the bandgap energy, the tight binding approximation is complementary to the effective-mass
approximation.
Along with the two theoretical backgrounds for electronic states of colloidal quantum
dots, a number of experiments have been carried out for the last three decades. Steady state
visible absorption, photoluminescence emission, composition analysis using X-ray and optical

25
microscopy have been used to analyze quantum dot properties. In addition, time resolved
measurements such as transient absorption spectroscopy were also used to understand
photophysics in CQDs.9
Most studies on electronic states of colloidal quantum dots were conducted using the
colloidal phase of the quantum dots due to the simplicity to rule out electronic coupling between
quantum dots and the ease to conduct experiment. However, the studies for colloidal phase
quantum dots cannot directly be applied to solid state quantum dot films since the electronic
interaction between quantum dots becomes substantial in the solid phase, which is not an issue in
the study for solution phase colloidal quantum dots.
Recently, a dramatic improvement in quantum dot solar cell performance was reported,
where the power conversion efficiency of PbS colloidal quantum dot (CQD) solar cells achieved
7% in 2012.10
Surprisingly, it took only a few years to increase the power conversion efficiency
to 7% from 1%. While the device performance has developed at a very fast rate, understanding
the electronic structure of solid state colloidal quantum dot films has not kept pace with device
performance. Consequently, there is a need to explore the fundamental photophysics of the solid
state CQD photovoltaic materials. There has been intense research to understand charge transport
and recombination processes in semiconducting nanoparticle. Nevertheless, reported
mechanisms underlying the charge transport and recombination processes are still controversial.
Our work using ultrafast and microsecond transient infrared spectroscopy makes it
possible to probe mid-IR electronic transitions of photocarriers over seven orders of magnitude in
time.11,12,13,14,15
By scrutinizing the carrier dynamics, the charge transport and recombination
processes in PbS CQD solid film were investigated. It was found that a sub-gap state lies below
the 1Se state separated by the Stokes-shift energy which is the energy difference between the
bandgap absorption and emission spectra. In combination with temperature dependent studies
from transient absorption kinetic decays, transient photoconductivity and short-circuit current

26
measurements, we discovered unprecedented findings that the Stokes-shifted state is the charge
transport state. We believe that the discovery will contribute to the colloidal quantum dot field in
both understanding the electronic properties of PbS colloidal quantum dots and guiding direction
for device manufacture.

27
3.2 Result and Discussion
The ultrafast transient infrared spectroscopy (UFIR) was performed to examine the mid-
IR transition of various ligand capped PbS CQD films. A 100 fs duration 800 nm wavelength
pulse was used for bandgap excitation at 1 kHz repetition rate followed by a 200 fs duration mid-
IR probe pulse interacting with the photoexcited PbS CQD films. Surprisingly, the UFIR
absorption intensity and decay are sensitive to the ligand passivation strategy. The inset in Figure
3-2 represents the UFIR absorption decays of hybrid, 3-mercaptopropionic acid (MPA),
ethanedithiol (EDT) and hexanedithiol (HDT) capped PbS CQD films. Hybrid passivation
indicates the organic and inorganic mixed ligand passivation. The hybrid capped PbS CQD is
treated by CdCl2 during CQD synthesis to passivate Pb2+
and S2-
,and then MPA ligand exchange
was carried out via layer-by-layer method. The hybrid, MPA, EDT and HDT capped PbS CQD
films show 0.036, 0.027, 0.019, and 0.012 transient absorption (arbitrary units), respectively. The
ligand dependent transient absorption intensity does not fit the conventional electronic model of
colloidal quantum dots. The conventional model merely includes 1Se, 1Pe, 1De,etc. delocalized
electronic states (1Sh and 1Ph, etc. for valence band). The conventional view predicts the same
density of the charge carrier in 1Se states if the films absorb the same density of photons.
However, our result, which have been scaled by the density of absorbed photons, reveals that the
UFIR intensity is sensitive to ligand passivation. The UFIR intensity study indicates that
electrons are able to relax on ultrafast time scales into sub-gap states that do not exhibit near-IR
electronic transitions and that the density of these states depends on ligand treatment.
The ligand dependent UFIR intensity can be explained by comparing the trap density of
PbS CQD films treated with various ligands.16
The trap density of the PbS CQD film decreases
in the order of EDT, MPA and Br- capped films. Since the hybrid capped PbS CQD is mostly
passivated by chloride and additional post-passivation is treated by MPA, the trap density of

28
hybrid should be similar or perhaps even less than that of the Br- capped film. Based on the anti-
correlation between UFIR intensity and the trap density, it is revealed that the UFIR is dependent
upon the density of trap states, implying that charge carriers can partition between different types
of states. It was reported that charge trapping takes place at very fast time scales17
and is involved
with exciton dissociation, leading to reduction of PL quantum yield181920
. Our UFIR kinetic
traces also do not exhibit a fast decay that would be associated with trapping of electrons (Figure
3-3), indicating that the trapping process is faster than the UFIR instrument temporal resolution
(100 fs). The electron transfer time from PbS CQD to TiO2 was reported to be 6.4 ±0.4 fs,21
which means that the exciton dissociation occurs at least within a few fs. Furthermore, based on
the observation by Engel and co-worker, the electron cooling process completes within 100 fs,22
indicating charge carriers relax to the sub-gap state within 100 fs. Therefore, the measured UFIR
intensity in 1ps mostly represents photocarrier density at the sub-gap state.
Interestingly, the decay of the UFIR signal is also reliant on the ligand passivation. The
time constants were obtained from the extended power law fit function combined with two rising
fit functions (Details are described in the Appendix). The time constant for each films are 1.3 ns,
2.6 ns, 3.7 ns and 6.5 ns for hybrid, MPA, EDT and HDT capped PbS CQD film, respectively. In
order to examine the density of charge carrier closer to the time zero point (t=0), the UFIR decays
of 1.30 eV bandgap hybrid PbS CQD were collected in a temperature range from 133K to 293K
with 30K increment (Figure 3-4). The time constant noticeably increases with lowering
temperature while the intensity only changes by 7±4% from 133 K to 293K. This suggests that
the initial transient absorption intensity should not be significantly different from the intensity
measured at room temperature. From the temperature dependent study, we also learned from the
significant decay rate variation with temperature that this decay is related to charge transport
since the electron cooling, which is the other possible process, is not a non-equilibrium process
that is not expected to be sensitive to temperature. It is also found that the UFIR kinetic decay

29
rate is proportional to the mobility of PbS films (Figure 3-5). The electron mobility is determined
by the ligand passivation strategy: bromide capped film (4 x 10⁻²
cm2/V·s) > MPA acid capped
film (5.1x 10⁻³
cm2/V·s) > EDT capped film (2.4 x 10
-4cm
2/V·s).
2324 For all experiments, the
pump excitation density was kept under one photon per dot. Hence, the fast UFIR decay of the
hybrid capped PbS CQD film might result from bimolecular process such as transport-limited
Auger recombination.25
The transport-limited Auger recombination process is illustrated in
Figure 3-6. Traditional Auger recombination arises when one exciton in close proximity to
another donates its excitation energy to the second exciton resulting in loss of the first and double
excitation of the second. The doubly excited exciton is able to rapidly cool back to the lowest
energy excited state such that the net result of the process is loss of an exciton. Traditional Auger
recombination is important in quantum dots when there is a high probability that two excitons
will be formed in the same nanocrystal. However, in dense CQD solids, excitons and charge
carriers are mobile and are therefore able to migrate to neighboring nanocrystals. IN this
situation, excitons or charge carriers created in one nanocrystal can migrate to other nanocrystals
that also contain excitons or charge carriers. In this situation, bimolecular recombination
processes can occur even at excitation densities well below the threshold where the probability of
absorbing two excitons per nanocrystal is significant. In order to confirm whether a transport-
limited bimolecular recombination process such as Auger recombination occurs in the hybrid
capped PbS CQD films, we examined UFIR kinetic decays at various pump excitation densities
in the range of 0.11- 1.84 photon per nanoparticle (Figure 3-7). The excitation density dependent
UFIR decay measurements show that transport-limited bimolecular recombination process occurs
even at lower than one photon per dot excitation density.
In order to find the energy level of the sub-gap state, we measured steady-state
UV/Vis/NIR absorption, photoluminescence (PL) emission and TRIR spectra of different size
PbS CQDs. The samples were oleic acid capped PbS CQDs in octane with bandgaps of 0.93,

30
1.22, 1.30 and 1.46 eV. The energy differences between the near-IR (NIR) absorption peak and
the PL peak, referred to as the Stokes shifts (Figure 3-8), were obtained by comparing the two
spectra. Second derivative analysis was applied to the NIR absorption spectra to identify
quantum confined transitions (Figure 3-9). Three common quantum confined interband
(excitonic) transitions were found (red curvatures) in the four mid-IR absorption spectra.
Reported assignments of the second and the third absorption peaks are controversial. Some
assign the second interband transition as 1Sh-1Pe. This assignment is based on the hypothesis that
the broken symmetry arising from imperfect surface passivation and non-perfectly spherical
shape of quantum dots allows the symmetry forbidden transition (1Sh-1Pe). If this is the case, the
third peak is supposed to be 1Ph-1Pe. Others assigned the second interband transition to arise
from 1Ph-1Pe transition which is the same assignment we incorporated. The 1Se-1Pe energy
difference was calculated by half of the energy difference of the 1Sh-1Se and 1Ph-1Pe transitions.
Surprisingly, the sum of this calculated 1Se-1Pe splitting energy and the Stokes shift energy
quantitatively matches the transition energy of the TRIR spectra (Figure 3-10 and 3-11). This
assignment is consistent with the results of the Klimov group and the Jiang group.26,27,28
The
quantitative agreement corroborates the hypothesis that the energy level of the sub-gap state
probed by TRIR is below the 1Se optically bright state by Stokes-shift energy, and the transition
energy of TRIR corresponds to the Stokes-shifted sub-gap state to 1Pe transition energy.
Comparison of the ligand dependent intensities obtained from TRIR with those of N-IR
photoluminescence spectra further supports that the sub-gap state involved in the TRIR transition
peak is identical to the Stokes-shifted dark state (Figure 3-12 and 3-13). The ligand dependent PL
emission intensity quantitatively matches the TRIR intensities, implying that the Stokes-shifted
sub-gap state is the state involved with PL emission in PbS CQDs.
Interestingly, the UFIR intensity decreases in the order of hybrid, MPA, EDT and HDT,
which is in inverse order of intensity of TRIR for the same film (Figure 3-14). The most distinct

31
difference between UFIR and TRIR is time delay. The UFIR reflects charge carrier dynamics
from tens of femtosecond to nanosecond time scale and the TRIR represents the charge carrier
dynamics from a hundred nanosecond to millisecond timescale after photoexcitation.
The inverse correlated intensity of UFIR and TRIR can be understood by comparing the
UFIR decay rate to the mobility of carriers. Surprisingly, the trend in decreasing mobility of PbS
CQD films is in the order (halide > MPA > EDT). This trend is consistent with that of the UFIR
decay rate (halide > MPA >EDT). Considering that the UFIR decay is related to the transport-
limited bimolecular recombination process, the correlation between the UFIR kinetic decay and
mobility demonstrates that charge carriers are transported through sub-gap states. The UFIR
intensities indicate the density of photocarriers in the sub-gap states before the onset of charge
recombination while the TRIR kinetic trace indicates the density of charge carrier after a
significant fraction of carriers have been lost due to the recombination process.
The hybrid capped PbS CQD dots with different bandgap energies (0.93, 1.30 and 1.46
eV) were examined using temperature dependent TRIR spectroscopy to obtain charge transport
activation energy. Strikingly, it was found that the activation energy measured using TRIR
spectroscopy shows quantitative agreement within experimental precision with the activation
energy measured by the temperature dependent transient photoconductivity and short-circuit
current techniques (Figure 3-15 and Table 3-1). Furthermore, the activation energy is much less
than the Stokes shift energy, suggesting that charge transport is not mediated by the 1Se state. In
other words, the activation energy agreement indicates that the charge carrier transport process
occurs via the Stokes-shifted sub-gap state. The Table 3-1 tabulates the 1Sh-1Se (bandgap)
energy, the Stokes shift energy, the activation energies measured by temperature depended TRIR,
and the activation energies measured by temperature dependent transient photoconductivity and
Jsc. With all the observations, it is concluded that the Stokes-shifted sub-gap state is the charge

32
transport state which is also optically probed by the UFIR, the TRIR and the NIR PL. This
assignment is unprecedented in the CQD field (Figure 3-16).
Density functional theory (DFT) calculations were used to understand the origin of the
Stokes-shifted sub-gap states by the Sargent group at the University of Toronto. DFT
calculations indicates that the four-fold 1Se states are comprised of two different symmetry states
represented as even and odd symmetry in Figure 3-17(A).29
Under perfect surface passivation,
optical transitions between the nearest bandedge states are allowed. When defects are generated
on the Pb sub-lattice due to imperfect passivation, however, the electronic states of1Se are
distorted and the even and odd states are reordered. This is because the 1Se(even) state is sensitive
to the surface defects (Figure 3-17 (B)). The reordering of different symmetry states causes the
closest-lying electronic states to no longer be radiatively coupled to each other. This reordering
produces a large Stokes shift that corresponding to the energy between even and odd symmetry
1Se states.
The Stokes-shift is not desirable for solar cell device performance when it comes to
photovoltage. The photovoltage (related to the built-in-potential at the P-N junction) is
determined by the energy difference between p-type PbS CQD Fermi energy and n-type material
Fermi energy. (Figure 3-18) Therefore, reduction of the energy of the transport states near the
conduction band of p-type PbS CQD by the Stokes-shift energy results in a decrease o f the
maximum available photovoltage. Because the Stokes-shift is caused by imperfect bonding of
ligands to nanocrystal surfaces, removing charge traps and strain will help minimize the Stokes
shift energy and maximize the photovoltage of CQD PV devices.
Another approach for device performance improvement is to reduce the polydispersity of
colloidal quantum dots. Figure 3-19 represents the half-width-at-half-maximum (HWHM) of two
dots with different bandgap energies (0.95 eV and 1.49 eV bandgap). The HWHM of the
Gaussian fits indicates that the 0.93 eV PbS CQDs are highly monodisperse while the 1.46 eV

33
show broad size distribution. Interestingly, this trend is consistent with that of activation energies
measured by temperature dependent TRIR, transient photoconductivity and short-circuit current
measurement. The correlation between HWHM and charge transport activation energy suggests
that reduction of quantum dots size distribution may enhance photoconductivity by reducing
charge transport activation energy.

34
3.3 Conclusion
In conclusion, we revealed the origin of Stokes-shifted sub-gap state and its
characteristics in PbS CQD solid. While Stokes-shifted sub-gap states do not do not undergo
strong dipole-allowed optical transitions from 1Sh states in PbS CQDs, UFIR and TRIR
spectroscopies are capable of probing this state. By scrutinizing the mid-IR absorption spectra
and the photoluminescence emission spectra, we identified the energetic position of the Stokes-
shifted sub-gap state.
In combination with the temperature dependent studies of TRIR, transient
photoconductivity and the short-circuit current measurement, we discovered that the Stokes-
shifted sub-gap state is the charge transport state coupled to surface of quantum dot.
Based on the DFT calculation, the Stokes shift results from the electronic state exchange
within 1Se states due to presence of surface traps. For the future direction, reduction of surface
irregular structure and strain is required to remove the Stokes shift to increase the photovoltage.
Additionally, reduction of polydispersity is desired to reduce charge transport activation energy.

35
Figure 3-1. Electronic energy states of atom, semiconducting quantum dot and bulk materials are
illustrated.
36
Figure 3-2.UFIRdecaysof PbS CQD films. UFIR decays measured near the maximum of
mid-IR electronic transition (0.24 eV) in ligand exchanged PbS CQD solids. The kinetic decays
are normalized to highlight the ligand-dependent decay rates. The inset shows the actual UFIR
intensities of kinetic decays on logarithmic time scale.

37
Figure 3-3.Mid-IR probe frequency dependent UFIR kinetic decays. UFIR rising curves
were measured at 0.24 and 0.33 eV. The rise times follows the instrument response functions at
both probe energies.

38
Figure 3-4. Temperature dependent UFIR decays of hybrid capped PbS CQD film.
39
Figure 3-5. Inverse correlation of UFIR intensity and electron mobility of various ligand
capped PbS CQD films.

40
Figure 3-6. Transport-limited Auger recombination
41
Figure 3-7.The normalized UFIR kinetic decays measured at 0.33 eV following 1.55 eV
excitation represents that the UFIR decay is sensitive to pump excitation density.

42
Figure 3-8. Mid-IR absorption and PL emission spectra of four different size
dots.ΔsindicatesStokes-shift energy which is a energy difference between the excitonic absorption
peak and the excitonic PL emission peak.

43
Figure 3-9. Mid-IR absorption spectra for four different size hybrid capped PbS CQD
films. Bottom panels represent second derivation applied mid-IR absorption spectra providing
three common excitonic peaks (red curves).

44
Figure 3-10. TRIR spectra measured 0.5 µs after photoexcitation for four different size
hybrid capped PbS CQD films.

45
Figure 3-11. Comparison of mid-IR transition energies (blue squares) to the sum of
Stokes-shift energy and 1Se-1Pe transition energy. The mid-IR transition energy quantitatively
matches to the sum of Stokes-shift energy and 1Se-1Pe transition energy.

46
Figure 3-12. Ligand dependent photoluminescence spectra of PbS CQD films. HDT >
EDT > MPA >Br .

47
Figure 3-13.Comparison PL intensity to TRIR intensity. The quantitative agreement
between PL intensity and TRIR intensity indicates that the same populations of photoexcited
electrons are responsible for both mid-IR and PL transitions.

48
Figure 3-14.Anti-correlation between UFIR and TRIR intensity with various ligand
passivation strategy.

49
Figure 3-15.Temperature dependent TRIR provides activation energy of charge
transport. Decay rate of TRIR in logarithm scale is plotted as a function of time. From the
Arrhenius plots, the obtained activation energies are 8, 47 and 16 meV for 0.93, 1.30 and 1.46 eV
bandgap energy hybrid capped PbS CQD film.

50
Figure 3-16. Energy diagram of PbS CQD solid.

51
Figure 3-17(A) Origin of sub-gap transport state.Band structure diagram is plotted on the
basis of density functional calculations indicating distinct states of different symmetry in the 1S
state manifolds. Cartoons in the left side shows 1Se even (blue top), 1Sh odd (red bottom), 1Se odd
(blue top) and 1Sh even (red bottom). (B) Localized trap states at surface of PbS CQD.
A
B

52
Figure 3-18. Reduction of photovoltage by Stokes shift increase.
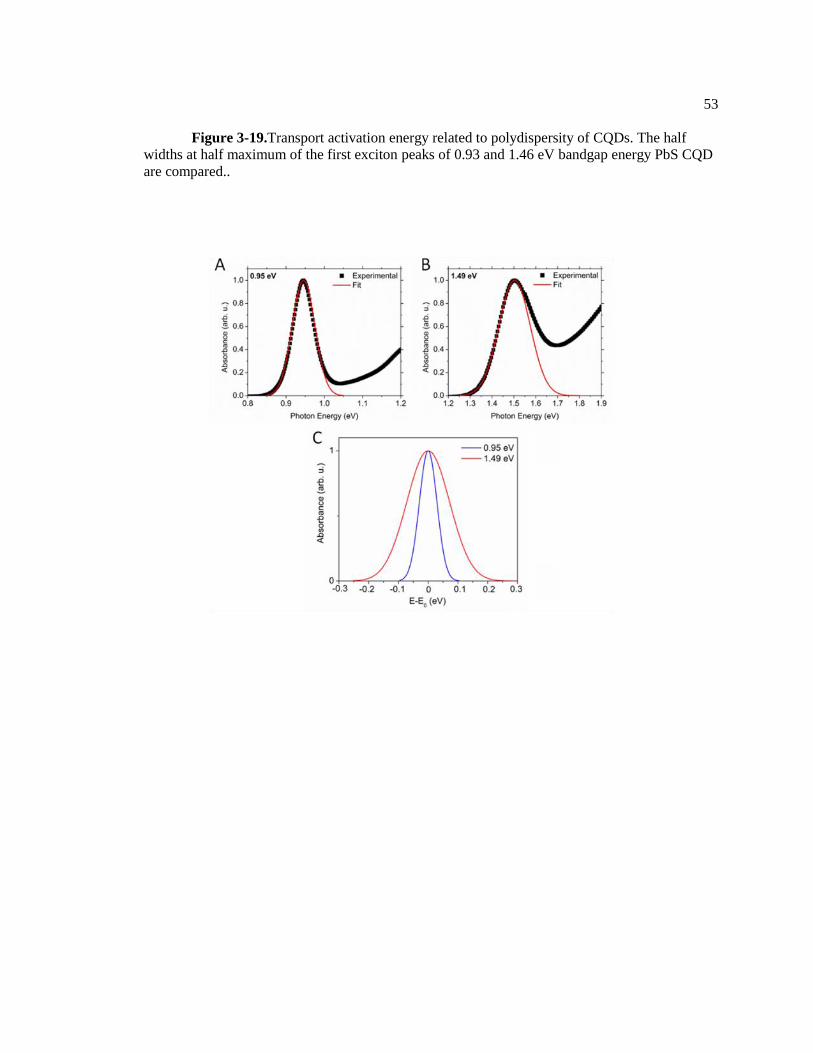
53
Figure 3-19.Transport activation energy related to polydispersity of CQDs. The half
widths at half maximum of the first exciton peaks of 0.93 and 1.46 eV bandgap energy PbS CQD
are compared..
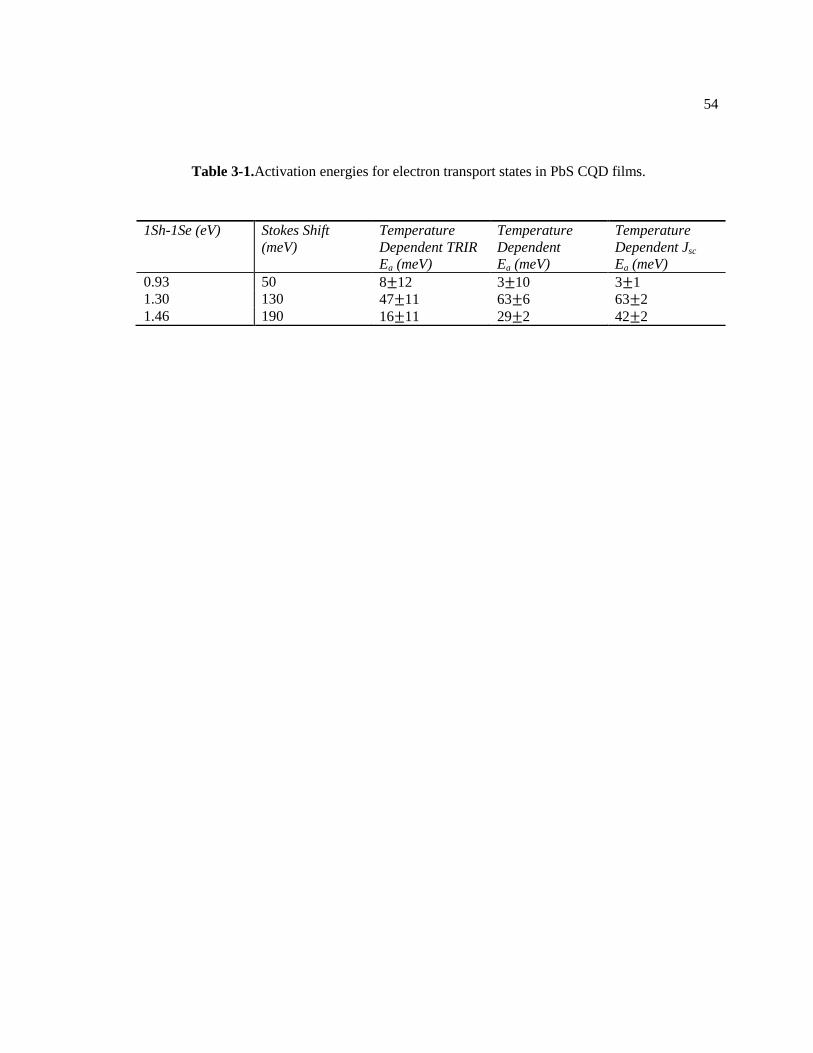
54
Table 3-1.Activation energies for electron transport states in PbS CQD films.
1Sh-1Se (eV) Stokes Shift
(meV)
Temperature
Dependent TRIR
Ea (meV)
Temperature
Dependent
Ea (meV)
Temperature
Dependent Jsc
Ea (meV)
0.93 50 8±12 3±10 3±1
1.30 130 47±11 63±6 63±2
1.46 190 16±11 29±2 42±2

55
3.4 Reference
1Brus, L. Electronic Wave Functions in Semiconductor Clusters: Experiment and Theory. J.
Phys. Chem., 1986, 90, 2555-2560.
2 Sargent, E. H. Infrared Photovoltaics made by solution processing Nature. Photonics.2009, 3,
326-331.
3Klimov, V. I. Semiconductor and Metal Nanocrystals: Synthesis and Electronic and Optical
Properties; Marcel Dekker, INC.: New York, Basel, 2004.
4 Snoke, D. W. Solid State Physics: Essential Concepts; Addison-Wesley: San Francisco, 2009.
5 Slater, J. C.; Koster, G. F. Simplified LCAO Method for the Periodic Potential Problem. Phys.
Rev., 1954, 94, 1498-1524.
6Bryant, G. W.; Jaskolski, W. Surface Effects on Capped and Uncapped Nanocrystals. J. Phys.
Chem. B.2005, 109, 19650-19656.
7 Jones, M; Shun, S. L., Scholes, G. D. Quantitative Modeling of the role of surface traps in
CdSe/CdS/ZnSNanocrystal Photoluminescence Decay Dynamics. Proc. Natl. Acad. Sci., 2009,
106, 3011-3016.
8Nagpal, P.; Klimov, V. I. Role of Mid-gap States in Charge transport and Photoconductivity in
Semiconductor NanocrystalFilms Nat.Commun., 2011, 2, 486.
9Klimov, V. I.; Schwarz, Ch. J.; McBranch, D. W.; Leatherdale, C. A.; Bawendi, M. G. Ultrafast
Dynamics of Inter- and Intraband transition s in Semiconductor Nanocrystals: Implications for
Quantum-dot Lasers Phys. Rev. B, 1999, 60, 2177-2180.
10
Ip, A. H.; Thon, S. M.; Hoogland, S.; Voznyy, O.; Zhitomirsky, R.; Debnath, R.; Levina, L.;
Rollny, L. R.; Carey, G. H.; Fischer, A.; Kemp, K. W.; Kramer, I. J.; Ning, Z.; Labelle, A. J.; Wei
Chou, K.; Amassian, A.; Sargent, E. H. Hybrid Passivated Colloidal Quantum Dot Solids.
Nature Nanotech.,2012, 7, 577-582.
11
Shim, M.; Shilov, S. v.; Braiman, M. S.; Guyot-Sionnest, P. Long-Lived Delocalized Electron
States in Quantum Dots: A Step-Scan Fourier Transform Infrared Study. J. Phys. Chem. B, 2000,
104, 1494.
12
Wehrenberg, B. L.; Wang, C. J.; Guyot-Sionnest, P. Interband and Intrabad Optical Studies of
PbSe Colloidal Quantum Dots.J. Phys. Chem. B, 2002, 106, 10634.
13
Pandey, A.; Guyot-Sionnest, P. Intraband Spectroscopy and Band Offsets of Colloidal II-VI
Core/Shell Structures. J. Chem. Phys., 2007, 127, 104710.

56
14
Zhang, J.; Jiang, X. Confinement-Dependent Below-Gap State in PbS Quantum Dot Films
Probed by Continuous-Wave Photoninduced Absorption. J. Phys. Chem. B, 2008, 112, 9557.
15
Lewis, J. E.; Wu, S.; Jiang, J. Unconventional Gap State of Trapped Exciton in Lead Sulfide
Quantum Dots. Nanotechnology, 2010, 21, 455402.
16Ip, A. H.; Thon, S. M.; Hoogland, S.; Voznyy, O.; Zhitomirsky, R.; Debnath, R.; Levina, L.;
Rollny, L. R.; Carey, G. H.; Fischer, A.; Kemp, K. W.; Kramer, I. J.; Ning, Z.; Labelle, A. J.; Wei
Chou, K.; Amassian, A.; Sargent, E. H. Hybrid Passivated Colloidal Quantum Dot Solids.
Nature Nanotech., 2012, 7, 577-582.
17
McArthur, E. A.; Morris-Cohen, A. J.; Knowles, K. E.; Weiss, E. A. Charge Carrier Resolved
Relaxation of the First Excitonic State in CdSe Quantum Dots Probed with Near-Infrared
Transition Absorption Spectroscopy. J. Phys. Chem. B, 2010, 114, 14514-14520.
18Smith, A.M.; Duan, H.W.; Rhyner, M.N.; Ruan, G.; Nie, S.M.A Systematic Examination of
Surface Coatings on the Optical and Chemical Properties of Semiconductor Quantum Dots. Phys.
Chem. Chem. Phys.2006, 8, 3895-3903.
19Qu, L.H.; Peng, X.G. Control of Photoluminescence Properties of CdSeNanocrystals in growth.
J. Am. Chem. Soc., 2002, 124, 2049–2055.
20Talapin, D.V.; Rogach, A.L.; Kornowski, A.; Haase, M.; Weller, H. (2001) Highly luminescent
monodisperseCdSe and CdSe/ZnSnanocrystals synthesized in a hexadecylaminetrioctylphosphine
oxide-trioctylphospine mixture. Nano Lett., 2001, 1, 207–211.
21Yang, Ye; Rodriguez-Cordoba, W.; Xiang, X.; Lian, T. Strong Electronic Coupling and
Ultrafast Electron Transfer between PbS Quantum Dots and TiO2 nanocrystalline Films. Nano
Lett., 2012, 12, 303-309.
22Harel, E.; Rupich, S. M.; Schaller, R. D.; Talapin, D. V.; Engel, G. S. Measurement of
Electronic Splitting in PbS Quantum Dots by Two-dimensional Nonlinear Spectroscopy Phys.
Rev. B, 2012, 86, 075412.

57
23
Tang,J; Kemp,K. W.; Hoogland, S.; Jeong, K.S.; Liu, H.; Levina, L.; Furukawa, M.; Wang,
X.; Debnath, R.; Cha, D.; Chou, K.W.; Fischer, A.; Amassian, A.; Asbury, J.B.; Sargent, E. H.
Colloidal-quantum-dot photovoltaics using atomic-ligand passivation Nature Mater.2011, 10,
765–771
24 Jeong, K. S.; Tang, J.; Liu, H.; Kim, J.; Schaefer, A. W.; Kemp, K.; Levina, L.; Wang, X.;
Hoogland, S.; Debnath, R.; Brzozowski, L.; Sargent, E. H.; Asbury, J. B. Enhanced mobility-
lifetime products in PbS colloidal quantum dot photovoltaics ACS Nano, 2012, 1, 89-99
25 E. Talgorn;Gao, Y.; Aerts, M.; Kunneman, L. T.; Schins, J. M.; Savenije, T. J.; van Huis, M.
A., van der Zant, H. S. J.; houtepen, A. J.; Siebbeles, L. D. A. Unity Quantum Yield of
Photogenerated Charges and Band-like Transport in Quantum-Dot Solids. Nature Nanotech.2011,
6, 733.
26 Diaconescu, B.; Padilha, L. A.; Nagpal, P.; Swartzentruber, B. S.; Klimov, V. I. Phys. Rev.
Lett., 2013, 110, 127406
27
Zhang, J.; Jiang, X. Confinement-Dependent Below-Gap State in PbS Quantum Dot Films
Probed by Continuous-Wave Photoninduced Absorption. J. Phys. Chem. B, 2008, 112, 9557.
28Lewis, J. E.; Wu, S.; Jiang, J. Unconventional Gap State of Trapped Exciton in Lead Sulfide
Quantum Dots. Nanotechnology, 2010, 21, 455402.
29An, J. M.; Franceschetti, A.; Zunger, A.TheExcitonic Exchange Splitting and Radiative
Lifetime in PbSe Quantum Dots Nano Lett., 2007, 7, 2129-2135.

58
Chapter 4 Enhancement of mobility-lifetime product in PbS colloidal quantum dot solid.
This chapter is based upon the following publication.
Kwang S. Jeong, Jiang Tang, Huan Liu, Jihye Kim, Andrew W. Schaefer, Kyle Kemp, Larissa
Levina, Xihua Wang, Sjoerd Hoogland, RatanDebnath, Lukasz Brzozowski, Edward H. Sargent,
and John B. Asbury
Enhanced mobility-lifetime products in PbS colloidal quantum dot photovoltaics
ACS Nano, 2012, 1, 89-99
Kwang S. Jeong, Ryan D. Pensack and John B. Asbury
Vibrational Spectroscopy of Electronic Processes in Emerging Photovoltaic Materials
Accounts of Chemical Research, ASAP
This project was performed via collaboration with Dr. Edward Sargent's group in department of
computer and electrical engineering at the University of Toronto in Canada. The electrical
measurements and images of colloidal quantum dots were obtained by the Sargent group.

59
4.1 Introduction
The power conversion efficiency (PCE) of colloidal quantum dot (CQD) solar cells is
partially determined by: 1) the efficiency at which photons are absorbed and converted into
charge carriers, and 2) the quantum yield for collecting those charge carriers in an external
circuit. 12
These processes are optimized for different thicknesses of material and so device
developers should balance light absorption with charge collection. For instance, an active layer
thickness of 1 µm is necessary to efficiently absorb incident photons (90%) at the bandgap of
CQDs. However, charge harvesting efficiency increases as the active layer decreases in thickness
since charge carries are susceptible to recombination if their transit time exceeds the charge
recombination lifetime. An effective electrical length is therefore typically a few hundred
nanometers in current optimized CQD devices.
In order to improve photo harvesting efficiency at the bandgap energy, it is necessary to
increase the diffusion length of charge carriers. The diffusion length (l) is described as the below
equation,
𝑙 = 𝑘𝐵𝑇
𝑒µ𝜏
where kB, T, e, µ, τ, is Boltzmann's constant, temperature, elementary charge, the charge carrier
mobility, the charge carrier lifetime , respectively.
This chapter discusses how the ligand passivation strategy influences the mobility-
lifetime products of PbS CQD films and their relevance to device performance. We analyzed the
3-mercaptopropionic acid capped PbS CQD device (5.1 % PCE) and the ethanedithiol (EDT)
capped PbS CQD device (1.7%) using microsecond transient infrared spectroscopy (TRIR)
coupled with electrical measurements of minority carrier mobility (Figure 4-1).We found that the
superior power conversion efficiency of the MPA capped PbS CQD devices originates from

60
enhancement of the mobility-lifetime product which is a key parameter in diffusion length at
ambient condition. The discovery highlights the importance of ligands that efficiently passivate a
variety of surface states leading to strong interparticle coupling for efficient charge transport and
higher PCE in CQD solar cell devices.
4.2 Results and Discussion
When PbS CQDs are synthesized, they are capped with long oleic acid molecules for
protection and colloidal stability. Due to the insulating barrier of long alkyl chains surrounding
the nanoparticle, however, the charge carrier mobility of the oleic acid capped PbS CQD film is
significantly lower than what is needed for solar cell applications. To improve the mobility, the
long oleic acids are replaced with short ligands leading to increases in the carrier mobility.3,4,5,6,7,8
Figure 4-2 (a) represents the linear infrared spectra of oleic acid (OA), ethanedithoil
(EDT), 3-mercaptopropionic acid (MPA), propanedithiol (PrDT), butanedithiol (BDT),
pentanedithiol (PnDT), hexanedithiol (HDT), 1,2-benzenedithiol (1,2-BzDT) and 1,4-
benzenedithiol (1,4-BzDT) capped PbS CQD films, respectively. Among the various ligands
capped PbS CQD films, we focused on the MPA capped PbS CQD film and EDT capped PbS
CQD film which have 5.1 % and 1.7 % power conversion efficiency, respectively, in order to
analyze the correlation of the fundamental photophysical properties and the device performance.
In Figure 4-2 (b), the oleic acid capped PbS (dark blue) has two high intense peaks at
around 2900 cm-1
corresponding to the CH2 symmetric and asymmetric vibrational stretching
modes of the long alkyl chains. In addition, two other distinct peaks appear at 1405 cm-1
and
1545 cm-1
corresponding to the symmetric and asymmetric stretching modes of carboxylate
bound to the nanoparticle surface.9 The absence of a noticeable peak at 1720 cm
-1corresponding
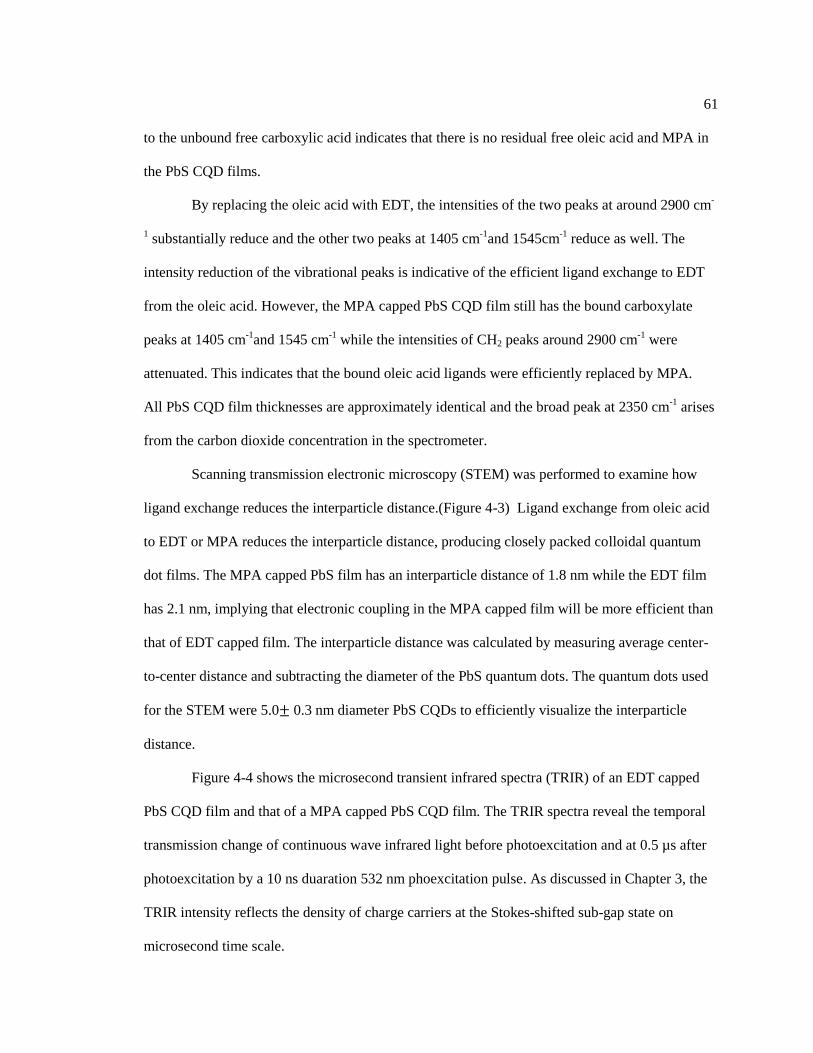
61
to the unbound free carboxylic acid indicates that there is no residual free oleic acid and MPA in
the PbS CQD films.
By replacing the oleic acid with EDT, the intensities of the two peaks at around 2900 cm-
1 substantially reduce and the other two peaks at 1405 cm
-1and 1545cm
-1 reduce as well. The
intensity reduction of the vibrational peaks is indicative of the efficient ligand exchange to EDT
from the oleic acid. However, the MPA capped PbS CQD film still has the bound carboxylate
peaks at 1405 cm-1
and 1545 cm-1
while the intensities of CH2 peaks around 2900 cm-1
were
attenuated. This indicates that the bound oleic acid ligands were efficiently replaced by MPA.
All PbS CQD film thicknesses are approximately identical and the broad peak at 2350 cm-1
arises
from the carbon dioxide concentration in the spectrometer.
Scanning transmission electronic microscopy (STEM) was performed to examine how
ligand exchange reduces the interparticle distance.(Figure 4-3) Ligand exchange from oleic acid
to EDT or MPA reduces the interparticle distance, producing closely packed colloidal quantum
dot films. The MPA capped PbS film has an interparticle distance of 1.8 nm while the EDT film
has 2.1 nm, implying that electronic coupling in the MPA capped film will be more efficient than
that of EDT capped film. The interparticle distance was calculated by measuring average center-
to-center distance and subtracting the diameter of the PbS quantum dots. The quantum dots used
for the STEM were 5.0± 0.3 nm diameter PbS CQDs to efficiently visualize the interparticle
distance.
Figure 4-4 shows the microsecond transient infrared spectra (TRIR) of an EDT capped
PbS CQD film and that of a MPA capped PbS CQD film. The TRIR spectra reveal the temporal
transmission change of continuous wave infrared light before photoexcitation and at 0.5 µs after
photoexcitation by a 10 ns duaration 532 nm phoexcitation pulse. As discussed in Chapter 3, the
TRIR intensity reflects the density of charge carriers at the Stokes-shifted sub-gap state on
microsecond time scale.

62
There are two apparent features in the TRIR spectra: broad electronic transition at 0.25 –
0.35 eV; and narrow vibrational features of the ligands appearing at 0.15-0.2 eV (1200 – 1600
cm-1
). The broad electronic transition spreads over 0.15 - 0.50 eV and the transition energy is
around 0.3 eV. The most striking feature of the transient infrared spectra is the narrow vibrational
bleaches shown at 0.15 - 0.2 eV. The negative signed absorption feature at 1405 cm-1
and 1545
cm-1
represent the symmetric and asymmetric stretch of carboxylate functional group bound to
PbS quantum dot surface. The bleach is generated when the transmission is increased by
electrical field generated by charge carriers at the Stokes shifted sub-gap state which is coupled to
surface. As well as the bleaches, two other absorption peaks appear right next to the two bleach
features. We believe that the two absorption peaks arise from new absorption of electrically
perturbed carboxylate ligand vibrational stretching modes.
For better understanding the coupling between the sub-gap state and the surface of
quantum dot, we investigated the transition energy of the sub-gap to 1Pe state using various
ligands (Figure 4-5). The transition energy of the TRIR spectra was calculated by following
equation.
𝐸 = 𝐸𝑔 𝐸 𝑑𝐸
𝑔 𝐸 𝑑𝐸
where g(E) represents the broad absorption line shape in the TRIR spectra expressed in terms of
the transition energy, E.
Figure 4-5 shows the TRIR spectra of various ligand capped PbS CQD film: MPA, EDT,
PrDT, BDT, PnDT, HDT, 1,2-BzDT and 1,4-BzDT capped PbS CQD films. The red-shift of the
TRIR transition may be attributed to the reduction of Stokes shift by ligand variation.
Additionally, the near-IR excitonic absorption peaks were measured for the same samples (Figure

63
4-6). All near-IR absorption spectra are normalized at maximum absorption peak to compare the
bandgap energy. Interestingly, the transition energy of TRIR spectra of various ligands capped
PbS CQD films do not show strong correlation with the bandgap of PbS CQD films (Figure 4-7).
The weak correlation arises from the less surface sensitivity of bandgap transition while the TRIR
transition is sensitive to surface of CQD. The bandgap transition is mainly involved with the
core-character delocalized states whiles the TRIR transition is related to the surface coupled
Stokes shift sub-gap states.
The decays of the TRIR spectra of the MPA capped film and the EDT capped film were
measured at the maximum intensity (Figure 4-8). The averaged lifetimes of the EDT capped film
and the MPA capped film are 93 to 31 µs, respectively. The lifetime indicates the bimolecular
recombination lifetime of charge carrier at the sub-gap state.
Mobility measurements were performed by the Sargent group using ion gel field effect
transistor (FET).1011
Figure 4-9 shows the drain current of EDT capped PbS film and that of MPA
capped PbS film. Surprisingly, the drain current of the MPA sample is larger than that of the
EDT sample by an order of magnitude. The mobility of the EDT and MPA samples are 2.4 x 10⁻⁴
cm2/V·s and 5.1 x 10
-3cm
2/V·s, respectively.
In combination with the recombination lifetime, we found that the mobility-lifetime
product positively contributes to the device performance. It is worth to note that the mobility-
lifetime product is a key parameter determining the diffusion length of charge carriers at ambient
temperature. By changing the ligand from EDT to MPA, the mobility increased by a factor of 20
from 2.4 x 10⁻⁴
to 5.1x 10⁻³
. In contrast, the averaged lifetime measured by the transient infrared
spectroscopy only reduced by a factor of 3 from 93 to 31 µs. Therefore, the mobility-lifetime
product increased by a factor of 7 by varying the ligand from EDT to MPA. The enhancement of
the mobility-lifetime products was a surprising result considering conventional mean field theory.
According to mean field theory, the lifetime of a diffusion controlled bimolecular charge

64
recombination process is inversely proportional to the mobility.12
Therefore, if the charge
recombination trend in diffusion processes were following the mean field theory, the mobility-
lifetime product should not have been changed.
The enhancement of mobility-lifetime product was rationalized by comparing the
recombination lifetime of differently passivated films. Assuming that the trap states are evenly
spread on the surface of quantum dots, the space between trap states of the MPA capped film
should be larger than that of the EDT capped film because of the lower density of traps.
Therefore, due to the larger inter-trap space, the recombination process of the MPA capped film
is slower than what is estimated.
Based on the observation that the ligand replacement from EDT to MPA increases the
mobility-lifetime product, we examined the device performance of each film to find a correlation
with the mobility-lifetime product. In Figure 4-9, current density - bias voltage (I-V) curves were
measured under AM 1.5 solar illumination for each EDT and MPA capped PbS CQD film. The
ligand change from EDT to MPA gives rise to a dramatic improvement in the short-circuit
current, increasing from 7.4 to 17.5 mA/cm2 while the open-circuit voltage is increased by only
0.07 V. Consequently, the increase of both short-circuit current and open-circuit voltage leads to
significant improvement in the power conversion efficiency from 1.7 % to 5.1 %.

65
4.3 Conclusion
The combination of the microsecond transient infrared spectroscopy and electrical
measurements reveals why the device performance of PbS CQD film increases through surface
modification via ligand passivation strategy. The combined measurements show that the charge
recombination dynamics and mobility are substantially changed by varying the ligand passivation
strategy. The mobility- lifetime product, which is a key parameter of diffusion length, was
enhanced by a factor of 7 via ligand variation from EDT to MPA. The increase of mobility-
lifetime product may be attributed to the decrease of the density of charge traps. Along with the
enhancement of the mobility-lifetime product, the power conversion efficiency achieved 5.1 %
of MPA capped PbS CQD film.

66
Figure 4-1. Molecular structure of ligands: Oleic acid (OA), Ethanedithiol (EDT) and 3-
mercaptopropionic acid (MPA)

67
Figure 4-2. Infrared spectra of oleic acid (OA), 3-mercaptopropionic acid (MPA),
ethanedithoil (EDT), propanedithiol (PrDT), butanedithiol (BDT), pentanedithiol (PnDT),
hexanedithiol (HDT), 1,2-benzenedithiol (1,2-BzDT) and 1,4-benzenedithiol (1,4-BzDT) capped
PbS CQD films.
(A)
(B)

68
Figure 4-3. Scanning transmission electron microscopy (STEM) images of EDT capped
PbS CQD and MPA capped PbS CQD films. Average interparticle distance for the EDT capped
film and the MPA capped film are 2.1 nm and 1.8 nm, respectively.
(A)
(B)

69
Figure 4-4. Microsecond transient infrared (TRIR) spectra of EDT capped PbS film
(green) and MPA capped PbS film (blue). The narrow vibrational features result from ligands that
are electronically perturbed by charges carriers. The broad absorption features corresponds to
subgap-to-1Pe transition.
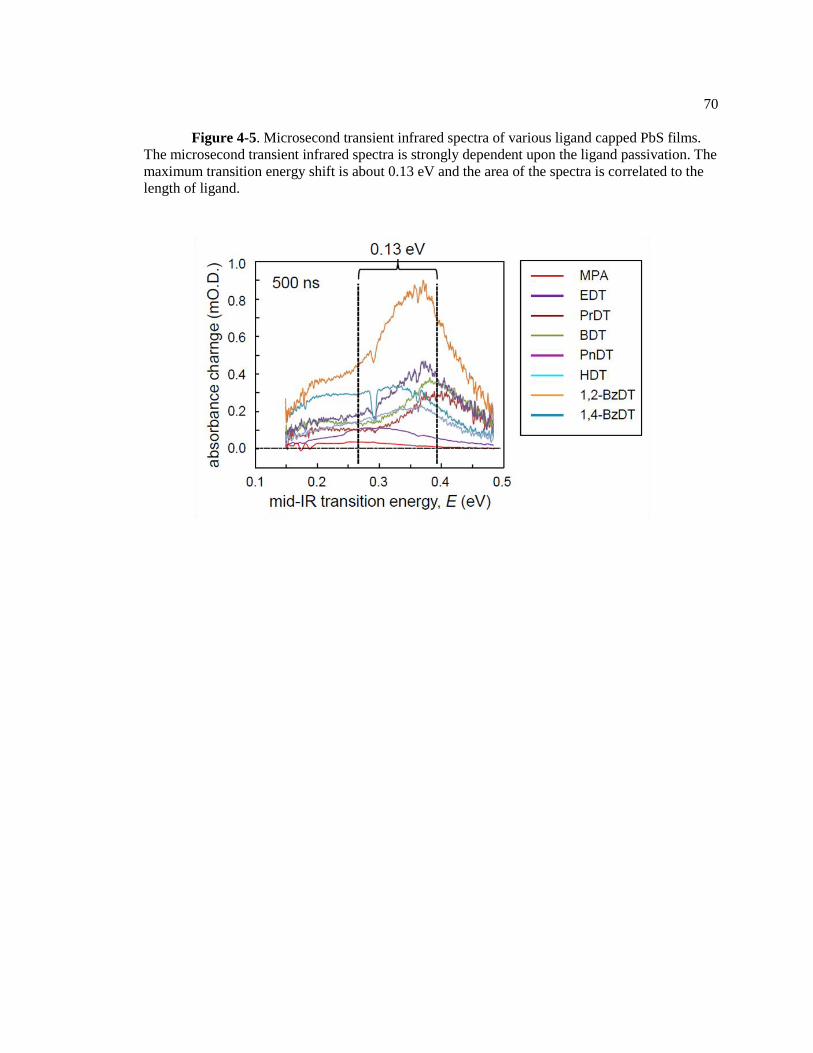
70
Figure 4-5. Microsecond transient infrared spectra of various ligand capped PbS films.
The microsecond transient infrared spectra is strongly dependent upon the ligand passivation. The
maximum transition energy shift is about 0.13 eV and the area of the spectra is correlated to the
length of ligand.

71
Figure 4-6.Excitonic absorption peaks of 3-mercaptopropionic acid (MPA), ethanedithoil
(EDT), propanedithiol (PrDT), butanedithiol (BDT), pentanedithiol (PnDT), hexanedithiol
(HDT), 1,2-benzenedithiol (1,2-BzDT) and 1,4-benzenedithiol (1,4-BzDT) capped PbS CQD
films. The bandgap energy is dependent on ligand passivation and the maximum shift is ~0.07
eV.

72
Figure 4-7.Mid-IR transition and bandgap correlation data. The scattered dots of various
ligand capped PbS CQD film implies the mid-IR transition is not strongly dependent on quantum
confinement.
73
Figure 4-8. TRIR decays of the EDT capped film (green) and the MPA capped film
(blue). The MPA capped film has lower lifetime by a factor of 3 in comparison to the EDT
capped film.

74
Figure 4-9. Id-Vg curves for minority carriers (electrons) in the EDT and MPA capped
PbS Films. The mobility was measured using the ion-gel field-effect transistor geometry. The
inset is the magnified Id-Vg curve for the EDT capped PbS film for clarity.

75
Table 4-1. Electrical and optical parameters of EDT capped PbS CQD film and MPA
capped PbS CQD film.
EDT MPA
µ<τ> product 0.022 0.16
µ (cm2/V s) 2.4 x 10
-4 5.1 x 10
-3
<τ> (µs) 93 31
< E > (eV) 0.29 0.27
𝐼 𝑣 𝑑𝑣 3.3 1.0
C-Vg (cm-3
) 8 x 10¹⁶
2 x 10¹⁶

76
4.5 Reference
1Tang, J.; Sargent, E. H. Infrared Colloidal Quantum Dots for Photovoltaics: Fundamentals and
Recent Progress. Adv. Mater. 2011, 23, 12–29.
2Talapin, D. V.; Lee, J.-S.; Kovalenko, M. V.; Shevchenko, E. V. Prospects of Colloidal
Nanocrystals for Electronic and Optoelectronic Applications. Chem. Rev. 2010, 110, 389–458.
3Tang, J.; Brzozowski, L.; Barkhouse, D. A. R.; Wang, X.; Debnath, R.;Wolowiec, R.; Palmiano,
E.; Levina, L.; Pattantyus-Abraham, A. G.; Jamakosmanovic, D.; Sargent, E. H. Quantum Dot
Photovoltaics in the Extreme Quantum Confinement Regime: The Surface-Chemical Origins of
Exceptional Air and Light-Stability. ACS Nano,2010, 4, 869–878.
4 Luther, J. M.; Law, M.; Beard, M. C.; Song, Q.; Reese, M. O.; Ellingson, R. J.; Nozik, A. J.
Schottky Solar Cells Based on Colloidal Nanocrystal Films. Nano Lett., 2008, 8, 3488–3492.
5 Luther, J. M.; Gao, J.; Lloyd, M. T.; Semonin, O. E.; Beard, M. C.; Nozik, A. J. Stability
Assessment on a 3% Bilayer PbS/ZnO Quantum Dot Heterojunction Solar Cell. Adv. Mater.,
2010, 22, 3704–3707.
6Choi, J. J.; Lim, Y.-F.; Santiago-Berrios, M. B.; Oh, M.; Hyun, B.-R.; Sun, L.; Bartnik, A. C.;
Goedhard, A.; Malliaras, G. G.; Abruna, H. D.; Wise, F. W.; Hanrath, T. PbSe Nanocrystal
Excitonic Solar Cells. Nano Lett., 2009, 9, 3749–3755.
7Leschkies, K. S.; Beatty, T. J.; Kang, M. S.; Norris, D. J.; Aydil, E. S. Solar Cells Based on
Junctions Between Colloidal PbSe Nanocrystals and Thin ZnO Films. ACS
Nano,2009, 3, 3638–3648.
8Kovalenko, M. V.; Scheele, M.; Talapin, D. V. Colloidal Nanocrystals with Molecular Metal
Chalcogenide Surface Ligands. Science, 2009, 324, 1417–1420.

77
9Pattantyus-Abraham, A. G.; Kramer, I. J.; Barkhouse, A. R.; Wang, X.; Konstantatos, G.;
Debnath, R.; Levina, L.; Raabe, I.; Nazeeruddin, M. K.; Gratzel, M.; Sargent, E. H. Depleted-
Heterojunction Colloidal Quantum Dot Solar Cells. ACS Nano, 2010, 4, 3374-3380.
10Kang, M. S.; Lee, J.; Norris, D. J.; Frisbie, C. D. High Carrier Densities Achieved at Low
Voltages in Ambipolar PbSe Nanocrystal Thin-Film Transistors. Nano Letter,2009, 9, 3848-3852.
11Kang, M. S.; Sahu, A.; Norris, D. J.; Frisbie, C. D. Size-Dependent Electrical Transport in
CdSe Nanocrystal Thin Films. Nano Lett., 2010, 10, 3727-3732.
12Waite, T. R. Theoretical Treatment of the Kinetics of Diffusion-limited reactions. Phys.
Rev.1957, 107, 463-470.

78
Chapter 5 ATOMIC LIGAND PASSIVATED LEAD SULFIDE COLLOIDAL QUANTUM
DOT SOLID
This chapter was written on the basis of following publication.
1) Jiang Tang, KyleW. Kemp, Sjoerd Hoogland, Kwang S. Jeong, Huan Liu, Larissa
Levina,Melissa Furukawa, XihuaWang, Ratan Debnath, Dongkyu Cha, KangWei Chou, Armin
Fischer,AramAmassian, John B. Asbury and Edward H. Sargent Colloidal-quantum-dot
photovoltaics using atomic-ligand passivation
Nature Mater.2011, 10, 765–771
2) Kwang S. Jeong, Ryan D. Pensack and John B. Asbury Vibrational Spectroscopy of
Electronic Processes in Emerging Photovoltaic Materials
Acc. Chem. Res., ASAP
This project was conducted via collaborating with the Sargent group at the University of
Toronto in Canada. To note, the electrical measurements and the imaging quantum dots were
performed by the Sargent group.

79
5.1 Introduction
Ligand exchange in colloidal quantum dots (CQDs) from long insulating alkyl chains to
short size ligands has shown to minimize the interparticle distance to promote carrier transport
and lower the defect density to reduce recombination loss. The short alkylthiols12
, alkylamines3,
aromatic thiols4 and mercaptocarboxylic acid
5 treatment has shown promising achievement in
surface passivation, reduction of interparticle distant and device performance.
From the previous chapter, we learned that the ligand variation from EDT to MPA
enables charge carriers to undergo efficient transport by reduction of the density of trap states,
leading to high power conversion efficiency of 5.1 %. Nevertheless, alternative passivation
strategy is required due to the intrinsic limitation of the organic ligand: vulnerability to oxidation,
thermal degradation and insulating property. Through collaborative work with the Sargent group
at the University of Toronto in Canada, we first reported the atomic size inorganic ligand
passivated PbS colloidal quantum solar cell of 6% world record power conversion efficiency.
Furthermore, we investigated the fundamental photophysics determining the device
performance.6 The analysis of the atomic ligand passivated PbS colloidal quantum dot solid
provides better understanding of the electronic states of PbS quantum dot film and guiding future
direction for development strategies of CQD solar cell.
80
5.2 Result and discussion
Atomic ligand passivation was enabled using halide compound such as
cetyltrimethylammonium bromide (CTAB), hexadecyltrimethylammonium chloride (HTAC) and
tetrabutylammonium iodide (TBAI). The bulk halide solution was dispersed on the oleic acid
capped PbS CQD layer, therefore, the bulk ionic compound slowly releases the halide and
replaces the oleic acid bound to the quantum dot surface with the halide (Figure 5-1). Figure 5-2
represents the steady state infrared spectra of the oleic acid capped PbS CQD film and the halide
(Br-, Cl
-, I
-) capped PbS CQD film, displaying the change of the linear infrared transmission of
PbS CQD before and after ligand exchange. The asymmetric and symmetric stretching modes of
the CH2 alkyl chains ( 2922 cm-1
and 2852 cm-1
) and the carboxylate (1545 cm-1
and 1403 cm-1
)
disappear by ligand exchange to Br-, Cl
- and I
-, indicating that the bound oleic acids were
efficiently replaced by halides. The peaks appearing at 2345cm-1
arise from carbon dioxide
molecules in the spectrometer.
X-ray photoelectron spectroscopy (XPS) confirmed the existence of bromide of the
bromide capped PbS CQD film. (Table 5-1) The elemental atomic percentage of Pb 4f, S 2s, Br
3d were obtained and they are 48%, 33.8 %, and 17.8 %, respectively. The difference of the
elemental atomic percentage between Pb (4f) and S (2s) quantitatively matches the atomic
percentage of Br (3d) on the surface of the bromide capped PbS CQD.
Scanning transmission electron microscopy (STEM) images offer further evidence of the
ligand exchange. Figure 5-3 displays the STEM image of the oleic acid capped PbS CQD treated
by pure methanol (A), 1 % EDT in acetonitrile (B), 10 % MPA in methanol (C), and 10 mg/mL
CTAB in methanol (D). Center-to-center spacing of quantum dots was analyzed and the
interparticle distances were obtained: 2.1 nm for EDT capped film, 1.8 nm for MPA capped film
81
and 1.0 nm for bromide capped film. As observed in the image, ligand exchange reduces the
interparticle distance which is related to the size of the ligand molecule.
The ligand exchange also influences the near-IR absorption spectra. Figure 5-4 shows
that the first excitonic peak is red-shifted and broadened by ligand exchange. The peak
broadening and red-shift appear because quantum dots are more electronically coupled with
neighboring dots through more electron wavefunction overlapping. The red-shift and peak
broadening are also seen in other organic ligand capped PbS CQD films. Figure 5-5 represents the
near-IR absorption spectra of Br, MPA, 1,4-BzDT, BDT and EDT ligand capped PbS CQD film.
Interestingly, the longest ligand, 1,4-BzDT, produces the most narrow half-width-at-half
maximum(HWHM). The HWHM becomes broader by reducing the ligand length from
butanedithiol (BDT), ethanedithiol (EDT), 3-mercaptopropionic acid (MPA), to bromide (Br-). To
note, the bandgap absorption peak broadening and redshift do not result from the polydispersity
of size distribution since all samples were from the same CQD batch.
It has been reported that the minority carrier (electron) in the p-type PbS CQD film
determines the overall solar power conversion efficiency of the device. The electron mobility of
the p-type PbS CQD film was measured using ion-gel field effect transistor (Figure 5-6). The
atomic ligand passivation allowed to achieve 4 x 10⁻²
cm2/V·s in mobility which is an order of
magnitude larger than that of MPA capped PbS CQD film (5.1 x 10⁻³
cm2/V·s) and two orders of
magnitude larger than that of EDT capped PbS film (2.4x10⁻⁴
cm2/V·s).
Using the capacitance-voltage (C-Vg) measurement, a p-type doping (electron acceptor)
density of the bromide capped PbS CQD films was measured to be Nacpt= 3.7 x10¹⁵
cm-3
. The
doping density is one order of magnitude lower than that of MPA (2 x 10¹⁶
cm-3
) or EDT (8 x 10¹⁶
cm-3
) capped PbS CQD films, suggesting that the atomic passivation suppresses the doping states
including trap states,1 via an efficient atomic size ligand passivation strategy. The reduction of
density of states at around quasi-Fermi level (cm-3
/eV) implies the decrease of density of trap

82
states.7 Therefore, the efficient ligand passivation using halide reduces the intrinsic trap density
of the PbS CQD film, leading to higher mobility of electron.
The less density of trap states of the bromide capped PbS CQD film is probably attributed
to less exposure to oxygen in the ambient condition, resulting from the efficient atomic ligand
passivation. During the film preparation process, the ligand exchange is performed under
ambient condition, so the PbS CQD is exposed to air. Oxygen in air permeates into the PbS CQD
which was intrinsically n-type, converting the conductivity from n-type to p-type.
The enhanced mobility also can be partially explained by change of the dielectric
property. The dielectric constant (ε) of the bromide capped PbS CQD film was measured by
carrier extraction by linear increasing voltage (CELIV) technique and calculated by below
equation.(Figure 5-7)
Ɛ = 𝑗0𝑑
𝐴Ɛ0
where j0, d, A and Ɛ0 are the displacement current density, the film thickness, the ramp rate of
applied linearly increasing voltage and the vacuum permittivity, respectively (Figure 5-7).
The measured dielectric constant of bromide capped PbS CQD film is 25, which is larger
than 18 of ethanedithiol (EDT) capped film8 or 15 of 1,4-benzenedithiol (1,4-BzDT) capped
film.9 Interestingly, the reduction of the interparticle distance by ligand variation gives rise to the
increase of dielectric constant of PbS CQD. Since the dielectric constant of the bulk PbS film is
175,10
the gradual increase of the dielectric constant via reducing ligand size seems to be a
reasonable trend. The dielectric constant is related to the mobility by following equations.
Based on the capacitance (C) equation, the increase of dielectric constant (Ɛr) leads to the
enhancement of capacitance.
𝐶 = Ɛ0Ɛ𝑟𝐴
𝑑

83
where ,Ɛ0, Ɛr, A and d are the vacuum permittivity, the relative permittivity (dielectric
constant), the area of electrode and the thickness of the sample. Since the capacitance is inversely
correlated with the mobility through following equations, it is apparent that enhancement of
mobility originates from the increase of dielectric constant probably resulting from efficient
interparticle coupling.
𝑛 = 𝐶𝑉𝑔
𝐴
𝑉2
𝑉1
𝑑𝑉𝑔
and
µ = 𝐿𝐼𝑑
𝑊𝑒𝑉𝑑𝑛
where L, Id, W, e, n, A, C, V1 and V2 are the channel length, the drain current, the channel
width, the elementary charge, the accumulated carrier density in the channel, the area of the gate
electrode, the capacitance and the initial and final gate voltages, respectively.
Microsecond time scale transient infrared spectroscopy (TRIR) provides useful
information about the charge carrier recombination dynamics, the density of carriers on
microsecond time scale and the depth of sub-gap states in PbS CQD solid. The TRIR spectra of
the Br- capped film, the MPA capped film and EDT capped film are plotted in Figure 5-8. In the
spectra, two distinct features are observed: broad electronic transition; and vibrational features at
around 0.15-0.2 eV.
The maximum intensity of the TRIR spectra decreases in the order of EDT, MPA and Br
capped films. Given that the TRIR spectra reflect the density of charge carrier, the bromide
capped film has the smallest carrier density at 0.5µs after photoexcitation. The fast decay of the
bromide capped PbS CQD film is also shown in the inset of Figure 5-9.
It is interesting that the mid-IR transition energy is dependent upon the ligand and it is
correlated with the recombination lifetime and the mobility (Figure 5-9 and 5-10). The transition
84
energy difference originates from the different Stokes shift of the samples. The bromide capped
film shows the fastest recombination and the largest mobility. This is because the surface of the
bromide capped PbS CQD is efficiently passivated so the density of trap states is smaller than that
of MPA capped film or EDT capped film,7 leading to the fastest recombination and the largest
mobility.
The observation that the CQD with small density of traps shows small recombination
lifetime is against to the conventional Schokley-Read-Hall recombination theory that the material
with small density of traps shows large recombination lifetime. The opposite result is attributed
to the different types of traps. The Schokley-Read-Hall recombination assumes all traps to be
deep trap where charge carriers cannot escape from, however, the nanoparticle has mainly two
different trap states: shallow traps and deep traps also known as recombination centers.
Especially, the doping density is dominated by shallow traps where the trapped charge carriers
can be promoted to delocalized states when efficient external energy is applied. Therefore, there
is discrepancy between our result and the Schokley-Read-Hall recombination theory.
Other halide ligands were examined as well (Figure 5-11). Chloride (Cl-) capped PbS
CQD film, iodide (I-) capped PbS CQD film and the Cd
2+ treated bromide capped PbS CQD film
were measured and it turned out that they are not much different from the bromide.
In combination with the mobility measurement, mobility-lifetime products were obtained
for Br- capped PbS film, MPA capped PbS film and EDT capped PbS film. The mobility-lifetime
products of the ligand treated PbS CQD films are enhanced by a factor of 20 by varying the
ligands used to treat the films from EDT to bromide. Simultaneously, the power conversion
efficiency of the devices improved from 1.7 % (EDT) to 6.0% (Br-). Furthermore, the short-
circuit currents and the open circuit voltage were improved, primarily due to reduction of the trap
densities in the films.
85
The dramatic increase of the short-circuit current can be understood in terms of changes
of the exciton binding energy (Eb) and enhancement of diffusion length, which are involved with
charge carrier generation and collection. The exciton binding energy is involved with charge
generation. Since the exciton binding energy is inversely proportional to the dielectric constant of
material, an exciton of a material with large dielectric constant is efficiently dissociated to
produce charge carrier.
𝐸𝑏 =µ𝑒4
2ħ2Ɛ2=
ħ2
2µ𝑎𝐵2 and 𝑎𝐵 =
ħ2Ɛ
µ𝑒2
where µ, e, ħ, Ɛ, aB are the reduced mass, the elementary charge, the reduced Planck constant, the
dielectric constant (Ɛ0Ɛr) and the Bohr radius, respectively.10
The binding energies for the hybrid,
Br-, EDT and 1,4-BzDT capped PbS CQDs were obtained. The hybrid capped PbS CQD (Ɛ =
40), the Br capped PbS CQDs (Ɛ = 25), the EDT capped PbS CQDs (Ɛ =18) and the 1,4-BzDT
capped PbS CQDs (Ɛ =15) have the exciton binding energies of 1.34 meV, 3.42 meV, 6.60 meV
and 9.50 meV, respectively. By changing the ligand passivation strategy, the exciton binding
energy is varied due to the change of dielectric constant. Therefore, the increase of the short-
circuit current can be partially understood by the ligand dependent exciton binding energy.
Diffusion occurs in the quasi-neutral region where the built-in-potential is negligible.
This is the identical condition to the short circuit which has zero electrical potential. Therefore,
the increase of diffusion length enables more charge carriers to reach electrodes, leading to larger
short-circuit currents. Consequently, the increase of the short-circuit current results from the
decrease of the exciton binding energy related to carrier generation and from the enhanced
mobility-lifetime product involved with charge harvesting.

86
5.3 Conclusion
In conclusion, we revealed the fundamental photophysical properties of atomic ligand
passivated PbS CQD film, reasoning the world record high power conversion efficiency of 6.0%
in colloidal quantum dot solar cell.
Especially, the microsecond transient infrared spectroscopy offered information of not
only the charge recombination dynamics but also the density of charge carriers in the
microsecond time scale at the sub-gap state which is strongly coupled to the surface. By
combining the charge carrier mobility with the density of doping states, it was revealed that the
PbS CQD film with less trap density has faster recombination and higher mobility. The mobility-
lifetime products of the bromide capped film, the MPA capped film and the EDT capped film
were obtained and the mobility-lifetime product of the bromide shows a 20-fold increase
comparing to that of the EDT capped film. The enhancement of mobility-lifetime product was
reflected in the short-circuit current, the open-circuit voltage and the power conversion efficiency.

87
Figure 5-1. Atomic ligand passivation. Cd2+
cations of Cd-TDPA passivate S2-
dangling
bonds of PbS CQD at S1 step and the OA is replaced by bromide using CTAB at S2 step.

88
Figure 5-2. Infrared spectra of PbS CQDs before and after ligand exchange.

89
Figure 5-3. Scanning transmission electron microscopy (STEM) images of oleic acid
capped PbS CQD (A), EDT capped PbS CQD (B), MPA capped PbS CQD (C) and Br capped
PbS CQDs (D). From the images, the interparticle distances of each samples were measured: 2.1
nm of EDT capped PbS CQD; 1.8 nm MPA capped PbS CQD; 1.0 nm Br capped PbS CQD.

90
Figure 5-4. Near-infrared absorption spectra of oleic acid capped PbS CQD and
transmission spectra for Br, Cl and I capped PbS CQD film.

91
Figure 5-5. Near-infrared absorption spectra of Br, MPA, 1,4-BzDT, BDT and EDT
capped PbS CQD films. As decreasing ligand size, bandgap peak becomes broaden and red-
shifted.

92
Figure 5-6. Id-Vg (black) and C-Vg (red) curves of hybrid capped PbS CQD film.

93
Figure 5-7. Charge Extraction via a Linearly Increasing Voltage (CELIV) measurement
of Br capped PbS CQD film. Dielectric constant of the Br capped PbS CQD film was measured
to be 25±2.

94
Figure 5-8. Transient infrared spectra of Br, MPA and EDT capped PbS CQD films at
0.5 µs after photoexcitation with 532 nm pump pulse.

95
Figure 5-9. The average decay times of the trap-to-band transitions in PbS CQD films
are strongly correlated with the average mid-infrared transition energies

96
Figure 5-10.The mobilities of electrons in PbS CQD films are also strongly correlated
with the average mid-infrared transition energies.

97
Figure 5-11. Microsecond transient infrared spectra of halide capped PbS CQD film (Br,
Cl and I)

98
Table 5-1. X-ray photoelectron spectroscopy (XPS) analysis of elemental atomic
percentage
Sample Pb 4f S 2s Br 3d
Br- capped PbS 48.4 % 33.8 % 17.8 %
Table 5-2. Binding energy and dielectric constant correlation11
Ɛr Binding energy (meV) Approximate Radius (nm)
KCl 4.6 580 3
CuCl 5.6 190 7
Cu2O 7.1 150 7
Si 11.4 12 50
GaAs 13.1 4 150

99
5.4 Reference
1Klem, E. J. D.; Shukla, H.; Hinds, S.; MacNeil, D. D.; Levina, L.; Sargent, E. H. Impact of
Dithiol Treatment and Air Annealing on the Conductivity, Mobility and Hole Density in PbS
Colloidal Quantum Dot Solids. Appl. Phys. Lett., 2008, 92, 212105.
2Luther, J. M. et al Schottky Solar Cells Based on Colloidal Nanocrystal Films. Nano Lett., 2008,
8, 3488-3492.
3Talapin, D. V.; Murray, C. B. PbSeNanocrystal Solids for N- and P- Channel Thin Film Field-
Effect Transistors. Science, 2005, 310, 86-89
4Koleilat, G. I. et al Efficient, Stable Infrared Photovoltaics Based on Solution-cast Colloidal
Quantum Dots. ACS Nano, 2008, 2, 833-840.
5Pattantyus-Abraham, A. G.; Kramer, I. J.; Barkhouse, A. R.; Wang, X.; Konstantatos, G.;
Debnath, R.; Levina, L.; Raabe, I.; Nazeeruddin, M. K.; Gratzel, M.; Sargent, E. H. Depleted-
Heterojunction Colloidal Quantum Dot Solar Cells. ACS Nano, 2010, 4, 3374-3380.
6Tang,J; Kemp,K. W.; Hoogland, S.; Jeong, K.S.; Liu, H.; Levina, L.; Furukawa, M.; Wang, X.;
Debnath, R.; Cha, D.; Chou, K.W.; Fischer, A.; Amassian, A.; Asbury, J.B.; Sargent, E. H.
Colloidal-quantum-dot photovoltaics using atomic-ligand passivation. Nature Mater.2011, 10,
765–771
7 Ip, A. H.; Thon, S. M.; Hoogland, S.; Voznyy, O.; Zhitomirsky, R.; Debnath, R.; Levina, L.;
Rollny, L. R.; Carey, G. H.; Fischer, A.; Kemp, K. W.; Kramer, I. J.; Ning, Z.; Labelle, A. J.; Wei
Chou, K.; Amassian, A.; Sargent, E. H. Hybrid Passivated Colloidal Quantum Dot Solids Nature
Nanotech.,2012, 7, 577-582.
8Tang, J.; Brzozowski, L.; Barkhouse, D. A. R.; Wang, x.; Debnath, R.; Wolowiec, R.; Palmiano,
E.; Levina, L.; Pattantyus-Abraham, A.G.; Jamakosmanovic, D.; Sargent E. H. Quantum Dot

100
Photovoltaic in the Extreme Quantum Confinement Regime: The Surface-Chemical Origins of
Exceptional Air- and Light-Stability. ACS Nano, 2010, 4, 869-878.
9Koleilat, G. I.; Levina, L.; Shukla, H.; Myrskog, S. H.; Hinds, S.; Pattantyus-Abraham, A. G.;
Sargent, E. H. Efficient, Stable Infrared Photovoltaics Based on Sollution-Cast Colloidal
Quantum Dots ACS Nano, 2008, 2, 833-840.
10 Dvorak, M.; Wei, S. H.; Wu, Z. Origin of the Variation of Exciton Binding Energy in
Semiconductors. Phys. Rev. Lett., 2013, 110, 016402.
11Snoke, D. W. Solid State Physics: Essential Concepts; Addison-Wesley: San Francisco, 2009.

101
Chapter 6 Improvement of charge transport in organic photovoltaic
materials by tuning dielectric properties
6.1 Introduction
We learned from previous chapters that the dielectric property of colloidal quantum dots
used as photovoltaic material influences the charge carrier mobility. In this work, we investigated
charge carrier dynamics by varying the dielectric property in organic photovoltaic materials.
Organic photovoltaic materials consist of an electron donor and an electron acceptor material.
Charge carriers are generated in the electron donor domain under photoexcitation and transfer
into electron acceptor domain. In the transport process, not all charge carriers move into the
electron acceptor domain. Some carriers recombine through geminate and bimolecular
recombination processes, dissipating the photon energy either radiatively or non-radiatively. The
recombination process is a significant loss mechanism in solar cell device performance.
Recombination processes can be reduced by limiting the thickness of organic photovoltaic active
layers to approximately 100 nm.1,2,3,4
The transit time of charge carriers is faster than the
recombination lifetime in such a thin layer, enabling efficient charge collection.5 However, such
a thin layer is not desirable for charge generation because a thicker layer is required to absorb all
of the incident photons. In particular, the extinction coefficient of the electron donor significantly
decreases at long wavelength range. The regioregularpoly(3-hexylthiophene) (P3HT) and
phenyl-C61-butyric acid methyl ester (PCBM) organic photovoltaic material are exceptions since
thicker active layers are available due to the relatively long recombination lifetime despite of the
high carrier mobility. This behavior, known as non-Langevin behavior, has been sought to
improve device performance of organic photovoltaic materials. According to the Langevin
theory,6 bimolecular recombination is determined by an effective lifetime (τ)

102
1/
/ ( (0) )n
where γ is an empirical disorder parameter, n(0) is the initial charge carrier density and β
is the Langevin coefficient. The Langevin coefficient β is proportional to the spatially averaged
carrier mobility divided by the spatially averaged dielectric permittivity, / . The
lifetime is dependent upon an empirical disorder parameter, γ, and inversely correlated to the
initial charge carrier density, n(0). When assuming that the disorder parameter is not significant
(γ =1), the mobility-lifetime product (µτ) is proportional to the spatially averaged dielectric
constant (ε) and inversely correlated to the initial carrier density (n(0)). According to the
equations of diffusion ( 𝑙𝑑𝑖𝑓𝑓𝑢𝑠𝑖𝑜𝑛 = 𝑘𝑇µτ
𝑒 ), the mobility-lifetime product (µτ) determines the
diffusion length at room temperature. Hence, an increase in mobility-lifetime product enables a
thicker active layer in the OPV device, leading to higher power conversion efficiency (PCE).
Here, we investigated bimolecular charge recombination processes using microsecond
transient infrared spectroscopy (TRIR).7 In order to analyze how the mobility-lifetime product
influences the OPV device performance, charge carrier mobilities were measured via
collaborative work with Dr. Enrique Gomez's group in the Department of Chemical Engineering
at Penn State University. Furthermore, the dielectric properties of the polymer blends were finely
tuned for analysis of the dielectric change effect on the mobilty-lifetime product and device
performance. Fine dielectric property control was possible using a specially synthesized polymer
named M-TQ1 (Figure 6-1) synthesized by collaborators in Dr. Qing Wang’s group in the
Department of Materials Science and Engineering at Penn State University. The M-TQ1 has
oligo-ethylene oxide chains to allow the Li ion to spread uniformly in it. Strikingly, we observed
a 35-fold enhancement of the mobility-lifetime product by increasing the dielectric constant by

103
addition of the Li ion salt. The increase in both recombination lifetime and mobility is consistent
with studies of Grätzel and coworkers with solid state dye sensitized solar cells.8910
6.2 Results and Discussion
M-TQ1 is the semiconducting polymer used as the electron donor in this work. The
backbone structure of M-TQ1 was inspired by the work of Andersson and coworkers who
reported 6% power conversion efficiency using an octyloxy side chain polymer.11
The
polyethylene glycol side chains of M-TQ1 are tethered to the conjugated backbone structure for
uniform distribution of bis(trifluoro-methyl-sulfonyl)imide lithium salt (LiTFSI) ionic compound.
Dielectric functions for LiTFSI doped M-TQ1 film with varying doping density were measured
by using impedance spectroscopy at frequency range of 2-20 MHz (Figure 6-2). The relative real
dielectric function was calculated from the below equation,
2 2' '/ ( ") ( ')z C z z
where z' is the real impedance, is the angular frequency, C is the capacitance of the empty cell,
(0 /C A d , o is the permittivity of vacuum, A is the area of the electrode, d is the thickness of
the sample) and z'' is the imaginary impedance. Figure 6-2 (A) displays the real dielectric
functions of M-TQ1 polymer films with Li+/O ratio of 0, 0.01 and 0.015. The static dielectric
constant of pure M-TQ1 is about 4 at 1 kHz, which is slightly greater than that of P3HT.12
The
increase of the dielectric constant is caused by the oligo-ethylene oxide side chain of M-TQ1.
Addition of the Li ion to the M-TQ1 polymer enhances the dielectric constant to ~140.
Interestingly, while the static dielectric constant does not noticeably change at 1 kHz with
increase of Li ion concentration from Li+/O of 0.010 to Li
+/O of 0.015, the dielectric function of
the highest Li+/O (0.015) is larger than that of the lowest Li
+/O (0.010) at high frequency range. It

104
is worth to note that the sample films were kept under nitrogen atmosphere to avoid oxygen or
water exposure so the dielectric feature of water molecule, the rapid increase at lower frequency
due to electrode polarization, is not seen at the measured dielectric functions.13
Figure 6-2(B) represents the real impedance functions of the pure and the Li ion doped
(0.010 and 0.015 in Li+/O) M-TQ1 films. The pure M-TQ1 film shows much higher impedance
than that of doped polymers at low frequency (< 1kHz), meaning that the charge carrier density is
relatively lower than that of Li ion doped films. With increase of Li ion concentration from 0 to
0.010, the real impedance is reduced, reflecting the increase of carrier concentration in the film.
With all observations, it was confirmed that the LiTFSI addition to M-TQ1 increases the
dielectric permittivity of the M-TQ1 polymer film.
Mobilities of the pure and the Li ion doped M-TQ1 films were measured using a thin film
transistor. Figure 6-3 shows the source-drain current ISDas a function of gate voltage Vgfor 0,
0.05, 0.010 and 0.015 Li+/O M-TQ1 films. ISD increases in both negative and positive gate
voltage range as Li ion concentration increases. The calculated mobility at VSD = -50V indicates
that the hole mobility increases by two orders of magnitude at 0.015 Li+/O.
Bimolecular recombination kinetics in the M-TQ1 PCBM polymer blend were examined
using TRIR spectroscopy (Figure 6-4).The compound ratio of M-TQ1and PCBM is 1:3 which is
the optimized ratio for the best PCE (1.1 %). In TRIR, a 10 ns duration 532 nm pump excites the
polymer blend film and broad featureless polaron absorption in the mid-IR region is probed at 0.5
µs after photoexcitation(inset of Figure 6-4).14
The featureless polaron kinetic decay was
measured at 1700 cm-1
. The lifetime increases with increasing salt concentration: 16 µs for 0
(Li+/O),101µs for 0.005 (Li
+/O),119µs for 0.010 (Li
+/O), and 133µs for 0.015 (Li
+/O). Multi-
exponential fit functions were used to obtain the kinetic data and the fit functions were
convoluted with the instrument response function. The mobility and bimolecular recombination
lifetime are plotted in Figure 6-5 (A). By varying the Li ion concentration, the mobility changes

105
by over two orders of magnitude and the bimolecular recombination lifetime varies by a factor of
8. Mobility-lifetime products are obtained for each sample and plotted in Figure 6-5
(B).Surprisingly, the mobility-lifetime product shows proportionality to the Li+/O concentration,
indicating that the increase of dielectric constant leads to larger mobility-lifetime product.
Steady state visible absorption and photoluminescence (PL) emission spectra were
obtained for various Li ion concentration films. Figure 6-6 displays the optical bandgap
absorption spectra of pure M-TQ1 film, 0.010 Li/O doped M-TQ1 film, M-TQ1 PCBM 1:1 blend
and 0.010 Li/O doped M-TQ1 PCBM blend film. The result suggests that neither the Li ion salt
addition nor PCBM addition makes any difference in the bandgap absorption spectra. The
insensitive bandgap absorption implies that the conjugated framework of the polymer is not
significantly perturbed by formation of Li+-poly ethylene glycol complex. In contrast, the PL
emission spectra in Figure 6-7 are very sensitive to the Li ion addition and, moreover, the PCBM
addition induces blue-shift of 8 nm. The blue-shift is frequently observed in conjugated polymer
blends and has been attributed to disruption of inter-chain interaction in the polymer. The
discrepancy between the absorption spectra and PL spectra can be explained by sensitivity for
irregular structure. The absorption spectra are not sensitive to the surface defect or morphological
disruption since the excitonic transition is mostly involved with delocalized states of the
conjugated backbone. The PL emission, however, is capable of reflecting the irregular structure
effect since it is sensitive to the localization state arising from branch structure. Therefore, we
believe that the difference in bandgap absorption and emission spectra results from the polaron
generated by inhomogeneous disruption of polymer blend morphology due to the addition of Li
salt. We believe that the blue-shift in PL may result from the shift of the effective Fermi energy
closer to the valence band due to the increase of density of positive polaron.
Time-correlated single photon counting (TCSPC) experiments were conducted to
examine the effect of dielectric property change in exciton lifetime in the M-TQ1 film. The

106
exciton lifetime of pure M-TQ1 film and 0.010 Li+/O doped M-TQ1 film were measured to be 82
and 77 ps, respectively. Considering the doping density of the Li ion (1020
cm-3
), the small change
of exciton lifetime is surprising comparing with prior results with charged species in organic
semiconductors.1516171819
To note, prior studies examined ionic species that arose form or gave rise
to defects in the molecular structures of the organic materials. For instance, Gregg and co-
workers discovered a significant density of p-type and n-type defects in P3HT layers originating
from polymer conformations that strain the π-bond system of the conjugated backbone. The p-
type defects decreased by 400-fold, leading to a doubling of the exciton diffusion length and an
order of magnitude increase in the hole mobility. Similarly, charge defects due to injection of
holes or migration of metal ions in AlQ3 layers in OLEDs give rise to disruption of the molecular
structure of the light emitting layers with corresponding loss of electro-and PL efficiency. As
opposed to works by others, our Li ion doping does not produce significant changes in the
conjugated framework of the polymer as exhibited by the unchanged absorption spectra after
adding Li ion salt. The small exciton lifetime change is consistent with negligible perturbation of
the conjugated framework observed in the absorption spectra.
The morphology of the M-TQ1 PCBM blend was examined by using energy filtered
transmission electron microscopy (TEM). Figure 6-8displays a carbon map of the M-TQ1 PCBM
1:3 polymer blend. The light and dark gray domains represent carbon-rich domains corresponding
to the PCBM domain and the M-TQ1 polymer domain, respectively. Interestingly, the M-TQ1
polymer domain is significantly separated from the PCBM domain in macroscale, which is not
desired. The approximately 500 nm scale phase separation implies that only about 10 % of the M-
TQ1 in the blends is within the ~10 nm exciton diffusion length of the PCBM-rich phase.
Therefore, the addition of PCBM has not a significant impact on approximately 90 % of the M-
TQ1 in the polymer blend. The PL decay of the blend film appearing in Figure 6-7 should be

107
dominated by the majority component of the polymer that is center of the macroscale PCBM
domain.
In order for efficient charge separation at the interface, the M-TQ1 and PCBM should be
homogeneously distributed. The lack of interface area between M-TQ1 and PCBM is reflected in
the device performance. The M-TQ1 PCBM 1:3 polymer blend film achieved 1.1% power
conversion efficiency (PCE). That is, the addition of Li ion salt did not result in an increase of
PCE. The inconsistency between the mobility-lifetime product and the PCE is attributed to the
lack of interface area between M-TQ1 and PCBM domains.
108
6.3 Conclusion
In conclusion, the dielectric property of M-TQ1 was investigated using various optical
and electrical methods. The dielectric property of M-TQ1 polymer film was varied by addition of
lithium bis(trifluoromethanesulfonyl)imide (LiTFSI) serving as the lithium ion source to the
electron donor polymer. M-TQ1 is optimally designed for the uniform distribution of the lithium
ion by tethering a 10 ethylene glycol structure to the backbone structure.
The dielectric property was quantified by using impedance spectroscopy. In order to
scrutinize the influence of dielectric property change on the optical property of M-TQ1, time-
correlated single photon counting, microsecond transient infrared spectroscopy, steady state
visible absorption and photoluminescence spectroscopy were utilized.
In combination with thin-film-transistor technique, the mobility-lifetime products of pure
M-TQ1 film and Li ion doped M-TQ1 films were measured. The mobility-lifetime product was
substantially enhanced with increasing dielectric constant. The energy filtered transmission
electron microscopy (TEM) demonstratedmacroscale phase separation in the M-TQ1 and PCBM
polymer blend, which is the reason why the device performance is not correlated with the
mobility-lifetime product. This result suggests that the mobility-lifetime product is very
sensitivetothemorphology of the material. For future work, it will be necessary to enhance the
interaction between the hydrophilic side chain and the hydrophobic PCBM molecule by addition
of more polarizable amphiphilic ionic compound or by attenuating the hydrophilicity of side
chain to minimize macroscale phase separation.

109
Figure 6-1.Structure of M-TQ1, Lithium Bis(Trifluoromethanesulfonyl)Imide (LiTFSI)
and Phenyl-C61-Butyric-Acid-Methyl Ester (PCBM).
M-TQ1 LiTFSI PCBM

110
Figure 6-2. Real dielectric functions (A) and real impedance functions (B) of M-TQ1
(red), 0.010 Li+/O (black), 0.015 Li+/O (green) doped M-TQ1 films.

111
Figure 6-3. Source-drain current, ISD, versus gate voltage, Vg, measured in thin films of
M-TQ1 doped with various concentrations of LiTFSI. The off current at positive gate voltage
increases substantially with lithium ion doping.

112
Figure 6-4. Charge recombination kinetics decays of 1:1 by mass of M-TQ1 PCBM
polymer blend doped with various concentrations of lithium ions. The transient signal arises
from the polaron absorption in the polymer phase measured at 1700 cm-1
, shaded region within
the inset. The gray curve represents the instrument response function (IRF) used to deconvolute
the kinetic decays. The data indicate slower charge recombination dynamics with increasing
lithium ion concentration.

113
Figure 6-5.(A)Li ion dependent mobility and bimolecular recombination lifetime of M-
TQ1 polymer film.(B)Both the hole mobility and recombination lifetime give rise to large
increases of the mobility-lifetime product.

114
Figure 6-6.The absorption spectrum of a film of Li-doped M-TQ1 is almost identical to
that of pure M-TQ1.

115
Figure 6-7. Steady-state fluorescence spectra of the pure M-TQ1, 0.010 Li+/O doped M-
TQ1, M-TQ1/PCBM 1:1 blend by mass and 0.010 Li+/O doped M-TQ1/PCBM 1:1 blend by
mass.

116
Figure 6-8. Time correlated single photon counting decays of M-TQ1 films in the
presence and absence of lithium ions are displayed. Interestingly, the exciton lifetime in M-TQ1
is not significantly affected by the presence of Li ions. Addition of PCBM to the pure polymer
film causes a modest decrease in the exciton lifetime.

117
Figure 6-9. Energy filtered TEM image of a 1:3by massM-TQ1 PCBM polymer blend.
The image shows a carbon map such that the lighter gray regions correspond to the PCBM-rich
phase and the dark gray correspond to the M-TQ1 domain. The image represents that M-TQ1
and PCBM undergo macroscopic phase separation.

118
6.4 Reference
1Chen, M.-H.; Hou, J.; Hong, Z.; Yang, G.; Sista, S.; Chen, L.-M.; Yang, Y. Efficient Polymer
Solar Cells with Thin Active Layers Based on Alternating Polyfluorene Copolymer/Fullerene
Bulk Heterojunctions. Adv. Mater. 2009, 21, 4238-4242.
2Chen, H.-Y.; Hou, J.; Zhang, S.; Liang, Y.; Yang, G.; Yang, Y.; Yu, L.; Wu, Y.; Li, G. Polymer
Solar Cells with Enhanced Open-circuit Voltage and Efficiency. Nature Photonics 2009, 3, 649-
653.
3Zhang, Y.; Hau, S. K.; Yip, Y.-L.; Sun, Y.; Acton, O.; Jen, A. K.-Y. Efficient Polymer Solar
Cells Based on the Copolymers of Benzodithiophene and Thienopyrroledione. Chem.
Mater.2010, 22, 2696-2698.
4Wienk, M. M.; Turbiez, M.; Gilot, J.; Janssen, R. A. J. Narrow-Bandgap Diketo-Pyrrolo-Pyrrole
Polymer Solar Cells: The Effect of Processing ont he Performance. Adv. Mater.2008, 20, 2556-
2560.
5Park, S.; Roy, A.; Beaupre, S.; Cho, S.; Coates, N.; Moon, J. S.; Moses, D.; Leclerc, M.; Lee, K.;
Heeger, A. J. Bulk Heterojunction Solar Cells with Internal Quantum Efficiency Approaching
100% Nature Photonics 2009, 3, 297-303.
6Langevin, P. Ann. Chem. Phys.1903, 28, 289-384.
7Pensack, R. D.; Banyas, K. M.; Asbury, J. B.; Charge Trapping in Organic Photovoltaic
Materials Examined with Time Resolved Vibrational Spectroscopy J. Phys. Chem.C, 2010, 114,
5344-5350.
8Kruger, J.; Plass, R.; Cevey, L.; Piccirelli, M.; Gratzel, M. High Efficiency Solid-state
Photovoltaic Device due to Inhibition of Interface Charge Recombination. Appl. Phys. Lett.2001,
79, 2085-2087.

119
9Snaith, H. J.; Gratzel, M. Enhanced Charge Mobility in a Molecular Hole Transpoter via
Addition of Redox Inactive Ionic Dopant: Implication to Dye-sensitized Solar Cells. Appl. Phys.
Lett.2006, 89, 262114(262113).
10Snaith, H. J.; Schmidt-Mende, L.; Gratzel, M. Light Intensity, Temperature, and Thickness
Dependence of the Open-circuit Voltage in Solid-state Dye-sensitized Solar Cells. Phys. Rev. B
2006, 74, 045306 (045306).
11Wang, E.; Hou, L.; Wang, Z.; Hellstrom, S.; Zhang, F.; Inganas, O.; Andersson, M. R. An
Easily Synthesized Blue Polymer for High-Performance Polymer Solar Cells. Adv. Mater.2010,
22, 5240-5244.
12Knipper, M.; Parisi, J.; Coakley, K. M.; Waldauf, C.; Brabec, C. J.; Dyakonov, V. Zeitschrift
Naturforsh.2007, 62, 490-494.
13Klein, R. J.; Zhang, S.; Dou, S.; Jones, B. H.; Colby, R. H.; Runt, J. Modeling Electrode
Polarization in Dielectric Spectroscopy: Ion Mobility and Mobile Ion Concentration of Single-ion
Polymer Electrolytes. J. Chem. Phys.2006, 124, 144903-144908.
14Sheng, C.-X.; Tong, M.; Singh, S.; Vardeny, Z. V. Experimental Determination of the
Charge/neutral Branching Ratio ƞ in the Photoexcitation of π-conjugated Polymers by Broadband
Ultrafast Spectroscopy. Phys. Rev. B 2007, 75, 085206(085207).
15Liang, Z.; Nardes, A.; Wang, D.; Berry, J. J.; Gregg, B. A. Defect Engineering in π-Conjugated
Polymers. Chem. Mater.2009, 21, 4914-4919.
16Aziz, H.; Popovic, Z. D. Degradation Phenomena in Small-Molecule Organic Light-Emitting
Devices. Chem. Mater.2004, 16, 4522-4532.
17Kondakov, D. Y.; Sandifer, J. R.; Tang, C.; Young, R. H. Nonradiative Recombination Centers
and Electrical Aging of Organic Light-emitting Diodes: Direct Connection Between
Accumulation of Trapped Charge and Luminance Loss. J. Appl.Phys. 2003, 93, 1108-1119.

120
18Popovic, Z. D.; Aziz, H.; Ioannidis, A.; Hu, N.-X.; dos Anjos, P. N. M.Time-resolved
Fluorescence Studies of Degradation in tris(8-hydroxyquinoline) Aluminum (AlQ3)-based
Organic Light Emitting Devices (OLEDs). Synthetic Metals 2001, 123, 179-181.
19Lee, S. T.; Gao, Z. Q.; Hung, L. S. Metal Diffusion from Electrodes in Organic Light-Emitting
Diodes. Appl. Phys. Lett. 1999, 75, 1404-1406.

121
Chapter 7 Conclusion
7.1 Summary
In conclusion, we found how the fundamental photophysical properties of photovoltaic
materials influence solar cell device performance using optical and electrical methods. In
chapters3,4 and 5, various optical methods including UFIR and TRIR spectroscopy were
discussed that reveal the origin of Stokes-shifted sub-gap state in PbS CQD solid. Investigations
combining with temperature dependent TRIR, transient photoconductivity and short-circuit
current measurements revealed that the Stokes-shifted sub-gap state is the charge transport state
in the highest efficiency PbS CQD solar cells.
The mobility-lifetime products were measured for various ligand capped PbS CQD
solids. It was found that efficient ligand passivation strategies lead to increased mobility-lifetime
products and device performance. The mobility-lifetime product determines the diffusion length
in the quasi-neutral region, which in turn affects device performance. By comparing the density
of trap states, it was realized that the mobility-lifetime product is inversely proportional to the
density of trap states.
In chapter 6, we examined the dielectric permittivity dependent mobility-lifetime product
of organic photovoltaic materials.M-TQ1, a polymer specially designed for this work, was used
as the electron donor polymer and PCBM was used as the electron acceptor molecule. We found
that the increase of dielectric permittivity of M-TQ1 PCBM polymer blend by addition of LiTFSI
salt gives rise to dramatic enhancement in mobility-lifetime product. However, the enhancement
of mobility-lifetime product was not reflected in the power conversion efficiency. The macroscale
phase separation in the M-TQ1 PCBM polymer blend arising from the 10 oligo-ethylene oxide

122
was the main reason for the discrepancy between the mobility-lifetime product and the device
performance.
7.2 Future direction
7.2.1 Bias controlled transient two dimensional infrared spectroscopy (BT2DIR)
As shown in chapters 3, 4 and 5, the optical and electrical properties are very sensitive to
the ligand passivation strategy. Therefore, it is critical to scrutinize the surface environment of
colloidal quantum dots using especially high sensitive optical approach such as the two
dimensional infrared (2D-IR) spectroscopy. Dimercaptoamide (DMA), which is not
commercially available and so was synthesized by the author, includes an amide bond in the
middle of the molecule and two thiols at each end. The amide bond is frequently used in biology
since it is the base of protein structure. Reports on protein folding dynamics using 2D-IR
spectroscopy show that vibrational modes of the amide bond are very sensitive to the surrounding
electrical potential, and therefore, the amide bond is frequently used as a probe.1Similarly, we
could examine vibrational modes of DMA to probe the surface environment of colloidal quantum
dot solids in the presence and absence of charge carrier, which will enable us to better understand
the carrier transport and trapping mechanism.
Preliminary result
The DMA ligand was synthesized through the following synthesis scheme.

123

124
Figure 7-1 represents the H-NMR of DMA molecule. The triplet, quartet, broad peaks of
DMA are present in the spectrum. The linear infrared absorption spectrum of the DMA capped
PbS CQD film was obtained as presented in Figure 7-2. The peaks at 1650cm-1
and 1550cm-1
represent C=O stretching mode of DMA (Amide I) and N-H bending mode (Amide II) of DMA
molecule. The H-NMR and linear IR spectra indicate that the DMA molecule was successfully
synthesized and bound to the surface of PbS CQDs via ligand exchange process.
The broadband infrared pump and infrared probe spectroscopy was performed to examine
the DMA capped PbS CQD films. A 200 fs duration mid-IR pump pulse excites the vibrational
manifold of the amide bond in the DMA molecule followed by a 200 fs duration mid-IR probe
pulse interacting with the excited DMA molecule. The bleach feature of the amide bond appears
at 1658 cm-1
and the new absorption peak arising from the perturbed DMA ligand is observed at
1620 cm-1
. The 1658 cm-1
indicates that the amide I bond is randomly bound to the surface of PbS
CQDs.
The broadband infrared pump and probe spectrum shows the possibility of using the
DMA molecule as a probe for bias controlled transient two dimensional infrared spectroscopy
(BT2DIR) in Figure 7-3. The BT2DIR is probing the charge transfer and trapping dynamics using
the electrical potential sensitive DMA probing molecule. By varying the Fermi energy level, the
bleach of DMA is expected to change under photoexcitation. Since it was revealed that the Stokes
shifted sub-gap state is coupled to the surface, the coherence between the Stokes-shifted sub-gap
state and the trap state (surface) should be probed.
125
The device geometry and setup for the BT2DIR are illustrated in Figure 7-4. The sample
cell consists of the semi-infrared transparent palladium electrode/ PbS CQD film/ Au electrode.
7.2.2 Time-resolved photoluminescence spectroscopy (TRPL)
TRPL will be able to probe the electron and hole recombination process through femto
to nano second time scale where a variety of photophysical events occur. The TRPL measurement
will clarify how the hole contributes to the photocarrier dynamics at very fast time scale
comparing to the result of ultrafast transient infrared spectra probing mainly electron dynamics.
TRPL is also capable of providinghow the surface passivation is involved in hole dynamics. In
combination with ultrafast transient infrared spectroscopy, it will be able to quantify how the
electron and hole dynamics are affected by ligand passivation.This approach was inspired by the
work done by Victor KilimovonCdSe/ZnS colloidal quantum dots. 2

126
Figure 7-1. H-NMR of dimercaptoamid (DMA)

127
Figure 7-2. Linear infrared spectrum of DMA

128
Figure 7-3. Broad infrared pump probe spectrum of DMA capped PbS CQD film.

129
Figure 7-4. Device geometry of BT2DIR

130
7.3 Reference
1DeFlores, L. P.; Ganim, Z.; Nicodemus, R. A.; Tokmakoff, A. Amide I'-II' 2D IR Spectroscopy
Provides Enhanced Protein Secondary Structural Sensitivity J. Am. Chem. Soc., 2009, 131, 3385-
3391.
2Klimov, V. I.; Mikhailovsky, A. A.; McBranch, D. W. Mechanisms for Intraband energy
relaxation in semiconductor quantum dots: The role of electron-hole interactions Phys. Rev.
B,2000, 61, 13349-13352)

131
Appendix
Extension power law fit function
𝑓 𝑡 = 𝐴1 × 1 − exp −𝑡
𝜏1 − 𝐴2 × 1 − exp −
𝑡
𝜏2 + (1 − 𝐴1 − 𝐴2)
× 1
𝑡
𝜏3 𝛾
+ 1
where A1, A2 are prefactor of two rising fit functions. Since the photophysical
phenomenon is associated with two charge carriers, power law function was used for fitting.γ is
the extention power representing the inhomogeneity of quantum dot.

VITA
Kwang Seob Jeong
Education
B.S. in Chemistry, Korea University, Seoul, Korea (2007)
2008-2013 Chemistry Ph.D., The Pennsylvania State University, University Park, PA,
USA Advisor: Prof. John B. Asbury
Publication
Kyle W. Kempǂ, Kwang S. Jeong
ǂ, Jihye Kim, OleksandrVoznyy, Sjoerd Hoogland,
Susanna M. Thon, Alex H. Ip, Robert J. Stewart, Edward H. Sargent and John B. Asbury
Stokes Shifted Sub-gap State Mediate Photocarrier Transport in Colloidal Quantum Dot
Solids. Submitted to Nature Communications.
Kwang S. Jeong, Jiang Tang, Huan Liu,, Jihye Kim, Andrew W. Schaefer, Kyle Kemp,
Larissa Levina, Xihua Wang, Sjoerd Hoogland, RatanDebnath, Lukasz Brzozowski,
Edward H. Sargent, and John B. Asbury Enhanced Mobility-Lifetime Products in PbS
Colloidal Quantum Dot Photovoltaics.
ACS Nano, 2012, 1, 89-99
Kwang S. Jeong, Ryan D. Pensack, John B. Asbury Vibrational Spectroscopy of
Electronic Processes in Emerging Photovoltaic Materials.
Account Chemical Research ASAP
Jiang Tang, Kyle M. Kemp, Sjoerd Hoogland, Kwang S. Jeong, Huan Liu, Larissa
Levina, Melissa Furukawa, Xihua Wang, Ratan Debnath, Dongkyu Cha, Kang Wei
Chou, Armin Fischer, Aram Amassian, John B. Asbury, Edward H. Sargent
Colloidal Quantum Dot Photovoltaics Using Atomic Ligand Passivation.
Nature Materials 2011, 10, 765-771