electron beam divergence measurements at low energies...
TRANSCRIPT

ELECTRON BEAM DIVERGENCE MEASUREMENTS AT LOW ENERGIES USING A NOVEL OPTICAL DIFFRACTION RADIATION TRANSMISSION
INTERFEROMETER
A.G. Shkvarunets, R.B. Fiorito, P. G. O'Shea, IREAP, University of Maryland, College Park, MD 20742, USA
J.G. Power, M.E. Conde and Wei Gai, ANL, Argonne, IL 60439, USA
Abstract
We have used an optical diffraction-transition radiation interferometer (ODTRI) in a transmission mode to measure the divergence of the low energy 8 MeV ANL-AWA electron beam. The interferometer employs a metallic micromesh first foil, which is used to overcome the inherent limitation due to scattering in the solid first foil of a conventional OTR interferometer, and an optically transparent dielectric foil. The interferences of forward directed ODR from the mesh and radiation from the dielectric foil is observed in transmission. This geometry allows a small gap between the foils (0.9 mm), which is required to observe fringes from two foils at low beam energies. The measured beam divergence is in a good agreement with that obtained using simulation code calculations. ODTRI measurements indicate that a single Gaussian distribution is insufficient to describe the angular distribution of the measured beam and that a second Gaussian beam faction or halo beam component is required to fit the data.
INTRODUCTION Conventional OTRI cannot be used for low emittance
beams because scattering in the first foil of the OTR interferometer dominates and obscures the beam divergence (1μm of Aluminium scatters 8 MeV electrons by RMS θ ~ 5mrad). To overcome this problem we have devised a perforated foil (mesh) – solid mirror foil reflection interferometer [1, 2] which is useful at moderate beam energies (E > 50 MeV).
For low energy beams the inter foil spacing (L ~ γ2λ) is too small to observe the interferences of forward ODR from the mesh and backward OTR from the mirror in a standard reflection geometry. For example, at beam energy E = 8 MeV and λ = 632nm, L < 1 mm. To overcome this problem, we have developed a transmission interferometer [3, 4]. This interferometer uses a transparent dielectric foil as a second foil. The forward ODR produced by the mesh passes through the dielectric foil and interferes with forward radiation produced by the dielectric itself. A transport mirror is used to redirect the interfering radiations into the optical measurement system.
The radiation from the mesh is produced by two beam fractions: 1) unscattered electrons passing through the
holes and 2) electrons heavily scattered in the mesh wires. Each component produces diffraction radiation ODR. Since no analytic theory for diffraction radiation from a matrix of holes in a metallic foil exists, we devised a simulation code (BEAMDR) to calculate the ODR from the two beam fractions.
A second code (CONVD) is then used to convolve the interferences of the ODR and OTR from the dielectric foil DOR with a given distribution of particle trajectory angles (typically a Gaussian distribution) and optical filter function. The latter is needed to produce distinct visible fringes for a given range of divergence. The essential part of code CONVD is the fitting procedure which varies the beam and interferometer parameters, and calculates the RMS deviation between the calculated and measured intensity distributions within some angular interval. The goal is to find a set of parameters which produces the minimum deviation. Beam divergence is one of the fitted parameters. A complete description of these codes is given in [2].
Figure 1: Mesh-dielectric foil interferometer.
There is a challenge in using dielectric foil in the interferometer, namely is to correctly prescribe the properties of optical dielectric optical radiation (DOR). In this work we use an additional measurement of OTR from metallic foil in order to "calibrate", the DOR from the kapton foil used in our interferometer and thus determine the parameters of the kapton foil.
EXPERIMENTAL SETUP
An ODR-DOR interferometer was designed and used to measure the electron beam divergence of the Argonne National Lab’s Advanced Wakefield Accelerator
TUPTPF048 Proceedings of BIW08, Tahoe City, California
Other measurements and diagnostics systems
218
operating at 8 MeV. The average current of this machine is about 0.1 μA, and the repetition rate is 5 Hz.
A 5 μm thick, rectangular aperture nickel micromesh (2000 lines per inch, 12.7 micron period, 36% transparency ) is the first foil and a ~ 9 μm thick Kapton foil with refraction index n ~ 1.8, the second foil. The transparency of the Kapton foil is ~ 95% at λ = 632nm. The inter foil spacing L ~ 0.9 mm. The wires of the mesh scatter electrons producing a calculated rms scattering angle of about 30 mrad which is much larger than the expected rms beam divergence, θrms ~2-4 mrad. The dielectric foil also produces a large amount of scattering (~ 10 mrad), but this does not affect the performance of the interferometer, since the phase and hence the interferences are primarily determined by the interfoil distance; see [3] for details.
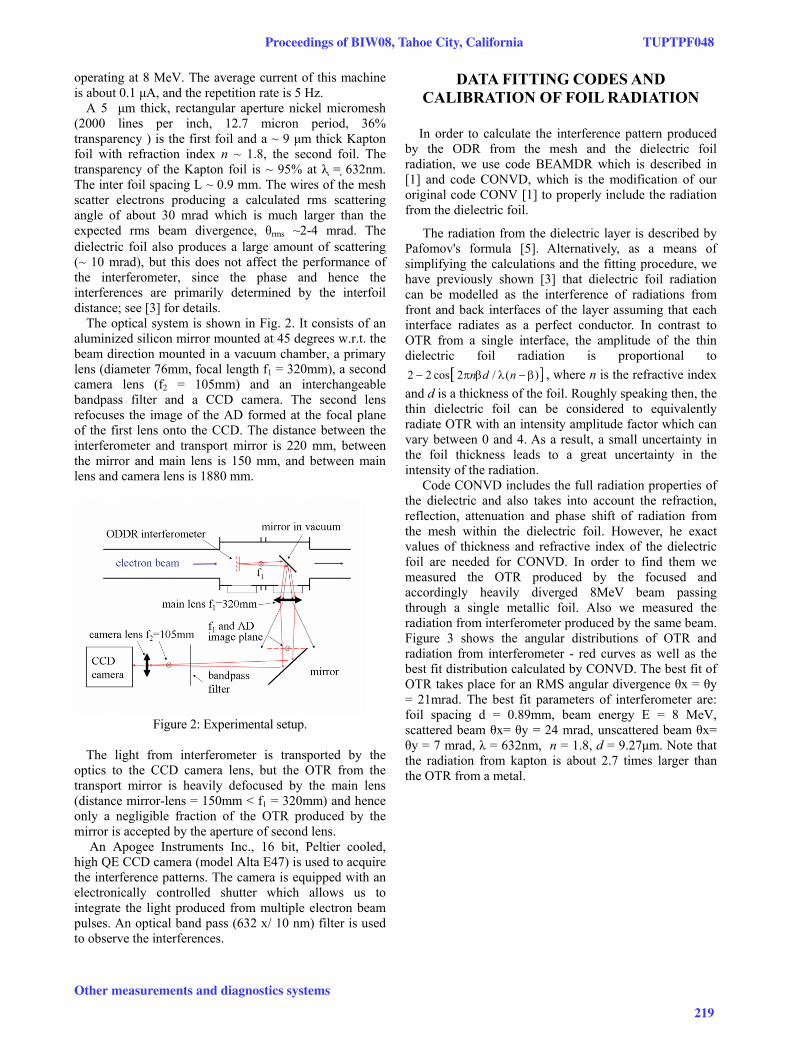
The optical system is shown in Fig. 2. It consists of an aluminized silicon mirror mounted at 45 degrees w.r.t. the beam direction mounted in a vacuum chamber, a primary lens (diameter 76mm, focal length f1 = 320mm), a second camera lens (f2 = 105mm) and an interchangeable bandpass filter and a CCD camera. The second lens refocuses the image of the AD formed at the focal plane of the first lens onto the CCD. The distance between the interferometer and transport mirror is 220 mm, between the mirror and main lens is 150 mm, and between main lens and camera lens is 1880 mm.
Figure 2: Experimental setup.
The light from interferometer is transported by the
optics to the CCD camera lens, but the OTR from the transport mirror is heavily defocused by the main lens (distance mirror-lens = 150mm < f1 = 320mm) and hence only a negligible fraction of the OTR produced by the mirror is accepted by the aperture of second lens.
An Apogee Instruments Inc., 16 bit, Peltier cooled, high QE CCD camera (model Alta E47) is used to acquire the interference patterns. The camera is equipped with an electronically controlled shutter which allows us to integrate the light produced from multiple electron beam pulses. An optical band pass (632 x/ 10 nm) filter is used to observe the interferences.
DATA FITTING CODES AND CALIBRATION OF FOIL RADIATION
In order to calculate the interference pattern produced
by the ODR from the mesh and the dielectric foil radiation, we use code BEAMDR which is described in [1] and code CONVD, which is the modification of our original code CONV [1] to properly include the radiation from the dielectric foil.
The radiation from the dielectric layer is described by Pafomov's formula [5]. Alternatively, as a means of simplifying the calculations and the fitting procedure, we have previously shown [3] that dielectric foil radiation can be modelled as the interference of radiations from front and back interfaces of the layer assuming that each interface radiates as a perfect conductor. In contrast to OTR from a single interface, the amplitude of the thin dielectric foil radiation is proportional to
2 2 cos 2 / ( )n d n , where n is the refractive index
and d is a thickness of the foil. Roughly speaking then, the thin dielectric foil can be considered to equivalently radiate OTR with an intensity amplitude factor which can vary between 0 and 4. As a result, a small uncertainty in the foil thickness leads to a great uncertainty in the intensity of the radiation.
Code CONVD includes the full radiation properties of the dielectric and also takes into account the refraction, reflection, attenuation and phase shift of radiation from the mesh within the dielectric foil. However, he exact values of thickness and refractive index of the dielectric foil are needed for CONVD. In order to find them we measured the OTR produced by the focused and accordingly heavily diverged 8MeV beam passing through a single metallic foil. Also we measured the radiation from interferometer produced by the same beam. Figure 3 shows the angular distributions of OTR and radiation from interferometer - red curves as well as the best fit distribution calculated by CONVD. The best fit of OTR takes place for an RMS angular divergence θx = θy = 21mrad. The best fit parameters of interferometer are: foil spacing d = 0.89mm, beam energy E = 8 MeV, scattered beam θx= θy = 24 mrad, unscattered beam θx= θy = 7 mrad, λ = 632nm, n = 1.8, d = 9.27μm. Note that the radiation from kapton is about 2.7 times larger than the OTR from a metal.
Proceedings of BIW08, Tahoe City, California TUPTPF048
Other measurements and diagnostics systems
219

Figure 3: Measured and calculated radiation from metallic foil and interferometer produced by the strongly diverged beam.
EXPERIMENTAL RESULTS
The primary goal of this experiment was to demonstrate the capability of method to measure angular divergence of a low energy (8 MeV) electron beam. Doing the experiment we were primarily interested to see how the beam tuning affects the fringe visibility and accordingly, the angular divergence of the beam. The first tune was a beam sharply focussed in both X and Y . Accordingly beam had large angular divergence θx= θy = 7 mrad and exhibited very small fringe visibility (Fig. 3). Then the beam was largely un-focused allowing the smallest angular divergence (Fig.4) and thus showed the maximum fringe visibility. The last two tunes produced a horizontal or (X waist (Fig. 5) and a vertical or Y-waist (Fig.6) condition.
Figure 4: Unfocused beam (no-waist, solenoid only). Top – beam spot distribution (black circle is an interferometer aperture with diameter 15mm); top right – image of the angular distribution of intensity; bottom left and right are the horizontal-x and vertical-y scans of angular distribution
Figure 5: Same as Fig.4 for horizontally focused beam (x-waist)
Figure 6: Same as Fig.4 for vertically focused beam (y-waist)
Horizontal and vertical line scans of the interference patterns were taken by averaging over the arcs to smooth the noise [2]. The sector averaged data scans are shown in Fig. 3, 4, 5 and 6 as red lines. The calculated distributions are also plotted in these figures as blue dotted lines for the set of parameters which gives the best fit for each scan. The best fit parameters for the unfocused beam (Fig.4) are: interferometer foil spacing d = 0.89mm, beam energy E = 8 MeV, RMS angular divergence of the scattered fraction of the beam θs = 18mrad. The unscatterd beam is split to two Gaussian fractions: 1) a narrow angle component and 2) a wide angle (halo) component. The best fit parameters are: first beam fraction(62%), θx= θy=1.15 mrad; second beam fraction (38% ) , θx= θy=6 mrad.
From Fig.5 and 6 it is seen that waist tuning of the beam increases the angular divergence and washes out the fringes. In two last cases the best fit requires the splitting the beam into two approximately equal fractions each with a different angular distributions. Best fit parameters for all cases are presented in Table 1.
TUPTPF048 Proceedings of BIW08, Tahoe City, California
Other measurements and diagnostics systems
220
Table 1. The measured best fit parameters of the beam.
RMS, mm, mrad
no-waist x-waist
y-waist
double waist
X spot size 2.7 <0.2 <1 X divergence 1.15/6 3.3/6 1.75/8.4 7 Y spot size 2.1 <0.2 <1 Y divergence 1.15/6 3/6 4.6/8.4 7
Table 2. Simulated parameters for pulse duration 2.5 ps.
RMS, mm, mrad
no-waist x-waist
y-waist
X spot size 2.7 0.068 X divergence 1 7.5 Y spot size 2.7 0.068 Y divergence 1 7.5
Table 2 shows the results of Parmela code simulation for the beam parameters. In the comparison of the observed and simulated beam note that the resolution of the imaging system used to measure the beam spot size was approximately 0.2mm. This means that we were not able to measure the spot size predicted by simulation with any accuracy. Another restriction is that the simulated beam assumes a single component beam whereas the our fits to the angular data shows two component. Roughly speaking we cannot distinguish between these two components, i.e "core" and "halo". For instance, in the case of no-waste condition tune, the simulation result matches the small divergence component of the beam. In the cases of the x and y-waists, the simulations fit the large divergence component. In the case of double waist, it is likely that the simulation fits the observed beam if we assume that the double waist focusing is a linear combination of the x and y waist focusing.
CONCLUSIONS
We have successfully applied an ODR-dielectric foil transmission interferometer to measure the unperturbed angular divergence of a 8 Mev ANL-AWA electron beam. Simulation and fitting codes allowed us to fit the measured distributions and determine the RMS divergences of the beam. Also we have developed procedure which allows to measure required parameters of the dielectric foil.
REFERENCES
[1] A.G. Shkvarunets, R.B. Fiorito, P.G. O'Shea, , Nuc. Instrum. and Methods B 201, (2003), p.153-160. [2] R.B. Fiorito, A.G. Shkvarunets, T. Watanabe, V. Yakimenko, D. Snyder, , Phys. Rev. ST Accelerators and Beams, 9, (2006) 052802.
[3] R.B. Fiorito, A.G. Shkvarunets, and P .G. O'Shea, paper WPPG056, PAC 2003, Portland, OR, May 14, 2003. [4] A.G. Shkvarunets, R.B. Fiorito, P. G. O'Shea, J.G. Power, M.E. Conde and Wei Gai, paper FRMPS034, PAC 2007, Albuquerque, USA, June 25 – 29, 2007. [5] V.E. Pafomov, Proc. of the P. N. Lebedev Physics Institute, Consultants Bureau, New York, NY, V.44, (1971) pp.25-157.
Proceedings of BIW08, Tahoe City, California TUPTPF048
Other measurements and diagnostics systems
221