electrochemical methods for monitoring performance … · electrochemical methods for monitoring...
TRANSCRIPT
Paper No.
509
ELECTROCHEMICAL METHODS FOR MONITORING PERFORMANCEOF CORROSION INHIBITOR UNDER MULTIPHASE FLOW
, Y. Chen and M. GopalNSF I/UCRC, Corrosion in Mukiphase Flow Systems Center
Dept. of Chemical EngineeringOhio University
Athens, OH 45701
This paper
ABSTRACT
presents results of an irnidazoline based(ECN) and Electrochemical Impedance Spectroscopy (EIS)
inhibitor using the Electrochemical Noisetechniques in a multiphase flow pipeline.
ECN and EIS measurements were made simultaneously in a 101 .6mm I.D., 15m long acrylic pipelineusing saltwater and carbon dioxide mixtures. Full pipe flow was studied for liquid velocity of 1.25 mhand slug flow for Froude numbers 6 and 9. Experiments were carried out at a constant pressure of136kPa and temperature of 40°C. The ECN signals and EIS spectra of blank and inhibition tests wereobtained. The ECN technique is able to monitor the inhibitor film formation continuously. The currentnoise fluctuation is correlated to the corrosion rate for both blank test and inhibitor test. The highercurrent fluctuation indicates higher corrosion rates. Different EIS spectra were obtained for blank andinhibitor studies. The simple charge transfer process was seen to occur for blank tests while chargetransfer and diffusion processes were taking place under inhibitor effects.
Keywords: Electrochemical Noise (ECN), Electrochemical impedance spectroscopy (EIS), corrosioninhibitor, multiphase flow
INTRODUCTION
The corrosion inhibitor is the main tool used for preventing internal corrosion in carbon steelpipelines, which are used to transport multiphase mixtures from oil production. The successfid selectionof corrosion inhibitors depends on a clear understanding of the inhibition performance of the inhibitorunder multiphase flow conditions. The Electrochemical Impedance Spectroscopy (EIS) technique is seento be a powerful method for studying the inhibition performance of inhibitor in a multiphase flow system‘. However, the EIS is unable to monitor inhibitor film performance and corrosion process continuously.Electrochemical noise (ECN) has attracted a lot of research attention for the past twenty
Copyright@l999 by NACE International. Requests for permission to publish this manuscript in any form, in part or in whole must be made in writing to NACEIntema$ional, Conferences Division, P.O. Box 218340, Houston, Texas 77218-8340. The material presented and the views expressed in thispaper are solely those of the author(s) and are not necessarily endorsed by the Association. Printed in the U.S.A.

years. ECN is able to monitor stochastic processes that might be correlated to the overall kinetic andprovide detailed information, which is not available through DC and AC methods. It is recognized thatECN provides scientific answers in corrosion research and solves practical problems in corrosionengineering 2. The noise resistance, which is calculated by standard deviation of voltage and currentnoise, might correlate to the polarization resistance for some systems 3-4.The ECN technique is able tomonitor the inhibitor film formation and destruction processes 3.
The ECN is a practical technique in the continuous monitoring of corrosion processes at a fastsampling rate, which is suitable for monitoring corrosion and inhibition processes in multiphase flowsystems. A multiphase flow can be classified into many different flow regimes according to the flow rateof gas and liquid for the multiphase flow system. At high production rates, the slug flow regime isprominent. The characteristics of slug flow have been discussed in a previous paper 5. Froude number isused to describe slug flowb. The slug flow is known to significantly enhance internal corrosion inoil/water/gas pipelines. This is due to the high levels of shear and turbulence occurring in the mixingzone of the slug 7-9. The high turbulence system must be monitored using a technique with a fastsampling rate, which must be at least at a frequency of the order of the perturbing effect, otherwise asignificant amount of detail is missed 10.Hence, the ECN at a higher sampling rate is very helpfid formonitoring corrosion process in a turbulent multiphase flow system. The corrosion monitoring by ECNtechniques under multiphase flow conditions have been studied extensively at the Corrosion Center ofOhio University. Voltage and current noise signals under fill pipe flow and slug flow at different watercuts were obtained 11. The noise fluctuation shows trends which can be correlated to the type of flow.Agreement of corrosion rates calculated by noise resistance with those obtained by Electrical Resistance(ER) technique was found 5.
This paper studies the validity of the ECN technique to monitor corrosion processes, inhibitorfilm formation and inhibition performance of the model inhibitor under a multiphase flow system. TheEIS technique, which works as the calibration technique, was also carried out.
EXPERIMENTAL PROCEDURE
Experiments were carried out in a 101 .6mm I.D., 15m long acrylic pipeline. The schematiclayout of the system is shown in Figure l(a). It is similar to the one designed by Jepson ‘lO].A preparedASTM substitute saltwater is placed in the 1.4m3 stainless steel tank A. The liquid from the tank ispumped into the 76 mm I.D. PVC pipe by a 1.5 kW centrifugal pump. The flow rate of the liquid iscontrolled by a bypass line B and is measured by a calibrated orifice meter D. Liquid is passed into a 76mm I.D. PVC pipe and then forced under gate E into the 101.6 mm I.D. plexiglass pipe where it forms afast moving liquid film. The carbon-dioxide gas is introduced into the system at port F. The gas-liquidmixture passes through the plexiglass pipeline and enters the tank where the liquid is separated using ade-entrainer plate inside the tank. Liquid is recycled and gas is vented to the atmosphere through theexhaust at the top of the tank. The carbon dioxide gas is also used to pressurize the system. The pressureinside the tank is indicated by the gauge I, installed on the top of the tank. All the measurements aretaken in the test section G located 8m downstream from the gate. For slug flow, a hydraulic jump isgenerated and moved to the test section by controlling the gas flow at the inlet F. This is done using aneedle valve in conjunction with a flow control system. The liquid inside the tank is heated by two 1.5kW heater positioned at K. The EIS and ECN probes are inserted into the test section G shown in Figure1(b), and are flush mounted with the pipe wall. ECN probe has three identical carbon steel C-1018electrodes. EIS probe consists of three electrodes. The working electrode is made of C-1 018 carbon

steel. The counter and reference electrodes are made of stainless steel. The surface area of all electrodesfor both probes is 0.785 cm 2.
Tests were performed using ASTM substitute saltwater and carbon dioxide gas. Once the de-oxygenation process is completed, ECN and EIS probes, which are polished by 600-grid sandpaper andrinsed by acetone and deioned water, are installed into the test section mounted flush with the pipe walland the corrosion rate measurements are started. For slug flow experiments, the liquid flow rate isadjusted to a value required to obtain the desired Froude number and the liquid is forced under the gate.At this point a hydraulic jump is created. The hydraulic jump is positioned stationary inside the testsection by a control system on the gas line. The concentration of the inhibitor is 25 ppm. Full pipe flowwas studied for liquid velocity of 1.25 rds and slug flow for Froude numbers 6 and 9. The systemtemperature and pressure are maintained constant at400 C and 0.136 MPa for all experiments.
ECN and EIS measurements were taken for each set of conditions simultaneously. EISmeasurements were carried out at open circuit potentials with amplitude of 10 mV in the frequencyrange about 20rnHz to 5 kHz. Current noise is measured on freely coupling electrodes with zeroresistance ammeter while the corrosion potential of coupled electrodes is measured with respect to thereference electrode, which has the same composition as the working electrodes. The sampling rate is 10points/second.
There are two different experimental procedures, with or without pre-corrosion. For theexperiments with pre-corrosion, EIS and ECN probes are set up into system for 2 hours to establish thebaseline data, and then the inhibitor of desired concentration (e.g. 25ppm) was then injected into thepipeline. For inhibition tests without pre-corrosion, the probes were set up into the inhibitor containing
system directly. ECN and EIS measurements were taken every hour during the inhibition study for bothexperimental procedures.
RESULTS AND DISCUSSION
Blank TestsFigure 2 shows the typical voltage and current noise after 3.5 hours of operation for slug flow at
Froude number 9. Random fluctuations around a mean value are seen in voltage and current noiseresponse. The magnitude of voltage and current differ for different flow patterns and fiu-ther studies arecontinuing to determine the correlation between the magnitude change of voltage and current anddifferent corrosion process. It is well known that the fluctuation of current and voltage is correlated tothe corrosion rate. In order to compare the real noise fluctuation under different flow conditions, the DCtrends, which cause distortions of the noise data as shown in Figure 2, must be removed from the noisedata. Moving Average Removal method (M.AR)[3]was used for DC trend removal in this work. At thetime t, a series of potential noise data Vt is a combination of the random noise V.Oi~~(t) and the DC trendcomponent VDC(t), which are fi.mction of time,
(1)
We assume that an average value of adjacent data points of Vt can be taken as an estimation of VDc (t),
{1
i+k+lV.c (t)= ~ vi / (2k+2) (2)
i–k
k is equal to 3 in this work. The random fluctuation V.Oi~~(t) could be calculated as
(3)
The current signals can be treated by the same method.Figure 3 show the real voltage and current fluctuations, which are extracted from the their raw
data by using MAR method afler 3.5 hours of exposure to different flow conditions. In Figure 3, thefluctuations of voltage for slug at Froude number 9 are larger than the others. And real voltagefluctuations of full pipe flow are smaller than slug flow at Froude number 6. The difference of currentfluctuations between these three flow conditions is very clear. The current noise fluctuations for the fullpipe flow condition are obviously less than those at slug flow conditions. Also the fluctuations for slugflow at Froude number 9 are greater than that for slug flow at Froude number 6. Figure 4 (a) is a Nyquistplot of EIS spectra under the same experimental condition after the probe was exposed to testingsolution for 3.5 hours. The shape of Nyquist plot is one semicircle. The circuit as shown in the Figure 4(b) can be used to fit the experimental data. The diameter of the semicircle represents charge transferresistance. It can be seen that charge transfer resistance of the full pipe flow is larger than slug flow.And the charge transfer resistance of slug flow at Froude number 9, which represents the higherturbulence, is smaller than Froude number 6. These are caused by the fact that corrosion rate for fullpipe flow is lower than slug flow and corrosion rate increases with increase of turbulence. Hence, thenoise fluctuations are correlated to the corrosion rate. The more the fluctuations, the greater is thecorrosion rate. The current signals are more sensitive than voltage signals to the fluid dynamics andcorrosion processes.
The comparison of the noise resistance and charge transfer resistance for the blank test atdifferent flow patterns is listed in Table 1. The results of voltage and current noise by statistic analysisare also listed in Table 1. Since the ECN probe in this work has three identical electrodes in the sametest environment, the potential noise from each electrode will be same, and therefore,
vmeasured=(V12+V;)05
Given VI =V2
For the potential data after the treatment of MAR in this work
(4)
(5)
(6)
(7)
Where, VI and Vz are the noise signals from the coupled electrodes and reference, respectively. R. is
noise resistance. 6V and 51 are standard deviation of potential and current noise. In this work, 5V and Nare standard deviation of real potential and current noise, which are treated by the MAR method.
The standard deviations of voltage and current for full pipe flow are smaller than slug flows. Thestandard deviation of voltage and current noise increases with Froude number. The noise resistance forblank test under fill pipe flow shows almost the same value as R~,,which is obtained by EIS technique.For slug flow, the trend of noise resistance seems to be the same as charge transfer resistance by EIS.
However the values are different. This could result from the fact that the noise resistance has agreementwith resistance obtained by EIS under uniform corrosion condition. It is well known that uniformcorrosion occurs under fill pipe flow whilst localized corrosion exists under slug flow.
Inhibition TestsFigure 5 is the typical voltage and current noise signals of C-1018 metal exposed to a 25 ppm
inhibitor-containing solution under slug flow at Froude number 9. Compared to Figure 2, which has thesame y-axis scale, it is seen that the noise fluctuations for both voltage and current are decreased underthe inhibitor effects. The plots in Figure 6 show the comparison of real voltage and current noise for slugflow at Froude number 9 between the blank test and inhibitor test at 25 ppm of the model inhibitor. Thevoltage fluctuation for inhibitor tests does not show much difference from blank test. The correspondingcurrent noise signals under inhibition effects show smaller fluctuations, which can be confirmed by thestandard deviation values of voltage and current shown in Table 1.
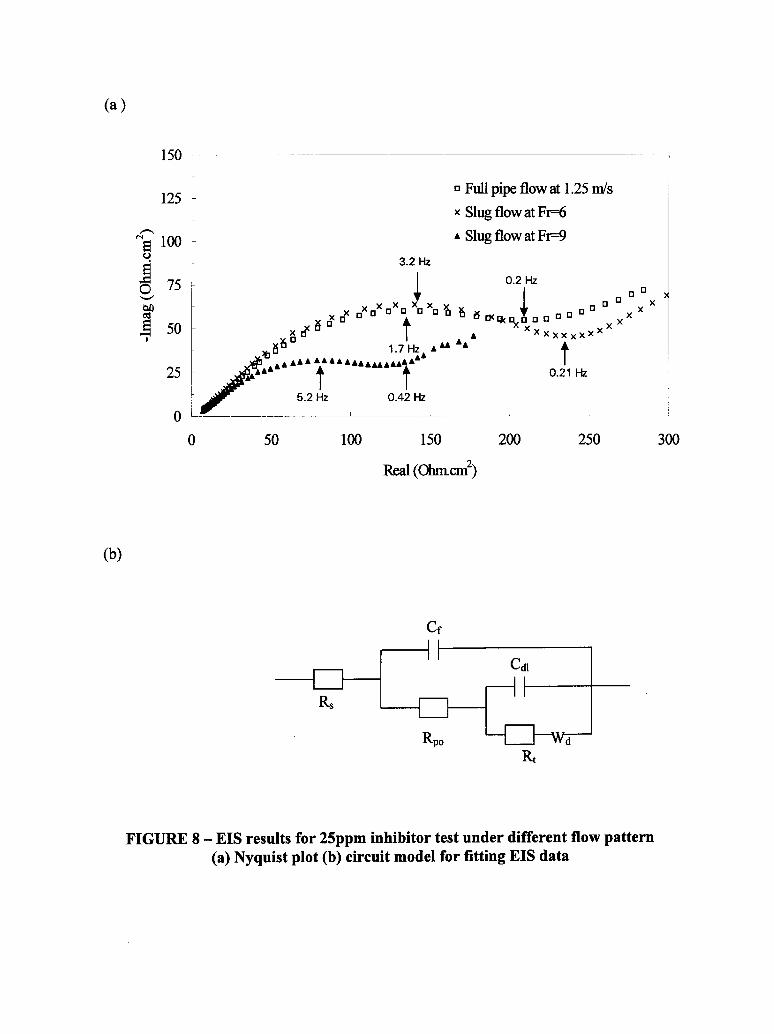
In Figure 7 the comparison of real noise for different flow patterns after 3.5 hours exposure timewithout pre-corrosion experimental procedure is shown. Again, at the same concentration of inhibitor,the noise fluctuation of voltage and current is higher with the higher degree of turbulence. Full pipe flowhas the lowest noise fluctuation. Figure 8 is the test results using EIS technique under the sameexperimental conditions. The shapes of Nyquist plot for all the cases include one semicircle anddiffusion tail at low frequency area, which can be simulated using circuit nested in Figure 8(b). Nyquistplot shows that slug flow at Froude number 9 has the lowest charge transfer resistance. The results forfull pipe flow and slug flow at Froude number 6 have very similar results. This could result from the factthat slug flow at the higher Froude number (such as Froude number 9) has higher turbulence and thebubbles impact on the pipe wall. The inhibition performance of corrosion inhibitor is degraded andcorrosion rate is increased in the turbulent flow condition. The resistance calculated by ECN and EISand noise fluctuation are listed in Table 1. The table shows that the standard deviations of voltage andcurrent are much higher than full pipe flow and slug flow at Froude number 6. No agreement is foundbetween noise resistance and charge transfer resistance.
Film FormationFigure 9 shows the electrochemical noise signals during 1800 seconds afler addition of the model
inhibitor. After 2 hour of pre-corrosion procedure, 25ppm inhibitor was injected into the pipeline system.The injection point is shown in Figure 9. After addition of the inhibitor the potential decreases with timeincreasing until the value is close to OmV and then increases. The corresponding current noise decreaseswith exposure increasing time. For the same experimental set, the comparison of noise response forblank test and inhibition tests at different exposure times shows that the voltage magnitude becomesmore positive and current value decreases with increasing time, as shown in Figure 10.
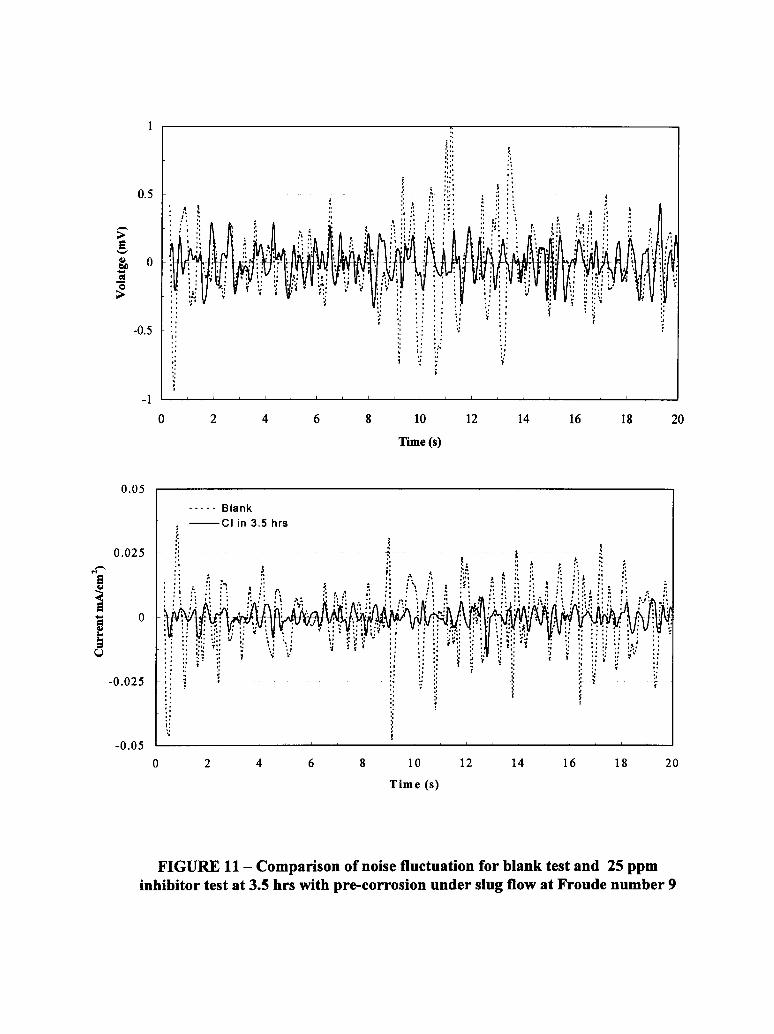
Figure 11 is the voltage noise fluctuation of blank test for 2 hours and inhibition test for 3.5hours. The noise fluctuations for both voltage and current exposed to the inhibitor containing solutionshow smaller fluctuation than the blank test. The current signal is much clearer. The same results are
‘3] The relative results are listed infound in the Rotating Cylinder Electrode system by other researchers .Table 2. As shown in Table 2, the standard deviation values for both voltage and current decreases afteraddition of inhibitor and decreases with exposure time. No agreement between noise resistance andcharge transfer resistance has been found under inhibitor effects in the multiphase flow conditions.

CONCLUSIONS
ECN and EIS were both used to monitor the corrosion processes with/without the model inhibitoreffects under a multiphase flow system. Real voltage and current signals were obtained by the MovingAverage Removal method to remove the DC treads. The ECN is able to track corrosion and inhibitionprocesses under different flow conditions. The real fluctuations show distinct differences between fillpipe flow and slug flow, which might be correlated to the corrosion rate. The higher noise fluctuationindicates higher corrosion rates. The ECN technique is able to monitor the inhibitor film formationcontinuously. Different circuit models were used to fit the EIS data witldwithout inhibitor effects. Thesimple charge transfer process was seen to occur for blank tests while charge transfer and diffisionprocesses were taking place under inhibitor effects. In multiphase flow system, the agreement betweenelectrochemical noise resistance (R.) and charge transfer resistance (IQ, which is obtained by EIStechnique, was not seen.
1
2
3
4
5
6
7
8
9
10
11
REFERENCES
Chen, Y. et al, “ Effect Of Multiphase Flow on Corrosion Inhibition”, NACE CORROSION/99,Paper No. 99012, 1999.Dawson, J. L.” Electrochemical Noise Measurement: The Definitive In-Situ Technique forCorrosion Applications?” Electrochemical Noise Measurement for Corrosion ApplicationsASTM STP 1277, 1996, pp. 3-35.Tan, Y. J., et al, “The Monitoring of The Formation and Destruction Of Corrosion Inhibitor Film
Using Electrochemical Noise Analysis (ENA)”, Corrosion Science, 38, No. 10, 1996, pp. 1681.Reichert, D. L.” Electrochemical Noise Measurement for Determining Corrosion rates?”Electrochemical Noise Measurement for Corrosion Atmlications ASTM STP 1277, 1996, pp.79-89.Chen, Y., Jepson, W. P., ” Comparison of ECN and EIS Measurement for CorrosionMonitoring under Multiphase Flow Condition”, NACE CORROSION/97, Paper N0.347, 1997.
Jepson, W. P., “ Flow Characteristics in Horizontal Slugs”, 3rd Int. Conf. On MultiphaseFlow, The Hague, Netherlands, 1987, pp. 187-197.Sun, Jyi-Yu, Jepson, W. P., “Slug Flow Characteristics and Their Effect on Corrosion Rates in
Horizontal Oil and Gas Pipelines”, SPE Paper 24787, 1992, pp.215-228.
Green, A. S., Johnson, B. V., and Choi, H.J., ” Flow Relation Corrosion in Large Diameter
Multiphase Flow Pipeline”, SPE Paper 20685, 1989, pp. 677-684.
Gopal, M., Kaul, A., Jepson, W. P., ” Mechanism Contributing to Enhanced Corrosion in
Three Phase Slug Flow in Horizontal Pipes”, NACE CORROSION/95, Paper No.1O5, 1995.Webster, S. et.al. , “The Application of the Electrochemical Noise Technique for CorrosionMonitoring under Multiphase Flow Condition”, First International Symposium onElectrochemical Noise Measurement for Corrosion Applications, Montreal, Canada, Paper 28,May 16-17, 1994.Deva, Y.K., Jepson, W. P. “A Use of Electrochemical Noise to Monitor Multiphase Flow
Corrosion”, NACE CORROSION/96, Paper N0.337, 1996.

FI II I
K
~“
A. Liquid tank G. Test sectionB. Liauid recvcle H. Gas outlet with filtersC. Li~uid f~ I. Pressure gauge with back pressure controlD. Orifice plate with pressure pipe K. HeaterE. Flow height control gate V. Flow control valveF. Clubon dioxide feed line
FIGURE la – Experimental pipeline system
A A
IJLOW
n!1
——L J I-II II-J
Q cB
c
A. EIS, ECN and ER probesB. Sampling tubeC. Pressure tapsD. Thermocouple A A
d
rl-C
FIGURE lb – Test section

67
66
64
63
2.7
2.65
2.45
2.4
0 10 20 30 40
Time (s)
[
o 10 20
Time (s)
30 40
FIGURE 2- Voltage and current noise response for blank test under slug flow at Froude number 9

1
0.5
-0.5
-1
0.05
0.025
-0.025
-0.05
o 2 4 6 8 10
Time (s)
::. A ~.:J
::
: “, :; ,,,.. , :: .,:; :’! .
! .’..,.,
..”. , . ::, ,.!’::.,:“ ,, :, “.,,,:$:,: :.::.!
,, ~.
i:,,. .
,.,,,,
,,,.
.,
—Full pipe flow
:: — Slug at Fr=6
----- Slug at Fr=9
o 2 4 6 8 10
Time (s)
FIGURE 3 – Comparison of noise fluctuations for blank tests under different flow patterns

(a)
40
30
10
0 1
0 Fti pipeflOW
X. XDXO x SlugflowatFI=6
XoXo
A ❑ A Slug f10Wi3t Fi=9XOA x o
OA Ax A o
‘A Ax
x ❑
~A A
J% ox
ItDo
A
* x o
L xo
Ax o
y- A oA
I x oA o
❑
—— , 1 I , 1 , $ t 1
0 10 20 30 40 50 60 m 80 90 lIXJ
R?aI (Ohmcd)
(b)
cdl
-=’-c3-Rt
FIGURE 4 – EIS results for blank tests under different flow patterns(a) Nyquist plots of EIS spectra (b) Circuit model for fitting EIS data

70
69
Fg
& 68zz>
67
66
0.85
0.8
~;o.75Q
$~ 0.7
Es
u 0.65
0.6
0.55
0 10 20 30 40
Time (s)
o 10 20 30 40
Time (s)
FIGURE 5 – Voltage and current noise response for 25ppm inhibitor testunder slug flow at Froude number 9.

0 2 4 6 8 10
Time (s)
0.05
0.025~-g
iig 0
Ee
-0.025
-0.05
0
-----Blank
—25ppm
..’.,; t,.,:;
:;. A ;.: ::
~’\ :: ::::
.-,.,. :. ,.. .:::;::; .,. ~:
..... : #. .-.:.,: ,.., ,, ::;: ,.
,.,.;:,,. ..,:::;’
2 4
Time (s)
6 8 10
FIGURE 6 – Comparison of noise fluctuation for blank test and 25ppm inhibitor testunder slug flow at Froude number 9.

0.5
0.25
?.g
:M os
?
-0.25
-0.5
0.01
0.005
-0.005
-0.01
.,,..,::,,,.
.;!,!,
,,
0 2 4 6 8 10
Time (s)
—Full pipe flow
—Slug at Fr=6 J
----- Slug at Fr=9;::;.,,,
:,.’
:::.,,,.
0 2 4 6 8 10
FIGURE 7 – Comparison of noise fluctuation for 25ppm inhibitor tests under different flow conditions
(a)
150 ‘-—[
—
125
1
❑ Full pipe flow at 1.25 mk
x Slug flow at FI=6
“~ 100 ~ AShg flowat F@
d“ 3.2 Hz
3075:J
0.2 Hz
A
0“
❑“”n xxxXxoxo ❑%lbdmw%
I 50 #ti#””t
•~nnxx
‘xxx Xxx1 Axx
~ti 1.7 H:AAAA ‘A
/
.AAAAAA AA AAAAAAAAAAA t25 d
#t t
0.21 Hz
5.2 HZ 0.42 Hz
o L._._... —
o 50 100 150 200 250 300
Real ((llm.cm2)
(b)
Cf
II
R,
RPO
R
FIGURE 8 – EIS results for 25ppm inhibitor test under different flow pattern(a) Nyquist plot (b) circuit model for fitting EIS data

2
1.8
-Aav 1.6
i~E51.4
1.2
1
25ppm inhibitor injected
o 200 400 600 800 1000 1200 1400 1600 1800 2000
Time (s)
I
o 200 400 600 800 1000 1200 1400 1600 1800 2000
Tme (s)
FIGURE 9 – Voltage and current response during addition of 25ppm inhibitor under slugflow at Froude number 9

o 10 20 30 40 50
Time (s)
Blank
CI in3.5 l-lrs2.5 h
1.5 hrs
o 10 20 30 40 50
Time (s)
FIGURE 10-Voltage andcurrent response for blank testand 25ppm inhibitor testwith pre-corrosion at different exposure time under slug flow at Froude number 9
0
0.05
0.025~-g
i~ 0h3u
-0.025
-0.05
.:I ,,,.., $,:,, :;1;, .:
2 4 6 8 10 12 14 16 18 20
----- Blank
—Cl in 3.5 hrs;
:: ;4.,.., ,.
1::,
.,. :
!
o 2 4 6 8 10 12 14 16 18 20
Time (s)
FIGURE 11 – Comparison of noise fluctuation for blank test and 25 ppminhibitor test at 3.5 hrs with pre-corrosion under slug flow at Froude number 9