surface roughness and electrochemical performance
TRANSCRIPT

Research ArticleSurface Roughness and Electrochemical PerformanceProperties of Biosynthesized α-MnO2/NiO-Based PolyanilineTernary Composites as Efficient Catalysts in Microbial Fuel Cells
Yilkal Dessie ,1 Sisay Tadesse ,2 and Rajalakshmanan Eswaramoorthy 1
1Department of Applied Chemistry, Adama Science and Technology University, Adama, Ethiopia2Chemistry Department, Hawassa University, Hawassa, Ethiopia
Correspondence should be addressed to Yilkal Dessie; [email protected]
Received 7 May 2021; Revised 2 June 2021; Accepted 4 June 2021; Published 30 June 2021
Academic Editor: Ibrahim Alarifi
Copyright © 2021 Yilkal Dessie et al. This is an open access article distributed under the Creative Commons Attribution License,which permits unrestricted use, distribution, and reproduction in any medium, provided the original work is properly cited.
In this study, biosynthesized α-MnO2/NiO NPs and chemically oxidative polyaniline (PANI) were synthesized to form ternarycomposite anode material for MFC. The synthesized materials were characterized with different materials (UV-Vis, FTIR, XRD,TGA-DTA-DSC, SEM-EDX-Gwyddion, CV, and EIS) to deeply examine their optical, structural, morphological, thermal,roughness, and electrocatalytic properties. The degree of surface roughness for α-MnO2/NiO/PANI was 23:65 ± 5:652 nm. Thisvalue was higher than the pure α-MnO2, pure PANI, and even α-MnO2/PANI nanocomposite due to surface modification. Thetotal charge storing performance for bare PGE, α-MnO2/PGE, PANI/PGE, α-MnO2/PANI/PGE, and α-MnO2/NiO/PANI/PGEwere 5.291, 17.267, 20.659, 23.258, and 24.456mC. From this, the charge storing performance formed by α-MnO2/NiO/PANI-modified PGE was highest, indicating that this electrode is best in cycle stability and increases its life cycle during energyconversion time in MFC. This is also supported by its effective surface area, having a value of 0.00984 cm2. From this, it isevidenced that the ternary composite catalyst-modified anode facilitates the fast electrocatalytic activity as observed from itshigh peak current and lower peak-to-peak potential separation (ΔEp = 0:216V) than other electrodes. Such surface modificationhelps to store more electrical charge by increasing electrical conductivity during its charge/discharge processing time. Inaddition, the lower charge transfer resistance property with a value of 788.9 Ω and the fast heterogeneous electron transfer rateof ~2.92 s-1 enable to facilitate glucose oxidation, and this enhances to produce high power output and increase wastewatertreatment efficiency. As a result, the bioelectrical activity of α-MnO2/NiO/PANI composite-modified PGE was very effective inproducing a maximum power density of 506.96mWm-2 with COD of 81.92%. The above observations justified that α-MnO2/NiO/PANI/PGE serves as an effective anode material in double-chambered MFC application.
1. Introduction
Focusing on alternative, renewable, and carbon-neutralenergy sources produced by the bioelectrochemical systemis necessary to keep the environment from pollution and eco-nomic sustainability across the globe [1]. Due to this, themicrobial fuel cell (MFC) is chosen as the more affordabledevice that enables to produce renewable electrical energyfollowed by simultaneous wastewater treatment [1]. There-fore, the way to produce renewable energy from organiceffluents and green treatments of liquid wastes has receivedmuch attention in MFC [2]. The device is able to produce
renewable bioelectricity from stored chemicals found onorganic pollutants in the presence of electroactive microor-ganisms (EAM) [3, 4]. But the low power output, poor stabil-ity, and cost-ineffectiveness to upgrade the device are themain drawbacks that affect MFC [2]. This is due to the lowelectron transfer rate and low EAM attachment found onelectrode components [5]. Electrodes from conventional car-bon materials are the most common but are poor in energyconversion and low in wastewater treatment efficiency dueto the short-term stability results for sluggish electron trans-fer rates between electrodes and EAM [6]. This limitation ingeneral affects the whole performance of MFC.
HindawiJournal of NanomaterialsVolume 2021, Article ID 7475902, 21 pageshttps://doi.org/10.1155/2021/7475902

To reduce these challenges, researchers have used transi-tion metal oxide- (TMO-) based nanomaterial catalysts tomodify such conventional carbon electrodes due to theirlow cost, environmentally friendly nature, abundance, highsurface area to volume ratio, and fast electrokinetic activityin a widespread of electrochemical applications [7]. How-ever, due to their poor electrical conductivity, poor dispersi-bility, and low stability in highly protonic media, theyreduce their long-term electrocatalytic activity in bioenergyproduction (i.e., reduces the life cycle), bioremediation, andsensing activity [3, 7]. Improving the electrochemical proper-ties of TMO by forming a composite with conducting poly-mers enables to increase the life cycle of the modifiedelectrode by improving its cycle stability in any energy con-version and storage applications. So, conducting polymerslike PANI modify anodes by enhancing their electrical con-ductivity and surface areas when they form composites [8].However, PANI lowers the electrochemical electrocatalyticactivity and life cycle of the anode electrode in the MFCdevice under neutral conditions during its charge/dischargeprocessing time. Not only this, the swelling and shrinkagebehavior of PANI affects the physical strength of the bioa-node while TMO NPs have a significant achievement toincrease the cycle stability by increasing the specific capaci-tance of conventional carbon electrodes by forming compos-ites under near-neutral and neutral solutions [9]. This is dueto the finding of high theoretical capacitance on TMO and isconsidered a good option for anode modifier nanocatalystswhen they form nanocomposites due to efficiency and stabil-ity improvement [10].
So, researchers usually combined different TMO withconducting polymers to modify conventional carbon mate-rial properties such as electrical conductivity, compatibility,and dispersibility [11–13]. As an advance, electrical conduc-tivity, biocompatibility, high surface area, and surface rough-ness are the main requirement for bacterial attachment inMFC anodes [14]. So, when conventional carbon electrodeswere modified with nanocomposite catalysts, their electro-chemical catalytic property, durability, stability, and porosityrequirements should successfully meet by improving the sur-face area. Such improvement facilitates fast extracellular elec-tron transfer efficiency between EAM and anodes by forminga conductive immobilization matrix [15]. Immobilization ofEAM helps to enhance the close contact between bacterialcells and electrode surfaces. So, the fabricated composite cat-alyst could act as a bridge to fasten electron movement acrossMFC. Simultaneously, the unique biocompatibility propertyof PANI could help to reduce extracellular electron transferresistance in MFC [3], but this activity is restricted in thenear-neutral and neutral media due to its swelling andshrinkage behavior [16].
To solve all limitations stated above and to be effective inMFC performance, some TMO NP-based hybrid compositeswhich were synthesized by different methods were used as agood electrode modifier nanocatalyst. MnO2/polypyrrole [2,17], MnO2/PANI/MnO2 [18], MnO2/polypyrrole/MnO2[19], and multiwalled carbon nanotubes/MnO2/polypyrrole[20] were studied. From those studies, their ease of synthesiswas time-consuming; the use of expensive chemicals with
environmentally intolerable solvents that might affect envi-ronmental safety, use of expensive synthesis instruments,lower efficiency in wastewater treatment and power output,and inefficient charge storing ability give the intention toextend this work on biosynthesized α-MnO2/NiO-integratedconductive PANI ternary composites for MFC applications.The synthesis of α-MnO2/NiO binary hybrids which weredispersed in the PANI matrix followed the green method.This was cost-effective and could enable to reduce expensiveand toxic reducing chemical constituents because the plantextracts are an effective reducing and stabilizing agent tosynthesize TMO-based nanomaterials. Therefore, finding asimple, cost-effective, and environmentally friendly greenmethod is one of the core objectives of this study.
So, in this study, α-MnO2/NiO/PANI ternary nanocom-posites were prepared by integrating the green method withcost-effective biosynthesized α-MnO2/NiO in a conductivePANI matrix. Hydrothermal, solvothermal, electrodeposi-tion, electropolymerization, microwave-assisted, and pyroly-sis methods were time-consuming and used expensiveadvanced instruments. Previously, we prepared Mn-Ni oxidebimetallic NPs by following the simple green method byusing Vernonia amygdalina leaf extract as a reducing and sta-bilizing agent [21]. To be an effective nanocatalyst towardsbioelectricity and its simultaneous waste remediation, thecatalyst should be best in roughness degree and be efficientin electrocatalytic activities that enable to increase anodeelectrode performance for effective organic wastewater oxi-dation (i.e., facilitating substrate oxidation). Therefore, thecombined α-MnO2/NiO/PANI nanocomposite has the bestsurface roughness with efficient electrochemical propertiesthan other catalysts. This was clearly modified to a conven-tional pencil graphite electrode (PGE) evidenced fromdouble-chambered MFC construction.
2. Materials and Methods
2.1. Materials. Permanganate KMnO4 (99%, AlphaChemika), hydrated nickel chloride NiCl2·6H2O (99.99%,Merck), aniline C6H5NH2 (99.5%, Merck), ammonium per-sulfate (NH4)2S2O8 (98%, Sigma-Aldrich), ethanol C2H5OH(98%, Merck), and hydrochloric acid HCl (37%, Merck) che-micals were used as received. The chemicals, nutrients, andsubstrates which were applicable for MFC are of analyticalgrade, and distilled water was used to prepare all requiredsolutions.
2.2. Material Synthesis. An optimized α-MnO2/NiO binarycomposite was prepared based on our previous method[21]. In detail, an aqueous nickel ion concentration of~51% (v/v) to KMnO4 was added in a round-bottom flaskwhich was placed on a controlled hot plate at a fixed temper-ature of 80°C and fixed pH~8 with continuous stirring. After15 minutes, ~75% (v/v) of V. amygdalina leaf extract wasadded dropwise in the given mixture. The reaction mixturewas then waited for ~25 minutes of stirring. Due to these,the speed of the stirrer was reduced due to thick dark brownprecipitate formation. The obtained precipitate was centri-fuged at 4000 rpm for 15 minutes. Recovered precipitates
2 Journal of Nanomaterials
were washed several times with distilled water and absoluteethanol to remove organic contaminants. The 4-hour hotair oven-dried precipitate was calcined at 450°C for 2 hoursto give α-MnO2/NiO bimetallic NPs. For the biosynthesizedα-MnO2 NP preparation, refer to our previous work [22].
PANI was polymerized chemically based on the literature[23] as follows. Firstly, 1M aqueous HCl solution was mixedwith 0.5mL aniline in a round-bottom flask and stirred for 30minutes. Secondly, 5.71 g of ammonium persulfate (APS)was dissolved in 50mL distilled water and kept for 1 houreach. Finally, two solutions were mixed and stirred at roomtemperature until a dark green precipitate was formed andwaited for 4 hours to polymerize. The final precipitate waswashed with 0.2M HCl solution until the filtrate becomesclear, then with ethanol to remove the monomer and oligo-mer and with distilled water to remove the remaining acid.The final powder was then dried in an oven at 60°C for 24hours.
A typical in situ oxidative polymerization method wasused to synthesize α-MnO2/PANI binary nanocompositesby using the literature with little modification [11]. In brief,0.5mL aniline was dissolved in 100mL of 1M HCl by usinga glass round-bottom flask. The mixture was waited for 30minutes, followed by stirring. Then, 0.5 g of optimized bio-synthesized α-MnO2 NPs [22] was dispersed in 25mL dis-tilled water, and the mixture was exposed for 5 minutes ofultrasonication to disperse the biosynthesized material.Finally, the dispersed α-MnO2 NPs were added dropwise toaniline hydrochloride solution with 2.86 g of 50mL APS (oxi-dant and codopant) at room temperature and stirred for 4hours to complete the polymerization. The mixture changedin color, and the obtained precipitate was collected andwashed with 0.2M HCl solution until the filtrate becomesclear, then with ethanol to remove the monomer and oligo-mer as well as with distilled water to remove the remainingacid. Finally, the product was dried in an oven at 60°C for24 hours to give α-MnO2/PANI nanocomposites.
A typical in situ chemical oxidative method was used toprepare α-MnO2/NiO/PANI ternary composites based onthe literature with little modification [11]. Briefly, 0.5 g ofhomogenously suspended α-MnO2/NiO bimetallic NPs wasdispersed in aniline hydrochloride aqueous solution(0:1M aniline + 1MHCl ðdopantÞ + 1:43 g of 50mLAPSðcodopantÞ). The mixture was stirred continuously for 4hours to complete the polymerization reaction. The finaldeep dark green precipitate was then collected by filtrationand washed with 0.2M HCl solution until the filtratebecomes clear, then with ethanol several times to removethe monomer and oligomer as well as with distilled water sev-eral times to remove the acid. Finally, the product was driedin an oven at 60°C for 24 hours to give α-MnO2/NiO/PANInanocomposites.
2.3. Electrode Fabrication. Catalyst-modified electrodes werecarried out by following the literature [24] as follows. Briefly,α-MnO2, PANI, α-MnO2/PANI, and α-MnO2/NiO/PANIwere dispersed with polyvinyl alcohol (PVOH, MW= 44:05gmol−1) polymer binder solution in the ratio of 1 : 5 (PVOHto NPs, wt/wt%). Before coating, the mixture was stirred for 1
hour at 70°C to disperse uniformly. Finally, a 100μL of uni-formly distributed suspension was coated on the PGE surfaceusing the drop-cast method with the help of a microsyringe[25]. To improve its interface stability and bonding force,the modified electrode was oven-dried at 60°C for 12 hours[26]. Bare PGE (1 cm in length and 0.2 cm in diameter) wasprepared by soaking in distilled water for 24 hours and rinsedwith 0.2M phosphate-buffered solution (PBS) [27].
2.4. Characterization Techniques. UV-Vis (Azzota SM-1600SPECTROPHOTOMETER, USA) was used to observe boththe maximum wavelength and the absorption spectrum inthe wavelength range of 200nm-800 nm.
The existence of metal-nonmetal functional groups wasmonitored using Fourier transform infrared (FTIR) spectrawith a PerkinElmer FT-IR BX spectrophotometer in therange of 4000-400 cm-1 with samples prepared using KBrpellets.
The structural elucidation was examined with powder X-ray diffraction (XRD-7000, Shimadzu, Japan) with a voltageof 40 kV and a current of 30mA using a Cu Kα X-ray radia-tion source (1.5406Å) in the 2θ range of 10°-80°.
Thermogravimetric-differential thermal analyses (TGA-DTA) were carried out on a DTG-60H detector (Shimadzu,Japan) at a 50mLmin-1 sample flow rate.
Differential scanning calorimetry (PerkinElmer, DSC4000, USA) was carried out at 20mLmin-1 and 10°Cmin-1
flow and heating rates, respectively, under nitrogen (N2)atmosphere.
The surface morphology and elemental compositionwere investigated using scanning electron microscopy-energy-dispersive X-ray analysis (SEM-EDX, JEOL Ltd.instrument with a model of JCM-6000Plus).
Electrochemical measurements were carried out with athree-electrode electrochemical workstation (Biologic SP-300, Canada) containing bare/modified PGE, Ag/AgCl, andPt wire as the working, reference, and counter electrodes,respectively. Electrochemical impedance spectroscopy (EIS)was measured in the frequency range of 200 kHz-10MHz atAC perturbation of 10mV. The cyclic voltammetry (CV)was also measured in the potential window between -0.8Vand +0.8V at a scan rate of 50mVs-1. All the measurementswere carried out in 100mM phosphate-buffered electrolytesolution (pH = 7:4). EC-Lab v10.36 software was used for fit-ting both the cyclic voltammogram and the EIS spectrum.
2.5. MFC Setup and Operation. To show the bioelectrocataly-tic catalytic activities of ternary composites compared withbare PGE, a double-chamber MFC setup was constructedfrom two equal glass Büchner flasks connected with a glasstube (9 cm in length and 1.1 cm in diameter) which acts asa salt bridge filled with 12 g of KCl and 3 g agar shown inFigure 1. Unmodified PGE and modified PGE with the α-MnO2/NiO/PANI ternary composite catalyst were used asan anode while bare PGE was used as a cathode. The anodebioreactor was prepared from measurable artificial wastewa-ter containing 160mgL-1 of glucose substrate, 5840mgL-1 ofNaCl, 100mgL-1 of KCl, 250mgL-1 of NH4Cl, 12,000mgL-1
of Na2HPO4·12H2O, 2570mgL-1 of NaH2PO4·2H2O, 840
3Journal of Nanomaterials

mgL-1 of MgCl2·6H2O, 500mgL-1 of FeCl3, 2mgL-1 ofMnSO4·H2O, 5mgL-1 of CaCl2, and 340mgL-1 of yeastextract to fulfill the micronutrient deficiency [28]. The anodewas inoculated with E. coli cultured from wastewater efflu-ents collected from the Adama Science and TechnologyUniversity wastewater treatment plant, Adama, Ethiopia (lat-itude 8°33′43.56″ north and longitude 39°17′23.28″ east),using a sterile glass bottle tied up with a lightweight steelround stick. The anode chamber was kept airtight and filledcompletely with 160mgL-1 of glucose substrate as a carbonsource with inoculum added to achieve anaerobic conditions[29]. The cathode chamber was filled with 50mM KMnO4which was dissolved in a neutral medium (100mM, pH7.40) PBS.
2.6. Power Measurement. The open-circuit voltage (OCV)and closed-circuit voltage (CCV) were monitored for 3hours/day after 5 minutes of stabilization for every 5-minute continuous interval using a digital multimeter(DT830D, Haoyue, China). The polarization determinationwas monitored from CCV against external resistors for a15-minute time interval using the Decade Resistance Box(ANSHUMAN, Model: DRB-7T) by varying an externalresistance from 10 kΩ to 200Ω. The current flow across eachresistor was determined by using Ohm’s law: I =V/R andP = IV , where P is power, I is current, and V is measuredvoltage. Similarly, the current (J) and power (P) densitieswere calculated from the ratio of current and power to sur-face area (A) of the anode, respectively.
2.7. COD Removal and CE Measurement. To measure thechemical oxygen demand (COD) and coulombic efficiency(CE), the following formulas would help to explain degrada-tion efficiency [30]:
COD = CODin − CODoutCODin
� �× 100%, ð1Þ
where CODin (mgL-1) is the influent COD and CODout (mgL-1) is the effluent COD.
The coulombic efficiency (CE) was measured as the ratiobetween the electrons transferred to the anode from themicroorganism to the theoretical one that can be achievedif all organic substrates were digested by the microorganismsto generate electrons. Therefore, the CE can be calculated forbatch reactor conditions as follows [30]:
CE = MÐ t0Idt
FbVan ΔCODt, ð2Þ
whereM is the oxygen molecular weight (32), I is the current,and t is the time at the maximum power density. F is Fara-day’s constant, b = 4 indicates the number of electronsexchanged per mole of oxygen, Van is the anodic solutionvolume, and ΔCOD is the change in chemical oxygendemand after time t.
3. Results and Discussions
3.1. UV-Vis Analysis. The UV-Vis spectra of α-MnO2 andPANI as well as α-MnO2/PANI and α-MnO2/NiO/PANInanocomposites are given in Figure 2. In pure α-MnO2, theabsorption peak observed at about 285nm might be an elec-tronic transition from the O2p valence band to the Mn3d con-duction band or from the triply degenerate (t2g) valence bandto the doubly degenerate conduction band (eg) if the shape ispurely tetrahedral, as shown in Figure 2(a) [22]. The absorp-tion peak for PANI found at about 267nm and near 405nmindicated π→π ∗ transitions of the benzenoid ring andpolaron→π ∗ transitions, respectively, as shown in
Glucose substratebased wastewater
Anode electrode
Anode chamber
Digital multimeter
Bubble evolutionon anode electrode
Salt bridge
Cathode electrode
Cathode chamber
Copper wire
Resistor box
Figure 1: Photograph of double-chambered MFC.
4 Journal of Nanomaterials

Figure 2(b) [31]. The shift to a higher wavelength in the α-MnO2/PANI nanocomposite than pure PANI is attributedto the chemical interactions between α-MnO2 NPs and thequinoid ring of the PANI backbone (see Figure 2(c)) [13].In the case of α-MnO2/NiO/PANI nanocomposites shownin Figure 2(d), a blueshift (below 300nm) with a maximumabsorption peak in the near-visible region (300 nm-400 nm)than pure PANI and α-MnO2/PANI may indicate thedecreasing polaron path during PANI conjugation due tothe loading of α-MnO2/NiO NPs in the conductive PANImatrix. According to Mohammad Shafiee et al. [23], a blue-shift found on the UV region might be a strong interactionbetween metal oxide d orbitals and π orbitals found in thepolymeric material. So, the significant redshift above 300nm in the α-MnO2/NiO/PANI nanocomposite supports itsimprovements in electrical conductivity due to the polaronmovement across the extended conjugation [32].
3.2. FTIR Analysis. The FTIR spectra of the pure NPs andtheir nanocomposites are shown in Figure 3. The spectrashown in Figure 3(a) demonstrated that characteristic peaksfound at 3422, 3304, 596, and 495 cm-1 are attributed to –OH surface water stretching, H-O-H bending, O-Mn-Ostretching collision, and Mn-O bond stretching vibrations,respectively [22]. The bands found at 3448, 2924, 1636,1445, 1098, and 969 cm-1 showed N-H stretching, aromaticC-H stretching, quinoid ring stretching vibration, and benze-noid ring vibrations, respectively, as indicated in Figure 3(b)[33]. The reduction in peak intensity of PANI found in α-MnO2/PANI and the reduction in peak intensity at about1098 cm-1 and 969 cm-1 as well as a new peak appearing atabout 508 cm-1 with better peak intensity than pure PANIindicate the clear transformation of PANI in the nanocom-posite (see Figure 3(c)). Moreover, an intense peak found atabout 1094 cm-1 and 511 cm-1 illustrates the successful NiO
interfaced in the MnO2/PANI binary nanocomposite system,as shown in Figure 3(d).
3.3. XRD Analysis. The XRD patterns of pure α-MnO2 andPANI as well as α-MnO2/PANI and α-MnO2/NiO/PANInanocomposites are shown in Figure 4. Figure 4(a) describesthe spectrum of α-MnO2 which has three intense characteris-tics at 2θ = 12:479°, 25.228°, and 37.218°, which are attributedto the diffraction planes found at (110), (220), and (211),respectively, which were indexed with the standard XRD pat-tern of α-MnO2 (Crystallography Open Database (COD),Entry # 96-151-4117 (space group: I4/m (87))) with puretetragonal phase and lattice parameters containing a =9:78760Å and c = 2:86500Å [22]. The XRD pattern shownin Figure 4(b) showed two broad characteristic peaks foundat 2θ = 20:494° and 25.413°, which are indexed to diffractionplanes at (100) and (110), respectively, due to the character-istic chain of PANI [34]. For the α-MnO2/PANI nanocom-posite, its diffraction peaks are almost similar to those ofpure PANI in all planes except changes that occurred at 2θ= 21:151° indexed at (100) (Figure 4(c)). The better peaksymmetry on α-MnO2/PANI than pure PANI showed thatthe presence of α-MnO2 NPs results in its crystal structuredistortion during the polymerization reaction. The spectrumof the α-MnO2/NiO/PANI nanocomposite is similar to that
300 400 500 600 700 8000.0
0.5
1.0
1.5
2.0
(d)
(c)(b)
(a) 𝛼-MnO2 (b) PANI(c) 𝛼-MnO2/PANI(d) 𝛼-MnO2/NiO/PANI
Abs
orba
nce
Wavelength (nm)
(a)
Figure 2: UV-Vis absorption spectra of the α-MnO2 (a), PANI (b),α-MnO2/PANI nanocomposite (c), and α-MnO2/NiO/PANInanocomposite (d).
4000 3600 3200 2800 2400 2000 1600 1200 800 400
40
60
80
100
70
80
90
10060
80
100
80
90
1004000 3600 3200 2800 2400 2000 1600 1200 800 400
495
59633
0434
22Wavenumber (cm–1)
(a)
969
109814
4516
36
2924
3448
(b)
109814
4516
362924
3422
508
(c)
Tran
smitt
ance
(%)
511
109414
45
2924
3422
(d)
(a) 𝛼-MnO2 (b) PANI
(c) 𝛼-MnO2/PANI(d) 𝛼-MnO2/NiO/PANI
Figure 3: FTIR spectra of the α-MnO2 (a), PANI (b), α-MnO2/PANInanocomposite (c), and α-MnO2/NiO/PANI nanocomposite (d).
5Journal of Nanomaterials

of the α-MnO2/PANI nanocomposite, as shown inFigure 4(d). The peak at 2θ = 21:151° and 25.413° may beattributed to the interaction of α-MnO2 insertion in PANIwhile the intense broad peak at 14.208° and 25.684° indexedat (101) and (110) planes is due to the incorporation ofNiO NPs in the conductive PANI matrix. The proof wasidentified and indexed from the standard XRD pattern ofNiO (COD, Entry # 96-432-9324 from Match! 3 phase iden-tification software) and in good agreement with the literature[35]. The overall crystallite size and d-spacing are summa-rized in Table 1.
3.4. Thermal Analysis. The thermal stability of pure α-MnO2and PANI nanomaterials as well as α-MnO2/PANI and α-MnO2/NiO/PANI nanocomposites was examined.Figure 5(a) (i) shows that at the temperature of 146.13°C,the weight loss amounted to be -5.024%, which can be rea-sonably attributed to existing water removal from the surfaceand lattice of the nanostructure, while the weight loss of-8.381% found at a temperature of 888.16°C might be thephase transformation of α-MnO2 to Mn2O3 [36]. InFigure 5(a) (ii–iv), PANI, α-MnO2/PANI, and α-MnO2/-NiO/PANI materials followed a similar weight loss patternin the four major stages of weight loss. The first two stagesof weight loss up to 150°C were attributed to the loss of vol-
atile impurities and surface adsorbed water. The weight lossfrom 150°C to 500°C might be assigned to the removal ofhigher oligomers and other remaining residuals [37]. Thepresence of subsequent weight loss found on the PANI andnanocomposites is due to the thermooxidative decomposi-tion of the PANI chain in the temperature range of 500°C-915°C [37].
The DTA curve shown in Figure 5(b) (i) revealed that α-MnO2 has two endothermic peaks with more stability prop-erty, but the curve shown in Figure 5(b) (ii) attributed tothe exothermic decomposition of PANI at a temperature of210.46°C and 524.31°C is due to the different oxidation prod-ucts [38]. Finally, the DTA curves shown in Figure 5(b) (iiiand iv) that peak at 503.44°C and 467.70°C are for α-MnO2/-PANI and α-MnO2/NiO/PANI, respectively. This revealedthat α-MnO2 and α-MnO2/NiO have a clear interaction withPANI and increase stabilization. The lower temperature peakexistence on both composites than pure PANI is due to thefast loss of different products from the polymer decomposi-tion [39]. The summarized weight loss and peak analysissteps are given in Tables 2 and 3.
Figure 5(c) illustrates the typical DSC thermogram forthe prepared materials. As shown in Figure 5(c) (i), theendothermic temperature found at 181.13°C justified theglass transition (Tg) of α-MnO2 NPs during thermal decom-position to Mn2O3 under N2 atmosphere [22]. The broadendothermic transition temperature at about 116.37°C forPANI is attributed to the bounded water loss, as shown inFigure 5(c) (ii). The fall of broad endothermic peaks on pureα-MnO2 and PANI components showed the clear integrationof α-MnO2 and α-MnO2/NiO in the conductive PANImatrixto form new and stable nanocomposite formations shown inFigure 5(c) (iii and iv).
3.5. SEM-EDX Analysis. Figure 6(a) shows the SEM micro-graphs of the as-prepared α-MnO2 nanoparticles with ball-shaped flower-like architecture. Figure 6(b) shows the non-uniform, rough, and closely packed irregular granular micro-graphs for pure PANI. The clear distribution of α-MnO2nanoparticles over granular PANI is shown in Figure 6(c).The surface modification and binary composite formationsclearly contribute to the better surface size distribution imageof α-MnO2/NiO/PANI (Figure 6(d)). The incorporation ofMnO2 and NiO nanoparticles has changed the granularstructure of PANI into a more ball-like spherical structure.The elemental composition of this ternary composite con-tains Mn, Ni, C, O, and codopant elements (S and Cl) withK traces (see Figure 6(e)). The excess of chlorine resultedfrom its adsorption on the surface of the salt or was trappedin this salt as anilinium chloride (emeraldine salt) during thereaction procedure [40]. The presence of sulfur which origi-nated from APS on the synthesized material improves theelectrocatalytic activity on the bare anode [41]. It is notedthat the detection of elements using EDX is below 0.01wt%[42]. So, in this investigation, the element nitrogen is notdetected on the spectrum. At low energy resolution, peakoverlap may occur between the nitrogen and the polyanilinecarbon signal. To prevent this, some researchers have used ahigh-energy resolution instrument [43].
10 20 30 40 50 60 70 80
0
200
400
600
200
400
600
8000
200
400
600
800
200
400
600
80010 20 30 40 50 60 70 80
(002
)
(521
)
(411
)
(301
)(211
)
(310
)(2
20)
2𝜃 (degree)
(a)
(110
)
(110
)
(200
)
(b)
#(1
00)
(100
)(1
10)
(110
)
(c)
Inte
nsity
(a.u
.)
# NiO
##
#(1
00)
(d)
(a) 𝛼-MnO2 (b) PANI
(c) 𝛼-MnO2/PANI(d) 𝛼-MnO2/NiO/PANI
Figure 4: XRDpatterns of the α-MnO2 (a), PANI (b), α-MnO2/PANInanocomposite (c), and α-MnO2/NiO/PANI nanocomposite (d).
6 Journal of Nanomaterials

3.6. Surface Roughness. Nanomaterial surface roughnessphysical performance analyses have a significant impact onvarious electrochemical applications [44]. Hence, the surfacetopography loaded from SEM images of α-MnO2, PANI, and
their nanocomposites was analyzed using Gwyddion soft-ware, as shown in Figure 7. The degree of surface roughnessthat arises from its parameters quantifies the direct poreoccurrence from 2D (Figure 7(a1, b1, c1, and d1)) and 3D
Table 1: XRD data used for calculating the interlayer spacing and crystallite size of different samples.
Sample type d-spacing (nm) 2θ (degree) FWHM (degree) Miller indices (hkl) Crystallite size (nm)
α-MnO2
0.69792 12.479 0.3875 1 1 0 21.55
0.35008 25.228 0.4050 2 2 0 21.00
0.23830 37.218 0.4453 2 1 1 19.67
Average = 20:74
PANI
0.43275 20.494 2.245 1 0 0 3.56
0.38851 25.413 10.024 1 1 0 0.79
Average = 2:18
α-MnO2/PANI
0.41971 21.151 1.545 1 0 0 12.48
0.35021 25.413 14.831 1 1 0 0.54
Average = 6:51α-MnO2/NiO/PANI 0.62286 14.208 2.835 1 0 1 2.95
0.34657 25.684 11.775 1 1 0 0.72
Average = 1:84
0 200 400 600 800 1000
–14–12–10
–8–6–4–2
0
(iv)
(iii)
(ii)
Wei
ght l
oss (
mg)
Temperature (°C)
(i)
(a)
0 200 400 600 800 1000
–50
0
50
100
150
200
250 (iv)(iii)
(ii)
Mic
rovo
lt en
do d
own
(𝜇V
)
Temperature (°C)
(i)
50 100 150 200T
700 800 900 1000–20
–15
–10
(b)
50 100 150 200 250 300 350 400 45060
40
20
0
–20
(iv)
(iii)
(ii)
Hea
t flow
endo
dow
n (m
W)
Temperature (°C)
(i)
(i) 𝛼-MnO2 (ii) PANI(iii) 𝛼-MnO2/PANI(iv) 𝛼-MnO2/NiO/PANI
(c)
Figure 5: Thermal properties of α-MnO2, PANI, α-MnO2/PANI, and α-MnO2/NiO/PANI samples: TGA (a), DTA (b), and DSC (c) profiles.
7Journal of Nanomaterials

(Figure 7(a2, b2, c2, and d2)) maps. These quantified param-eters are mean roughness (Ra), mean square roughness (Rq),surface skewness (Rsk), and kurtosis coefficient (Rku) [45]. So,from this study, all representative parameters were examinedby the row statistical analysis approach shown in Table 4.The Ra value of the α-MnO2/NiO/PANI nanocompositewas 23:65 ± 5:652 nm. This value was higher than α-MnO2and PANI, and even the α-MnO2/PANI nanocomposite hasa lowerRavalue. This shows that α-MnO2/NiO/PANI has abetter rough surface than others which is a clear indicationfor its best surface area and reactive surface site [46]. Thesame principle is also proved from its Rq (28:55 ± 5:617 nm) values, indicating the degree of surface roughness variationis much higher than others. The Rsk of α-MnO2/NiO/PANInanocomposites shows a higher positive value than otherprepared materials. The higher positive value indicated thatthere are more troughs (regions of positive curvature) thanpeaks on the surface. The Rku value of the α-MnO2/NiO/-PANI nanocomposite was −0:7148 ± 0:566. The results showthat the pore size distribution of the α-MnO2/NiO/PANInanocomposite is more scattered (i.e., the pore size distribu-tion is not compact or more concentrated) than other nano-materials. Therefore, from all parametric information, weconclude that α-MnO2 and NiO nanomaterials are success-fully incorporated in the conductive PANI matrix. Such dis-persion enhances the mechanical properties [47] and thermalstability of the nanocomposites which was supported by thethermal analysis. Not only these, the addition of the abovemetal oxides on the polymer matrix led to increased surfaceroughness and increased multifunctionality by forming hier-archical shapes of the materials [48]. For comparison, allparameters are given in Table 4.
3.7. Electrochemical Property. In order to evaluate the electro-chemical performances of unmodified and modified elec-trodes, CVs were performed under phosphate-bufferedelectrolyte solution, as shown in Figure 8. A pair of quasi-reversible redox peaks was dominated on thenanocomposite-modified electrode from the best fit line of
Ip versus v1/2. The reversibility of these peaks suggests thatthe fabricated nanocomposite does not decompose duringthe charge transfer mechanism, and this helps for fast elec-tron transfer ability. A pair of weak redox peaks was observedat bare PGE with anodic (Ipa) and cathodic peak current (Ipc)values of 0.735mA and 4.379mA, respectively, which waslower than other electrodes, as shown in Figure 8(a). Aftermodification, the peak current observed by PGE was 2.685mA and 6.079mA for Ipa and Ipc, respectively. The bare elec-trode modified by the α-MnO2/NiO/PANI nanocompositewas increased by 3-fold anodic peak current than unmodifiedPGE. The rest of the peak currents determined by α-MnO2,PANI, and α-MnO2/PANI-modified PGE are given inTable 5. The increase in peak current in all modified elec-trodes indicated the better electrocatalytic activity of α-MnO2 NP interaction in the PANI matrix and good attribu-tion of the nanocomposite on the PGE surface. So, the anodicpeak current was found to be higher in α-MnO2/NiO/PA-NI/PGE (2.685mA at a potential of -0.573V) than the othermodified electrodes including bare PGE. This suggests thatdispersion of α-MnO2/NiO bimetallics in the PANI matrixmodified the surface activity of PGE and changes its anodicpeak potential. This activity extends to increase the totalcharge storing performance in the order of α-MnO2/NiO/-PANI/PGE>α-MnO2/PANI/PGE>PANI/PGE>α-MnO2/P-GE>PGE anode electrode, as shown in Figure 8(b). Thisorder facilitates a conductive anode formation. It indicatedthat α-MnO2/NiO/PANI/PGE exhibited a fast electron trans-fer rate that enables to increase electrical conductivity due tohaving lower peak-to-peak potential separation(ΔEp = 0:216V) than other electrodes. The effective surfacearea (effective electroactive area) of the electrode is the mainfactor which affects the electrocatalytic performance activi-ties. So, to determine this area, the equation proposed byRandles-Sevčik was followed [7]:
Ipa = 2:69 × 105� �
n3/2D1/2v1/2AC, ð3Þ
Table 2: Onset degradation temperature and corresponding weight loss.
Weight lossanalysis
α-MnO2 PANI α-MnO2/PANI α-MnO2/NiO/PANI
Step 1st 2nd 1st 2nd 3rd 4th 1st 2nd 3rd 4th 1st 2nd 3rd 4th
Temperature(°C)
146.13 888.16 37.67 205.62 319.78 692.81 19.63 225.68 493.75 509.59 84.70 198.49 473.42 914.35
TGA (mg) -0.660 -1.101 -0.072 -4.393 -8.732 -13.057 -0.044 -1.433 -5.440 -6.917 -0.644 -2.088 -8.855 -11.589
TGA (%) -5.024 -8.381 -0.520 -31.721 -63.051 -94.281 -0.525 -17.092 -64.885 -82.502 -4.460 -14.459 -61.318 -80.251
TGA= thermogravimetric analysis.
Table 3: Differential thermal analysis (DTA) results.
DTA peak analysis α-MnO2 PANI α-MnO2/PANI α-MnO2/NiO/PANIStep 1st 2nd 1st 2nd 1st 2nd 1st 2nd
Temperature (°C) 146.13 888.16 210.46 524.31 68.25 503.44 105.12 467.70
DTA (μV) -9.68 -18.57 -56.90 84.79 -9.36 208.79 -25.30 231.86
8 Journal of Nanomaterials

where Ipa is the anodic peak current (A), n is the number of
electron transfer, D is the diffusion coefficient of HPO2−4
(7:60 × 10−6 cm2/s [49]), v is the scanning rate (V s-1), A isthe effective electroactive area (m2), and C is concentrationof PBS (mol cm-3). Their effective areas were described tobe 0.00269, 0.00695, 0.00945, 0.00942, and 0.00984 cm2 forunmodified PGE, α-MnO2/PGE, PANI/PGE, α-MnO2/PA-NI/PGE, and α-MnO2/NiO/PANI/PGE, respectively. These
results suggest that α-MnO2/NiO/PANI nanocomposite-modified PGE has the largest effective surface area whichhelps to facilitate a fast electrocatalytic activity as observedfrom its high peak current.
To visualize the possible redox reactions found at theelectrode, dissolved oxygen PBS interfaces are as follows [50]:
M sð Þ +HPO2−4 aqð Þ⇄M3PO4 sð Þ +H+ aqð Þ + 3e− ð4Þ
30kV ×10,000 1𝜇m 0088 10 47 SEI
(a)
30kV ×10,000 1𝜇m 0088 11 49 SEI
(b)
30kV ×10,000 1𝜇m 0088 11 49 SEI
(c)
30kV ×10,000 1𝜇m 0088 11 49 SEI
(d)
Element Line type wt% Atomic%COSClK
MnNi
Total:
K series 52.0826.24.188.433.012.763.33100 100
66.4425.1
23.641.180.770.87
K seriesK seriesK seriesK seriesK seriesK series
(e)
Figure 6: SEM topographies of (a) α-MnO2, (b) PANI, (c) α-MnO2/PANI, and (d) α-MnO2/NiO/PANI and (e) EDX spectrum of α-MnO2/NiO/PANI.
9Journal of Nanomaterials

2 𝜇m
121 nm
(a1) (a2)
11010090807060504030200
y: 9.2 𝜇m x: 12.0 𝜇m
0.12 𝜇m
0.00 𝜇m
2 𝜇m
(b1) (b2)
11010090807060504030200
y: 9.8 𝜇m x: 12.0 𝜇m
0.12 𝜇m
0.00 𝜇m
2 𝜇m
119 nm
(c1) (c2)
11010090807060504030200
y: 9.3 𝜇m x: 12.0 𝜇m
119 nm
0 nm
2 𝜇m
140 nm
(d1) (d2)
110120130
10090807060504030200
y: 8.9 𝜇m x: 12.0 𝜇m
0.14 𝜇m
0.00 𝜇m
Figure 7: 2D and 3D SEM images of α-MnO2 (a1, a2), PANI (b1, b2), α-MnO2/PANI (c1, c2), and α-MnO2/NiO/PANI (d1, d2).
10 Journal of Nanomaterials

whereM stands for catalysts such as PGE, α-MnO2, PANI, α-MnO2/PANI, and α-MnO2/NiO/PANI.
As observed from the CV result, α-MnO2/NiO/PANInanocomposite-modified PGE was the best electrode amongthe rest. Therefore, the effect of the scan rate on the cyclicvoltammetric performance of α-MnO2/NiO/PANI/PGE isshown in Figure 9(a) at the scan rates (5-200mVs-1). Theresponses of both Ipa and Ipc currents gradually increase withincreasing scan rates along with oxidation and reduction
peak potentials that shift to the right and left, respectively.Figure 9(b) justifies the linear dependence of both Ipa andIpc versus the square root of the scan rate with linear regres-
sion equations of Ipa = 0:30405v1/2 + 0:29912 (R2 = 0:97) andIpc = −0:63452v1/2 − 1:1702 (R2 = 0:98). The dependence ofpeak potentials (Epa and Epc) against the scan rate is alsoshown in Figure 9(c). Hence, we imply that the nature ofthe redox process occurring on the electrode surface is nearly
Table 4: Surface roughness row statistical quantity results for different samples acquired from SEM entire image analysis.
Catalyst Ra (nm) Rq (nm) Rsk Rku
α-MnO2 13:11 ± 3:163 17:21 ± 3:587 −0:8903 ± 0:5439 0:9627 ± 1:798PANI 19:96 ± 2:264 24:22 ± 2:423 −0:3789 ± 0:1872 −0:5079 ± 0:342α-MnO2/PANI 22:92 ± 3:648 28:15 ± 3:645 −0:6072 ± 0:3500 −0:2429 ± 0:709α-MnO2/NiO/PANI 23:65 ± 5:652 28:55 ± 5:617 −0:2178 ± 0:4192 −0:7148 ± 0:566Note: Ra: mean roughness; Rq: mean square roughness (RMS); Rsk : surface skewness; Rku : kurtosis coefficient.
–0.8 –0.7 –0.6 –0.5 –0.4 –0.3 –0.2
–6–5–4–3–2–1
012
Curr
ent (
mV
)
Potential vs. Ag/AgCl (V)
(a)
30 40 50 60 70 80 90
–0.024
–0.020
–0.016
–0.012
–0.008
–0.004
0.000
PGE𝛼-MnO2/PGEPANI/PGE𝛼-MnO2/PANI/PGE𝛼-MnO2/NiO/PANI/PGE
Q-Q
0 (C)
Time (second)
(b)
Figure 8: Cyclic voltammogram (a) and total charge exchanged Q −Q0 (b) of bare PGE (black line), α-MnO2/PGE (red line), PANI/PGE(blue line), α-MnO2/PANI/PGE (green line), and α-MnO2/NiO/PANI/PGE (pink line) electrodes in 100mM PBS (pH = 7:4) at a scan rateof 50mV s-1.
Table 5: Summary of the redox current and potential peak formed on the prepared anode electrodes.
Electrode PGE α-MnO2/PGE PANI/PGE α-MnO2/PANI/PGE α-MnO2/NiO/PANI/PGE
Ipa (mA) 0.735 1.897 2.579 2.569 2.685
Ipc (mA) 4.379 5.015 5.895 5.975 6.079
Ip,av (mA) 2.557 3.456 4.237 4.272 4.382
Epa (V) vs. Ag/AgCl -0.543 -0.553 -0.568 -0.570 -0.573
Epc (V) vs. Ag/AgCl -0.800 -0.799 -0.798 -0.794 -0.789
ΔEp = Epa − Epc (V) vs. Ag/AgCl 0.257 0.246 0.230 0.224 0.216
(Q-Q0)average (mC) 5.291 17.267 20.659 23.258 24.456
Average peak current ðIp,avÞ = ðIpa + IpcÞ/2.
11Journal of Nanomaterials

reversible (quasi-reversible) [20] and is clearly a diffusion-controlled process [51]. The anodic peak potential (Epa)was highly correlated with the natural logarithm of the scanrate (ln v) for α-MnO2/NiO/PANI/PGE in PBS (pH = 7:4)(Figure 9(d)). To evaluate the electrochemical parametersfrom such linearity, the Laviron equation was applied asfollows [52]:
Epa = Eo + RT1 − αð ÞnF + RT
1 − αð ÞnF ln v, ð5Þ
where Eo is the formal potential (Epa + Epc/2), α is the chargetransfer coefficient of the system, v is the scan rate, n is thenumber of electron transfer, R is the universal gas constant
(8.314 Jmol-1 K-1), T = 298K, F = 96,493 Cmol−1, and ks isthe heterogeneous electron transfer rate constant. From theslope of Epa vs. ln v, α = 0:51. So, if α is closer to 0.5, the elec-trode reaction is quasi-reversible and governed by thediffusion-controlled process [53].
The Laviron equation [54] was applied to calculate ks foreach electrode as well as electron transfer at each scan rate:
log ks = α log 1 − αð Þ + 1 − αð Þ log α − log RTnFv
−α 1 − αð ÞnF2:3RT ΔEp:
ð6Þ
The calculated ks value of α-MnO2/NiO/PANI/PGE atconstant scan rates of 50mVs-1 was higher than the rest of
–0.8 –0.7 –0.6 –0.5 –0.4 –0.3 –0.2 –0.1 0.0
–10
–8
–6
–4
–2
0
2
4
6
5 mVs–1
10 mVs–1
20 mVs–1
50 mVs–1
100 mVs–1
200 mVs–1
Curr
ent (
mA
)
Potential vs. Ag/AgCl (V)
(a)
2 4 6 8 10 12 14 16
–12
–8
–4
0
4
8
Y = –0.63452X-1.1702R2 = 0.98318Ipc vs. v1/2
Anodic peak current (Ipa)
Cathodic peak current (Ipc)
Peak
curr
ent (
mV
)
Scan rate1/2 (mVs–1)1/2
Y = 0.30405X+0.29912R2 = 0.96621Ipa vs. v1/2
(b)
0 25 50 75 100 125 150 175 200 225
–0.80
–0.75
–0.70
–0.65
–0.60
–0.55
Anodic peak potential (Epa)
Cathodic peak potential (Epc)
Ep v
s. A
g/A
gCl (
V)
Scan rate (mVs–1)
(c)
3.0 3.5 4.0 4.5 5.0 5.5
Epa = 0.01742 ln v-0.63774, R2 = 0.99723
Epc = -0.02068 ln v-0.69805, R2 = 0.81521
–0.80
–0.75
–0.70
–0.65
–0.60
–0.55E
p vs.
Ag/
AgC
l (V
)
lnv (mVs–1)
Epa
Epc
(d)
Figure 9: Cyclic voltammograms of α-MnO2/NiO/PANI/PGE in pH7.4 PBS at different scan rates (a), linear plots of peak currents versus thesquare root of the scan rate (v1/2) (b), linear plots of peak potential versus scan rates (c), and linear plots of peak potential versus the naturallogarithm of the scan rate (ln v) (d).
12 Journal of Nanomaterials

the electrode, and this indicated that the α-MnO2/NiO/PANInanocomposite is a good facilitator for direct electron trans-fer between electroactive species and bare PGE (see Table 6).The direct dependence of ks over peak potential is also givenin Table 7.
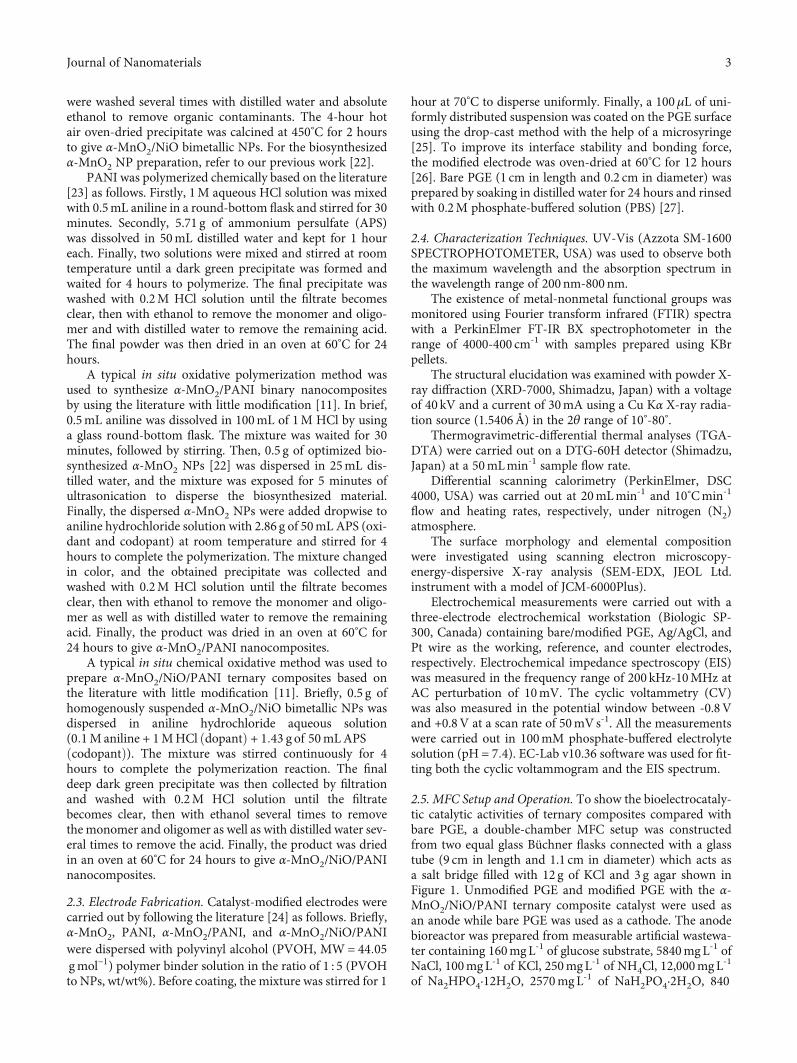
EIS is an efficient technique to estimate electron transferproperties between electrode surfaces and electrolyte inter-faces during redox reactions [52]. The Nyquist plot shownin Figure 10(a) describes that both the α-MnO2/PANI andα-MnO2/NiO/PANI composite-modified electrodes havelower solution and charge transfer resistances (Rs and Rct)in the high-frequency regions due to their electrical conduc-tivity improvement. The Rs was determined from a higherfrequency intercept on the real axis. The value was in therange of 8.86-9.26 Ω for α-MnO2/PANI and α-MnO2/NiO/-PANI composite-modified electrodes. The Rct values of theα-MnO2/NiO/PANI-modified PGE (788.9Ω) and α-MnO2/-PANI/PGE (958Ω) were lower than that of unmodified PGE(1519Ω), indicating that the modified anode surface hadimproved its electrocatalytic activity and surface roughnessmodification which is responsible for conductive biofilmattachment and EAM growth. The same behavior is alsoobserved from bode plots of frequency-dependent imped-ance magnitude (log ∣ Z ∣ ) (Figure 10(b)). Their diffusionresistance (Zw) found in the lower frequency region is alsolower than pure α-MnO2 and PANI-modified PGE (seeTable 8). The lower diffusion resistance found on thecomposite-modified PGE showed that the electrode couldhave a capacitive characteristic due to the finding of phaseangles found in the range between -45° and -90° withfrequency lower than 100Hz, as shown in Table 8 andFigure 10(c). Since the capacitive behavior is governed forall electrodes in this phase angle range, and this also suggeststheir good redox behavior. In the frequency range of 100Hz-104Hz, the phase angles decrease rapidly and are close tozero, indicating less electrolyte ion adsorption on electrodesurfaces, and resistive behavior is dominated [55]. From this,it is evidenced that the current generation signal in the giventime is much better than bare PGE (Figure 10(d)). InFigure 10(e), as the number of cycles increases, the stable cur-rent production by α-MnO2/NiO/PANI ternary composite-modified PGE becomes higher in efficiency than that by α-MnO2/PANI binary composite-modified PGE due to thelong life cycle, high metallic conductivity, and fast charge/-discharge mechanism nature of NiO NMs [56].
3.8. MFC Application. At steady-state conditions, the cata-lytic activity investigations of composite-modified electrodesunder steady-state conditions are shown in Figure 11. Thehighest open-circuit voltage (OCV) elucidated by α-MnO2/-NiO/PANI/PGE was 616:72 ± 56:65mV which was higherthan bare PGE with values of 222:36 ± 8:16mV. A total of180-minute measurements per day were operated for eachelectrode (Figure 11(a)). On the second day, the 3-hourmeasurement was the better time to perform MFC using α-MnO2/NiO/PANI/PGE than unmodified PGE. From thesecontinuous operations, the higher OCV determinationthroughout the day using α-MnO2/NiO/PANI ternarycomposite-modified PGE was due to the effective adhesionbetween the E. coli colony and the α-MnO2/NiO/PANI cata-lyst (Figure 11(b)); these may also be attributed to highcharge density capacity after forming the bioanode. Theseinteractions cause increasing conductive biofilm formationby increasing its active surface area on the electrode surfaceswhich leads to improved fast electron transfer rates on theanode surface in the MFC operation. Each day, OCV valuesproduced by two electrodes are given in Table 9. So, the pre-pared ternary composite is considered an effective catalyst toincrease MFC performances under steady-state conditions.
At non-steady-state conditions, the electrocatalytic activ-ity of α-MnO2/NiO/PANI composite-modified PGE andunmodified PGE MFC performance tests is given inFigure 12(a). The mean maximum power density of 506.96mWm-2 was delivered with α-MnO2/NiO/PANIcomposite-modified PGE while 65.74mWm-2 was obtainedusing bare PGE. The current density formed at this maxi-mum power density was 2710.51 and 436.52mAm-2 for α-MnO2/NiO/PANI/PGE and PGE, respectively. The capacityof composite-modified electrodes was 7.71 and 6.21 timeshigher in power and current densities than that of unmodi-fied PGE. The calculated internal resistance obtained fromslopes of measured voltage versus current density [57] was1183.29 Ω and 3745.74Ω for α-MnO2/NiO/PANI/PGE(R2 = 0:97916) and PGE (R2 = 0:98858), respectively. Anincrease in surface areas lowers the internal resistance foundon the modified electrodes, indicating fast extracellular elec-tron transfer between the E. coli and the bioanode. The goodelectron transfer between π orbitals of PANI and d orbitals ofMn4+-Ni2+ enables the α-MnO2/NiO/PANI composite to beeffective in power density during glucose oxidation in thegiven time of operations (Figure 12(b)). Thus, the charge
Table 6: Summary of the heterogeneous electron transfer rate constant for different anode electrodes at 50mV s-1.
Electrode PGE α-MnO2/PGE PANI/PGE α-MnO2/PANI/PGE α-MnO2/NiO/PANI/PGE
ΔEp = Epa − Epc (V) vs. Ag/AgCl 0.257 0.246 0.230 0.224 0.216
ks (s-1) 2.91776971 2.917832732 2.917924402 2.91795878 2.918004616
Table 7: A heterogeneous electron transfer rate constant for α-MnO2/NiO/PANI/PGE at different scan rates.
Scan rate (mVs-1) 5 10 20 50 100 200
ΔEp = Epa − Epc (V) vs. Ag/AgCl 0.182 0.175 0.169 0.216 0.242 0.256
ks (s-1) 0.292 0.584 1.167 2.918 5.836 11.671
13Journal of Nanomaterials
0 20 40 60 80 100 120 140 160 180 2000
20
40
60
80
100
120
140
160
180
W.ER.E
Z′′
(k𝛺
)
Z′′
(𝛺)
R1R2
C1
w1
0 5 10 15 20 25Z′ (𝛺)
Z′ (k𝛺)
300
10
20
30
40
50
60
(a)
–2 –1 0 1 2 3 4 5
1
2
3
4
5
Log
(|Z|)
(𝛺) Lo
g (|Z
|) (𝛺
)
Log f (Hz)
3.0 3.5 4.0 4.5 5.0
1.0
1.1
1.2
Log f (Hz)
(b)
–2 –1 0 1 2 3 4 5 6 7 8 960
40
20
0
–20
–40
–60
–80
Phas
e ang
le (d
egre
e)
Log f (Hz)
–1.8 –1.5 –1.2 –0.9
–20
–40
–60
Phas
e ang
le (d
egre
e)
Log f (Hz)
(c)
40 60 80 100 120 140 160 180 200
–0.005
0.000
0.005
0.010
0.015
Curr
ent (
mA
)
Time (second)
39 42 45 48
0.000
0.006
0.012
0.018
Curr
ent (
mA
)
Time (second)
(d)
0 1000000 2000000 3000000 4000000 50000000.000.010.020.030.040.050.060.070.080.090.10
Curr
ent (
mA
)
Number of cycle
PGE𝛼-MnO2/PGEPANI/PGE
𝛼-MnO2/PANI/PGE𝛼-MnO2/NiO/PANI/PGE
(e)
Figure 10: Nyquist plot (a) (inset represents the equivalent circuit model after impedance fitting), bode-magnitude (b), bode-phase angle (c),current vs. time (d), and current vs. number of cycles (e) for bare PGE, PANI/PGE, α-MnO2/PGE, α-MnO2/PANI/PGE, and α-MnO2/NiO/PANI/PGE.
14 Journal of Nanomaterials

storage capacity from current discharge as a function of timein the given areas of electrodes was much higher in modifiedelectrodes than bare PGE (see Figure 12(c)). The flow of freecharge hindered using bare PGEmight arise due to its highestinternal resistance found from the polarization curve. Thisproved that the higher electrical conductivity elucidated fromelectrochemical performance analysis showed that α-MnO2/-NiO/PANI/PGE produces a higher power output at a lowerexternal load (Figure 12(d)). Hence, the area under time-
dependent current at higher external resistance becomestoo low due to the continuous charge loss from glucosedecomposition. Therefore, the good integration betweenbimetallic oxides with conductive PANI enhances MFCperformance.
3.9. Bioanode Morphology Analysis. The surface morphologyof the anode surface is shown in Figure 13. Before MFC oper-ation, an irregular (with flakes in shape) rough surface
Table 8: Electrochemical parameters of the bare PGE, α-MnO2/PGE, PANI/PGE, α-MnO2/PANI/PGE, and α-MnO2/NiO/PANI/PGEelectrodes in 100mM PBS (pH = 7:4) supporting electrolytes.
Electrode R1 (Rs) (Ω) R2 (Rct) (Ω) C2 (Cdl) (F) W2 (Zw) (Ω s-1/2) log Z (Ω) θ (deg) f (kHz)
PGE 11.91 1519 5:12 × 10−5 25,283 1.07 -72.851 19.15
α-MnO2/PGE 11.54 1119 7:42 × 10−5 13,283 1.06 -70.039 28.32
PANI/PGE 10.47 1071 8:50 × 10−5 736.1 1.01 -72.854 19.15
α-MnO2/PANI/PGE 8.86 958 8:01 × 10−4 448.5 0.94 -73.182 19.15
α-MnO2/NiO/PANI/PGE 9.26 788.9 9:26 × 10−5 12,000 0.96 -73.048 19.15
0 180 360 540 7200
100
200
300
400
500
600
700
800
900
1000
PGE𝛼-MnO2/NiO/PANI/PGE
Ope
n ci
rcui
t vol
tage
(mV
)
Time (minute)
1st day 2nd day 3rd day 4th day
(a)
0 1 2 3 4 50
100
200
300
400
500
600
700
800
900
Ope
n ci
rcui
t vol
tage
(mV
)
Days (hour)
PGE𝛼-MnO2/NiO/PANI/PGE
(b)
Figure 11: Open-circuit voltage (a) and average open-circuit voltage (b) as a function of time for unmodified PGE and α-MnO2/NiO/PANI/PGE.
Table 9: OCV output obtained using bare PGE and α-MnO2/NiO/PANI-modified PGE anode materials.
Time of operation Electrode Mean ± SD (mV) Minimum (mV) Maximum (mV)
1st dayPGE 164:98 ± 24:84 137 239
α-MnO2/NiO/PANI/PGE 473:39 ± 13:29 463 513
2nd dayPGE 166:92 ± 27:03 142 260
α-MnO2/NiO/PANI/PGE 616:72 ± 56:65 525 714
3rd dayPGE 195:83 ± 22:92 176 291
α-MnO2/NiO/PANI/PGE 504:25 ± 36:61 478 592
4th dayPGE 222:36 ± 8:16 212 263
α-MnO2/NiO/PANI/PGE 466:92 ± 27:03 442 560
15Journal of Nanomaterials

topography of bare PGE is shown in Figure 13(a). The rough-ness of this surface is attributed to the granularity of the con-ductive materials [58]. After PGE is immersed in the anodebioreactor, the surface morphology of PGE is clearly coveredby small colonies of E. coli which forms a biofilm due to thelittle hydrophilicity nature of bare PGE, as shown inFigure 13(b). However, such adherence of E. coli on thePGE surface was ineffective for power generation duringMFC operations. This is due to the poor capacitive and littlesubstrate degradation activity of carbon electrode materialsin MFC performance [10]. So, to solve these limitations, barePGE was successfully modified with α-MnO2/NiO/PANI ter-nary composites. As shown in Figure 13(c), the integrationbetween α-MnO2/NiO binary composites in the conductive
PANI matrix exhibited a higher bacterial colony. It isobserved that the distribution of bimetallic oxide with posi-tively charged PANI enhances the glucose electrochemicalreactions. Such reaction was enabled to facilitate better powerproduction than bare PGE, as described from the MFC testanalysis. This is due to the formation of thick conductive bio-film as evidenced from the high-magnification surface topog-raphy view, as shown in Figures 13(d) and 13(e). From thismagnified image, E. coli cells are tightly attached to the mod-ified anode surface to form the bioanode electrode. Xu et al.[59] have reported that when a bare carbon electrode ismodified by conductive composites from PANI, its surfaceroughness and biocompatibility are increased, which makesit more comfortable for more biofilms to attach, helping it
0 1000 2000 3000 4000 50000
100
200
300
400
500
600
700
800
900
Current density (mA m–2)
Clos
ed ci
rcui
t vol
tage
(mV
)
0
100
200
300
400
500
600
700
Pow
er d
ensit
y (m
W m
–2)
Measured voltagePGE𝛼-MnO2/NiO/PANI/PGE
Power densityPGE𝛼-MnO2/NiO/PANI/PGE
(a)
0 50 100 150 200 250 300 350 4000
100
200
300
400
500
600
700
(180, 506.96)
Pow
er d
ensit
y (m
W m
–2)
Time (minute)
(280, 65.74)
(i) PGE(ii) 𝛼-MnO2/NiO/PANI/PGE
(b)
0 50 100 150 200 250 300 350 4000
1000
2000
3000
4000
5000
(200, 820.29)
Curr
ent d
ensit
y (m
A m
–2)
Time (minute)
(180, 2710.51)
PGE𝛼-MnO2/NiO/PANI/PGE
(c)
–1 0 1 2 3 4 5 6 7 8 9 10 110
100
200
300
400
500
600
700
(6000, 65.74)Pow
er d
ensit
y (m
W m
–2)
External resistance (k𝛺)
(1000, 506.96)
PGE𝛼-MnO2/NiO/PANI/PGE
(d)
Figure 12: Power density and polarization curves (a), power density versus time (b), current density versus time (c), and power densitydependence external load (d) for PGE and α-MnO2/NiO/PANI/PGE.
16 Journal of Nanomaterials

become more conductive [59]. Finally, this enabled the crea-tion of a direct electron transfer improvement between E. coliouter membrane c-type cytochromes and α-MnO2/NiO/-PANI/PGE for better MFC performance operation.
3.10. COD Removal and CE Performance. In addition to gen-erating electricity, treating glucose-based artificial wastewaterusing bare PGE and α-MnO2/NiO/PANI-modified PGE isshown in Figures 14(a) and 14(b). It is observed that thehigher glucose degradation performance was performed with
a lower concentration and higher removal efficiency of 30.37mgL-1 and 81.92%, respectively, using α-MnO2/NiO/PA-NI/PGE. Degradation efficiency using bare PGE was toolow due to the slower glucose biodegradation rate, indicatingless COD removal efficiency over a given time period. Thus,electron transfer from decomposed glucose to the bare anodeis too slow while faster in α-MnO2/NiO/PANI ternarycomposite-modified PGE due to their surface modification.To support this, the degree (fraction) of electrons producedfrom glucose to modified PGE was higher in terms of CE with
(a)
(c)
(d) (e)
(b)
High-vac. SED PC-std. 15 kV10 𝜇m
× 2000 09/06/2020
High-vac. SED PC-std. 15 kV500 𝜇m× 34
High-vac. SED PC-std. 15 kV20 𝜇m
× 1500
09/06/2020
09/06/2020 High-vac. SED PC-std. 15 kV20 𝜇m
× 1500 09/06/2020
High-vac. SED PC-std. 15 kV20 𝜇m
× 750 09/06/2020
Figure 13: SEM micrograph of bare PGE (a), biocatalyst-modified PGE (b), α-MnO2/NiO/PANI composite-modified PGE (c), andcomposite-modified electrodes at high resolution (d, e).
17Journal of Nanomaterials

a value of 10.30% while PGE alone has a small CE value of2.29%, as shown in Figure 14(b) and Table 10. The fasterelectron transfer using ternary composite-modified PGEwas also effective in bioelectricity generation conversion dur-ing the time of treatment at the same conditions. Literaturesurvey described that the lower CE values have indicated thata portion of electrons extracted from substrates are used forthe biosynthesis of cellular compounds, not for completebioelectricity production, whereas higher CE would indicatethe dominance of bioelectricity conversion rather than forbiosynthesis [60].
4. Conclusion
α-MnO2/NiO/PANI ternary composites are prepared by dis-persing the optimized biosynthesized α-MnO2/NiO bimetal-lic NPs in the conductive PANI matrix using the in situchemical polymerization method. The prepared ternarycomposites showed to be best in the degree of roughnessand charge storing performances with a value of 23:65 ±5:652 nm and 24.456mC. This property clearly increasesthe biocompatibility, electrical conductivity, and life cycle ofthe anode in MFC by improving its performance towards amaximum power density of 506.96mWm-2 with a COD
removal of 81.92%. The power density produced by the α-MnO2/NiO/PANI ternary composite-modified anode is bet-ter in efficiency than power output which was done by bio-synthesized α-MnO2/NiO bimetallic NPs with a mean valueof 412.24mWm-2 [21]. The CE produced by the α-MnO2/-NiO/PANI/PGE ternary composite was 10.30% which wasalmost 5-fold better than bare PGE with a value of 2.29%.Therefore, this study contributes to advances in the use ofbiosynthesized α-MnO2/NiO-based PANI ternary compos-ites as an emerging cost-effective catalyst for anode modifiercatalysts in energy conversion and simultaneous wastewatertreatment application in MFC.
Data Availability
Data are available in the manuscript.
Conflicts of Interest
The authors declare no conflict of interest in this paper.
Acknowledgments
The authors acknowledge Adama Science and TechnologyUniversity for financial support.
020406080
100120140160180200
Initial CODFinal COD
COD
(mg
L–1)
Electrodes
PGE 𝛼-MnO2/NiO/PANI/PGE
(a)
0102030405060708090
100
PGE
COD%CE%
Electrodes
Rem
oval
effici
ency
(%)
0
3
6
9
12
15
Coul
ombi
c effi
cien
cy (%
)
𝛼-MnO2/NiO/PANI/PGE
(b)
Figure 14: (a) Concentration and (b) removal efficiency performances using bare PGE and α-MnO2/NiO/PANI-modified PGE under closed-circuit conditions.
Table 10: Summary of triplicate final concentration (CODf) and their COD removal efficiency values for different anode electrodes duringCCV measurements under optimum conditions.
Anode electrodeExperiment 1
(CODf (mg L-1))Experiment 2
(CODf (mg L-1))Experiment 3
(CODf (mg L-1))Mean ± SD(mg L-1)
Removalefficiency(COD%)
Coulombicefficiency (CE%)
PGE 50.92 51.20 62.39 54:84 ± 6:54 67.00 2.29
α-MnO2/NiO/PANI/PGE
31.59 28.10 30.37 30:02 ± 1:77 81.92 10.30
(Mean ± SD) is calculated using OriginPro 8 software. SD = standard deviation; substrate = (glucose, CODo, 166mg/L).Note: both COD removal efficiency andCE were calculated from the mean values of CODf.
18 Journal of Nanomaterials

References
[1] A. Parkash, “Microbial fuel cells: a source of bioenergy,” Jour-nal of Microbial and Biochemical Technology, vol. 8, no. 3,pp. 247–255, 2016.
[2] X. Zhao, T. Tian, M. Guo, X. Liu, and X. Liu, “Cauliflower-likepolypyrrole@MnO2 modified carbon cloth as a capacitiveanode for high-performance microbial fuel cells,” Journal ofChemical Technology and Biotechnology, vol. 95, no. 1,pp. 163–172, 2020.
[3] Y. Dessie, S. Tadesse, and R. Eswaramoorthy, “Review onmanganese oxide based biocatalyst in microbial fuel cell: nano-composite approach,” Materials Science in Energy Technology,vol. 3, pp. 136–149, 2020.
[4] Y. Dessie, S. Tadesse, R. Eswaramoorthy, and B. Abebe,“Recent developments in manganese oxide based nanomater-ials with oxygen reduction reaction functionalities for energyconversion and storage applications: a review,” Journal of Sci-ence: Advanced Materials and Devices, vol. 4, no. 3, pp. 353–369, 2019.
[5] H. Xu, X. Quan, Z. Xiao, and L. Chen, “Effect of anodes deco-ration with metal and metal oxides nanoparticles on pharma-ceutically active compounds removal and power generation inmicrobial fuel cells,” Chemical Engineering Journal, vol. 335,no. August 2017, pp. 539–547, 2018.
[6] Y. Qiao, X. S. Wu, and C. M. Li, “Interfacial electron transfer of_Shewanella putrefaciens_ enhanced by nanoflaky nickeloxide array in microbial fuel cells,” Journal of Power Sources,vol. 266, pp. 226–231, 2014.
[7] X. Wan, S. Yang, Z. Cai et al., “Facile synthesis of MnO2 nano-flowers/N-doped reduced graphene oxide composite and itsapplication for simultaneous determination of dopamine anduric acid,” Nanomaterials, vol. 9, no. 6, p. 847, 2019.
[8] S. Mathew and P. C. Thomas, “Fabrication of polyanilinenanocomposites as electrode material for power generationin microbial fuel cells,” Materials Today: Proceedings, vol. 33,pp. 1415–1419, 2020.
[9] S. Shivakumara and N. Munichandraiah, “In-situ preparationof nanostructured α-MnO2/polypyrrole hybrid compositeelectrode materials for high performance supercapacitor,”Journal of Alloys and Compounds, vol. 787, pp. 1044–1050,2019.
[10] D. Zhong, X. Liao, Y. Liu, N. Zhong, and Y. Xu, “Enhancedelectricity generation performance and dye wastewater degra-dation of microbial fuel cell by using a petaline [email pro-tected] polyaniline-carbon felt anode,” BioresourceTechnology, vol. 258, no. November 2017, pp. 125–134, 2018.
[11] H. K. Inamdar, R. B. Basavaraj, H. Nagabhushana et al., “DCconductivity study of polyaniline/NiO nanocomposites pre-pared through green synthesis,”Materials Today: Proceedings,vol. 3, no. 10, pp. 3850–3854, 2016.
[12] J. He, M. Wang, W. Wang et al., “Hierarchical mesoporousNiO / MnO 2 @ PANI core- shell microspheres highly efficientand stable bifunctional electrocatalysts for oxygen evolutionand reduction reactions,” ACS Applied Materials & Interfaces,vol. 9, no. 49, pp. 42676–42687, 2017.
[13] O. E. Fayemi, A. S. Adekunle, and E. E. Ebenso, “Electrochem-ical detection of phenanthrene using nickel oxide doped PANInanofiber based modified electrodes,” Journal of Nanomater-ials, vol. 2016, Article ID 9614897, 12 pages, 2016.
[14] F. Nourbakhsh, M. Mohsennia, and M. Pazouki, “Nickel oxi-de/carbon nanotube/polyaniline nanocomposite as bifunc-
tional anode catalyst for high-performance Shewanella-baseddual-chamber microbial fuel cell,” Bioprocess and BiosystemsEngineering, vol. 40, no. 11, pp. 1669–1677, 2017.
[15] T. H. Han, N. Parveen, J. H. Shim, A. T. N. Nguyen,N. Mahato, and M. H. Cho, “Ternary composite of polyanilinegraphene and TiO2as a bifunctional catalyst to enhance theperformance of both the bioanode and cathode of a microbialfuel cell,” Industrial and Engineering Chemistry Research,vol. 57, no. 19, pp. 6705–6713, 2018.
[16] C. Zhao, P. Gai, C. Liu et al., “Polyaniline networks grown ongraphene nanoribbons-coated carbon paper with a synergisticeffect for high-performance microbial fuel cells,” Journal ofMaterials Chemistry A, vol. 1, no. 40, pp. 12587–12594, 2013.
[17] W. Chen, Z. Liu, G. Su et al., “Composite-modified anode byMnO2/polypyrrole in marine benthic microbial fuel cells andits electrochemical performance,” International Journal ofEnergy Research, vol. 41, no. 6, pp. 845–853, 2017.
[18] Y. Wang, Q. Wen, Y. Chen, and L. Qi, “A novel polyanilineinterlayer manganese dioxide composite anode for high- per-formance microbial fuel cell,” Journal of the Taiwan Instituteof Chemical Engineers, vol. 75, pp. 112–118, 2017.
[19] H. Yuan, L. Deng, Y. Chen, and Y. Yuan, “MnO2/polypyrro-le/MnO2 multi- walled-nanotube-modified anode for high-performance microbial fuel cells,” Electrochimica Acta,vol. 196, pp. 280–285, 2016.
[20] P. Mishra and R. Jain, “Electrochemical deposition ofMWCNT-MnO2/PPy nano- composite application for micro-bial fuel cells,” International Journal of Hydrogen Energy,vol. 41, no. 47, pp. 22394–22405, 2016.
[21] Y. Dessie, S. Tadesse, R. Eswaramoorthy, and E. Abdisa,“Bimetallic Mn-Ni oxide nanoparticles: green synthesis, opti-mization and its low-cost anode modifier catalyst in microbialfuel cell,” Nano-Structures and Nano-Objects, vol. 25, article100663, 2021.
[22] Y. Dessie, S. Tadesse, and R. Eswaramoorthy, “Physicochemi-cal parameter influences and their optimization on the biosyn-thesis of MnO2 nanoparticles using _Vernonia amygdalina_leaf extract,” Arabian Journal of Chemistry, vol. 13, no. 8,pp. 6472–6492, 2020.
[23] M. R. Mohammad Shafiee, A. Sattari, M. Kargar, andM. Ghashang, “MnO2/Cr2O3/PANI nanocomposites pre-pared byin situoxidation polymerization method: optical andelectrical behaviors,” Journal of Applied Polymer Science,vol. 136, no. 15, article 47219, 2019.
[24] M. Harshiny, N. Samsudeen, R. J. Kameswara, andM. Matheswaran, “Biosynthesized FeO nanoparticles coatedcarbon anode for improving the performance of microbial fuelcell,” International Journal of Hydrogen Energy, vol. 42, no. 42,pp. 26488–26495, 2017.
[25] Madhusudhana, G. Manasa, A. K. Bhakta, Z. Mekhalif, andR. J. Mascarenhas, “Bismuth-nanoparticles decorated multi-wall-carbon-nanotubes cast-coated on carbon paste electrode;an electrochemical sensor for sensitive determination of gallicacid at neutral pH,” Materials Science in Energy Technology,vol. 3, pp. 174–182, 2020.
[26] S. Kalathil, V. H. Nguyen, J. J. Shim, M. M. Khan, J. Lee, andM. H. Cho, “Enhanced performance of a microbial fuel cellusing CNT/MnO2 nanocomposite as a bioanode material,”Journal of Nanoscience and Nanotechnology, vol. 13, no. 11,pp. 7712–7716, 2013.
[27] S. Patade, K. Silveira, A. Babu et al., “Bioremediation of dyeeffluent waste through an optimised microbial fuel cell,”
19Journal of Nanomaterials
International Journal of Advanced Research in Biological Sci-ences, vol. 3, no. 3, pp. 214–226, 2016.
[28] M. Danish Khan, H. Abdulateif, I. M. Ismail, S. Sabir, andM. Zain Khan, “Bioelectricity generation and bioremediationof an azo-dye in a microbial fuel cell coupled activated sludgeprocess,” PLoS One, vol. 10, no. 10, 2015.
[29] S. Pandit, S. Khilari, S. Roy, D. Pradhan, and D. Das,“Improvement of power generation using _Shewanella putre-faciens_ mediated bioanode in a single chambered microbialfuel cell: effect of different anodic operating conditions,” Bior-esource Technology, vol. 166, pp. 451–457, 2014.
[30] M. Kloch and R. Toczylowska-Maminska, “Toward optimiza-tion of wood industry wastewater treatment in microbial fuelcells-mixed wastewaters approach,” Energies, vol. 13, no. 1,p. 263, 2020.
[31] R. S. Diggikar, S. P. Deshmukh, T. S. Thopate, and S. R. Kshir-sagar, “Performance of polyaniline nanofibers (PANI NFs) asPANI NFs-silver (Ag) nanocomposites (NCs) for energy stor-age and antibacterial applications,” ACS Omega, vol. 4, no. 3,pp. 5741–5749, 2019.
[32] S. Ahmad, M. M. Ali Khan, and F. Mohammad, “Graphene/-nickel oxide-based nanocomposite of polyaniline with specialreference to ammonia sensing,” ACS Omega, vol. 3, no. 8,pp. 9378–9387, 2018.
[33] A. P. Mahajan, S. B. Kondawar, R. P. Mahore, B. H. Meshram,and P. D. Virutkar, “Polyaniline/MnO2 nanocomposites basedstainless steel electrode modified enzymatic urease biosensor,”Procedia Materials Science, vol. 10, pp. 699–705, 2015.
[34] X. Zhou, Y. Xu, X. Mei et al., “Polyaniline/β-MnO2 nanocom-posites as cathode electrocatalyst for oxygen reduction reac-tion in microbial fuel cells,” Chemosphere, vol. 198, pp. 482–491, 2018.
[35] A. Angel Ezhilarasi, J. Judith Vijaya, K. Kaviyarasu, L. JohnKennedy, R. J. Ramalingam, and H. A. Al-Lohedan, “Greensynthesis of NiO nanoparticles using _Aegle marmelos_ leafextract for the evaluation of in-vitro cytotoxicity, antibacterialand photocatalytic properties,” Journal of Photochemistry andPhotobiology B: Biology, vol. 180, pp. 39–50, 2018.
[36] Z. Hu, L. Zu, Y. Jiang et al., “High specific capacitance of poly-aniline/mesoporous manganese dioxide composite using KI-H2SO4 electrolyte,” Polymers, vol. 7, no. 10, pp. 1939–1953,2015.
[37] M. O. Ansari, M. M. Khan, S. A. Ansari, K. Raju, J. Lee, andM. H. Cho, “Enhanced thermal stability under DC electricalconductivity retention and visible light activity of Ag/TiO2@-polyaniline nanocomposite film,” ACS Applied Materials &Interfaces, vol. 6, no. 11, pp. 8124–8133, 2014.
[38] S. A. Ansari, N. Parveen, T. H. Han, M. O. Ansari, and M. H.Cho, “Fibrous polyaniline@manganese oxide nanocompositesas supercapacitor electrode materials and cathode catalysts forimproved power production in microbial fuel cells,” PhysicalChemistry Chemical Physics, vol. 18, no. 13, pp. 9053–9060,2016.
[39] M. O. Ansari and F. Mohammad, “Thermal stability of HCl-doped-polyaniline and TiO 2 nanoparticles-based nanocom-posites,” Journal of Applied Polymer Science, vol. 124, no. 6,pp. 4433–4442, 2012.
[40] R. Taş, M. Can, and S. Sönmezoʇlu, “Preparation and charac-terization of polyaniline microrods synthesized by using dode-cylbenzene sulfonic acid and periodic acid,” Turkish Journal ofChemistry, vol. 39, no. 3, pp. 589–599, 2015.
[41] R. Djara, Y. Holade, A. Merzouki et al., “Insights from thephysicochemical and electrochemical screening of the potenti-ality of the chemically synthesized polyaniline,” Journal of theElectrochemical Society, vol. 167, no. 6, article 066503, 2020.
[42] S. Nasrazadani and S. Hassani, “Modern analytical techniquesin failure analysis of aerospace, chemical, and oil and gasindustries,” in Handbook of Materials Failure Analysis withCase Studies from the Oil and Gas Industry, pp. 39–54, Elsevier,2016.
[43] J. Rudloff-Grund, F. E. Brenker, K. Marquardt, F. V.Kaminsky, and A. Schreiber, “STEM EDX nitrogen mappingof nanoinclusions in milky diamonds from Juina, Brazil, usinga windowless silicon drift detector system,” Analytical Chemis-try, vol. 88, no. 11, pp. 5804–5808, 2016.
[44] Z. Ye, J. Hou, M.W. Ellis, and B. Behkam, “Effect of anode sur-face roughness on power generation in microbial fuel cells,” inVol. 6 Energy, Parts A B, American Society of Mechanical Engi-neers, pp. 1409–1414, 2012.
[45] S. Zhao, Y. Li, Y. Wang, Z. Ma, and X. Huang, “Quantitativestudy on coal and shale pore structure and surface roughnessbased on atomic force microscopy and image processing,”Fuel, vol. 244, pp. 78–90, 2019.
[46] M. Hu, Z. Yao, and X. Wang, “Characterization techniques forgraphene-based materials in catalysis,” AIMS Materials Sci-ence, vol. 4, no. 3, pp. 755–788, 2017.
[47] P. Bhawal, S. Ganguly, T. K. Chaki, and N. C. Das, “Synthesisand characterization of graphene oxide filled ethylene methylacrylate hybrid nanocomposites,” RSC Advances, vol. 6,no. 25, pp. 20781–20790, 2016.
[48] A. B. Radwan, A. M. Abdullah, A. M. A. Mohamed, and M. A.Al-Maadeed, “New electrospun polystyrene/Al2O3 nanocom-posite superhydrophobic coatings; synthesis, characterization,and application,” Coatings, vol. 8, no. 2, 2018.
[49] S. Ou, H. Kashima, D. S. Aaron, J. M. Regan, and M. M.Mench, “Full cell simulation and the evaluation of the buffersystem on air-cathode microbial fuel cell,” Journal of PowerSources, vol. 347, pp. 159–169, 2017.
[50] D. He, E. Rauwel, R. Malpass-Evans et al., “Redox reactivity atsilver microparticle—glassy carbon contacts under a coating ofpolymer of intrinsic microporosity (PIM),” Journal of SolidState Electrochemistry, vol. 21, no. 7, pp. 2141–2146, 2017.
[51] S. Tahtaisleyen, O. Gorduk, and Y. Sahin, “Electrochemicaldetermination of sunset yellow using an electrochemically pre-pared graphene oxide modified – pencil graphite electrode(EGO-PGE),” Analytical Letters, vol. 54, no. 3, pp. 394–416,2021.
[52] S. u. Haque, A. Nasar, Inamuddin, and M. M. Rahman,“Applications of chitosan (CHI)-reduced graphene oxide(rGO)-polyaniline (PAni) conducting composite electrodefor energy generation in glucose biofuel cell,” Scientific Reports,vol. 10, no. 1, article 10428, 2020.
[53] Z. Qin, J. Zhang, Y. Liu et al., “A simple but efficient voltam-metric sensor for simultaneous detection of tartrazine andponceau 4R based on TiO2/electro-reduced graphene oxidenanocomposite,” Chemosensors, vol. 8, no. 3, p. 70, 2020.
[54] H. Yin, S. Ai, W. Shi, and L. Zhu, “A novel hydrogen peroxidebiosensor based on horseradish peroxidase immobilized ongold nanoparticles-silk fibroin modified glassy carbon elec-trode and direct electrochemistry of horseradish peroxidase,”Sensors and Actuators B: Chemical, vol. 137, no. 2, pp. 747–753, 2009.
20 Journal of Nanomaterials
[55] R. Ramachandran, W. Xuan, C. Zhao et al., “Enhanced electro-chemical properties of cerium metal-organic framework basedcomposite electrodes for high-performance supercapacitorapplication,” RSC Advances, vol. 8, no. 7, pp. 3462–3469, 2018.
[56] H. Gebretinsae, G. Welegergs, N. Matinise, M. Maazab, andZ. Y. Nurua, “Electrochemical study of nickel oxide (NiO)nanoparticles from cactus plant extract,” MRS Advances,vol. 5, no. 21–22, pp. 1095–1102, 2020.
[57] M. Ghasemi, W. R. W. Daud, M. Rahimnejad et al., “Copper-phthalocyanine and nickel nanoparticles as novel cathode cat-alysts in microbial fuel cells,” International Journal of Hydro-gen Energy, vol. 38, no. 22, pp. 9533–9540, 2013.
[58] K. Skrzypczynska, K. Kusmierek, A. Swiatkowski, andL. Dabek, “The influence of pencil graphite hardness on vol-tammetric detection of pentachlorophenol,” InternationalJournal of Electrochemical Science, vol. 13, no. 1, pp. 88–100,2018.
[59] H. Xu, L. Wang, C. Lin et al., “Improved simultaneous decol-orization and power generation in a microbial fuel cell withthe sponge anode modified by polyaniline and chitosan,”Applied Biochemistry and Biotechnology, vol. 192, no. 2,pp. 698–718, 2020.
[60] Z. A. Stoll, J. Dolfing, and P. Xu, “Minimum performancerequirements for microbial fuel cells to achieve energy-neutral wastewater treatment,” Watermark, vol. 10, no. 3,p. 243, 2018.
21Journal of Nanomaterials