electricity trading among microgrids - strath · a thesis submitted in partial fulfilment for the...
TRANSCRIPT

Department of Mechanical Engineering
Electricity Trading Among Microgrids
Author: Sheikh Muhammad Ali
Supervisor: Professor Joe Clarke
A thesis submitted in partial fulfilment for the requirement of degree in
Master of Science in Energy Systems and the Environment
2009

2
Copyright Declaration
This thesis is the result of the author’s original research. It has been composed by the
author and has not been previously submitted for examination which has led to the
award of a degree.
The copyright of this thesis belongs to the author under the terms of the United
Kingdom Copyright Acts as qualified by University of Strathclyde Regulation 3.50.
Due acknowledgement must always be made of the use of any material contained in,
or derived from, this thesis.
Signed: Sheikh Muhammad Ali Date: 16-Sep-2009
.

3
In the loving memory of my grandparents - Mr. & Mrs. Omar Khan

4
Acknowledgements
I would like to thank my supervisor Professor Joe Clarke for all his support and
guidance. The encouragement he provided at every stage during this thesis gave me
the confidence necessary for this work. A special thanks due to Dr Paul Strachan and
Dr Nick Kelly for their help throughout the course, which has helped in improvement
of approach. I am also thankful to Dr Andrew Grant for supervising the second
semester project.

5
Abstract
The latest energy policies to encounter the environmental damage, depletion of fossil
fuel reserves and insecurity of supply have provided the reason to increase the share
of renewable energy sources in energy generation. The importance of conventional
energy sources still can not be neglected as they are more reliable than renewables
and the technologies which are used to obtain energy from them are mature. One of
the possibilities to have a reliable, economical and less harmful to the environment
generation system is embedded generation which is a combination of renewable and
conventional energy sources. A microgrid is a community level embedded generation
system with local loads and micro-sources of energy. It can be operated in island
mode or connected to the national grid. It was hypothesized that a microgrid can also
be connected to the other microgrids through the national grid to trade energy and to
improve the energy supply, reliability and efficiency. However, connecting
microgrids to each other through the national grid has the question of tradability due
to their stochastic sources such as renewables. A number of microgrids of different
natures from each other which are likely to spread over the national grid would need a
centralized control and dispatching system to trade electricity. This system should
have the ability to deal with the stochastic natures of microgrids to ensure tradability.
In this thesis, a computer program MGET-SIM was developed that can simulate the
electricity trading among microgrids. Assumptions were made about microgrids’
connection through the national grid, a centralized control & dispatching system and
electricity prices. Several simulations were run after the development of the computer
program to know the tradability and the effects of different factors on such a trading
system. The results of these simulations show the extent of how much this system
could be affected by various factors, and prove the tradability of electricity among
microgrids. The technical & economical benefits of the system have also been
presented.

6
CONTENTS
CHAPTER ONE : INTRODUCTION & BACKGROUND ------------ 11
1.1 Energy & Environment ------------------------------------------------------------- 11
1.2 Microgrids ----------------------------------------------------------------------------- 14
1.2.1 Intra-microgrid Issues-------------------------------------------------------------- 17
1.2.2 Inter-microgrid Issues-------------------------------------------------------------- 18
1.3 Objectives ------------------------------------------------------------------------------ 19
1.4 Research Method --------------------------------------------------------------------- 19
1.5 Assumptions --------------------------------------------------------------------------- 20
1.5.1 Use of National Grid --------------------------------------------------------------- 20
1.5.2 Control System---------------------------------------------------------------------- 20
1.5.3 Timestamping ----------------------------------------------------------------------- 21
1.5.4 Electricity Price --------------------------------------------------------------------- 21
2 CHAPTER TWO: SOFTWARE DEVELOPMENT----------------- 22
2.1 MGET-SIM (MicroGrid Electricity trading SIMulator)-------------------- 22
2.1.1 Microgrid Generation / Demand Data ------------------------------------------- 23
2.1.2 Number of Microgrids in the System -------------------------------------------- 23
2.1.3 Variability in Size of Dummy Microgrids -------------------------------------- 23

7
2.1.4 Possibility of Equipment Failure ------------------------------------------------- 25
2.1.5 Consideration of Intermittence of Renewable Energy Sources -------------- 25
2.1.6 Electric Supply from the National Grid ----------------------------------------- 26
2.1.7 System Economics------------------------------------------------------------------ 27
2.1.8 National Grid and Microgrids Electricity Prices ------------------------------- 27
2.1.9 Peak/Off-Peak Rates --------------------------------------------------------------- 28
2.2 How MGET-SIM Works ----------------------------------------------------------- 29
2.3 Validation ------------------------------------------------------------------------------ 33
3 CHAPTER THREE: SIMULATIONS & RESULTS----------------- 36
3.1 Cases for Simulations---------------------------------------------------------------- 36
3.2 Goodness Parameters---------------------------------------------------------------- 37
3.2.1 Electricity Wasted in the Microgrids Electricity Pool------------------------- 37
3.2.2 Economic Loss ---------------------------------------------------------------------- 37
3.2.3 Electricity Imported from the National Grid------------------------------------ 38
3.3 Simulations & Results --------------------------------------------------------------- 38
3.3.1 Effect of Number of Microgrids-------------------------------------------------- 38
3.3.2 Effects of Variability in Sizes----------------------------------------------------- 42
3.3.3 Effect of Equipment Failure------------------------------------------------------- 46
3.3.4 Effect of Renewable Energy Intermittence ------------------------------------- 50
3.3.5 Effect of Separate Price Plans for Peak/Off-Peak Timings------------------- 54
3.3.6 A Case Designed on the Basis of All Previous Results ----------------------- 56

8
4 CHAPTER FOUR: CONCLUSIONS & FUTURE WORK--------- 61
4.1 Is electricity trading possible among microgrids? ---------------------------- 61
4.2 Is every demand satisfied? --------------------------------------------------------- 62
4.3 Does it economically benefit a microgrid? -------------------------------------- 62
4.4 Will it work with 'N' number of microgrids? ---------------------------------- 62
4.5 Does the simulator work with different supply & demand data sets? ---- 63
4.6 Overall Conclusions------------------------------------------------------------------ 63
4.7 Future Work -------------------------------------------------------------------------- 64
4.7.1 Additions in the Software --------------------------------------------------------- 65
4.7.1.1 Energy Storage---------------------------------------------------------------- 65
4.7.1.2 Demand Only Consumers --------------------------------------------------- 65
4.7.1.3 ‘N’ Number of Real Data Sets---------------------------------------------- 65
4.7.1.4 Simultaneous Trading of Heat and Electrical Energy ------------------- 65
4.7.1.5 Cost & Environmental Models --------------------------------------------- 66
4.7.1.6 DG in Stand-by --------------------------------------------------------------- 66
4.7.2 Policy & Legislation --------------------------------------------------------------- 66
Reference --------------------------------------------------------------------------------------------------- 68
Appendix.1------------------------------------------------------------------------------------------------- 70
Appendix.2------------------------------------------------------------------------------------------------- 85

9
List of Figures Page
No.
Figure.1 – Combined Power Systems
Figure.2 – Centralized Control for Microgrids
Figure.3 – Low Variability in Sizes of Microgrids
Figure.4 – Medium Variability in Sizes of Microgrids
Figure.5 – High Variability in Sizes of Microgrids
Figure.6 – MGET-SIM: Equipment Failure at Random Timestamp
Figure.7 – Source Text File for Different Peak/Off-Peak Rates
Figure.8 (a). – MGET-SIM Flow Chart
Figure.8 (b). – continued MGET-SIM Flow Chart
Figure.9 – Electricity wasted vs. Number of Dummy Microgrids
Figure.10 – Economic Loss vs. Number of Dummy Microgrids
Figure.11 – Electricity import vs. Number of Dummy Microgrids
Figure.12 – Electricity wasted vs. Variability in Size
Figure.13 – Economic Loss vs. Variability in Size
Figure.14 – Electricity import vs. Variability in Size
Figure.15 – Electricity wasted vs. Equipment Failure
Figure.16 – Economic Loss vs. Equipment Failure
Figure.17 – Electricity import vs. Equipment Failure Case
Figure.18 – Electricity wasted vs. Renewables Intermittence
Figure.19 – Economic Loss vs. Renewables Intermittence
Figure.20 – Electricity import vs. Renewables Intermittence
Figure.21 – Economic Loss vs. Day/Night Separate Price Plans
Figure.22 - Results Comparison
15
18
24
24
25
26
28
30
31
40
41
42
44
45
46
48
49
50
52
53
54
56
58

10
List of Tables Page
No.
Table.1 – CO2, N2O and CH4 emissions by fuel type [ref.10]
Table.2 – MGET-SIM Test 1
Table.3 – Results of Test 1
Table.4 – MGET-SIM Test 2
Table.5 – Results of Test 2
Table.6 – Cases to Check the Effect of Number of Microgrids
Table.7 – Electricity wastage Results of Number of Microgrids Cases
Table.8 – Economic Loss Results of Number of Microgrids Cases
Table.9 – Electricity import Results of Number of Microgrids Cases
Table.10 – Cases to Check the Effect of Variability in Size
Table.11 – Electricity wastage Results of Variability in Size Cases
Table.12 – Economic Loss Results of Variability in Size Cases
Table.13 – Electricity import Results of Variability in Size Cases
Table.14 – Cases to check the Effect of Equipment Failure
Table.15 – Electricity wastage Results of Equipment Failure Cases
Table.16 – Economic Loss Results of Equipment Failure Cases
Table.17 – Electricity import Results of Equipment Failure Cases
Table.18 - Cases to check the Effect of Renewables Intermittence
Table.19 – Electricity wastage Results of Renewables Intermittence Cases
Table.20 – Economic Loss Results of Renewables Intermittence Cases
Table.21 – Electricity import Results of Renewables Intermittence Cases
Table.22 – Cases to Check the Effect of Separate Price Plans
Table.23 – Economic Loss Results of Separate Price Plans Cases
Table.24 - Final Case
14
34
34
35
35
39
39
40
41
43
44
45
45
47
47
48
49
51
51
52
53
55
55
57

11
Chapter One : Introduction & Background
1.1 Energy & Environment
Energy usage and demand have consistently increased with economic growth. The
conventional sources of energy have been meeting these energy demands for
centuries. Issues like the depletion of ozone layer, global warming, oil prices, security
of supply and the depletion of fossil reserves in earth have highlighted the need to
increase the share of renewables in energy generation. Through energy generation
from renewables, these issues could be dealt with. As an example, it can be seen in
Brown’s [1] work that carbon emissions, which are blamed to be the main source of
global warming, could be reduced by a significant amount by using such sources of
energy that are renewable. Brown [1] estimates that through restructuring in energy
generation, 3,240 million tons, which is about 35%, of carbon emissions could be
reduced. This could be done by replacing fossil fuels with renewables for electricity
and heat, and reducing the use of oil and coal in the industry.
The latest energy policies are aiming to generate clean energy. The targets, that are
expected to be achieved by the enforcement of these policies, are the reduction of
emissions of hazardous gases that damage the environment, and an increase in the
share of energy generated from renewable energy sources. These policies are now
demanding, from the energy suppliers, to deviate from the present culture of energy
generation, supply, and dispatching.
There are various solutions available for these new challenges to the energy suppliers.
One of these solutions is to build centralized generation plants of renewable energy to
produce energy in bulk at excellent economy of scale. Even now, there are wind
farms, hydroelectricity schemes, solar power stations and other renewable schemes
already generating bulks of energy economically. There are solar thermal

12
power stations operating in Spain and USA, and the largest of these is the 354
Megawatt SEGS power plant in the Mojave Desert [2]. The world's
largest geothermal power installation is ‘The Geysers’ in California, USA with a rated
capacity of 750 Megawatt [3]. ‘The Horse Hollow wind energy centre’ in Texas, USA
is the world’s largest wind farm with 735.5 Megawatt capacity [4] and the London
Array project off the Kent and Essex coasts in England, when fully completed, would
become the largest wind farm with 1,000 Megawatt of generation capacity [5]. The
world’s largest hydro-electric plant is ‘The Three Gorges’ in China with 13,400
Megawatt capacity, which will increase to 22,500 Megawatt by 2011 [6].
The demand for increased share of renewables could also be met through
decentralized distributed energy resources (DER). Renewable energy systems could
be deployed at or near the location as per feasibility. It will not only help to increase
the local area potential of renewables but also increase the security of supply and
reduce the energy transmission losses. These decentralized distributed generation
systems are similar to the earliest power systems when power systems were kept and
run close to the loads. These power blocks closer to the loads lost their place with the
arrival and success of larger power stations that could generate bulks of electricity
economically, transform it to high voltages and transmit it to distances as long as one
country to another through high voltage transmission lines. Goldstein et al [7] believe
that DER technologies provide opportunities for greater local control of electricity
delivery and consumption.
In reality, there are many problems associated with the use of renewables as energy
source. The renewable sources do not offer the reliability and economic benefits of
conventional fossil fuels. The technology is not mature enough to take place of fossils
in energy generation. Different regions in the world do not have the same potential to
generate energy from renewables. The reliability of renewable energy sources still
needs to be enhanced through improved energy capture, conversion and storage
techniques. Proper siting and energy prediction, in cases of wind and solar energy, are
also vital. To be pragmatic, this all comes with a price, which is not yet reasonable
enough to compete with the price at which fossil fuels are providing energy to the

13
world. Apart from the technological development, there are other concerns with
renewable energy sources like the barriers in policy and socio-economic deployment.
A country, with huge oil and gas reserves which are already generating energy at very
cheap rates, would find it hard to believe if its energy future is insecure. A country
like this would not easily agree to spend billions of pounds to ensure the use of
renewables as its prominent source of energy.
Another solution could be the use of Combined Heat & Power (CHP) systems.
According to Greenpeace (UK) [8], the power stations in UK throw away the same
amount of heat as is needed to provide hot water and heating for every building in the
UK. On average, the large centralized power stations throw away, as waste heat, two
thirds of the energy they generate [8]. A CHP system captures the waste heat which
could be used to meet industrial or residential heating requirements. According to
Breeze [9], such systems can operate with an energy efficiency of up to 90%. Though
some CHP systems could be run on bio-fuels, most of them use fossils. However, a
natural gas fired CHP system emits significantly less amount of hazardous greenhouse
gases. Energy Information Administration in US Department of Energy [10] has
published statistics of CO2, N2O and CH4 emissions by fuel type which are presented
in table.1.
The statistical data in table.1 [10] shows that gas fired CHP systems emit the least
hazardous emissions in comparison to other main sources of energy.
Understanding the issues with both conventional and renewable energy systems, a
possible solution can be a combination of conventional and renewable energy sources.
In such a case, it will take the advantages of reliability and low-cost of conventional
system, with the cleanliness and sustainability of renewables. The system improves
even further if the conventional system is a gas fired CHP which is energy efficient
and emits least hazardous emissions than other fossils.

14
Table.1 [ref.10]
1.2 Microgrids
The combined systems of fossil and renewable energy systems could be designed at a
power plant level generating bulks of electricity or a community level as shown in
figure.1. The intelligent approach could be to have a combination of conventional and
renewable energy systems embedded in energy generation systems for communities
like residential or commercial buildings, hospitals, blocks of houses, etc. A microgrid
is a community level embedded generation system with local loads and micro-sources
of energy. It can be operated in island mode or connected to the national grid. The
generation system embedded within the local distribution system would increase the
security of supply, utilization of local renewable energy potential, utilization of most

15
of the heat generated by CHP system as the loads are near the source, and reduce the
transmission losses and public infrastructure costs.
Figure.1 – Combined Power Systems [Picture Courtesy:
www.dreamingnewmexico.org]
The importance of the system has been acknowledged by the UK government, as
presented in a joint report by UK government and OFGEM [11], “There are potential
benefits in having a more decentralised energy supply. Electricity and heat can be
generated locally from renewable sources, making valuable carbon savings. Losses
incurred in transmitting centrally-generated electricity to the point of use can be
significantly reduced. And even where fossil fuels are used, Combined Heat and
Power (CHP) can, in the right setting, ensure that these fuels are used more
efficiently by capturing and using the heat created as a by-product in the generation
of electricity. A more community-based energy system would also lead to greater
individual awareness of energy issues, driving a change in social attitudes and, in
turn, more efficient use of our energy resources”.

16
Another major benefit of the system is based on the fact that the majority of
renewable energy sources have relatively smaller power outputs, and so it is more
economical to connect them at low voltages in the electricity distribution system. It
makes renewable energy systems suitable to be part of a microgrid. This will increase
the share of renewable energy sources into the energy markets through the low
voltage distribution networks and help to utilize the local potential of renewables.
At present, there are no functional microgrids available. However, there are a few
projects running like ‘The Ashton Hayes Going Carbon Neutral Project’ [12], which
is the first project of its kind in England, where multiple renewable electricity
generation sources are embedded in a microgrid in a village at Cheshire, so the village
could become carbon neutral. Options like wind power, biomass and solar PV are
being considered. There are some other projects [13] like Kythnos Island in Greece,
Bornholm in Denmark, Manheim in Germany, Kozuf in Macedonia, etc. These
projects shall not only help in a better understanding of the behaviour and control of
real microgrids, but they would also provide useful real data sets which could be used
to support the study of impacts of these microgrids on the national grid and energy
tradability among these microgrids.
The novel concept has various issues associated with it. Conner [15] highlighted the
issues of control and coordination among the generators distributed over the network,
and proposed a novel dispatching management system, distributing the dispatching
functions throughout the network. It traded successfully both in the simulation
environment and the experimental test bed designed specifically for this purpose.
However, some of the issues related to electricity trading among microgrids still
remain unanswered.
It is now considered better to divide these issues into intra-microgrid and inter-
microgrid issues to have a clear view.

17
1.2.1 Intra-microgrid Issues
The major source of problem is the connection of microgrids to the main grid. The
supply of electricity must be equal to its demand. As the demand rises, the generators
slow down and thus their frequency drops. This is more likely to happen when
microgrids are connected to the main grid with continuously changing demand. The
load frequency control sensors sense this change and increase the fuel supply to the
generation system through governors, pro-act motors, etc. However, in case of
renewable energy systems in the microgrid, where the fuel supply is controlled by the
weather, they can not be controlled in the same way. But the problems could still be
resolved by providing the additionally required power from the non-renewable energy
system in the microgrid, thus maintaining the frequency back to normal. Another
issue is the variation in voltage. The voltage drops due to various reasons like
resistance, reactance, temperature, external pressure, etc. AVR (Automatic Voltage
regulator) is used to detect and control the voltage so that the electricity is supplied to
the end-user at desired voltage level. System protection is also vital in a microgrid.
The protection system should have the capability to detect fault and isolate the fault
area if required as quickly as possible, and maintain the stability of the system. When
there is a fault in national grid, the protection system should isolate the microgrid so it
could function normally. In case of islanding, the microgrid would drift out of the
phase of the main grid. This issue could be resolved by locking the equipment with
the timebase of global positioning system. Another issue in a microgrid is the
intermittence of supply from its renewable energy systems. However, this energy lack
could be compensated by increasing power output from the non-renewable partners of
the microgrid power generation system. The solution to this problem could also be
made possible by having more reserve capacity of renewables to tackle this problem,
or by adding energy storage. Another issue is whether generating power in a
microgrid is economically viable or not. A microgrid can not generate electricity as
cheap as a traditional power plant that generates bulk of electricity. However, there
are many options to obtain economic benefits. These options include utilizing waste
heat energy using CHP system, adding energy storage, selling excess electricity to the
main grid and through incentives offered by the government.

18
1.2.2 Inter-microgrid Issues
The microgrids could possibly be connected to each other through the national grid.
However, there is the issue if electricity trading is possible among the microgrids.
There are number of questions concerned with such tradability. First of all, there is
need of a centralized control system that could allow fair trade of electricity on the
basis of some defined laws. The system, as shown in figure.2, will take information
from each of the microgrids and the national grid to take its action. However Jiayi et
al [14] propose that a multi-agent system (MAS) with distributed control and
autonomous operation could be better than a centralized system. This system should
also be capable to deal with random nature of energy demand and supply from
microgrids. The microgrids in the whole system may range from a few to thousands in
number. Conner [15] states that, “As the network is made bigger, it will become more
complex, and the scope for error will increase too. As the system gets larger, the
dynamics get harder and harder to model. It would be almost impossible to predict
the transient performance, stability, response to faults, etc. of a network with
hundreds of thousands of embedded generators”. Also these microgrids would vary in
their sizes, which may be from a few kilowatts to tens of megawatts or even more. It
raises the question if all the microgrids’ demands are going to be satisfied or not, and
also, whether most of the energy generated by microgrids would be consumed or not.
Also, these microgrids are assumed to be generating part of their energy from
renewables which are intermittent sources. It raises the question how they would
affect the system. It will also be necessary that the trading system must economically
benefit each of the microgrids. Another important issue is to have an alternative of the
centralized control system in a case when it breaks down to continue electricity
trading without interruption.
Figure.2 – Centralized Control for Microgrids

19
There has been identified a need to gain an insight into these issues in the inter-
microgrid electricity trading. This could be done by simulating trading of electricity
among microgrids. There is no simulator presently available that could simulate such
a trading. So the subject of this thesis has been identified as to develop a new
simulator MGET-SIM, Microgrid Electricity trading Simulator, a software having the
capability to generate a large number of dummy microgrids with random natures and
simulate electricity trading among them.
1.3 Objectives
Now as the subject has been defined, these are the main objectives that are expected
to be achieved through this thesis:
- To develop a simulation software that could simulate electricity trading among
microgrids
- To simulate and verify the tradability of energy among the microgrids using
different test cases
- To check how the microgrids could benefit technically and economically
- To make some useful conclusions that could help in promoting this work
further
1.4 Research Method
The research method chosen for this study is computational modelling. A computer
program has been written using C programming language. A pseudo data set of
electricity demand and generation in a microgrid over a period of 24 hours is made.
The data set could be replaced by the actual data set of any microgrid. The program
generates required number of supply and demand data sets of dummy microgrids, and
simulates electricity trading among all the microgrids. Parameters of interest are
exported by the program to a text file, which is used for further analysis and to make
useful conclusions.

20
1.5 Assumptions
There are various factors that may become challenges before actually starting
electricity trading among the microgrids. However, if taken seriously and handled
carefully, then these problems are not permanent barriers and assumptions have been
made to permit the development of simulator.
1.5.1 Use of National Grid
It is not a must, but a good idea to connect the microgrids to each other through
national grid. It does not only increase the security of supply but the embedded
systems like CHP could be run at a level where their efficiency is maximum, so their
excess energy at maximum efficiency run could be exported. Also, when thousands or
even more of the microgrids would be trading electricity with each other, it is
supposed impossible without using the main national grid. But there are few
difficulties in doing that, like the control and protection of the power systems. The
national grid is so far equipped with control and protection system to deal with one
directional flow only. The bi-directional flow of power needs more control and
protections. For this thesis, it has been assumed that the national grid is already
equipped to support such a flow.
1.5.2 Control System
A control system monitors the supply, demand and safety parameters of power system
and takes necessary action if required to keep the whole system stable. It is an agreed
point that there is need of an improved control system. There will be controls required
at various levels such as site-level control and device-level control. But a centralized
control system can be beneficial, as the dispatching system could be integrated with it,
to make electricity fairly tradable among a number of microgrids. For this thesis, it
has been assumed that such a control system is already available.
21
1.5.3 Timestamping
In demand of fair trading, the timestamping plays a vital role. It has been assumed
that the timestamps of control systems in the microgrids are synchronized with the
timestamps of assumed control system. In case of a difference, the trading system
could not get proper information of available energy from a microgrid for a given
period of time. Timestamping synchronization is possible by locking the equipment
with the timebase of global positioning system. This is also important when the
microgrid runs in island mode, and connects back to the main grid later.
1.5.4 Electricity Price
It has been assumed that the price of electricity from microgrid must be lesser than
national grid electricity price to make it competitive. Another assumption is that the
trading price of microgrid electricity is fixed through legislation. However, in reality
the trading environment may be different where the electricity will be traded among
the microgrids through competitive bidding. But in that case, the system may become
complex with the presence of a large number (say 10,000) of bidders, and there will
be a need of such mechanisms which would ensure that energy trade is completed
within a reasonable time, thus avoiding of any chances of electricity wastage. An
intelligent bidding system could possibly be developed to handle this issue.

22
2 Chapter TWO: Software Development
In the first chapter, a brief look was taken at the challenges and possible future trends
of energy markets, conventional and renewable energy sources, etc. New and
developing approaches like distributed generation and microgrids were explained with
views from different thinkers, researchers and organizations, and so the need was
identified to simulate electricity trading among the microgrids. The reasons for
necessary assumptions were also given. The next step now is to develop a simulator.
In this chapter, different stages for the development of simulation software have been
described. Different factors have been explained in detail, which were considered to
make this software give realistic results. At the end, the testing and validation of
software is discussed.
2.1 MGET-SIM (Microgrid Energy trading Simulator)
MGET-SIM or Microgrid Energy trading Simulator is the software developed to
simulate energy trading among the microgrids. Now there might be a question why
use the term ‘energy trading’ rather than ‘electricity trading’, so the reason is, this
simulator has the capability to simulate the trading of energy not just electricity. For
example, in case of excess heat energy available in microgrids, that could also be
traded among them. Similar to electricity, a microgrid may have generation and
demand of heat energy. So the software shall be equally useful to simulate that if
given with data in the appropriate form.
While designing the software, several factors were considered to be included in it to
make it give realistic results. A brief look at these factors with their justifications is
presented as follows.

23
2.1.1 Microgrid Generation / Demand Data
The electricity generation and demand data of one microgrid is taken as seed to
further functions. The seed data set consists of hourly values of electricity generation
and demand for a single day. For this thesis, a pseudo data set was made, considering
an office building as a microgrid, and used for simulations. The data set is not real,
but still it has been designed with consideration of variations in demand due to office
opening & closing hours, lunch time, etc. It also accounts for variations in electricity
generation capacity due to shutdown or standby of some of the micro-sources. The
physical unit assumed for electricity generation and demand is kWh.
2.1.2 Number of Microgrids in the System
Trading electricity among microgrids is a novel idea, so presently there are no such
systems controlling electricity trading among microgrids. But whenever such system
is designed, it should have the capability to deal with any number of microgrids. It
could be only two microgrids in a model village, a few microgrids in a small town, or
thousands of microgrids over the whole country. The simulator should also have the
flexibility that it could simulate electricity trading among any given number of
microgrids. MGET-SIM has been designed in such a way that it can generate up to
one thousand dummy microgrids for simulation. However, the source code can be
modified to generate any number of dummy microgrids, if required. When the
software is run, the user is prompted to enter the number of dummy microgrids that
are wished to be generated by the software.
2.1.3 Variability in Size of Dummy Microgrids
The microgrids in the system would not be of exactly similar sizes to each other in
terms of their electricity demand and generation. There may be a superstore with a
few extra kilowatt-hours to a multi-story commercial building with hundreds of
excess kilowatt-hours at the same time in a day. The demand could also have the same
property. In MGET-SIM, the user is prompted to choose if the variability in sizes of

24
dummy microgrids is required to be low, medium or high. The software uses the data
set of given microgrid to generate the data sets for dummy microgrids.
When the user opts for low variability in size, the program generates each value in
dummy microgrids’ data from as low as 0.5 times to the seed data, to as high as 1.5
times the value of seed data. For example, if the electricity generation is 10 kWh in
the seed data set, the dummy grid’s electricity generation will be in the range of 5
kWh (i.e. 0.5 x 10 kWh) to 15 kWh (i.e. 1.5 x 10 kWh). A similar example can be
seen in Figure.3.
Figure.3 – Low Variability in Sizes of Microgrids
When the user opts for medium variability in size, the program generates each value
in dummy microgrids’ data from as low as 0.3 times to the seed data, to as high as 3
times the value of seed data. For example, if the electricity generation is 10 kWh in
the seed data set, the dummy grid’s electricity generation could be in the range of 3
kWh (i.e. 0.3 x 10 kWh) to 30 kWh (i.e. 3 x 10 kWh). A similar example can be seen
in Figure.4.
Figure.4 – Medium Variability in Sizes of Microgrids

25
When the user opts for high variability in size, the program generates each value in
dummy microgrids’ data from as low as 0 times to the seed data, to as high as 10
times the value of seed data. For example, if the electricity generation is 10 kWh in
the seed data set, the dummy grid’s electricity generation will be in the range of 0
kWh (i.e. 0 x 10 kWh) to 100 kWh (i.e. 10 x 10 kWh). A similar example can be seen
in Figure.5.
Figure.5 – High Variability in Sizes of Microgrids
2.1.4 Possibility of Equipment Failure
There may be various reasons a microgrid could go down and out of the whole trading
system, and so each microgrid may not be generating electricity at all times. A few of
the reasons may be equipment failure, maintenance, scheduled outages, etc. A factor
has been introduced in MGET-SIM, called ‘equipment failure factor’, which accounts
for all these issues when a microgrid’s generation goes to nil. In the start of program,
the user is prompted if this factor should be used when generating the data sets for
dummy microgrids. If the user chooses ‘yes’ for this option, then the electricity
generation of some microgrid/microgrids may become zero at some random
timestamp as can be seen in the figure.6.
2.1.5 Consideration of Intermittence of Renewable Energy Sources
The intermittence of renewable energy sources is one of the major reasons why
renewables are hardly considered to be used as sole energy source. The frequent
variations in wind velocity make it impossible to have a constant power output. The
inconsistency of solar intensity is a barrier in its wider usage, and it is available in the

26
Figure.6 – MGET-SIM: Equipment Failure at Random Timestamp
day time only. Similar issues are there with other forms of renewables. These are the
reasons which show that the microgrids installed with some renewable energy source
would not offer supply as per their full capacity. This means reductions in the supply.
In MGET-SIM, a factor has been introduced called as ‘Renewables intermittence
factor’. In the start of program, the user is prompted if this factor should be used when
generating the data sets for dummy microgrids. If the user chooses ‘yes’ for this
option, then the electricity generation from microgrids may be reduced up to a
maximum of 30% reductions. For example, if the energy generation was 10 kWh,
then after using this factor, it will be in the range of 7 kWh to 10 kWh.
2.1.6 Electric Supply from the National Grid
Trading electricity among the microgrids would not mean if there is no need of
electricity from the national grid public electricity supply, as it may be used as an
alternative source of electricity when the electricity exported from the microgrids is
unable to meet the demand. Also, at this stage, there is need to distinguish between

27
the microgrids with excess electricity available and microgrids in demand of
electricity. The microgrids with excess electricity have been named as ‘exporter
microgrids’ and the microgrids with electricity demand as ‘importer microgrids’. In
MGET-SIM, if the electricity available from exporter microgrids is not able to meet a
demand from importer microgrid, then the demand will be met from the national
grid’s public electricity supply.
2.1.7 System Economics
The importance of electricity trading among microgrids has been discussed and it
seems useful technically and environmentally. But it has to be appealing economically
as well to attract the financing bodies and the public as well. People started to switch
to hybrid cars in USA when energy price went up to $5 per gallon and stopped using
their gas-guzzlers that they loved to use. So economics can change the habit the way
energy is consumed. In the last chapter, the necessary steps from legislative bodies
and policy makers needed to promote such electricity trading will be discussed. At
this stage, some of the features of MGET-SIM, which would help in checking the
economical benefits of trading electricity among microgrids, are being discussed.
However, a detailed economic evaluation of such a system was done by Zoka et al
[16] who considered installation, operation, microgrid construction and power
interruption costs, and found that a microgrid with an optimal operation of distributed
energy sources is economical than each consumer having an independent resource,
and possible sale of electricity would increase the economic benefits further.
2.1.8 National Grid and Microgrids Electricity Prices
The user is prompted by the program to enter the electricity price for the national grid
public electricity supply and the microgrids electric supply. It is logical that the price
of electricity from the microgrids must be less than electricity price from the national
grid to make microgrids’ electricity competitive. The program does not accept if the
user enters such electricity prices where the price of electricity from microgrids is

28
higher than or equal to the national grid electricity price. The program shows an error
in this case. At this stage, it was also assumed that there is a fixed price of electricity
from national grid and microgrids.
2.1.9 Peak/Off-Peak Rates
The electricity rates may change at different times in a day due to various reasons.
One of the reasons may be when electricity availability is less than demand, so the
price may increase. Another reason if the electricity demand is less than its
availability, so the price may decrease. Another factor that may affect the rates is high
demand with high availability, as the price may be kept low for customers with such a
demand.
The program prompts the user if different electricity rates should be considered in day
and night. The default setting is that, if the user chooses ‘yes’ for this option, then the
electricity rates from all grids become half in the first six hours of the day i.e. 12:00
a.m. to 06:00 a.m. However, MGET-SIM has the flexibility that different electricity
prices for each hour of the day can be set. All the user has to do is to modify the
corresponding text file in the program folder. The file contains 24 values, one for each
hour of the day. By default, the first six values are ‘0.5’ that means half rates in the
first six hours, whereas remaining eighteen values are ‘1.0’ that means full rates in the
remaining eighteen hours as presented in figure.7. The user can modify value for each
hour to change the rates.
Figure.7 – Source Text File for Different Peak/Off-Peak Rates

29
For example, a user enters 10 pence/kWh as the national grid electricity price, and 7
pence/kWh as the microgrid electricity price. The user now changes the first value in
the corresponding text file from 0.5 to 0.7. It will now mean that, when simulating,
the software will take the electricity price in first hour as 7 pence/kWh (i.e. 0.7 x 10
pence/kWh) for the national grid, and 4.9 pence/kWh (i.e. 0.7 x 7 pence/kWh) for the
microgrid.
The user also changes the second value in the same file from 0.5 to 1.5. For the
second hour, the software will take the electricity price as 15 pence/kWh (i.e. 1.5 x 10
pence/kWh) for the national grid and 10.5 pence/kWh (i.e. 1.5 x 7 pence/kWh) for the
microgrid.
2.2 How MGET-SIM Works
The first step in the development of the simulator was to develop the algorithm. There
were a number of revisions of the algorithm as the factors were added and removed
after consideration. After all the factors discussed above had been finalized, the
algorithm was finally developed. Figure.8 (a) and figure.8 (b) present the flowchart of
the software. The written logic on which the software works is as follows.
This computer program has been designed to take input from a text file (supply &
demand data of a microgrid); with some user inputs, and use it to generate electricity
generation & demand data sets for dummy microgrids.
The user is asked by the program to provide the following information:
- No of dummy microgrids to be generated.
- Variability in size of dummy microgrids from the given microgrid (low,
medium or high).

30
Step:1 Input 24 hourly values of
generation & demand of a
microgrid in corresponding
text file (mg1.txt) in the
program folder
24 values of mg1g(generation)
& 24 values of mg1d(demand)
Step:2Input No. of dummy grids to
be generated 'N'N
Step:3 Input variability in size as
either low or medium or high
'Vs'
Step:4 Input if equipment failure
factor is required 'eff'
Step:5Input if renewable
intermittence factor is
required 'ref'
Step:6 Input national grid electricity
price 'ngsp'ngsp
Step:7 Input microgrid electricity
price 'mgsp'mgsp
Step:8Input if different peak and off-
peak rates required
Low
Medium
High
Yes
No
Yes
No
Vs = 0.5 ~ 1.5
Vs = 0.3 ~ 3.0
Vs = 0.1 ~ 10.0
eff = 0.0/1.0 (very rarely 0.0)
eff = 1.0
ref = 0.7 ~ 1.0
ref = 1.0
input rate factors from dnp1.txt
input rate factors from dnp0.txt
Yes
No
Figure.8 (a). – MGET-SIM Flow Chart

31
Step:9
Step:10Is mg1g>mg1d ?
Is microgrid-g>microgrid-d ?
Step:11Select a microgrid randomly
whose 'generation<demand'
Step:12Is demand+exp>=0 ?
Step:13 Repeat step:11 'Nx10' times
to make sure no demand is
left
Step:14Divide total income to the
microgrids as per their
respective share in the pool.
Step:15 Repeat all steps 24 times for
each respective hour.
Export the results to results.txt
file in program folder
microgrid-g(generation) =
mg1gxVsxeffxref
microgrid-d(demand) = mg1dxVs
Generate data for 'N' dummy
microgrids:
add value to energy pool 'exp'
No action
add value to energy pool 'exp'
No action
Yes
No
demand met from exp at cost 'mgsp'
demand met from nat grid at 'ngsp'
Yes
No
Yes
No
Figure.8 (b). – continued MGET-SIM Flow Chart

32
- Intermittence of supply from renewable sources (yes/no: if yes, supply
reduces)
- National grid electricity price
- Microgrid electricity price (which must be lower than the national grid’s
electricity price)
- Day/night price plans, which is like having different peak and off-peak rates
(yes/no: if yes, half price from 12 a.m. to 6 a.m. in this thesis, but modifiable
by the user)
On the basis of above information, the program generates the data for dummy
microgrids. The detailed explanation is available in Appendix.2. Once the electricity
generation and demand data is available for each microgrid, the program calculates
the amount of energy that is to be exported or imported. If a microgrid has surplus, its
surplus amount is added into an electricity pool that is common for all microgrids
with surplus. After this, the program randomly selects one of the microgrids with
electricity demand, and meets its demand from the microgrids’ surplus electricity
pool. If the pool can not satisfy its demand, then its demand will be met from the
national grid public electricity supply.
The result output from the program is exported to a text file generated in the program
folder. This file will give user the information about
- How much electricity trading was carried out among the microgrids in each
hour
- How much electricity was available in electricity pool
- How many demands of electricity from microgrids were satisfied from the
pool, and at what cost
The available results in this text could be used for further analysis and obtain useful
information about this trading.

33
2.3 Validation
The software validation is necessary to check if the simulation program is suitable for
its intended purpose. As the programming code for MGET-SIM has been written, now
the software needs to be validated so it could be trusted and used for simulating
electricity trading.
In software validation, there are various approaches and techniques. The validation of
MGET-SIM was done using the analytical approach. There are various reasons for
doing this. First of all, the software is only one of its types and it is not possible to
validate it by comparing with similar and accredited softwares already available.
Second, there was no physical test bed available that could be used to compare it with
the software results. In analytical approach, the coding is simplified and tested
whether it serves its purpose.
As random numbers with different ranges are generated at various stages in this
software, so the first requirement was to simplify the model. The model was
simplified so its results become comparable to the results calculated using a page, pen
and simple calculator. The simplified approach was to:
- Replace random numbers with constant numbers so these could be used in
comparison of results
- As a separate additional check, test each function separately
- Another additional check separate from previous checks, use of different seed
data file
Tests were designed and run, with random numbers replaced by constants in the
computer program. Two examples of these tests are given here.
The microgrid ‘1’ in the test is the microgrid in the seed data set. Its data was used to
generate data for microgrid ‘2’. The constants in place of random numbers were taken
as ‘1.1’ for variability in size for both electricity demand and generation, ‘1.0’ for

34
equipment failure and ‘0.7’ for renewables intermittence and dummy microgrid was
generated. Formulae used to generate data for microgrid ‘2’ can be seen in details of
the program in Appendix.2. The given seed microgrid and dummy microgrid data are
given in table.2.
Microgrid
No.
Energy
Generated
in kWh (x)
Energy
Demand in
kWh (y)
1 80 65
2 61.6 71.5
Table.2 – Test 1
The program checked if each of the microgrids had an electricity surplus or demand.
In this test, the surplus electricity of microgrid ‘1’ was sent to the microgrid electricity
pool. Then the pool had more electricity than the demand of microgrid ‘2’, so its
demand was met from the pool at the price of microgrid electricity rate. There was no
electricity imported from the national grid public electricity supply. The calculations
by hand were compared side by side with the program results and found same. The
results of the test are also shown in table.3.
Microgrid
No.
Energy
Generated
in kWh (x)
Energy
Demand in
kWh (y)
x – y Earning
(pence)
Payment
(pence)
Nat. Grid
Earning
(pence)
1 80 65 15 69.3 0.0
2 61.6 71.5 -9.9 0.0 69.3 0.0
Table.3 – Results of Test 1
Another test was performed using same microgrid ‘1’ seed data and same constant
values in place of random numbers. The only change was that the variability in size
was changed from ‘1.1’ to ‘1.5’ for microgrid ‘2’ electricity demand only. So now
microgrids’ electricity pool was not able to meet the demand of microgrid ‘2’. The
given seed microgrid and dummy microgrid data are given in table.4.

35
Microgrid
No.
Energy
Generated
in kWh (x)
Energy
Demand in
kWh (y)
1 80 65
2 61.6 97.5
Table.4 – Test 2
This time the microgrids’ electricity pool had less electricity than the demand of
microgrid ‘2’, so the demand was met by importing electricity from the national grid
public electricity supply at a price higher than microgrid electricity price. There was
no electricity imported from the microgrids’ electricity pool. The calculations by hand
were compared side by side with the program results and found same. The results of
this test are also shown in table.5.
Microgrid
No.
Energy
Generated
in kWh (x)
Energy
Demand in
kWh (y)
x – y Earning
(pence)
Payment
(pence)
Nat. Grid
Earning
(pence)
1 80 65 15 0.0 0.0
2 61.6 71.5 -35.9 0.0 359.0 359.0
Table.5 – Results of Test 2
There were several tests performed like this and the results matched in each case. The
functions used in different steps within the program were tested separately and found
working accurately. So it has been found that the software is able to generate dummy
microgrids’ data and simulate electricity trading among the microgrids. Also, there
were different data sets taken as seeds to ensure that MGET-SIM works with every
given microgrid data set, and it was observed that it can work with any data set with
some reasonable values of demand and generation as in a microgrid. It is not to be
used with seed data sets from electricity sources other than microgrids.
36
3 Chapter THREE: Simulations & Results
In the previous chapters, possible solutions were discussed to meet the latest
challenges to the energy industry. Microgrids, a community level embedded
generation system, were highlighted and the need to simulate electricity trading
among them was identified. As part of this thesis, the software MGET-SIM was
developed to simulate electricity trading among microgrids through the national grid.
In this chapter, the simulations will be discussed which were carried out using
MGET-SIM. The purpose of testing, the effects of various factors, their simulations
and their results will be discussed in detail.
3.1 Cases for Simulations
After the development of software, several cases were designed. The purpose of these
cases was to not only to simulate electricity trading among microgrids but also to
check how microgrids may behave under the influence of different factors, and the
potential benefits of having such a system. After the simulation of all these cases, the
ideal case was designed and simulated, which is based on conditions where
microgrids are best utilized.
Each case has its own purpose, simulation and results. The cases are designed to
understand the effects of following factors:
- Effect of number of microgrids
- Effects of variability in sizes
- Effect of equipment failures
- Effect of renewable energy intermittence
- Effect of separate price plans for peak/off-peak timings

37
3.2 Goodness Parameters
For each factor, three parameters shall be evaluated to test how good the proposed
microgrid electricity trading system is working in each case. These parameters are as
follows:
3.2.1 Electricity Wasted in the Microgrids Electricity Pool
This is the percentage of electricity that has been wasted out of the total electricity
generated. It is calculated using the below formula:
= x 100
3.2.2 Economic Loss
It is a factor that is specific to the microgrid whose data is provided as the seed to
MGET-SIM. It represents the percentage of the difference of amount this microgrid
has to pay for the electricity it imports in present system to the amount it would have
to pay in the new microgrid electricity trading system. It is calculated using the below
formula:
= x 100
A negative sign in economic loss % would mean additional economic benefit a
microgrid is earning with the new system after paying for its electricity imports. For
example, 10% economic loss means the microgrid had to pay only 10% of the amount
now in the new system than it had to pay in the previous system with no electricity
trading taking place among the microgrids. In case of negative values of economic
loss, like a -30% economic loss, it would mean that the microgrid did not only pay for
Electricity wasted
in the pool (%)
1 – Electricity consumed from the pool
Electricity generated in the pool
Economic
Loss (%)
1 – income (old system)-income (new system)
income (old system)

38
all its imports but also earned an additional 30% of that amount that it actually had to
pay for its imports.
3.2.3 Electricity Imported from the National Grid
It represents the percentage of total electricity imported from the national grid by all
of the microgrids in the system out of their total consumption. Electricity is imported
from the national grid whenever the microgrids’ electricity pool is unable to meet the
demands. It is calculated using the below formula:
= x 100
3.3 Simulations & Results
The cases were designed in such a way as to test each factor one by one. Like when
effect of number of microgrids is being checked, the other factors are not considered
at that time.
3.3.1 Effect of Number of Microgrids
There were four simulations run to check the effect of number of microgrids on a
microgrid electricity trading system. The three cases are presented in table.6.
Electricity wasted in the Pool
It was observed that increasing the number of microgrids in the system would
decrease the amount of electricity wasted in the microgrids’ electricity pool. Table.7
Electricity import from
national grid (%)
Total import from national grid
Total consumption

39
Inputs Case 1 Case 2 Case 3 Case 4
Number of Dummy Microgrids 3 10 50 100
Total Microgrids 4 11 51 101
Variability in Size medium medium medium medium
Equipment Failure Factor No No No No
Renewables Intermittence Factor No No No No
Different Peak/Off-Peak Rates No No No No
National Grid Electricity Price
(pence/kWh) 10 10
10
10
Microgrids Electricity Price
(pence/kWh) 7 7
7
7
*Note: the electricity prices are assumed values which could be different, but kept
constant throughout this thesis.
Table.6 – Cases to Check the Effect of Number of Microgrids
and figure.9 gives a clear picture of the simulation results.
From the statistics presented in table.7 and the trend shown in figure.9, it was seen
that electricity wastage was high i.e. 96% in case of very few microgrids. However,
with the increasing number of microgrids, the reduction in electricity wastage is
steady. It shows that a system with at least 10 microgrids seems to function
reasonable, and it was concluded that electricity wastage reduces by increasing the
number of microgrids in the system.
Case N
Electricity wasted
in the Pool
1 3 96%
2 10 86%
3 50 82%
4 100 78%
Table.7 – Electricity Wastage Results of Number of Microgrids Cases

40
310 50 100
0%
20%
40%
60%
80%
100%
120%
0 50 100 150
Number of Dummy Microgrids
Ele
ctr
icit
y W
aste
d
Figure.9 – Electricity wasted vs. Number of Dummy Microgrids
Economic Loss
It was observed that increasing the number of microgrids in the system would
decrease the economic loss of the given microgrid. Table.8 and figure.10 give a clear
picture of the simulation results.
Case N Economic Loss
1 3 60%
2 10 48%
3 50 46%
4 100 42%
Table.8 – Economic Loss Results of Number of Microgrids Cases
From the statistics presented in table.8 and the trend shown in figure.10, it was
concluded that similar to electricity wastage, economic loss decreases by a good
amount as the number of microgrids are increased. The fact is, as there are more

41
3
10 50100
0%
10%
20%
30%
40%
50%
60%
70%
0 50 100 150
Number of Dummy Microgrids
Eco
no
mic
Lo
ss
Figure.10 – Economic Loss vs. Number of Dummy Microgrids
microgrids available in the system, more electricity of the given grid will be
consumed thus increasing its economic benefits. Figure.10 shows that at least 10
microgrids will improve the system by reducing significant amount of economic loss.
Electricity imported from the National Grid
It was observed that increasing the number of microgrids in the system would produce
a significant decrease in electricity imports from the national grid. It was shown that
having more and more microgrids in the system make them rely less on the public
electricity from national grid and more on each other thus getting cheaper electricity.
Table.9 and figure.11 give a clear picture of the simulation results.
Case N
Electricity
imported from the
National Grid
1 3 86%
2 10 51%
3 50 36%
4 100 28%
Table.9 – Electricity import Results of Number of Microgrids Cases

42
3
10
50100
0%
10%
20%
30%
40%
50%
60%
70%
80%
90%
100%
0 50 100 150
Number of Dummy Microgrids
Ele
ctr
icit
y Im
po
rted
fro
m N
at
Gri
d
Figure.11 – Electricity import vs. Number of Dummy Microgrids
From the statistics presented in table.9 and the trend shown in figure.11, it was seen
that the electricity imports from national grid were decreased by a good amount i.e.
more than one thirds as the number of dummy microgrids were increased from 3 to
10. Even after that, increasing the number of microgrids further decreased electricity
imports from national grid at a good rate as can be seen in figure.11.
From the results of above four cases that checked the effect of number of microgrids
on the microgrids’ electricity trading system, it was found that increasing the number
of microgrids is important to make the effective use of system, with at least 10
microgrids available every time. Also, in the next cases to check other factors, 10
microgrids will be taken in the simulations consistently.
3.3.2 Effects of Variability in Sizes
Three simulations were carried out to check the effect of variability in microgrids’
sizes on a microgrid electricity trading system. The details of these cases have been
presented in table.10.

43
Inputs Case 1 Case 2 Case 3
Number of Dummy Microgrids 10 10 10
Total Microgrids 11 11 11
Variability in Size low medium High
Equipment Failure Factor No No No
Renewables Intermittence Factor No No No
Different Peak/Off-Peak Rates No No No
National Grid Electricity Price
(pence/kWh) 10 10 10
Microgrids Electricity Price
(pence/kWh) 7 7 7
*Note: the electricity prices are assumed values which could be different, but
kept constant throughout this thesis.
Table.10 – Cases to Check the Effect of Variability in Size
As in previous cases, the factors other than variability in size were either not
considered, or kept constant.
Electricity wasted in the Pool
It was observed that as the variability in sizes of microgrids increased, the amount of
electricity in the microgrids’ electricity pool was less wasted. It showed that if there
are large variations in the generation and demand of electricity, more of microgrids’
electricity will be consumed. Table.11 and figure.12 give a clear picture of the
simulation results.
From the statistics presented in table.11 and the trend shown in figure.12, a linear
decrease was observed in the electricity wastage as the variability in size of
microgrids was increased.

44
Case Variability
Electricity wasted
in the Pool
1 low 91%
2 medium 86%
3 high 81%
Table.11 – Electricity wastage Results of Variability in Size Cases
low
medium
high80%
82%
84%
86%
88%
90%
92%
0 1 2 3 4
Variability in Size
Ele
ctr
icit
y W
aste
d
Figure.12 – Electricity wasted vs. Variability in Size
Economic Loss
It was observed that increasing the variability in size of microgrids decreased the
economic loss of given microgrid. This must be due to the fact that higher demands
are available for given microgrid’s electricity as variability increases. Table.12 and
figure.13 give a clear picture of the simulation results.
From the statistics presented in table.12 and the trend shown in figure.13, it was
concluded that the economic loss decreased as the variability in sizes was increased.
The economic loss of the given grid decreased even sharply as the variability in size
was changed from ‘medium’ to ‘high’.

45
Case Variability Economic Loss
1 Low 59%
2 Medium 48%
3 High 35%
Table.12 – Economic Loss Results of Number of Microgrids Cases
low
medium
high
0%
10%
20%
30%
40%
50%
60%
70%
0 1 2 3 4
Variability in Size
Eco
no
mic
Lo
ss
Figure.13 – Economic Loss vs. Variability in Size
Electricity imported from the National Grid
It was observed that increasing the variability in size will affect the electricity import
from the national grid by a little amount, and it can either increase or decrease as the
increasing variability is both in the electricity demand and generation of the
microgrids. Table.13 and figure.14 give a clear picture of the simulation results.
Case Variability
Electricity
imported from the
National Grid
1 low 49%
2 medium 51%
3 high 44%
Table.13 – Electricity import Results of Variability in Size Cases

46
low
medium
high
43%
44%
45%
46%
47%
48%
49%
50%
51%
52%
0 1 2 3 4
Variability in Size
Ele
ctr
icit
y I
mp
ort
ed
fro
m N
at
Gri
d
Figure.14 – Electricity import vs. Variability in Size
From the statistics presented in table.13 and the trend shown in figure.14, it was
concluded that electricity imports from the national grid can go in either upward or
downward direction with increasing variability in sizes of microgrids. The reasons
may be that, sometimes this factor can increase the demand which will be higher than
availability of electricity in microgrids’ electricity pool so the electricity will be
imported from the national grid’s supply. On the other side, this factor can also
increase electricity supply resulting in less electricity imports from the national grid.
3.3.3 Effect of Equipment Failure
There were two simulations performed to check the effect of considering equipment
failure factor on the microgrids’ electricity trading system. The details of the two
cases have been presented in table.14.

47
Inputs Case 1 Case 2
Number of Dummy Microgrids 10 10
Total Microgrids 11 11
Variability in Size medium Medium
Equipment Failure Factor No Yes
Renewables Intermittence Factor No No
Different Peak/Off-Peak Rates No No
National Grid Electricity Price
(pence/kWh) 10 10
Microgrids Electricity Price
(pence/kWh) 7 7
*Note: the electricity prices are assumed values which could be
different, but kept constant throughout this thesis.
Table.14 – Cases to check the Effect of Equipment Failure
As in previous cases, the factors other than equipment failure factor were either not
considered, or kept constant.
Electricity wasted in the Pool
It was observed that considering equipment failure factor in the microgrids resulted in
an increase in electricity consumption and decrease in electricity wastage. It was due
to the fact that that when a microgrid went down because of equipment failure or any
other reasons, the demand was still there thus increasing the amount of electricity
consumption from the microgrids’ electricity pool. Table.15 and figure.15 give a clear
picture of the simulation results.
Case E,F.F
Electricity wasted
in the Pool
1 No 86%
2 Yes 82%
Table.15 – Electricity wastage Results of Equipment Failure Cases

48
No
Yes
81%
82%
83%
84%
85%
86%
87%
Equipment Failure
Ele
ctr
icit
y W
aste
d
Figure.15 – Electricity wasted vs. Equipment Failure
From the statistics presented in table.15 and the trend shown in figure.15, it was
concluded that there was a valuable decrease i.e. 4% in electricity wastage by
considering the equipment failure factor.
Economic Loss
It was observed that considering equipment failure factor resulted in reduction in
economic loss of the given grid. The economic loss of the given grid was reduced by
half the amount when equipment failure factor was considered. Table.16 and figure.16
give a clear picture of the simulation results.
Case E,F.F Economic Loss
1 No 48%
2 Yes 24%
Table.16 – Economic Loss Results of Equipment Failure Cases

49
No
Yes
0%
10%
20%
30%
40%
50%
60%
Equipment Failure
Eco
no
mic
Lo
ss
Figure.16 – Economic Loss vs. Equipment Failure
From the statistics presented in table.16 and the trend shown in figure.16, it was
concluded that economic loss of the given grid reduces by considering equipment
failure factor. The reason of this reduction is that, when some of the microgrids are
not available, the share of the given grid in the microgrids’ electricity pool becomes
larger than usual. Another reason is that there is increased demand of its electricity
than normal as there is less supply in the market, thus its economic loss decreases.
Electricity imported from the National Grid
It was observed that considering equipment failure factor results in a 2% increase in
the electricity imports from the national grid. The electricity imports from the national
grid increased just by 2% showing increased demand of electricity from the
microgrids. Table.17 and figure.17 give a clear picture of the simulation results.
Case E,F.F
Electricity
imported from the
National Grid
1 No 51%
2 Yes 53%
Table.17 – Electricity import Results of Equipment Failure Cases

50
No
Yes
51%
51%
52%
52%
53%
53%
54%
Equipment Failure
Ele
ctr
icit
y Im
po
rted
fro
m N
at
Gri
d
Figure.17 – Electricity import vs. Equipment Failure Case
From the statistics presented in table.17 and the trend shown in figure.17, it is evident
that electricity imports from the national grid increase by a small amount i.e. 2%
when equipment failure factor was considered. The reason for this increase is that
there was less energy in the microgrids’ electricity pool than usual due to some
microgrid failures, but the demands were the same, and so this energy shortage was
dealt by importing electricity from the national grid. So it was concluded that if the
equipment failures increase due to any reason, then the electricity imports from the
national grid will further increase.
3.3.4 Effect of Renewable Energy Intermittence
There were two simulations run to check the effect of renewable energy intermittence
factor on the microgrids’ electricity trading system. The details of these two cases
have been given in table.18.

51
Inputs Case 1 Case 2
Number of Dummy Microgrids 10 10
Total Microgrids 11 11
Variability in Size medium Medium
Equipment Failure Factor No No
Renewables Intermittence Factor No Yes
Different Peak/Off-Peak Rates No No
National Grid Electricity Price
(pence/kWh) 10 10
Microgrids Electricity Price
(pence/kWh) 7 7
*Note: the electricity prices are assumed values which could be
different, but kept constant throughout this thesis.
Table.18 - Cases to check the Effect of Renewables Intermittence
As in previous cases, the factors other than renewables intermittence factor were
either not considered, or kept constant.
Electricity wasted in the Pool
It was observed that considering renewables intermittence factor resulted in a 7%
decrease in electricity wastage from the microgrids’ electricity pool as more
electricity from the pool was consumed by the microgrids. Table.19 and figure.18
give a clear picture of the simulation results.
Case R.I.F
Electricity wasted
in the Pool
1 No 86%
2 Yes 79%
Table.19 – Electricity wastage Results of Renewables Intermittence Cases

52
No
Yes
78%
79%
80%
81%
82%
83%
84%
85%
86%
87%
Renewables Intermittence
Ele
ctr
icit
y W
aste
d
Figure.18 – Electricity wasted vs. Renewables Intermittence
From the statistics presented in table.19 and the trend shown in figure.18, it was
concluded that electricity wastage from the microgrids’ electricity pool is reduced by
considering renewables intermittence factor. There was less electricity supply due to
the intermittence of renewable sources but the demand was still as usual, so the
consumption of microgrids’ electricity increased thus resulting in a decrease in
electricity wastage.
Economic Loss
It was observed that the economic loss of the given microgrid reduced from 48% to
10% by considering renewables intermittence. The difference was 38% which is not
just a small reduction. Table.20 and figure.19 give a clear picture of the simulation
results.
Case R.I.F Economic Loss
1 No 48%
2 Yes 10%
Table.20 – Economic Loss Results of Renewables Intermittence Cases

53
No
Yes
0%
10%
20%
30%
40%
50%
60%
Renewables Intermittence
Ec
on
om
ic L
oss
Figure.19 – Economic Loss vs. Renewables Intermittence
From the statistics presented in table.20 and the trend shown in figure.19, it was
concluded that economic losses of the given microgrid decrease steeply when
renewables intermittence factor is considered. The reason of this benefit for the given
microgrid is the increased share of its electricity in the microgrids’ electricity pool.
Electricity imported from the National Grid
It was observed that considering renewables intermittence factor resulted in increased
imports of electricity from the national grid. The 12% rise in electricity imports from
the national grid showed a major increase. Table.21 and figure.20 give a clear picture
of the simulation results.
Case R.I.F
Electricity imported
from the National
Grid
1 No 51%
2 Yes 63%
Table.21 – Electricity import Results of Renewables Intermittence Cases

54
No
Yes
0%
10%
20%
30%
40%
50%
60%
70%
Renewables Intermittence
Ele
ctr
icit
y Im
po
rted
fro
m N
at
Gri
d
Figure.20 – Electricity import vs. Renewables Intermittence
From the statistics presented in table.21 and the trend shown in figure.20, it was
concluded that electricity imports from the national grid increase when renewables
intermittence factor is considered. The reason for this increase is that, it was assumed
for this system that every microgrid has some share of its electricity generated from
renewables. So considering renewables intermittence factor caused reductions in
electricity generation from most of the microgrids in the system and increased imports
from the national grid.
3.3.5 Effect of Separate Price Plans for Peak/Off-Peak Timings
There were two simulations run to check the effect of considering different peak and
off-peak rates in a microgrid electricity trading system. The details of these
simulations have been given in table.22.
As in previous cases, the factors other than peak/off-peak rates were either not
considered, or kept constant.

55
Inputs Case 1 Case 2
Number of Dummy Microgrids 10 10
Total Microgrids 11 11
Variability in Size medium Medium
Equipment Failure Factor No No
Renewables Intermittence Factor No No
Different Peak/Off-Peak Rates No Yes
National Grid Electricity Price
(pence/kWh) 10 10
Microgrids Electricity Price
(pence/kWh) 7 7
*Note: the electricity prices are assumed values which could be
different, but kept constant throughout this thesis.
Table.22 – Cases to Check the Effect of Separate Price Plans
Hence this factor only affects the economic aspects of the system, so only economic
losses were observed to compare the system behaviours in the two simulations.
Economic Loss
It was observed that considering different peak and off-peak rates resulted in a
significant increase in the economic losses of the given microgrid. There was a rise of
11% in the economic loss when different rates were considered. Table.23 and
figure.21 give a clear picture of the simulation results.
Case D.N.P Economic Loss
1 Yes 48%
2 No 37%
Table.23 – Economic Loss Results of Separate Price Plans Cases

56
No
Yes
0%
10%
20%
30%
40%
50%
60%
Day/Night Price Plans
Ec
on
om
ic L
os
s
Figure.21 – Economic Loss vs. Day/Night Separate Price Plans
From the statistics presented in table.23 and the trend shown in figure.21, it was
concluded that economic loss of the given microgrid increase by considering separate
price plans. The reason behind this increase is that electricity is available to the
microgrid at cheaper rates in the times when it already has excess electricity, and so
its electricity is sold through the pool at lower rates than normal. In the times when
the given microgrid had a demand, there were no reductions in the rates.
3.3.6 A Case Designed on the Basis of All Previous Results
On the basis of observations from all the previous simulations, a new case was
designed. The specifications of input data for the simulation were based on
conclusions from previous simulations. The case specifications are given in table.24.
The results from this simulation will reflect how the microgrids’ electricity trading
system would work in reality with a number of microgrids in the system, having high
variability in their sizes. Some of the microgrids may go down due to equipment
failure, and the electricity generation from these microgrids will also be affected by
the intermittence of their renewable sources. Different peak and off-peak rates were
not considered in this case to ensure that economic benefits of the given microgrid are
not reduced.
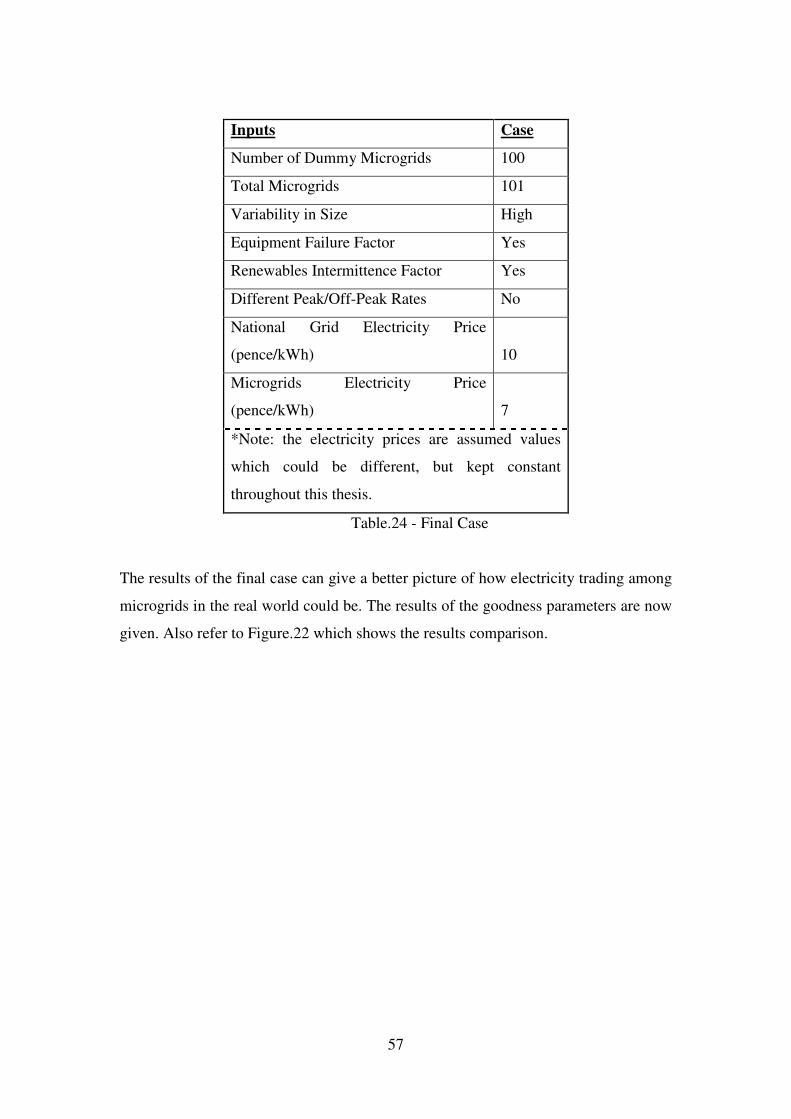
57
Inputs Case
Number of Dummy Microgrids 100
Total Microgrids 101
Variability in Size High
Equipment Failure Factor Yes
Renewables Intermittence Factor Yes
Different Peak/Off-Peak Rates No
National Grid Electricity Price
(pence/kWh) 10
Microgrids Electricity Price
(pence/kWh) 7
*Note: the electricity prices are assumed values
which could be different, but kept constant
throughout this thesis.
Table.24 - Final Case
The results of the final case can give a better picture of how electricity trading among
microgrids in the real world could be. The results of the goodness parameters are now
given. Also refer to Figure.22 which shows the results comparison.

58
Figure.22 - Results Comparison
A V
iew
of
All R
es
ult
s
0%
20%
40%
60%
80%
100%
120%
N=3
N=10
N=100
Vs=low
Vs=medium
Vs=high
E.F.F=No
E.F.F=Yes
RIF=No
RIF=Yes
DNP=No
DNP=Yes
Final
Ele
ctr
icity W
aste
d in
the P
ool
Ele
ctr
icity Im
port
ed
from
National G
rid
Econom
ic L
oss

59
Electricity wasted in the Pool
It was observed that, as expected, least electricity was wasted in the last case i.e. 67%.
It showed that with a real microgrids’ electricity trading system, with size variability,
equipment failures, renewables intermittence and large number of microgrids,
electricity wastage would be reduced and most of the amount of electricity generated
from the a microgrid will be consumed by other microgrids. It was also concluded
from the results that by increasing the number of microgrids in the system and raising
the variability in their sizes, the electricity wastage can further be reduced.
Economic Loss
The least figure of economic loss of the given grid was observed in the final case. It
was observed that only 3% economic losses occurred when simulated with the
specifications in the last case. From this and all the previous results, it was also
concluded that economic benefits can be increased further with more microgrids in
the system, higher variability in their sizes, with normally occurring equipment
failures and renewables intermittence. Day and night separate price plans can also
benefit a microgrid if the prices are lower in such timings when its generation is less
than its own demand, so it could buy electricity at cheaper prices.
Electricity imported from the National Grid
In the last case, only 41% of the total energy demand was imported from the national
grid which was better than most of the previous cases. This was the second lowest
value in the whole bunch of simulations performed for this thesis. The only value
lower than this was 28% which was obtained when simulation was performed only to
check the effect of number of microgrids with 100 microgrids in the system, but other
important factors like renewables intermittence and equipment failure were not
considered, and the variability in microgrids’ sizes was also medium in that
simulation. So it was concluded that in a realistic picture, similar to the final case, the

60
electricity imports for microgrids from the national grid can be lesser than half of their
total demand.
From all the simulations and results, valuable information was obtained. This
information is aimed to be used to make useful conclusions in the next chapter.

61
4
5 Chapter FOUR: CONCLUSIONS & FUTURE WORK
In the previous chapters, possible solutions were discussed to meet the latest
challenges to the energy industry. Microgrids, a community level embedded
generation system, were highlighted and the need to simulate electricity trading
among them was identified. As part of this thesis, the software MGET-SIM was
developed to simulate electricity trading among microgrids through the national grid.
Different cases were designed to check various aspects of the proposed electricity
trading system, and simulated using the software MGET-SIM. The obtained results
were presented in the form of tables and graphs, and discussed in detail. In this
chapter, the answers to the related hypotheses are presented in the light of
simulations’ results. The next in this chapter are the overall conclusions obtained from
this research based project. In the last part of this chapter, some future work has been
proposed.
5.1 Is electricity trading possible among microgrids?
Yes, electricity trading is possible among microgrids. As discussed in the previous
chapter, there were over 100 simulations performed (including the cases for the given
microgrid data, use of different seeds, different validations, etc) and the electricity
was traded successfully in each case. The random nature of size variability in the
whole system, renewables intermittence and equipment failures were considered
separately and then together, and they were not found capable to stop the trading in
any case. It can also be assumed that like electricity, low grade heat energy could also
be traded using the same concept.

62
5.2 Is every demand satisfied?
Yes. As the results of simulations prove, every demand was satisfied. Their source of
electricity was preferably a microgrid through the electricity pool, which served the
demands in most of the cases, and otherwise the demand was satisfied from the
national grid’s public electricity supply. So every microgrid had more security of
supply, by having two sources of electricity, the microgrids’ electricity pool and the
national grid.
5.3 Does it economically benefit a microgrid?
As the economic loss of given microgrid was calculated in every simulation, it was
observed that the microgrid benefited economically in every case. Looking at the
simulation results, it was also concluded that economic benefits can be increased
further by increasing number of microgrids in the system, higher variability in their
sizes, with normally occurring equipment failures and renewables intermittence. Day
and night separate price plans could also benefit a microgrid if prices are lower in
such timings when its generation is less than its own demand so it could buy
electricity at cheaper prices.
In the model used to check the economic benefits from this system, the inputs were
only the electricity selling and buying prices. However, in the future, this model could
further be improved by using advanced economic models with short and long
marginal costs. Also, as mentioned earlier in section 2.1.7, a detailed economic
evaluation of similar system was done by Zoka et al [16] who considered installation,
operation, microgrid construction and power interruption costs.
5.4 Will it work with 'N' number of microgrids?
In the cases presented in this thesis, it was shown that the system worked successfully
with up to 100 dummy microgrids. However, in the validation simulations, the
software worked successfully with 1000 dummy microgrids which is its present limit.

63
But as pointed out earlier in section 2.1.2, the software has the capability to simulate
any given ‘N’ number of microgrids with some modification in its source code. The
simulation results showed a better performance by the system when the number of
dummy microgrids was increased, so it was concluded that by increasing number of
microgrids, the performance of the system improves.
5.5 Does the simulator work with different supply & demand data sets?
Yes, as software testing results showed, it can work with any microgrid data given as
seed. By the microgrid data, a data set is meant with a reasonable electricity demand
as well as electricity generation. The software takes hourly values for a day for a
microgrid’s electricity generation and demand and these two values in each hour must
represent a 24 hours functional microgrid data.
5.6 Overall Conclusions
In the beginning of this thesis, the need was identified to simulate electricity trading
among the microgrids as they appear to be a promising solution for increasing the
security of supply, reliability of community based energy systems and penetration of
low voltage renewable energy systems into the distribution system, thus reducing the
share of depleting fossils in the energy markets and the hazardous emissions.
Assumptions were made about some impeding issues and the simulator MGET-SIM
was developed. Several simulations were performed to check the effects of different
factors on microgrids electricity trading system and its behaviour. The main
conclusions obtained from these simulations are as follows:
- Electricity is tradable among the microgrids. The stochastic nature of variable
sizes of microgrids in the whole system, renewables intermittence and
equipment failures can not fail the trading system in any case.

64
- Availability of multiple external sources of electricity, like the microgrids’
electricity pool and national grid public electricity supply, increase the
security of supply. Every demand was satisfied when simulated.
- Trading electricity among the microgrids is economically beneficial for them,
as the microgrids can sell their excess electricity to earn money, and buy cheap
electricity from the electricity pool when they have electricity demand.
- Electricity consumption can be increased from the microgrids’ electricity pool
by increasing the number of microgrids in the system with high variability
among their generation and demand capacities. Equipment failures and
renewables intermittence increase the overall electricity demand and thus
consumption from the microgrid electricity pool also increases.
- Equipment failures and renewables intermittence are the factors that increase
the imports from national grid’s public electricity supply. Microgrids, when
having electricity demand, can rely less on national grid’s public electricity
supply pool by increasing the number of microgrids in the system.
- Separate price plans for peak and off-peak timings are beneficial for a
microgrid only in the case where the microgrid has electricity demand when
the prices are off-peak i.e. low.
- The simulator MGET-SIM is useful with any given electricity generation and
demand data set of a microgrid.
5.7 Future Work
In this little span of time, maximum efforts have been put to develop a useful tool to
simulate electricity trading among microgrids. However, due to lack of time, some
useful ideas still remain ideas and need to be worked on to support further
developments in this much needed area. These ideas have been presented below.

65
5.7.1 Additions in the Software
5.7.1.1 Energy Storage
As pointed out at some instances in this thesis, a much need requirement of the
microgrids in future will be to store energy. This energy could either be used by the
microgrid itself or exported later. The energy could be stored using batteries, pumped
storage, compressible gases, etc. A good choice will be to store energy and then use it
to generate heat or electricity as per the demand. This will not only improve the
microgrid economically but environmentally as well.
5.7.1.2 Demand Only Consumers
In the present version of MGET-SIM, the trading is done among the microgrids or
between national grid and microgrids. However, in future versions, the ‘demand only’
consumers like a house, a shop, etc. could be introduced. The electricity from the
electricity pool of microgrids could be sold to the ordinary electricity consumers
through the national grid.
5.7.1.3 ‘N’ Number of Real Data Sets
For this thesis, the seed to the software was a pseudo microgrid data set. When the
real microgrid projects like those discussed in chapter.1 become functional, their real
time data sets could be used as seed to the software. Another idea is to have N seeds
of real data sets to the software and simulate electricity trading among them.
5.7.1.4 Simultaneous Trading of Heat and Electrical Energy
Hence MGET-SIM is an energy trading simulator, so it can also be used to simulate
trading of heat energy among microgrids. A useful feature to add in MGET-SIM
would be the simultaneous trading of electricity and heat energy among the
microgrids.

66
5.7.1.5 Cost & Environmental Models
In this thesis, the economic aspects were limited to the selling and buying prices of
electricity. In future, a bidding environment could be introduced like commodity
trading. This feature may be integrated with the energy storage, so an intelligent
microgrid could decide at what minimum price it could sell its electricity or store it
otherwise. The detailed cost model could include the short and long marginal costs of
the whole system. The environmental models could investigate the eco-performance
of the microgrid and there could also be a rating system on the basis of environment
friendliness of a microgrid.
5.7.1.6 DG in Stand-by
A microgrid could have the ability to predict through historic data if there will be no
demand of its energy in the next timestamp, and shutdown part of its generating
equipment or keep it in stand-by mode.
5.7.2 Policy & Legislation
To make the concept of electricity trading among microgrids a reality, there is need of
concrete policies and necessary legislation from the governments. Market
mechanisms are also required to support such a trading. It is a novel idea, and for new
practices, financers do not like to take risks. As a first step, government has to issue
reasonable funds so the research in this area could be supported and model microgrids
could be made. Government needs to take at least the following steps
- Reduce the administration burdens and lengthy procedures
- Provide fundings and scholarships to promote research in this area
- Introduce incentives, subsidies and awards to promote microgrids. For
example, the microgrid with lowest carbon footprint could be rewarded

67
- Ensure better communication between grid authorities and the microgrid
owners
- Ensure the development of necessary infrastructure that is required to begin
electricity trading among microgrids
- Aware the people how government is making it easier for them to build
microgrids, and encourage them to build it.
In MGET-SIM, any requirements imposed by the government on microgrids could be
made part of the simulator, to show how the microgrids behave to ensure they meet
these requirements.

68
Reference
1. Brown, L.R (2008), ‘PLAN B 3.0 Mobilizing to save civilization’, 2008, pp.273-
274
2. National Renewable Energy Laboratory (2000), ‘Solar Trough Power Plants’,
available online at:
http://www.osti.gov/accomplishments/documents/fullText/ACC0196.pdf, accessed on
September 02, 2009.
3. Calpine Corporation, ‘The Geysers’, available online at: http://www.geysers.com/,
accessed on September 02, 2009.
4. Rae, A. (2009), ‘Oil, Plastics and Power’, ISBN 0237536463, 9780237536466,
2009, p. 33
5. London Array (2009), the largest windfarm project, details available online at:
http://www.londonarray.com/about/, accessed on September 02, 2009.
6. Navarro, P. (2008), ‘The coming China wars: where they will be fought and how
they can be won’, ISBN 0132359820, 9780132359825, Ed.2, 2008, p. 103
7. Goldstein, L., et al (2003), ‘Gas Fired Distributed Energy Resource Technology
Characterizations’, A joint project of Gas Research Institute (GRI) and National
Renewable Energy Research Laboratory (NREL), 2003.
8. Greenpeace UK, ‘Combined Heat and Power’, available online at:
http://www.greenpeace.org.uk/climate/solutions/combined-heat-and-power-chp,
accessed on August 21, 2009.
9. Breeze, P.A. (2005), ‘Power Generation Technologies’, ISBN 0750663138,
9780750663137, 2005, p.62
10. ‘Emission Factors for Selected Technologies’, Energy Information
Administration, US Dept of Energy, USA. Available online at:
http://www.eia.doe.gov/pub/oiaf/1605/cdrom/pdf/gg-app-tables.pdf, accessed on
August 17, 2009.
11. ‘Review of Distributed Generation’, A joint UK government, Ofgem report, 2007,
p.3

69
12. ‘Ashton Hayes Going Carbon Neutral: 2009 Survey Summary’, available online
at: http://www.goingcarbonneutral.co.uk/microgrid-study-informaton, accessed on
August 21, 2009.
13. ‘Pilot Microgrids’, EU Microgrids Research Project, available online at:
http://www.microgrids.eu/index.php?page=kythnos, accessed on August 21, 2009.
14. Jiayi, H. et al (2007), ‘A Review on Distributed Energy Resources and
Microgrid’, Shanghai Jiaotong University, 2007.
15. Conner, S.J. (2003), ‘Distributed Dispatching for Embedded Generation’, PhD
Thesis, University of Strathclyde, 2003, p.11
16. Zoka, Y. et al (2006), ‘An Economic Evaluation for An Autonomous Independent
Network of Distributed Energy Resources’, 2006.

70
Appendix.1
Source Code of MGET-SIM
/ / / / / / / S T A R T / / / / / / /
#include <stdio.h>
#include <stdlib.h>
#include <iostream.h>
#include <time.h>
void init_mm( );
int number_range( int from, int to );
int number_mm( void );
static int rgiState[2+55]; // for random number
int main(void)
{
FILE *fp; /* file pointer */
int c,i,j,x,z,N,abc,vsz,effz,refz,dnpz,xyz,lmn,mno,opq,pqr,qrs,gsk,gh,gn,traderand;
float
mg[1000][48],vs,ngsp,mgsp,eff,ref,dnp[24],trade[1000][24],exp,grid,cost,costg,ghi,jk
l,mnop,inc[1000][24];
if ((fp=fopen("mg1.txt", "r"))==NULL)
{
printf("Cannot open file.\n");

71
}
for (i = 0; i < 48; i++)
{
if (fscanf(fp, "%f", &mg[0][i]) != 1)
{
break;
}
}
fclose(fp);
x = i;
printf("Supply & Demand data in text file is found for %d hours\n", (x/2));
for (i = 0; i < x; i++)
{
printf("mg[0][%d] = %6.2f\n", i, mg[0][i]);
}
// ask user how many dummy grids are required
printf ("what are the number of dummy micro-grids do you want to simulate
electricity trading with?\n");
scanf ("%d", &N);
// ask user how much variability in size is required
printf ("what should be the variability in size of dummy micro-grids from the given
micro-grid?\n Enter 1 for low, 2 for medium and 3 for high.\n");
scanf ("%d", &vsz);
while (vsz < 1)

72
{
printf ("Error: Please Enter a value in the given range. \n what should be the
variability in size of dummy micro-grids from the given micro-grid?\n Enter 1 for
low, 2 for medium and 3 for high.\n");
scanf ("%d", &vsz);
}
while (vsz > 3)
{
printf ("Error: Please Enter a value in the given range. \n what should be the
variability in size of dummy micro-grids from the given micro-grid?\n Enter 1 for
low, 2 for medium and 3 for high.\n");
scanf ("%d", &vsz);
}
// ask user if equipment failure possibility is to be considered
printf ("Do you want to consider the possibility of equipment failure in micro-
grids?\n Enter 1 for Yes, 2 for No.\n");
scanf ("%d", &effz);
while (effz < 1)
{
printf ("Error: Please Enter a value in the given range. \n Do you want to
consider the possibility of equipment failure in micro-grids?\n Enter 1 for Yes, 2 for
No.\n");
scanf ("%d", &effz);
}

73
while (effz > 2)
{
printf ("Error: Please Enter a value in the given range. \n Do you want to
consider the possibility of equipment failure in micro-grids?\n Enter 1 for Yes, 2 for
No.\n");
scanf ("%d", &effz);
}
// ask user if intermittence of renewable energy sources is to be considered
printf ("Do you want to consider the intermittence of renewable energy supplies in
micro-grids?\n Enter 1 for Yes, 2 for No.\n");
scanf ("%d", &refz);
while (refz < 1)
{
printf ("Error: Please Enter a value in the given range. \n Do you want to
consider the intermittence of renewable energy supplies in micro-grids?\n Enter 1 for
Yes, 2 for No.\n");
scanf ("%d", &refz);
}
while (refz > 2)
{
printf ("Error: Please Enter a value in the given range. \n Do you want to
consider the intermittence of renewable energy supplies in micro-grids?\n Enter 1 for
Yes, 2 for No.\n");
scanf ("%d", &refz);

74
}
// ask user the national grid electricity price
printf ("Please enter the national grid electricity price in pence/kWh\n");
scanf ("%f", &ngsp);
while (ngsp < 0.001)
{
printf ("Error: Invalid Price entered \n Please enter the national grid electricity
price in pence/kWh\n");
scanf ("%f", &ngsp);
}
// ask user the microgrid electricity price
printf ("Please enter the micro-grid electricity price in pence/kWh\n");
scanf ("%f", &mgsp);
while (mgsp >= ngsp)
{
printf ("Error: Invalid Price entered \n Price must be less than national grid
electricity price\n Please enter the micro-grid electricity price in pence/kWh\n");
scanf ("%f", &mgsp);
}
// ask user ask user if the night money saver plan is to be considered for electricity
price
printf ("Do you want to consider different electricity rates in day & night?\n Enter 1
for Yes, 2 for No.\n");
scanf ("%d", &dnpz);

75
while (dnpz < 1)
{
printf ("Error: Please Enter a value in the given range. \n Do you want to
consider different electricity rates in day & night?\n Enter 1 for Yes, 2 for No.\n");
scanf ("%d", &dnpz);
}
while (dnpz > 2)
{
printf ("Error: Please Enter a value in the given range. \n Do you want to
consider different electricity rates in day & night?\n Enter 1 for Yes, 2 for No.\n");
scanf ("%d", &dnpz);
}
init_mm(); //seed the number generator
for (j=1; j<=N; j++)
for (i=0; i<48; i++)
{
if (vsz == 1)
{
abc = number_range( 0, 10 );
vs = (0.1*(5.0+abc));
}
if (vsz == 2)

76
{
abc = number_range( 0, 27 );
vs = (0.1*(3.0+abc));
}
if (vsz == 3)
{
abc = number_range( 0, 100 );
vs = (0.1*abc);
}
if (effz == 1)
{
lmn = number_range( 0, 1 );
mno = number_range( 0, 1 );
opq = number_range( 0, 1 );
pqr = number_range( 0, 1 );
qrs = number_range( 0, 1 );
eff = (lmn+mno+opq+pqr+qrs)/(lmn+mno+opq+pqr+qrs+0.000001);
}
if (effz == 2)
{
eff = 1.0;
}
if (refz == 1)
{

77
xyz = number_range( 7, 10 );
ref = (0.1*(xyz));
}
if (refz == 2)
{
ref = 1.0;
}
if (dnpz == 1)
{
if ((fp=fopen("dnp1.txt", "r"))==NULL)
{
printf("Cannot open the night package file.\n");
}
for (int dnlp = 1; dnlp <= 24; dnlp++)
{
if (fscanf(fp, "%f", &dnp[dnlp]) != 1)
{
break;
}
}
fclose(fp);
}
if (dnpz == 2)
{

78
if ((fp=fopen("dnp0.txt", "r"))==NULL)
{
printf("Cannot open the price package file.\n");
}
for (int dnlp = 1; dnlp <= 24; dnlp++)
{
if (fscanf(fp, "%f", &dnp[dnlp]) != 1)
{
break;
}
}
fclose(fp);
}
{
if (i%2!=0)
{
mg[j][i]= (mg[0][i]*vs);
}
else mg[j][i]= (mg[0][i]*vs*eff*ref);
printf ("mg[%d][%d] is %10.2f\n", j, i, mg[j][i]);
}
};
fp = fopen("results.txt", "w");
if (fp == NULL)

79
{
printf("\nError opening write.txt\n");
exit(1);
}
else;
for (gh=1; gh<=24; gh++)
{
exp = 0;
grid = 0;
mnop=0;
for (gn=0; gn<=N; gn++)
{
trade [gn][gh]= (mg[gn][(gh*2)-2])-(mg[gn][(gh*2)-1]);
printf ("Hour no %d: Energy available in Micro-grid No.%d is %10.2f
kWh\n", gh, gn, trade[gn][gh]);
fprintf(fp, "%d %d %7.2f ", gh, gn, trade[gn][gh]);
if ((trade[gn][gh])>0)
{
exp = exp + (trade[gn][gh]);
ghi = exp;
fprintf(fp, "%9.2f\n", exp);
}
if (gn == N)
{

80
printf ("Energy available in the microgrids pool is %10.2f\n", exp);
for (gsk=0; gsk<(10*N); gsk++)
{
traderand = number_range( 0, gn );
if ((trade[traderand][gh])<0)
{
printf ("Random grid selected for electricity trading is %d\n",
traderand);
if (((trade[traderand][gh])+exp)>0)
{
cost = (trade[traderand][gh])*dnp[gh]*mgsp*0.01;
printf ("Hour No. %d\nImporter: Microgrid No. %d\nImport:
%10.2f kWh\n Cost/kWh: %3.2f\n", gh,traderand,(trade[traderand][gh]),cost);
fprintf (fp, "%d %d %7.2f", gh,traderand,(trade[traderand][gh]));
exp = exp + (trade[traderand][gh]);
printf ("Energy still available: %10.2f kWh\n",exp);
fprintf(fp, "%9.2f %6.2f\n", exp,cost);
(trade[traderand][gh])= 0;
}
if (((trade[traderand][gh])+exp)<0)
{
costg = (trade[traderand][gh])*dnp[gh]*ngsp*0.01;
printf ("Hour No. %d\nImporter: Microgrid No. %d\nImport:
%10.2f kWh\n Cost/kWh: %3.2f\n", gh,traderand,(trade[traderand][gh]),costg);

81
fprintf (fp, "%d %d %7.2f", gh,traderand,(trade[traderand][gh]));
grid = grid + (trade[traderand][gh]);
fprintf(fp, "%9.2f %6.2f", grid,costg);
printf ("Total electricity imported from the grid: %10.2f
kWh\n",grid);
(trade[traderand][gh])= 0;
mnop=mnop+costg;
fprintf(fp, "%7.2f\n", mnop);
}
fprintf(fp, "National Grid earns %7.2f\n", mnop);
}
}
jkl=ghi-exp;
}
inc[i][gh]=0;
for (i=0;i<=N;i++)
{
if ((trade[i][gh])>0)
{
inc[i][gh]=((trade[i][gh])*dnp[gh]*mgsp*0.01*jkl)/ghi;
if (inc[i][gh]>0)
{
fprintf(fp, "Grid No:%d earns %6.2f\n", i,inc[i][gh]);
inc[i][gh]=0;

82
}
}
}
jkl=0;
}
};
fclose(fp);
printf ("See the results.txt file in the program folder for simulation results\n Press C
then Enter to close the program");
scanf ("%d",&c);
return 0;
}
int number_mm( void ) //for random number generator (ref.16) //
{
int *piState;
int iState1;
int iState2;
int iRand;
piState = &rgiState[2];
iState1 = piState[-2];
iState2 = piState[-1];
iRand = ( piState[iState1] + piState[iState2] )
& ( ( 1 << 30 ) - 1 );
piState[iState1] = iRand;

83
if ( ++iState1 == 55 )
iState1 = 0;
if ( ++iState2 == 55 )
iState2 = 0;
piState[-2] = iState1;
piState[-1] = iState2;
return iRand >> 6;
}
/*
* Generate a random number.
*/
int number_range( int from, int to ) //for random number generator
{
int power;
int number;
if ( ( to = to - from + 1 ) <= 1 )
return from;
for ( power = 2; power < to; power <<= 1 )
;
while ( ( number = number_mm( ) & ( power - 1 ) ) >= to )
;
return from + number;
}
/*

84
* This is the Mitchell-Moore algorithm from Knuth Volume II.
*/
void init_mm( ) //for random number generator
{
int *piState;
int iState;
piState = &rgiState[2];
piState[-2] = 55 - 55;
piState[-1] = 55 - 24;
piState[0] = ( (int) time( NULL ) ) & ( ( 1 << 30 ) - 1 );
piState[1] = 1;
for ( iState = 2; iState < 55; iState++ )
{
piState[iState] = ( piState[iState-1] + piState[iState-2] )
& ( ( 1 << 30 ) - 1 );
}
return ; //end of code for random number generator
}
/ / / / / / / F I N I S H / / / / / / /

85
Appendix.2
1. First the user has to copy a text file (should be named as mg1.txt) in the program
folder. This text file contains the hourly generation/demand data of a microgrid (tab-
separated values) for one day (i.e. 24 time-steps). Units are assumed as kWh. The data
should be in a format like:
80.00 23.00 82.00 22.00 80.00 23.00 81.00 24.00
As an alternate option, the user can simply edit the already available mg1.txt file in
the program folder with its own microgrid data.
2. The data is stored in an array ‘mg[0] [48]’.
3. The user is asked for required number of dummy microgrids, say N. on the basis of
user input, the program generates N number of array from mg[1] [48], mg[2] [48],…
mg[N] [48]. At this moment, program is designed so it could generate up to 1000
microgrids. With little modification in the program, it could generate more.
4. The user is prompted for variability in size of dummy microgrids from the given
microgrid: (1-low, 2-medium, 3-high)
- If ‘low’: the program generates a random number Vs. (Vs = 0.5~1.5)
- If ‘medium’: the program generates a random number Vs (Vs = 0.3~3.0)
- If ‘high’: the program generates a random number Vs (Vs = 0.1~10.0)
5. The user is asked if the impact of equipment failure is to be considered: (yes/no)
- If ‘yes’: the program generates a number ‘eff’ i.e. either ‘0’ or ‘1’. (eff = 0.0 or
eff = 1.0).. The Code has been modified in a way so it does not generate ‘0’
very often.
- If ‘no’: the program always takes (eff = 1.0)
6. The user is asked if the intermittence of renewable energy sources is to be
considered: (yes/no)
- If ‘yes’: the program generates a random number ‘ref’. (ref = 0.7~1.0)
- If ‘no’: the program always takes (ref = 1.0)
7. The user is asked for the national grid electricity price in pence/kWh. It is given the
name ‘ngsp’.

86
8. The user is asked for the microgrid electricity price in pence/kWh. It is given the
name ‘mgsp’.
9. The user is asked if the day/night price plan is to be considered (yes/no). The
program folder contains two more files, dnp0.txt and dnp1.txt. These correspond to
day/night price plans.
- If ‘yes’: the program makes an array ‘dnp[24]’ taking input from dnp1.txt.
- If ‘no’: the program makes an array ‘dnp[24]’ taking input from dnp0.txt.
10. Once the program has taken the required data from the user, it will generate values
for each dummy microgrid in the mg[N][48] array in the following manner:
mg[N][0]=mg[0][0] x vs x eff x ref
mg[N][2]=mg[0][2] x vs x eff x ref
mg[N][46]=mg[0][46] x vs x eff x ref
Supply data of dummy grids
mg[N][1]=mg[0][1] x vs
mg[N][3]=mg[0][3] x vs
Mg[N][47]=mgone[47] x vs
Demand data of dummy grids
11. Now after all dummy microgrid arrays have been generated, a two dimensional
array is generated which is trade[gn][gh], where gn corresponds to grid number and
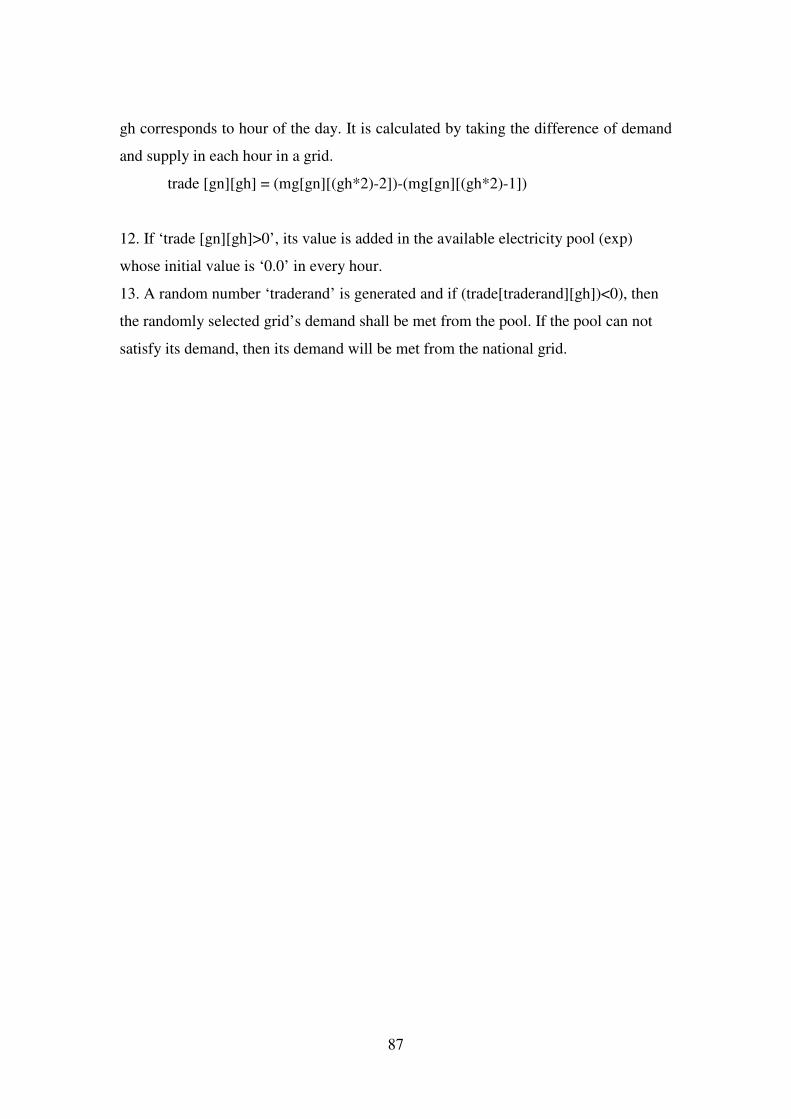
87
gh corresponds to hour of the day. It is calculated by taking the difference of demand
and supply in each hour in a grid.
trade [gn][gh] = (mg[gn][(gh*2)-2])-(mg[gn][(gh*2)-1])
12. If ‘trade [gn][gh]>0’, its value is added in the available electricity pool (exp)
whose initial value is ‘0.0’ in every hour.
13. A random number ‘traderand’ is generated and if (trade[traderand][gh])<0), then
the randomly selected grid’s demand shall be met from the pool. If the pool can not
satisfy its demand, then its demand will be met from the national grid.