electricity scarcity pricing with an operating … · electricity scarcity pricing with an...
TRANSCRIPT

ELECTRICITY SCARCITY PRICING WITH AN OPERATING RESERVE DEMAND CURVE
William W. Hogan
Mossavar-Rahmani Center for Business and Government John F. Kennedy School of Government
Harvard University Cambridge, Massachusetts 02138
2013 Austin Electricity Conference Are Capacity Markets Necessary to Ensure Adequate Generating Reserves?
Austin, TX April 18, 2013

1
MW
Energy Price(¢/kWh)
Q1 Q2 Qmax
Demand2-2:30 a.m.
Demand9-9:30 a.m.
Demand7-7:30 p.m.
Short-RunMarginal
Cost
Price at7-7:30 p.m.
Price at9-9:30 a.m.
Price at2-2:30 a.m.
SHORT-RUN ELECTRICITY MARKET
ELECTRICITY MARKET A Consistent Framework The example of successful central coordination, CRT, Regional Transmission Organization (RTO) Millennium Order (Order 2000) Standard Market Design (SMD) Notice of Proposed Rulemaking (NOPR), “Successful Market Design” provides a workable market framework that is working in places like New York, PJM in the Mid-Atlantic Region, New England, the Midwest, California, SPP, and Texas. This efficient market design is under (constant) attack.
“Locational marginal pricing (LMP) is the electricity spot pricing model that serves as the benchmark for market design – the textbook ideal that should be the target for policy makers. A trading arrangement based on LMP takes all relevant generation and transmission costs appropriately into account and hence supports optimal investments.”(International Energy Agency, Tackling Investment Challenges in Power Generation in IEA Countries: Energy Market Experience, Paris, 2007, p. 16.)
CoordinatedSpot Market
Bid-Based,Security-Constrained,Economic Dispatchwith Nodal Prices
The RTO NOPR Order SMD NOPR "Successful Market Design" Contains a Consistent Framework
07/05
Bilateral Schedules
Financial Transmission Rights
Lice
nse
Plat
e A
cces
s C
harg
es Market-D
riven Investment
at Difference in Nodal Prices
(TCCs, FTRs, FCRs, CRRs, ...)5/99
12/9907/02

2
MW
Energy Price
(¢/kWh)
Q1 Q2 Qmax
Demand2-2:30 a.m.
Demand9-9:30 a.m.
Demand7-7:30 p.m.
Short-RunMarginal
Cost
Mitigated Price at7-7:30 p.m.
Price at9-9:30 a.m.
Price at2-2:30 a.m.
SHORT-RUN ELECTRICITY MARKET
} MissingMoney
ELECTRICITY MARKET Pricing and Demand Response Early market designs presumed a significant demand response. Absent this demand participation most markets implemented inadequate pricing rules equating prices to variable costs even when capacity is constrained. This produces a “missing money” problem.

3
ELECTRICITY MARKET Scarcity Pricing Scarcity pricing presents an important challenge for Regional Transmission Organizations (RTOs) and electricity market design. Simple in principle, but more complicated in practice, inadequate scarcity pricing is implicated in several problems associated with electricity markets. Investment Incentives. Inadequate scarcity pricing contributes to the “missing money” needed to
support new generation investment. The policy response has been to create capacity markets. Better scarcity pricing would reduce the challenges of operating good capacity markets.
Demand Response. Higher prices during critical periods would facilitate demand response and distributed generation when it is most needed. The practice of socializing payments for capacity investments compromises the incentives for demand response and distributed generation.
Renewable Energy. Intermittent energy sources such as solar and wind present complications in providing a level playing field in pricing. Better scarcity pricing would reduce the size and importance of capacity payments and improve incentives for renewable energy.
Transmission Pricing. Scarcity pricing interacts with transmission congestion. Better scarcity pricing would provide better signals for transmission investment.
Smarter scarcity pricing would mitigate or substantially remove the problems in all these areas. While long-recognized, the need for smarter prices for a smarter grid promotes interest in better theory and practice of scarcity pricing.1
1 FERC, Order 719, October 17, 2008.

4
ELECTRICITY MARKET Operating Reserve Demand Operating reserve demand curve would reflect capacity scarcity.
Illustrative Reserve Demand
Q(MW)
ReserveDemand
P ($/MWh)$20,000
$10,000
$30
There is a minimum level of operating reserve (e.g., 3%) to protect against system-wide failure. Above the minimum reserve, reductions below a nominal reserve target (e.g., 7%) are price senstive.
3%
7%
EnergyDemand

5
ELECTRICITY MARKET Generation Resource Adequacy Market clearing addresses the “missing money.”
Normal "Energy Only" Market Clearing
Q(MW)
Energy + Reserves
P ($/MWh)$20,000
$10,000
$30
When demand is low and capacity available, reserves hit nominal targets at a low price.
GenerationSupply
Scarcity "Energy Only" Market Clearing
Q(MW)
Energy + Reserves
P ($/MWh)$20,000
$10,000
$30
When demand is high and reserve reductions apply,there is a high price.
GenerationSupply
$7,000

6
ELECTRICITY MARKET Smart Pricing A critical connection is the treatment of operating reserves and construction of operating reserve demand curves. The basic idea of applying operating reserve demand curves is well tested and found in operation in important RTOs.
NYISO. See NYISO Ancillary Service Manual, Volume 3.11, Draft, April 14, 2008, pp. 6-19-6-22. ISONE. FERC Electric Tariff No. 3, Market Rule I, Section III.2.7, February 6, 2006. MISO. FERC Electric Tariff, Volume No. 1, Schedule 28, January 22, 2009. 2 PJM. PJM Manual 11, Energy & Ancillary Services Market Operations, Revision: 59, April 1, 2013.
The underlying models of operating reserve demand curves differ across RTOs. One need is for a framework that develops operating reserve demand curves from first principles to provide a benchmark for the comparison of different implementations.
Operating Reserve Demand Curve Components. The inputs to the operating reserve demand curve construction can differ and a more general model would help specify the result.
Locational Differences and Interactions. The design of locational operating reserve demand curves presents added complications in accounting for transmission constraints.
Economic Dispatch. The derivation of the locational operating demand curves has implications for the integration with economic dispatch models for simultaneous optimization of energy and reserves.
2 “For each cleared Operating Reserve level less than the Market-Wide Operating Reserve Requirement, the Market-Wide Operating Reserve Demand Curve price shall be equal to the product of (i) the Value of Lost Load (“VOLL”) and (ii) the estimated conditional probability of a loss of load given that a single forced Resource outage of 100 MW or greater will occur at the cleared Market-Wide Operating Reserve level for which the price is being determined. … The VOLL shall be equal to $3,500 per MWh.” MISO, FERC Electric Tariff, Volume No. 1, Schedule 28, January 22, 2009, Sheet 2226.
7
ELECTRICITY MARKET ERCOT Operating Reserves An application of the model for the case of ERCOT illustrates the possible scale of the impacts.

8
ELECTRICITY MARKET ERCOT Operating Reserves An application of the model for the case of ERCOT illustrates the possible scale of the impacts. The purpose of the back cast was to suggest the scale of the scarcity prices that would have been relevant under the tight conditions that existed in 2011 and the greater abundance of capacity in 2012. The charge was not to simulate the full system to include changes in behavior and dispatch, which could be expected to occur. Rather the mandate was to assume the same offers, bids and dispatch that actually occurred, and then recalculate the energy and reserve prices. This provides a first order approximation of the effects of scarcity pricing. By way of comparison, the “ERCOT-wide load-weighted average real-time energy price was $53.23 per MWh in 2011, a 35 percent increase from $39.40 per MWh in 2010.” (Potomac Economics, 2012)
Table 1 : Energy-weighted average energy price adder (and Online reserve price) ($/MWh) for 2011 & 2012 for different VOLLs and minimum contingency levels (X)
VOLL
Energy-weighted average price increase with X at 1375 MW
($/MWh)
Energy-weighted average price increase with X at 1750 MW
($/MWh)
2011 2012 2011 &
2012 combined
2011 2012 2011 &
2012 combined
$5000/MWh 7.00 1.08 4.08 12.03 2.40 7.28
$7000/MWh 11.27 1.56 6.48 19.06 3.45 11.35
$9000/MWh 15.54 2.05 8.87 26.08 4.50 15.42
Source:(ERCOT Staff & Hogan, 2013)
ERCOT Staff, & Hogan, W. W. (2013). “Back Cast of Interim Solution B + to Improve Real-Time Scarcity Pricing White Paper.” Potomac Economics. (2012). “2011 State of the Market Report for the ERCOT Wholesale Electricity Markets.”

9
ELECTRICITY MARKET Scarcity Pricing and Resource Adequacy Better scarcity pricing would improve many aspects of market efficiency. In addition, better scarcity pricing would contribute towards making up the missing money and supporting resource adequacy. Would better scarcity pricing be enough to resolve the resource adequacy problem? Posing a choice between capacity markets and better scarcity pricing is a false dichotomy.
Even if the scarcity pricing is not enough and a long-term capacity market is necessary, better scarcity pricing would make the capacity market less important and thereby mitigate some of the unintended consequences.
Resource adequacy depends on the planning standard. The planning reserve margin rests on criteria such as the 1-event-in-10-years standard that appears to be a rule of thumb rather than a result derived from first principles. Depending on the details of filling in missing pieces in the economic analysis, the VOLL implied by the reliability standard is at least an order of magnitude larger than the range that would be consistent with actual choices and technology opportunities. There is general agreement that applying reasonable estimates of VOLL and the cost-benefit criterion of welfare maximization would not support the typical planning reliability standards.
Justification of the planning standard would depend on a more nuanced argument for market failure that goes well beyond suppressed scarcity prices. A more complicated argument might address dynamic issues about the credibility of future market returns versus future regulatory mandates. The volatility and uncertainty of market forces might tip the argument one way or the other. Or a different engineering argument might call for efforts to compensate for the errors of approximation in the engineering models that underpin both the reliability planning studies and the cost-benefit analyses. These efforts might include a margin of safety beyond the already conservative assumptions of security constrained n-1 contingency analysis.

10
ELECTRICITY MARKET Smarter and Better Pricing Improved pricing through an explicit operating reserve demand curve raises a number of issues.
Demand Response: Better pricing implemented through the operating reserve demand curve would provide an important signal and incentive for flexible demand participation in spot markets.
Price Spikes: A higher price would be part of the solution. Furthermore, the contribution to the “missing money” from better pricing would involve many more hours and smaller price increases.
Practical Implementation: NYISO, ISONE, MISO and PJM implementations dispose of any argument that it would be impractical to implement an operating reserve demand curve. The only issues are the level of the appropriate price and the preferred model of locational reserves.
Operating Procedures: Implementing an operating reserve demand curve does not require changing the practices of system operators. Reserve and energy prices would be determined simultaneously treating decisions by the operators as being consistent with the adopted operating reserve demand curve.
Multiple Reserves: The demand curve would include different kinds of operating reserves, from spinning reserves to standby reserves.
Reliability: Market operating incentives would be better aligned with reliability requirements.
Market Power: Better pricing would remove ambiguity from analyses of high prices and distinguish (inefficient) economic withholding through high offers from (efficient) scarcity pricing derived from the operating reserve demand curve.
Hedging: Day-ahead and longer term forward markets can reflect expected scarcity costs, and price in the risk.
Increased Costs: The higher average energy costs from use of an operating reserve demand curve do not automatically translate into higher costs for customers. In the aggregate, there is an argument that costs would be lower.
11
ELECTRICITY MARKET Operating Reserve Demand Curve On the development of an operating reserve demand curve.
Appendix

12
ELECTRICITY MARKET An Economic Dispatch Model Begin with an expected value formulation of economic dispatch that might appeal in principle. Given benefit (B) and cost (C) functions, demand (d), generation (g), plant capacity (Cap), reserves (r), commitment decisions (u), transmission constraints (H), and state probabilities (p):
0 0 0 0 0 0
0, , , , 0,1 1
0 0
0
, , , , , ,
. ., 0, 2, , ,
0, 0,1, 2, , ,, 0,1,2, , ,
,, 1, 2, , ,, 0,1,2, , .
i i i
Ni i i i
iy d g r u i
i i i
t i
i i i
i
i i
Max p B d C g r u p B d d C g g r u
s ty d g i Ny i N
H y b i Ng r u Capg g r i Ng u Cap i N
Suppose there are K possible contingencies. The interesting cases have 310K . The number of possible system states is 2KN , or more than the stars in the Milky Way. Some approximation will be in order.3 3 Shams N. Siddiqi and Martin L. Baughman, “Reliability Differentiated Pricing of Spinning Reserve,” IEEE Transactions on Power Systems, Vol. 10, No. 3, August 1995, pp.1211-1218. José M. Arroyo and Francisco D. Galiana, “Energy and Reserve Pricing in Security and Network-Constrained Electricity Markets,” IEEE Transactions On Power Systems, Vol. 20, No. 2, May 2005, pp. 634-643. François Bouffard, Francisco D. Galiana, and Antonio J. Conejo, “Market-Clearing With Stochastic Security—Part I: Formulation,” IEEE Transactions On Power Systems, Vol. 20, No. 4, November 2005, pp. 1818-1826; “Part II: Case Studies,” pp. 1827-1835.
13
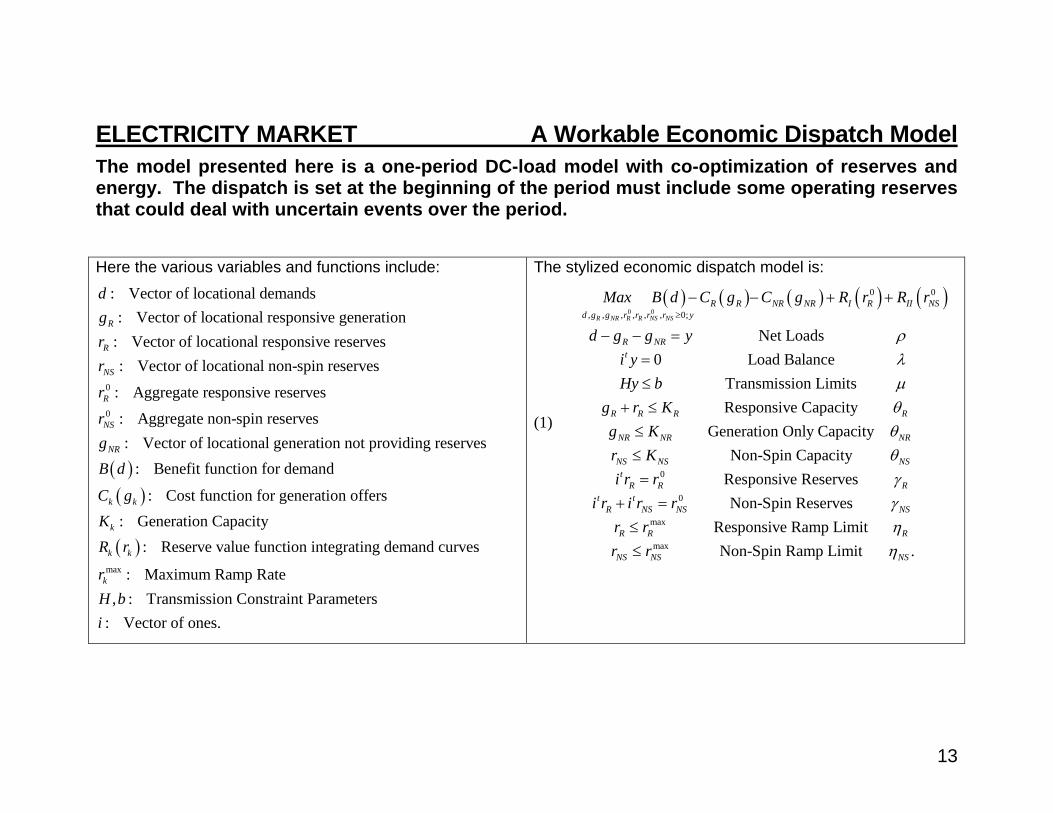
ELECTRICITY MARKET A Workable Economic Dispatch Model The model presented here is a one-period DC-load model with co-optimization of reserves and energy. The dispatch is set at the beginning of the period must include some operating reserves that could deal with uncertain events over the period. Here the various variables and functions include:
0
0
: Vector of locational demands: Vector of locational responsive generation
: Vector of locational responsive reserves: Vector of locational non-spin reserves
: Aggregate responsive reserves
:
R
R
NS
R
NS
dgrr
r
r
Aggregate non-spin reserves : Vector of locational generation not providing reserves
: Benefit function for demand
: Cost function for generation offers: Generation Capacity
: Reserve value fun
NR
k k
k
k k
gB d
C gKR r
max
ction integrating demand curves
: Maximum Ramp Rate, : Transmission Constraint Parameters
: Vector of ones.
krH bi
The stylized economic dispatch model is:
(1)
0 0
0 0
, , , , , , 0;
Net Loads0 Load Balance
Transmission LimitsResponsive Capacity
Generation Only CapacityNon-Spin
R NR R R NS NS
R R NR NR I R II NSd g g r r r r y
R NRt
R R R R
NR NR NR
NS NS
Max B d C g C g R r R r
d g g yi yHy b
g r Kg Kr K
0
0
max
max
CapacityResponsive ReservesNon-Spin Reserves
Responsive Ramp LimitNon-Spin Ramp Limit .
NSt
R R Rt t
R NS NS NS
R R R
NS NS NS
i r ri r i r r
r rr r
14
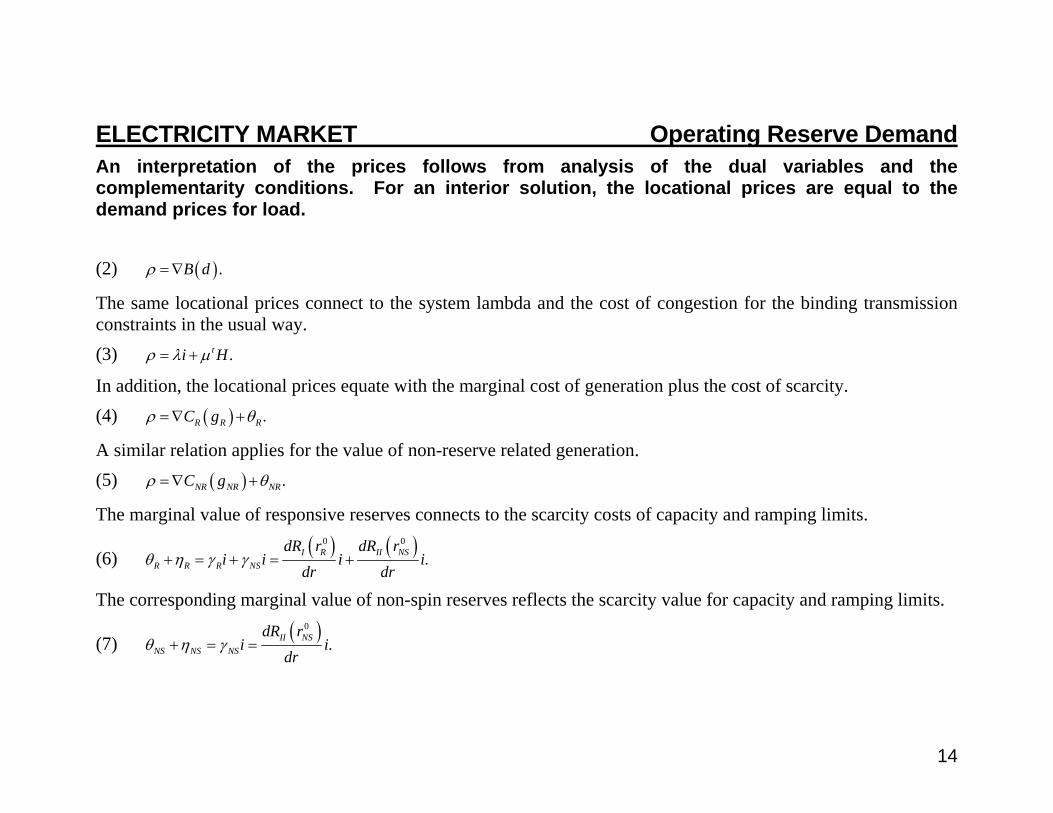
ELECTRICITY MARKET Operating Reserve Demand An interpretation of the prices follows from analysis of the dual variables and the complementarity conditions. For an interior solution, the locational prices are equal to the demand prices for load. (2) .B d
The same locational prices connect to the system lambda and the cost of congestion for the binding transmission constraints in the usual way. (3) .ti H
In addition, the locational prices equate with the marginal cost of generation plus the cost of scarcity. (4) .R R RC g
A similar relation applies for the value of non-reserve related generation. (5) .NR NR NRC g
The marginal value of responsive reserves connects to the scarcity costs of capacity and ramping limits.
(6) 0 0
.I R II NSR R R NS
dR r dR ri i i i
dr dr
The corresponding marginal value of non-spin reserves reflects the scarcity value for capacity and ramping limits.
(7) 0
.II NSNS NS NS
dR ri i
dr

15
ELECTRICITY MARKET Operating Reserve Demand The assumption of a benefit function for reserves simplifies the analysis. The derivative of the reserve benefit defines an operating reserve demand curve. The basic framework approximates the complex problem with a wide range of uncertainties. Single Period Model. A static representation of the underlying dynamic problem. A building block
for a multi-period framework.
Deterministic Representation. The single period dispatch formulation based on bids, offers, and expected network conditions.
Security Constrained. The dispatch model includes n-1 contingency constraints to preclude cascading failures.
Ex Ante Dispatch. The dispatch is determined before uncertainty revealed.
Administrative Balancing. Uncertain events treated according to administrative rules to utilize operating reserves to maintain system balance and minimize load curtailments.
Expected Value for Reserves. The reserve benefit function represents the expected value of avoiding involuntary load curtailments and similar emergency actions.
Consistent Prices. The ex ante model co-optimizes the dispatch of energy and reserves and produces a consistent set of prices for the period.

16
ELECTRICITY MARKET Operating Reserve Demand The assumption of a benefit function for reserves simplifies the analysis. Here, a derivation of a possible approximation of a reserve benefit function provides a background for describing the form of an Operating Reserve Demand Curve (ORDC). Let f x be the probability of net load change. Treat net load change x and use of reserve, x , to avoid involuntary curtailment. Reserves protect against involuntary load curtailment at the value of lost load (VOLL).
(8)
, , , , 0; 0
Net Loads0 Load Balance
Transmission Limits
Responsive Capacity, Responsive Utilization
Responsiv,
R NR R x
tR R NR NR x R R x R R
d g g r y x
R NRt
R R Rt
x
x R
Max B d C g C g VOLLi C g C g f x
d g g yi yHy b
g r K
i x xr x
e LimitGeneration Only Capacity .
R
x
x
NR NR NRg K
After some simplification for a system wide reserve requirement, r, we obtain the approximation:
(9) ˆ 1 .tR R R RC g VOLL C i g F r i
Here 1 Probability Net Load ChangeF r Lolp r r , is the loss of load probability. The result is an easy calculation
in the term ˆ tR RVOLL C i g Lolp r in (9), which is the scarcity price defining the ORDC.

17
ELECTRICITY MARKET Operating Reserve Demand Operating reserve demand is a complement to energy demand for electricity. The probabilistic demand for operating reserves reflects the cost and probability of lost load. 4
Example Assumptions Expected Load (MW) 34000Std Dev % 1.50%Expected Outage % 0.45%Std Dev % 0.45%
Expected Total (MW) 153Std Dev (MW) 532.46VOLL ($/MWh) 10000 Under the simplifying assumptions, if the dispersion of the LOLP distribution is proportional to the expected load, the operating reserve demand is proportional to the expected load.
4 “For each cleared Operating Reserve level less than the Market-Wide Operating Reserve Requirement, the Market-Wide Operating Reserve Demand Curve price shall be equal to the product of (i) the Value of Lost Load (“VOLL”) and (ii) the estimated conditional probability of a loss of load given that a single forced Resource outage of 100 MW or greater will occur at the cleared Market-Wide Operating Reserve level for which the price is being determined. … The VOLL shall be equal to $3,500 per MWh.” MISO, FERC Electric Tariff, Volume No. 1, Schedule 28, January 22, 2009, Sheet 2226.
Operating Reserve Demand
0
1,000
2,000
3,000
4,000
5,000
6,000
7,000
0.00% 1.00% 2.00% 3.00% 4.00% 5.00% 6.00%
Q (% of load)
P ($
/MW
h)
Marginal Value
18
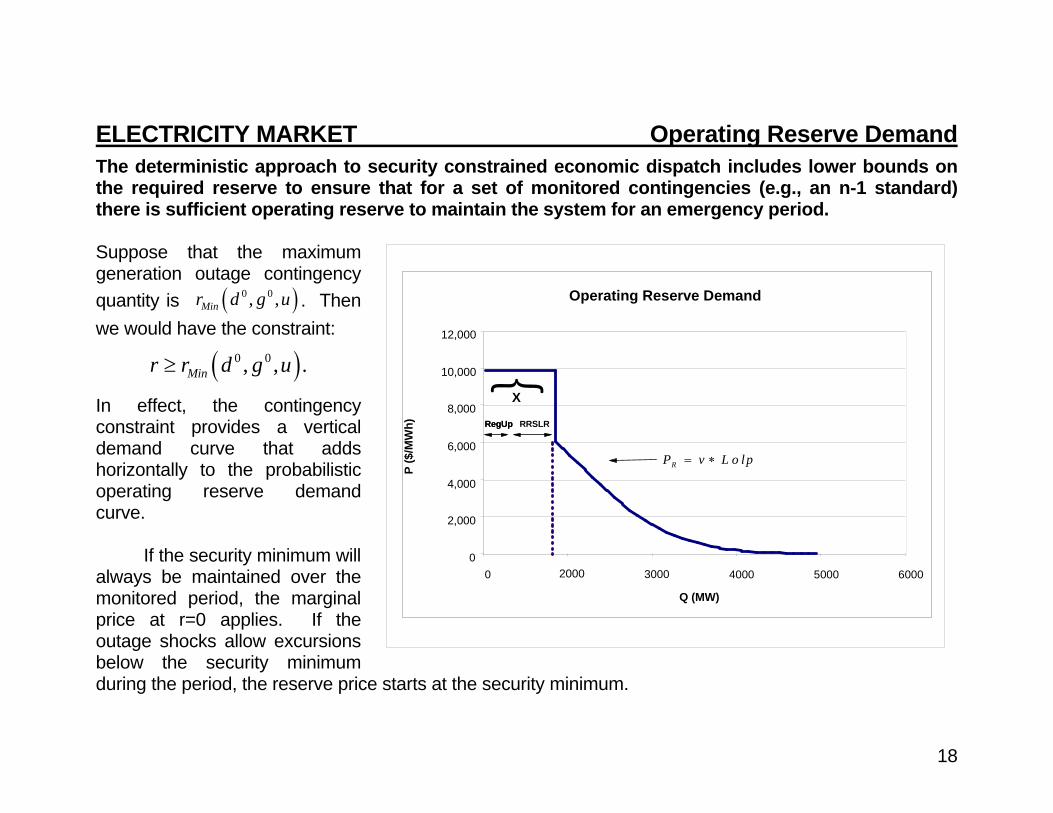
ELECTRICITY MARKET Operating Reserve Demand The deterministic approach to security constrained economic dispatch includes lower bounds on the required reserve to ensure that for a set of monitored contingencies (e.g., an n-1 standard) there is sufficient operating reserve to maintain the system for an emergency period. Suppose that the maximum generation outage contingency quantity is 0 0, ,Minr d g u . Then we would have the constraint:
0 0, , .Minr r d g u
In effect, the contingency constraint provides a vertical demand curve that adds horizontally to the probabilistic operating reserve demand curve.
If the security minimum will always be maintained over the monitored period, the marginal price at r=0 applies. If the outage shocks allow excursions below the security minimum during the period, the reserve price starts at the security minimum.
Operating Reserve Demand
0
2,000
4,000
6,000
8,000
10,000
12,000
0 2000 3000 4000 5000 6000
Q (MW)
P ($
/MW
h)X
RegUpRegUp RRSLR
}RP v L o lp

19
ELECTRICITY MARKET Operating Reserve Types Multiple types of operating reserves exist according to response time. A nested model divides the period into consecutive intervals. Reserve schedules set before the period. Uncertainty revealed after the start of the period. Faster responding reserves modeled as available for subsequent intervals. The operating reserve demand curves apply to intervals and the payments to generators include the sum of the prices for the available intervals.
Multiple Operating Reserve Demand Types (Intervals)
Synchronized Reserves
Other Reserves
+
Payment=$3000+$1000=$4000
800 MW
First Interval Operating Reserve Demand
0
2,000
4,000
6,000
8,000
10,000
12,000
0 500 1000 1500 2000 2500Q (MW)
P ($
/MW
h)Second Interval Operating Reserve Demand
0
2,000
4,000
6,000
8,000
10,000
12,000
0 500 1000 1500 2000 2500Q (MW)
P ($
/MW
h)
Payment=$1000
"Nested" Model
500 MW
Nested model with two intervals, decisions made before uncertainty revealed.

20
ELECTRICITY MARKET Operating Reserve Demand An interesting question is the frequency of different reserve levels and the interaction with the operating reserve demand curve. This will determine the scarcity price duration curve.
Capacity Frequency and Reserve Prices
System Reserve Demand Curve
$0
$1,000
$2,000
$3,000
$4,000
$5,000
$6,000
$7,000
$8,000
0 200 400 600 800 1000 1200 1400
Capacity (MW)
Pric
e ($
/MW
h)
Hypothetical Frequency
21
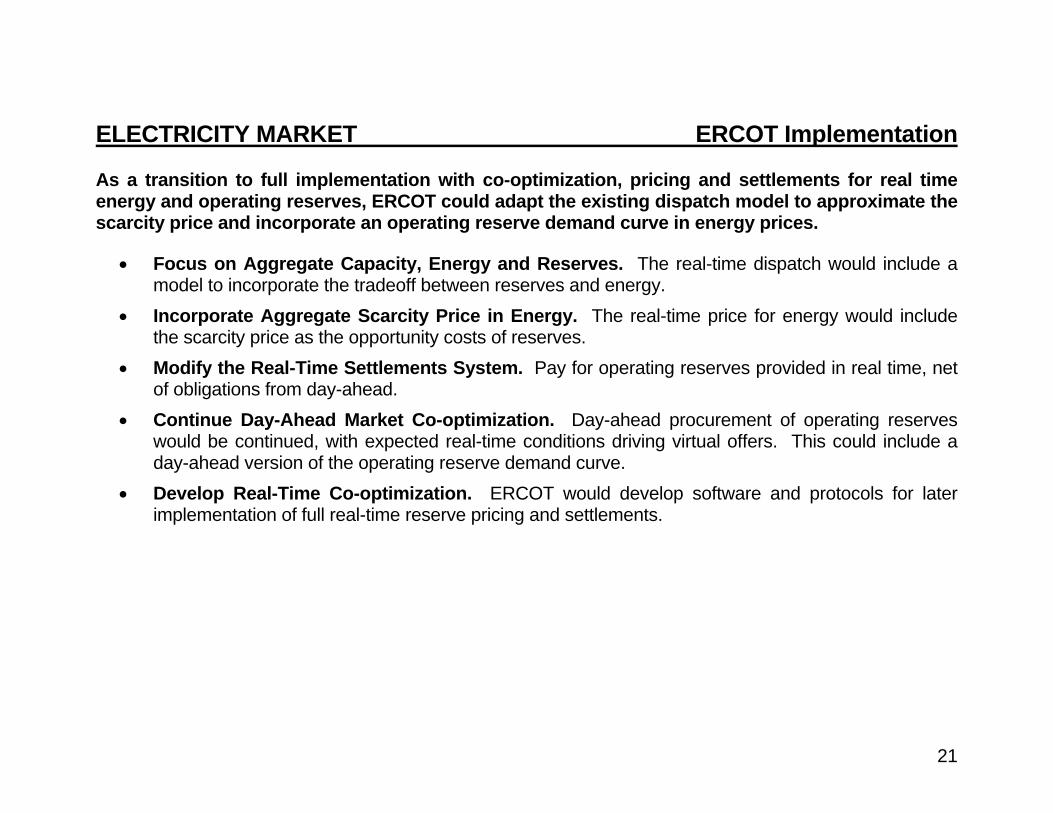
ELECTRICITY MARKET ERCOT Implementation As a transition to full implementation with co-optimization, pricing and settlements for real time energy and operating reserves, ERCOT could adapt the existing dispatch model to approximate the scarcity price and incorporate an operating reserve demand curve in energy prices.
Focus on Aggregate Capacity, Energy and Reserves. The real-time dispatch would include a model to incorporate the tradeoff between reserves and energy.
Incorporate Aggregate Scarcity Price in Energy. The real-time price for energy would include the scarcity price as the opportunity costs of reserves.
Modify the Real-Time Settlements System. Pay for operating reserves provided in real time, net of obligations from day-ahead.
Continue Day-Ahead Market Co-optimization. Day-ahead procurement of operating reserves would be continued, with expected real-time conditions driving virtual offers. This could include a day-ahead version of the operating reserve demand curve.
Develop Real-Time Co-optimization. ERCOT would develop software and protocols for later implementation of full real-time reserve pricing and settlements.

22
William W. Hogan is the Raymond Plank Professor of Global Energy Policy, John F. Kennedy School of Government, Harvard University. The work is based on research for the Harvard Electricity Policy Group and for the Harvard-Japan Project on Energy and the Environment. This paper draws joint work with John Dumas, David Maggio, Sai Moorty, Resmi Surendran of ERCOT. Support was provided by GDF SUEZ Energy Resources NA. The author is or has been a consultant on electric market reform and transmission issues for Allegheny Electric Global Market, American Electric Power, American National Power, Aquila, Atlantic Wind Connection, Australian Gas Light Company, Avista Energy, Barclays Bank PLC, Brazil Power Exchange Administrator (ASMAE), British National Grid Company, California Independent Energy Producers Association, California Independent System Operator, California Suppliers Group, Calpine Corporation, Canadian Imperial Bank of Commerce, Centerpoint Energy, Central Maine Power Company, Chubu Electric Power Company, Citigroup, Comision Reguladora De Energia (CRE, Mexico), Commonwealth Edison Company, COMPETE Coalition, Conectiv, Constellation Energy, Constellation Energy Commodities Group, Constellation Power Source, Coral Power, Credit First Suisse Boston, DC Energy, Detroit Edison Company, Deutsche Bank, Deutsche Bank Energy Trading LLC, Duquesne Light Company, Dynegy, Edison Electric Institute, Edison Mission Energy, Electricity Corporation of New Zealand, Electric Power Supply Association, El Paso Electric, Exelon, Financial Marketers Coalition, FTI Consulting, GenOn Energy, GPU Inc. (and the Supporting Companies of PJM), GPU PowerNet Pty Ltd., GDF SUEZ Energy Resources NA, GWF Energy, Independent Energy Producers Assn, ISO New England, LECG LLC, Luz del Sur, Maine Public Advocate, Maine Public Utilities Commission, Merrill Lynch, Midwest ISO, Mirant Corporation, MIT Grid Study, JP Morgan, Morgan Stanley Capital Group, National Independent Energy Producers, New England Power Company, New York Independent System Operator, New York Power Pool, New York Utilities Collaborative, Niagara Mohawk Corporation, NRG Energy, Inc., Ontario Attorney General, Ontario IMO, Pepco, Pinpoint Power, PJM Office of Interconnection, PJM Power Provider (P3) Group, PPL Corporation, Public Service Electric & Gas Company, Public Service New Mexico, PSEG Companies, Reliant Energy, Rhode Island Public Utilities Commission, San Diego Gas & Electric Company, Sempra Energy, SPP, Texas Genco, Texas Utilities Co, Tokyo Electric Power Company, Toronto Dominion Bank, Transalta, Transcanada, TransÉnergie, Transpower of New Zealand, Tucson Electric Power, Westbrook Power, Western Power Trading Forum, Williams Energy Group, and Wisconsin Electric Power Company. The views presented here are not necessarily attributable to any of those mentioned, and any remaining errors are solely the responsibility of the author. (Related papers can be found on the web at www.whogan.com).