electricity rate comparison annual report may 1, 2011 rates
TRANSCRIPT

Electricity Rate Comparison Annual Report - May 1, 2011 Rates
Page i
List of Tables
Table 1 Residential Monthly Bills .................................................................... 4
Table 2 Small Power Monthly Bills .................................................................. 5
Table 3 Medium Power Monthly Bills .............................................................. 6
Table 4 Large Power Monthly Bills .................................................................. 7
Table 5 Residential Average Prices ................................................................ 8
Table 6 Small Power Average Prices .............................................................. 9
Table 7 Medium Power Average Prices ........................................................ 10
Table 8 Large Power Average Prices ............................................................ 11
Table 9 BC Hydro Monthly Bills Summary .................................................... 12
Table 10 BC Hydro Average Prices Summary ................................................ 13
Table 11 Corresponding BC Hydro Rate Schedules included in each Segment of the Hydro Quebec Rate Survey .................................... 14
Table 12 BC Hydro Rankings Summary in Hydro Quebec Rate Surveys, Out of 22 Utilities Surveyed .............................................................. 15

Electricity Rate Comparison Annual Report - May 1, 2011 Rates
Page 1
Monthly Bills and Average Prices as of May 1, 2011
This is the fourth Electricity Rate Comparison Annual Report (Report) prepared by
BC Hydro in response to the Rate Comparison Regulation, issued by Ministerial
Order No. M114, under the Utilities Commission Act, on March 30, 2009. The Report
provides a comparison of BC Hydro’s monthly bills and average prices for
residential, commercial and industrial customers with other North American utilities,
including those in Alberta, Quebec, Ontario, Manitoba, Washington, Oregon and
California.1
Each year BC Hydro participates in a Hydro-Quebec comparison survey, submitting
bill calculations based on electricity prices that are in place as of April 1 of the
current year, and which may reflect approved interim rate increases. Hydro-Quebec
compiles the information and provides the monthly bills and average prices for
12 Canadian utilities and 10 American utilities in an annual report. The BC Hydro
Report provides survey information taken from the Hydro-Quebec report:
Comparison of Electricity Prices in Major North American Cities2.
The Hydro-Quebec report provides the monthly bills, excluding taxes and non-utility
levies, calculated for specific consumption points for four different customer
segments: residential, small power, medium power and large power. The average
price is also calculated, for each customer segment and specific consumption point,
by dividing the monthly bill by the amount of monthly energy consumption. For
example, if an electric bill for 1,000 kWh was calculated to be a monthly amount of
$50, the average price would be $50 divided by 1,000 kWh, or 5 cents/kWh.
Due to the timing of its F2012 rate increase, BC Hydro has replaced its April 1, 2011
rate calculations from the Hydro Quebec report with rate calculations using its rates
on May 1, 2011 to compare against the other utilities’ rates on April 1, 2011.
1 Monthly bills and average prices for American utilities have been converted to Canadian dollars using the
exchange rate as at 12 PM Eastern on April 1, 2011 of CDN $0.9926 per US $1. 2 http://www.hydroquebec.com/publications/en/comparison_prices/index.html.
Attachment A
Electricity Rate Comparison Annual Report - May 1, 2011 Rates
Page 2
BC Hydro believes that its May 1 rates provide a more meaningful comparison than
those provided in the Hydro Quebec report.
The monthly bills for customers are presented in Tables 1 to 4. The average prices
for customers are presented in Tables 5 to 8. BC Hydro’s monthly bills and average
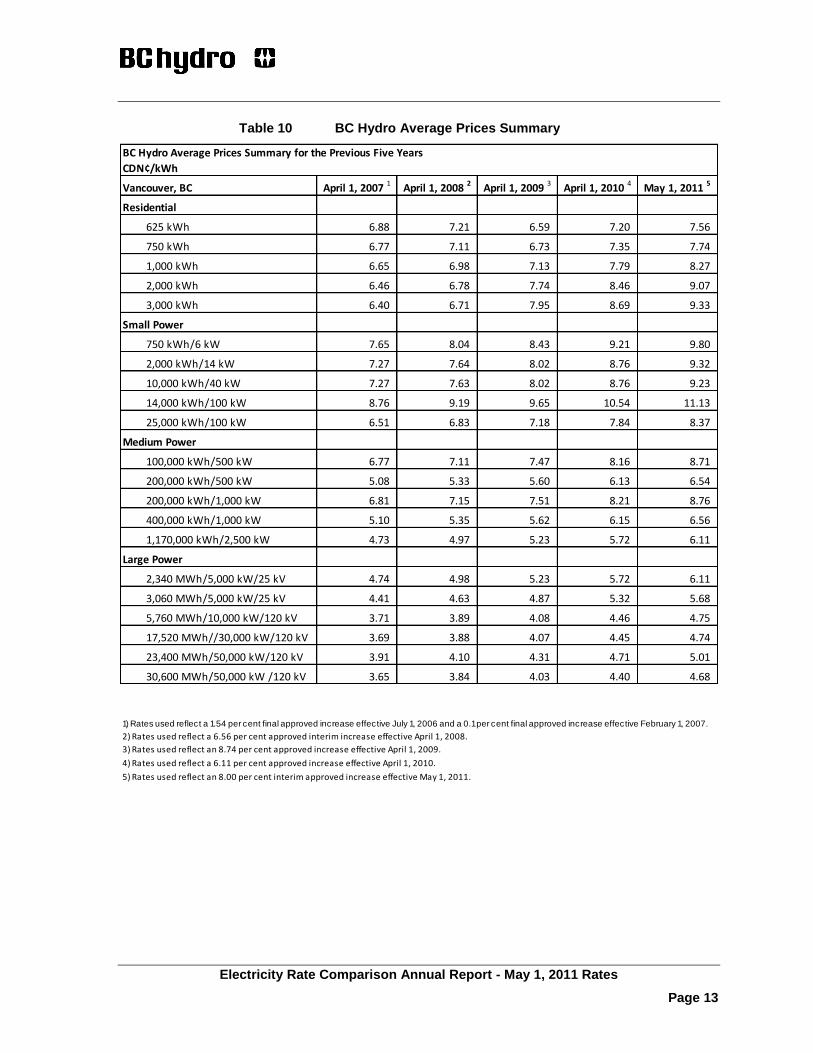
prices over the past five years are summarized in Tables 9 and 10.
The Hydro-Quebec residential segment includes calculations for BC Hydro’s
residential customers. The Hydro-Quebec small power segment includes
calculations for both BC Hydro’s general service under 35 kW customers and
general service 35 kW and over customers, while the medium power segment
includes calculations for BC Hydro’s general service 35 kW and over customers.
Lastly, the Hydro-Quebec large power segment includes calculations for BC Hydro’s
general service 35 kW and over customers and transmission service customers.
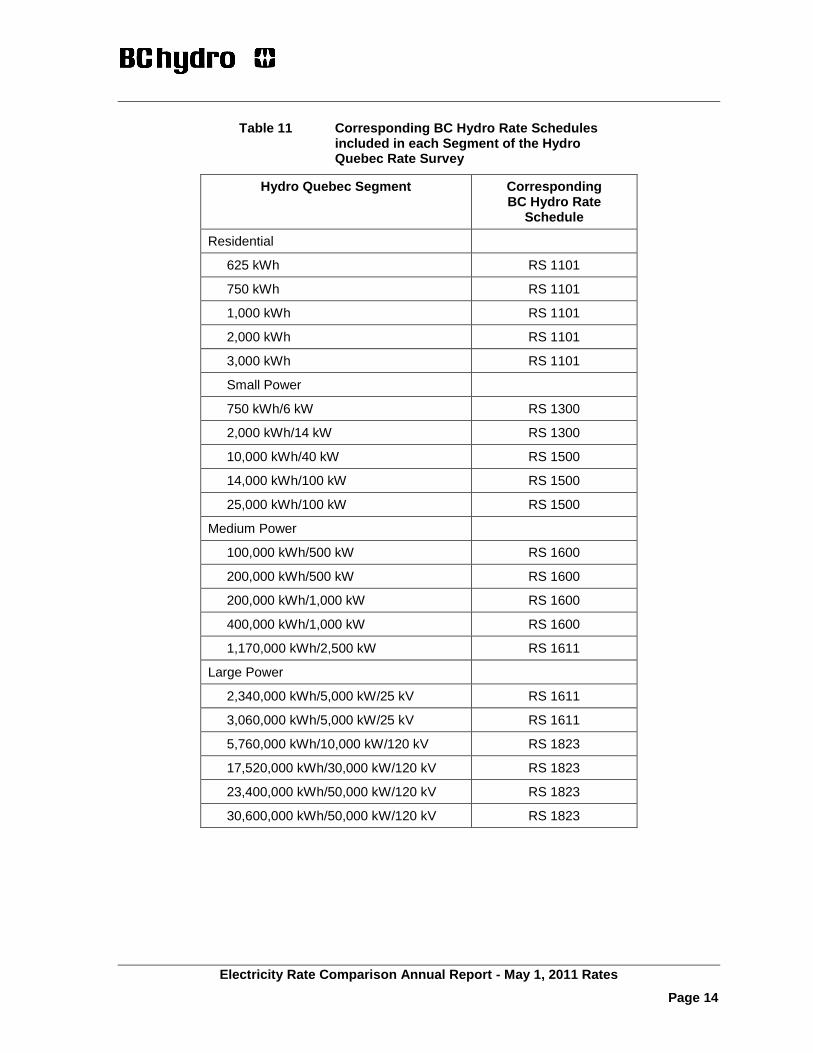
Table 11 shows the specific BC Hydro rate schedules that have been included in
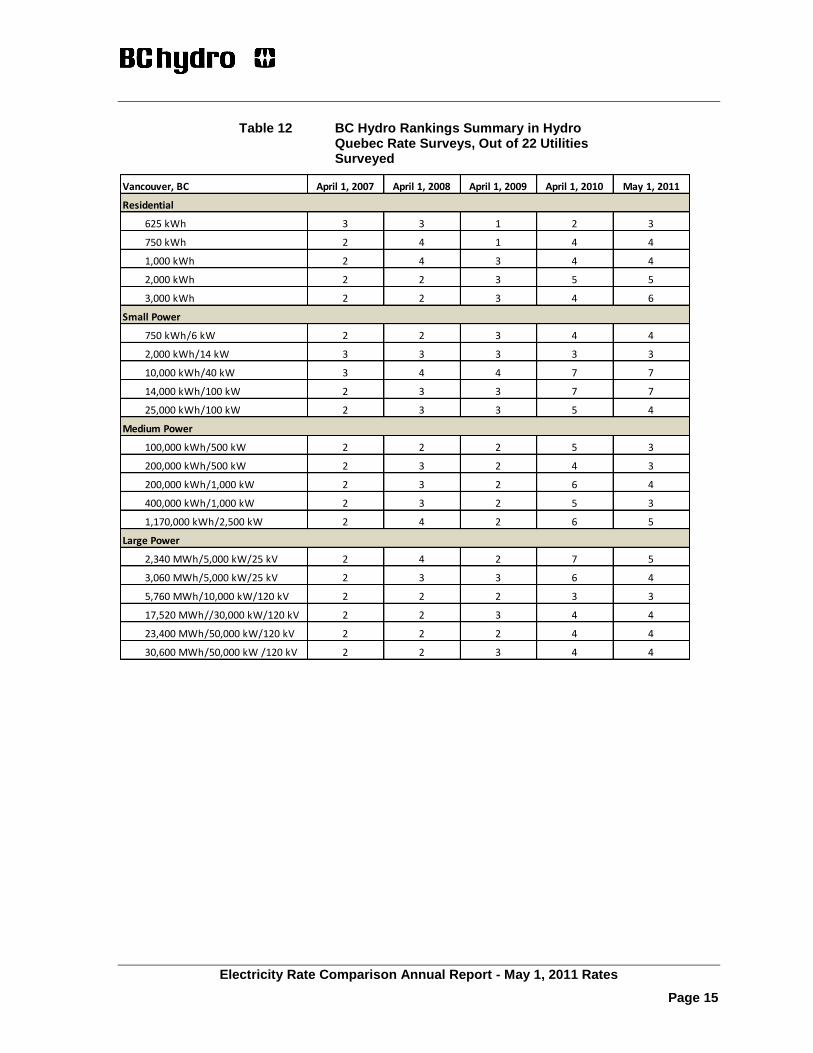
each Hydro Quebec segment. Table 12 summarizes BC Hydro’s relative rankings in
each rate class since the first year of participation in the survey in 2008.
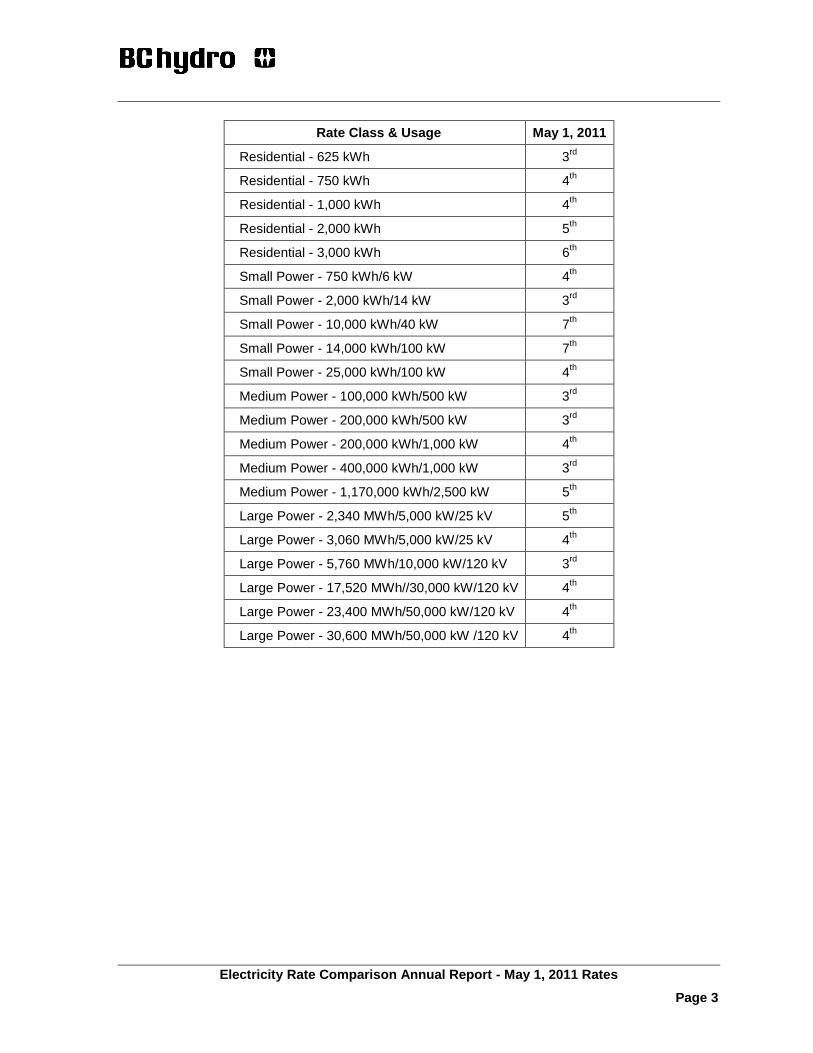
Based on the data from the Hydro-Quebec survey, BC Hydro’s monthly bills and
average prices for all customer segments are generally within the top quartile of
utilities, with low rates providing a competitive advantage to customers in British
Columbia. The rankings of the top five participating utilities with the lowest monthly
bills and average prices are noted in the tables. Out of the 22 utilities providing data,
BC Hydro’s monthly bills and average price rankings on May 1, 2011 against the
Hydro-Quebec report for April 1, 2011 data are as follows:
Attachment A
Electricity Rate Comparison Annual Report - May 1, 2011 Rates
Page 3
Rate Class & Usage May 1, 2011
Residential - 625 kWh 3rd
Residential - 750 kWh 4th
Residential - 1,000 kWh 4th
Residential - 2,000 kWh 5th
Residential - 3,000 kWh 6th
Small Power - 750 kWh/6 kW 4th
Small Power - 2,000 kWh/14 kW 3rd
Small Power - 10,000 kWh/40 kW 7th
Small Power - 14,000 kWh/100 kW 7th
Small Power - 25,000 kWh/100 kW 4th
Medium Power - 100,000 kWh/500 kW 3rd
Medium Power - 200,000 kWh/500 kW 3rd
Medium Power - 200,000 kWh/1,000 kW 4th
Medium Power - 400,000 kWh/1,000 kW 3rd
Medium Power - 1,170,000 kWh/2,500 kW 5th
Large Power - 2,340 MWh/5,000 kW/25 kV 5th
Large Power - 3,060 MWh/5,000 kW/25 kV 4th
Large Power - 5,760 MWh/10,000 kW/120 kV 3rd
Large Power - 17,520 MWh//30,000 kW/120 kV 4th
Large Power - 23,400 MWh/50,000 kW/120 kV 4th
Large Power - 30,600 MWh/50,000 kW /120 kV 4th
Attachment A
Electricity Rate Comparison Annual Report - May 1, 2011 Rates
Page 4
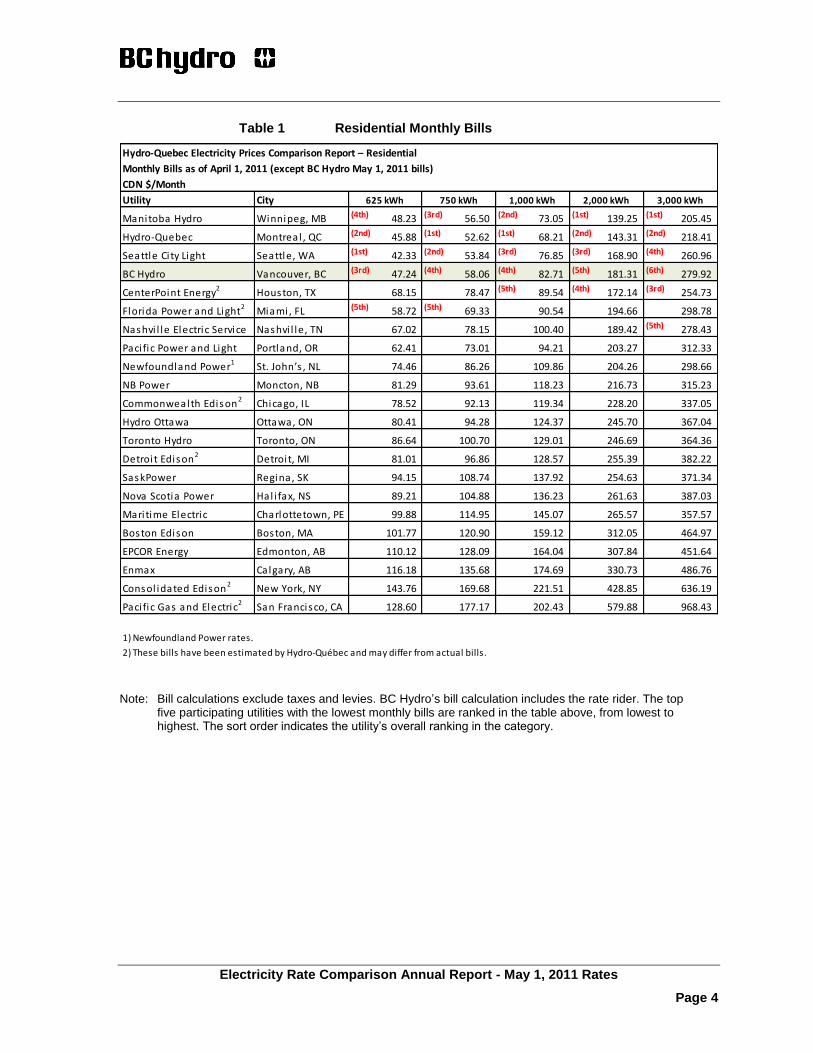
Table 1 Residential Monthly Bills
Utility City
Manitoba Hydro Winnipeg, MB (4th) 48.23 (3rd) 56.50 (2nd) 73.05 (1st) 139.25 (1st) 205.45
Hydro-Quebec Montreal , QC (2nd) 45.88 (1st) 52.62 (1st) 68.21 (2nd) 143.31 (2nd) 218.41
Seattle Ci ty Light Seattle, WA (1st) 42.33 (2nd) 53.84 (3rd) 76.85 (3rd) 168.90 (4th) 260.96
BC Hydro Vancouver, BC (3rd) 47.24 (4th) 58.06 (4th) 82.71 (5th) 181.31 (6th) 279.92
CenterPoint Energy2
Houston, TX 68.15 78.47 (5th) 89.54 (4th) 172.14 (3rd) 254.73
Florida Power and Light2 Miami, FL (5th) 58.72 (5th) 69.33 90.54 194.66 298.78
Nashvi l le Electric Service Nashvi l le, TN 67.02 78.15 100.40 189.42 (5th) 278.43
Paci fic Power and Light Portland, OR 62.41 73.01 94.21 203.27 312.33
Newfoundland Power1 St. John’s , NL 74.46 86.26 109.86 204.26 298.66
NB Power Moncton, NB 81.29 93.61 118.23 216.73 315.23
Commonwealth Edison2 Chicago, IL 78.52 92.13 119.34 228.20 337.05
Hydro Ottawa Ottawa, ON 80.41 94.28 124.37 245.70 367.04
Toronto Hydro Toronto, ON 86.64 100.70 129.01 246.69 364.36
Detroit Edison2 Detroit, MI 81.01 96.86 128.57 255.39 382.22
SaskPower Regina, SK 94.15 108.74 137.92 254.63 371.34
Nova Scotia Power Hal i fax, NS 89.21 104.88 136.23 261.63 387.03
Mari time Electric Charlottetown, PE 99.88 114.95 145.07 265.57 357.57
Boston Edison Boston, MA 101.77 120.90 159.12 312.05 464.97
EPCOR Energy Edmonton, AB 110.12 128.09 164.04 307.84 451.64
Enmax Calgary, AB 116.18 135.68 174.69 330.73 486.76
Consol idated Edison2 New York, NY 143.76 169.68 221.51 428.85 636.19
Paci fic Gas and Electric2 San Francisco, CA 128.60 177.17 202.43 579.88 968.43
1) Newfoundland Power rates.
2) These bills have been estimated by Hydro-Québec and may differ from actual bills.
Hydro-Quebec Electricity Prices Comparison Report – Residential
Monthly Bills as of April 1, 2011 (except BC Hydro May 1, 2011 bills)
CDN $/Month
625 kWh 750 kWh 1,000 kWh 2,000 kWh 3,000 kWh
Note: Bill calculations exclude taxes and levies. BC Hydro’s bill calculation includes the rate rider. The top five participating utilities with the lowest monthly bills are ranked in the table above, from lowest to highest. The sort order indicates the utility’s overall ranking in the category.
Attachment A
Electricity Rate Comparison Annual Report - May 1, 2011 Rates
Page 5
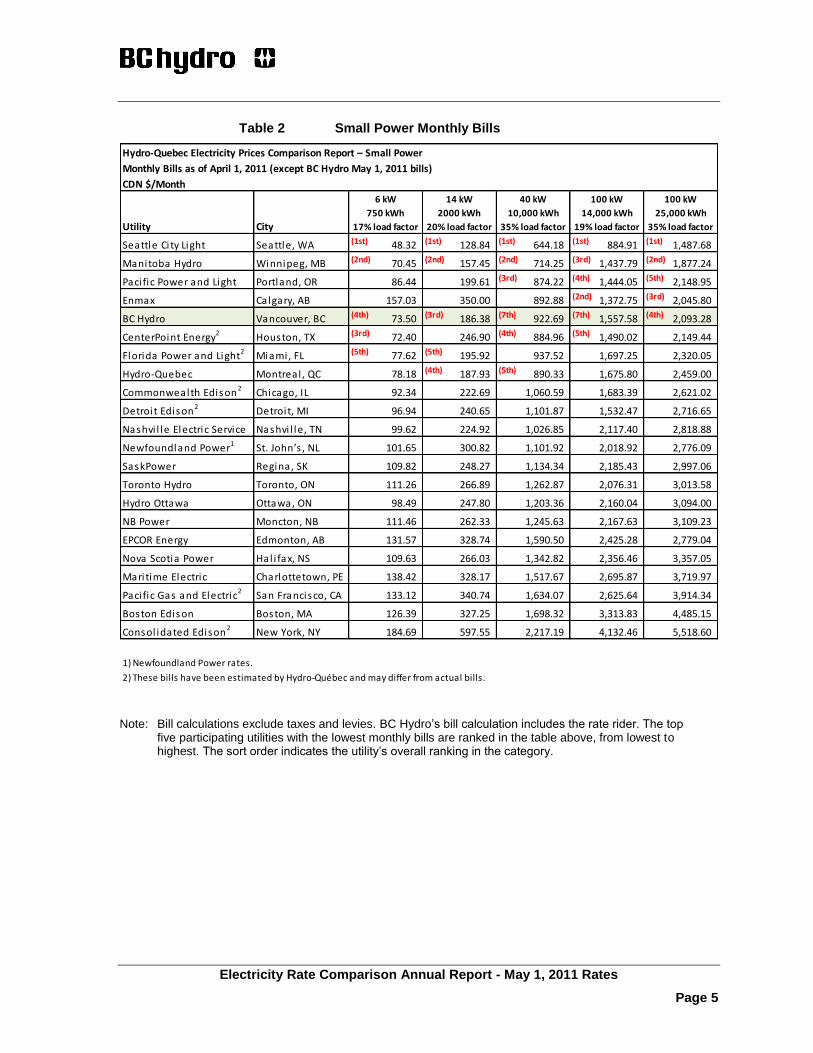
Table 2 Small Power Monthly Bills
Utility City
Seattle Ci ty Light Seattle, WA (1st) 48.32 (1st) 128.84 (1st) 644.18 (1st) 884.91 (1st) 1,487.68
Manitoba Hydro Winnipeg, MB (2nd) 70.45 (2nd) 157.45 (2nd) 714.25 (3rd) 1,437.79 (2nd) 1,877.24
Paci fic Power and Light Portland, OR 86.44 199.61 (3rd) 874.22 (4th) 1,444.05 (5th) 2,148.95
Enmax Calgary, AB 157.03 350.00 892.88 (2nd) 1,372.75 (3rd) 2,045.80
BC Hydro Vancouver, BC (4th) 73.50 (3rd) 186.38 (7th) 922.69 (7th) 1,557.58 (4th) 2,093.28
CenterPoint Energy2 Houston, TX (3rd) 72.40 246.90 (4th) 884.96 (5th) 1,490.02 2,149.44
Florida Power and Light2 Miami, FL (5th) 77.62 (5th) 195.92 937.52 1,697.25 2,320.05
Hydro-Quebec Montreal , QC 78.18 (4th) 187.93 (5th) 890.33 1,675.80 2,459.00
Commonwealth Edison2 Chicago, IL 92.34 222.69 1,060.59 1,683.39 2,621.02
Detroit Edison2 Detroit, MI 96.94 240.65 1,101.87 1,532.47 2,716.65
Nashvi l le Electric Service Nashvi l le, TN 99.62 224.92 1,026.85 2,117.40 2,818.88
Newfoundland Power1 St. John’s , NL 101.65 300.82 1,101.92 2,018.92 2,776.09
SaskPower Regina, SK 109.82 248.27 1,134.34 2,185.43 2,997.06
Toronto Hydro Toronto, ON 111.26 266.89 1,262.87 2,076.31 3,013.58
Hydro Ottawa Ottawa, ON 98.49 247.80 1,203.36 2,160.04 3,094.00
NB Power Moncton, NB 111.46 262.33 1,245.63 2,167.63 3,109.23
EPCOR Energy Edmonton, AB 131.57 328.74 1,590.50 2,425.28 2,779.04
Nova Scotia Power Hal i fax, NS 109.63 266.03 1,342.82 2,356.46 3,357.05
Mari time Electric Charlottetown, PE 138.42 328.17 1,517.67 2,695.87 3,719.97
Paci fic Gas and Electric2 San Francisco, CA 133.12 340.74 1,634.07 2,625.64 3,914.34
Boston Edison Boston, MA 126.39 327.25 1,698.32 3,313.83 4,485.15
Consol idated Edison2 New York, NY 184.69 597.55 2,217.19 4,132.46 5,518.60
1) Newfoundland Power rates.
2) These bills have been estimated by Hydro-Québec and may differ from actual bills.
Hydro-Quebec Electricity Prices Comparison Report – Small Power
Monthly Bills as of April 1, 2011 (except BC Hydro May 1, 2011 bills)
CDN $/Month
6 kW
750 kWh
17% load factor
14 kW
2000 kWh
20% load factor
40 kW
10,000 kWh
35% load factor
100 kW
14,000 kWh
19% load factor
100 kW
25,000 kWh
35% load factor
Note: Bill calculations exclude taxes and levies. BC Hydro’s bill calculation includes the rate rider. The top five participating utilities with the lowest monthly bills are ranked in the table above, from lowest to highest. The sort order indicates the utility’s overall ranking in the category.
Attachment A
Electricity Rate Comparison Annual Report - May 1, 2011 Rates
Page 6
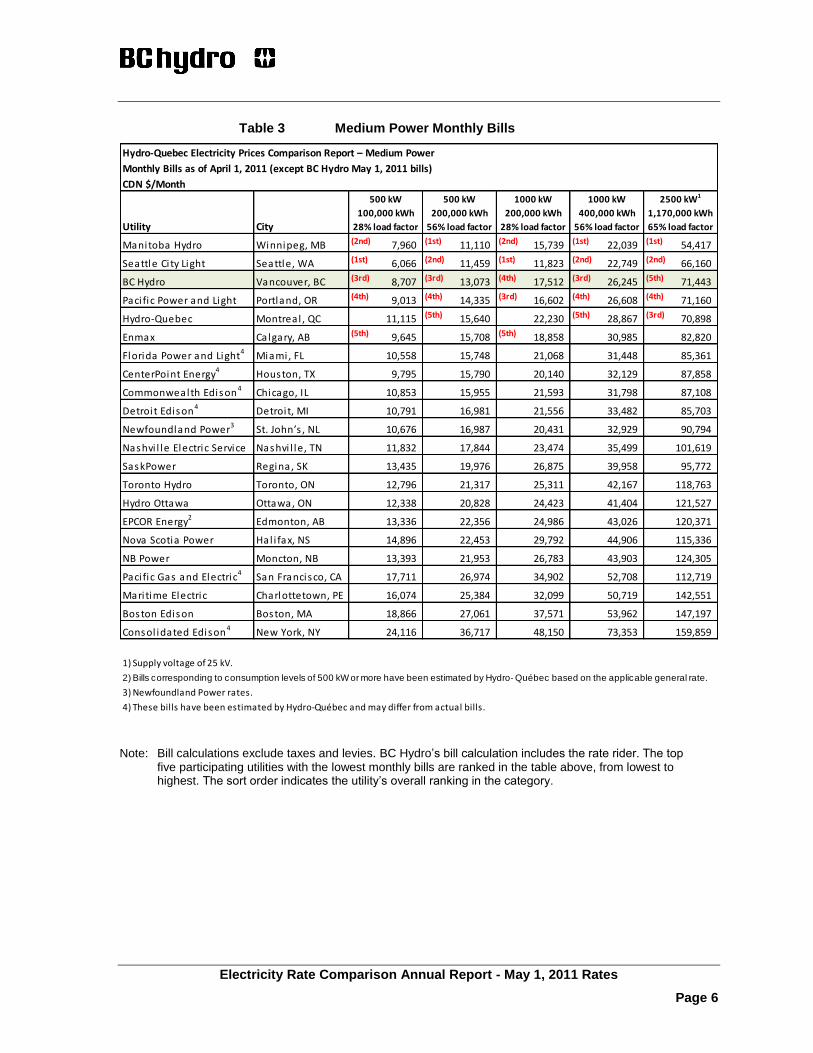
Table 3 Medium Power Monthly Bills
Utility City
Manitoba Hydro Winnipeg, MB (2nd) 7,960 (1st) 11,110 (2nd) 15,739 (1st) 22,039 (1st) 54,417
Seattle Ci ty Light Seattle, WA (1st) 6,066 (2nd) 11,459 (1st) 11,823 (2nd) 22,749 (2nd) 66,160
BC Hydro Vancouver, BC (3rd) 8,707 (3rd) 13,073 (4th) 17,512 (3rd) 26,245 (5th) 71,443
Paci fic Power and Light Portland, OR (4th) 9,013 (4th) 14,335 (3rd) 16,602 (4th) 26,608 (4th) 71,160
Hydro-Quebec Montreal , QC 11,115 (5th) 15,640 22,230 (5th) 28,867 (3rd) 70,898
Enmax Calgary, AB (5th) 9,645 15,708 (5th) 18,858 30,985 82,820
Florida Power and Light4 Miami, FL 10,558 15,748 21,068 31,448 85,361
CenterPoint Energy4 Houston, TX 9,795 15,790 20,140 32,129 87,858
Commonwealth Edison4 Chicago, IL 10,853 15,955 21,593 31,798 87,108
Detroit Edison4 Detroit, MI 10,791 16,981 21,556 33,482 85,703
Newfoundland Power3 St. John’s , NL 10,676 16,987 20,431 32,929 90,794
Nashvi l le Electric Service Nashvi l le, TN 11,832 17,844 23,474 35,499 101,619
SaskPower Regina, SK 13,435 19,976 26,875 39,958 95,772
Toronto Hydro Toronto, ON 12,796 21,317 25,311 42,167 118,763
Hydro Ottawa Ottawa, ON 12,338 20,828 24,423 41,404 121,527
EPCOR Energy2 Edmonton, AB 13,336 22,356 24,986 43,026 120,371
Nova Scotia Power Hal i fax, NS 14,896 22,453 29,792 44,906 115,336
NB Power Moncton, NB 13,393 21,953 26,783 43,903 124,305
Paci fic Gas and Electric4 San Francisco, CA 17,711 26,974 34,902 52,708 112,719
Mari time Electric Charlottetown, PE 16,074 25,384 32,099 50,719 142,551
Boston Edison Boston, MA 18,866 27,061 37,571 53,962 147,197
Consol idated Edison4 New York, NY 24,116 36,717 48,150 73,353 159,859
1) Supply voltage of 25 kV.
2) Bills corresponding to consumption levels of 500 kW or more have been estimated by Hydro- Québec based on the applicable general rate.
3) Newfoundland Power rates.
4) These bills have been estimated by Hydro-Québec and may differ from actual bills.
Hydro-Quebec Electricity Prices Comparison Report – Medium Power
Monthly Bills as of April 1, 2011 (except BC Hydro May 1, 2011 bills)
CDN $/Month
500 kW
100,000 kWh
28% load factor
500 kW
200,000 kWh
56% load factor
1000 kW
200,000 kWh
28% load factor
1000 kW
400,000 kWh
56% load factor
2500 kW1
1,170,000 kWh
65% load factor
Note: Bill calculations exclude taxes and levies. BC Hydro’s bill calculation includes the rate rider. The top five participating utilities with the lowest monthly bills are ranked in the table above, from lowest to highest. The sort order indicates the utility’s overall ranking in the category.
Attachment A
Electricity Rate Comparison Annual Report - May 1, 2011 Rates
Page 7
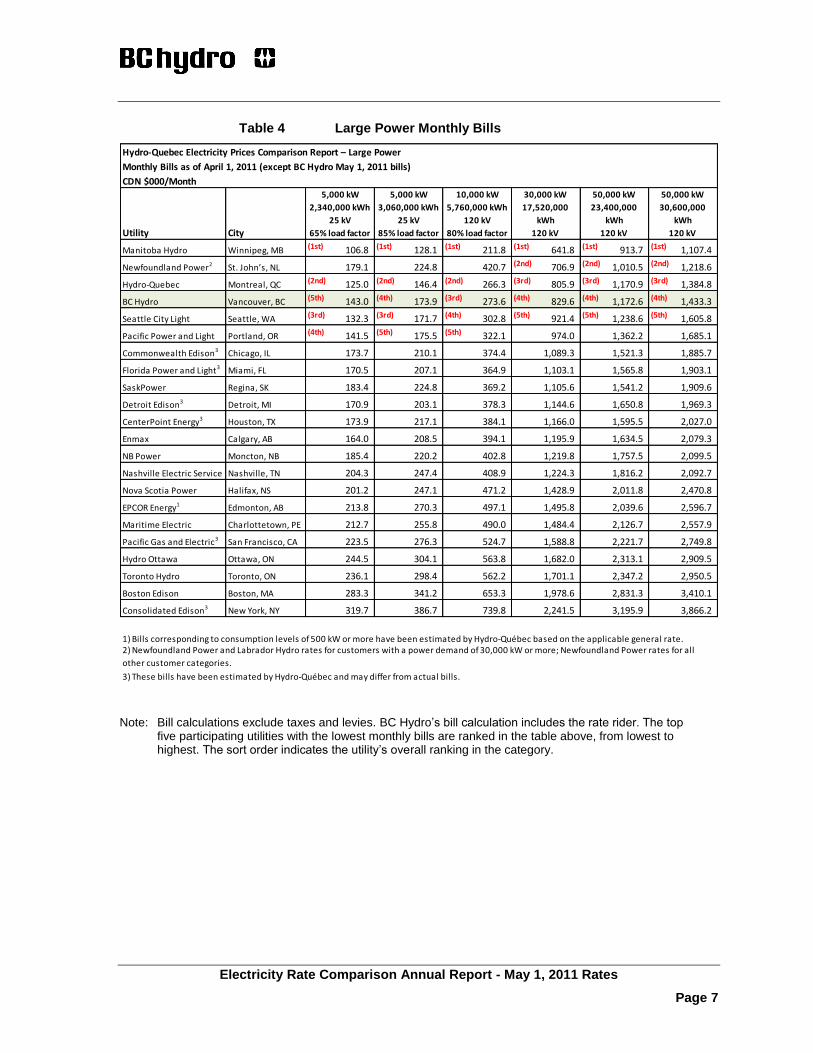
Table 4 Large Power Monthly Bills
Utility City
Manitoba Hydro Winnipeg, MB (1st) 106.8 (1st) 128.1 (1st) 211.8 (1st) 641.8 (1st) 913.7 (1st) 1,107.4
Newfoundland Power2 St. John’s, NL 179.1 224.8 420.7 (2nd) 706.9 (2nd) 1,010.5 (2nd) 1,218.6
Hydro-Quebec Montreal, QC (2nd) 125.0 (2nd) 146.4 (2nd) 266.3 (3rd) 805.9 (3rd) 1,170.9 (3rd) 1,384.8
BC Hydro Vancouver, BC (5th) 143.0 (4th) 173.9 (3rd) 273.6 (4th) 829.6 (4th) 1,172.6 (4th) 1,433.3
Seattle City Light Seattle, WA (3rd) 132.3 (3rd) 171.7 (4th) 302.8 (5th) 921.4 (5th) 1,238.6 (5th) 1,605.8
Pacific Power and Light Portland, OR (4th) 141.5 (5th) 175.5 (5th) 322.1 974.0 1,362.2 1,685.1
Commonwealth Edison3 Chicago, IL 173.7 210.1 374.4 1,089.3 1,521.3 1,885.7
Florida Power and Light3 Miami, FL 170.5 207.1 364.9 1,103.1 1,565.8 1,903.1
SaskPower Regina, SK 183.4 224.8 369.2 1,105.6 1,541.2 1,909.6
Detroit Edison3 Detroit, MI 170.9 203.1 378.3 1,144.6 1,650.8 1,969.3
CenterPoint Energy3 Houston, TX 173.9 217.1 384.1 1,166.0 1,595.5 2,027.0
Enmax Calgary, AB 164.0 208.5 394.1 1,195.9 1,634.5 2,079.3
NB Power Moncton, NB 185.4 220.2 402.8 1,219.8 1,757.5 2,099.5
Nashville Electric Service Nashville, TN 204.3 247.4 408.9 1,224.3 1,816.2 2,092.7
Nova Scotia Power Halifax, NS 201.2 247.1 471.2 1,428.9 2,011.8 2,470.8
EPCOR Energy1 Edmonton, AB 213.8 270.3 497.1 1,495.8 2,039.6 2,596.7
Maritime Electric Charlottetown, PE 212.7 255.8 490.0 1,484.4 2,126.7 2,557.9
Pacific Gas and Electric3 San Francisco, CA 223.5 276.3 524.7 1,588.8 2,221.7 2,749.8
Hydro Ottawa Ottawa, ON 244.5 304.1 563.8 1,682.0 2,313.1 2,909.5
Toronto Hydro Toronto, ON 236.1 298.4 562.2 1,701.1 2,347.2 2,950.5
Boston Edison Boston, MA 283.3 341.2 653.3 1,978.6 2,831.3 3,410.1
Consolidated Edison3 New York, NY 319.7 386.7 739.8 2,241.5 3,195.9 3,866.2
1) Bills corresponding to consumption levels of 500 kW or more have been estimated by Hydro-Québec based on the applicable general rate.
3) These bills have been estimated by Hydro-Québec and may differ from actual bills.
2) Newfoundland Power and Labrador Hydro rates for customers with a power demand of 30,000 kW or more; Newfoundland Power rates for all
other customer categories.
Hydro-Quebec Electricity Prices Comparison Report – Large Power
Monthly Bills as of April 1, 2011 (except BC Hydro May 1, 2011 bills)
CDN $000/Month5,000 kW
2,340,000 kWh
25 kV
65% load factor
5,000 kW
3,060,000 kWh
25 kV
85% load factor
10,000 kW
5,760,000 kWh
120 kV
80% load factor
30,000 kW
17,520,000
kWh
120 kV
50,000 kW
23,400,000
kWh
120 kV
50,000 kW
30,600,000
kWh
120 kV
Note: Bill calculations exclude taxes and levies. BC Hydro’s bill calculation includes the rate rider. The top five participating utilities with the lowest monthly bills are ranked in the table above, from lowest to highest. The sort order indicates the utility’s overall ranking in the category.
Attachment A
Electricity Rate Comparison Annual Report - May 1, 2011 Rates
Page 8
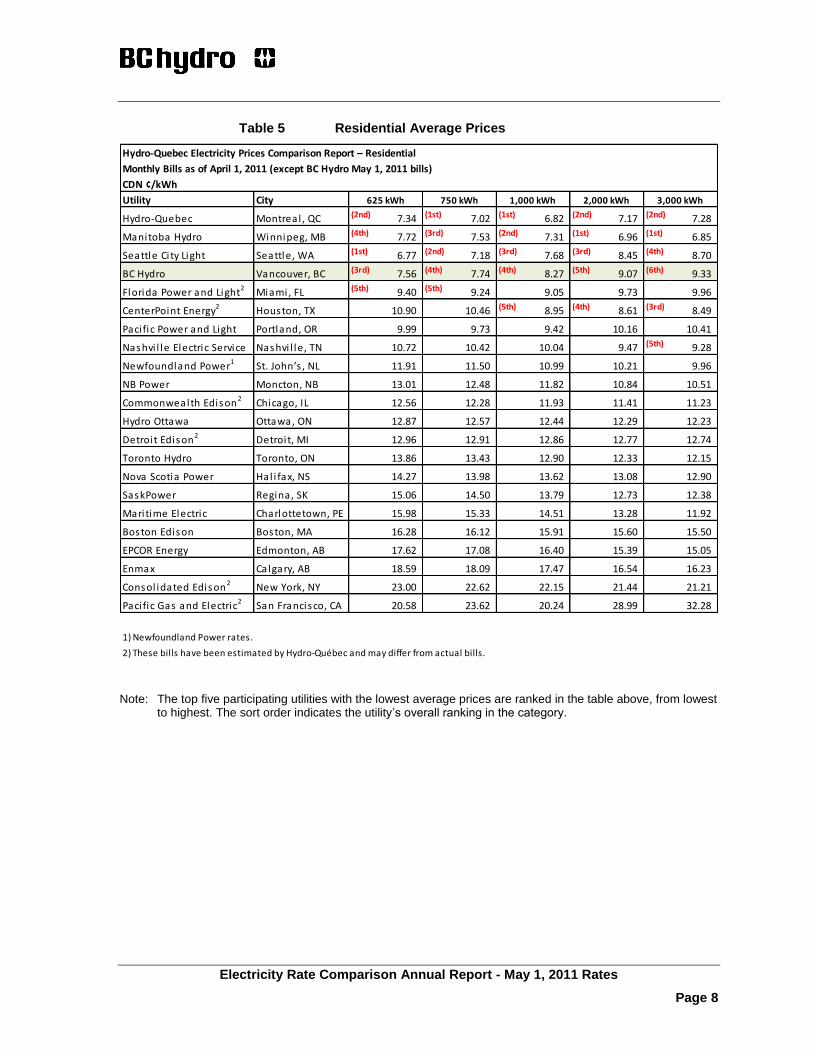
Table 5 Residential Average Prices
Utility City
Hydro-Quebec Montreal , QC (2nd) 7.34 (1st) 7.02 (1st) 6.82 (2nd) 7.17 (2nd) 7.28
Manitoba Hydro Winnipeg, MB (4th) 7.72 (3rd) 7.53 (2nd) 7.31 (1st) 6.96 (1st) 6.85
Seattle Ci ty Light Seattle, WA (1st) 6.77 (2nd) 7.18 (3rd) 7.68 (3rd) 8.45 (4th) 8.70
BC Hydro Vancouver, BC (3rd) 7.56 (4th) 7.74 (4th) 8.27 (5th) 9.07 (6th) 9.33
Florida Power and Light2 Miami, FL (5th) 9.40 (5th) 9.24 9.05 9.73 9.96
CenterPoint Energy2 Houston, TX 10.90 10.46 (5th) 8.95 (4th) 8.61 (3rd) 8.49
Paci fic Power and Light Portland, OR 9.99 9.73 9.42 10.16 10.41
Nashvi l le Electric Service Nashvi l le, TN 10.72 10.42 10.04 9.47 (5th) 9.28
Newfoundland Power1 St. John’s , NL 11.91 11.50 10.99 10.21 9.96
NB Power Moncton, NB 13.01 12.48 11.82 10.84 10.51
Commonwealth Edison2 Chicago, IL 12.56 12.28 11.93 11.41 11.23
Hydro Ottawa Ottawa, ON 12.87 12.57 12.44 12.29 12.23
Detroit Edison2
Detroit, MI 12.96 12.91 12.86 12.77 12.74
Toronto Hydro Toronto, ON 13.86 13.43 12.90 12.33 12.15
Nova Scotia Power Hal i fax, NS 14.27 13.98 13.62 13.08 12.90
SaskPower Regina, SK 15.06 14.50 13.79 12.73 12.38
Mari time Electric Charlottetown, PE 15.98 15.33 14.51 13.28 11.92
Boston Edison Boston, MA 16.28 16.12 15.91 15.60 15.50
EPCOR Energy Edmonton, AB 17.62 17.08 16.40 15.39 15.05
Enmax Calgary, AB 18.59 18.09 17.47 16.54 16.23
Consol idated Edison2 New York, NY 23.00 22.62 22.15 21.44 21.21
Paci fic Gas and Electric2 San Francisco, CA 20.58 23.62 20.24 28.99 32.28
1) Newfoundland Power rates.
2) These bills have been estimated by Hydro-Québec and may differ from actual bills.
Hydro-Quebec Electricity Prices Comparison Report – Residential
Monthly Bills as of April 1, 2011 (except BC Hydro May 1, 2011 bills)
CDN ¢/kWh
625 kWh 750 kWh 1,000 kWh 2,000 kWh 3,000 kWh
Note: The top five participating utilities with the lowest average prices are ranked in the table above, from lowest to highest. The sort order indicates the utility’s overall ranking in the category.
Attachment A
Electricity Rate Comparison Annual Report - May 1, 2011 Rates
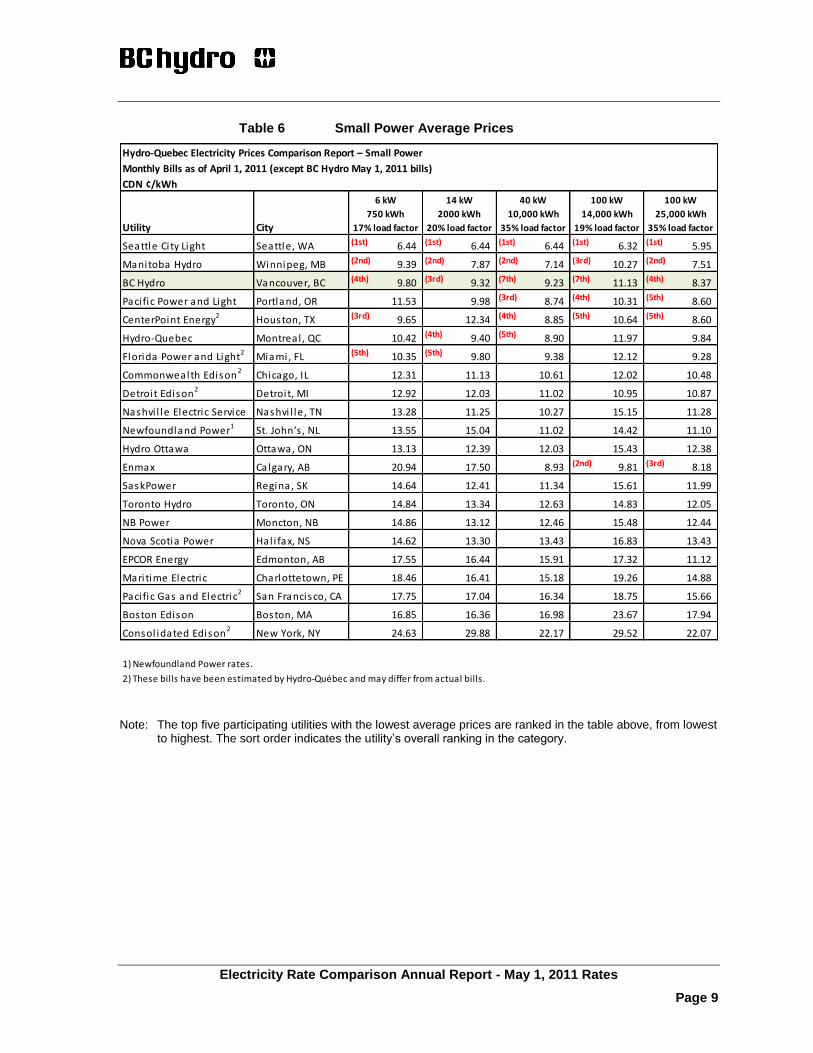
Page 9
Table 6 Small Power Average Prices
Utility City
Seattle Ci ty Light Seattle, WA (1st) 6.44 (1st) 6.44 (1st) 6.44 (1st) 6.32 (1st) 5.95
Manitoba Hydro Winnipeg, MB (2nd) 9.39 (2nd) 7.87 (2nd) 7.14 (3rd) 10.27 (2nd) 7.51
BC Hydro Vancouver, BC (4th) 9.80 (3rd) 9.32 (7th) 9.23 (7th) 11.13 (4th) 8.37
Paci fic Power and Light Portland, OR 11.53 9.98 (3rd) 8.74 (4th) 10.31 (5th) 8.60
CenterPoint Energy2 Houston, TX (3rd) 9.65 12.34 (4th) 8.85 (5th) 10.64 (5th) 8.60
Hydro-Quebec Montreal , QC 10.42 (4th) 9.40 (5th) 8.90 11.97 9.84
Florida Power and Light2 Miami, FL (5th) 10.35 (5th) 9.80 9.38 12.12 9.28
Commonwealth Edison2 Chicago, IL 12.31 11.13 10.61 12.02 10.48
Detroit Edison2 Detroit, MI 12.92 12.03 11.02 10.95 10.87
Nashvi l le Electric Service Nashvi l le, TN 13.28 11.25 10.27 15.15 11.28
Newfoundland Power1 St. John’s , NL 13.55 15.04 11.02 14.42 11.10
Hydro Ottawa Ottawa, ON 13.13 12.39 12.03 15.43 12.38
Enmax Calgary, AB 20.94 17.50 8.93 (2nd) 9.81 (3rd) 8.18
SaskPower Regina, SK 14.64 12.41 11.34 15.61 11.99
Toronto Hydro Toronto, ON 14.84 13.34 12.63 14.83 12.05
NB Power Moncton, NB 14.86 13.12 12.46 15.48 12.44
Nova Scotia Power Hal i fax, NS 14.62 13.30 13.43 16.83 13.43
EPCOR Energy Edmonton, AB 17.55 16.44 15.91 17.32 11.12
Mari time Electric Charlottetown, PE 18.46 16.41 15.18 19.26 14.88
Paci fic Gas and Electric2 San Francisco, CA 17.75 17.04 16.34 18.75 15.66
Boston Edison Boston, MA 16.85 16.36 16.98 23.67 17.94
Consol idated Edison2
New York, NY 24.63 29.88 22.17 29.52 22.07
1) Newfoundland Power rates.
2) These bills have been estimated by Hydro-Québec and may differ from actual bills.
Hydro-Quebec Electricity Prices Comparison Report – Small Power
Monthly Bills as of April 1, 2011 (except BC Hydro May 1, 2011 bills)
CDN ¢/kWh
6 kW
750 kWh
17% load factor
14 kW
2000 kWh
20% load factor
40 kW
10,000 kWh
35% load factor
100 kW
14,000 kWh
19% load factor
100 kW
25,000 kWh
35% load factor
Note: The top five participating utilities with the lowest average prices are ranked in the table above, from lowest to highest. The sort order indicates the utility’s overall ranking in the category.
Attachment A
Electricity Rate Comparison Annual Report - May 1, 2011 Rates
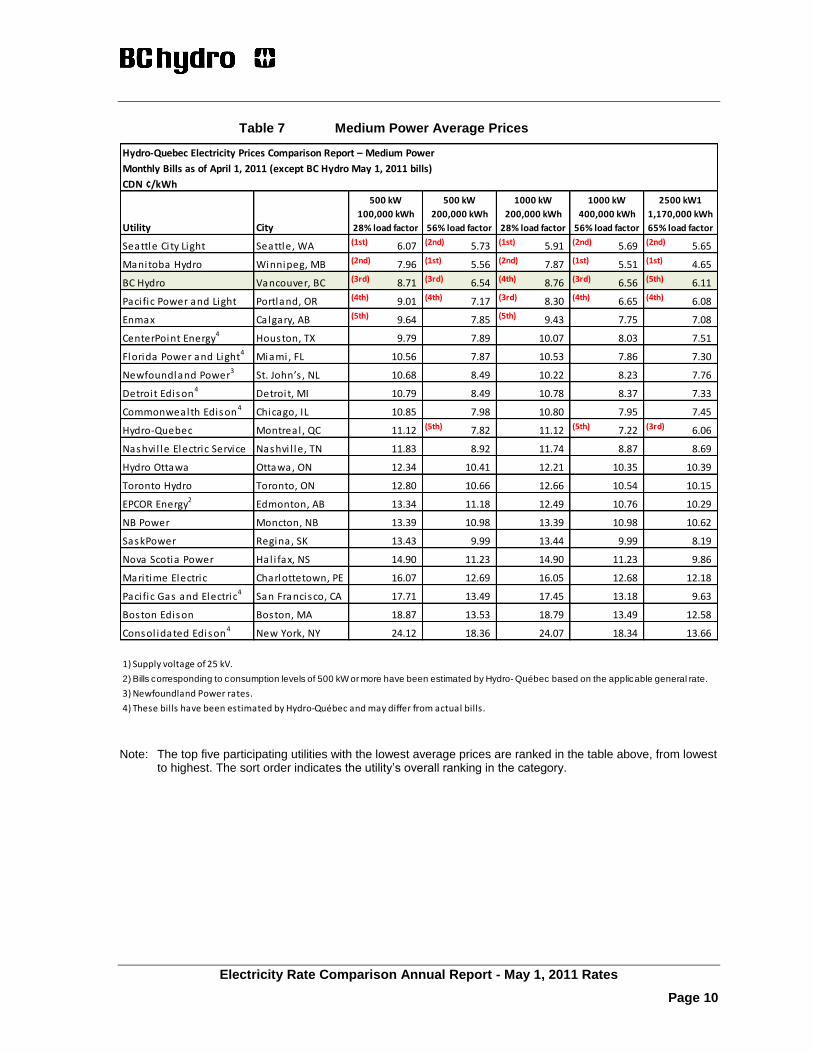
Page 10
Table 7 Medium Power Average Prices
Utility City
Seattle Ci ty Light Seattle, WA (1st) 6.07 (2nd) 5.73 (1st) 5.91 (2nd) 5.69 (2nd) 5.65
Manitoba Hydro Winnipeg, MB (2nd) 7.96 (1st) 5.56 (2nd) 7.87 (1st) 5.51 (1st) 4.65
BC Hydro Vancouver, BC (3rd) 8.71 (3rd) 6.54 (4th) 8.76 (3rd) 6.56 (5th) 6.11
Paci fic Power and Light Portland, OR (4th) 9.01 (4th) 7.17 (3rd) 8.30 (4th) 6.65 (4th) 6.08
Enmax Calgary, AB (5th) 9.64 7.85 (5th) 9.43 7.75 7.08
CenterPoint Energy4
Houston, TX 9.79 7.89 10.07 8.03 7.51
Florida Power and Light4
Miami, FL 10.56 7.87 10.53 7.86 7.30
Newfoundland Power3 St. John’s , NL 10.68 8.49 10.22 8.23 7.76
Detroit Edison4 Detroit, MI 10.79 8.49 10.78 8.37 7.33
Commonwealth Edison4 Chicago, IL 10.85 7.98 10.80 7.95 7.45
Hydro-Quebec Montreal , QC 11.12 (5th) 7.82 11.12 (5th) 7.22 (3rd) 6.06
Nashvi l le Electric Service Nashvi l le, TN 11.83 8.92 11.74 8.87 8.69
Hydro Ottawa Ottawa, ON 12.34 10.41 12.21 10.35 10.39
Toronto Hydro Toronto, ON 12.80 10.66 12.66 10.54 10.15
EPCOR Energy2 Edmonton, AB 13.34 11.18 12.49 10.76 10.29
NB Power Moncton, NB 13.39 10.98 13.39 10.98 10.62
SaskPower Regina, SK 13.43 9.99 13.44 9.99 8.19
Nova Scotia Power Hal i fax, NS 14.90 11.23 14.90 11.23 9.86
Mari time Electric Charlottetown, PE 16.07 12.69 16.05 12.68 12.18
Paci fic Gas and Electric4 San Francisco, CA 17.71 13.49 17.45 13.18 9.63
Boston Edison Boston, MA 18.87 13.53 18.79 13.49 12.58
Consol idated Edison4 New York, NY 24.12 18.36 24.07 18.34 13.66
1) Supply voltage of 25 kV.
2) Bills corresponding to consumption levels of 500 kW or more have been estimated by Hydro- Québec based on the applicable general rate.
3) Newfoundland Power rates.
4) These bills have been estimated by Hydro-Québec and may differ from actual bills.
Hydro-Quebec Electricity Prices Comparison Report – Medium Power
Monthly Bills as of April 1, 2011 (except BC Hydro May 1, 2011 bills)
CDN ¢/kWh
500 kW
100,000 kWh
28% load factor
500 kW
200,000 kWh
56% load factor
1000 kW
200,000 kWh
28% load factor
1000 kW
400,000 kWh
56% load factor
2500 kW1
1,170,000 kWh
65% load factor
Note: The top five participating utilities with the lowest average prices are ranked in the table above, from lowest to highest. The sort order indicates the utility’s overall ranking in the category.
Attachment A
Electricity Rate Comparison Annual Report - May 1, 2011 Rates
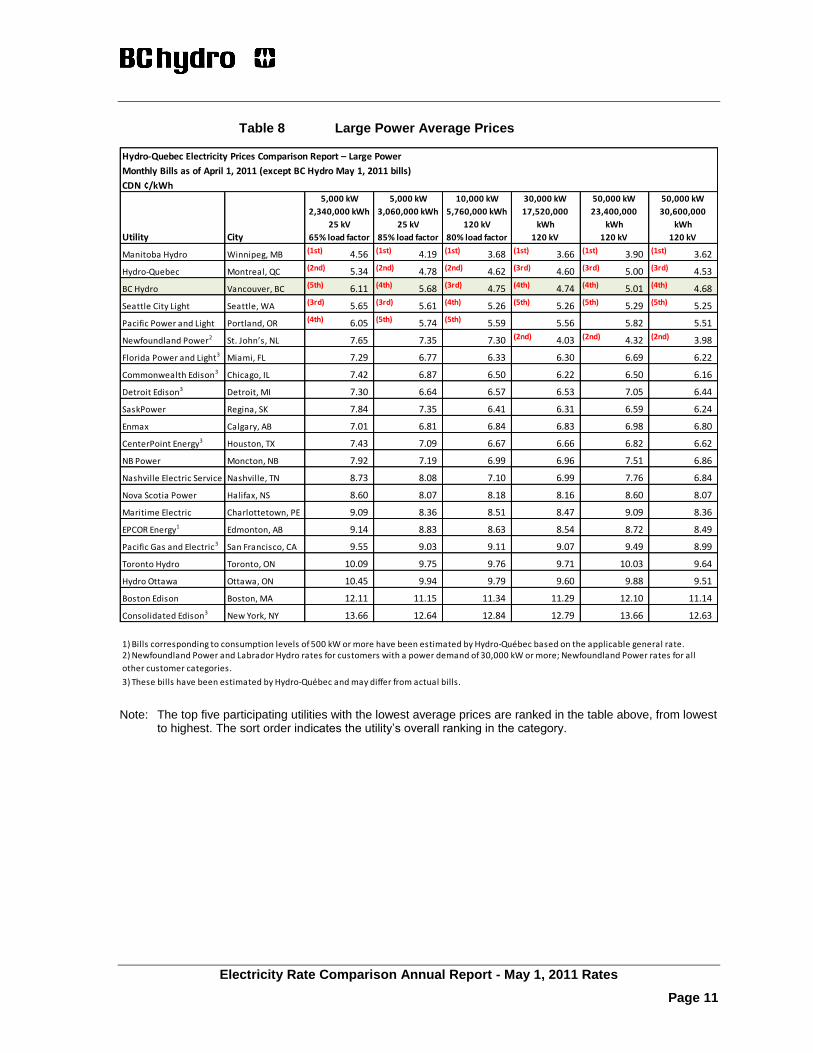
Page 11
Table 8 Large Power Average Prices
Utility City
Manitoba Hydro Winnipeg, MB (1st) 4.56 (1st) 4.19 (1st) 3.68 (1st) 3.66 (1st) 3.90 (1st) 3.62
Hydro-Quebec Montreal, QC (2nd) 5.34 (2nd) 4.78 (2nd) 4.62 (3rd) 4.60 (3rd) 5.00 (3rd) 4.53
BC Hydro Vancouver, BC (5th) 6.11 (4th) 5.68 (3rd) 4.75 (4th) 4.74 (4th) 5.01 (4th) 4.68
Seattle City Light Seattle, WA (3rd) 5.65 (3rd) 5.61 (4th) 5.26 (5th) 5.26 (5th) 5.29 (5th) 5.25
Pacific Power and Light Portland, OR (4th) 6.05 (5th) 5.74 (5th) 5.59 5.56 5.82 5.51
Newfoundland Power2 St. John’s, NL 7.65 7.35 7.30 (2nd) 4.03 (2nd) 4.32 (2nd) 3.98
Florida Power and Light3 Miami, FL 7.29 6.77 6.33 6.30 6.69 6.22
Commonwealth Edison3 Chicago, IL 7.42 6.87 6.50 6.22 6.50 6.16
Detroit Edison3 Detroit, MI 7.30 6.64 6.57 6.53 7.05 6.44
SaskPower Regina, SK 7.84 7.35 6.41 6.31 6.59 6.24
Enmax Calgary, AB 7.01 6.81 6.84 6.83 6.98 6.80
CenterPoint Energy3 Houston, TX 7.43 7.09 6.67 6.66 6.82 6.62
NB Power Moncton, NB 7.92 7.19 6.99 6.96 7.51 6.86
Nashville Electric Service Nashville, TN 8.73 8.08 7.10 6.99 7.76 6.84
Nova Scotia Power Halifax, NS 8.60 8.07 8.18 8.16 8.60 8.07
Maritime Electric Charlottetown, PE 9.09 8.36 8.51 8.47 9.09 8.36
EPCOR Energy1 Edmonton, AB 9.14 8.83 8.63 8.54 8.72 8.49
Pacific Gas and Electric3 San Francisco, CA 9.55 9.03 9.11 9.07 9.49 8.99
Toronto Hydro Toronto, ON 10.09 9.75 9.76 9.71 10.03 9.64
Hydro Ottawa Ottawa, ON 10.45 9.94 9.79 9.60 9.88 9.51
Boston Edison Boston, MA 12.11 11.15 11.34 11.29 12.10 11.14
Consolidated Edison3 New York, NY 13.66 12.64 12.84 12.79 13.66 12.63
1) Bills corresponding to consumption levels of 500 kW or more have been estimated by Hydro-Québec based on the applicable general rate.
3) These bills have been estimated by Hydro-Québec and may differ from actual bills.
2) Newfoundland Power and Labrador Hydro rates for customers with a power demand of 30,000 kW or more; Newfoundland Power rates for all
other customer categories.
Hydro-Quebec Electricity Prices Comparison Report – Large Power
Monthly Bills as of April 1, 2011 (except BC Hydro May 1, 2011 bills)
CDN ¢/kWh5,000 kW
2,340,000 kWh
25 kV
65% load factor
5,000 kW
3,060,000 kWh
25 kV
85% load factor
10,000 kW
5,760,000 kWh
120 kV
80% load factor
30,000 kW
17,520,000
kWh
120 kV
50,000 kW
23,400,000
kWh
120 kV
50,000 kW
30,600,000
kWh
120 kV
Note: The top five participating utilities with the lowest average prices are ranked in the table above, from lowest to highest. The sort order indicates the utility’s overall ranking in the category.
Attachment A
Electricity Rate Comparison Annual Report - May 1, 2011 Rates
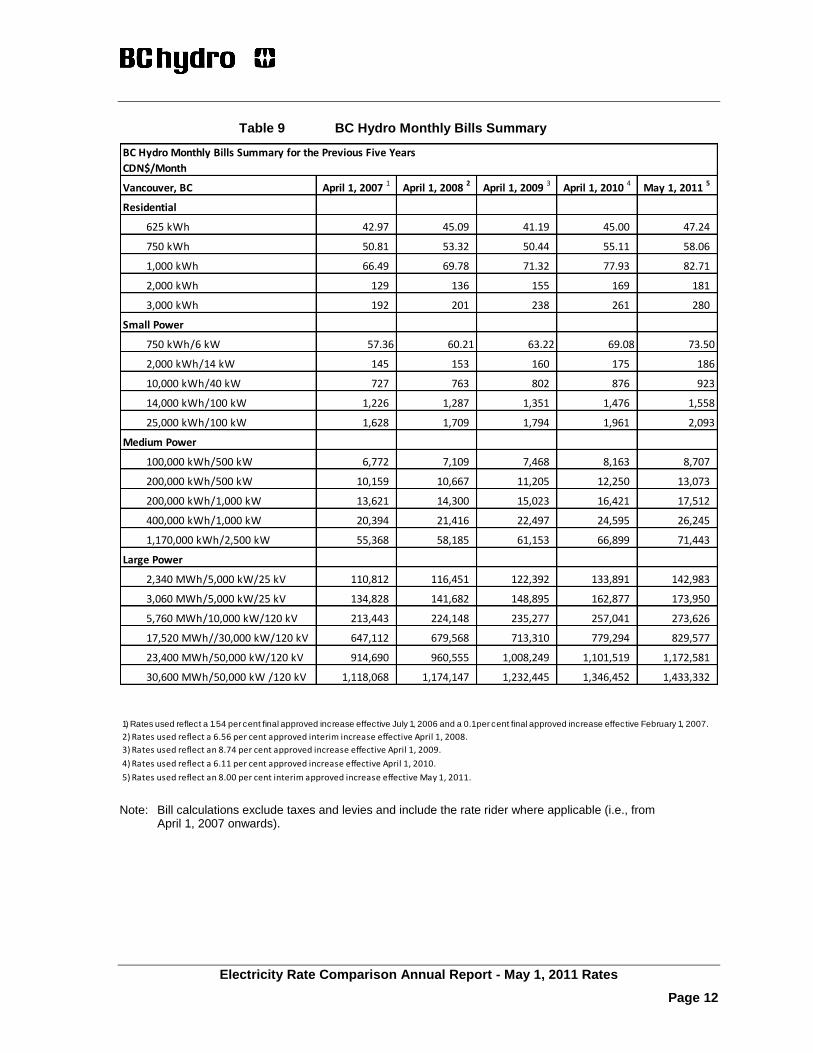
Page 12
Table 9 BC Hydro Monthly Bills Summary
Vancouver, BC April 1, 2007 1
April 1, 2008 2
April 1, 2009 3
April 1, 2010 4
May 1, 2011 5
Residential
625 kWh 42.97 45.09 41.19 45.00 47.24
750 kWh 50.81 53.32 50.44 55.11 58.06
1,000 kWh 66.49 69.78 71.32 77.93 82.71
2,000 kWh 129 136 155 169 181
3,000 kWh 192 201 238 261 280
Small Power
750 kWh/6 kW 57.36 60.21 63.22 69.08 73.50
2,000 kWh/14 kW 145 153 160 175 186
10,000 kWh/40 kW 727 763 802 876 923
14,000 kWh/100 kW 1,226 1,287 1,351 1,476 1,558
25,000 kWh/100 kW 1,628 1,709 1,794 1,961 2,093
Medium Power
100,000 kWh/500 kW 6,772 7,109 7,468 8,163 8,707
200,000 kWh/500 kW 10,159 10,667 11,205 12,250 13,073
200,000 kWh/1,000 kW 13,621 14,300 15,023 16,421 17,512
400,000 kWh/1,000 kW 20,394 21,416 22,497 24,595 26,245
1,170,000 kWh/2,500 kW 55,368 58,185 61,153 66,899 71,443
Large Power
2,340 MWh/5,000 kW/25 kV 110,812 116,451 122,392 133,891 142,983
3,060 MWh/5,000 kW/25 kV 134,828 141,682 148,895 162,877 173,950
5,760 MWh/10,000 kW/120 kV 213,443 224,148 235,277 257,041 273,626
17,520 MWh//30,000 kW/120 kV 647,112 679,568 713,310 779,294 829,577
23,400 MWh/50,000 kW/120 kV 914,690 960,555 1,008,249 1,101,519 1,172,581
30,600 MWh/50,000 kW /120 kV 1,118,068 1,174,147 1,232,445 1,346,452 1,433,332
BC Hydro Monthly Bills Summary for the Previous Five Years
CDN$/Month
1) Rates used reflect a 1.54 per cent final approved increase effective July 1, 2006 and a 0.1 per cent final approved increase effective February 1, 2007.
2) Rates used reflect a 6.56 per cent approved interim increase effective April 1, 2008.
3) Rates used reflect an 8.74 per cent approved increase effective April 1, 2009.
4) Rates used reflect a 6.11 per cent approved increase effective April 1, 2010.
5) Rates used reflect an 8.00 per cent interim approved increase effective May 1, 2011.
Note: Bill calculations exclude taxes and levies and include the rate rider where applicable (i.e., from April 1, 2007 onwards).
Attachment A
Electricity Rate Comparison Annual Report - May 1, 2011 Rates
Page 13
Table 10 BC Hydro Average Prices Summary
Vancouver, BC April 1, 2007 1
April 1, 2008 2
April 1, 2009 3
April 1, 2010 4
May 1, 2011 5
Residential
625 kWh 6.88 7.21 6.59 7.20 7.56
750 kWh 6.77 7.11 6.73 7.35 7.74
1,000 kWh 6.65 6.98 7.13 7.79 8.27
2,000 kWh 6.46 6.78 7.74 8.46 9.07
3,000 kWh 6.40 6.71 7.95 8.69 9.33
Small Power
750 kWh/6 kW 7.65 8.04 8.43 9.21 9.80
2,000 kWh/14 kW 7.27 7.64 8.02 8.76 9.32
10,000 kWh/40 kW 7.27 7.63 8.02 8.76 9.23
14,000 kWh/100 kW 8.76 9.19 9.65 10.54 11.13
25,000 kWh/100 kW 6.51 6.83 7.18 7.84 8.37
Medium Power
100,000 kWh/500 kW 6.77 7.11 7.47 8.16 8.71
200,000 kWh/500 kW 5.08 5.33 5.60 6.13 6.54
200,000 kWh/1,000 kW 6.81 7.15 7.51 8.21 8.76
400,000 kWh/1,000 kW 5.10 5.35 5.62 6.15 6.56
1,170,000 kWh/2,500 kW 4.73 4.97 5.23 5.72 6.11
Large Power
2,340 MWh/5,000 kW/25 kV 4.74 4.98 5.23 5.72 6.11
3,060 MWh/5,000 kW/25 kV 4.41 4.63 4.87 5.32 5.68
5,760 MWh/10,000 kW/120 kV 3.71 3.89 4.08 4.46 4.75
17,520 MWh//30,000 kW/120 kV 3.69 3.88 4.07 4.45 4.74
23,400 MWh/50,000 kW/120 kV 3.91 4.10 4.31 4.71 5.01
30,600 MWh/50,000 kW /120 kV 3.65 3.84 4.03 4.40 4.68
BC Hydro Average Prices Summary for the Previous Five Years
CDN¢/kWh
1) Rates used reflect a 1.54 per cent final approved increase effective July 1, 2006 and a 0.1 per cent final approved increase effective February 1, 2007.
2) Rates used reflect a 6.56 per cent approved interim increase effective April 1, 2008.
3) Rates used reflect an 8.74 per cent approved increase effective April 1, 2009.
4) Rates used reflect a 6.11 per cent approved increase effective April 1, 2010.
5) Rates used reflect an 8.00 per cent interim approved increase effective May 1, 2011.
Attachment A
Electricity Rate Comparison Annual Report - May 1, 2011 Rates
Page 14
Table 11 Corresponding BC Hydro Rate Schedules included in each Segment of the Hydro Quebec Rate Survey
Hydro Quebec Segment Corresponding BC Hydro Rate
Schedule
Residential
625 kWh RS 1101
750 kWh RS 1101
1,000 kWh RS 1101
2,000 kWh RS 1101
3,000 kWh RS 1101
Small Power
750 kWh/6 kW RS 1300
2,000 kWh/14 kW RS 1300
10,000 kWh/40 kW RS 1500
14,000 kWh/100 kW RS 1500
25,000 kWh/100 kW RS 1500
Medium Power
100,000 kWh/500 kW RS 1600
200,000 kWh/500 kW RS 1600
200,000 kWh/1,000 kW RS 1600
400,000 kWh/1,000 kW RS 1600
1,170,000 kWh/2,500 kW RS 1611
Large Power
2,340,000 kWh/5,000 kW/25 kV RS 1611
3,060,000 kWh/5,000 kW/25 kV RS 1611
5,760,000 kWh/10,000 kW/120 kV RS 1823
17,520,000 kWh/30,000 kW/120 kV RS 1823
23,400,000 kWh/50,000 kW/120 kV RS 1823
30,600,000 kWh/50,000 kW/120 kV RS 1823
Attachment A
Electricity Rate Comparison Annual Report - May 1, 2011 Rates
Page 15
Table 12 BC Hydro Rankings Summary in Hydro Quebec Rate Surveys, Out of 22 Utilities Surveyed
Vancouver, BC April 1, 2007 April 1, 2008 April 1, 2009 April 1, 2010 May 1, 2011
Residential 4 4
625 kWh 3 3 1 2 3
750 kWh 2 4 1 4 4
1,000 kWh 2 4 3 4 4
2,000 kWh 2 2 3 5 5
3,000 kWh 2 2 3 4 6
Small Power 6 5
750 kWh/6 kW 2 2 3 4 4
2,000 kWh/14 kW 3 3 3 3 3
10,000 kWh/40 kW 3 4 4 7 7
14,000 kWh/100 kW 2 3 3 7 7
25,000 kWh/100 kW 2 3 3 5 4
Medium Power 6 3
100,000 kWh/500 kW 2 2 2 5 3
200,000 kWh/500 kW 2 3 2 4 3
200,000 kWh/1,000 kW 2 3 2 6 4
400,000 kWh/1,000 kW 2 3 2 5 3
1,170,000 kWh/2,500 kW 2 4 2 6 5
Large Power 4 4
2,340 MWh/5,000 kW/25 kV 2 4 2 7 5
3,060 MWh/5,000 kW/25 kV 2 3 3 6 4
5,760 MWh/10,000 kW/120 kV 2 2 2 3 3
17,520 MWh//30,000 kW/120 kV 2 2 3 4 4
23,400 MWh/50,000 kW/120 kV 2 2 2 4 4
30,600 MWh/50,000 kW /120 kV 2 2 3 4 4
Attachment A