models for the electricity sector and comparison of electricity
TRANSCRIPT

Models for the Electricity Sector and Electricity Market Reforms
Youngho Chang Nanyang Technological University
18 February 2015
The 8th Capacity Building for Officers of Electricity Regulatory Commissions
18 – 20 February 2015, Singapore

World at Night from Satellite
2

Models for the Electricity Sector and Electricity Market Reforms
• Descriptive statistics • Modeling natural monopoly
– Social optimum in a natural monopoly market • Government policy for a natural monopoly
– Rate of return regulation – Utility base
• Various load structures, load and load duration curve • Peak Load Pricing • Models for restructuring the electricity sector
– System marginal price and capacity charge – Market power and measures
3

Electricity Consumption per Capita (kWh) in 2009
4
0
2000
4000
6000
8000
10000
12000
14000
Source: World Bank (2012)

Electricity Consumption per Capita by Region in 2009 (kWh)
Region Consumption Arab World 2,154.8 East Asia and Pacific 2,797.4 Euro Area 6,588.7 European Union 6,063.6 Latin America and Caribbean 1,901.2 Middle East and North Africa 2,445.2 North America 13,167.1 OECD 7.981.8 South Asia 516.9 Sub Saharan Africa 517.4 World 2,806.9
5 Source: World Bank (2012)

World Population Without Electricity (Millions of People)
Rural Urban S. America 38 7 North Africa-Middle East 30 17 Sub-Sahara Africa 438 109 S. Asia 580 126 S.E. Asia 182 41 Total 1,268 300
6 Source: World Energy Outlook 2006 (IEA)

Electricity Generation, Transmission and Distribution: A Schematic Diagram
7
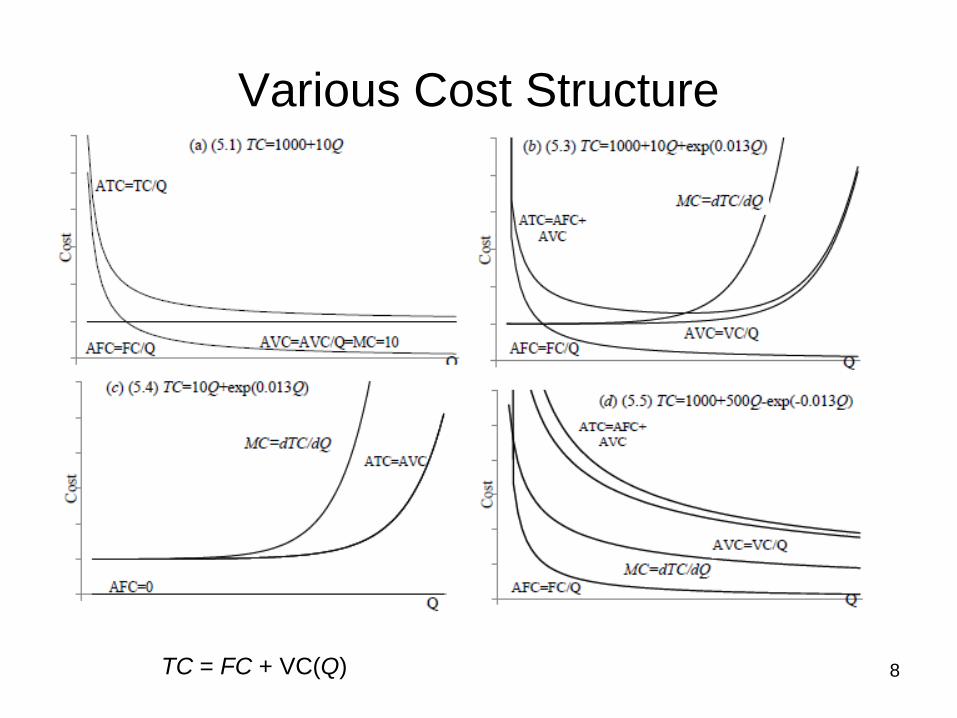
Various Cost Structure
8 TC = FC + VC(Q)

Inverse Demand and Cost Curves in a Decreasing Cost Industry
9

Monopoly Production, Price and Profit
10
P = 75 – 4Q TC = 19Q – 0.25Q2
ATC = MC = TR = P*Q = MR = Profit (πm) =

Social Optimum in a Natural Monopoly Market
11
Social Optimum: P(Q) – MC(Q) = 0 Derivation:

Government Policy for a Natural Monopoly • Rate of Return Regulation
– The utility is allowed to earn a normal rate of return on their capital stock or their rate base (RB)
– The accounting equation
12
investment sfirm' regulated theof base rate the return of rate fair"" of allowable the
classes service ofnumber the class serviceth - theofquantity the
class serviceth - theof price the
)(expenses1
=====
+=∑=
RBsn
iQiPwhere
RBsQP
i
i
i
n
ii

A Case of Rate Increase: An Illustration • Suppose that a utility has a rate base of $2,000
– It expects to sell 4,000 kWh to industrial customers and 2,500 kWh to residential customers
– Its operating costs are $200 – The regulator believes that 10% is a normal rate of
return for the utility – The utility has asked the public utility commission for
a rate increase to $0.05 per kWh for industrial customers and to $0.10 per kWh for residential customers.
• Should the commission approve the rate increase?
13

Utility Rate Base
• Rate Base (RB) is usually original capital cost minus depreciation – Suppose a plant was bought in 1980 for 500 million
1980 dollars and it is depreciated over 40 years. So annual depreciation is 500/40 = 12.5.
– The rate base in 2000 • RB(2000) = 500 – 20*12.5 = 250 million
– This value could understate actual investment if inflation has occurred
• If prices have doubled from 1980 to 2000, the rate base related to 2000 dollars would be 2*250 = 500 million
– The rate base can be adjusted with an approprate index
14

15
Load Structure • Load curve
– Plots demands over a 24-hour period – Variation of the electricity demand on a national grid
and a day • Load-duration curve
– Measures how long a level of demand lasts over a year
• A typical peak load – Egypt, Jordan and Israel – UK – U.S. and Canada – Shopping Malls in Hong Kong – Singapore

Load and Load Duration Curve
16 Source: Crew and Kleindorfer (1986)
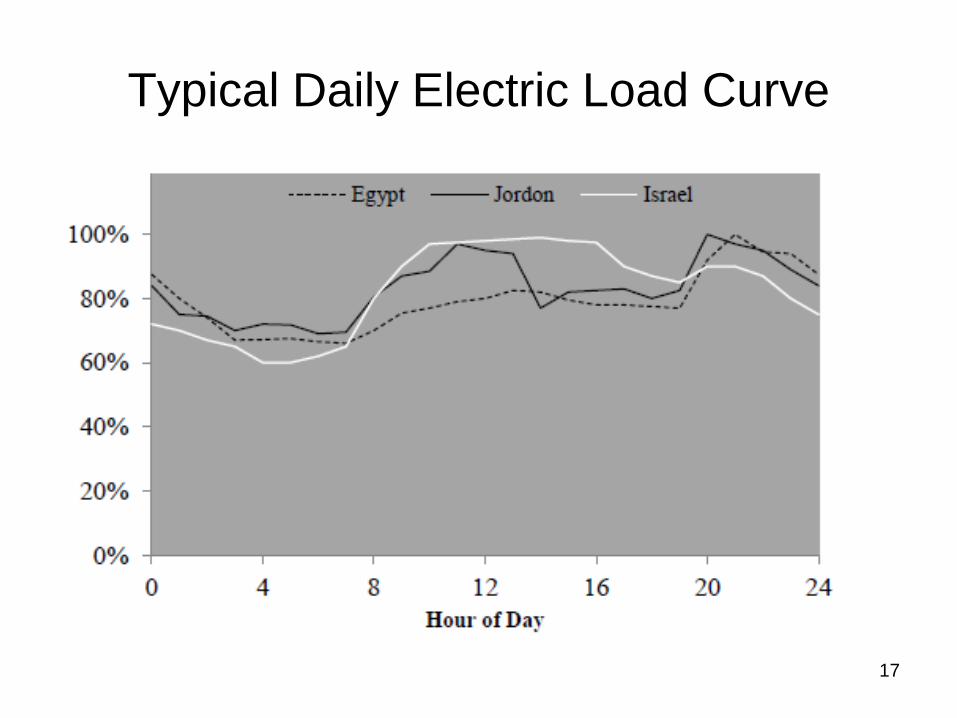
Typical Daily Electric Load Curve
17

Variation of the Electricity Demand on the National Grid, 2009-10
18 Source: National Grid (2010)

Variation in UK Electricity Demand during the 1990 World Cup Semi-Final
19 Source: National Grid (2010)

Electricity End Use by Month
20

Monthly Electricity Consumption Profiles for Four Shopping Malls in Hong Kong
21
Electricity consumption varies seasonally and the lord curve depends on the climate, how much electricity is used for heating and cooling, and whether commercial and industrial activity follow a seasonal pattern or not. Source: Lam and Li (2003)

Singapore Load Curve
22
Daily peak production tends to occur during the day, Shoulder production early in the morning and later in the evening, Off-peak during the night
Source: Energy Market Authority (EMA) Singapore

Peak-Load Pricing
• Charging different prices for electricity depending on the load factor – Storing electricity is expensive – So, capacity is usually made large enough to
satisfy the on-peak demand – Hence, during much of the time (i.e., off-peak
time) some capital is sitting idle
23

Capacity Requirement: Illustration
• A utility produces 55 billion kWh per year – Its average single-customer demand is 6,300 MW – Peak demand is 11,145 MW – Installed capacity is 13,234 MW, with the extra
needed as a mandated reliability margin • What would happen if the utility can move some
of the on-peak demand to off-peak? – Can it decrease the amount of total capital needed
and cost by using existing capital more intensely?
24

Peak-Load Pricing: Setting
• Suppose daily demand – Dpk for on-peak and Dofpk for off-peak – Demands are independent
• The price in the on-peak period does not affect the quantity demanded in the off-peak period and vice versa
• Operating costs – Coppk for on-peak and Copof for off-peak
• Capital costs per unit are constant at Ck – Assume capital can be added in small increments
• To pick prices in the two markets (on-peak and off-peak) to maximize social welfare
25

Peak-Load Model
26

Peak-Load Pricing: Implications
• The first-order conditions require – On-peak load pays its operating plus capital costs – Off-peak load only pays its operating costs
• Implications:
27

Generating Costs
D
D'
28

29
Structures of Electricity Market • Under regulation
– Vertically integrated, mostly government owned, natural monopoly
– Instruments for regulation • Price and quantity
• Under deregulation – Separation of industry by ownership – Horizontally unbundled
• Full competition in generation and wholesale/retail • Still monopoly in transmission and distribution (T&D)
• Motivations for unbundling?

30
In a Deregulated Electricity Market
• Market becomes competitive – Non-existence (or little abuse) of market power – Easy entry and exit of players – Efficiency of allocation and lower and/or stable prices
• Market functions properly – Informed decisions – Allocation of risk – Transactions at minimal cost and lower production costs
• Market leads close to marginal-cost pricing – Prices would be close to the marginal cost under workable
competition and a reasonably well-functioning market environment
• What do we expect? – Right and Stable Prices – Competition and Reliability

Models for the Electricity Sector
• Model 1 – No competition, vertically integrated, publicly or privately owned
• Model 2 – Model 1 but with competition in generation. A single buyer (a
distribution company) may buy from a number of different producers
• Model 3 – Model 2 but with common or contract carriage of high voltage
transmission lines offered to all wholesale sellers and buyers • Model 4
– Model 3 but retail customers also choose their suppliers in full retail competition
31

4 Electricity Restructuring Models – Model 1
• Hunt and Shuttleworth (1996) – 4 models • depend on competition at each stage • Model 1: no competition - vertical
integration •
Local Distribution
32

• Model 2: competition generation (gencos)
•
Electricity Restructuring Models – Model 2
33

• Model 3: distribution companies (distcos) • own the distribution wires • distcos and large buyers choose their
supplier • competition in generation and wholesale
Electricity Restructuring Models – Model 3
open access wholesale market
34

• Model 4: all customers choose suppliers • full retail competition •
4 Electricity Restructuring Models – Model 4
open access
35

Model 4 is the Most Economically Efficient
• If there are – A well-established electricity retailing system – Mature market institutions – Constant vigilance against market power – Appropriate methods of dispatch
36

Electricity Prices and Taxes, $/kWh, 2011
Chile U.K. New Zealand
Norway Sweden U.S
Price (Tax)
Price (Tax)
Price (Tax)
Price (Tax)
Price (Tax)
Price (Tax)
Industrial 0.18 (N/A)
0.12 (0.00)
0.06 (N/A)
0.04 (0.01)
0.08 (0.00)
0.07 (N/A)
Households 0.25 (0.04)
0.19 (0.01)
0.18 (0.02)
0.10 (0.03)
0.18 (0.05)
0.12 (N/A)
37
Observations:

Electricity Restructuring: U.K.
• United Kingdom – A first country that reforms electricity market – The market reform (in England and Wales) was
considered a success – In 2001, New Electricity Trading Arrangements
(NETA) replaced the power pool; bilateral contracts and self power dispatch
– Climate change levee (CCL) replaced non-fossil fuel obligation (NFFO) in 2001; Feed-in-Tariffs for renewables (2008 and 2010)
38

Electricity Restructuring: New Zealand
• New Zealand – A third early reformer – A role model for electricity market
deregulation in Singapore – The SMP is determined where the supply and
demand bids intersect (next slide) – No price caps
39

Double Sided Bidding Market
40

Electricity Restructuring: Norway
• Norway – Only second in Europe – Unique in power generation – hydropower (more than
90%) – Long experiences in electricity pool operation – Third-party access for all networks – Generation: largely government owned (90%) – Network services or distribution companies: natural
monopolies
41

Electricity Restructuring: Sweden
• Sweden – High energy intensity and per capita
consumption – Liberalization was resumed in 1996 with third-
party access to the network – Joined Nord Pool in 1996 – Nord Pool is considered one of the most
successful wholesale markets
42

43
Why Does Economics Concern Power Supply?
• Motivations – Cost structure is rather unique – Continuity requirement in power supply – Efficiency
• Generation technologies and cost structures – Long-Run Marginal Cost (LRMC)
• Fixed and variable costs – Short-Run Marginal Cost (SRMC)
• Variable costs or avoidable costs

Merit Order by Marginal Running Cost
44

Market Clearing Price
Quantity (MW)
Total demand Price ($/MWh)
60
20
- 20
0
40
80
100
Clearing price = $50/MWh
Marginal unit
above
Offers above the clearing price are not accepted
Offers below the clearing price are accepted
Company A Company B Company C
The market clears at this point
Source: EMA (2012)

A System Marginal Price (SMP)
• Suppose that the forecast demand is 100 kW for the next hour – National Power bids $0.05 per kWh for 75 kW of
capacity (with a transmission capacity of 65 kW) – Power Gen bids $0.06 kWh for 25kW of capacity – Scottish Power bids $0.07 per kWh for 50 kW of
capacity – EdF bids $0.075 per kWh for 10 kW of capacity – National Grid bids $0.08 per kWh for 50 kW of
capacity – The SMP for this case is _______
46

Pool Purchase Price (PPP)
• All generators who bids SMP or lower will be paid the pool purchase price (PPP) equal to this SMP plus a capacity charge (CC) – PPP = SMP + CC – CC signals how much need there for new generation
capacity
47

Capacity Charge (CC)
• It is computed as follows: – CC = LOLP*VOLL distributed over all producers – LOLP: The Loss of Load Probability
• The likelihood of a load interruption because of capacity constraints
– VOLL: The Value of Lost Load (estimated) • Suppose there is a 5% probability of a 10 kWh shortfall.
The loss of output from a 10 kWh shortfall is estimated at $15 – LOLP*VOLL = 0.05*15 = $0.75 – CC = $0.75/100 = $0.0075
• PPP = SMP + CC = $0.07 + $0.0075 = $0.0775
48

Pool-Selling Price (PSP) • PPP plus an uplift charge (U) • The uplift charge
– To recover costs form extra electricity or spinning reserve dispatched to cover transmission constraints and demand forecast errors
– If a plant is dispatched to provide 10kWh of spinning reserve at $0.06 per kWh, but there is no market for the power, the producer must still be paid for being ready
– The payment is divided over all power users – U = 0.06*10/100 = $0.006
• PSP is total charge to cover energy, capacity and uncertainty – PSP = SMP + CC + U = $0.07 + $0.0075$ + $0.006 = $0.0835
49

Physical and Economic Withholding
50 Source: EMC (2012)

51
Market Power and Measures

52
Lerner Index
• The relative mark-up over marginal cost – The difference between price and marginal cost as a
fraction of the price – A ratio of price less marginal cost of supply to price – Price-cost margin
• Zero (0): no market power • One (1): infinite market power
• It measures a firm’s ability to maintain prices above competitive level at its profit-maximizing level of output

Test Results of Market Power: An Example
Measures Values and Remarks CS4 96% CS8 Close to 100% HHI 0.2662 SMA Negative for all gencos RSI Larger than 1 for all gencos Lerner Index 0.188 – 0.250
53
Source: Compiled from Chang (2007) Energy Policy, 35: 403 – 412

Key Points
• Modeling natural monopoly – Social optimum in a natural monopoly market
• Government policy for a natural monopoly – Rate of return regulation – Utility base
• Various load structures, load and load duration curve • Peak Load Pricing • A Schematic Diagram of Electricity Market • Models for the Electricity Sector • Market Power: Definitions and Measures
– CS, HHI, SMA, RSI, and Lerner Index
54