electricity generation capacity in belgium over the …€¦ · context & methodology •...
TRANSCRIPT
1
Electricity Generation Capacity in Belgium over the Period 2011-2020
Commission for Electricity and Gas Regulation
Dominique WoitrinDirector Technical Operation of Markets
European Commission – Experts Meeting20 July 2011

2
Context & Methodology• Current legal framework• Fukushima – direct consequences
– Closing of German nuclear plants– Stress tests for nuclear plants in Europe
• Update of CREG-study 715 from 09/2007• Study over timeframe 2011-2020• Model Procreas : probabilistic calculation method
with economic data• Adequacy criterium : LOLE = max 16h/year
3
Assumptions• Evolution Electricity demand : +1.8%/year
(projection ELIA high demand in project of development plan 2010-2020)
• No structural net import (self-security)• +1146 MW new plants in 2011
T-Power, Marcinelle Energie, SPE (GT’s Angleur) and Max Green
• Shutdown of plants– Nuclear : legal Belgian framework (40y)– Announced shutdowns of older plants– Expected maximum lifetime for other thermal units– LCP-Directive
4
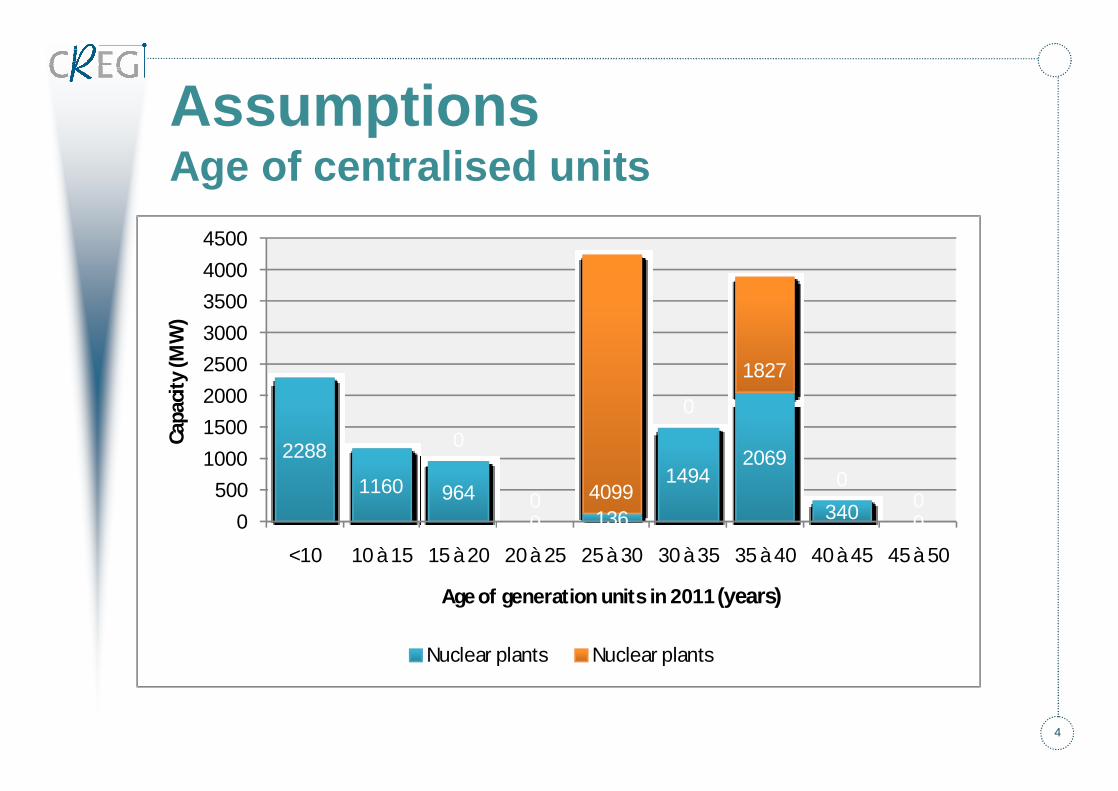
AssumptionsAge of centralised units
2288
1160 964
0 136
14942069
340 0
0
0 4099
0
1827
00
0
500
1000
1500
2000
2500
3000
3500
4000
4500
<10 10 à 15 15 à 20 20 à 25 25 à 30 30 à 35 35 à 40 40 à 45 45 à 50
Capa
city
(MW
)
Age of generation units in 2011 (years)
Nuclear plants Nuclear plants
5
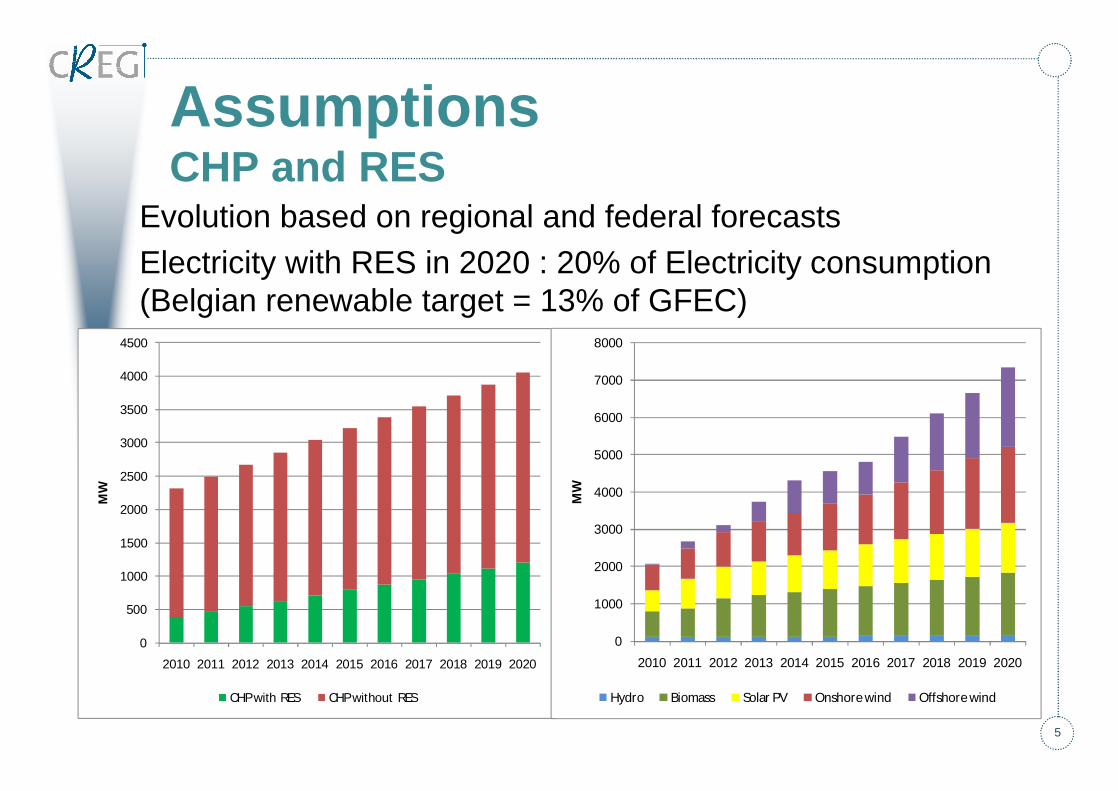
Assumptions CHP and RES
Evolution based on regional and federal forecastsElectricity with RES in 2020 : 20% of Electricity consumption (Belgian renewable target = 13% of GFEC)
0
500
1000
1500
2000
2500
3000
3500
4000
4500
2010 2011 2012 2013 2014 2015 2016 2017 2018 2019 2020
MW
CHP with RES CHP without RES
0
1000
2000
3000
4000
5000
6000
7000
8000
2010 2011 2012 2013 2014 2015 2016 2017 2018 2019 2020
MW
Hydro Biomass Solar PV Onshore wind Offshore wind

6
ResultsEvolution generation capacity for electricity
0
5000
10000
15000
20000
25000
2011 2012 2013 2014 2015 2016 2017 2018 2019 2020
MW
Doel1, Doel2, Tihange1 Existing Power Generation New Fossil CHP
New RES (incl. CHP) Necessary Investments

7
ResultsEvolution LOLE with possible investments
2011 2012 2013 2014 2015 2016 2017 2018 2019 2020
Peak Load Units 0 0 0 0 320 400 480 560 720 800
Base Load Units 0 0 0 0 450 2800 2800 3200 3600 3600
LOLE 14.2 18.5 46.2 47.9 259.6 15.6 14.1 15.5 14.9 14.5
0
50
100
150
200
250
0
1000
2000
3000
4000
5000
LOLE
(h)
Add
itio
nal C
apac
ity
(MW
)

8
Conclusions• Sufficient number of projects in the pipeline to
cover needs till 2020 (yet to be decided)But• Most of these projects cannot be realized before
2016.• Closing of classic thermal generation units on top of
the shutdown of three oldest nuclear plants• Increased risk over the period 2012 -2015• Early shutdown of three oldest nuclear plants leads to
an even higher risk• (transitional) measures are necessary
9
Recommendations• NegaWatts• Financial incentives for new power plant
investments• Exceptional measures :
– Extension of Nuclear lifetime with 1 or 2 years for 3 oldest reactors (D1, D2 en Ti1)
– Maintain availability of certain old thermal power plants beyond their normal lifetime (LCP)
• Stress test results and political decision ASAP
10
www. .beStudy 1074 available at