electric vehicle and wireless charging laboratoryof a wireless charging product and compared...
TRANSCRIPT
i
ElectricVehicleandWirelessChargingLaboratory
Richard Raustad William Wilson
Electric Vehicle Transportation Center Florida Solar Energy Center
1679 Clearlake Road Cocoa, FL 32922-5703 [email protected]
Submitted as:
Final Research Project Report EVTC Project 15 – Electric Vehicle and Wireless Charging Laboratory
Submitted to
Ms. Denise Dunn Research and Innovative Technology Administration
1200 New Jersey Avenue, SE Washington, DC 20590
E-mail: [email protected]
Contract Number: DTRT13-G-UTC51 EVTC Report Number: FSEC-CR-2078-18
March 2018
The contents of this report reflect the views of the authors, who are responsible for the facts and the accuracy of the information presented herein. This document is disseminated under the sponsorship of the U.S. Department of Transportation’s University Transportation Centers Program in the interest of information exchange. The U.S. Government assumes no liability for the contents or use thereof.

ii
Acknowledgements
This report is a final research report for the Electric Vehicle and Wireless Charging Laboratory project of the Electric Vehicle Transportation Center (EVTC) at the University of Central Florida (UCF). The Electric Vehicle Transportation Center is a University Transportation Center funded by the Research and Innovative Technology Administration of the U.S. Department of Transportation. The EVTC is a research and education center whose projects prepare the U.S. transportation system for the influx of electric vehicles into a sustainable transportation network and investigate the opportunity these vehicles present to enhance electric grid modernization efforts. The EVTC is led by UCF's Florida Solar Energy Center partners from UCF’s Departments of Electrical Engineering and Computer Science and Civil, Environmental and Construction Engineering, the University of Hawaii, and Tuskegee University.
The objective of the Electric Vehicle and Wireless Charging Laboratory project was to purchase equipment and to conduct wireless charging of EVs within an FSEC laboratory facility. The work was conducted by William Wilson of the Florida Solar Energy Center.
1
Final Research Project Report
Electric Vehicle and Wireless Charging Laboratory
Richard Raustad William Wilson
Electric Vehicle Transportation Center March 2018
1. Summary
Wireless charging tests of electric vehicles (EV) have been conducted at the EVTC Wireless Laboratory located at the Florida Solar Energy Center, Cocoa, FL. These tests were performed to document testing protocols, evaluate standards and evaluate operational related wireless charging characteristics. The presented results give the charging efficiency of a Plugless wireless charger of 3.3 kW rated input power operating at 20 kHz resonant frequency. The results show a maximum charging efficiency of 94% at about 19 cm (7.5 in) of vertical separation. The electric and magnetic fields emanating from the transmitter were measured with and without the unit installed on the vehicle. Measurements after the unit was installed indicate a peak electric field of 430 V/m (0.43 kV/m) and a peak magnetic field of 57 µT at the rear of the vehicle near the installed location. Measurements at the side of the vehicle indicate a much lower electric field strength below 2 V/m along the entire side length of the vehicle. 2. Introduction Wireless charging has the potential to allow EVs to operate in an equivalent fashion as conventional internal combustion engine (ICE) vehicles for two reasons:
• Wireless chargers located within a roadway can provide continuous vehicle charging, thus, eliminating the EV range anxiety problem and need for large battery capacities.
• Wireless charging gives a no effort option in the ability to re-charge at any location which is so equipped.
In order to prepare and plan for a future wireless charging environment, the EVTC equipped and conducted laboratory experiments of wireless charging. The lab staff investigated the operation of a wireless charging product and compared measured data to SAE standards. The wireless charger was then installed on a Nissan Leaf laboratory vehicle. The results of the lab tests follow. 3. Results
The EVTC lab staff investigated wireless charging through lab experiments that measured the wireless charger efficiency and the electric and magnetic field emissions at varying heights and offset distances. These tests were performed prior to the publication of the Society of

2
Automotive Engineers Technical Information Report Standard J2954 - Wireless Power Transfer for Light-Duty Plug-in / Electric Vehicles and Alignment Methodology and therefore do not reflect the actual procedure described in this Standard1. Figure 1 shows the simple test stand that was assembled to fix the height of the receiver to the transmitter. The system was tested prior to installation on the vehicle to gain information on unobstructed emissions from the unit under test. The 2 wiring harnesses connected to the wireless receiver were connected to the J1772 plug external to the vehicle (orange) and the on-board diagnostics (OBD) connector inside the vehicle (black).
Figure1.SimpleTestStandforTestingPluglessWirelessSystemEmissions
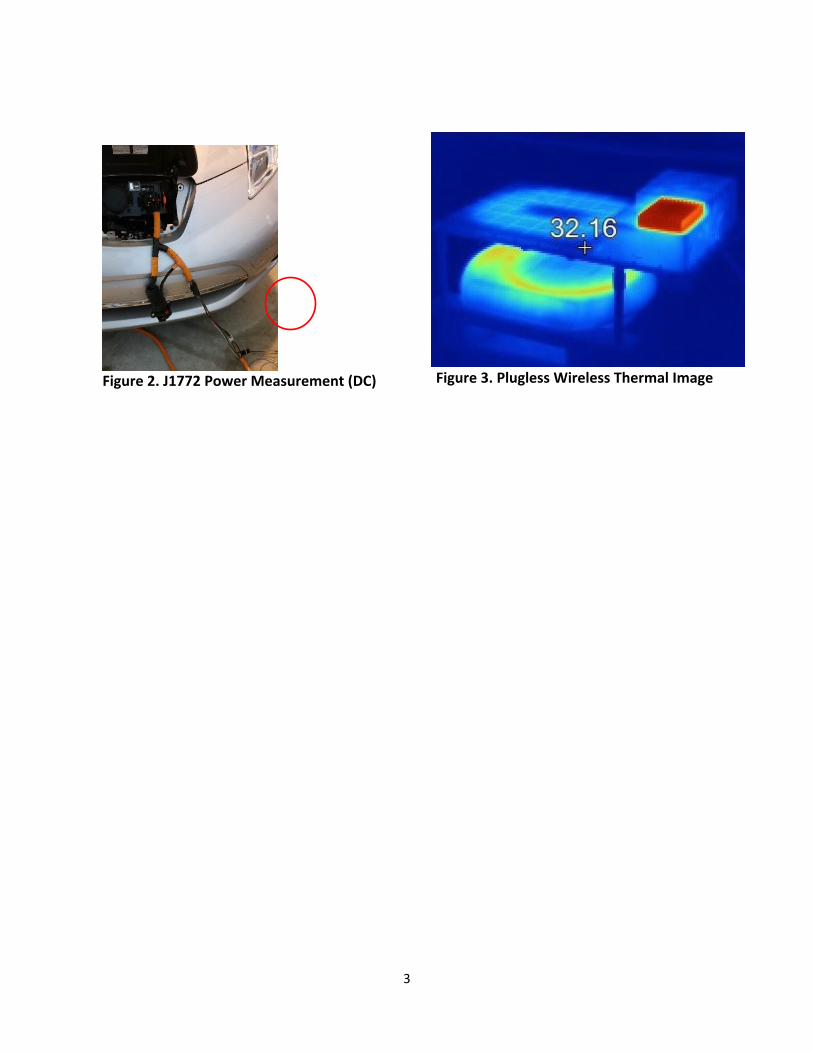
Technical specifications are shown in Table 1. The temporary connection of the input harness to the J1772 vehicle plug is shown in Figure 2. A direct current (DC) Hall Effect current transformer was installed on the J1772 power line at the vehicle interface (lower right of figure). A thermal imaging camera shows the heat signature of the Plugless wireless EV charging station under test in Figure 3. Figure 4 provides dimensions of the unit under test. Table1.PluglessPowerWirelessTechnicalSpecifications,D50044-RevA,2015EvatranGroupCharging Power Output 3.3 kW (cont.) Parking Pad Drive Over 1100 lbs. (500 kg) Rated Input Power 3.75 kW (cont.) Enclosure NEMA 3R/NEMA 4 Input Voltage 208-240 VAC Operating Temperature -18° to 50°C (-0° to 122°F) Minimum Breaker Size 30 A, 2 pole Station Weight 45 lbs. (20 kg)
3
Figure2.J1772PowerMeasurement(DC)
Figure3.PluglessWirelessThermalImage

4
3.1 Charger Efficiency Results A Campbell Scientific CR10 data logger was configured to measure the energy transfer efficiency of the Plugless wireless charger system. The alternating current (AC) input of the Plugless controller was monitored using an Ohio Semitronics W-062B energy meter wired for single-phase power/energy measurement. This meter measures both instantaneous power in watts and energy in watt-hours. AC input voltage was 208 VAC. The output of the wireless receiver is 220 VDC which is directly connected to the EV onboard charger through the J1772 charging connector. Measurements were made at different vertical spacing between the transmitter and the receiver. The maximum and minimum spacing is limited by the Plugless control system in order to maintain an effective power coupling. The wireless system will not initiate the charging sequence if the receiver is too close or too far away from the transmitter. The range of acceptable heights was determined to be 14.5 cm to 20.5 cm. At 14 cm and 21 cm the system would either not start or would quickly drop the charge transfer. Height was recorded as the distance from the bottom of the transmitter (i.e., finished floor) to bottom of the receiver (i.e., lowest part of receiver when installed).
1.3”(32mm) 5.0”
(127mm)
18.0”(457mm)
30.0”(762mm)
22.0”(559mm)
2.7”(68.5mm)
18.5”(470mm)
Figure4.PluglessWirelessChargerDimensions(Source:PluglessPower.com)

5
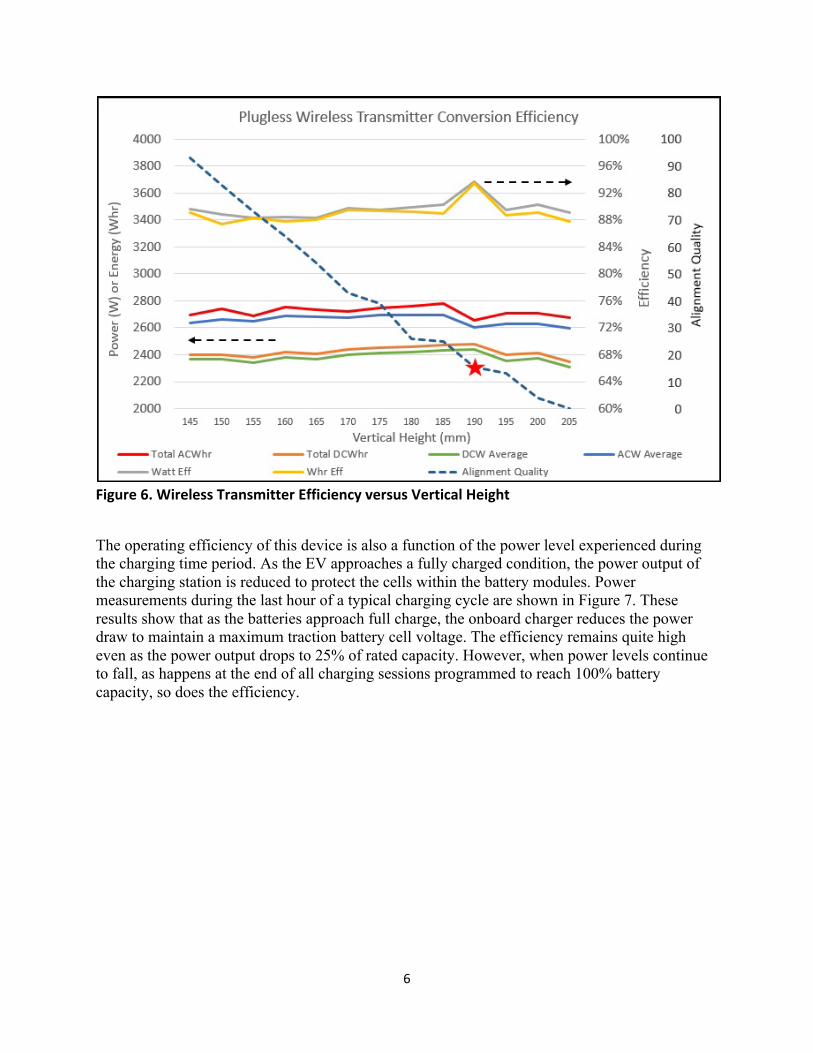
The efficiency testing of the 3.3 kW Plugless Power wireless charging station was conducted by monitoring of the AC input and DC output power/energy of the unit’s transmitter/receiver pair. For these tests, losses through the vehicle’s on-board AC-DC converter were not measured. Measurements were collected at 1-minute intervals over a minimum of 1-hour and the data were then averaged. The results show the wireless system efficiency to be greater than 88% at all heights (see Table 1 where rated efficiency is reported as 3.3 kW out / 3.75 kW in = 88%), measured between 145 mm (5.7 in) and 205 mm (8.1 in) from finished floor. A peak efficiency was measured at 93.6% at a height of 190 mm (7.5 in.). The results of the efficiency tests are shown in Figure 3. Both energy and power were measured with similar profiles for the resulting efficiency.
The Plugless wall-mounted power controller includes a Plugless symbol (lit means power is applied), an outer lighted ring, alignment arrows and a 2 digit LED to show the ‘alignment quality’ of the wireless receiver with respect to the transmitter as shown in Figure 5. A value around 15 is considered optimum by the manufacturer. The alignment arrows below the green lit Plugless symbol light up while the vehicle is being parked and are used to guide the alignment of the vehicle with the wireless charging pad (transmitter). The outer green circle around the Plugless symbol lights up when the vehicle is properly aligned. The outer circle flashes blue while the vehicle is charging. The optimum alignment quality was attained at a height of 190 mm (red star in Figure 6). The measurement at this height was repeated because of the obvious increase in measured efficiency. The two measurements, at 190 mm, of 92.6 and 94.8, and 92.4 and 94.4 for Watt (W) and Watt-hour (Whr) efficiency, respectively, were averaged to yield 93.7 and 93.4 in this figure.
Figure5.PluglessController
6
Figure6.WirelessTransmitterEfficiencyversusVerticalHeight
The operating efficiency of this device is also a function of the power level experienced during the charging time period. As the EV approaches a fully charged condition, the power output of the charging station is reduced to protect the cells within the battery modules. Power measurements during the last hour of a typical charging cycle are shown in Figure 7. These results show that as the batteries approach full charge, the onboard charger reduces the power draw to maintain a maximum traction battery cell voltage. The efficiency remains quite high even as the power output drops to 25% of rated capacity. However, when power levels continue to fall, as happens at the end of all charging sessions programmed to reach 100% battery capacity, so does the efficiency.

7
Figure7.PowervsEfficiencyduringandatEndofCharge
3.2 Electric and Magnetic (EM) Field Measurements
A Plugless wireless charger has been used to measure the electric and magnetic fields emanating from the transmitter. To perform the testing, a frame device was constructed which allowed multiple repeated measurements of the electric and magnetic fields around the charging system by slowly moving a sensor through the EM field while data is recorded at about 1.5 second intervals. The EM field measurements were taken with a Narda EHP-50D electric and magnetic field probe and by using the accompanying software for collecting and reporting the data. The measurements were numerous which required the construction of a scanning platform in order to collect multiple repeated measurements semi-automatically. The collected measurements are visually presented. To perform the EM tests, the wireless charging system was tested before attaching to the vehicle in order to allow field measurements to be taken from any side. The transmitter was also raised off the floor to minimize any induced current effects from concrete reinforcement mesh or rebar in the concrete slab.
8
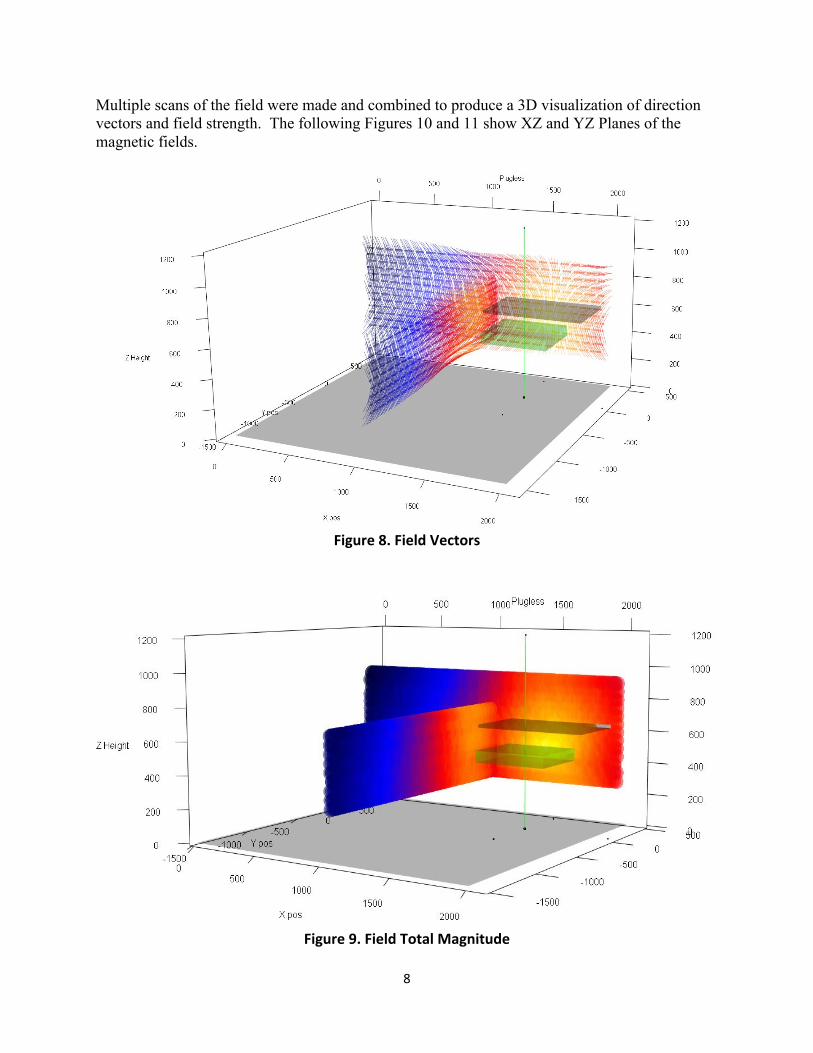
Multiple scans of the field were made and combined to produce a 3D visualization of direction vectors and field strength. The following Figures 10 and 11 show XZ and YZ Planes of the magnetic fields.
Figure8.FieldVectors
Figure9.FieldTotalMagnitude
9
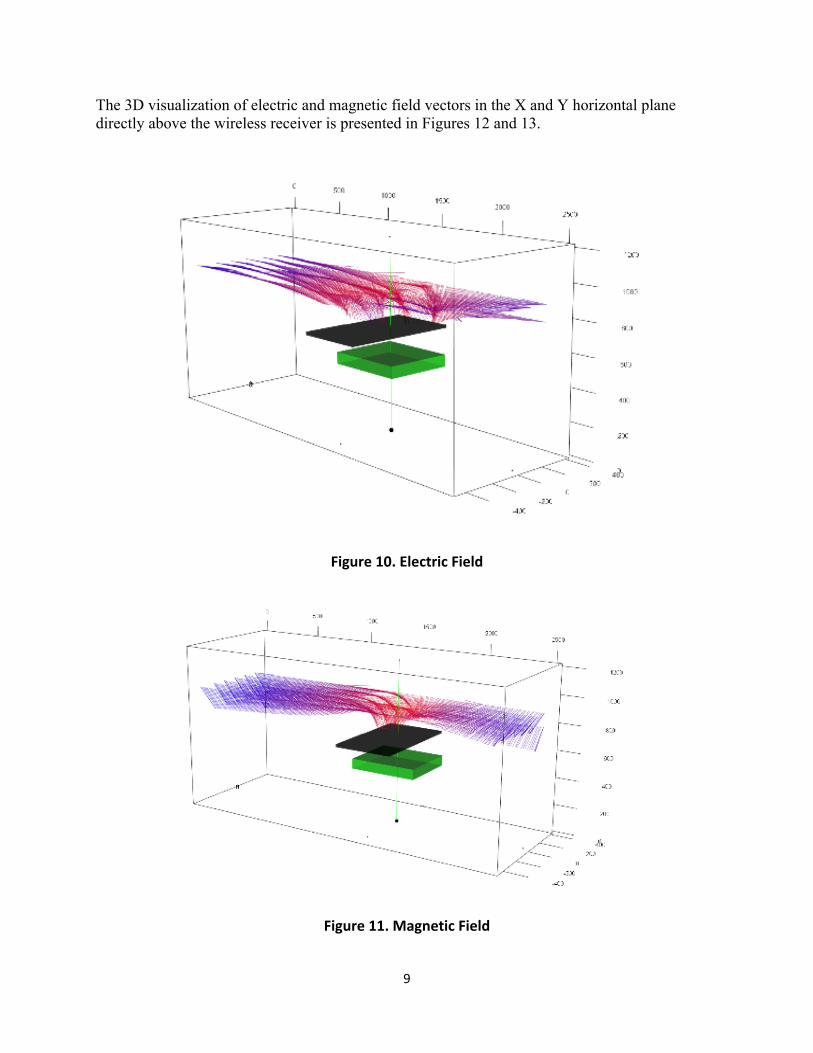
The 3D visualization of electric and magnetic field vectors in the X and Y horizontal plane directly above the wireless receiver is presented in Figures 12 and 13.
Figure10.ElectricField
Figure11.MagneticField
10
SteppermotoractuatedEM
emissionssensor
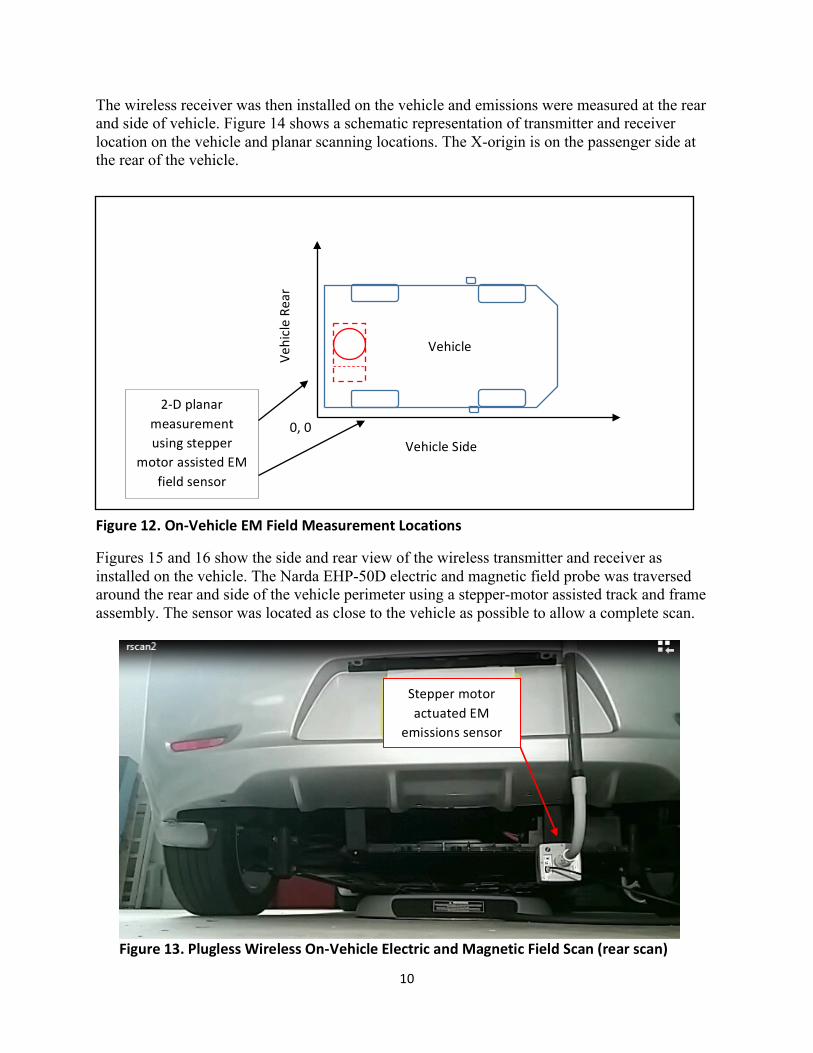
Figure13.PluglessWirelessOn-VehicleElectricandMagneticFieldScan(rearscan)
The wireless receiver was then installed on the vehicle and emissions were measured at the rear and side of vehicle. Figure 14 shows a schematic representation of transmitter and receiver location on the vehicle and planar scanning locations. The X-origin is on the passenger side at the rear of the vehicle.
Figures 15 and 16 show the side and rear view of the wireless transmitter and receiver as installed on the vehicle. The Narda EHP-50D electric and magnetic field probe was traversed around the rear and side of the vehicle perimeter using a stepper-motor assisted track and frame assembly. The sensor was located as close to the vehicle as possible to allow a complete scan.
Vehicle
Figure12.On-VehicleEMFieldMeasurementLocations
2-Dplanarmeasurementusingstepper
motorassistedEMfieldsensor
0,0
VehicleRe
ar
VehicleSide
11
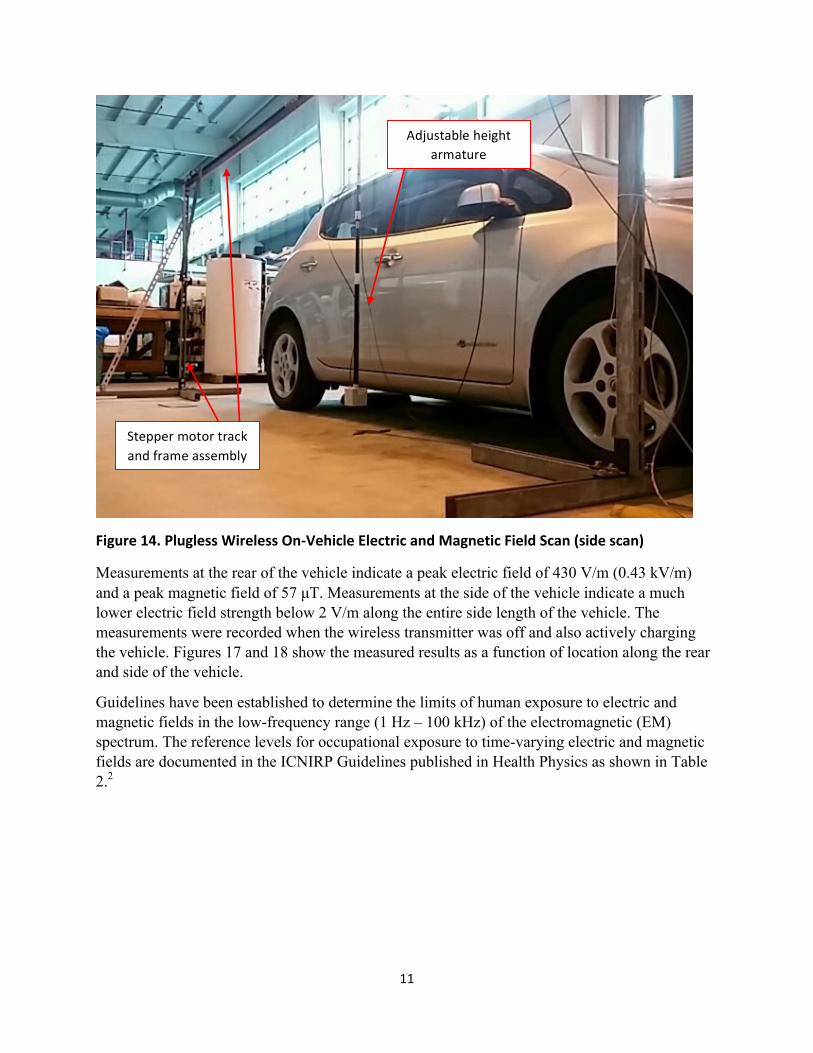
Figure14.PluglessWirelessOn-VehicleElectricandMagneticFieldScan(sidescan)
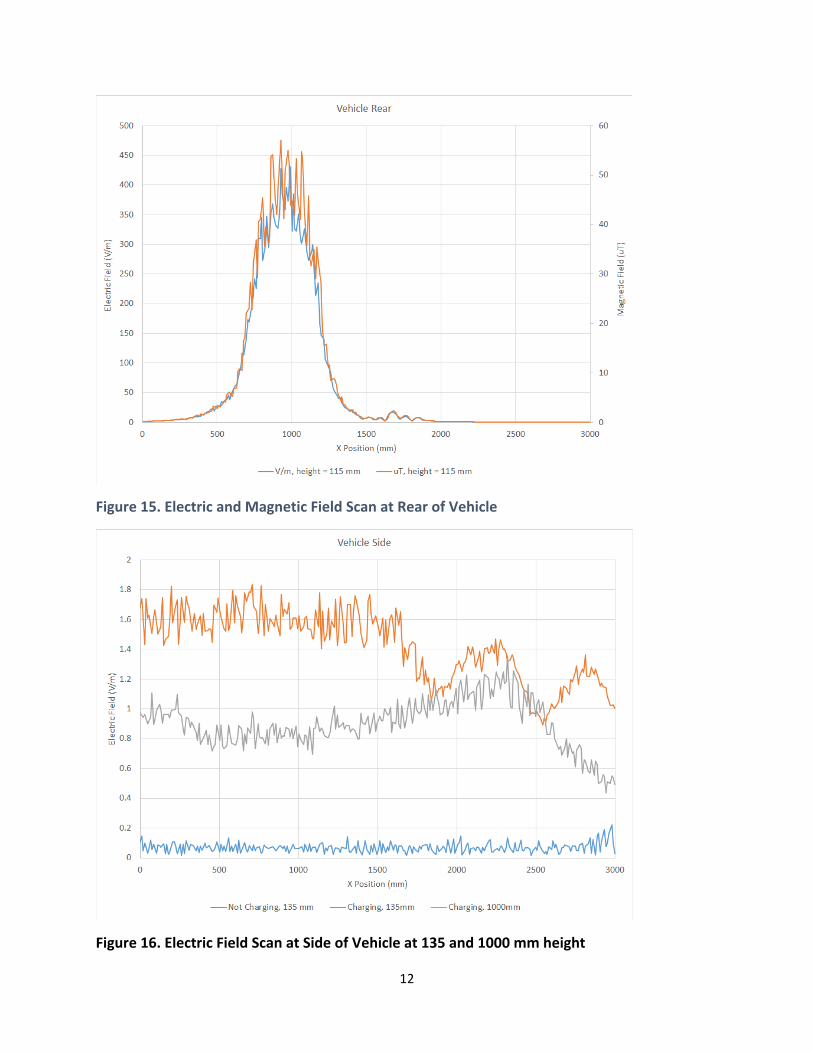
Measurements at the rear of the vehicle indicate a peak electric field of 430 V/m (0.43 kV/m) and a peak magnetic field of 57 µT. Measurements at the side of the vehicle indicate a much lower electric field strength below 2 V/m along the entire side length of the vehicle. The measurements were recorded when the wireless transmitter was off and also actively charging the vehicle. Figures 17 and 18 show the measured results as a function of location along the rear and side of the vehicle.
Guidelines have been established to determine the limits of human exposure to electric and magnetic fields in the low-frequency range (1 Hz – 100 kHz) of the electromagnetic (EM) spectrum. The reference levels for occupational exposure to time-varying electric and magnetic fields are documented in the ICNIRP Guidelines published in Health Physics as shown in Table 2.2
Steppermotortrackandframeassembly
Adjustableheightarmature
12
Figure15.ElectricandMagneticFieldScanatRearofVehicle
Figure16.ElectricFieldScanatSideofVehicleat135and1000mmheight

13
Table2.ICNIRPGuidelinesforLimitingExposuretoTime-VaryingEMFields
These field strength exposure limits for time-varying EM fields were used as a reference to measurements of wireless charger EM emissions as shown in Figure 17.
Figure17.PluglessWirelessEMEmissionsResults
0.001
0.01
0.1
1
10
100
1 10 100 1,000 10,000 100,000 1,000,000 10,000,000
ElectricField(kV/m)
Frequency(Hz)
OccupaTonalExposure GeneralPublicExposure
Post-InstallRear Post-InstallSide
J2954NominalOperaTngFrequency J2954NominalOperaTngFrequency
0.00001
0.0001
0.001
0.01
0.1
1
1 10 100 1,000 10,000 100,000 1,000,000 10,000,000
Magne
TcField(T
)
Frequency(Hz)
OccupaTonalExposure GeneralPublicExposure
Post-InstallRear J2954NominalOperaTngFrequency
J2954NominalOperaTngFrequency

14
3.3 Harmonic Distortion
Limitations of harmonics components of electric equipment are described in IEC 61000-3-2.3 This standard provides guidance for limitations of harmonic order frequency currents from various electric equipment having less than 16 amps phase current. Class A covers 3-phase equipment, household appliances, ballast dimmers, audio equipment and other equipment not covered under Class B-D. The Plugless Power wireless charger is a Class A device. Class B includes portable tools. Class C includes lighting and Class D includes personal computers and television receivers. High power wireless chargers (> 1 kW) are exempt from this standard, however, a comparison of suggested limits with those measured in the laboratory is useful. The Standard limits through harmonic order 9 are shown in Table 3. The Standard covers harmonic orders up to 40, however, orders higher than 9 have progressively smaller limits and usually do not add significantly to the total harmonic distortion (THD). Also, for electric equipment with symmetrical current waveforms (i.e., same positive shape as negative), the even harmonics have very small contribution to the total harmonic distortion. Additionally, the triplet harmonics (i.e., n = 3, 9, 15, etc.) are of great importance since currents for these frequencies are additive on the neutral conductor which can lead to higher neutral currents in 3-phase electrical systems. This can lead to overheating of the neutral conductor if not properly considered (i.e., neutral conductors are typically oversized when harmonics are anticipated in an electrical system). For the remainder of the discussion the even harmonics are not of concern, the odd harmonics are pertinent for this Class A equipment, and the triplet harmonic order 3 limit at 2.3 amps is noted.
Table3.IEC61000-3-2HarmonicorderCurrentLimitsbyClass
EquipmentClass
HarmonicOrderCurrentLimit(A)n=2A 3 4 5 6 7 8 9
A 1.08 2.3 0.43 1.14 0.3 0.77 0.23 0.4B 1.62 3.45 0.64 1.71 0.45 1.15 0.34 0.6CB 2 30*λC - 10 - 7 - 5D - 2.3 - 1.14 - 0.77 - 0.4
Notes: A–multipleofthefundamentalfrequency(i.e.,for60Hz,2=120Hz,3=180Hz,etc.) B–expressedasapercentageoftheinputcurrentatthefundamentalfrequency C–λisthepowerfactorofthecircuit
The total harmonic distortion of the Plugless Power 3.3 kW wireless charger was measured in the laboratory during an active charging session as shown in Figure 20. In the following figures A-F,
C
Figure18.TotalHarmonicDistortionmeasurementsofPluglessPowerwirelesscharger

15
the voltage and current waveforms are shown on the top row from higher to lower power from left to right (A-C). On the bottom row, the first figure (D) is the voltage total harmonic distortion measured at 1.1%. The next two figures (E and F) represent the current total harmonic distortion of 156% and 147%, at 31 amps and 25 amps, respectively, as the wireless charging power level reduced at the end of charge. The voltage wave shape is nearly sinusoidal with very little distortion noticeable at the very top and bottom of the wave shape when the current is non-zero. Since the voltage wave shape is very near sinusoidal, the voltage harmonic distortion is minimal at 1.1%. The most notable in the figures is the non-sinusoidal current wave shape and higher order current harmonic distortion (Figures 20-E and 20-F). Of particular note is the magnitude of current harmonic orders 3 – 13. The harmonic current at 180 Hz (i.e., harmonic order 3) is of nearly the same magnitude as the current at the fundamental frequency (60 Hz, a.k.a. harmonic order 1). The magnitudes of the currents at harmonic orders 3 – 13 exceed the recommended limits in the Standard for low power equipment, however, recall that this device is exempt as specified in the Standard.
Although this device is single-phase, it is connected to a commercial 3-phase electrical system. If more of these devices are connected to the same electrical system, special consideration should be given to the wire sizes selected, especially for the neutral conductor since as current harmonics increase, the current on the neutral conductor also increases. The power total harmonic distortion was measured at 1.3%. Given that the voltage distortion was minimal, the higher order current harmonics did not cause a significant increase in total power harmonic distortion. Described another way, if power = voltage x current, and the voltage harmonic magnitude at higher frequencies is near 0, then the power at that frequency is also near zero.
4. Impacts/Benefits
Wireless electric vehicle charging simplifies EV battery charging and will allow vehicle owners to simply park their vehicle to charge the battery. The investigation of using EV traction batteries as distributed energy resources for improving building and utility electric grid efficiency and quality will enhance EV usage for vehicle owners, fleet operators and utility companies.
5. Conclusions The electric and magnetic emissions from one wireless charging station was measured and was found to be within the expected maximum limits as specified by the ICNIRP Guidelines. In the future, emissions from wireless charging equipment are not expected to exceed recommended limits since proper placement and/or shielding can significantly reduce or at least mitigate emissions. On the other hand, the electrical characteristics of these devices is seemingly a more important focus of attention. This study highlighted that harmonics from this high-power equipment class, specifically current harmonics, may be more troublesome in the future as more electric vehicle charging stations are installed to service the growing number of EVs. The measured harmonics show very high current harmonics which leads to higher than expected neutral conductor current. Whether these results indicate a potential problem for electric utility companies or that building owners need to be more attentive to electrical capacity infrastructure is being debated. Consideration of phase and

16
neutral currents for large scale installations of EV charging equipment should be carefully considered during the design phase of construction. 6. References 1. SAE J2954 Wireless Power Transfer for Light-Duty Plug-In/Electric Vehicles and Alignment
Methodology, Society of Automotive Engineers, May 2016. 2. ICNIRP Guidelines for Limiting Exposure to Time-Varying Electric and Magnetic Fields (1
Hz-100 kHz), International Commission on Non-Ionizing Radiation Protection, Health Physics 99(6):818-836, 2010.
3. IEC 61000-3-2 Electromagnetic compatibility (EMS) – Part3-2: Limits for harmonic current emissions (equipment input current ≤16 A per phase)