electoral cycles in electricity losses in indiabrianmin/ep_theft_20130308_nd.pdfthe home of mulayam...
TRANSCRIPT

Electoral Cycles in Electricity Losses in India
Brian Mina, Miriam Goldenb
aCorresponding AuthorUniversity of Michigan
Department of Political Science505 S. State St
Ann Arbor, MI 48103 USATel: 734-615-4708
Email: [email protected] of California, Los Angeles
Department of Political Science4289 Bunche Hall
Box 951472Los Angeles, CA 90095 USA
Abstract
A third of electricity in India is lost each year, where losses refer to powerthat is supplied but not billed. Utilizing data from the power corporationof Uttar Pradesh, India’s most populous state, we study the politics of elec-tricity losses. Examining annual data over four decades, we document thatstatewide electricity losses tend to increase in periods immediately prior tostate assembly elections. Drawing upon more fine-grained and disaggregateddata since 2000, we observe higher line losses leading up to the 2002 and2007 elections, and show that the incumbent party was more likely to retainthe assembly seat as line losses in the locality increased. We interpret theseresults as corroboration that political parties deliberately permit users toaccess unbilled electricity in a context of chronically inadequate supply. Po-litical factors appear to affect line losses in ways that technical and economicfactors alone cannot explain.
Keywords: Power theft, Line losses, Politics

1. Introduction
In many developing countries, electricity theft and line losses are a costly
burden on the power sector (Depuru et al., 2011). Transmission and dis-
tribution (T&D) losses are estimated to cost India’s economy 1.5% of GDP
each year, aggravating chronic power shortages and straining the precarious
finances of its public electricity providers (Bhatia and Gulati, 2004). In In-
dia’s largest state, Uttar Pradesh, 29% of all power sent out from 1970 to
2010 was never billed for, presumably lost to theft, billing irregularities, and
technical losses. This cumulative loss amounts to some 300 million megawatt-
hours (MWh), enough to power all of Italy or South Africa for a year. More-
over, rates of line loss in Uttar Pradesh are higher today than they were
in the 1970s despite numerous policy interventions, regulatory reforms, and
increased efforts to prosecute power theft.
We examine data from Uttar Pradesh to demonstrate that variations in
electricity losses are related to the timing of statewide elections. The focus of
our study is on line losses — electricity that is supplied but for which bills are
not issued. Some of these losses are technical in nature, including resistive
losses from high voltage transmission, and variations in the quality of electri-
cal infrastructure.1 The remaining (majority) line losses are widely assumed
to reflect inefficiencies in billing, meter tampering, illegal connections, and
unauthorized excess use by flat rate consumers. Yet such explanations do not
fully explain why rates of line loss vary over time within the same geographic
1Such technical losses range from 1–2 percent in efficient systems to as high as 9–12percent in less efficient systems, according to Smith (2004, p. 2070). Line losses in Indiaare much larger than this, on the order of 30 percent.
2

unit. We present evidence that the cyclicality of losses are consistent with
patterns of political manipulation of the power sector associated with election
periods. Given the scarcity of electrical power, its value to consumers, and
the central role of politicians and public officials in its provision, electricity
is a potentially valuable weapon in electoral competition.
We report on statewide trends from 1970 to 2010 and examine more
highly disaggregated data on electrical power distribution, billing, and line
losses from 2000 to 2009. The main results of our analysis are as follows.
First, the data show that power theft and line losses in Uttar Pradesh are
large in magnitude. Second, line losses are substantially higher in periods
immediately prior to state elections. Third, we extend this line of argument
and document that the incumbent political party is more likely to retain
the assembly seat where power theft is more extensive. We interpret these
results as corroboration of the theory that electricity is used for political gain.
Our results suggest that a part of line losses can be explained by political
motivations rather than only by technical and economic factors.
Our paper is related to studies of the political business cycle in subna-
tional units (examples include Baleiras and Costa (2004), Drazen and Eslava
(2005), Mouriuen (2007)), which grew out of studies of the political business
cycle at the national level (Nordhaus, 1975; Tufte, 1980). Various papers
show that municipal level elected officials manipulate aspects of the local
political economy prior to elections in order to improve their chances of re-
election. Of particular relevance is Khemani (2004), which documents state-
level electorally sensitive targeting of advantage to special interests in India.
In a paper especially related to this one, Badiani and Jessoe (2011) show
3
that the price subsidies for electricity that go to Indian agriculture increase
significantly in the year prior to an election.
A large literature on political corruption is also relevant (Rose-Ackerman,
1999; Johnston, 2006; Treisman, 2007), particularly those showing that cor-
ruption rates are correlated with the reelection incentives of politicians (Fer-
raz, 2006). The only studies of which we are aware that study energy theft
as a problem of corruption are Smith (2004) and Joseph (2010). The first
is a cross-national study of T&D losses in electricity transmission linking
it to corruption as well as weaknesses in accountability and institutional
performance. The second reports that T&D losses across Indian states are
associated with decisions by firms to establish their own power-generating
capacity, exiting the state provider.2
2. Electricity in Uttar Pradesh
Uttar Pradesh is India’s largest state, with a population of 190 million
people in an area about half the size of California. According to World Bank
estimates, it is home to 8 percent of the world’s poor. Electricity transmis-
2Our study also draws on a large literature on the politics of public goods provisionand a small literature on the political economy of electricity provision. The former isexceedingly vast; for a relevant review, see Golden and Min (Forthcoming 2013). The mainresult of the distributive politics literature is to underscore that public officials use electoralcriteria in the allocation of government goods and services rather than utilizing strictlywelfare maximizing criteria. There is considerable national and local variation in howthis occurs, however, in part because features of electoral competition differ. As regardselectricity provision, Brown and Mobarak (2009) show that in poorer countries, democraticpolitical institutions shift electricity provision from the industrial sector to households,whereas authoritarian institutions favor industry. Min (2010) documents partisan effectsin electricity provision in Uttar Pradesh. Other studies, including Bernard et al. (1997),show that electricity prices may be politically manipulated for electoral ends, in line withthe general distributive politics theme.
4

sion and distribution in the state is controlled by the Uttar Pradesh Power
Corporation Ltd (UPPCL), formed in 2000 as a result of power sector reforms
and the unbundling of India’s state electricity boards. Electricity provision
is a state-level responsibility in India’s federal structure and the UPPCL is a
state-owned entity. Its workers are state employees and its key leadership po-
sitions are filled by appointment by the state government. Politically, Uttar
Pradesh has 403 single-member state assembly constituencies and elections
are held approximately every five years.
We report trends in statewide losses from 1970 to 2010 and then focus our
analysis on finer geographically disaggregated data from 2000 to 2009. Our
primary outcome variable is line losses, measured as the share of electrical
power that is distributed from the power substation busbar but not billed
for. The power company reports connected load and billing data at the level
of the geographic service division, which are units specific to the UPPCL.
The state of Uttar Pradesh was divided into 193 divisions at the end of 2009.
When the number of customers within a division gets sufficiently large, the
division is split. As a result, the number of divisions at the beginning of our
time frame is smaller than in 2009.
To investigate the political correlates of power theft, we merged data on
state assembly elections with UPPCL data on electricity transmission and
billing. However, there is no way to directly map the 403 assembly con-
stituencies to UPPCL’s 190+ geographic service divisions, since information
on service division boundaries is not publicly available. Each assembly con-
stituency and UPPCL service division can, however, be precisely located
within a single administrative district, a unit roughly comparable to a U.S.
5
county. We can thus aggregate data from both other levels to the adminis-
trative district level, of which there are 70 in Uttar Pradesh.
Given the mismatch in the geographic levels between our power loss vari-
ables and our political variables, there is no single optimal way to merge
the data together for analysis. One option is to aggregate all the data into
larger units, computing averages and totals at the level of the 70 adminis-
trative districts. However, we lose a lot of information doing this. We can
also create a separate dataset at the assembly constituency level (but with
imputed electricity data drawn from the UPPCL service zone) and another
at the UPPCL service division level (but with imputed electoral data from
the assembly constituency). These alternative scenarios lead us to construct
three datasets, one at the administrative district level (n = 70), a second at
the UPPCL service division level (nupto193), and a third at the assembly
constituency level (n = 403). We report results using these alternate data
setups.
3. Descriptive Analysis
3.1. Geographic Variations in Power Loss
There is wide variation in electrical line losses across Uttar Pradesh. In
2005, for example, a staggering two-thirds of all power in the Mainpuri dis-
trict was not billed for. Meanwhile, in that same year, line losses were lowest
(just under 13 percent) in the Sonbhadra district.3 Line loss is, as observed
in Figure 1, greatest in the western part of the state. The western part of
3Sonbhadra is sparsely populated and home to several of India’s largest coal-basedthermal power plants.
6

Figure 1: District-level Line Losses Across Uttar Pradesh, 2005.
Source: UP Power Corporation.
UP is more developed economically and more intensive irrigation by means
of electric tubewells, a significant driver of electricity use.
Table 1 lists the districts with the highest average line losses between
2000 and 2009. On average, half of all power supplied in the Hathras district
(now known as Mahamaya Nagar) could not be accounted for, higher than
any other district in the state. Among the other leading districts, Etawah is
the home of Mulayam Singh Yadav, leader of the Samajwadi Party and Chief
Minister of the state from 2003 to 2007. Mainpuri, the district that ties for
7

Table 1: Highest Line Losses by District, 2000–09 Average
District Line losses (%) Energy Supplied (GWh) Energy Billed (GWh)Hathras 49.9 472.5 192.7Mainpuri 49.9 241.7 118.5Jhansi 45.8 662.2 364.8Jalaun 45.7 419.2 231.9Etawah 45.4 321.8 173.5Bulandshahr 43.8 933.0 526.5Saharanpur 42.8 1233.9 709.4Firozabad 42.5 675.5 395.7Rampur 42.3 370.7 216.6Moradabad 40.5 964.1 573.2
first place in line losses, is also a stronghold of the Singh Yadav family. The
data reported in Table 1 suggests that line losses may be affected by political
influence.
The districts with the lowest line losses on average during our study period
are listed in Table 2. At the top of the list is Gautam Buddha Nagar, home to
the bustling outsourcing hub of Noida, just east of New Delhi. The efficiency
of collections in this district may reflect UPPCL’s greater willingness to bill
commercial customers, including many foreign-owned entities.
3.2. Variations in Line Loss Over Time
In Figure 2a, we graph annual line losses in Uttar Pradesh as a percent
of total electricity supplied in the state from 1970 through 2010. Overall,
line losses are very high. By comparison, 2009 data from the International
Energy Agency show that T&D losses were 5 percent in China, 15 percent
in Argentina, and 16 percent in Kenya. More disturbingly, line losses in
Uttar Pradesh are higher today than in the past, despite numerous regulatory
reforms aimed at strengthening India’s power sector.
8

(a) Statewide Losses as Percent of Total Electricity Supplied
(b) Statewide Line Losses and Electricity Supplied
Figure 2: Statewide Line Losses in Uttar Pradesh (1970–2010).Source: Uttar Pradesh Power Corporation Ltd., Statistics at a Glance, various years.
9
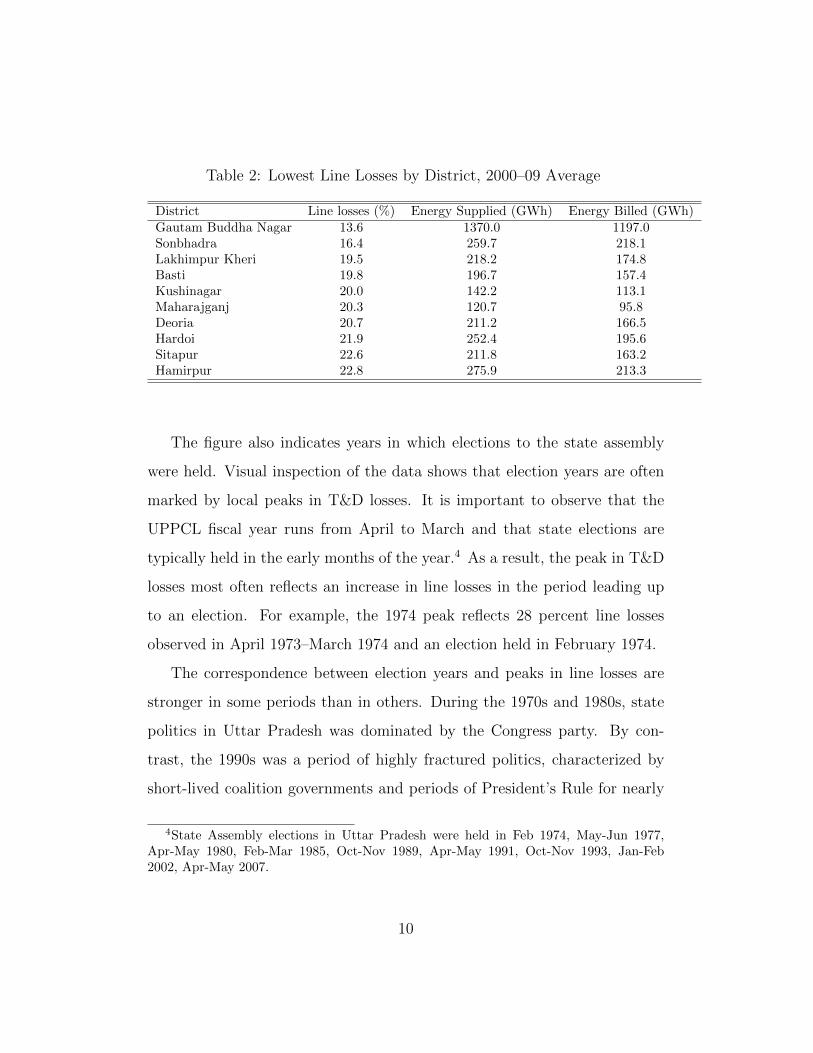
Table 2: Lowest Line Losses by District, 2000–09 Average
District Line losses (%) Energy Supplied (GWh) Energy Billed (GWh)Gautam Buddha Nagar 13.6 1370.0 1197.0Sonbhadra 16.4 259.7 218.1Lakhimpur Kheri 19.5 218.2 174.8Basti 19.8 196.7 157.4Kushinagar 20.0 142.2 113.1Maharajganj 20.3 120.7 95.8Deoria 20.7 211.2 166.5Hardoi 21.9 252.4 195.6Sitapur 22.6 211.8 163.2Hamirpur 22.8 275.9 213.3
The figure also indicates years in which elections to the state assembly
were held. Visual inspection of the data shows that election years are often
marked by local peaks in T&D losses. It is important to observe that the
UPPCL fiscal year runs from April to March and that state elections are
typically held in the early months of the year.4 As a result, the peak in T&D
losses most often reflects an increase in line losses in the period leading up
to an election. For example, the 1974 peak reflects 28 percent line losses
observed in April 1973–March 1974 and an election held in February 1974.
The correspondence between election years and peaks in line losses are
stronger in some periods than in others. During the 1970s and 1980s, state
politics in Uttar Pradesh was dominated by the Congress party. By con-
trast, the 1990s was a period of highly fractured politics, characterized by
short-lived coalition governments and periods of President’s Rule for nearly
4State Assembly elections in Uttar Pradesh were held in Feb 1974, May-Jun 1977,Apr-May 1980, Feb-Mar 1985, Oct-Nov 1989, Apr-May 1991, Oct-Nov 1993, Jan-Feb2002, Apr-May 2007.
10

all of 1993 and from October 1995–March 1997. Following the rise of the
Bharatiya Janata Party (BJP) in the late 1990s, political power has since
consolidated around the lower-Caste Bahujan Samaj Party (BSP) and the
Samajwadi Party (SP). Strikingly, electoral peaks in line losses were most
notable during the era of Congress dominance and look to have re-emerged
in the last decade of BSP and SP rule. We interpret this to suggest that
parties are most capable of facilitating higher line losses when they enjoy
firm control of the state governing apparatus. The unusual spike in line loss
around 2000 coincides with significant reorganization of the power corpora-
tion and the creation of the new state of Uttaranchal out of the northern hill
districts of UP, and may be an artifact of these disruptions.
Data also suggest that peaks in line losses are not a result of increased
power generation. We can see this in the data depicted in Figure 2b, which
shows that electricity has increased most smoothly since 1970. We interpret
these patterns to suggest that line loss peaks do not simply reflect more elec-
tricity being supplied around elections, but rather lower levels of billing to
consumers for the electricity they consume in those periods. Such a pattern
seems consistent with the technical constraints facing elected leaders and par-
ties in managing the power supply. While it may be difficult for politicians
to increase the volume or number of hours of electricity supplied to their con-
stituents, no purely technical obstacle limits their ability to reduce billing or
collection efforts during electorally critical periods. We explore this connec-
tion between line losses and the electoral cycle in UP more systematically
below.
11

4. Statistical Analyses of Electoral Cycles and Line Loss
Using statistical tools, we investigate two questions: (1) whether line loss
is affected by the occurrence of an election to the State Assembly; and (2)
whether power theft pays politically; that is, whether political incumbents
benefit electorally from power theft. The first hypothesis examines whether
the power corporation, presumably acting under unobserved pressure from
elected politicians, permits users more unbilled electricity in the year (ap-
proximately) prior to an election. The second examines whether the political
party holding the state assembly seat is more likely to retain the seat as a
result of the election where more power is unbilled prior to it. The second
hypothesis helps us understand the first: because there are electoral bene-
fits to allowing users more unbilled electricity in the run-up to the election,
state assembly members have strong incentives to pressure power corporation
officials to permit that. We cannot observe directly the interactions of politi-
cians and power corporation officials. However, we can examine whether the
data are consistent with patterns showing successful political pressures on
the power corporation.
4.1. Electoral Cycles
Figure 3 plots fiscal year line losses in Uttar Pradesh from 2000 to 2009.
The individual lines depict smoothed trends for individual service divisions,
with the thick line showing the average across all divisions.5 The overall
5The figure plots only divisions that could be consistently tracked across the timeperiod, excluding newly created divisions. Also excluded are divisions that were extractedinto the new state of Uttaranchal in 2000. These help explain the differences in overallaveraged in Figures 2a and 3.
12

pattern shows slight increases in line losses during the 2002 and 2007 fiscal
years, which mostly capture the period preceding elections in February 2002
and May 2007. A t-test in Table 3 shows that line losses at the division level
are nearly 3 percentage points higher in the two election years than other
years. The difference is highly statistically significant.
Figure 3: Division level line losses, 2000–2009.
The higher average losses in election periods is not driven by outliers.
Figures 4a and 4b shows kernel density plots that reveal the distribution
of line losses across all UPPCL divisions in the years surrounding the 2002
and 2007 elections. The overall distribution of losses in the election year is
shifted towards the right, indicating that most divisions experienced higher
line losses in that year than in the years prior and after.
13

(a) Kernel Density Plots of Line Losses Around 2002 Election
(b) Kernel Density Plots of Line Losses Around 2007 Election
Figure 4: Line Losses Around Election YearsSource: Uttar Pradesh Power Corporation Ltd.
14

Table 3: UP Line Losses in Election and Non-Election Years, 2000–09
Division-Year Mean Std. Dev.Observations
Election Year 325 34.1 10.3Non-Election Year 1,336 31.4 11.5Difference +2.7∗∗∗
Notes : State assembly elections held in 2002 and 2007. ∗∗∗p ≤ 0.001
Table 4 shows a fixed effects OLS regression that predicts division-level
line losses using election year as regressors and indicator variables for each
division to control for time-invariant division characteristics. 6 Model 2 adds
a control for the total amount of electrical power supplied to the division, to
account for the possibility that higher line losses are driven by an increase
in electricity supply. In both models, line losses are about 3 points higher
in election years than in other years, a result similar to the uncontrolled
comparison of means above. These results provide additional circumstantial
evidence that the provision of electricity is subject to political manipulation.
Constituents appear to benefit from reduced efforts by the state to monitor
electricity use in periods prior to elections.
4.2. The Electoral Returns to Line Loss
If politicians are involved in facilitating line losses prior to elections, such
activities would make sense only if they were electorally advantageous. We
evaluate the electoral returns to line loss by closely examining the May 2007
6The division fixed effects specification helps to account for differences in economicdevelopment, industrial/sectoral composition, rural/urban balance, population density,and other geographically-specific characteristics that do not vary much over time but mayaffect rates of line loss.
15

Table 4: Fixed Effects OLS Results Testing for Electoral Cycles in UP LineLoss, 2000–2009
(1) (2)Election year 2.847∗∗∗ 3.107∗∗∗
(0.336) (0.336)Power supplied to division -0.018∗∗
(0.006)Division Fixed Effects Yes Yes
Constant 30.972∗∗∗ 35.792∗∗∗
(0.067) (1.501)Division-level Observations 1661 1661
Standard errors in parentheses. ∗ p < 0.05, ∗∗ p < 0.01, ∗∗∗ p < 0.001
election.7 Previous research has documented a significant incumbency disad-
vantage for Indian state legislators (Uppal, 2009). The 2007 elections appear
consistent with this expectation: across UP’s 403 state assembly constituen-
cies, only 146 of seats were retained by the same party that had held the seat
since the prior 2002 election.
Were rates of line loss higher in areas where parties were able retain
their seats? The geographic mismatch between assembly constituencies and
UPPCL’s service divisions makes it difficult to answer this question cleanly.
We can, however, compare incumbency re-election rates against line losses
measured at the larger administrative district level.8 In general, districts
where parties retained more seats had higher rates of line loss than those
where most incumbents were replaced. In the five districts in which all
7In that contest, the BSP won an outright majority of seats, the first time in nearlytwo decades that a power sharing coalition was not required to govern the state.
8The typical district is comprised of five or six assembly constituency seats.
16
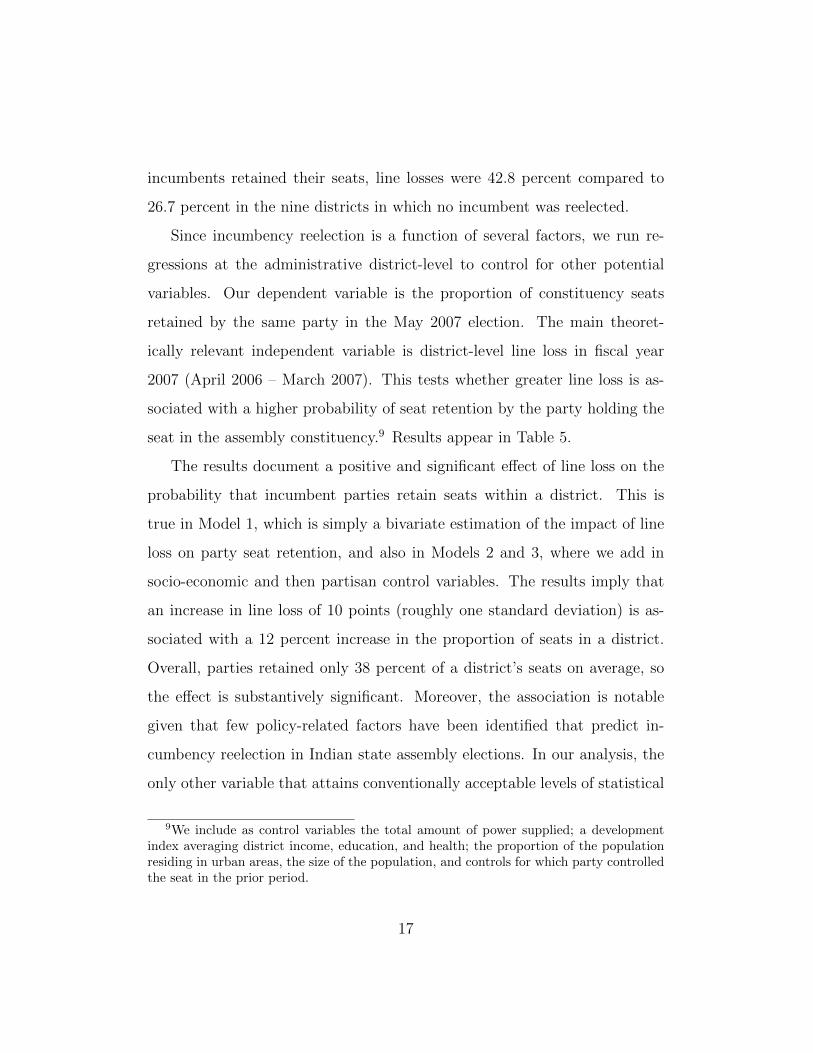
incumbents retained their seats, line losses were 42.8 percent compared to
26.7 percent in the nine districts in which no incumbent was reelected.
Since incumbency reelection is a function of several factors, we run re-
gressions at the administrative district-level to control for other potential
variables. Our dependent variable is the proportion of constituency seats
retained by the same party in the May 2007 election. The main theoret-
ically relevant independent variable is district-level line loss in fiscal year
2007 (April 2006 – March 2007). This tests whether greater line loss is as-
sociated with a higher probability of seat retention by the party holding the
seat in the assembly constituency.9 Results appear in Table 5.
The results document a positive and significant effect of line loss on the
probability that incumbent parties retain seats within a district. This is
true in Model 1, which is simply a bivariate estimation of the impact of line
loss on party seat retention, and also in Models 2 and 3, where we add in
socio-economic and then partisan control variables. The results imply that
an increase in line loss of 10 points (roughly one standard deviation) is as-
sociated with a 12 percent increase in the proportion of seats in a district.
Overall, parties retained only 38 percent of a district’s seats on average, so
the effect is substantively significant. Moreover, the association is notable
given that few policy-related factors have been identified that predict in-
cumbency reelection in Indian state assembly elections. In our analysis, the
only other variable that attains conventionally acceptable levels of statistical
9We include as control variables the total amount of power supplied; a developmentindex averaging district income, education, and health; the proportion of the populationresiding in urban areas, the size of the population, and controls for which party controlledthe seat in the prior period.
17

Table 5: OLS Regressions Predicting Proportion of Seats in Each UP DistrictRetained by Party, 2007 State Assembly Elections
Variable Model 1 Model 2 Model 3
Line losses, FY 2007 (%) 0.012∗∗ 0.012∗∗ 0.011∗
(0.003) (0.003) (0.003)Power supplied (GU) 0.133 0.102
(0.098) (0.095)Level of development (HDI index) 0.632 -0.041
(0.861) (0.855)Prop of pop urban -0.926∗ -0.041
(0.458) (0.447)District pop (millions) -0.030 -0.032
(0.045) (0.044)District seats previously held by BSP 0.220
(0.184)District seats previously held by SP -0.217
(0.175)District seats previously held by INC -0.273
(0.295)District seats previously held by BJP -0.131
(0.206)Intercept -0.000 -0.213 0.245
(0.108) (0.495) (0.557)Observations 68 68 68Standard errors in parentheses. Significance levels : † : 10% ∗ : 5% ∗∗ : 1%
significance is urban population in Model 2. Partisan effects are not statis-
tically significant, nor are interaction effects between line losses and parties
(not reported here). One possible interpretation of the results reported in
Table 5 is that when incumbent MLA’s allow high rates of power theft, their
party is more likely to be rewarded by voters and to achieve reelection.
18

5. Conclusions
Line losses are widespread in India, yet the variations in intensity across
space and time can only partially be explained by technical and economic
factors. Using disaggregated data from India’s largest state, we provide ev-
idence that line loss is politically correlated. It occurs more often around
elections and proves advantageous to the political parties holding the leg-
islative assembly seat. Our results underscore that line losses have become
bound up with the intense electoral competition that now characterizes Ut-
tar Pradesh. This suggests that power theft is part of deliberate political
strategy and not a by-product of weak institutions or the product of random
fluctuations in the ability of the public sector power corporation to enforce
standard transmission or billing procedures. Although some line losses are
unavoidable, our data suggest that much of it is not only a function of tech-
nical features of electricity provision, but rather an outcome of processes that
may benefit politicians and consumers in the short-run, despite consequences
to the state and its citizens in the long-run.
19

References
Badiani, R., Jessoe, K. K., Jan. 2011. Elections at what cost? the impact
of electricity subsidies on groundwater extraction and agricultural produc-
tion, unpublished paper.
Baleiras, R. N., Costa, J. d. S., September 2004. To be or not to be in
office again: An empirical test of a local political business cycle rationale.
European Journal of Political Economy 20 (1), 655–71.
Bernard, J.-T., Gordon, S., Tremblay, J., August 1997. Electricity prices and
elections in quebec. Canadian Journal of Economics 30 (3), 505–25.
Bhatia, B., Gulati, M., September 2004. Reforming the power sector: Con-
trolling electricity theft and improving revenue. Public policy for the pri-
vate sector note 272., World Bank, washington, DC: World Bank.
Brown, D. S., Mobarak, A. M., May 2009. The transforming power of democ-
racy: Regime type and the distribution of electricity. American Political
Science Review 103 (2), 193–213.
Depuru, S. S. S. R., Wang, L., Devabhaktuni, V., 2011. Electricity theft:
Overview, issues, prevention and a smart meter based approach to control
theft. Energy Policy 39 (2), 1007 – 1015.
Drazen, A., Eslava, M., January 2005. Electoral manipulation via expendi-
ture composition: Theory and evidence. Working Paper No. 11085, Na-
tional Bureau of Economic Research.
20

Ferraz, C., May 2006. Political influence and environmental regulation: Evi-
dence from municipal electoral cycles in urban Brazil, unpublished paper.
Golden, M. A., Min, B., Forthcoming 2013. Distributive politics around the
world. Annual Review of Political Science 16.
Johnston, M., 2006. Syndromes of Corruption: Wealth, Power, and Democ-
racy. Cambridge University Press, Cambridge.
Joseph, K. L., 2010. The politics of power: Electricity reform in India. Energy
Policy 38, 503–11.
Khemani, S., 2004. Political cycles in a developing economy: Effect of elec-
tions in the indian states. Journal of Development Economics 73 (1), 125–
154.
Min, B., 2010. Democracy and light: Public service provision in the devel-
oping world, ph.D. thesis, University of California at Los Angeles.
Mouriuen, P. E., March 2007. The local political business cycle. Scandinavian
Political Studies 12 (1), 37–55.
Nordhaus, W. D., April 1975. The political business cycle. Review of Eco-
nomic Studies 42 (2), 169–90.
Rose-Ackerman, S., 1999. Corruption and Government: Causes, Conse-
quences, and Reform. Cambridge University Press, Cambridge.
Smith, T. B., Dec. 2004. Electricity theft: A comparative analysis. Energy
Policy 32 (18), 2067–76.
21
Treisman, D., 2007. What have we learned about the causes of corruption
from ten years of cross-national empirical research? Annual Review of
Political Science 10, 211–44.
Tufte, E. R., 1980. Political Control of the Economy. Princeton University
Press, Princeton.
Uppal, Y., 2009. The disadvantaged incumbents: Estimating incumbency
effects in indian state legislatures. Public Choice 138 (1), 9–27.
22