el niño–southern oscillation and aspects of western south american hydro-climatology
TRANSCRIPT

HYDROLOGICAL PROCESSESHydrol. Process. 16, 1247–1260 (2002)Published online in Wiley InterScience (www.interscience.wiley.com). DOI: 10.1002/hyp.1060
El Nino–Southern Oscillation and aspects of westernSouth American hydro-climatology
Peter Waylen1* and German Poveda2
1 Department of Geography, University of Florida, Gainesville, Florida, 32611-7315, USA2 Programa de Posgrado en Approvechamiento de Recursos Hidraulicos, Facultad de Minas, Universidad Nacional de Colombia sede
Medellın, AA 1027, Medellın, Colombia
Abstract:
The countries of western South America are heavily dependent upon their water resources and are subjected toconsiderable interannual variability in precipitation and streamflow. Many of these extremes, both high and low, areshown to be associated with the various aspects of atmosphere–ocean behaviour in the eastern and central Pacific, whichare collectively termed El Nino–Southern Oscillation (ENSO). ENSO itself constitutes a complex of environmentalchanges that have differing influences throughout the study area, but which are loosely associated, statistically andphysically, with the major regional precipitation-generating mechanisms. As the result of a non-linear chaotic system,no two ENSO events are the same, nor are their interactions with other regional climatic factors and the state ofthe continental hydrologic system, both of which may act to dampen or amplify any changes. However, statisticalevidence suggests that probabilistic forecasts are possible based either upon anticipated state of the atmosphere–oceanarbitrarily classified according to some a priori classification scheme or upon forecasted sea surface temperatures.Examples of the changing probability distributions of hydro-climatological variables in the study area suggest thatsome practical information of value may be extracted. Copyright 2002 John Wiley & Sons, Ltd.
KEY WORDS El Nino–Southern Oscillation; annual precipitation; western South America; floods
INTRODUCTION
Knowledge of the interannual variability of hydro-climatic variables, and of any potential for reducing theuncertainty associated with the occurrence of hydrologic events of practical importance in the near- to medium-term future, is of considerable value in western South America. A list of water-related environmental hazardsand the resulting human and economic costs that are frequently experienced in this region includes: flooddamage, disruption of freshwater supply by both floods and droughts, reduction in the quantity of hydro-electricity produced (and the ensuing importation of fossil fuel alternatives), irrigation for agriculture, lossof lives and infrastructure through devastating mass movement phenomena, and environmental and socialconditions favourable to the spread of diseases (see Table I for some representative figures). The geographicrange of the study area (13 °N to 56 °S) encompasses a variety of hydro-climatic environments from amongstthe driest (Atacama Desert) to the wettest (NW Colombia) places in the world, and from coastal plains to thesecond largest mountain chain and sustained high-altitude plateau in the world. It includes climate types fromevery one of the major Koppen classifications excluding D (snowy forests). The proximity of the area to theseat of the El Nino–Southern Oscillation (ENSO) phenomenon may result in a clearer picture of its effects,but the latitudinal range furnishes a continental-scale picture of variations in responses. A brief review ofthe major precipitation and stream flow regimes of the area is followed by a discussion of major changes incirculation patterns associated with ENSO. Examples are provided to illustrate the way in which the statistical
* Correspondence to: P. Waylen, Department of Geography, University of Florida, Gainesville, FL 32611-7315, USA.E-mail: [email protected]
Received 31 April 1999Copyright 2002 John Wiley & Sons, Ltd. Accepted 15 October 2001
1248 P. WAYLEN AND G. POVEDA
Table I. Significance of water resources to countries within the study area; source: Roberts (1998)
Variable Chile Colombia Ecuador Peru
Internal renewable water resources (km2) 468 1070 314 40Internal renewable water resources (m3 per capita) 31 570 28 393 25 791 1613Annual withdrawals (% of available resources) 4 <0.1 2 15National energy from hydroelectricity (%) 62 76 45 82Agricultural land under irrigation (%) 29 14 9 43Cases of cholera, 1991–95 (per 100 000) 21 230 782Cases of malaria, 1991–95 (per 100 000) 458 417 341
properties of various hydro-climatic variables change in association with the ENSO phase, and the potentialfor their forecast is investigated.
STUDY AREA AND DATA AVAILABILITY
The study area, defined by its political boundaries, encompasses Colombia, Ecuador, Peru and Chile. Boliviawas excluded because of the paucity of available records. In reality, most observations are restricted verymuch to the Andes themselves (as in the case of Colombia) or to their western flanks.
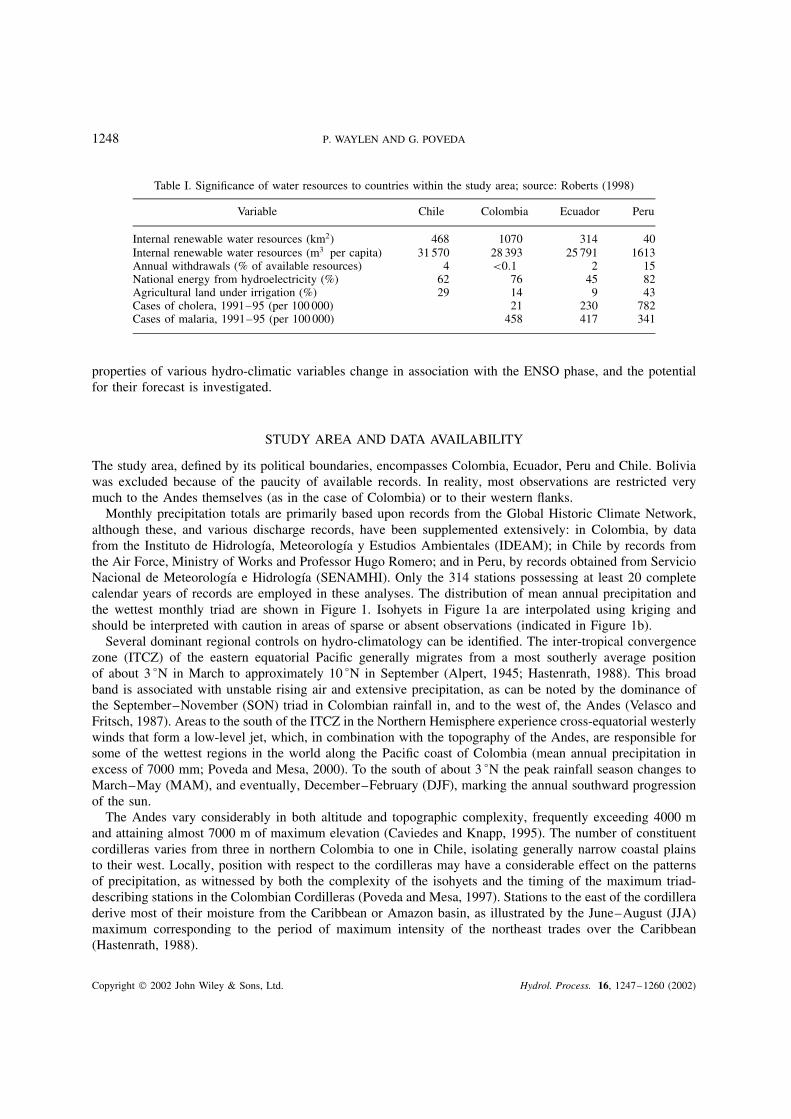
Monthly precipitation totals are primarily based upon records from the Global Historic Climate Network,although these, and various discharge records, have been supplemented extensively: in Colombia, by datafrom the Instituto de Hidrologıa, Meteorologıa y Estudios Ambientales (IDEAM); in Chile by records fromthe Air Force, Ministry of Works and Professor Hugo Romero; and in Peru, by records obtained from ServicioNacional de Meteorologıa e Hidrologıa (SENAMHI). Only the 314 stations possessing at least 20 completecalendar years of records are employed in these analyses. The distribution of mean annual precipitation andthe wettest monthly triad are shown in Figure 1. Isohyets in Figure 1a are interpolated using kriging andshould be interpreted with caution in areas of sparse or absent observations (indicated in Figure 1b).
Several dominant regional controls on hydro-climatology can be identified. The inter-tropical convergencezone (ITCZ) of the eastern equatorial Pacific generally migrates from a most southerly average positionof about 3 °N in March to approximately 10 °N in September (Alpert, 1945; Hastenrath, 1988). This broadband is associated with unstable rising air and extensive precipitation, as can be noted by the dominance ofthe September–November (SON) triad in Colombian rainfall in, and to the west of, the Andes (Velasco andFritsch, 1987). Areas to the south of the ITCZ in the Northern Hemisphere experience cross-equatorial westerlywinds that form a low-level jet, which, in combination with the topography of the Andes, are responsible forsome of the wettest regions in the world along the Pacific coast of Colombia (mean annual precipitation inexcess of 7000 mm; Poveda and Mesa, 2000). To the south of about 3 °N the peak rainfall season changes toMarch–May (MAM), and eventually, December–February (DJF), marking the annual southward progressionof the sun.
The Andes vary considerably in both altitude and topographic complexity, frequently exceeding 4000 mand attaining almost 7000 m of maximum elevation (Caviedes and Knapp, 1995). The number of constituentcordilleras varies from three in northern Colombia to one in Chile, isolating generally narrow coastal plainsto their west. Locally, position with respect to the cordilleras may have a considerable effect on the patternsof precipitation, as witnessed by both the complexity of the isohyets and the timing of the maximum triad-describing stations in the Colombian Cordilleras (Poveda and Mesa, 1997). Stations to the east of the cordilleraderive most of their moisture from the Caribbean or Amazon basin, as illustrated by the June–August (JJA)maximum corresponding to the period of maximum intensity of the northeast trades over the Caribbean(Hastenrath, 1988).
Copyright 2002 John Wiley & Sons, Ltd. Hydrol. Process. 16, 1247–1260 (2002)
EL NINO–SOUTHERN OSCILLATION 1249
−80
−50
−40
−30
−20
−10
0
10
−50
−40
−30
−20
−10
0
10
−70 −80 −70
AnnualPrecipitation
(mm)
Triad of Max.Precipitation
DJF
MAM
JJA
SON
(a) (b)
2000
2000
2000
3000
2000
30004000
2000
500
500
1000
1000
250
250
Figure 1. (a) Mean annual precipitation totals and (b) the triad of maximum precipitation based upon the available station records
The South Pacific sub-tropical anticyclone is generally located to the west of the continent at about 25–30 °S.It is partially responsible for the aridity at these latitudes and for sustaining the cold Humboldt/Chile/PeruCurrent along the coastal waters south of the equator. The subtropical jet associated with the release oflatent heat at the upper levels of the troposphere over the western equatorial Pacific brings moisture in tocentral Chile (Aceituno, 1988) during the austral winter (JJA maximum), whereas precipitation to the southis dominated by the polar jets, westerlies and frontal activity that move northwards with the weakening ofthe anticyclone (JJA).
ENSO
Using the established definitions, El Nino is the warm ocean current frequently (3–4 years) observed in theeastern equatorial Pacific off the coast of Ecuador, and the Southern Oscillation refers to the varying bi-polarnature of atmospheric pressures in the western Pacific (low) and the South Pacific sub-tropical anticyclone. Thetwo are now seen as two aspects of the same Pacific-wide atmosphere–ocean system, and the term El Ninohas popularly taken on a much broader meaning of global environmental disruption (Philander, 1990). Thelower atmospheric pressure over Indonesia/Australia, and a possible jet over the eastern Pacific (Hastenrath,1999) induce generally easterly surface winds across the Pacific. There is a return airflow at high altitudes anddescending air at the sub-tropical anticyclone. This pattern of Walker cell circulation pushes warmer water
Copyright 2002 John Wiley & Sons, Ltd. Hydrol. Process. 16, 1247–1260 (2002)

1250 P. WAYLEN AND G. POVEDA
towards the western Pacific, driving down the thermocline (and pycnocline) to about 100 m, while raisingit to about 40 m and producing equatorial upwelling of cold waters in the east. A balance may be viewedas existing between the surface wind stress and the gradient of the thermocline. Should the wind stress forany reason be reduced in the central Pacific, the gradient of the thermocline will also be reduced locally.This local change will be propagated west to east along the thermocline by the rotation of the Earth, as aKelvin wave (Harrison and Larkin, 1998). In terms of sea surface temperatures (SSTs) and their interactionwith the atmosphere, the effects of these Kelvin waves are most pronounced where the thermocline is at itsshallowest depth beneath the surface. The Kelvin wave ultimately moves sufficiently eastward to be reflectednorthwards and southwards off of the coast of equatorial western South America. Equatorial easterlies abateand even reverse, producing two areas of shallower thermocline depth west of the international dateline, northand south of the equator, and the ocean–atmosphere enters a new mean, unstable state.
These areas of shallower thermocline affect the strength and positions of the sub-tropical anticylones andthereby the planetary, or Rossby, waves. Away from the equator, evaporation and turbulent mixing are thedominant mechanisms of energy transfer. The stronger winds in mid-latitudes increase evaporation (therebyincreasing latent heat releases to the atmosphere), and mixing. The extra-tropical ocean waters then cool,reducing the equatorward flow of the ocean currents down the west coasts of mid-latitude continents andpermitting the poleward transfer of the reflected equatorial waters. These delayed changes away from theequator portend the end of the current unstable mean state and herald a series of positive feedbacks towardsthe opposing mean condition. In this way the atmosphere and ocean are in a permanently unstable condition,and tend to move alternately between two end conditions (Vallis, 1986). Given the intrinsic non-linear nature ofthe climate system, each change of mean condition is unique. The general suite of environmental conditionsassociated with the two mean states has become known as El Nino (deepened thermocline in the easternPacific) and La Nina, anti-El Nino or El Viejo (shallower thermocline in eastern Pacific). As the exact stateof each unstable mean condition varies, no universally accepted definition of El Nino and La Nina can existin terms of the dominant factors of SSTs and atmospheric pressures.
However, in order to facilitate the generalization of effects, certain canonical characteristics of warm phases(deeper eastern thermocline) and cold phase (shallower eastern thermocline) have been extracted (e.g. Harrisonand Larkin, 1998), but the non-linear chaotic nature of the atmosphere–ocean system requires that each eventwill vary in its time of initiation, severity and spatial extent, and suggests that a probabilistic representationof the results is the appropriate one. Two basic approaches exist to the definition of the relationship betweencontinental hydro-climatic variables and the state of the atmosphere–ocean system. The first is to establishassociations with indices of the dominant components of the atmospheric and oceanic systems. The SouthernOscillation index (SOI), a standardized measure of the differences between surface pressures at Darwin,Australia, and Tahiti, or measures of the oceanic component, such as SSTs in various areas throughout thePacific, are commonly used in this way. In this paper SSTs in regions Nino3.4 (5 °N–5 °S, 170 °W–120 °W)and Nino1C2 (0° –10 °S, 90 °W–80 °W) are employed (see http://www.cpc.ncep.noaa.gov, for sources ofthese data). The fact that existing climate models appear to have a reasonable capacity to forecast SSTs 3to 9 months in advance (Barnston et al., 1999), and are thereby potentially translatable into similar hydro-climatic forecasts, may be an advantage of employing SSTs (particularly in the Nino3.4 region). None of thethree series shows any significant (0Ð05) autocorrelation at lag � 1.
A second approach has been to subdivide years according to some a priori classification scheme (generallyEl Nino, La Nina and normal) based on a variety of environmental indicators. Many of these are fairlysubjective, and vary with investigator and region of application; they are extensively reviewed by Rossel(1997). Various statistical properties of the hydro-climatic variables can be compared between sub-samples.For the sake of objectivity, the classification of the Japanese Meteorological Society is used throughout thiswork. This classification is based on an index calculated as a 5 month running mean of spatially averagedSST anomalies over the tropical Pacific: 4 °S–4 °N, 150 °W–90 °W. If the index values exceed 0Ð5 °C for sixconsecutive months, then the ENSO year of October through to the following September is categorized as El
Copyright 2002 John Wiley & Sons, Ltd. Hydrol. Process. 16, 1247–1260 (2002)
EL NINO–SOUTHERN OSCILLATION 1251
Nino; a La Nina has index values less than �0Ð5 °C; all other values are considered neutral. A full listing ofyears and explanation is given at http://www.coaps.fsu.edu/¾legler/jma index1.shtml.
EMPIRICAL RESULTS
Annual precipitation
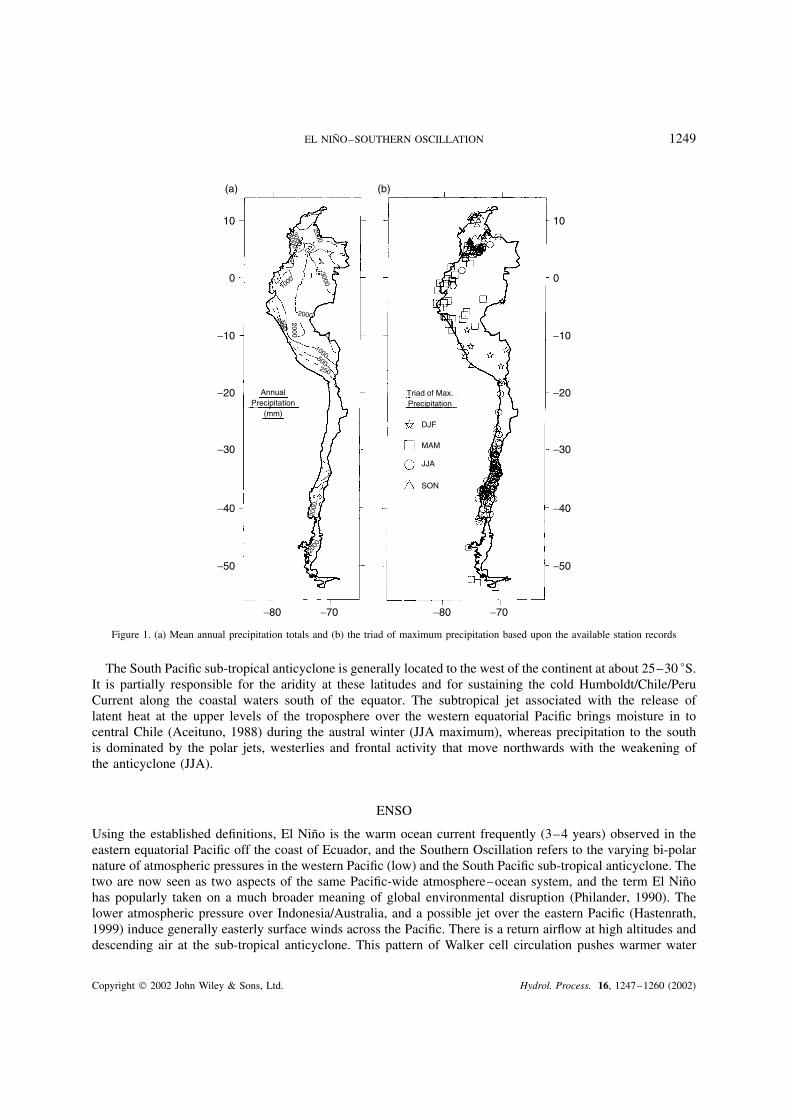
Maps of simple simultaneous correlations between annual precipitation and SOI, Nino3.4 and Nino1C2 areshown in Figure 2, indicating areas of positive and negative associations. Slightly over 50% of all the stationsexhibit statistically significant (0Ð05 level) correlations between the SOI and annual precipitation, dropping to20% for correlations with SST in Nino1C2, and 28% for Nino3.4. These figures may not reflect the true arealcoverage, owing to the spatial bias towards stations in central Chile and the Colombian Andes (Figure 1b).Although the geographic limits of the affected areas vary depending upon the indicator (independent) variableemployed, a common pattern emerges. Colombia and northern Ecuador, from the Andes westward, experiencesincreased positive associations with the SOI, and negative ones with measures of SST. During years of warmer
Figure 2. Synchronous (year 0) correlations of annual precipitation total to three major indices of the state of the atmosphere–ocean systemin the equatorial Pacific
Copyright 2002 John Wiley & Sons, Ltd. Hydrol. Process. 16, 1247–1260 (2002)
1252 P. WAYLEN AND G. POVEDA
than normal SST (lower than normal SOI) in the eastern Pacific (warm-phase years) the descending limb ofthe Walker cell circulation moves eastward over these regions subduing convection, and the ITCZ movesfurther south. During El Nino there is a decrease in water vapour advection as a result of the weakening ofthe low-level westerly jet that normally penetrates from the Pacific Ocean to inland Colombia. This slackeningresults form a diminished temperature gradient between Colombia and the cold tongue off the Peruvian coast(Poveda and Mesa, 2000). In addition, the number of tropical easterly waves decreases throughout the tropicalNorth Atlantic and the Caribbean (Gray and Sheaffer, 1992). Although such events have no direct impactupon South America, their presence in the Caribbean basin induces a regional reversal of the normal pressuregradient and enhances vapour transport from the Pacific (Vargas and Trejos, 1994). Southern Ecuador andnorthern coastal Peru demonstrate the opposite signal, reflecting the reduction of off-shore upwelling, andthe spatial extent of the ‘cold tongue’ in general, during warm phase years, which permits the southwardmigration of the ITCZ and associated precipitation in the eastern Pacific (Rossel, 1997). The other zone ofmarked correlation is found in central Chile, which experiences increased (decreased) precipitation duringwarm (cold) phases. This pattern reflects the northward displacement of the sub-tropical jet-stream and theconcomitant increase in frontal activity (Aceituno, 1988). The differences in patterns of statistically significantcorrelations with the two measures of SST are indicative of these varying physical processes. The fact thattemperatures in Nino3.4 are more closely related physically to the location of the Walker cell circulationand the sub-tropical jet is reflected in the concentrations of significant associations in Colombia and centralChile, whereas stations in Ecuador and northern Peru are more directly affected by temperatures in the watersimmediately offshore (Nino1C2). There is also a slight indication of a potential negative correlation with SSTin Altiplano of southern Peru and northern Chile (Tapley and Waylen, 1990).
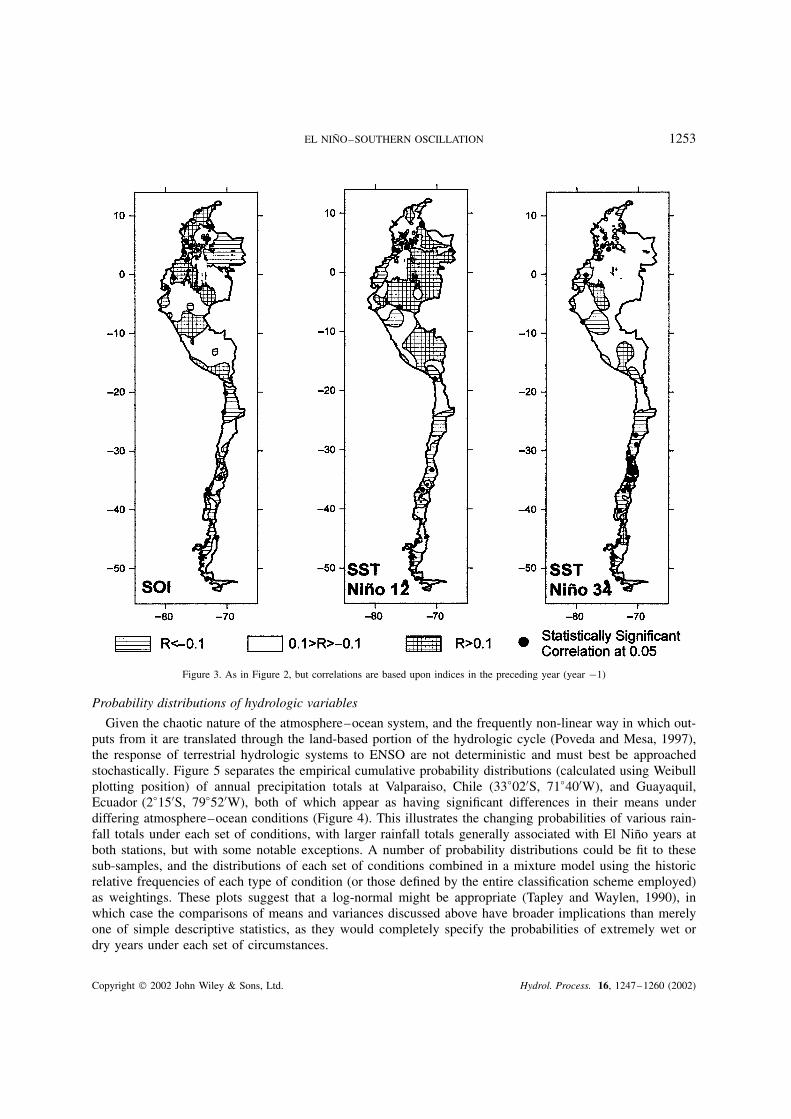
The ability to forecast precipitation based on the value of last year’s independent variables would be ofconsiderable practical use. Figure 3 shows the results of similar lag cross-correlations with a lead of one year.The potential for such forecasting looks slim, with only 4% of the stations reporting statistically significantassociations with preceding values of SOI and Nino1C2, and 10% with Nino3.4. 4% is within the numberthat one would expect under the null hypothesis of no correlation at the selected significance level, and the10% probably reflects, in part, the spatial bias/clustering of the stations (Wolter, 1987). However, SST inNino3.4 changes more gradually than the other two indices, and this persistence may account for the higherpercentage of correlations. In many of the regions in which precipitation appears most strongly correlated withENSO the sign of the correlation changes between Figures 2 and 3, indicating the tendency for alternatingphases (warm/cold) to follow one another (Rasmusson et al., 1990); this is particularly marked in centralChile.
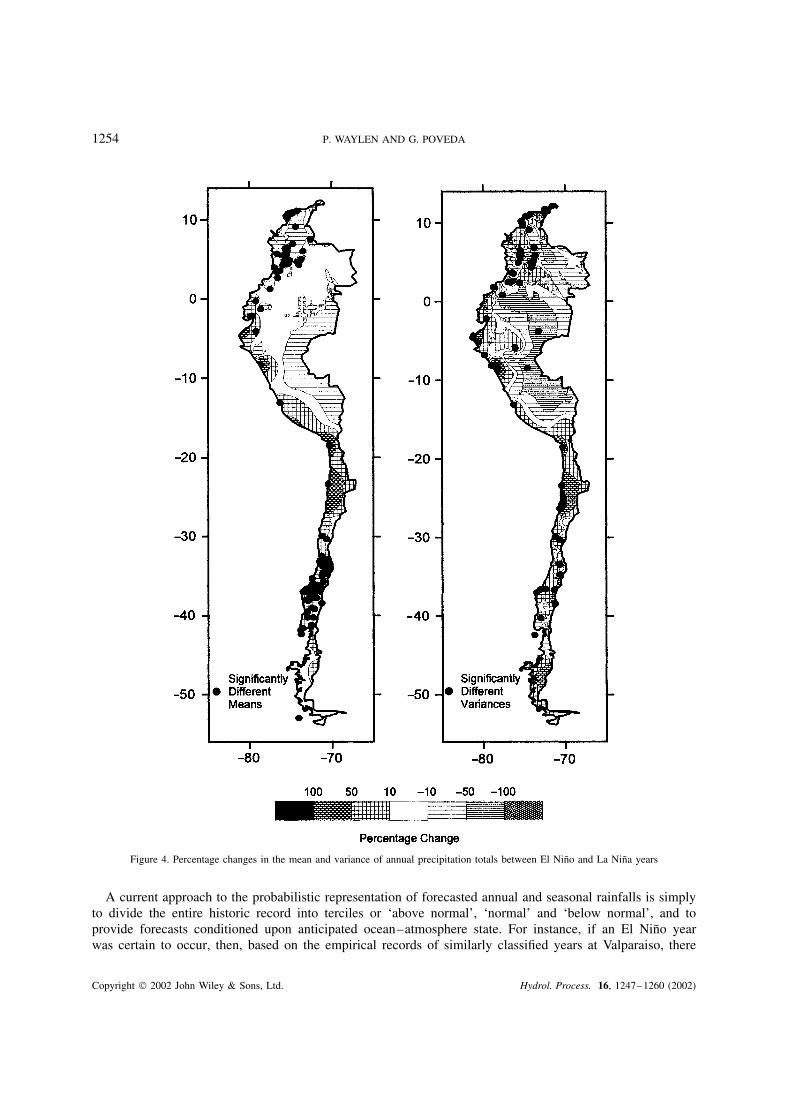
Similar regional patterns are observed when the annual precipitation records of each station are sub-dividedaccording to selected ENSO classification, and the l-means and l-variances (Hosking, 1990) of the El Ninoand La Nina years are compared (Figure 4). L-moments can be interpreted in a similar fashion to their productmoment counterparts, but have been shown to be less sensitive to small sample sizes (Vogel and Fennessy,1993). Given the tremendous variability in annual precipitation totals over the region (Figure 1a), thesedifferences (El Nino � La Nina) are expressed as percentages of the La Nina figures. Statistical comparisonsof the observed variances (F-test) and means (t-test) are carried out, but it should be noted that the assumptionof normally distributed sub-samples in annual rainfall totals will probably be violated in the arid and semi-arid regions, therefore the significance level is, in reality, larger in these areas than the 0Ð05 level used.Significant differences in variances were detected in 19% of the stations, which were fairly evenly spreadthroughout the principal areas affected by ENSO. Increased variances are shown throughout Chile and littoralPeru and Ecuador during El Nino years, whereas the signal is more mixed in Colombia. The method ofcalculating percentage changes will highlight more strongly locations at which statistics in El Nino years arelarger. Almost 40% of the stations reported significant differences in mean annual precipitation. Percentagechanges are most marked in the arid and semi-arid areas, although what appear to be smaller negative changes(10–50%) in Colombia correspond to very large absolute changes.
Copyright 2002 John Wiley & Sons, Ltd. Hydrol. Process. 16, 1247–1260 (2002)
EL NINO–SOUTHERN OSCILLATION 1253
Figure 3. As in Figure 2, but correlations are based upon indices in the preceding year (year �1)
Probability distributions of hydrologic variables
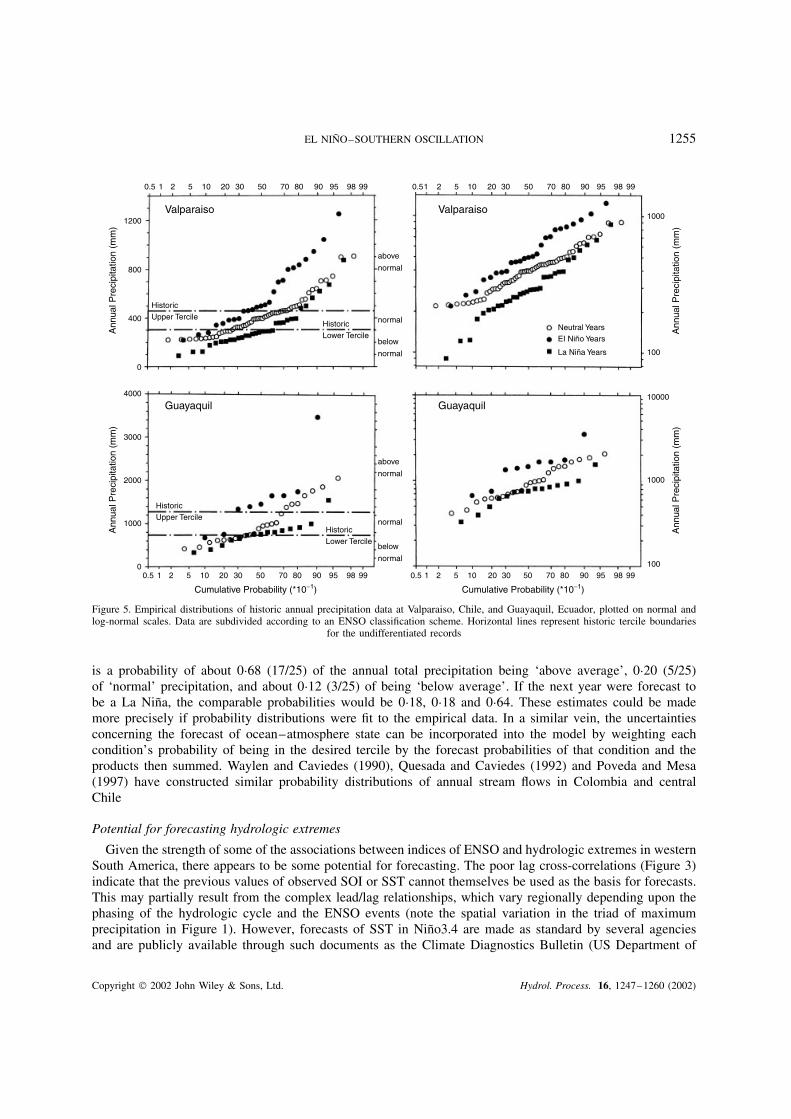
Given the chaotic nature of the atmosphere–ocean system, and the frequently non-linear way in which out-puts from it are translated through the land-based portion of the hydrologic cycle (Poveda and Mesa, 1997),the response of terrestrial hydrologic systems to ENSO are not deterministic and must best be approachedstochastically. Figure 5 separates the empirical cumulative probability distributions (calculated using Weibullplotting position) of annual precipitation totals at Valparaiso, Chile (33°020S, 71°400W), and Guayaquil,Ecuador (2°150S, 79°520W), both of which appear as having significant differences in their means underdiffering atmosphere–ocean conditions (Figure 4). This illustrates the changing probabilities of various rain-fall totals under each set of conditions, with larger rainfall totals generally associated with El Nino years atboth stations, but with some notable exceptions. A number of probability distributions could be fit to thesesub-samples, and the distributions of each set of conditions combined in a mixture model using the historicrelative frequencies of each type of condition (or those defined by the entire classification scheme employed)as weightings. These plots suggest that a log-normal might be appropriate (Tapley and Waylen, 1990), inwhich case the comparisons of means and variances discussed above have broader implications than merelyone of simple descriptive statistics, as they would completely specify the probabilities of extremely wet ordry years under each set of circumstances.
Copyright 2002 John Wiley & Sons, Ltd. Hydrol. Process. 16, 1247–1260 (2002)
1254 P. WAYLEN AND G. POVEDA
Figure 4. Percentage changes in the mean and variance of annual precipitation totals between El Nino and La Nina years
A current approach to the probabilistic representation of forecasted annual and seasonal rainfalls is simplyto divide the entire historic record into terciles or ‘above normal’, ‘normal’ and ‘below normal’, and toprovide forecasts conditioned upon anticipated ocean–atmosphere state. For instance, if an El Nino yearwas certain to occur, then, based on the empirical records of similarly classified years at Valparaiso, there
Copyright 2002 John Wiley & Sons, Ltd. Hydrol. Process. 16, 1247–1260 (2002)
EL NINO–SOUTHERN OSCILLATION 1255
0.5 1 2 5 10 20 30 50 70 80 90 95 98 99
Cumulative Probability (*10−1)
0.5 1 2 5 10 20 30 50 70 80 90 95 98 99
0.5 1 2 5 10 20 30 50 70 80 90 95 98 99 0.51 2 5 10 20 30 50 70 80 90 95 98 99
Cumulative Probability (*10−1)
0
1000
2000
3000
4000
Ann
ual P
reci
pita
tion
(mm
)
0
400
800
1200
Ann
ual P
reci
pita
tion
(mm
)
100
1000
10000
Ann
ual P
reci
pita
tion
(mm
)
100
1000
Ann
ual P
reci
pita
tion
(mm
)
Valparaiso Valparaiso
Guayaquil Guayaquil
HistoricUpper Tercile
HistoricUpper Tercile
HistoricLower Tercile
HistoricLower Tercile
Neutral YearsEI Niño Years
La Niña Years
above
normal
above
normal
below
normal
below
normal
normal
normal
Figure 5. Empirical distributions of historic annual precipitation data at Valparaiso, Chile, and Guayaquil, Ecuador, plotted on normal andlog-normal scales. Data are subdivided according to an ENSO classification scheme. Horizontal lines represent historic tercile boundaries
for the undifferentiated records
is a probability of about 0Ð68 (17/25) of the annual total precipitation being ‘above average’, 0Ð20 (5/25)of ‘normal’ precipitation, and about 0Ð12 (3/25) of being ‘below average’. If the next year were forecast tobe a La Nina, the comparable probabilities would be 0Ð18, 0Ð18 and 0Ð64. These estimates could be mademore precisely if probability distributions were fit to the empirical data. In a similar vein, the uncertaintiesconcerning the forecast of ocean–atmosphere state can be incorporated into the model by weighting eachcondition’s probability of being in the desired tercile by the forecast probabilities of that condition and theproducts then summed. Waylen and Caviedes (1990), Quesada and Caviedes (1992) and Poveda and Mesa(1997) have constructed similar probability distributions of annual stream flows in Colombia and centralChile
Potential for forecasting hydrologic extremes
Given the strength of some of the associations between indices of ENSO and hydrologic extremes in westernSouth America, there appears to be some potential for forecasting. The poor lag cross-correlations (Figure 3)indicate that the previous values of observed SOI or SST cannot themselves be used as the basis for forecasts.This may partially result from the complex lead/lag relationships, which vary regionally depending upon thephasing of the hydrologic cycle and the ENSO events (note the spatial variation in the triad of maximumprecipitation in Figure 1). However, forecasts of SST in Nino3.4 are made as standard by several agenciesand are publicly available through such documents as the Climate Diagnostics Bulletin (US Department of
Copyright 2002 John Wiley & Sons, Ltd. Hydrol. Process. 16, 1247–1260 (2002)
1256 P. WAYLEN AND G. POVEDA
Commerce, 1999) and the World Wide Web at http://www.cpc.noaa.gov. The ‘canonical correlation ENSOforecast’ (Barnston and Ropelewski, 1992) employs a variety of environmental indicators to forecast seasonalSST in Nino3.4, up to a year into the future. The forecasts, which include error estimates, might be used asthe basis for the forecasting of hydrologic variables.
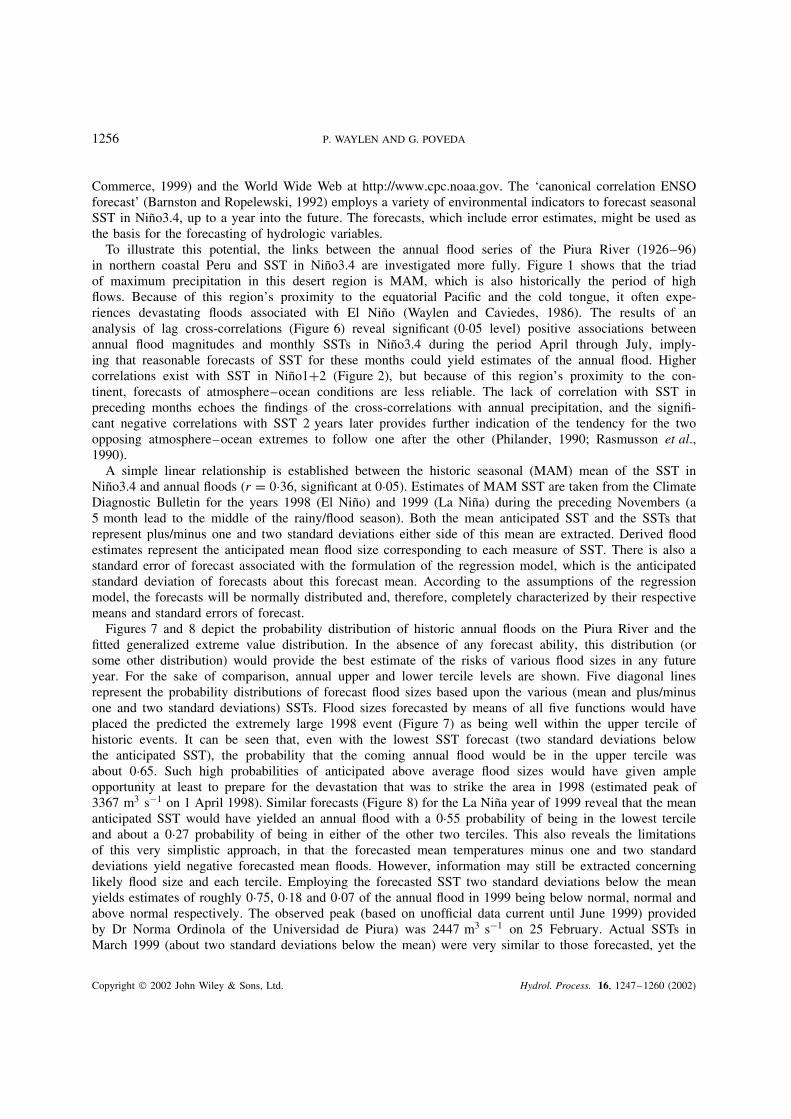
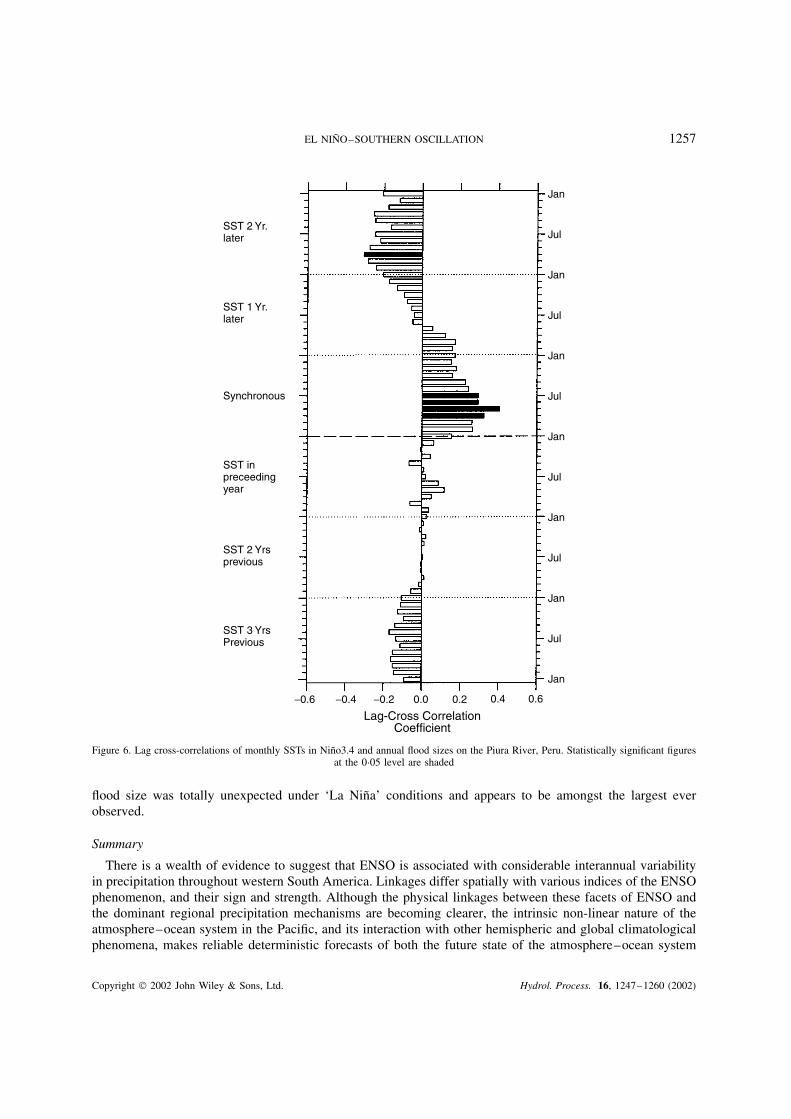
To illustrate this potential, the links between the annual flood series of the Piura River (1926–96)in northern coastal Peru and SST in Nino3.4 are investigated more fully. Figure 1 shows that the triadof maximum precipitation in this desert region is MAM, which is also historically the period of highflows. Because of this region’s proximity to the equatorial Pacific and the cold tongue, it often expe-riences devastating floods associated with El Nino (Waylen and Caviedes, 1986). The results of ananalysis of lag cross-correlations (Figure 6) reveal significant (0Ð05 level) positive associations betweenannual flood magnitudes and monthly SSTs in Nino3.4 during the period April through July, imply-ing that reasonable forecasts of SST for these months could yield estimates of the annual flood. Highercorrelations exist with SST in Nino1C2 (Figure 2), but because of this region’s proximity to the con-tinent, forecasts of atmosphere–ocean conditions are less reliable. The lack of correlation with SST inpreceding months echoes the findings of the cross-correlations with annual precipitation, and the signifi-cant negative correlations with SST 2 years later provides further indication of the tendency for the twoopposing atmosphere–ocean extremes to follow one after the other (Philander, 1990; Rasmusson et al.,1990).
A simple linear relationship is established between the historic seasonal (MAM) mean of the SST inNino3.4 and annual floods (r D 0Ð36, significant at 0Ð05). Estimates of MAM SST are taken from the ClimateDiagnostic Bulletin for the years 1998 (El Nino) and 1999 (La Nina) during the preceding Novembers (a5 month lead to the middle of the rainy/flood season). Both the mean anticipated SST and the SSTs thatrepresent plus/minus one and two standard deviations either side of this mean are extracted. Derived floodestimates represent the anticipated mean flood size corresponding to each measure of SST. There is also astandard error of forecast associated with the formulation of the regression model, which is the anticipatedstandard deviation of forecasts about this forecast mean. According to the assumptions of the regressionmodel, the forecasts will be normally distributed and, therefore, completely characterized by their respectivemeans and standard errors of forecast.
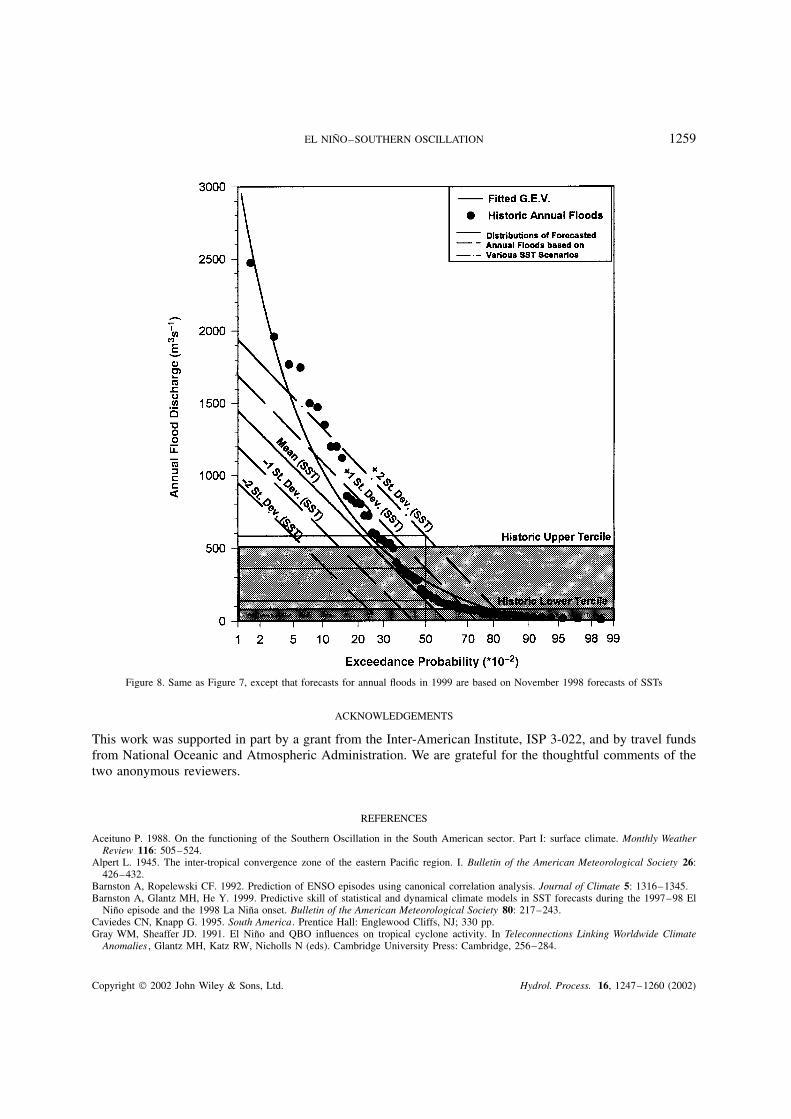
Figures 7 and 8 depict the probability distribution of historic annual floods on the Piura River and thefitted generalized extreme value distribution. In the absence of any forecast ability, this distribution (orsome other distribution) would provide the best estimate of the risks of various flood sizes in any futureyear. For the sake of comparison, annual upper and lower tercile levels are shown. Five diagonal linesrepresent the probability distributions of forecast flood sizes based upon the various (mean and plus/minusone and two standard deviations) SSTs. Flood sizes forecasted by means of all five functions would haveplaced the predicted the extremely large 1998 event (Figure 7) as being well within the upper tercile ofhistoric events. It can be seen that, even with the lowest SST forecast (two standard deviations belowthe anticipated SST), the probability that the coming annual flood would be in the upper tercile wasabout 0Ð65. Such high probabilities of anticipated above average flood sizes would have given ampleopportunity at least to prepare for the devastation that was to strike the area in 1998 (estimated peak of3367 m3 s�1 on 1 April 1998). Similar forecasts (Figure 8) for the La Nina year of 1999 reveal that the meananticipated SST would have yielded an annual flood with a 0Ð55 probability of being in the lowest tercileand about a 0Ð27 probability of being in either of the other two terciles. This also reveals the limitationsof this very simplistic approach, in that the forecasted mean temperatures minus one and two standarddeviations yield negative forecasted mean floods. However, information may still be extracted concerninglikely flood size and each tercile. Employing the forecasted SST two standard deviations below the meanyields estimates of roughly 0Ð75, 0Ð18 and 0Ð07 of the annual flood in 1999 being below normal, normal andabove normal respectively. The observed peak (based on unofficial data current until June 1999) providedby Dr Norma Ordinola of the Universidad de Piura) was 2447 m3 s�1 on 25 February. Actual SSTs inMarch 1999 (about two standard deviations below the mean) were very similar to those forecasted, yet the
Copyright 2002 John Wiley & Sons, Ltd. Hydrol. Process. 16, 1247–1260 (2002)
EL NINO–SOUTHERN OSCILLATION 1257
−0.4−0.6 −0.2 0.0 0.2 0.4 0.6
Lag-Cross CorrelationCoefficient
SST 3 YrsPrevious
SST 2 Yrsprevious
SST inpreceedingyear
SST 1 Yr.later
SST 2 Yr.later
Synchronous
Jan
Jul
Jan
Jul
Jan
Jul
Jan
Jul
Jan
Jul
Jul
Jan
Jan
Figure 6. Lag cross-correlations of monthly SSTs in Nino3.4 and annual flood sizes on the Piura River, Peru. Statistically significant figuresat the 0Ð05 level are shaded
flood size was totally unexpected under ‘La Nina’ conditions and appears to be amongst the largest everobserved.
Summary
There is a wealth of evidence to suggest that ENSO is associated with considerable interannual variabilityin precipitation throughout western South America. Linkages differ spatially with various indices of the ENSOphenomenon, and their sign and strength. Although the physical linkages between these facets of ENSO andthe dominant regional precipitation mechanisms are becoming clearer, the intrinsic non-linear nature of theatmosphere–ocean system in the Pacific, and its interaction with other hemispheric and global climatologicalphenomena, makes reliable deterministic forecasts of both the future state of the atmosphere–ocean system
Copyright 2002 John Wiley & Sons, Ltd. Hydrol. Process. 16, 1247–1260 (2002)

1258 P. WAYLEN AND G. POVEDA
Figure 7. Forecast distributions of the annual flood on the Piura River for 1998 based on forecasts of SSTs in Nino3.4 made in November1997. Historic flood distribution and tercile levels are shown for comparative purposes
and regional precipitation problematic. In terms of forecasting the effects upon aspects of the continentalhydrologic system, the task is made more complex by potential positive and negative feedbacks. There isevidence that, within those portions of the region where the hydro-climatology can be shown to be most closelyassociated (statistically and physically) to ENSO (i.e. northwestern Colombia, coastal Ecuador and Peru, andcentral Chile), there also exists a difference in the probabilistic characteristics of hydro-climatic variablesconditioned upon either the classification of ENSO events or one of the ENSO indicator variables. Resultantprobabilistic statements permit the incorporation and expression of the inherent uncertainties witnessedin the atmosphere–ocean and hydrologic systems in such way as to facilitate their incorporation by riskmanagers into computations of potential long-term gains and losses in taking actions based on the forecasts.Such statements are conditioned upon the assumption of some form of stationarity in both the index ofENSO activity and hydro-climatic variable, and in the relationship between the two. There is mountingevidence (e.g. see Trenberth, 1990; Wang, 1995) to question this assumption of longer run (inter-decadal)stationarity.
Copyright 2002 John Wiley & Sons, Ltd. Hydrol. Process. 16, 1247–1260 (2002)
EL NINO–SOUTHERN OSCILLATION 1259
Figure 8. Same as Figure 7, except that forecasts for annual floods in 1999 are based on November 1998 forecasts of SSTs
ACKNOWLEDGEMENTS
This work was supported in part by a grant from the Inter-American Institute, ISP 3-022, and by travel fundsfrom National Oceanic and Atmospheric Administration. We are grateful for the thoughtful comments of thetwo anonymous reviewers.
REFERENCES
Aceituno P. 1988. On the functioning of the Southern Oscillation in the South American sector. Part I: surface climate. Monthly WeatherReview 116: 505–524.
Alpert L. 1945. The inter-tropical convergence zone of the eastern Pacific region. I. Bulletin of the American Meteorological Society 26:426–432.
Barnston A, Ropelewski CF. 1992. Prediction of ENSO episodes using canonical correlation analysis. Journal of Climate 5: 1316–1345.Barnston A, Glantz MH, He Y. 1999. Predictive skill of statistical and dynamical climate models in SST forecasts during the 1997–98 El
Nino episode and the 1998 La Nina onset. Bulletin of the American Meteorological Society 80: 217–243.Caviedes CN, Knapp G. 1995. South America. Prentice Hall: Englewood Cliffs, NJ; 330 pp.Gray WM, Sheaffer JD. 1991. El Nino and QBO influences on tropical cyclone activity. In Teleconnections Linking Worldwide Climate
Anomalies , Glantz MH, Katz RW, Nicholls N (eds). Cambridge University Press: Cambridge, 256–284.
Copyright 2002 John Wiley & Sons, Ltd. Hydrol. Process. 16, 1247–1260 (2002)
1260 P. WAYLEN AND G. POVEDA
Harrison DE, Larkin NK. 1998. El-Nino–Southern Oscillation sea surface temperature and wind anomalies, 1946–1993. Reviews ofGeophysics 36(3): 353–399.
Hastenrath SL. 1988. Climate and Circulation of the Tropics . Reidel: Dordrecht.Hastenrath SL. 1999. Equatorial mid-tropospheric easterly jet over the eastern Pacific. Journal of the Meteorological Society of Japan 77:
701–709.Hosking JRM. 1990. L-moments: analysis and estimation of distributions using linear combinations of order statistics. Journal of the Royal
Statistical Society B 52: 105–124.Philander SG. 1990. El Nino, La Nina and the Southern Oscillation. Academic Press: San Diego; 293 pp.Poveda G, Mesa OJ. 1997. Feedbacks between hydrological processes in tropical South America and large scale oceanic–atmospheric
phenomena. Journal of Climate 10: 2690–2702.Poveda G, Mesa OJ. 2000. On the existence of Lloro (the rainiest locality on Earth): enhanced ocean–land–atmosphere interaction by a
low-level jet. Geophysical Research Letters 27(11): 1675–1678.Quesada ME, Caviedes CN. 1992. Caracterısticas etadistıcas de algunos rıos de Colombia. Revista Geografica 116: 53–64.Rasmusson EM, Wang X, Ropelewski CF. 1990. The biennial component of ENSO variability. Journal of Marine Systems 1: 70–96.Roberts L. 1998. World Resources 1998–99: a Guide to the Global Environment , Oxford University Press: Oxford; 369 pp.Rossel F. 1997. Influencia de El Nino sobre los regimenes hidro-pluviometricos del Ecuador, Tomos I–III . Serie INSEQ (Inundacioes y
Sequias) N° 18. Cooperacion Franco-Ecuatoriana, ORSTOM y INAHMI: Quito, Ecuador; 203 pp.Tapley TD Jr, Waylen PR. 1990. Spatial variability in the effects of ENSO events and annual precipitation in western Peru. Journal of
Hydrosciences 35: 429–446.Trenberth KZ. 1990. Recent observed interdecadal climate changes in the Northern Hemisphere. Bulletin of the American Meteorological
Society 71: 988–993.US Department of Commerce. 1999. Climate Diagnostic Bulletin: near real-time analyses of ocean/atmosphere. Climate Prediction Center,
National Oceanic and Atmospheric Administration, National Weather Service, National Centers for Environmental Protection, Washington,DC.
Vallis G. 1986. El Nino: a chaotic dynamical system. Science 232: 243–245.Vargas AB, Trejos VFB. 1994. Changes in the general circulation and its influence on precipitation trends in Central America: Costa Rica.
Ambio 23: 87–90.Velasco I, Fritsch M. 1987. Mesoscale convective complexes in the Americas. Journal of Geophysical Research 92(D8): 9591–9613.Vogel RM, Fennessy NM. 1993. L-moment diagrams should replace product moment diagrams. Water Resources Research 29: 1745–1752.Wang B. 1995. Interdecadal changes in El Nino onset in the last four decades. Journal of Climate 8: 267–285.Waylen PR, Caviedes CN. 1986. El Nino and floods along the north Peruvian littoral. Journal of Hydrology 89: 141–156.Waylen PR, Caviedes CN. 1990. Annual and seasonal fluctuations of precipitation and streamflow in the Aconcagua river basin, Chile.
Journal of Hydrology 120: 79–102.Wolter K. 1987. The Southern Oscillation in surface circulation and climate over the tropical Atlantic, eastern Pacific and Indian Oceans as
captured by cluster analysis. Journal of Applied Climate and Meteorology 26: 540–558.
Copyright 2002 John Wiley & Sons, Ltd. Hydrol. Process. 16, 1247–1260 (2002)