eia study for development of industrial estate of...
TRANSCRIPT

Project No. ENV-438
EIA Study for Development of Industrial Estate of HSIIDC at Sector-37 & Sector-3 Extn.
Ph-III, Karnal
Prepared By
Shriram Institute for Industrial Research (A Unit of Shriram Scientific & Industrial Research Foundation)
19, University Road, Delhi-110 007


Project Title : EIA Study for Development of Industrial Estate of HSIIDC at Sec-37 & Sec-3 Extn, Ph-III, Karnal Project No. : 21-1041/2007-IA.III Contract No. : HSIA:2007:K:1315 dt.09.10.2007
Shriram Institute for Industrial Research: Delhi
Table of Contents
Section Description Page
1. Introduction 1-10
1.1 Purpose of the Report 1
1.2 Identification of Project and Project Proponent 1
1.3 Regulatory Framework 5
1.4 Requirements of prior EC 2
1.5 Approved TOR from MOEF 3-5
1.6 Compliance with respect to the TOR issued by EAC 6-9
1.7 Organization of the Report 9
1.8 Contents of the Report 9-10
2. General Project Description 11-27
2.1 Preamble 11
2.2 The Proposal for Development of Industrial Estate, Ph-III, Karnal 11-15
2.3 Infrastructure Development Proposal for Proposed Project 15-17
2.4 Abstract of the Project Cost 17-19
3. Description of the Environment 28-127
3.1 Development of Environment Baseline 28-30
3.2 Air Environment 31-54
3.3 Meteorological Scenario 55-84
3.4 Noise Environment 85-87
3.5 Water Environment 88-100
3.6 Wastewater Collection & Treatment 101-105
3.7 Land Environment 106-110
3.8 Socio-Economic Environment 111-116
3.9 Biological Environment 117-123
3.10 Traffic Study 124-127
4. Anticipated Environmental Impacts 128-142
5. Environmental Management Plan including Mitigation Measures, Environmental Monitoring Program And Project Benefit
143-173
6. Public Consultation 174-180
7. Disclosure of Consultants Engaged 181-182
List of Abbrerviations 183-184

Project Title : EIA Study for Development of Industrial Estate of HSIIDC at Sec-37 & Sec-3 Extn, Ph-III, Karnal Project No. : 21-1041/2007-IA.III Contract No. : HSIA:2007:K:1315 dt.09.10.2007
Shriram Institute for Industrial Research: Delhi
List of Tables
Table No. Description Page Table-1.2 Area statement of proposed project 1 Table-1.4 Criteria for EC 2 Table-1.6 Compliance wrt TOR 6-9 Table-2.2 (a) Landuse of Proposed Project Site 12 Table-2.2 (b) Detail of plots for proposed project 14-15 Table-2.3 (a) Information wrt Right of Way, Formation Width etc. 15 Table-2.3 (b) Benchmarking for electric load calculations 16 Table-2.3 (c) Load estimations for proposed project 17 Table-2.4 (a) Abstract of the project cost 18-19 Table-3.2 (a) Description of AAQ monitoring stations in the project area 31 Table-3.2 (b) Statistical Analysis of SPM Monitoring Data in Ambient Air 33 Table-3.2 (c) Statistical Analysis of RSPM Monitoring Data in Ambient Air 33 Table-3.2 (d) Statistical Analysis of SO2 Monitoring Data in Ambient Air 34 Table-3.2 (e) Statistical Analysis of NOx Monitoring Data in Ambient Air 35 Table-3.2 (f) Statistical Analysis of CO Monitoring Data in Ambient Air 36 Table-3.2 (g) Statistical Analysis of Hydrocarbon Monitoring Data in Ambient Air 36 Table-3.2 (h) Rating scale for Air Quality Index (AQI) 37 Table-3.2 (i) Minimum, Average and Maximum values of AQI wrt NAASQ for Rural, Residential &
Other areas 37
Table-3.2 (j) Minimum, Average and Maximum values of AQI wrt NAASQ for Industrial areas 38 Table-3.2 (k) SPM, RSPM, NO2 & SO2 data at AAQ-1 38 Table-3.2 (l) SPM, RSPM, NO2 & SO2 data at AAQ-2 38-39 Table-3.2 (m) SPM, RSPM, NO2 & SO2 data at AAQ-3 39 Table-3.2 (n) SPM, RSPM, NO2 & SO2 data at AAQ-4 39-40 Table-3.2 (o) SPM, RSPM, NO2 & SO2 data at AAQ-5 40 Table-3.2 (p) RSPM, NO2 & SO2 data at AAQ-6 40-41 Table-3.2 (q) AAQ data of Carbon monoxide 41-42 Table-3.2 (r) AAQ data of Hydrocarbons 42-43 Table-3.3 (a) Rainfall data of Karnal region 55 Table-3.3 (b) Meteorological Scenario in the vicinity of proposed project site (Daily Mean Max/Min
Temperature, RH & WS) 61-63
Table-3.4 (a) Noise Level Criteria 85 Table-3.4 (b) Study area for Ambient Noise Level 85 Table-3.4 (c) Analysis of Ambient Noise Level data 86 Table-3.4 (d) Hourly Ambient Noise Level Data of Project Site 87 Table-3.5 (a) Water Quantity in Karnal 88 Table-3.5 (b) Criteria for categorization of Assessment Units 88 Table-3.5 (c) Description of Water Sources Selected for the Study 92 Table-3.5 (d) Physical properties of water 94 Table-3.5 (e) Inorganic non-metallic properties in water 95 Table-3.5 (f) Toxic metals in water 95 Table-3.5 (g) Iron, Phenolic Substances, Cyanide, Anionic Detergents, Mineral Oil, Aluminum &
Boron in water 96
Table-3.5 (h) Sodicity & Salinity Hazard Rating 97 Table-3.5 (i) Percent Sodium and SAR of Water 97 Table-3.5 (j) Microbiological Quality of Water 97 Table-3.5 (k) Detailed Analysis Results of water (GW-1, GW-2 & GW-3) 98 Table-3.5 (l) Detailed Analysis Results of water (GW-4, GW-5 & GW-6) 99 Table-3.5 (m) Detailed Analysis Results of surface water 100 Table-3.6 (a) Design parameters for wastewater collection network 102

Project Title : EIA Study for Development of Industrial Estate of HSIIDC at Sec-37 & Sec-3 Extn, Ph-III, Karnal Project No. : 21-1041/2007-IA.III Contract No. : HSIA:2007:K:1315 dt.09.10.2007
Shriram Institute for Industrial Research: Delhi
Table No. Description Page Table-3.6 (b) Characteristics of composite untreated effluent 103 Table-3.6 (c) Effluent discharge criteria 104 Table-3.7 (a) Landuse in 10 km buffer zone of the Project Area 107 Table-3.7 (b) Description of Soil Quality Sampling Locations for the Study 107 Table-3.7 (c) Test Methods/ Protocols for Soil Quality Analysis 108 Table-3.7 (d) Test Methods/ Protocols for Soil Quality Analysis 109 Table-3.7 (e) Soil Quality Rating for available nutrients & organic carbon 109 Table-3.7 (f) Soil Quality Results in Project Area (SQ-1 to SQ-6) 110 Table-3.8 (a) Population profile in the study area 111 Table-3.8 (b) Sex Ratio in the study area 112 Table-3.8 (c) Trend of SC/ST population in the study area 112 Table-3.8 (d) Trend of Literacy Rate (LR) in the study area 112 Table-3.8 (e) Population Density in the project area 112 Table-3.8 (f) Trend of WPR in the study area 113 Table- 3.8 (g) Occupation Structure in the Project Area 113 Table-3.8 (h) Scale for Socio-economic Index Development (Population Density & Sex Ratio) 115 Table-3.8 (i) Scale for Socio-economic Index Development (Literacy Rate, Amenities & WPR) 115 Table-3.8 (j) Socio-economic Index Matrix 115 Table-3.8 (k) Socio-economic Index in the Project Area 116 Table-3.9 (a) Terrestrial Flora in Study Area 120-122 Table-3.9 (b) Food crops 122 Table-3.9 (c) Garden Plants 122 Table-3.9 (d) Fruit trees 122-123 Table-3.9 (e) List of terrestrial fauna of the study area 123 Table-3.9 (f) List of Avifauna of the Study Area 123 Table-3.10 (a) Criteria for computation of equivalent PCU 125 Table-3.10 (b) PCUs at TM-1 & TM-2 126 Table-3.10 (c) Traffic Monitoring at station TM-1 127 Table-3.10 (d) Traffic Monitoring at station TM-2 127 Table-4.1 (a) Design features of the Right of Way 136 Table-4.1 (b) Load estimations as per lanuse 137 Table-4.2 (a) Baseline AAQ data at Core & Buffer Zones of Proposed Project Site 138 Table-5.4 (a) Characteristics of composite equalized untreated/ raw effluent 157 Table-5.4 (b) Effluent discharge standards for treated effluent 158 Table-5.4 (c) Areawise benchmarking for electric load 162 Table-5.4 (d) Area wise tentative electrical load in MW 162 Table-5.6 (a) Post-project Monitoring Schedule 172

Project Title : EIA Study for Development of Industrial Estate of HSIIDC at Sec-37 & Sec-3 Extn, Ph-III, Karnal Project No. : 21-1041/2007-IA.III Contract No. : HSIA: K:2007:1315 dt.09.10.2007 Page 1 of 184
Shriram Institute for Industrial Research: Delhi
1. INTRODUCTION 1.1 Purpose of the Report The purpose of EIA/ EMP report is to reduce or/ minimize undesirable or negative impacts and to enhance the positive impacts due to the project activities based on the conductance of EIA study by analysing various environmental issues related to the proposed project activities. Every anthropogenic activity has some impact on the environment. The objective of EIA is, thus, to foresee the potential environmental problems that would arise out of a proposed development and address them in the project's planning and design stage. The EIA process should then allow for the communication of this information to: (a) The project proponent; (b) The regulatory agencies; and, (c) All stakeholders and interest groups. 1.2 Identification of Project and Project Proponent Haryana State Industrial and Infrastructure Development Corporation Limited (HSIIDC) is the Project Proponent for the proposed project. In line with the Industrial Policy announced by the Government of Haryana, HSIIDC has decided to develop a new Industrial Estate at Sector – 37 and extension of Sec - 3, Karnal ( Phase – III). It will have integrated sites for Industrial, Commercial & Institutional areas along with adjoining residential area for operational convenience & promoting walk-to-work culture. This industrial township will be developed in sector 37 and extension of Sec – 3 of Karnal –Phase – III
Table-1.2 Area statement of proposed project Sector –37 Karnal S. No Name of the Village Area
Acre Kanal Marla 1. Karnal 160 5 6 2. Kambopura 66 0 17 3. Total 226 6 3 Sec – 3 Extn. Karnal S. No Name of the Village Area
Acre Kanal Marla 1. Karnal 62 0 7 Total Land Area 288Acre 6Kanal 10Marla Type of Industries to come up in proposed Industrial Estate The project envisages the establishment of mainly pollution free industries based on advanced technologies. The spectrum of industries which are expected to come up, would comprise of following type:
♦ Agricultural Implements ♦ General Engineering ♦ Auxiliary Industries
Project Title : EIA Study for Development of Industrial Estate of HSIIDC at Sec-37 & Sec-3 Extn, Ph-III, Karnal Project No. : 21-1041/2007-IA.III Contract No. : HSIA: K:2007:1315 dt.09.10.2007 Page 2 of 184
Shriram Institute for Industrial Research: Delhi
1.3 Regulatory Framework The principal Environmental Regulatory Agency in India is the Ministry of Environment and Forests (MoEF), New Delhi. MoEF formulates environmental policies and accords environmental clearances for the projects. Many State and Central legislation have a bearing on environmental issues but laws on "environment protection" have been notified from time to time. Key Legislations in India
There are various legal instruments at the National & State level, which address environmental management in some form or the other. The key legislations relevant to the project includes following: (a) The Environment (Protection) Act, 1986 (amended 1991) and following Rules there under:
♦ The Environment (Protection) Rules, 1986. ♦ The Hazardous Wastes (Management, Handling and Transboundary Movement) Rules, 2008
amended till date ♦ EIA Notification, 2006 amended till date. ♦ The Noise Pollution (Regulation & Control) Rules 2000
(b) The Forest (Conservation) Act, 1980. (c) The Factories Act, 1948 (with latest amendments). (d) The Motor Vehicles Act, 1988 (amended 2001). (e) The Central Motor Vehicles Rules, 1989 (amended 2005). (f) The Public Liability Insurance Rules, 1991 (amended 1992). (g) The National Environment Tribunal Act, 1995. 1.4 Requirements of prior Environmental Clearance (EC):
The projects or activities requiring prior environmental clearance from the concerned regulatory authority, to be as the Central Government in the Ministry of Environment and Forests for matters falling under Category ‘A’ in the Schedule and at State level the State Environment Impact Assessment Authority (SEIAA) for matters falling under Category ‘B’ in the said Schedule, before any construction work, or preparation of land by the project management except for securing the land, is started on the project or activity: (a) All new projects or activities listed in the Schedule to this notification; (b) Expansion and modernization of existing projects or activities listed in the Schedule to
this notification with addition of capacity beyond the limits specified for the concerned sector, that is, projects or activities which cross the threshold limits given in the Schedule, after expansion or modernization;
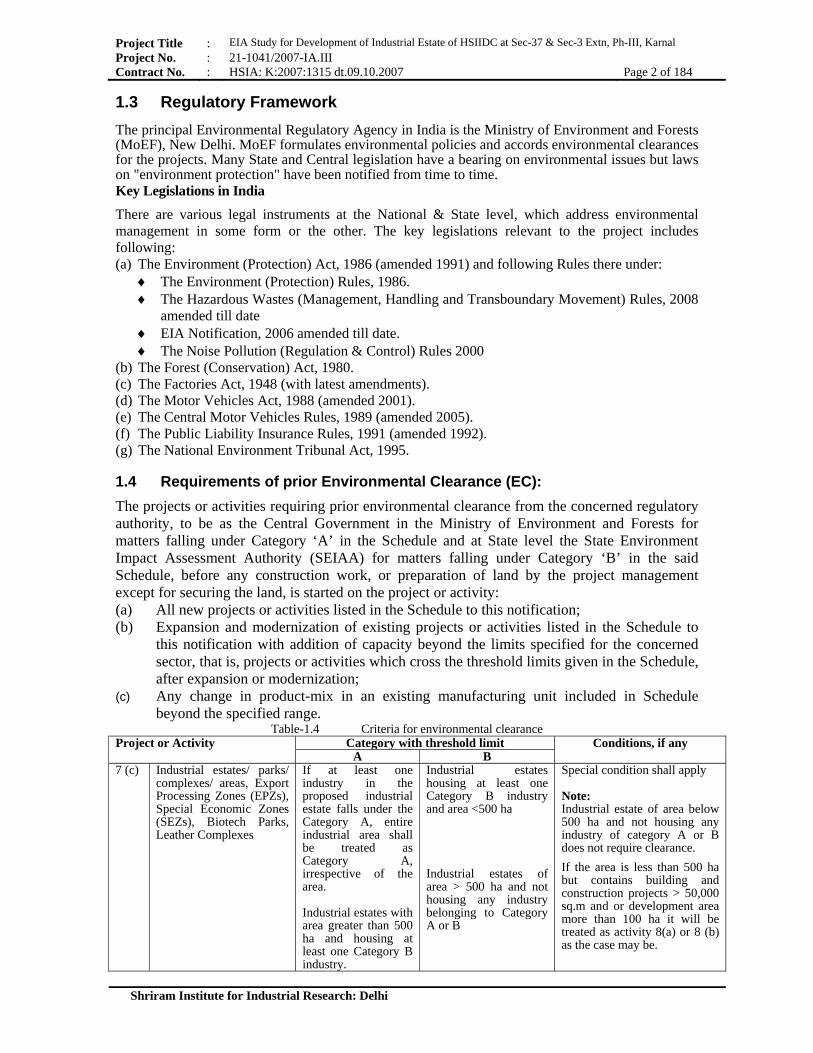
(c) Any change in product-mix in an existing manufacturing unit included in Schedule beyond the specified range.
Table-1.4 Criteria for environmental clearance Project or Activity Category with threshold limit Conditions, if any
A B7 (c) Industrial estates/ parks/
complexes/ areas, Export Processing Zones (EPZs), Special Economic Zones (SEZs), Biotech Parks, Leather Complexes
If at least one industry in the proposed industrial estate falls under the Category A, entire industrial area shall be treated as Category A, irrespective of the area. Industrial estates with area greater than 500 ha and housing at least one Category B industry.
Industrial estates housing at least one Category B industry and area <500 ha Industrial estates of area > 500 ha and not housing any industry belonging to Category A or B
Special condition shall apply Note: Industrial estate of area below 500 ha and not housing any industry of category A or B does not require clearance.
If the area is less than 500 ha but contains building and construction projects > 50,000 sq.m and or development area more than 100 ha it will be treated as activity 8(a) or 8 (b) as the case may be.

Project Title : EIA Study for Development of Industrial Estate of HSIIDC at Sec-37 & Sec-3 Extn, Ph-III, Karnal Project No. : 21-1041/2007-IA.III Contract No. : HSIA: K:2007:1315 dt.09.10.2007 Page 3 of 184
Shriram Institute for Industrial Research: Delhi
1.5 Approved TOR from MOEF
By Speed Post No. 21-1041/2007-IA.III
Government of India Ministry of Environment & Forests
(IA Division) Paryavaran Bhavan,
C.G.O. Complex, Lodi Road, New Delhi-110003. Telefax.: 2436 0789
Dated: June 19, 2008 To M/s Haryana State Industrial&Infrastructure Development Corporation C-13-14, Sec-6, Panchkula Haryana Sub: Environmental Clearance for development of industrial Estates of HSIIDC at Sector-37, I.E, Karnal (Phase-III), Haryana. Dear Sirs, The undersigned is directed to refer to your communication no. HSIIDC:K:2008:12 dated April 03, 2008 regarding the subject mentioned above. 2. The proposal is for development of industrial Estates of HSIIDC at Sector-37, I.E, Karnal (phase-III), Haryana at a cost of Rs. 157.50 crore. The total plot area is 350 acres. Total water requirement will be 6300 KLD. The land will be prepared for establishment of industries based on advanced technologies Viz. agricultural implements, general engineering and auxiliary industries. Apart from it, common facilities for transport, communication, drainage system, water / wastewater facilities, solid waste disposal system, sewage treatment plant, hazardous waste management, rain water harvesting etc. will be provided. 3. The Expert Appraisal Committee for environmental appraisal of Construction projects and industrial estates considered the project during its 27th and 30th meetings held in February 28-29,and May 23-24, 2008 respectively. Based on the consideration of the documents submitted and the presentation made by the project proponent, the Committee prescribed the Terms of Reference (TORs) for preparing EIA report for the above-mentioned project as per enclosed annexure. 4. After preparing the EIA (as per the generic structure prescribed in Appendix-III of the EIA Notification, 2006) covering the above mentioned issues, the proponent will take further necessary action for obtaining environmental clearance in accordance with the procedure prescribed under the EIA Notification, 2006.
(K. C. RATHORE) Additional Director (IA)
Copy to: 1. The Secretary, Department of Environment, Government of Haryana, Secretariat Building, Panchkula,
Haryana. 2. The Member Secretary, Haryana Pollution Control Board, Panchkula, Haryana. 3. The CCF, Regional Office, Ministry of Environment & Forests, Chandigarh. 4. IA - Division, MOEF, Paryavaran Bhawan, CGO Complex, New Delhi. 5. Guard file
(K.C. RATHORE) Additional Director (IA)

Project Title : EIA Study for Development of Industrial Estate of HSIIDC at Sec-37 & Sec-3 Extn, Ph-III, Karnal Project No. : 21-1041/2007-IA.III Contract No. : HSIA: K:2007:1315 dt.09.10.2007 Page 4 of 184
Shriram Institute for Industrial Research: Delhi
Annexure Terms of Reference (TOR) for Environmental Impact Assessment
The approved TOR for the Rapid Environmental Impact Assessment (REIA) study of the proposed development of industrial Estates at Karnal phase III, Haryana is given below: 1. The study area should cover an area of 10 km radius around the proposed site. 2. Location of any National Park, Sanctuary, Elephant / Tiger Reserve (existing as well as proposed), migratory routes,
if any, within 10 km of the project site shall be specified and marked on the map duly authenticated by the Chief Wildlife Warden.
3. Land requirement for the project to be optimized. Unit Item wise break up of land requirement and its availability to be furnished including for STP/CETP secured land fill site etc.
4. Provide comprehensive details of the following: a. planned activities, b. support facilities, c. environmental management utilities
i. drainage system ii. water conservation measures iii. sewage treatment iv. effluent treatment v. solid waste management vi. effluent recycling and discharge vii. hazardous waste management & handling, disposal viii. landscape development ix. energy conservation measures x. odor management
d. project layout, e. site location maps, f. logistic hub/ parking details g. transportation facilities, h. residential and other community facilities etc. i. overall carrying capacity of the environment.
5. Detailed description of the existing environmental conditions shall be provided covering physical, biological and socio-economic attributes. a. A detailed description of the existing land use (supported by satellite imagery), soil characteristics/ geology in
the study area shall be covered in it. Special emphasis shall be placed on drainage patterns. b. The soil of the area shall be tested from 5 - 6 locations in the project area. c. Water quality (ground/surface) and Wastewater Quality study at project area(8 sources). Sampling frequency:
Grab(once during the study period); Test Parameters: Ph, temperature, turbidity, hardness, Ca, Mg, Cl, SO4, NO3, F, Na, K, Alkalinity, T-N, T-P, DO, BOD, COD, Phenol, Heavy/ Toxic Metals(Pb, Cd, Zn, Cu, Cr, As, Hg, Se), Total Coliform.
d. Water quality of nearby River, if any, Source of water supply and nearby water ponds shall be analyzed. e. Climatic conditions of the study area shall be monitored for hourly wind speed, wind direction, relative
humidity, ambient dry and wet bulb temperatures and precipitation. f. Ambient air quality in the study area would be monitored at 6 locations on twice a week for 12 weeks (one
season) for SPM, RSPM, SO2, HC, CO, NOx. One complete season AAQ data (except monsoon) to be given along with the dates of monitoring. The location of the monitoring stations should be so decided so as to take into consideration the pre-dominant downwind direction, population zone and sensitive receptors including reserved forests. There should be at least one monitoring station in the upwind direction.
g. Impact of the project on the AAQ of the area. Details of the model used and the input data used for modelling should also be provided. The air quality contours may be plotted on a location map showing the location of project site, habitation nearby, sensitive receptors, if any. The wind roses should also be shown on this map.
h. Noise levels at site and ambient noise levels in the nearby villages, National Highway and State Highway as well as project site shall be monitored to set up baseline noise levels. For this, noise level monitoring shall be conducted during day and nighttime. Traffic density and noise at the connecting road to State Highway.
i. Identification of existing potential sources of pollution like industries in the study area. j. Examine the feasibility of zero discharge. In case of any proposed discharge, its quantity, quality and point of
discharge, users downstream etc. should be provided. k. Identification of available facilities for solid waste management near the project location. l. Identification of municipal solid waste disposal facilities in the near by area. m. Details of existing water supply, rail and road networks. n. Availability of water, power, and other raw material etc. and their actual demands, vis a vis constraints.
Commitment regarding availability of requisite quantity of water from the competent authority. o. A detailed description of the flora and fauna (terrestrial and aquatic) of the area shall be given in the
environmental assessment report.

Project Title : EIA Study for Development of Industrial Estate of HSIIDC at Sec-37 & Sec-3 Extn, Ph-III, Karnal Project No. : 21-1041/2007-IA.III Contract No. : HSIA: K:2007:1315 dt.09.10.2007 Page 5 of 184
Shriram Institute for Industrial Research: Delhi
p. Present and projected population; present and proposed land use; planned development activities, issues relating to squatting and relocation, community structure, employment, distribution of income, goods and services; recreation; public health and safety; cultural peculiarities, aspirations and attitudes shall be explored in study.
q. The historical importance of the area shall also be examined in the study. While this analysis is being conducted, it is expected that an assessment of public perception of the proposed development be conducted.
r. Details regarding availability of social infrastructure and future projections, details of facilities such as sanitation, fuel, restroom etc. to be provided to the labour force during construction as well as to the casual workers including truck drivers during operation phase.
6. Environmental condition scenarios shall be developed based on industrial activities and pollution potentials. 7. Two different kinds of scenarios shall be studied to work out techno-economically feasible model of the R&R
policy of the State. 8. Each industrial activity shall be defined with respect to its manufacturing process, product, material balance,
waste generation, treatment and its disposal. 9. The mass balance for each type of industry giving material in and out etc. shall be taken into account. Planning
of industries with respect to flow of goods and services in sequential order and workout production figures with respect to utilization of automatic and labour intensive technology.
10. Cumulative impact on regional supportive capacity shall be studied in terms of population density, water supply, sewerage, storm water drainage, power supply, educational facilities, medical facilities, public transport, traffic, housing for EWS, and communities facilities etc.
11. All kind of resources both renewable and non-renewable shall be taken into account 12. The environmental impacts shall be identified for construction and operation stages of the project. 13. Major environmental issues of concern shall be discussed in the environmental assessment report. Identified
potential impacts could be: a. Air Pollution due to industrial, construction activities & transportation of goods and material b. Change in drainage pattern c. Change in landscape d. Water Pollution due to industrial and domestic wastewater e. Pollution of potable, surface, groundwater water bodies f. Increase in Noise Levels g. Generation of Solid & Hazardous Waste h. Socio-economic and cultural impacts i. Impact on Flora & Fauna j. Odor problem due to industrial activity
14. The impacts shall be distinguished between significant positive and negative impacts, direct and indirect impacts.
15. Project activities and impacts shall be represented in matrix form with separate matrices for pre and post mitigation scenarios.
16. Measures shall be prepared for avoiding, as far as possible, any adverse impacts due to proposed development. 17. Identification of the industries which should be avoided in the industrial estate. 18. An Environmental Management Plan (EMP), specifying stage of implementation, time frame, responsibility and
resources shall also be prepared along with basic designs drawings, cost estimates and implementation logistics for environmentally balanced industrial complexes, rain water harvesting, waste water recycling, site flooding mitigation plan, landscaping and green belt, use of eco friendly building material, use of solar energy for streetlights, use of wind/ biomass as resource, energy conservation as per ECBS norms, fire prevention & control plan and traffic management plan.
19. An outline-monitoring programme for construction and operation stage shall also be developed. 20. The monitoring programme shall include the parameters to be monitored with frequency, locations and
reporting. 21. A detailed environmental budget and green belt development proposal would also be presented. 22. Besides the above, the following general points will be followed: -
a) All documents to be properly referenced with index, page numbers and continuous page numbering. b) Where data is presented in the report especially in table, the period in which the data was collected and the source
should invariably be indicated. c) Where the documents provided are in a language other than English, an English translation should be provided. d) The CETP may be planned after carefully studying the need to have such common facility indicating the capacity and
technology proposed to be adopted. Plan shall be prepared taking in to account water conservation, energy consumption and conservation plan. Energy efficient and cost effective technology should be identified. Special emphasis should be given for identification of group/mix of industries while designing the CETP so as to meet the stipulated standards brought out by MOEF (CPCB)/SPCB.
e) Explore possibility of utilizing waste of one unit as raw material for the other units. f) Chemical emergency response and rescue system proposed may be indicated including onsite and offsite disaster
management plans. ****
Project Title : EIA Study for Development of Industrial Estate of HSIIDC at Sec-37 & Sec-3 Extn, Ph-III, Karnal Project No. : 21-1041/2007-IA.III Contract No. : HSIA: K:2007:1315 dt.09.10.2007 Page 6 of 184
Shriram Institute for Industrial Research: Delhi
1.6 Compliance with respect to the TOR issued by Expert Appraisal Committee
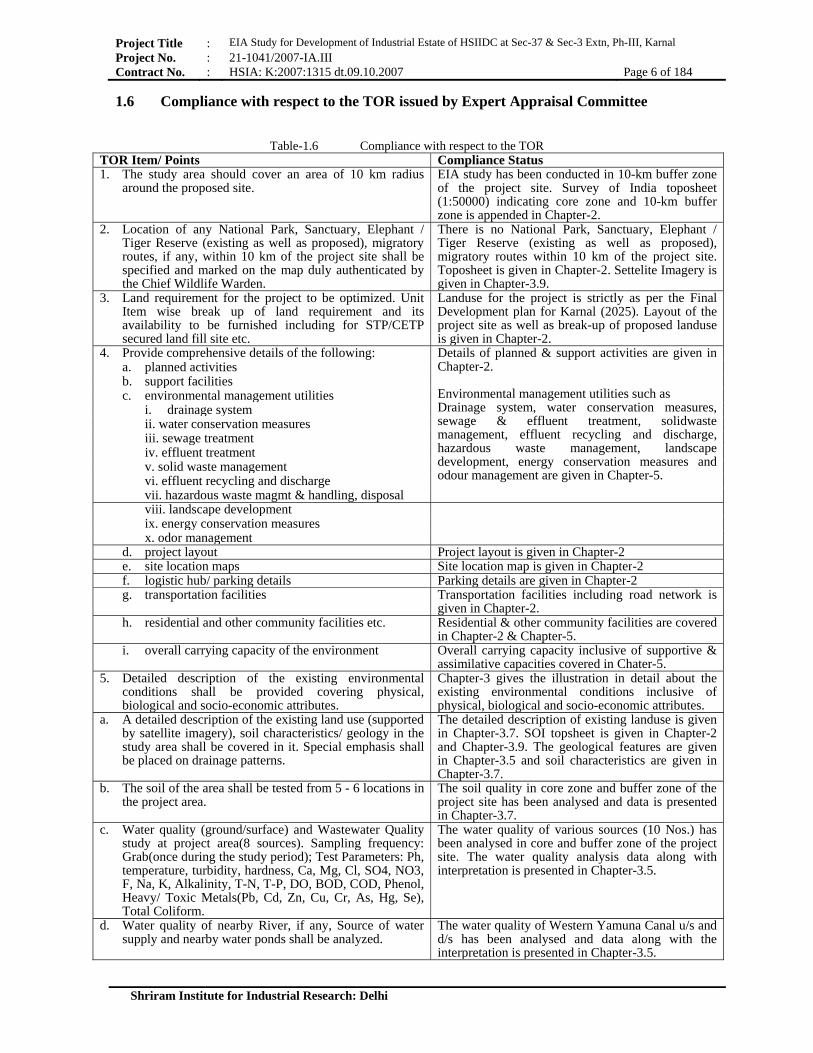
Table-1.6 Compliance with respect to the TOR TOR Item/ Points Compliance Status1. The study area should cover an area of 10 km radius
around the proposed site. EIA study has been conducted in 10-km buffer zone of the project site. Survey of India toposheet (1:50000) indicating core zone and 10-km buffer zone is appended in Chapter-2.
2. Location of any National Park, Sanctuary, Elephant / Tiger Reserve (existing as well as proposed), migratory routes, if any, within 10 km of the project site shall be specified and marked on the map duly authenticated by the Chief Wildlife Warden.
There is no National Park, Sanctuary, Elephant / Tiger Reserve (existing as well as proposed), migratory routes within 10 km of the project site. Toposheet is given in Chapter-2. Settelite Imagery is given in Chapter-3.9.
3. Land requirement for the project to be optimized. Unit Item wise break up of land requirement and its availability to be furnished including for STP/CETP secured land fill site etc.
Landuse for the project is strictly as per the Final Development plan for Karnal (2025). Layout of the project site as well as break-up of proposed landuse is given in Chapter-2.
4. Provide comprehensive details of the following: Details of planned & support activities are given in Chapter-2. Environmental management utilities such as Drainage system, water conservation measures, sewage & effluent treatment, solidwaste management, effluent recycling and discharge, hazardous waste management, landscape development, energy conservation measures and odour management are given in Chapter-5.
a. planned activities b. support facilities c. environmental management utilities
i. drainage system ii. water conservation measures iii. sewage treatment iv. effluent treatment v. solid waste management vi. effluent recycling and dischargevii. hazardous waste magmt & handling, disposalviii. landscape development ix. energy conservation measures x. odor management
d. project layout Project layout is given in Chapter-2 e. site location maps Site location map is given in Chapter-2 f. logistic hub/ parking details Parking details are given in Chapter-2 g. transportation facilities Transportation facilities including road network is
given in Chapter-2.h. residential and other community facilities etc. Residential & other community facilities are covered
in Chapter-2 & Chapter-5. i. overall carrying capacity of the environment Overall carrying capacity inclusive of supportive &
assimilative capacities covered in Chater-5.5. Detailed description of the existing environmental
conditions shall be provided covering physical, biological and socio-economic attributes.
Chapter-3 gives the illustration in detail about the existing environmental conditions inclusive of physical, biological and socio-economic attributes.
a. A detailed description of the existing land use (supported by satellite imagery), soil characteristics/ geology in the study area shall be covered in it. Special emphasis shall be placed on drainage patterns.
The detailed description of existing landuse is given in Chapter-3.7. SOI topsheet is given in Chapter-2 and Chapter-3.9. The geological features are given in Chapter-3.5 and soil characteristics are given in Chapter-3.7.
b. The soil of the area shall be tested from 5 - 6 locations in the project area.
The soil quality in core zone and buffer zone of the project site has been analysed and data is presented in Chapter-3.7.
c. Water quality (ground/surface) and Wastewater Quality study at project area(8 sources). Sampling frequency: Grab(once during the study period); Test Parameters: Ph, temperature, turbidity, hardness, Ca, Mg, Cl, SO4, NO3, F, Na, K, Alkalinity, T-N, T-P, DO, BOD, COD, Phenol, Heavy/ Toxic Metals(Pb, Cd, Zn, Cu, Cr, As, Hg, Se), Total Coliform.
The water quality of various sources (10 Nos.) has been analysed in core and buffer zone of the project site. The water quality analysis data along with interpretation is presented in Chapter-3.5.
d. Water quality of nearby River, if any, Source of water supply and nearby water ponds shall be analyzed.
The water quality of Western Yamuna Canal u/s and d/s has been analysed and data along with the interpretation is presented in Chapter-3.5.

Project Title : EIA Study for Development of Industrial Estate of HSIIDC at Sec-37 & Sec-3 Extn, Ph-III, Karnal Project No. : 21-1041/2007-IA.III Contract No. : HSIA: K:2007:1315 dt.09.10.2007 Page 7 of 184
Shriram Institute for Industrial Research: Delhi
e. Climatic conditions of the study area shall be monitored for hourly wind speed, wind direction, relative humidity, ambient dry and wet bulb temperatures and precipitation.
Data of the climatic condition of study area (hourly readings for three months) with respect to temperature, RH, wind direction, wind speed are presented in Chapter-3.3. Month wise rainfall data of five years is also given from IMD source.
f. Ambient air quality in the study area would be monitored at 6 locations on twice a week for 12 weeks (one season) for SPM, RSPM, SO2, HC, CO, NOx. One complete season AAQ data (except monsoon) to be given along with the dates of monitoring. The location of the monitoring stations should be so decided so as to take into consideration the pre-dominant downwind direction, population zone and sensitive receptors including reserved forests. There should be at least one monitoring station in the upwind direction.
Ambient Air Quality in the core and buffer zone of the project site has been monitored for twice in a week for 12 weeks (one non-monsoon season) for all the relevant parameters. Location map along with the data compilation and interpretation is given in Chapter-3.2. AAQ locations include the pre-dominat wind direction and sensitive receptors. Location description is fixed with the latitudes and longitudes.
g. Impact of the project on the AAQ of the area. Details of the model used and the input data used for modelling should also be provided. The air quality contours may be plotted on a location map showing the location of project site, habitation nearby, sensitive receptors, if any. The wind roses should also be shown on this map.
ISCST3 EPA approved model has been used for Air pollution dispersion modeling which uses the steady-state Gaussian Plume equation for continuous elevated sources. The sources coordinates include down-wind, cross-wind and vertical directions. 1st highest 1-hr average GLC and 2nd highest 1-hr GLC are estimated and presented along with the contours in Chapter-3.2.5. Month wise windrose diagrams along with the data analysis are presented in Chapter-3.3.
h. Noise levels at site and ambient noise levels in the nearby villages, National Highway and State Highway as well as project site shall be monitored to set up baseline noise levels. For this, noise level monitoring shall be conducted during day and nighttime. Traffic density and noise at the connecting road to State Highway.
The Ambient Noise level has been monitored in the core zone and buffer zone of project site. The data alongwith the interpretation has been presented in chapter-3.4. Traffic density data, which has been monitored on hourly basis for 24-hours, is presented along with interpretation and graphical presentation in Chapter-3.10.
i. Identification of existing potential sources of pollution like industries in the study area.
Details are provided in Chapter-4 & 5.
j. Examine the feasibility of zero discharge. In case of any proposed discharge, its quantity, quality and point of discharge, users downstream etc. should be provided.
Details are provided in chapter-3.5,3.6 and 5.0.
k. Identification of available facilities for solid waste management near the project location.
Details are provided along with the plan and budget in chater-5.
l. Identification of municipal solid waste disposal facilities in the near by area.
The district administration of Yamunanagar is constructing a solid waste management site for Yamunanagar & Jagadhri, which is at a distance of 10-km from the proposed site. The facility of collection and lifting the waste from project site would be provided by HSIIDC.
m. Details of existing water supply, rail and road networks. Details are given in Chapter-2 & 5 alongwith the layout.
n. Availability of water, power, and other raw material etc. and their actual demands, vis a vis constraints. Commitment regarding availability of requisite quantity of water from the competent authority.
Details are given in Chapter-2 & 5.
o. A detailed description of the flora and fauna (terrestrial and aquatic) of the area shall be given in the environmental assessment report.
The detailed description of the flora and fauna (terrestrial & aquatic) are given in the Chapter-3.9.
p. Present and projected population; present and proposed land use; planned development activities, issues relating to squatting and relocation, community structure, employment, distribution of income, goods and services; recreation; public health and safety; cultural peculiarities, aspirations and attitudes shall be explored in study.
Demographic data in detail alongwith data analysis with respect to various socio-economic attributes are presented in Chapter-3.8. Attributes like connectivity, power supply, P&T services, drinking water, educational facilities, medical facilities etc. are also assessed and are included in the socio-economic index of the area.
q. The historical importance of the area shall also be Environmental sensitivity analysis has been done

Project Title : EIA Study for Development of Industrial Estate of HSIIDC at Sec-37 & Sec-3 Extn, Ph-III, Karnal Project No. : 21-1041/2007-IA.III Contract No. : HSIA: K:2007:1315 dt.09.10.2007 Page 8 of 184
Shriram Institute for Industrial Research: Delhi
examined in the study. While this analysis is being conducted, it is expected that an assessment of public perception of the proposed development be conducted.
and details are provided in the Chapter-3.7
r. Details regarding availability of social infrastructure and future projections, details of facilities such as sanitation, fuel, restroom etc. to be provided to the labour force during construction as well as to the casual workers including truck drivers during operation phase.
Details of social infrastructure together with wor participation rate are given in Chapter-3.7. Details regarding availability of social infrastructure for labour force during the construction period of the project are provided in Chapter-5.
6. Environmental condition scenarios shall be developed based on industrial activities and pollution potentials.
Detailed environmental conditions scenarios are discussed in Chapter-4.
7. Two different kinds of scenarios shall be studied to work out techno-economically feasible model of the R&R policy of the State.
R&R aspects are given in Chapter-2 and Chapter-5.
8. Each industrial activity shall be defined with respect to its manufacturing process, product, material balance, waste generation, treatment and its disposal.
Industrial activities along with the size of industries expected to come up in the Ie are given in Chapter-2.
9. The mass balance for each type of industry giving material in and out etc. shall be taken into account. Planning of industries with respect to flow of goods and services in sequential order and workout production figures with respect to utilization of automatic and labour intensive technology.
Detailed description and type of industries are discussed in the Chapter-2.
10. Cumulative impact on regional supportive capacity shall be studied in terms of population density, water supply, sewerage, storm water drainage, power supply, educational facilities, medical facilities, public transport, traffic, housing for EWS, and communities facilities etc.
Cumulative impact analysis has been done and is reported in Chapter-4.
11. All kind of resources both renewable and non-renewable shall be taken into account
All kind of resources both renewable and non-renewable are taken into account. Details are presented in Chapter-5.
12. The environmental impacts shall be identified for construction and operation stages of the project.
The Environmental Impacts are identified both during construction and operation phase of the project and are reported in Chapter-4.
13. Major environmental issues of concern shall be discussed in the environmental assessment report. Identified potential impacts could be:
All major issues of concerns were considered during the environmental impact analysis and are reported in Chapter-4
a. Air Pollution due to industrial, construction activities & transportation of goods and material
Air pollution scenarios are considered due to various activities in detailed impact analysis.
b. Change in drainage pattern Drainage pattern has been considered c. Change in landscape Landscape has been taken into account d. Water Pollution due to industrial and domestic
wastewater e. Pollution of potable, surface, groundwater water bodies
Detailed impact analysis has been done related to water and water pollution aspects.
f. Increase in Noise Levels Impact analysis due to noise has been consideredg. Generation of Solid & Hazardous Waste Impacts due to solid & hazardous wastes have been
considered.h. Socio-economic and cultural impacts Socio-economic & cultural aspects are taken into
consideration in impact analysis. i. Impact on Flora & Fauna Impacts on flora & fauna are studies. j. Odor problem due to industrial activity Impacts due to odour have been considered.14. The impacts shall be distinguished between significant
positive and negative impacts, direct and indirect impacts.
All positive and negative impacts are considered and analysed.
15. Project activities and impacts shall be represented in matrix form with separate matrices for pre and post mitigation scenarios.
Impact analysis included potential impacts, sources and safeguard measures.
16. Measures shall be prepared for avoiding, as far as possible, any adverse impacts due to proposed development.
Details are reported in the Environmental Management Plan in Chapter-5.
17. Identification of the industries, which should be avoided in the industrial estate.
The size and type of industries have been identified. Details given in Chapter-2.
18. An Environmental Management Plan (EMP), specifying Detail Environmental Management Plan covering all

Project Title : EIA Study for Development of Industrial Estate of HSIIDC at Sec-37 & Sec-3 Extn, Ph-III, Karnal Project No. : 21-1041/2007-IA.III Contract No. : HSIA: K:2007:1315 dt.09.10.2007 Page 9 of 184
Shriram Institute for Industrial Research: Delhi
stage of implementation, time frame, responsibility and resources shall also be prepared along with basic designs drawings, cost estimates and implementation logistics for environmentally balanced industrial complexes, rain water harvesting, waste water recycling, site flooding mitigation plan, landscaping and green belt, use of eco friendly building material, use of solar energy for streetlights, use of wind/ biomass as resource, energy conservation as per ECBS norms, fire prevention & control plan and traffic management plan.
these aspects are given in Chapter-5
19. An outline-monitoring programme for construction and operation stage shall also be developed.
Environmental Monitoring Plan for the Operational Phase of the project has been delineated.
20. The monitoring programme shall include the parameters to be monitored with frequency, locations and reporting.
Environmental Monitoring Plan includes activity to be monitored, parameters, frequacy etc.
21. A detailed environmental budget and green belt development proposal would also be presented.
Environmental Budget including that for the development and maintenance of green belt is reported in Chapter-5.
22. Besides the above, the following general points will be followed: -
(a) All documents to be properly referenced with index, page numbers and continuous page numbering.
All documents are properly referenced with index, page numbers and continuous page numbering.
(b) Where data is presented in the report especially in table, the period in which the data was collected and the source should invariably be indicated.
Source of data has been mentioned in case where secondary data has been used.
(c) Where the documents provided are in a language other than English, an English translation should be provided.
EIA/EMP report is written in English language only.
(d) The CETP may be planned after carefully studying the need to have such common facility indicating the capacity and technology proposed to be adopted. Plan shall be prepared taking in to account water conservation, energy consumption and conservation plan. Energy efficient and cost effective technology should be identified. Special emphasis should be given for identification of group/mix of industries while designing the CETP so as to meet the stipulated standards brought out by MOEF (CPCB)/SPCB.
The planning of CETP has been done very carefully considering the proposed load in future. CETP layout is given. Cost of CETP (capital & recuurent is given). CETP design meets all the stipulated criterias of MOEF/CPCB.
(e) Explore possibility of utilizing waste of one unit as raw material for the other units.
Such kind of possibilities will be explored during the operational phase of the project.
(f) Chemical emergency response and rescue system proposed may be indicated including onsite and offsite disaster management plans.
Management plan for handling emergencies is given in Chapter-5.
1.7 Organization of the Report The basic objective of identification of impacts is to aid the proponents of the project to rationalize the procedure for an effective environmental management plan, leading to an improvement in environmental quality. This has been attempted by the following procedures: ♦ Collection, collation and analysis of baseline data for various environmental attributes; ♦ Identification of impacts; ♦ Impact assessment; ♦ Evaluation of impacts leading to preparation of Environmental Management Plan; and ♦ Outlining Post Project Monitoring Plan. 1.8 Contents of the Report This Rapid EIA/EMP Report is based on the primary data generated and secondary data collected in the vicinity of the proposed project. The present report contains compilation of data collected/ generated as well as data collation and its interpretation with regulatory guidelines. Generic structure of the present report includes following chapters in nutshell:
Project Title : EIA Study for Development of Industrial Estate of HSIIDC at Sec-37 & Sec-3 Extn, Ph-III, Karnal Project No. : 21-1041/2007-IA.III Contract No. : HSIA: K:2007:1315 dt.09.10.2007 Page 10 of 184
Shriram Institute for Industrial Research: Delhi
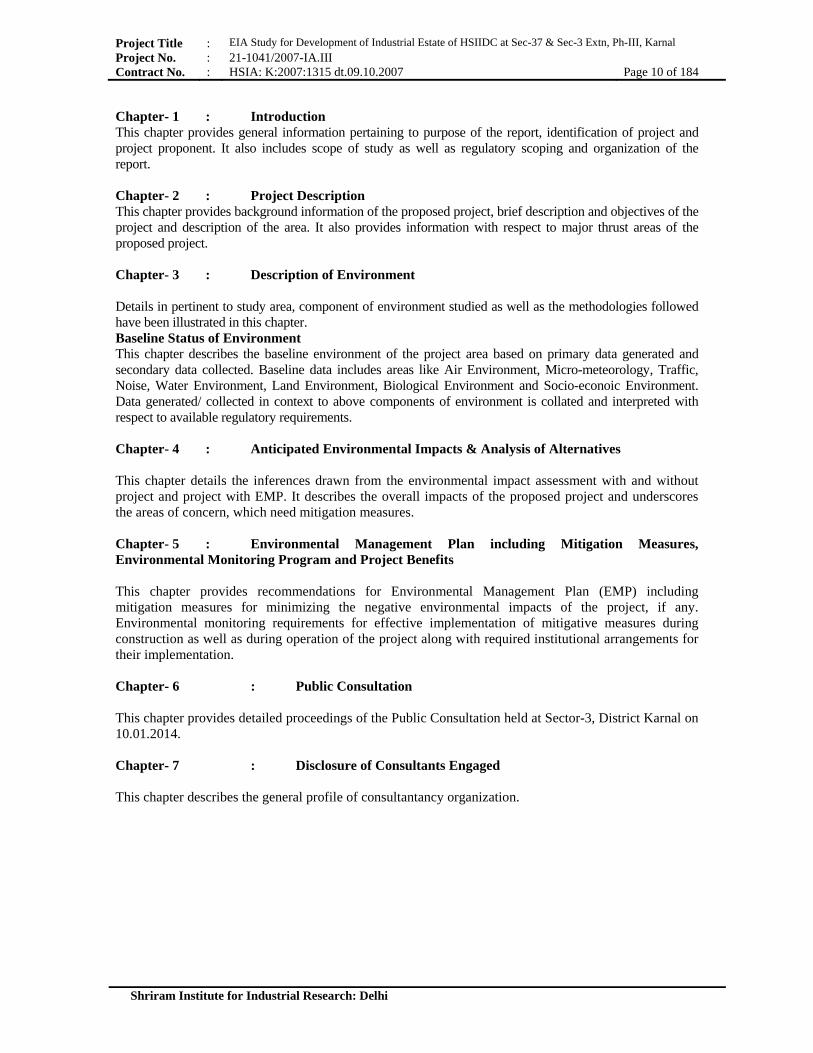
Chapter- 1 : Introduction This chapter provides general information pertaining to purpose of the report, identification of project and project proponent. It also includes scope of study as well as regulatory scoping and organization of the report. Chapter- 2 : Project Description This chapter provides background information of the proposed project, brief description and objectives of the project and description of the area. It also provides information with respect to major thrust areas of the proposed project. Chapter- 3 : Description of Environment Details in pertinent to study area, component of environment studied as well as the methodologies followed have been illustrated in this chapter. Baseline Status of Environment This chapter describes the baseline environment of the project area based on primary data generated and secondary data collected. Baseline data includes areas like Air Environment, Micro-meteorology, Traffic, Noise, Water Environment, Land Environment, Biological Environment and Socio-econoic Environment. Data generated/ collected in context to above components of environment is collated and interpreted with respect to available regulatory requirements. Chapter- 4 : Anticipated Environmental Impacts & Analysis of Alternatives This chapter details the inferences drawn from the environmental impact assessment with and without project and project with EMP. It describes the overall impacts of the proposed project and underscores the areas of concern, which need mitigation measures.
Chapter- 5 : Environmental Management Plan including Mitigation Measures, Environmental Monitoring Program and Project Benefits
This chapter provides recommendations for Environmental Management Plan (EMP) including mitigation measures for minimizing the negative environmental impacts of the project, if any. Environmental monitoring requirements for effective implementation of mitigative measures during construction as well as during operation of the project along with required institutional arrangements for their implementation. Chapter- 6 : Public Consultation This chapter provides detailed proceedings of the Public Consultation held at Sector-3, District Karnal on 10.01.2014. Chapter- 7 : Disclosure of Consultants Engaged
This chapter describes the general profile of consultantancy organization.
Project Title : EIA Study for Development of Industrial Estate of HSIIDC at Sec-37 & Sec-3 Extn, Ph-III, Karnal Project No. : 21-1041/2007-IA.III Contract No. : HSIA: K:2007:1315 dt.09.10.2007 Page 11 of 184
Shriram Institute for Industrial Research: Delhi
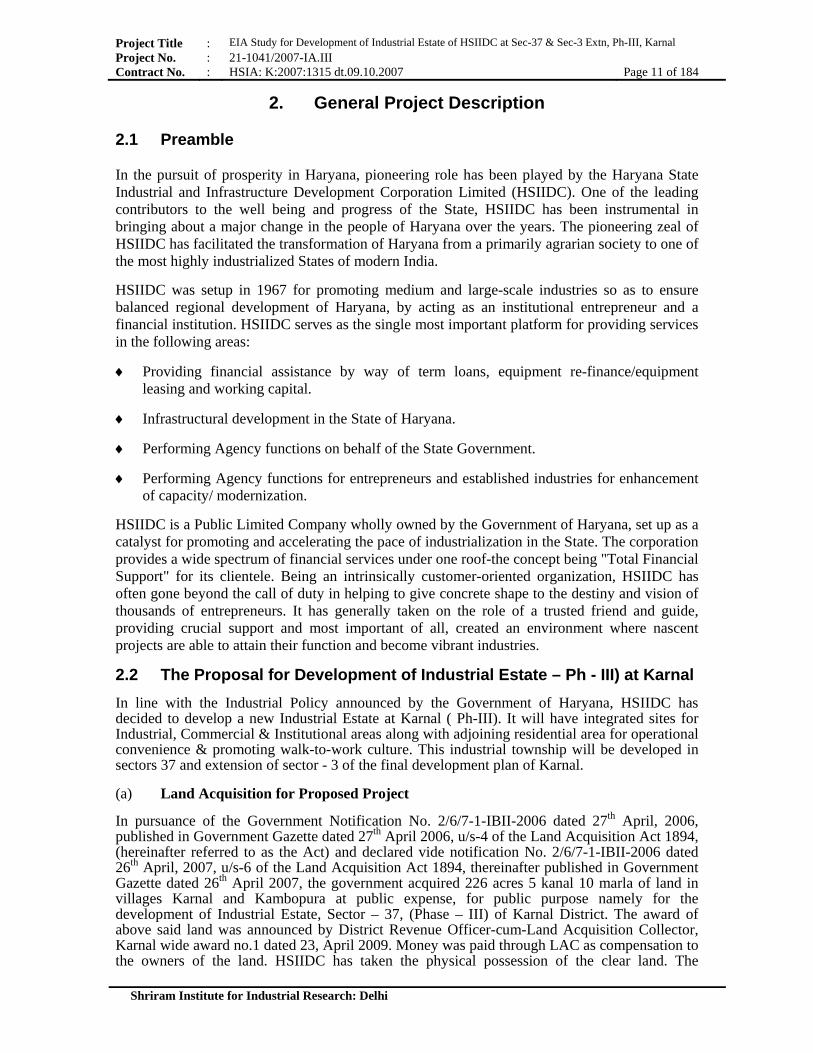
2. General Project Description 2.1 Preamble In the pursuit of prosperity in Haryana, pioneering role has been played by the Haryana State Industrial and Infrastructure Development Corporation Limited (HSIIDC). One of the leading contributors to the well being and progress of the State, HSIIDC has been instrumental in bringing about a major change in the people of Haryana over the years. The pioneering zeal of HSIIDC has facilitated the transformation of Haryana from a primarily agrarian society to one of the most highly industrialized States of modern India. HSIIDC was setup in 1967 for promoting medium and large-scale industries so as to ensure balanced regional development of Haryana, by acting as an institutional entrepreneur and a financial institution. HSIIDC serves as the single most important platform for providing services in the following areas:
♦ Providing financial assistance by way of term loans, equipment re-finance/equipment leasing and working capital.
♦ Infrastructural development in the State of Haryana.
♦ Performing Agency functions on behalf of the State Government.
♦ Performing Agency functions for entrepreneurs and established industries for enhancement of capacity/ modernization.
HSIIDC is a Public Limited Company wholly owned by the Government of Haryana, set up as a catalyst for promoting and accelerating the pace of industrialization in the State. The corporation provides a wide spectrum of financial services under one roof-the concept being "Total Financial Support" for its clientele. Being an intrinsically customer-oriented organization, HSIIDC has often gone beyond the call of duty in helping to give concrete shape to the destiny and vision of thousands of entrepreneurs. It has generally taken on the role of a trusted friend and guide, providing crucial support and most important of all, created an environment where nascent projects are able to attain their function and become vibrant industries.
2.2 The Proposal for Development of Industrial Estate – Ph - III) at Karnal In line with the Industrial Policy announced by the Government of Haryana, HSIIDC has decided to develop a new Industrial Estate at Karnal ( Ph-III). It will have integrated sites for Industrial, Commercial & Institutional areas along with adjoining residential area for operational convenience & promoting walk-to-work culture. This industrial township will be developed in sectors 37 and extension of sector - 3 of the final development plan of Karnal.
(a) Land Acquisition for Proposed Project In pursuance of the Government Notification No. 2/6/7-1-IBII-2006 dated 27th April, 2006, published in Government Gazette dated 27th April 2006, u/s-4 of the Land Acquisition Act 1894, (hereinafter referred to as the Act) and declared vide notification No. 2/6/7-1-IBII-2006 dated 26th April, 2007, u/s-6 of the Land Acquisition Act 1894, thereinafter published in Government Gazette dated 26th April 2007, the government acquired 226 acres 5 kanal 10 marla of land in villages Karnal and Kambopura at public expense, for public purpose namely for the development of Industrial Estate, Sector – 37, (Phase – III) of Karnal District. The award of above said land was announced by District Revenue Officer-cum-Land Acquisition Collector, Karnal wide award no.1 dated 23, April 2009. Money was paid through LAC as compensation to the owners of the land. HSIIDC has taken the physical possession of the clear land. The

Project Title : EIA Study for Development of Industrial Estate of HSIIDC at Sec-37 & Sec-3 Extn, Ph-III, Karnal Project No. : 21-1041/2007-IA.III Contract No. : HSIA: K:2007:1315 dt.09.10.2007 Page 12 of 184
Shriram Institute for Industrial Research: Delhi
proposed development of Industrial Estate, Karnal (Phase – III) at Karnal would be in adherence with the Master Plan-2021 of Karnal, issued by Dept. of Town & Country Planning, Haryana.Moreover, in pursuance of Govt. Notification No. 2/6/13-1-1B-11-2006 dated 11-07-2006, published in Govt. Gazette dated 11-07-2006, u/s – 4 of land acquisition act 1894, (herein after referred to as act) and declared vide notification no. 2/6/13 – 1 – 1B – 11 – 2006 dated 16, July 2007, u/s – 6 of land acquisition act 1894, therein, after published in Govt. Gazette dated 16,July 2007, the Govt. acquired 62 acre, 0 kanal 7 marla of land in village Karnal at public expenses for public purpose namely for expansion of Industrial Estate, Sector – 3 Karnal vide award no.2 dated 23-06-2009. The possession of clear land has been taken over. The compensation to the land owners has been paid through Land Acquisition Collector.
(b) Land use of Proposed Project Site HSIIDC proposes to develop the most modern industrial township with international level of environmental friendly infrastructure. Total area acquired for this purpose is 288 acres, 6 kanal and 10 marla. Out of the area acquired, 160 acre, 5 kanal and 6 marla is from kasba Karnal, 66 acre, and 0 kanal and 17 marla is from near by village Kambopura, and 62 acre 0 kanal and 7 marla is again from kasba Karnal for Sector – 3, Karnal.
Table-2.2 (a) Landuse of Proposed Project Site Schedule of area
Area in acre Karnal Sector – 37 and
Kambopura Sector – 3 Extn Total
Total Land 234.39 62.0 296.39
In the case of Sector - 37
♦ Total area under acquisition - 234.39 Acre ♦ To be planned later - 2.28 Acre ♦ Net area planned - 232.11 ♦ Area under industrial plots would be 75.96 Acre ♦ Are reserved for commercial use would be 15.37 Acre ♦ Area under R & R Policy would be 12.03 Acre ♦ Area under institutional use would be 4.12 Acre ♦ Area under disposal site would be 12.00 Acre ♦ Area reserved for utilities would be 5.58Acre ♦ Area reserved for Multi-Specialty Hospital would be 4.53 Acre ♦ Area under Flatted Factories would be 11.51 Acre ♦ Area under open spaces parking, Roads, Green belts etc would be 91.01.Acre.
Green belt will be provided situated along High way No.1, along internal roads and in green plots for an approximate cost of Rs. 101.80 lakhs including contingencies. It is proposed that green belt including trees and shrubs will be planted as per set norms of HSIIDC. In the case of Sector – 3 Extn ♦ Total Area planned for Sector – 3 Extn. is 62 acre - ♦ Total Area acquired 46.76 Acre. ♦ Area to be planned later would be 25.24 Acre ♦ Area under industrial plots would be 19.36 Acre ♦ Area under Commercial and Public Utilities would be 2.20 Acre ♦ Area reserved under R & R Policy and Institutional use would be 6.31 Acre ♦ Area under Road and Open Spaces would be 17.49 Acre.
Project Title : EIA Study for Development of Industrial Estate of HSIIDC at Sec-37 & Sec-3 Extn, Ph-III, Karnal Project No. : 21-1041/2007-IA.III Contract No. : HSIA: K:2007:1315 dt.09.10.2007 Page 13 of 184
Shriram Institute for Industrial Research: Delhi
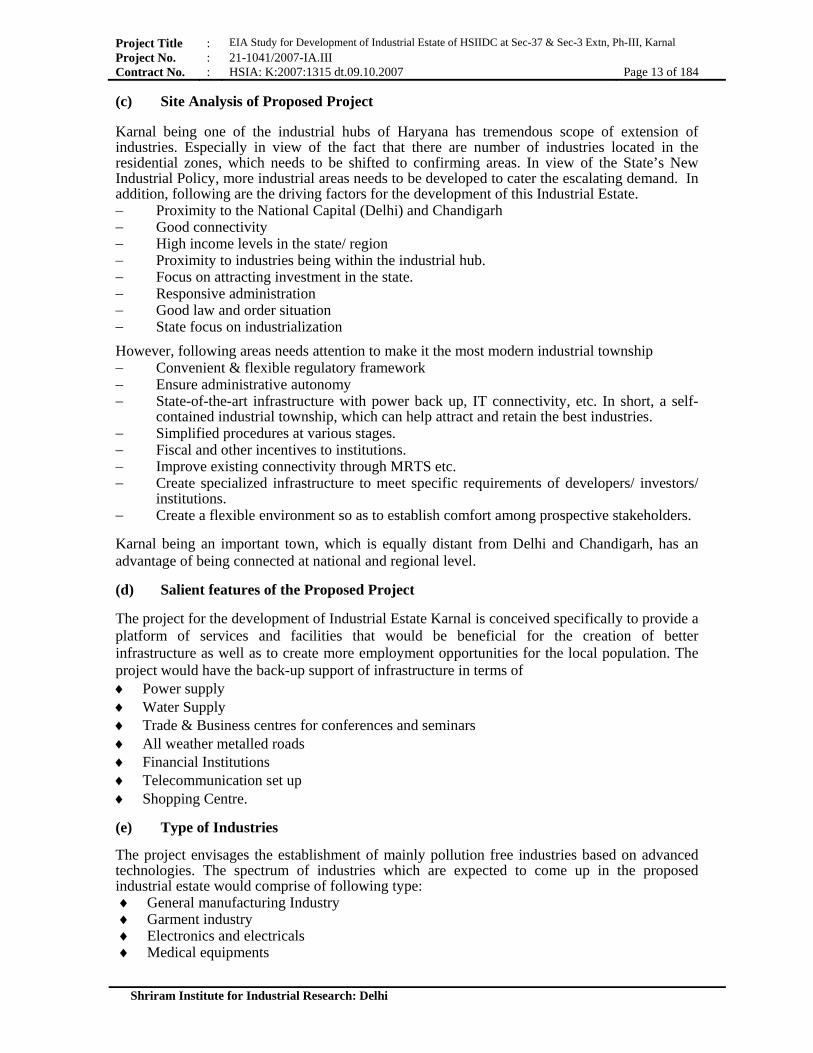
(c) Site Analysis of Proposed Project
Karnal being one of the industrial hubs of Haryana has tremendous scope of extension of industries. Especially in view of the fact that there are number of industries located in the residential zones, which needs to be shifted to confirming areas. In view of the State’s New Industrial Policy, more industrial areas needs to be developed to cater the escalating demand. In addition, following are the driving factors for the development of this Industrial Estate. − Proximity to the National Capital (Delhi) and Chandigarh − Good connectivity − High income levels in the state/ region − Proximity to industries being within the industrial hub. − Focus on attracting investment in the state. − Responsive administration − Good law and order situation − State focus on industrialization
However, following areas needs attention to make it the most modern industrial township − Convenient & flexible regulatory framework − Ensure administrative autonomy − State-of-the-art infrastructure with power back up, IT connectivity, etc. In short, a self-
contained industrial township, which can help attract and retain the best industries. − Simplified procedures at various stages. − Fiscal and other incentives to institutions. − Improve existing connectivity through MRTS etc. − Create specialized infrastructure to meet specific requirements of developers/ investors/
institutions. − Create a flexible environment so as to establish comfort among prospective stakeholders. Karnal being an important town, which is equally distant from Delhi and Chandigarh, has an advantage of being connected at national and regional level. (d) Salient features of the Proposed Project The project for the development of Industrial Estate Karnal is conceived specifically to provide a platform of services and facilities that would be beneficial for the creation of better infrastructure as well as to create more employment opportunities for the local population. The project would have the back-up support of infrastructure in terms of ♦ Power supply ♦ Water Supply ♦ Trade & Business centres for conferences and seminars ♦ All weather metalled roads ♦ Financial Institutions ♦ Telecommunication set up ♦ Shopping Centre. (e) Type of Industries The project envisages the establishment of mainly pollution free industries based on advanced technologies. The spectrum of industries which are expected to come up in the proposed industrial estate would comprise of following type: ♦ General manufacturing Industry ♦ Garment industry ♦ Electronics and electricals ♦ Medical equipments

Project Title : EIA Study for Development of Industrial Estate of HSIIDC at Sec-37 & Sec-3 Extn, Ph-III, Karnal Project No. : 21-1041/2007-IA.III Contract No. : HSIA: K:2007:1315 dt.09.10.2007 Page 14 of 184
Shriram Institute for Industrial Research: Delhi
♦ Sports goods ♦ CNC machines ♦ Health care items ♦ Sheet metal components ♦ Auxiliary Industries.
The raw material required for input purpose would depend upon the nature of industry likely to come up in the Industrial Estate. The raw material required for industrial units can only be known after floatation of the project. However, it is expected that raw material generally needed for automobile, auto parts, electronic, garments etc. shall be met indigenously and from other sources.
(f) Connectivity
The project would have better connectivity to major towns of country as it is well connected with respect to Railway and road network. There would not be any problem with respect to the supply and procurement. (g) Site Constraints Given below are the rough estimates of plots coming up in the industrial estate. Sector – 37.
Table 2.2(b) Details of Plots of Proposed Project S. No Category ( In Acres) Size in Sq. Metres No. of Plots 1 1.38 5573 (65 x 85.74) 01 2 0.92 3728 01 3 0.88 3573 (47.64 x 75) 03 4 0.87 3521 01 5 0.82 3315 01 6 0.77 3108 017 0.72 2902 018 0.67 2700 01 9 0.61 2471 01 10 0.60 2415 (48.1 x 50.2) 01 11 0.59 2372 (61.67 x 38.47) 03 12 0.57 2310 (38.7 x 59.7) 01 13 0.54 2179 0114 0.44 1800 (30 x 60) 50 15 0.44 1768 01 16 0.34 1368 (30.4 x 45) 01 17 0.32 1299 01 18 0.31 1237 (27.5 x 45) 01 19 0.30 1222 01 20 0.28 1145 01 21 0.27 1074 01 22 0.26 1069 01 23 0.25 1012.5 (22.5 x 45) 128 24 0.11 450 (15 X 30) 54 Total 257

Project Title : EIA Study for Development of Industrial Estate of HSIIDC at Sec-37 & Sec-3 Extn, Ph-III, Karnal Project No. : 21-1041/2007-IA.III Contract No. : HSIA: K:2007:1315 dt.09.10.2007 Page 15 of 184
Shriram Institute for Industrial Research: Delhi
Sector – 3 Extn.
S. No Category ( In Acres) Size in Sq. Meters No. of Plots 1 1.00 4045 (45 x 90) 09 2 0.78 3156 01 3 0.67 2710 01 4 0.50 1800 (30 x 60) 22 5 0.25 1012 (22.5 x 45) 65 6 0.125 450 (15 x 30) 26 7 0.062 250 (10 x 25) 14 Total 138
2.3 Infrastructure Development Proposal for Proposed Project (a) Existing Roads & Connectivity
At present the main access to the project area is from the 45 m wide outer periphery road.
(i) Road Hierarchy under the proposal
The classification of roads in terms of road hierarchy depends upon access to abutting property and travel mobility. Accessibility refers to the level of control over traffic entering of existing road way to or from adjacent properties. Mobility refers to the ability of road to move traffic for example ‘express way’ emphasizes high degree of mobility, but have virtually no access to abutting properties. Local roads on the other hand mainly provide access to the abutting properties while discouraging the mobility through traffic. The road hierarchy for the present project is proposed as under: External roads
♦ 45 M outer peripheral road with 30 M green belt on inner side (As per the lay out plan). Internal roads
♦ 30 M wide road : Internal major roads ♦ 20 M wide road : Collector streets ♦ 18 M wide road : Collector streets ♦ 15 M wide road : Collector streets
(ii) Proposed Road Levels
The slope of the master roads has been kept according to proposed storm water drainage proposal. The formation levels of other roads have been fixed accordingly, and as per standard specifications. (iii) Right of Way
The right of way as well as formation width together with metalled width, side slope, of various roads will be as under:
Table-2.3 (a) Information wrt Right of Way, Formation Width etc
Right of Way (m)
Formation width (m)
Side slope Hort.-Vert.
Mettaled width (m) Service Lanes
Camber (%)
15 15 2:1 7.5 - 2.0 18 18 2:1 7.5 - 2.0 30 30 2:1 12.0 - 2.045 45 2:1 2 carriage ways 10 m wide - 2.0

Project Title : EIA Study for Development of Industrial Estate of HSIIDC at Sec-37 & Sec-3 Extn, Ph-III, Karnal Project No. : 21-1041/2007-IA.III Contract No. : HSIA: K:2007:1315 dt.09.10.2007 Page 16 of 184
Shriram Institute for Industrial Research: Delhi
(iv) Pavement Design
The pavement design will be done as per IRC-37 and IRC-58 depending upon the type of pavement. The soil classification shall be carried out as per IS:1498 and tests like field density, CBR and other desirable laboratory tests shall be carried out as per IS:2720 (relevant parts).
(v) Specifications for the pavement The following specifications for the pavement design has to be considered:
♦ The side slopes to be 2 horizontal to 1 vertical with minimum camber 2.0%.
♦ The compaction of the embankment of the roads shall be considered satisfactory when desired DBD is achieved.
♦ The requirements of earth work in embankment and tentative proposed crust thickness for construction shall be as under
− Physical requirement of embankment and sub-grade shall be as per MORTH specifications.
− Compaction of embankment and sub grade shall be as per MORTH specifications.
− The tentative road crust thickness shall be as under: ( As per the current design) ♦ 15 m – 200 mm GSB + 200 mm WMM + 75 mm BM + 25 mm SDBC ♦ 18 m – 200 mm GSB + 200 mm WMM + 75 mm BM + 25 mm SDBC ♦ 20 m – 200 mm GSB + 200 mm WMM + 75 mm BM + 25 mm SDBC ♦ 30 m – 250 mm GSB + 200 mm WMM + 75 mm DBM + 40 mm BC ♦ 45 m – 250 mm GSB + 200 mm WMM + 75 mm DBM + 40 mm BC
− The crust thickness may increase or decrease during detailed design depending upon the CBR values.
(vi) Connectivity
♦ The land is abutting NH-I
(b) Electrification Requirement
There are no standard norms for calculation of electrical load for industrial areas. It is also not possible to fix norms as the electric load requirements will be different for different type of industry. However, based on the actual experience of industrial area in Sector-18, 19 & 20 of Gurgaon and IMT Manesar, following benchmark can be made for industrial areas:
Table-2.3 (b) Benchmarking for electric load calculations Sl. Area Electric Load1. 0.125 acre 30 KW2. 0.25 acre 50 KW3. 0.5 acre 75 KW4. 1 acre 100 KW5. 2 acre 200 KW6. 5 acre 1000 KW7. 10 acre 4000 KW8. Above 10 acre 5000 KW
(i) Load Calculations The load calculations for the industrial estate being developed by HSIIDC at industrial area at Karnal for various categories/ landuses would be as under

Project Title : EIA Study for Development of Industrial Estate of HSIIDC at Sec-37 & Sec-3 Extn, Ph-III, Karnal Project No. : 21-1041/2007-IA.III Contract No. : HSIA: K:2007:1315 dt.09.10.2007 Page 17 of 184
Shriram Institute for Industrial Research: Delhi
Table-2.3 (c) Load estimations for proposed project Sl. Category/ Landuse Approx. Area (acres) Tentative Load (MVA)1. Industrial Plots 95.32 20 2. Commercial 17.57 11 3. R & R policy 18.33 0.5 4. Institutional use 4.12 0.25 5 Disposal Site 12.00 0.12 6 Multi – speciality Hospital 4.53 2 7 Utilities 5.67 0.05 8 Open Space, Green Belts etc 123.64 - Total 33.92
(ii) Design & Proposal it is proposed to provide one no. of 132/11 KV substation with 2 x 16/20 MVA power transformers. The land required for the 132/11 KVsub-station would be 4 acres. (iii) Distribution System
The distribution system is proposed as under: ♦ The transformers for other common services should be separately provided for connections. ♦ The streetlights shall be of LED & CFL fittings to economize power consumption.
(iv) Street lighting As per notification issued by Govt. of Haryana vide ref. No. 22/52/05-5 dated 25.06.2008 & UHBVN circular No. D-35/2008 the use of CFL/T-28 Energy Efficient tube lights/ LED lamps shall be mandatory for all electricity consumed in industrial, institutional & commercial sectors having connected load of 30 kW or above. In this context, following proposal has been made:
♦ CFL & LED lights have been proposed on streetlights consisting of 2 units of CFL of 36 watts each to economize power consumption.
♦ 80 watts LED lights have been proposed on 30 metre road on one side at a convenient distance as per design with 9 metre high steel tubular poles.
♦ 80 watts LED lamps have been proposed on 45 metre road in central verge at a convenient distance as per design with 11 metre high steel tubular poles.
♦ At road junctions also 80 watts LED lamps have been proposed.
♦ All street lighting shall be flexible non-metallic, suitable for direct burial, sized to suit wire sizes with a minimum of 50 mm diameter. Road crossing shall be indirect burial conduit.
♦ Phase wise circuits shall be maintained from pole to pole to ensure energy conservation i.e 1/3” of illumination can be switched off at a time.
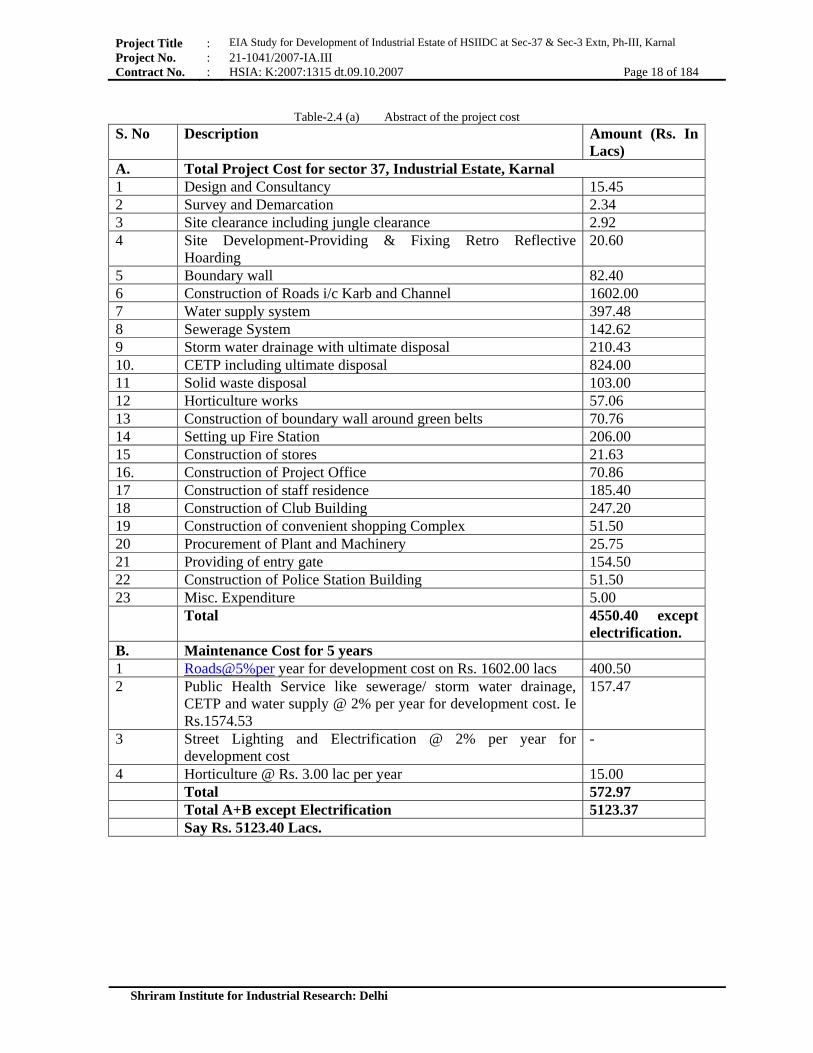
2.4 Abstract of the Project Cost Project cost comprising of cost towards sub-work namely development of roads, water supply, waste water scheme, storm water drainage, electrification & street lighting, horticulture & road side plantation, solid waste management, IT & telecom and office complex, are given in following table.
Project Title : EIA Study for Development of Industrial Estate of HSIIDC at Sec-37 & Sec-3 Extn, Ph-III, Karnal Project No. : 21-1041/2007-IA.III Contract No. : HSIA: K:2007:1315 dt.09.10.2007 Page 18 of 184
Shriram Institute for Industrial Research: Delhi
Table-2.4 (a) Abstract of the project cost
S. No Description Amount (Rs. In Lacs)
A. Total Project Cost for sector 37, Industrial Estate, Karnal 1 Design and Consultancy 15.45 2 Survey and Demarcation 2.34 3 Site clearance including jungle clearance 2.92 4 Site Development-Providing & Fixing Retro Reflective
Hoarding 20.60
5 Boundary wall 82.40 6 Construction of Roads i/c Karb and Channel 1602.00 7 Water supply system 397.48 8 Sewerage System 142.62 9 Storm water drainage with ultimate disposal 210.43 10. CETP including ultimate disposal 824.00 11 Solid waste disposal 103.00 12 Horticulture works 57.06 13 Construction of boundary wall around green belts 70.76 14 Setting up Fire Station 206.00 15 Construction of stores 21.63 16. Construction of Project Office 70.86 17 Construction of staff residence 185.40 18 Construction of Club Building 247.20 19 Construction of convenient shopping Complex 51.50 20 Procurement of Plant and Machinery 25.75 21 Providing of entry gate 154.50 22 Construction of Police Station Building 51.50 23 Misc. Expenditure 5.00 Total 4550.40 except
electrification. B. Maintenance Cost for 5 years 1 Roads@5%per year for development cost on Rs. 1602.00 lacs 400.50 2 Public Health Service like sewerage/ storm water drainage,
CETP and water supply @ 2% per year for development cost. Ie Rs.1574.53
157.47
3 Street Lighting and Electrification @ 2% per year for development cost
-
4 Horticulture @ Rs. 3.00 lac per year 15.00 Total 572.97 Total A+B except Electrification 5123.37 Say Rs. 5123.40 Lacs.

Project Title : EIA Study for Development of Industrial Estate of HSIIDC at Sec-37 & Sec-3 Extn, Ph-III, Karnal Project No. : 21-1041/2007-IA.III Contract No. : HSIA: K:2007:1315 dt.09.10.2007 Page 19 of 184
Shriram Institute for Industrial Research: Delhi
S. No Description Amount (Rs. In
Lacs) A. Total Project Cost for sector 3-Extn., Industrial Estate, Karnal 1 Design and Consultancy 5.15 2 Survey and Demarcation 0.60 3 Site clearance including jungle clearance 0.75 4 Site Development-Providing & Fixing Retro Reflective
Hoarding 20.60
5 Boundary wall 30.90 6 Construction of Roads i/c Karb and Channel 573.90 7 Water supply system 101.63 8 Sewerage System 46.77 9 Storm water drainage with ultimate disposal 64.10 10 Solid waste disposal 5.15 11 Horticulture works 22.42 12 Construction of boundary wall around green belts 14.32 13 Construction of stores 7.21 14 Construction of convenient shopping Complex 20.60 15 Procurement of Plant and Machinery 10.30 16 Misc. Expenditure 5.00 Total 929.40 except
electrification. B. Maintenance Cost for 5 years 1 Roads@5%per year for development cost on Rs. 573.90 lacs 143.48 2 Public Health Service like sewerage/ storm water drainage,
CETP and water supply @ 2% per year for development cost. Ie Rs.212.50 lacs
21.25
3 Street Lighting and Electrification @ 2% per year for development cost
-
4 Horticulture @ Rs. 3.00 lac per year 15.00 Total 179.73 Total A+B except Electrification 1109.13 Say Rs. 1109. Lacs.

PrPrCo
DePlan
roject Title : roject No. : ontract No. :
Shriram Institute
Final evelopment n for Karnal
(2025)
EIA Study for Dev21-1041/2007-IAHSIA: K:2007:1
e for Industrial R
velopment of IndustriA.III 315 dt.09.10.2007
Research: Delhi
ial Estate of HSIIDC
at Sec-37 & Sec-3 EExtn, Ph-III, Karnal
Page 20 of 1184

Project Title : EIA Study for Development of Industrial Estate of HSIIDC at Sec-37 & Sec-3 Extn, Ph-III, Karnal Project No. : 21-1041/2007-IA.III Contract No. : HSIA: K:2007:1315 dt.09.10.2007 Page 21 of 184
Shriram Institute for Industrial Research: Delhi
10-km buffer zone on SOI Toposheet (1:50K)

Project Title : EIA Study for Development of Industrial Estate of HSIIDC at Sec-37 & Sec-3 Extn, Ph-III, Karnal Project No. : 21-1041/2007-IA.III Contract No. : HSIA: K:2007:1315 dt.09.10.2007 Page 22 of 184
Shriram Institute for Industrial Research: Delhi

Project Title : EIA Study for Development of Industrial Estate of HSIIDC at Sec-37 & Sec-3 Extn, Ph-III, Karnal Project No. : 21-1041/2007-IA.III Contract No. : HSIA: K:2007:1315 dt.09.10.2007 Page 23 of 184
Shriram Institute for Industrial Research: Delhi

Project Title : EIA Study for Development of Industrial Estate of HSIIDC at Sec-37 & Sec-3 Extn, Ph-III, Karnal Project No. : 21-1041/2007-IA.III Contract No. : HSIA: K:2007:1315 dt.09.10.2007 Page 24 of 184
Shriram Institute for Industrial Research: Delhi
Project Title : EIA Study for Development of Industrial Estate of HSIIDC at Sec-37 & Sec-3 Extn, Ph-III, Karnal Project No. : 21-1041/2007-IA.III Contract No. : HSIA: K:2007:1315 dt.09.10.2007 Page 25 of 184
Shriram Institute for Industrial Research: Delhi

Project Title : EIA Study for Development of Industrial Estate of HSIIDC at Sec-37 & Sec-3 Extn, Ph-III, Karnal Project No. : 21-1041/2007-IA.III Contract No. : HSIA: K:2007:1315 dt.09.10.2007 Page 26 of 184
Shriram Institute for Industrial Research: Delhi

Project Title : EIA Study for Development of Industrial Estate of HSIIDC at Sec-37 & Sec-3 Extn, Ph-III, Karnal Project No. : 21-1041/2007-IA.III Contract No. : HSIA: K:2007:1315 dt.09.10.2007 Page 27 of 184
Shriram Institute for Industrial Research: Delhi

Project Title : EIA Study for Development of Industrial Estate of HSIIDC at Sec-37 & Sec-3 Extn, Ph-III, Karnal Project No. : 21-1041/2007-IA.III Contract No. : HSIA: K:2007:1315 dt.09.10.2007 Page 28 of 184
Shriram Institute for Industrial Research: Delhi
3. DESCRIPTION OF THE ENVIRONMENT 3.1 Development of Environment Baseline (a) The Objective The Description of Existing Environment for the proposed project facilities will describe the existing environmental conditions in and around the project sites (baseline environmental status). It identifies the environmental parameters that are consequent to the proposed facilities and the impact on these parameters due to the proposed project. Environment Management Plan (EMP), thus, prepared includes the general background of the project like process details, facilities description, details of major utility systems and special care, which needs to be taken during design/ construction/ operation stage for mitigating environmental impacts. The environmental parameters that has been covered include air quality, water quality, aquatic ecology, micrometeorology, noise levels, flora and fauna etc. in accordance with the guidelines of the Ministry of Environment and Forests, Government of India. Based on the project inputs, impact on the environmental parameters has been assessed using the standard methods . The existing environmental quality in the project area has been assessed based on current available data. Wherever data was not available, in order to make fair assessment, actual monitoring in the field have been carried out. The potential sources of pollution owing to the project facilities have been identified and anticipated pollution load has been quantified. The potential environmental impacts have been identified and assessed qualitatively as well as quantitatively and possible changes in the quality of the environment have been predicted. A study on wildlife and flora-fauna has been taken up in and around the project site. An Environmental Management Plan has been drawn up to maintain and enhance the environmental quality around the project sites. The pollution control strategies have been suggested wherever the deterioration of environmental quality is expected. A green-belt/ greenery development plan for the stations has been provided that would enhance the quality of the environment besides attenuating environmental pollution. A post-project monitoring plan (PPMP) has been suggested to monitor the changes in the environmental quality after the implementation of the project. (b) Study Area The study was carried out in the vicinity (within the 10-km radius of proposed Development Site. (c) Study Period Baseline data was generated during Dec-2008 to Mar-2009

Project Title : EIA Study for Development of Industrial Estate of HSIIDC at Sec-37 & Sec-3 Extn, Ph-III, Karnal Project No. : 21-1041/2007-IA.III Contract No. : HSIA: K:2007:1315 dt.09.10.2007 Page 29 of 184
Shriram Institute for Industrial Research: Delhi
(d) Methodology The Approach of Shriram Institute for Industrial Research (SRI) to undertake the present assignment encompassed sound scientific and management practices, to suit the project requirements to ensure efficiency & effectiveness. SRI always endeavoured to optimise the approach for the execution of the specified assignment by incorporating the requirements of the various key components of the project. Approach of SRI reflects its appreciation to the relevant guidelines of regulatory bodies. In nutshell, methodology followed for the execution of present project includes following generic steps: (a) Reconnaissance survey (b) Secondary data collection from government, non-government & academic institutions. (c) Primary data generation at various points representing study area for multi-disciplinary
activities. (d) Data compilation, collation & analysis. (e) Data interpretation with respect to regulatory requirements. (f) Environmental media indices estimation & indicator for describing affected
environment (g) Importance Weighing Techniques for Impact Studies (h) Impact identification (i) Impact prediction & assessment EIA/ EMP Report It includes: ♦ Interpretation of data with respect to the regulatory requirements and derivation of
meaningful scientific conclusions based on critical and comparative study of data generated / collected and analytical findings of supportive & assimilative capacity of the project area.
♦ Significant environmental issues, important findings, assessment of alternatives & necessary
recommendations. ♦ The environmental requirements of regulatory bodies. ♦ Adverse impacts, if any, due to proposed development and which cannot be avoided, has
been mentioned and to minimize such impacts, suggestions will be incorporated to reduce/ mitigate them in Environmental Management Plan.

Project Title : EIA Study for Development of Industrial Estate of HSIIDC at Sec-37 & Sec-3 Extn, Ph-III, Karnal Project No. : 21-1041/2007-IA.III Contract No. : HSIA: K:2007:1315 dt.09.10.2007 Page 30 of 184
Shriram Institute for Industrial Research: Delhi
PROCESS FLOWSHEET OF METHODOLOGY
Project Start-up/ Inception meeting
Project Baseline
Reconnaissance Survey
Data Collection/ Generation (Secondary/ Primary)
Monitoring Methodology Finalization
♦ Data Analysis/ Interpretation ♦ Impact Analysis/ Prediction
Formulation of EMP
EIA/EMP Report
Public Consultation
EIA/EMP Finalization

Project Title : EIA Study for Development of Industrial Estate of HSIIDC at Sec-37 & Sec-3 Extn, Ph-III, Karnal Project No. : 21-1041/2007-IA.III Contract No. : HSIA: K:2007:1315 dt.09.10.2007 Page 31 of 184
Shriram Institute for Industrial Research: Delhi
3.2 Air Environment Air quality is influenced by a number of factors, which includes natural (e.g. winds, thermal profile, humidity etc.) and anthropogenic or man-made (e.g. traffic, emissions etc.) factors. An assessment of the existing air quality status was carried out at five different locations in the vicinity of proposed development site. It would provide the ground level concentration of air quality indicators. The impact of the project on local Ambient Air Quality could be compared with the baseline AAQ scenario. 3.2.1 Selection of Sampling Locations for AAQ Six numbers of Ambient Air Quality (AAQ) monitoring stations, as per the detail given below, were set up in the vicinity of the proposed project site.
Table- 3.2 (a) Description of AAQ monitoring stations in the project area Station Code
Location Description Geo-codes Latitude Longitude
AAQ-1 Kambhopura Core Zone 29°38’12.90” 76°59’02.94” AAQ-2 Ganjogarhi Buffer Zone (4.0 km ESE from CZ) 29°37’35.52” 77°02’32.04” AAQ-3 Bastara Buffer Zone (8.0 km S from CZ) 29°34’06.96” 76°59’19.20” AAQ-4 Baldi Buffer Zone (8.5 km N from CZ) 29°43’06.90” 76°59’24.66” AAQ-5 Ghogripur Buffer Zone (2.0 km WNW from CZ) 29°38’53.10” 76°56’44.70” AAQ-6 Dabri Buffer Zone (8.0 km NNW from CZ) 29°42’09.78” 76°56’16.80” 3.2.2 Monitoring Schedule Monitoring was carried out twice in a week for 12 weeks duration in the months Dec-2008 to Mar-2009. Parameters like Suspended Particulate Matter (SPM), Respirable Particulate Matter (RPM), Sulfur dioxide (SO2) and Oxides of Nitrogen (NOx) were measured on the basis of 24-hourly averaging period, whereas parameters like Carbon monoxide (CO) and Hydrocarbons (HC) were monitored on the basis of 8-hourly averaging period. 3.2.3 AAQ monitoring Methodology (a) Suspended Particulate Matter (SPM) Atmospheric air was drawn into a covered High Volume Sampler equipped with an air flow measurement device. Air samples were drawn by means of a high-flow-rate blower at the flow rate of 1.00 to 1.20 m3/min for 24 hourly averaging periods. Particulates were collected on the filter paper (Whatman GF/A). The mass concentration in µg/m3 of suspended particulate in ambient air was computed by measuring the mass of collected particulate and the volume of air sampled. (Protocol – IS- 5182; Part-IV and MOEF guidelines for ambient air quality). (b) Respirable Particulate Matter (RPM) Atmospheric air was drawn into a Respirable Particulate Sampler equipped with an air flow measurement device. Air samples were drawn by means of a high-flow-rate blower at the flow rate of 1.00 to 1.20 m3/min for 24 hourly averaging period. The mass concentration in µg/M3 of

Project Title : EIA Study for Development of Industrial Estate of HSIIDC at Sec-37 & Sec-3 Extn, Ph-III, Karnal Project No. : 21-1041/2007-IA.III Contract No. : HSIA: K:2007:1315 dt.09.10.2007 Page 32 of 184
Shriram Institute for Industrial Research: Delhi
respirable particulate in ambient air was computed by measuring the mass of collected particulate and the volume of air sampled. (Protocol - IS 5182; Part-IV and MOEF guidelines for ambient air quality).
(c) Sulphur dioxide (SO2) Sulphur dioxide from the air stream was absorbed in sodium tetrachloromercurate solution by bubbling the air into absorbing solvent by means of low volume sampler assembly attached with HVS, at the flow rate of 0.2 to 0.5 litre/min for 24 hourly averaging period. The stable compound dichlorosulphito mercurate, thus, produced during sampling was allowed to react with p-rosaniline hydrochloride to form a coloured complex, intensity of which was measured by UV/VISIBLE Spectrophotometer. Level of Sulphur dioxide in atmospheric air was quantified by computing the concentration of SO2 in absorbing solution and the volume of air sampled. (Protocol - IS: 5182; Part-II). (d) Nitrogen Oxides (NOx) Nitrogen oxides as Nitrogen dioxides from the air stream was absorbed in sodium hydroxide solution by bubbling the air into absorbing solvent by means of low volume sampler assembly attached with HVS, at the flow rate of 0.2 to 0.5 litre/min for 24 hourly averaging period. The NO2 ion, thus, produced during sampling was allowed to react with phosphoric acid, sulphanilamide & N-1 (naphthyl) ethylenediamine dihydrochloride (NEDA) to form a coloured complex, intensity of which was measured by UV/VISIBLE Spectrophotometer. Level of Nitrogen oxide as NO2 in atmospheric air was quantified by computing the concentration of NO2 in absorbing solution and the volume of air sampled. (Protocol -IS: 5182;Part-VI). (e) Carbon monoxide (CO) Samples were collected in Tedlar bags. NDIR based carbon monoxide analyser CO11M of Environmental s.a., which provides better sensitivity in addition to continuos measurement system, was used to determine concentration of Carbon monoxide (CO) in ambient air. (Protocol-IS: 5182; Part-X). (f) Hydrocarbons Samples were collected in Tedlar bags. Hydrocarbons in collected samples were monitored using THC analyser. 3.2.4 AAQ Data Interpretation Interpretation of analytical data was carried out using the guidelines of National Ambient Air Quality Standards (NAAQS), Central Pollution Control Board, New Delhi notification dt. 11th April, 1994. Discussion on Results Detail analytical data generated as per the methodology given above is summarized in tables-3.2 (k) to 3.2 (r). Parameter-wise observations recorded in ambient air quality on selected spatial scale are as follows:

Project Title : EIA Study for Development of Industrial Estate of HSIIDC at Sec-37 & Sec-3 Extn, Ph-III, Karnal Project No. : 21-1041/2007-IA.III Contract No. : HSIA: K:2007:1315 dt.09.10.2007 Page 33 of 184
Shriram Institute for Industrial Research: Delhi
(a) Suspended Particulate Matter (SPM) Suspended Particulate Matter in ambient air means atmospheric level of dust retained on glass microfibre filter. As per the regulatory requirements (NAAQS), 24 hourly average value of SPM in Residential, Rural & Other areas should not exceed 200 µg/m3, while same for the Industrial area should not exceed 500 µg/m3. Statistical analysis of SPM monitoring data is illustrated in following table:
Table –3.2 (b) Statistical Analysis of SPM Monitoring Data in Ambient Air Data Indicator SPM concentration in µg/m3
AAQ-1 AAQ-2 AAQ-3 AAQ-4 AAQ-5 AAQ-6 Minimum 111 104 181 121 102 155 Average 206 237 308 291 251 280 Maximum 395 516 498 496 456 535 98th Percentile 349.9 460.3 490.6 454.6 436.7 507.9 90th Percentile 286.1 371.5 435.3 393.4 370.9 366.1 50th Percentile 188.5 231.5 288.0 281.0 238.5 259.0 10th Percentile 119.6 139.5 215.5 188.8 147.3 181.6 ± SD 71.9 102.5 87.0 89.9 87.2 93.2 Monitoring data suggests that during the monitoring period, level of SPM in ambient air at all the monitoring stations in the vicinity of project site are found in varying range as described below: ♦ 111-395 µg/m3 with mean value 206 µg/m3 and 98th percentile value 349.9 µg/m3 at AAQ-1. ♦ 104-516 µg/m3 with mean value 237 µg/m3 and 98th percentile value 460.3 µg/m3 at AAQ-2. ♦ 181-498 µg/m3 with mean value 308 µg/m3 and 98th percentile value 490.6 µg/m3 at AAQ-3. ♦ 121-496 µg/m3 with mean value 291 µg/m3 and 98th percentile value 454.6 µg/m3 at AAQ-4. ♦ 102-456 µg/m3 with mean value 251 µg/m3 and 98th percentile value 436.7 µg/m3 at AAQ-5. ♦ 155-535 µg/m3 with mean value 280 µg/m3 and 98th percentile value 507.9 µg/m3 at AAQ-6. Standard Deviation of SPM data during the monitoring period was estimated in range of ±71.9 to ±102.5 µg/m3 at all monitoring locations. (b) Respirable Suspended Particulate Matter (RSPM) Respirable Suspended Particulate Matter (RSPM) in ambient air means atmospheric level of dust below 10-µm size. As per the regulatory requirements (NAAQS), 24 hourly average value of RPM in Residential, Rural & Other areas should not exceed 100 µg/m3, while same for the Industrial area should not exceed 150 µg/m3. Statistical analysis of RSPM monitoring data is illustrated in following table:
Table - 3.2(c) Statistical Analysis of RSPM Monitoring Data in Ambient Air Data Indicator RSPM concentration in µg/m3
AAQ-1 AAQ-2 AAQ-3 AAQ-4 AAQ-5 AAQ-6 Minimum 65 72 111 94 87 99Average 125 135 177 203 176 180 Maximum 218 359 261 369 313 315 98th Percentile 205.6 295.5 258.2 326.7 284.9 313.6 90th Percentile 185.1 198.6 239.7 269.9 243.0 262.9 50th Percentile 117.5 116.0 176.0 198.5 171.5 170.5 10th Percentile 71.3 80.3 116.2 120.2 112.0 111.5 ±SD 44.6 64.8 45.6 65.4 53.2 61.8
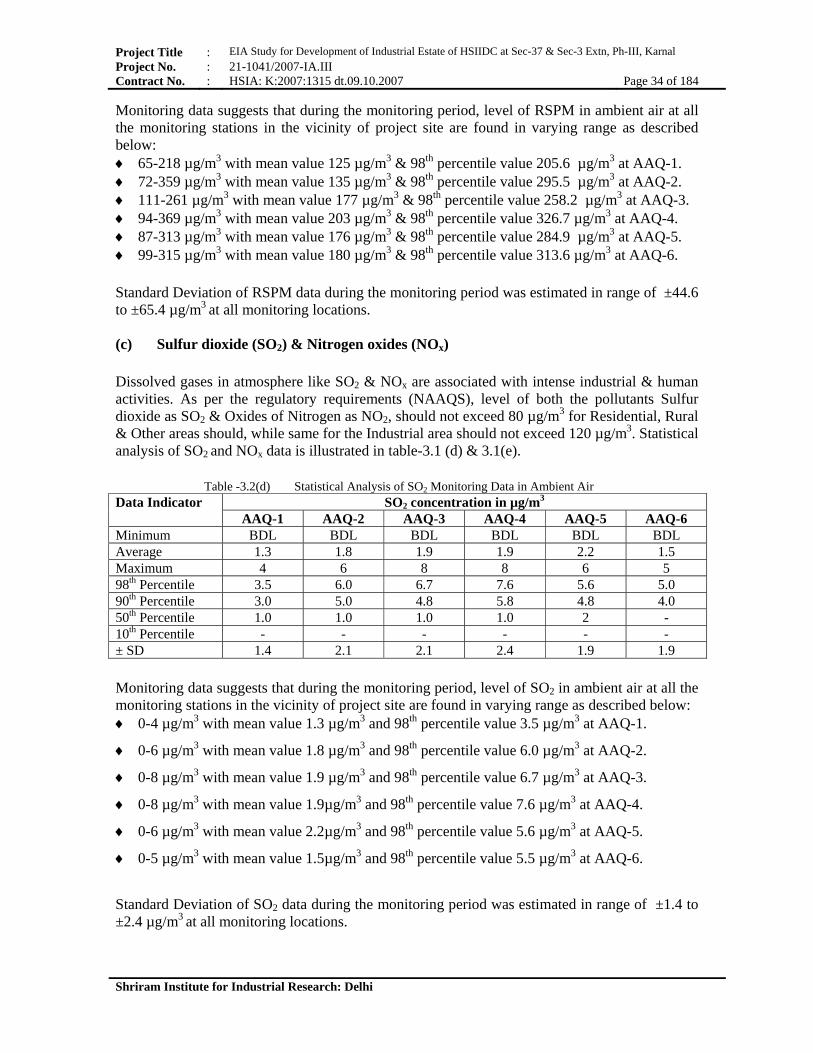
Project Title : EIA Study for Development of Industrial Estate of HSIIDC at Sec-37 & Sec-3 Extn, Ph-III, Karnal Project No. : 21-1041/2007-IA.III Contract No. : HSIA: K:2007:1315 dt.09.10.2007 Page 34 of 184
Shriram Institute for Industrial Research: Delhi
Monitoring data suggests that during the monitoring period, level of RSPM in ambient air at all the monitoring stations in the vicinity of project site are found in varying range as described below: ♦ 65-218 µg/m3 with mean value 125 µg/m3 & 98th percentile value 205.6 µg/m3 at AAQ-1. ♦ 72-359 µg/m3 with mean value 135 µg/m3 & 98th percentile value 295.5 µg/m3 at AAQ-2. ♦ 111-261 µg/m3 with mean value 177 µg/m3 & 98th percentile value 258.2 µg/m3 at AAQ-3. ♦ 94-369 µg/m3 with mean value 203 µg/m3 & 98th percentile value 326.7 µg/m3 at AAQ-4. ♦ 87-313 µg/m3 with mean value 176 µg/m3 & 98th percentile value 284.9 µg/m3 at AAQ-5. ♦ 99-315 µg/m3 with mean value 180 µg/m3 & 98th percentile value 313.6 µg/m3 at AAQ-6. Standard Deviation of RSPM data during the monitoring period was estimated in range of ±44.6 to ±65.4 µg/m3 at all monitoring locations. (c) Sulfur dioxide (SO2) & Nitrogen oxides (NOx) Dissolved gases in atmosphere like SO2 & NOx are associated with intense industrial & human activities. As per the regulatory requirements (NAAQS), level of both the pollutants Sulfur dioxide as SO2 & Oxides of Nitrogen as NO2, should not exceed 80 µg/m3 for Residential, Rural & Other areas should, while same for the Industrial area should not exceed 120 µg/m3. Statistical analysis of SO2 and NOx data is illustrated in table-3.1 (d) & 3.1(e).
Table -3.2(d) Statistical Analysis of SO2 Monitoring Data in Ambient Air Data Indicator SO2 concentration in µg/m3
AAQ-1 AAQ-2 AAQ-3 AAQ-4 AAQ-5 AAQ-6 Minimum BDL BDL BDL BDL BDL BDL Average 1.3 1.8 1.9 1.9 2.2 1.5 Maximum 4 6 8 8 6 598th Percentile 3.5 6.0 6.7 7.6 5.6 5.0 90th Percentile 3.0 5.0 4.8 5.8 4.8 4.0 50th Percentile 1.0 1.0 1.0 1.0 2 - 10th Percentile - - - - - - ± SD 1.4 2.1 2.1 2.4 1.9 1.9 Monitoring data suggests that during the monitoring period, level of SO2 in ambient air at all the monitoring stations in the vicinity of project site are found in varying range as described below: ♦ 0-4 µg/m3 with mean value 1.3 µg/m3 and 98th percentile value 3.5 µg/m3 at AAQ-1.
♦ 0-6 µg/m3 with mean value 1.8 µg/m3 and 98th percentile value 6.0 µg/m3 at AAQ-2.
♦ 0-8 µg/m3 with mean value 1.9 µg/m3 and 98th percentile value 6.7 µg/m3 at AAQ-3.
♦ 0-8 µg/m3 with mean value 1.9µg/m3 and 98th percentile value 7.6 µg/m3 at AAQ-4.
♦ 0-6 µg/m3 with mean value 2.2µg/m3 and 98th percentile value 5.6 µg/m3 at AAQ-5.
♦ 0-5 µg/m3 with mean value 1.5µg/m3 and 98th percentile value 5.5 µg/m3 at AAQ-6.
Standard Deviation of SO2 data during the monitoring period was estimated in range of ±1.4 to ±2.4 µg/m3 at all monitoring locations.
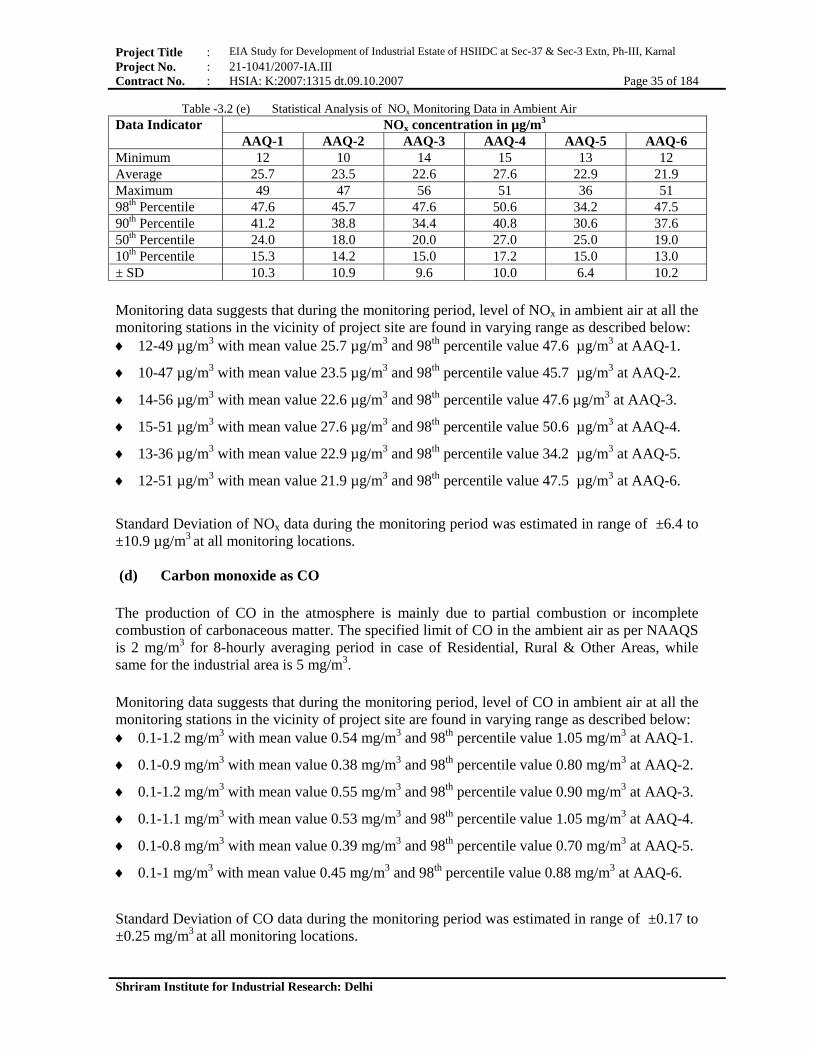
Project Title : EIA Study for Development of Industrial Estate of HSIIDC at Sec-37 & Sec-3 Extn, Ph-III, Karnal Project No. : 21-1041/2007-IA.III Contract No. : HSIA: K:2007:1315 dt.09.10.2007 Page 35 of 184
Shriram Institute for Industrial Research: Delhi
Table -3.2 (e) Statistical Analysis of NOx Monitoring Data in Ambient Air Data Indicator NOx concentration in µg/m3
AAQ-1 AAQ-2 AAQ-3 AAQ-4 AAQ-5 AAQ-6 Minimum 12 10 14 15 13 12 Average 25.7 23.5 22.6 27.6 22.9 21.9 Maximum 49 47 56 51 36 51 98th Percentile 47.6 45.7 47.6 50.6 34.2 47.5 90th Percentile 41.2 38.8 34.4 40.8 30.6 37.6 50th Percentile 24.0 18.0 20.0 27.0 25.0 19.0 10th Percentile 15.3 14.2 15.0 17.2 15.0 13.0 ± SD 10.3 10.9 9.6 10.0 6.4 10.2 Monitoring data suggests that during the monitoring period, level of NOx in ambient air at all the monitoring stations in the vicinity of project site are found in varying range as described below: ♦ 12-49 µg/m3 with mean value 25.7 µg/m3 and 98th percentile value 47.6 µg/m3 at AAQ-1.
♦ 10-47 µg/m3 with mean value 23.5 µg/m3 and 98th percentile value 45.7 µg/m3 at AAQ-2.
♦ 14-56 µg/m3 with mean value 22.6 µg/m3 and 98th percentile value 47.6 µg/m3 at AAQ-3.
♦ 15-51 µg/m3 with mean value 27.6 µg/m3 and 98th percentile value 50.6 µg/m3 at AAQ-4.
♦ 13-36 µg/m3 with mean value 22.9 µg/m3 and 98th percentile value 34.2 µg/m3 at AAQ-5.
♦ 12-51 µg/m3 with mean value 21.9 µg/m3 and 98th percentile value 47.5 µg/m3 at AAQ-6.
Standard Deviation of NOx data during the monitoring period was estimated in range of ±6.4 to ±10.9 µg/m3 at all monitoring locations. (d) Carbon monoxide as CO The production of CO in the atmosphere is mainly due to partial combustion or incomplete combustion of carbonaceous matter. The specified limit of CO in the ambient air as per NAAQS is 2 mg/m3 for 8-hourly averaging period in case of Residential, Rural & Other Areas, while same for the industrial area is 5 mg/m3. Monitoring data suggests that during the monitoring period, level of CO in ambient air at all the monitoring stations in the vicinity of project site are found in varying range as described below: ♦ 0.1-1.2 mg/m3 with mean value 0.54 mg/m3 and 98th percentile value 1.05 mg/m3 at AAQ-1.
♦ 0.1-0.9 mg/m3 with mean value 0.38 mg/m3 and 98th percentile value 0.80 mg/m3 at AAQ-2.
♦ 0.1-1.2 mg/m3 with mean value 0.55 mg/m3 and 98th percentile value 0.90 mg/m3 at AAQ-3.
♦ 0.1-1.1 mg/m3 with mean value 0.53 mg/m3 and 98th percentile value 1.05 mg/m3 at AAQ-4.
♦ 0.1-0.8 mg/m3 with mean value 0.39 mg/m3 and 98th percentile value 0.70 mg/m3 at AAQ-5.
♦ 0.1-1 mg/m3 with mean value 0.45 mg/m3 and 98th percentile value 0.88 mg/m3 at AAQ-6.
Standard Deviation of CO data during the monitoring period was estimated in range of ±0.17 to ±0.25 mg/m3 at all monitoring locations.

Project Title : EIA Study for Development of Industrial Estate of HSIIDC at Sec-37 & Sec-3 Extn, Ph-III, Karnal Project No. : 21-1041/2007-IA.III Contract No. : HSIA: K:2007:1315 dt.09.10.2007 Page 36 of 184
Shriram Institute for Industrial Research: Delhi
Table-3.2 (f) Statistical Analysis of CO Monitoring Data in Ambient Air Data Indicator CO concentration in mg/m3
AAQ-1 AAQ-2 AAQ-3 AAQ-4 AAQ-5 AAQ-6 Minimum 0.1 0.1 0.1 0.1 0.1 0.1 Average 0.54 0.38 0.55 0.53 0.39 0.45 Maximum 1.2 0.9 1.2 1.1 0.8 1.0 98th Percentile 1.05 0.80 0.90 1.05 0.70 0.88 90th Percentile 0.88 0.60 0.80 0.80 0.60 0.78 50th Percentile 0.50 0.40 0.60 0.50 0.40 0.40 10th Percentile 0.20 0.10 0.30 0.20 0.20 0.20 ± SD 0.25 0.20 0.22 0.23 0.17 0.22 (e) Hydrocarbons Presence of Hydrocarbons in Ambient Air is associated with industrial & vehicular activities. No limit of Hydrocarbons in the ambient air has been specified in the NAAQS. Monitoring data suggests that during the monitoring period, level of total hydrocarbons in ambient air at all the monitoring stations in the vicinity of project site are found in varying range as described below: ♦ 3.0 - 6.9 ppm with mean value 5.0 ppm and 98th percentile value 6.59 ppm at AAQ-1. ♦ 3.0 – 5.4 ppm with mean value 4.0 ppm and 98th percentile value 5.20 ppm at AAQ-2. ♦ 3.6 - 6.9 ppm with mean value 5.2 ppm and 98th percentile value 6.57 ppm at AAQ-3. ♦ 3.4 - 6.7 ppm with mean value 5.1 ppm and 98th percentile value 6.46 ppm at AAQ-4. ♦ 3.1 - 5.6 ppm with mean value 4.2 ppm and 98th percentile value 5.42 ppm at AAQ-5. ♦ 3.0 - 6.1 ppm with mean value 4.4 ppm and 98th percentile value 5.77 ppm at AAQ-6
Table-3.2 (g) Statistical Analysis of Hydrocarbon Monitoring Data in Ambient Air Data Indicator Hydrocarbon concentration in ppm
AAQ-1 AAQ-2 AAQ-3 AAQ-4 AAQ-5 AAQ-6 Minimum 3.0 3.0 3.6 3.4 3.1 3.0 Average 4.98 4.04 5.18 5.09 4.22 4.39 Maximum 6.9 5.4 6.9 6.7 5.6 6.1 98th Percentile 6.59 5.20 6.57 6.46 5.42 5.77 90th Percentile 6.08 4.90 6.08 5.9 5.08 5.29 50th Percentile 4.90 4.00 5.20 5.1 4.20 4.40 10th Percentile 3.90 3.21 4.21 4.2 3.41 3.51 ± SD 0.80 0.61 0.74 0.74 0.61 0.72
3.2.5 Air Quality Index (AQI) The concept of air quality index (AQI) is to have a means of describing air pollution as an overall entity, rather than in terms of series of concentrations of several individual pollutants. Method for determination of AQI The calculation AQI includes ♦ Formation of sub-indices (S1, S2, ………. Sn) for the ‘n’ pollutants, variables
(X1,X2,…………. Xn) using sub-index function. Ii = fi (Xi) where I = 1,2, ………….n.

Project Title : EIA Study for Development of Industrial Estate of HSIIDC at Sec-37 & Sec-3 Extn, Ph-III, Karnal Project No. : 21-1041/2007-IA.III Contract No. : HSIA: K:2007:1315 dt.09.10.2007 Page 37 of 184
Shriram Institute for Industrial Research: Delhi
♦ Sub–indices (Ii) thus, formed can be aggregated together in a second mathematical form called aggregated index on conbined index as:
I = f (S1, S2, …………. Sn) This aggregate operation function ‘f’ is usually a summation process. Step-1: Calculation of sub–index
The calculation of sub-index follows the linear relationship of pollutant concentration and sub-index ‘S’ and ‘S’ can be interpreted as percentage of the prescribed air quality index:
100.x S = -------------
Xn Where x is the observed value of the pollutant and Xn is the prescribed standard for the pollutant. If S < 100, the given parameters is within the prescribed limits. On the other hand, if S>100, it implies that the parameters exceeds the prescribed standards. Step-2: Calculation of Aggregate or combined index (Air Quality Index)
Once the sub – indices are formed, they are combined or aggregated in a simple addition form:
1 n AQI = ---- ∑ Si n i=1,2,….. n
Where I is the Air Quality Index (AQI), Si is the sub-index for pollutant I, and n is the number of pollutant variables.
Table-3.2 (h) Rating scale for Air Quality Index (AQI) Index Value Rating
0 – 25 Clear Air (CA) 26 – 50 Light Air Pollution (LAP) 51 – 75 Moderate Air Pollution (MAP) 76 – 100 Heavy Air Pollution (HAP)
>100 Severe Air Pollution (SAP) AQI wrt NAAQS for Rural, Residential & Other areas
Table-3.2 (i) Minimum, Average and Maximum values of AQI wrt NAASQ for Rural, Residential & Other areas Data indicator (AQI) AAQ-1 AAQ-2 AAQ-3 AAQ-4 AAQ-5 AAQ-6 Minimum 31.5 28.3 44.8 35.6 31.8 39.3 Average 57.2 60.4 77.8 82.4 70.5 74.6 Maximum 108.3 145.7 130.0 149.2 126.7 140.5 AQI of Ambient Air Quality data generated at project site indicates LAP & MAP to SAP, while processing the data vis-a-vis NAAQS for residential, rural and other areas.

Project Title : EIA Study for Development of Industrial Estate of HSIIDC at Sec-37 & Sec-3 Extn, Ph-III, Karnal Project No. : 21-1041/2007-IA.III Contract No. : HSIA: K:2007:1315 dt.09.10.2007 Page 38 of 184
Shriram Institute for Industrial Research: Delhi
AQI wrt NAAQS for Industrial areas
Table-3.2 (j) Minimum, Average and Maximum values of AQI wrt NAASQ for Industrial areas Data indicator (AQI) AAQ-1 AAQ-2 AAQ-3 AAQ-4 AAQ-5 AAQ-6Minimum 15.5 15.8 24.8 20.1 18.2 21.8 Average 31.5 33.2 42.2 45.7 39.2 41.1 Maximum 68.9 80.9 70.2 83.3 70.2 76.7 AQI of Ambient Air Quality data generated at project site indicates LAP & MAP to HAP, while processing the data vis-a-vis NAAQS for industrial areas.
Table-3.2(k) SPM, RSPM, NO2 & SO2 data at AAQ-1
Location Code/ Description AAQ-1 (KAMBHOPURA) Date SPM
(µg/m3) RSPM (µg/m3)
Oxides of Nitrogen (NO2) (µg/m3)
Sulfur dioxide (SO2) (µg/m3)
24-25/12/2008 238 141 28 1 28-29/12/2008 184 144 17 1 01-02/01/2009 119 72 49 3 04-05/01/2009 226 176 37 2 07-08/01/2009 249 169 24 1 10-11/01/2009 395 218 43 0 15-16/01/2009 281 158 25 0 19-20/01/2009 287 147 28 4 22-23/01/2009 111 65 16 1 26-27/01/2009 185 103 15 0 30-31/01/2009 118 81 16 0 03-04/02/2009 121 92 12 0 07-08/02/2009 191 88 14 3 11-12/02/2009 142 67 46 0 16-17/02/2009 186 101 35 0 20-21/02/2009 131 82 23 0 24-25/02/2009 175 114 19 0 27-28/02/2009 216 136 33 2 03-04/03/2009 273 165 19 0 07-08/03/2009 297 191 18 3 12-13/03/2009 284 189 21 3 16-17/03/2009 210 121 30 3 19-20/03/2009 174 114 24 3 23-24/03/2009 143 71 24 2
Table-3.2(l) SPM, RSPM, NO2 & SO2 data at AAQ-2
Location Code/ Description AAQ-2 (Ganjogarhi) Date SPM
(µg/m3) RPM
(µg/m3) Oxides of Nitrogen
(NO2) (µg/m3) Sulfur dioxide (SO2) (µg/m3)
24-25/12/2008 346 193 44 2 28-29/12/2008 240 168 23 1 01-02/01/2009 376 192 44 3 04-05/01/2009 395 221 15 1 07-08/01/2009 261 119 26 0 10-11/01/2009 304 201 25 0 15-16/01/2009 516 359 16 019-20/01/2009 138 75 10 022-23/01/2009 243 117 15 0 26-27/01/2009 226 94 18 1 30-31/01/2009 184 106 16 0 03-04/02/2009 143 85 15 1

Project Title : EIA Study for Development of Industrial Estate of HSIIDC at Sec-37 & Sec-3 Extn, Ph-III, Karnal Project No. : 21-1041/2007-IA.III Contract No. : HSIA: K:2007:1315 dt.09.10.2007 Page 39 of 184
Shriram Institute for Industrial Research: Delhi
07-08/02/2009 155 115 16 1 11-12/02/2009 147 81 17 016-17/02/2009 104 72 15 020-21/02/2009 258 121 47 6 24-25/02/2009 264 113 33 5 27-28/02/2009 128 96 14 1 03-04/03/2009 159 124 39 4 07-08/03/2009 237 138 12 1 12-13/03/2009 361 180 35 6 16-17/03/2009 156 103 38 5 19-20/03/2009 188 91 25 3 23-24/03/2009 168 80 26 2
Table-3.2 (m) SPM, RSPM, NO2 & SO2 data at AAQ-3
Location Code AAQ-3 (Bastara) Date SPM
(µg/m3) RPM
(µg/m3) Oxides of Nitrogen
(NO2) (µg/m3) Sulfur dioxide (SO2) (µg/m3)
24-25/12/2008 315 215 14 0 28-29/12/2008 374 246 15 1 01-02/01/2009 181 115 14 2 04-05/01/2009 351 178 14 1 07-08/01/2009 219 119 21 1 10-11/01/2009 280 185 18 0 15-16/01/2009 498 261 24 4 19-20/01/2009 284 133 15 2 22-23/01/2009 253 174 21 0 26-27/01/2009 223 141 23 0 30-31/01/2009 429 180 21 0 03-04/02/2009 482 255 16 0 07-08/02/2009 438 203 19 1 11-12/02/2009 253 157 15 1 16-17/02/2009 292 193 16 0 20-21/02/2009 213 112 19 3 24-25/02/2009 330 213 36 4 27-28/02/2009 281 154 56 8 03-04/03/2009 356 208 26 0 07-08/03/2009 293 170 28 0 12-13/03/2009 335 225 37 5 16-17/03/2009 236 164 25 3 19-20/03/2009 250 111 20 5 23-24/03/2009 214 124 20 2
Table-3.2 (n) SPM, RSPM, NO2 & SO2 data at AAQ-4
Location Code AAQ-4 (Baldi) Date SPM
(µg/m3) RPM
(µg/m3) Oxides of Nitrogen
(NO2) (µg/m3) Sulfur dioxide (SO2) (µg/m3)
24-25/12/2008 356 164 17 028-29/12/2008 406 244 27 101-02/01/2009 203 152 36 1 04-05/01/2009 232 182 34 2 07-08/01/2009 173 110 17 2 10-11/01/2009 227 94 18 0 15-16/01/2009 273 191 21 1 19-20/01/2009 215 187 21 0 22-23/01/2009 193 144 20 0 26-27/01/2009 121 116 16 0 30-31/01/2009 273 244 31 1

Project Title : EIA Study for Development of Industrial Estate of HSIIDC at Sec-37 & Sec-3 Extn, Ph-III, Karnal Project No. : 21-1041/2007-IA.III Contract No. : HSIA: K:2007:1315 dt.09.10.2007 Page 40 of 184
Shriram Institute for Industrial Research: Delhi
03-04/02/2009 312 265 22 0 07-08/02/2009 298 254 32 611-12/02/2009 263 188 21 116-17/02/2009 496 369 51 8 20-21/02/2009 394 206 50 7 24-25/02/2009 382 277 29 0 27-28/02/2009 387 272 42 0 03-04/03/2009 392 249 30 0 07-08/03/2009 329 227 15 0 12-13/03/2009 309 246 29 5 16-17/03/2009 187 130 20 3 19-20/03/2009 281 217 30 3 23-24/03/2009 281 141 23 2
Table-3.2 (o) SPM, RSPM, NO2 & SO2 data at AAQ-5
Location Code AAQ-5 (Goghripur) Date SPM
(µg/m3) RPM
(µg/m3) Oxides of Nitrogen
(NO2) (µg/m3) Sulfur dioxide (SO2) (µg/m3)
24-25/12/2008 137 99 17 1 28-29/12/2008 147 126 16 0 01-02/01/2009 198 167 36 2 04-05/01/2009 211 165 27 2 07-08/01/2009 293 252 15 0 10-11/01/2009 102 87 17 0 15-16/01/2009 233 187 13 0 19-20/01/2009 241 156 20 1 22-23/01/2009 195 124 16 0 26-27/01/2009 148 109 15 0 30-31/01/2009 246 177 22 3 03-04/02/2009 216 168 19 4 07-08/02/2009 345 249 26 6 11-12/02/2009 314 177 29 5 16-17/02/2009 194 172 25 3 20-21/02/2009 273 182 32 0 24-25/02/2009 313 198 28 4 27-28/02/2009 255 216 26 3 03-04/03/2009 382 221 21 0 07-08/03/2009 456 313 15 5 12-13/03/2009 236 171 31 4 16-17/03/2009 261 150 26 3 19-20/03/2009 414 229 27 3 23-24/03/2009 222 119 25 2
Table-3.2(p) SPM, RSPM, NO2 & SO2 data at AAQ-6 Location Code AAQ-6 (Dabri) Date SPM
(µg/m3) RPM
(µg/m3) Oxides of Nitrogen
(NO2) (µg/m3) Sulfur dioxide (SO2) (µg/m3)
24-25/12/2008 237 210 45 0 28-29/12/2008 197 110 14 1 01-02/01/2009 476 312 51 5 04-05/01/2009 356 315 43 5 07-08/01/2009 220 208 13 0 10-11/01/2009 175 99 16 0 15-16/01/2009 206 162 13 019-20/01/2009 317 193 28 022-23/01/2009 295 179 24 0 26-27/01/2009 278 183 21 0

Project Title : EIA Study for Development of Industrial Estate of HSIIDC at Sec-37 & Sec-3 Extn, Ph-III, Karnal Project No. : 21-1041/2007-IA.III Contract No. : HSIA: K:2007:1315 dt.09.10.2007 Page 41 of 184
Shriram Institute for Industrial Research: Delhi
30-31/01/2009 367 21 14 0 03-04/02/2009 310 237 22 407-08/02/2009 223 138 19 411-12/02/2009 155 99 19 1 16-17/02/2009 238 119 12 0 20-21/02/2009 297 155 22 0 24-25/02/2009 206 115 13 0 27-28/02/2009 535 205 19 0 03-04/03/2009 175 129 16 2 07-08/03/2009 339 229 16 0 12-13/03/2009 364 274 24 4 16-17/03/2009 266 143 25 3 19-20/03/2009 226 157 19 2 23-24/03/2009 252 140 40 1
Table-3.2 (q) AAQ data of Carbon monoxide
Date Shift Location Code AAQ-1 AAQ-2 AAQ-3 AAQ-4 AAQ-5 AAQ-6
24-25/12/08 I 0.2 0.4 0.5 0.3 0.1 0.6 II 0.5 0.5 0.7 0.5 0.3 0.8 III 0.4 0.6 0.8 0.7 0.4 0.9
28-29/12/08 I 0.3 0.2 0.3 0.1 0.2 0.5 II 0.4 0.3 0.6 0.4 0.4 0.7 III 0.6 0.5 0.6 0.6 0.6 0.7
01-02/01/09 I 0.2 0.3 0.1 0.3 0.4 0.2 II 0.4 0.5 0.4 0.5 0.5 0.5 III 0.4 0.7 0.7 0.8 0.5 0.8
04-05/01/09 I 0.3 0.4 0.2 0.2 0.3 0.1 II 0.5 0.6 0.4 0.7 0.4 0.4III 0.7 0.8 0.6 0.7 0.5 0.7
07-08/01/09 I 0.4 0.1 0.6 0.5 0.1 0.5 II 0.6 0.3 0.7 0.6 0.4 0.8 III 0.8 0.5 0.8 0.8 0.6 1.0
10-11/01/09 I 0.2 0.2 0.1 0.1 0.2 0.1 II 0.4 0.6 0.5 0.4 0.4 0.4III 0.5 0.6 0.7 0.7 0.6 0.5
15-16/01/09 I 0.4 0.2 0.2 0.2 0.1 0.2 II 0.5 0.3 0.5 0.4 0.4 0.4 III 0.8 0.5 0.9 0.5 0.5 0.6
19-20/01/09 I 0.3 0.1 0.4 0.3 0.2 0.3 II 0.5 0.4 0.6 0.5 0.5 0.5III 0.7 0.4 0.7 0.6 0.6 0.5
22-23/01/09 I 0.2 0.1 0.4 0.3 0.2 0.4 II 0.4 0.3 0.7 0.5 0.4 0.5 III 0.5 0.4 0.9 0.7 0.5 0.6
26-27/01/09 I 0.3 0.3 0.5 0.3 0.3 0.3 II 0.6 0.5 0.6 0.6 0.5 0.4III 0.8 0.6 0.7 0.6 0.6 0.7
30-31/01/09 I 0.1 0.2 0.2 0.4 0.3 0.1 II 0.4 0.5 0.5 0.5 0.5 0.4 III 0.6 0.5 0.6 0.7 0.7 0.6
03-04/02/09 I 0.4 0.1 0.6 0.2 0.4 0.1 II 0.9 0.5 1.2 0.8 0.5 0.5 III 0.6 0.3 0.8 0.6 0.6 0.4
07-08/02/09 I 0.3 0.3 0.4 0.4 0.3 0.2 II 0.8 0.7 0.9 0.9 0.7 0.8 III 0.4 0.4 0.6 0.7 0.4 0.6

Project Title : EIA Study for Development of Industrial Estate of HSIIDC at Sec-37 & Sec-3 Extn, Ph-III, Karnal Project No. : 21-1041/2007-IA.III Contract No. : HSIA: K:2007:1315 dt.09.10.2007 Page 42 of 184
Shriram Institute for Industrial Research: Delhi
11-12/02/09 I 0.1 0.2 0.4 0.1 0.2 0.4 II 0.7 0.8 0.9 0.4 0.6 0.6III 0.4 0.4 0.6 0.3 0.4 0.3
16-17/02/09 I 0.6 0.1 0.3 0.2 0.4 0.3 II 1.2 0.4 0.7 0.7 0.8 0.6 III 0.8 0.4 0.5 0.5 0.3 0.4
20-21/02/09 I 0.1 0.2 0.1 0.7 0.2 0.1 II 0.7 0.6 0.6 1.1 0.5 0.4 III 0.4 0.3 0.4 0.6 0.4 0.2
24-25/02/09 I 0.2 0.6 0.4 0.5 0.1 0.2 II 0.9 0.9 0.8 0.8 0.4 0.4 III 0.6 0.2 0.6 0.4 0.4 0.3
27-28/02/09 I 0.4 0.2 0.3 0.4 0.1 0.2 II 0.8 0.1 0.8 0.7 0.2 0.8 III 0.4 0.1 0.4 0.5 0.2 0.6
03-04/03/09 I 0.9 0.2 0.4 0.8 0.5 0.2 II 0.8 0.4 0.5 1.1 0.6 0.4 III 0.9 0.2 0.3 0.8 0.5 0.4
07-08/03/09 I 0.7 0.1 0.4 0.7 0.4 0.5 II 0.6 0.2 0.5 0.8 0.6 0.7 III 0.5 0.1 0.3 0.5 0.3 0.4
12-13/03/09 I 0.9 0.5 0.6 0.4 0.1 0.3 II 1.1 0.6 0.9 0.5 0.2 0.5 III 0.8 0.5 0.6 0.2 0.2 0.3
16-17/03/09 I 0.6 0.4 0.4 0.1 0.5 0.4 II 0.6 0.5 0.5 0.3 0.7 0.6 III 0.5 0.4 0.2 0.4 0.4 0.4
20-21/03/09 I 0.4 0.4 0.8 0.2 0.2 0.3 II 0.5 0.5 0.9 0.2 0.2 0.8 III 0.4 0.4 0.7 0.1 0.1 0.3
23-24/03/09 I 0.2 0.2 0.4 0.4 0.4 0.4 II 0.4 0.4 0.5 0.5 0.4 0.2 III 0.4 0.4 0.1 0.3 0.2 0.1
Table-3.2 (r) AAQ data of Hydrocarbons Hydrocarbons (HC), ppm
Date Shift Location Code AAQ-1 AAQ-2 AAQ-3 AAQ-4 AAQ-5 AAQ-6
24-25/12/08 I 4.9 3.3 5.2 4.6 3.6 3.1 II 5.2 3.9 5.8 5.2 3.9 3.6 III 5.8 4.2 6.4 5.9 4.5 3.9
28-29/12/08 I 4.4 3.4 4.8 4.2 3.2 3.3 II 4.8 3.7 5.2 4.9 3.6 3.8 III 5.3 3.5 5.9 5.5 4.2 4.1
01-02/01/09 I 4.1 4.1 4.6 5.2 3.1 3.5 II 4.9 4.4 4.9 5.7 3.7 3.8III 5.6 4.8 5.7 6.2 4.2 3.9
04-05/01/09 I 4.8 3.9 4.4 3.9 3.2 3.6 II 5.4 3.5 4.9 4.7 3.6 4.1 III 6.2 3.8 5.8 5.6 4.1 4.8
07-08/01/09 I 4.5 3.1 5.2 4.8 3.9 3.0II 5.1 3.9 5.9 5.4 4.2 3.6III 5.8 4.2 6.7 5.9 4.5 4.5
10-11/01/09 I 3.9 4.1 4.9 5.2 3.4 3.1 II 4.6 4.5 5.6 5.9 3.8 3.7 III 5.2 4.9 6.4 6.4 4.3 4.4
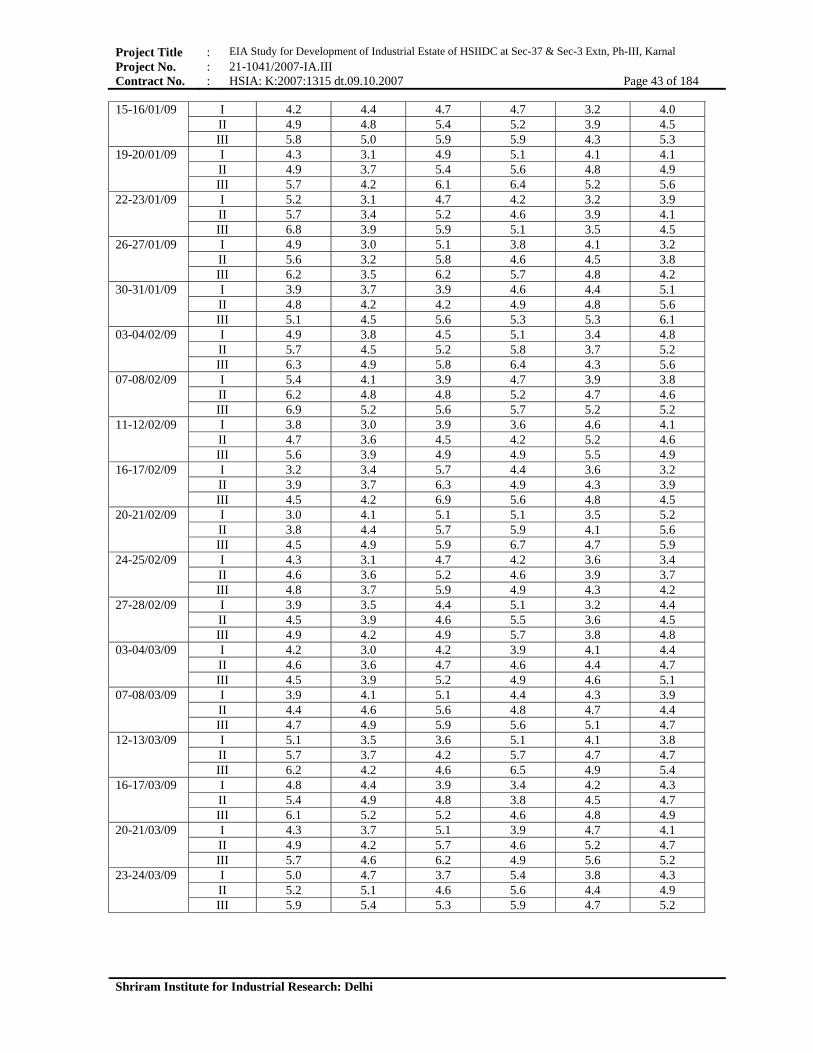
Project Title : EIA Study for Development of Industrial Estate of HSIIDC at Sec-37 & Sec-3 Extn, Ph-III, Karnal Project No. : 21-1041/2007-IA.III Contract No. : HSIA: K:2007:1315 dt.09.10.2007 Page 43 of 184
Shriram Institute for Industrial Research: Delhi
15-16/01/09 I 4.2 4.4 4.7 4.7 3.2 4.0 II 4.9 4.8 5.4 5.2 3.9 4.5III 5.8 5.0 5.9 5.9 4.3 5.3
19-20/01/09 I 4.3 3.1 4.9 5.1 4.1 4.1 II 4.9 3.7 5.4 5.6 4.8 4.9 III 5.7 4.2 6.1 6.4 5.2 5.6
22-23/01/09 I 5.2 3.1 4.7 4.2 3.2 3.9 II 5.7 3.4 5.2 4.6 3.9 4.1 III 6.8 3.9 5.9 5.1 3.5 4.5
26-27/01/09 I 4.9 3.0 5.1 3.8 4.1 3.2 II 5.6 3.2 5.8 4.6 4.5 3.8 III 6.2 3.5 6.2 5.7 4.8 4.2
30-31/01/09 I 3.9 3.7 3.9 4.6 4.4 5.1 II 4.8 4.2 4.2 4.9 4.8 5.6 III 5.1 4.5 5.6 5.3 5.3 6.1
03-04/02/09 I 4.9 3.8 4.5 5.1 3.4 4.8 II 5.7 4.5 5.2 5.8 3.7 5.2 III 6.3 4.9 5.8 6.4 4.3 5.6
07-08/02/09 I 5.4 4.1 3.9 4.7 3.9 3.8 II 6.2 4.8 4.8 5.2 4.7 4.6 III 6.9 5.2 5.6 5.7 5.2 5.2
11-12/02/09 I 3.8 3.0 3.9 3.6 4.6 4.1 II 4.7 3.6 4.5 4.2 5.2 4.6 III 5.6 3.9 4.9 4.9 5.5 4.9
16-17/02/09 I 3.2 3.4 5.7 4.4 3.6 3.2 II 3.9 3.7 6.3 4.9 4.3 3.9 III 4.5 4.2 6.9 5.6 4.8 4.5
20-21/02/09 I 3.0 4.1 5.1 5.1 3.5 5.2 II 3.8 4.4 5.7 5.9 4.1 5.6 III 4.5 4.9 5.9 6.7 4.7 5.9
24-25/02/09 I 4.3 3.1 4.7 4.2 3.6 3.4 II 4.6 3.6 5.2 4.6 3.9 3.7 III 4.8 3.7 5.9 4.9 4.3 4.2
27-28/02/09 I 3.9 3.5 4.4 5.1 3.2 4.4 II 4.5 3.9 4.6 5.5 3.6 4.5 III 4.9 4.2 4.9 5.7 3.8 4.8
03-04/03/09 I 4.2 3.0 4.2 3.9 4.1 4.4 II 4.6 3.6 4.7 4.6 4.4 4.7 III 4.5 3.9 5.2 4.9 4.6 5.1
07-08/03/09 I 3.9 4.1 5.1 4.4 4.3 3.9 II 4.4 4.6 5.6 4.8 4.7 4.4 III 4.7 4.9 5.9 5.6 5.1 4.7
12-13/03/09 I 5.1 3.5 3.6 5.1 4.1 3.8 II 5.7 3.7 4.2 5.7 4.7 4.7 III 6.2 4.2 4.6 6.5 4.9 5.4
16-17/03/09 I 4.8 4.4 3.9 3.4 4.2 4.3 II 5.4 4.9 4.8 3.8 4.5 4.7 III 6.1 5.2 5.2 4.6 4.8 4.9
20-21/03/09 I 4.3 3.7 5.1 3.9 4.7 4.1 II 4.9 4.2 5.7 4.6 5.2 4.7III 5.7 4.6 6.2 4.9 5.6 5.2
23-24/03/09 I 5.0 4.7 3.7 5.4 3.8 4.3 II 5.2 5.1 4.6 5.6 4.4 4.9 III 5.9 5.4 5.3 5.9 4.7 5.2

Project Title : EIA Study for Development of Industrial Estate of HSIIDC at Sec-37 & Sec-3 Extn, Ph-III, Karnal Project No. : 21-1041/2007-IA.III Contract No. : HSIA: K:2007:1315 dt.09.10.2007 Page 44 of 184
Shriram Institute for Industrial Research: Delhi
3.2.6 Air Pollution Dispersion Modeling The ISC short term model for stacks has been used for Air Pollution Dispersion Modeling. It uses the steady-state Gaussian plume equation for a continuous elevated source. For each source and each hour, the origin of the source's coordinate system is placed at the ground surface at the base of the stack. The x axis is positive in the downwind direction, the y axis is crosswind (normal) to the x axis and the z axis extends vertically. The fixed receptor locations are converted to each source's coordinate system for each hourly concentration calculation. The calculation of the downwind and crosswind distances is described in. The hourly concentrations calculated for each source at each receptor are summed to obtain the total concentration produced at each receptor by the combined source emissions. For a steady-state Gaussian plume, the hourly concentration at downwind distance x (meters) and crosswind distance y (meters) is given by:
Where: Q = pollutant emission rate (mass per unit time) K = a scaling coefficient to convert calculated concentrations to desired units (default value
of 1 x 10⁶ for Q in g/s and concentration in µg/m3) V = vertical term D = decay term Fy,Fz = standard deviation of lateral and vertical concentration distribution (m) The vertical term includes the effects of source elevation, receptor elevation, plume rise, limited mixing in the vertical, and the gravitational settling and dry deposition of particulates (with diameters greater than about 0.1 microns). Downwind and Crosswind Distances The ISC model uses either a polar or a Cartesian receptor network as specified by the user. The model allows for the use of both types of receptors and for multiple networks in a single run. All receptor points are converted to Cartesian (X,Y) coordinates prior to performing the dispersion calculations. In the polar coordinate system, the radial coordinate of the point (r, 2) is measured from the user-specified origin and the angular coordinate 2 is measured clockwise from the north. In the Cartesian coordinate system, the X axis is positive to the east of the user-specified origin and the Y axis is positive to the north. For either type of receptor network, the user must define the location of each source with respect to the origin of the grid using Cartesian coordinates. In the polar coordinate system, assuming the origin is at X = Xo, Y = Yo, the X and
Y coordinates of a receptor at the point (r, 2) are given by:

Project Title : EIA Study for Development of Industrial Estate of HSIIDC at Sec-37 & Sec-3 Extn, Ph-III, Karnal Project No. : 21-1041/2007-IA.III Contract No. : HSIA: K:2007:1315 dt.09.10.2007 Page 45 of 184
Shriram Institute for Industrial Research: Delhi
If the X and Y coordinates of the source are X(S) and Y(S), the downwind distance x to the receptor, along the direction of plume travel, is given by:
where WD is the direction from which the wind is blowing. The downwind distance is used in calculating the distance-dependent plume rise and the dispersion parameters. If any receptor is located within 1 meter of a point source or within 1 meter of the effective radius of a volume source, a warning message is printed and no concentrations are calculated for the source-receptor combination. The crosswind distance y to the receptor from the plume centerline is given by:
Wind Speed Profile The wind power law is used to adjust the observed wind speed, uref, from a reference measurement height, zref, to the stack or release height, hs. The stack height wind speed, us, is used in the Gaussian plume equation, and in the plume rise formulas. The power law equation is of the form:
where p is the wind profile exponent. Values of p may be provided by the user as a function of stability category and wind speed class. Default values are as follows: Stability Category Rural Exponent Urban Exponent
A 0.07 0.15 B 0.07 0.15 C 0.10 0.20 D 0.15 0.25 E 0.35 0.30 F 0.55 0.30
The ISC models include algorithms to model volume, area and open-pit sources, in addition to point sources. These non-point source options of the ISC models are used to simulate the effects of emissions from a wide variety of industrial sources. In general, the ISC volume source model is used to simulate the effects of emissions from sources such as building roof monitors and line sources (for example, conveyor belts and rail lines). The ISC area source model is used to simulate the effects of fugitive emissions from sources such as storage piles and slag dumps.

Project Title : EIA Study for Development of Industrial Estate of HSIIDC at Sec-37 & Sec-3 Extn, Ph-III, Karnal Project No. : 21-1041/2007-IA.III Contract No. : HSIA: K:2007:1315 dt.09.10.2007 Page 46 of 184
Shriram Institute for Industrial Research: Delhi
AIR POLLUTANT DISPERSION MODELLING FOR IE of HSIIDC at Sector-37 & Sec-3 Ph-III Karnal Point Source : DG Set Stacks) ISCST3 - VERSION 02035 CONC RURAL FLAT DFAULT CO STARTING CO TITLEONE AIR POLLUTANT DISPERSION MODELING FOR IE OF HSIIDC AT IE KARNAL CO MODELOPT DFAULT RURAL CONC CO AVERTIME 1 CO POLLUTID Particulate Matter CO TERRHGTS FLAT CO RUNORNOT RUN CO FINISHED SO STARTING (DG set Stacks; 1000 KVA Rated Capacity; Fuel Type : HSD; QE 2700 Nm3/hr) SO LOCATION STACK1 POINT 800 400 0.0 SO SRCPARAM STACK1 0.10 30 587 22.3 0.3 SO LOCATION STACK2 POINT 40 360 0.0 SO SRCPARAM STACK2 0.15 25 533 20.4 0.3 SO LOCATION STACK3 POINT 480 20 0.0 SO SRCPARAM STACK3 0.12 30 563 22.4 0.3 SO LOCATION STACK4 POINT 420 260 0.0 SO SRCPARAM STACK4 0.15 30 540 23.5 0.3 SO LOCATION STACK5 POINT 420 180 0.0 SO SRCPARAM STACK5 0.18 32 563 23.5 0.3 SO LOCATION STACK6 POINT 420 100 0.0 SO SRCPARAM STACK6 0.16 30 583 23.5 0.3 SO LOCATION STACK7 POINT 260 340 0.0 SO SRCPARAM STACK7 0.15 32 590 24.5 0.3 SO LOCATION STACK8 POINT 300 360 0.0 SO SRCPARAM STACK8 0.12 35 550 20.2 0.3 SO LOCATION STACK9 POINT 40 20 0.0 SO SRCPARAM STACK9 0.14 30 574 18.5 0.3 SO SRCGROUP ALL SO FINISHED RE STARTING RE GRIDPOLR POL1 STA RE GRIDPOLR POL1 ORIG 0.0 0.0 RE GRIDPOLR POL1 DIST 500. 1000. 1500. 2000. 2500. 3000. 4000. 5000. 5500. RE GRIDPOLR POL1 DIST 6000. 6500. 7000. 7500. 8000. 8500. 9000. 9500. 10000 RE GRIDPOLR POL1 GDIR 36 10. 10. RE GRIDPOLR POL1 END RE FINISHED ME STARTING ME INPUTFIL MNP.PRN FREE ME ANEMHGHT 8 METERS ME WDROTATE 0 ME SURFDATA 001 2009 IE, Karnal. ME UAIRDATA 001 2009 IE, Karnal. ME FINISHED OU STARTING OU RECTABLE ALLAVE FIRST SECOND OU MAXTABLE ALLAVE 10 OU FINISHED *********************************** *** SETUP Finishes Successfully ***

Project Title : EIA Study for Development of Industrial Estate of HSIIDC at Sec-37 & Sec-3 Extn, Ph-III, Karnal Project No. : 21-1041/2007-IA.III Contract No. : HSIA: K:2007:1315 dt.09.10.2007 Page 47 of 184
Shriram Institute for Industrial Research: Delhi
*** MODEL SETUP OPTIONS SUMMARY *** **Intermediate Terrain Processing is Selected **Model Is Setup For Calculation of Average CONCentration Values. -- SCAVENGING/DEPOSITION LOGIC -- **Model Uses NO DRY DEPLETION. DDPLETE = F **Model Uses NO WET DEPLETION. WDPLETE = F **NO WET SCAVENGING Data Provided. **NO GAS DRY DEPOSITION Data Provided. **Model Does NOT Use GRIDDED TERRAIN Data for Depletion Calculations **Model Uses RURAL Dispersion. **Model Uses Regulatory DEFAULT Options: 1. Final Plume Rise. 2. Stack-tip Downwash. 3. Buoyancy-induced Dispersion. 4. Use Calms Processing Routine. 5. Not Use Missing Data Processing Routine. 6. Default Wind Profile Exponents. 7. Default Vertical Potential Temperature Gradients. 8. "Upper Bound" Values for Supersquat Buildings. 9. No Exponential Decay for RURAL Mode **Model Assumes Receptors on FLAT Terrain. **Model Assumes No FLAGPOLE Receptor Heights. **Model Calculates 1 Short Term Average(s) of: 1-HR **This Run Includes: 9 Source(s); 1 Source Group(s); and 648 Receptor(s) **The Model Assumes A Pollutant Type of: SPM **Model Set To Continue RUNning After the Setup Testing. **Output Options Selected: Model Outputs Tables of Highest Short Term Values by Receptor (RECTABLE Keyword) Model Outputs Tables of Overall Maximum Short Term Values (MAXTABLE Keyword) **NOTE: The Following Flags May Appear Following CONC Values: c for Calm Hours m for Missing Hours b for Both Calm and Missing Hours **Misc. Inputs: Anem. Hgt. (m) = 8.00 ; Decay Coef. = 0.000 ; Rot. Angle = 0.0 Emission Units = GRAMS/SEC Emission Rate Unit Factor = 0.10000E+07 Output Units = MICRO GRAMS/M**3

Project Title : EIA Study for Development of Industrial Estate of HSIIDC at Sec-37 & Sec-3 Extn, Ph-III, Karnal Project No. : 21-1041/2007-IA.III Contract No. : HSIA: K:2007:1315 dt.09.10.2007 Page 48 of 184
Shriram Institute for Industrial Research: Delhi
*** POINT SOURCE DATA *** (Stack of DG Set 1000 KVA (800 KW) SOURCE SCALER ID
NUMBER PART CATS.
EMISSION RATE (g/sec)
X (METERS)
Y (METERS)
BASE ELEV.
(METERS)
STACK HEIGHT (METERS)
STACK TEMP (°K)
STACK EXIT VEL(m/sec)
STACK DIAMETER(METERS)
BUILD EXISTS
STACK1 0 1.0000E-01 800.0 400.0 0.0 30.00 587.00 22.30 0.30 NO STACK2 0 1.5000E-01 40.0 360.0 0.0 25.00 533.00 20.40 0.30 NO STACK3 0 1.2000E-01 480.0 20.0 0.0 30.00 563.00 22.40 0.30 NO STACK4 0 1.5000E-01 420.0 260.0 0.0 30.00 540.00 23.50 0.30 NO STACK5 0 1.8000E-01 420.0 180.0 0.0 32.00 563.00 23.50 0.30 NO STACK6 0 1.6000E-01 420.0 100.0 0.0 30.00 583.00 23.50 0.30 NO STACK7 0 1.5000E-01 260.0 340.0 0.0 32.00 590.00 24.50 0.30 NO STACK8 0 1.2000E-01 300.0 360.0 0.0 35.00 550.00 20.20 0.30 NO STACK9 0 1.4000E-01 40.0 20.0 0.0 30.00 574.00 18.50 0.30 NO
*** WIND PROFILE EXPONENTS ***
WIND SPEED CATEGORY STABILITY CATEGORY
1 2 3 4 5 6
A 7.000E-02 7.000E-02 7.000E-02 7.000E-02 7.000E-02 7.000E-02 B 7.000E-02 7.000E-02 7.000E-02 7.000E-02 7.000E-02 7.000E-02 C 1.000E-01 1.000E-01 1.000E-01 1.000E-01 1.000E-01 1.000E-01 D 1.500E-01 1.500E-01 1.500E-01 1.500E-01 1.500E-01 1.500E-01 E 3.500E-01 3.500E-01 3.500E-01 3.500E-01 3.500E-01 3.500E-01 F 5.500E-01 5.500E-01 5.500E-01 5.500E-01 5.500E-01 5.500E-01
*** VERTICAL POTENTIAL TEMPERATURE GRADIENTS ***
(DEGREES KELVIN PER METER) WIND SPEED CATEGORY
STABILITY CATEGORY
1 2 3 4 5 6
A 0.000E+00 0.000E+00 0.000E+00 0.000E+00 0.000E+00 0.000E+00 B 0.000E+00 0.000E+00 0.000E+00 0.000E+00 0.000E+00 0.000E+00 C 0.000E+00 0.000E+00 0.000E+00 0.000E+00 0.000E+00 0.000E+00 D 0.000E+00 0.000E+00 0.000E+00 0.000E+00 0.000E+00 0.000E+00 E 2.000E-02 2.000E-02 2.000E-02 2.000E-02 2.000E-02 2.000E-02 F 3.500E-02 3.500E-02 3.500E-02 3.500E-02 3.500E-02 3.500E-02

Project Title : EIA Study for Development of Industrial Estate of HSIIDC at Sec-37 & Sec-3 Extn, Ph-III, Karnal Project No. : 21-1041/2007-IA.III Contract No. : HSIA: K:2007:1315 dt.09.10.2007 Page 49 of 184
Shriram Institute for Industrial Research: Delhi
*** THE FIRST 24 HOURS OF METEOROLOGICAL DATA *** FILE: MnP.PRN FORMAT: FREE SURFACE STATION NO. : 1 UPPER AIR STATION NO. : 1 NAME : IE, KARNAL NAME : IE, KARNAL YEAR : 2009 YEAR : 2009 YR MN DY HR FLOW
VECTOR SPEED (m/sec)
TEMP (°K)
STAB CLASS
MIXING HEIGHT (MTR)
USTAIR (m/sec)
M-O LENGTH (M)
Z-O (M)
IPCODE PRATE (mm/HR)
RURAL URBAN 09 01 01 01 270.0 6.50 286.0 3 100.0 100.0 0.000 0.0 0.000 0.0 0.00 09 01 01 02 270.0 3.90 286.0 3 100.0 100.0 0.000 0.0 0.000 0.0 0.00 09 01 01 03 225.0 4.60 286.0 3 100.0 100.0 0.000 0.0 0.000 0.0 0.00 09 01 01 04 225.0 4.30 286.0 3 100.0 100.0 0.000 0.0 0.000 0.0 0.00 09 01 01 05 315.0 3.30 286.0 3 100.0 100.0 0.000 0.0 0.000 0.0 0.00 09 01 01 06 270.0 4.30 286.0 3 100.0 100.0 0.000 0.0 0.000 0.0 0.00 09 01 01 07 270.0 3.90 286.0 3 100.0 100.0 0.000 0.0 0.000 0.0 0.00 09 01 01 08 315.0 2.80 285.0 3 100.0 100.0 0.000 0.0 0.000 0.0 0.00 09 01 01 09 270.0 4.30 285.0 3 100.0 100.0 0.000 0.0 0.000 0.0 0.00 09 01 01 10 270.0 3.30 286.0 3 100.0 100.0 0.000 0.0 0.000 0.0 0.00 09 01 01 11 135.0 1.30 286.0 3 100.0 100.0 0.000 0.0 0.000 0.0 0.00 09 01 01 12 135.0 1.30 286.0 3 100.0 100.0 0.000 0.0 0.000 0.0 0.00 09 01 01 13 225.0 2.70 286.0 3 100.0 100.0 0.000 0.0 0.000 0.0 0.00 09 01 01 14 180.0 3.80 287.0 5 100.0 100.0 0.000 0.0 0.000 0.0 0.00 09 01 01 15 180.0 2.30 287.0 5 100.0 100.0 0.000 0.0 0.000 0.0 0.00 09 01 01 16 180.0 2.00 286.0 5 100.0 100.0 0.000 0.0 0.000 0.0 0.00 09 01 01 17 180.0 4.40 288.0 5 100.0 100.0 0.000 0.0 0.000 0.0 0.00 09 01 01 18 180.0 3.30 289.0 3 100.0 100.0 0.000 0.0 0.000 0.0 0.00 09 01 01 19 270.0 2.50 288.0 3 100.0 100.0 0.000 0.0 0.000 0.0 0.00 09 01 01 20 0.0 0.40 287.0 3 100.0 100.0 0.000 0.0 0.000 0.0 0.00 09 01 01 21 90.0 0.60 285.0 3 100.0 100.0 0.000 0.0 0.000 0.0 0.00 09 01 01 22 90.0 1.40 284.0 3 100.0 100.0 0.000 0.0 0.000 0.0 0.00 09 01 01 23 90.0 1.10 283.0 3 100.0 100.0 0.000 0.0 0.000 0.0 0.00 09 01 01 24 90.0 0.30 283.0 3 100.0 100.0 0.000 0.0 0.000 0.0 0.00 *** NOTES: STABILITY CLASS 1=A, 2=B, 3=C, 4=D, 5=E AND 6=F. FLOW VECTOR IS DIRECTION TOWARD WHICH WIND IS BLOWING.

Project Title : EIA Study for Development of Industrial Estate of HSIIDC at Sec-37 & Sec-3 Extn, Ph-III, Karnal Project No. : 21-1041/2007-IA.III Contract No. : HSIA: K:2007:1315 dt.09.10.2007 Page 50 of 184
Shriram Institute for Industrial Research: Delhi
*** THE 1ST HIGHEST 1-HR AVERAGE CONCENTRATION VALUES FOR SOURCE GROUP: ALL *** INCLUDING SOURCE(S): STACK1, STACK2, STACK3, STACK4, STACK5, STACK6, STACK7,STACK8,STACK9 Direction/Degrees *** NETWORK ID: POL1 ; NETWORK TYPE: GRIDPOLR *** ** CONC OF SPM IN MICROGRAMS/M3
500 m 1000 m 1500 m 2000 m 2500 m 3000 m 4000 m 5000 m 5500 m 6000 m 6500 m 7000 m 7500 m 8000 m 8500 m 9000 m 9500 m 10000 m 10° 20.845 14.388 17.459 19.531 16.271 13.020 8.433 5.669 4.731 3.995 3.411 2.944 2.565 2.254 1.996 1.781 1.599 1.443 20° 17.725 13.770 14.957 8.829 8.245 7.752 6.937 6.253 5.950 5.670 5.411 5.172 4.951 4.746 4.557 4.381 4.217 4.065 30° 11.730 10.930 17.651 19.112 16.964 14.559 10.569 7.883 6.910 6.116 5.461 4.916 4.456 4.065 3.729 3.439 3.186 2.963 40° 9.824 12.505 12.559 11.334 9.731 8.485 6.792 5.677 5.246 4.876 4.555 4.272 4.022 3.799 3.599 3.418 3.255 3.106 50° 6.626 9.247 19.194 20.301 17.654 14.839 10.885 8.478 7.617 6.907 6.314 5.811 5.380 5.007 4.680 4.393 4.138 3.910 60° 6.767 7.821 15.874 13.758 10.573 8.263 5.534 4.059 3.560 3.161 2.834 2.564 2.336 2.141 1.974 1.829 1.701 1.588 70° 7.328 17.635 17.826 18.111 16.189 14.310 11.526 9.636 8.906 8.281 7.739 7.265 6.847 6.476 6.144 5.846 5.576 5.331 80° 8.621 20.558 21.533 20.101 14.678 10.483 6.495 4.738 4.147 3.674 3.289 2.970 2.702 2.473 2.277 2.107 1.958 1.827 90° 11.294 23.712 13.926 13.820 13.539 12.959 11.538 10.159 9.546 8.988 8.483 8.027 7.614 7.239 6.899 6.588 6.304 6.044 100° 13.854 20.925 24.902 19.003 13.111 8.938 5.435 3.658 3.086 2.644 2.294 2.013 1.783 1.592 1.431 1.295 1.179 1.078 110° 12.642 27.317 11.583 12.791 14.085 14.048 12.695 11.068 10.317 9.628 9.004 8.441 7.933 7.475 7.062 6.688 6.348 6.039 120° 16.220 17.460 26.053 18.217 11.318 7.938 4.628 2.954 2.509 2.411 2.316 2.224 2.137 2.054 1.976 1.903 1.834 1.769 130° 15.838 24.322 10.862 12.788 14.599 14.580 12.792 10.781 9.890 9.092 8.381 7.750 7.191 6.693 6.249 5.853 5.497 5.177 140° 12.030 18.660 23.137 12.742 8.014 5.520 3.644 3.442 3.325 3.206 3.089 2.976 2.868 2.765 2.667 2.576 2.489 2.407 150° 17.145 16.915 13.439 16.560 16.558 14.964 11.354 8.589 7.529 6.642 5.896 5.267 4.732 4.276 3.884 3.545 3.250 3.002 160° 20.318 20.304 16.556 7.926 6.092 6.058 5.698 5.236 5.148 5.040 4.921 4.795 4.666 4.539 4.413 4.290 4.172 4.058 170° 19.660 11.998 17.150 17.539 15.174 12.489 8.329 5.735 4.836 4.121 3.547 3.080 2.698 2.381 2.117 1.893 1.704 1.541 180° 17.114 17.616 9.042 9.018 9.089 9.056 8.659 8.056 7.739 7.427 7.127 6.841 6.571 6.317 6.079 5.856 5.647 5.451 190° 16.088 18.189 17.782 13.169 9.185 6.760 4.432 3.131 2.690 2.339 2.055 1.822 1.627 1.464 1.325 1.206 1.103 1.013 200° 17.093 15.244 15.861 15.500 14.676 13.668 11.665 9.985 9.279 8.653 8.096 7.600 7.157 6.759 6.401 6.077 5.783 5.515 210° 19.285 16.979 10.018 6.939 5.574 5.010 4.169 3.569 3.328 3.117 2.931 2.765 2.617 2.484 2.363 2.253 2.152 2.060 220° 19.943 21.006 19.496 16.879 14.517 12.580 9.758 7.878 7.167 6.566 6.052 5.608 5.222 4.882 4.583 4.316 4.077 3.862 230° 17.940 15.540 13.824 11.820 10.204 8.944 7.143 5.933 5.467 5.068 4.723 4.421 4.154 3.918 3.706 3.516 3.344 3.188 240° 19.584 14.276 10.650 8.578 7.174 6.160 4.791 3.910 3.578 3.297 3.055 2.845 2.661 2.498 2.354 2.224 2.108 2.002 250° 23.213 22.895 20.863 18.473 16.379 14.625 11.949 10.060 9.317 8.676 8.117 7.626 7.192 6.805 6.458 6.146 5.863 5.605 260° 21.346 18.240 13.411 9.133 6.976 5.527 3.770 2.780 2.438 2.160 1.932 1.742 1.581 1.444 1.326 1.238 1.175 1.117 270° 18.682 14.301 14.031 13.459 12.789 12.055 10.609 9.355 8.814 8.324 7.882 7.482 7.119 6.789 6.487 6.212 5.959 5.726 280° 18.512 20.595 21.339 17.433 13.359 10.235 6.356 4.730 4.183 3.736 3.364 3.052 2.787 2.559 2.361 2.188 2.036 1.902 290° 19.749 22.322 10.758 6.548 6.460 6.230 5.644 5.074 4.818 4.621 4.477 4.334 4.196 4.061 3.933 3.810 3.693 3.581 300° 22.167 13.298 16.609 18.234 17.145 15.244 11.600 8.922 7.903 7.050 6.331 5.721 5.201 4.752 4.364 4.025 3.728 3.465 310° 23.904 23.628 21.318 12.012 7.645 5.357 3.776 3.524 3.390 3.258 3.131 3.010 2.896 2.788 2.687 2.592 2.503 2.419 320° 20.087 20.518 11.548 13.363 14.520 15.338 16.268 14.433 13.295 12.181 11.138 10.184 9.323 8.552 7.863 7.248 6.699 6.208 330° 21.987 18.650 24.180 17.552 11.269 7.709 4.605 2.994 2.479 2.132 1.888 1.686 1.516 1.373 1.251 1.145 1.063 1.027 340° 22.948 25.380 11.665 8.836 9.987 10.527 10.379 9.603 9.163 8.727 8.308 7.911 7.539 7.192 6.870 6.571 6.293 6.036 350° 17.149 14.657 19.344 20.099 15.579 11.657 6.767 4.159 3.332 2.707 2.356 2.087 1.863 1.675 1.515 1.378 1.260 1.158 360° 17.145 19.959 15.464 8.738 9.029 9.175 8.929 8.348 8.024 7.701 7.388 7.088 6.803 6.535 6.283 6.047 5.826 5.619
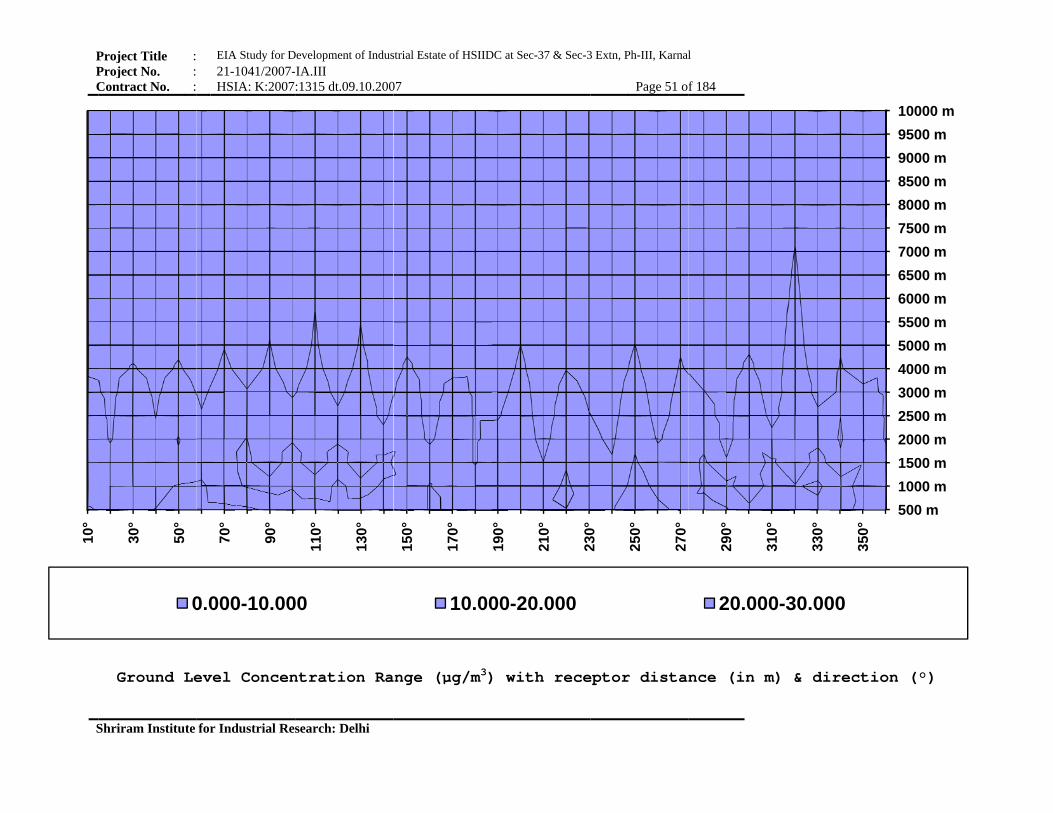
PPC
S
10°
Project Title : Project No. : Contract No. :
Shriram Institute
Ground Le
30°
50°
0
EIA Study for D21-1041/2007-HSIA: K:2007
for Industrial Res
evel Concen
70°
90°
0.000-10.00
Development of Indus-IA.III :1315 dt.09.10.200
search: Delhi
ntration Ra
110°
130°
00
strial Estate of HSIID
07
ange (µg/m3)
150°
170°
10.00
DC at Sec-37 & Sec-3
) with rece
190°
210°
230°
00-20.000
3 Extn, Ph-III, Karnal
Page 51 of
eptor distan
230
250°
270°
l
f 184
nce (in m)
290°
310°
20.000-3
& directio
330°
350°
30.000
on (°)
500 m1000 m1500 m2000 m2500 m3000 m4000 m5000 m5500 m6000 m6500 m7000 m7500 m8000 m8500 m9000 m9500 m10000 m

Project Title : EIA Study for Development of Industrial Estate of HSIIDC at Sec-37 & Sec-3 Extn, Ph-III, Karnal Project No. : 21-1041/2007-IA.III Contract No. : HSIA: K:2007:1315 dt.09.10.2007 Page 52 of 184
Shriram Institute for Industrial Research: Delhi
*** THE 2ND HIGHEST 1-HR AVERAGE CONCENTRATION VALUES FOR SOURCE GROUP: ALL *** INCLUDING SOURCE(S): STACK1, STACK2, STACK3, STACK4, STACK5, STACK6, STACK7, STACK8, STACK9 *** NETWORK ID: POL1 ; NETWORK TYPE: GRIDPOLR *** ** CONC OF SPM IN MICROGRAMS/M3
500 m 1000 m 1500 m 2000 m 2500 m 3000 m 4000 m 5000 m 5500 m 6000 m 6500 m 7000 m 7500 m 8000 m 8500 m 9000 m 9500 m 10000 m 10° 18.928 14.314 17.452 19.530 16.271 13.020 8.433 5.669 4.731 3.995 3.411 2.944 2.565 2.254 1.996 1.781 1.599 1.443 20° 16.341 13.741 14.952 7.089 6.588 6.187 5.531 4.983 4.741 4.517 4.310 4.119 3.943 3.780 3.629 3.489 3.358 3.237 30° 11.395 10.902 14.579 15.235 13.478 11.569 8.401 6.266 5.493 4.862 4.342 3.908 3.543 3.232 2.965 2.735 2.533 2.356 40° 9.667 12.497 12.397 11.334 9.731 8.485 6.792 5.677 5.246 4.876 4.555 4.272 4.022 3.799 3.599 3.418 3.255 3.106 50° 6.474 9.247 19.194 20.301 17.654 14.839 10.885 8.478 7.617 6.907 6.314 5.811 5.380 5.007 4.680 4.393 4.138 3.910 60° 5.674 7.658 14.643 12.422 9.517 7.436 4.980 3.653 3.204 2.844 2.551 2.307 2.102 1.927 1.777 1.646 1.531 1.430 70° 7.181 17.611 16.518 16.375 14.578 12.880 10.374 8.673 8.016 7.453 6.965 6.538 6.162 5.828 5.530 5.261 5.019 4.798 80° 8.267 20.523 21.531 20.095 14.678 10.483 6.495 4.738 4.147 3.674 3.289 2.970 2.702 2.473 2.277 2.107 1.958 1.827 90° 8.168 23.667 13.926 13.818 13.539 12.959 11.538 10.159 9.546 8.988 8.483 8.027 7.614 7.239 6.899 6.588 6.304 6.044 100° 12.036 20.879 24.853 18.999 13.111 8.938 5.435 3.658 3.086 2.644 2.294 2.013 1.783 1.592 1.431 1.295 1.179 1.078 110° 11.769 27.285 11.583 12.789 14.085 14.048 12.695 11.068 10.317 9.628 9.004 8.441 7.933 7.475 7.062 6.688 6.348 6.039 120° 14.016 17.448 26.053 18.217 11.318 7.938 4.628 2.954 2.509 2.411 2.316 2.224 2.137 2.054 1.976 1.903 1.834 1.769 130° 12.640 24.120 10.862 12.788 14.599 14.580 12.792 10.781 9.890 9.092 8.381 7.750 7.191 6.693 6.249 5.853 5.497 5.177 140° 11.453 15.132 23.116 12.741 6.948 4.186 3.643 3.442 3.325 3.206 3.089 2.976 2.868 2.765 2.667 2.576 2.489 2.407 150° 17.098 16.826 12.819 16.559 16.558 14.964 11.354 8.589 7.529 6.642 5.896 5.267 4.732 4.276 3.884 3.545 3.250 2.991 160° 20.290 20.244 16.548 7.926 4.894 5.101 5.299 5.236 5.148 5.040 4.921 4.795 4.666 4.539 4.413 4.290 4.172 4.058 170° 19.647 11.973 17.146 17.538 15.174 12.489 8.329 5.735 4.836 4.121 3.547 3.080 2.698 2.381 2.117 1.893 1.703 1.541 180° 17.105 17.610 9.039 9.018 9.089 9.056 8.659 8.056 7.739 7.427 7.127 6.841 6.571 6.317 6.079 5.856 5.647 5.451 190° 16.072 18.184 17.782 13.169 9.185 6.760 4.432 3.131 2.690 2.339 2.055 1.822 1.627 1.464 1.325 1.206 1.103 1.013 200° 16.744 15.239 15.860 15.500 14.676 13.668 11.665 9.985 9.279 8.653 8.096 7.600 7.157 6.759 6.401 6.077 5.783 5.515 210° 17.245 16.972 10.018 6.295 5.574 5.010 4.169 3.569 3.328 3.117 2.931 2.765 2.617 2.484 2.363 2.253 2.152 2.060 220° 17.962 20.995 19.495 16.879 14.517 12.580 9.758 7.878 7.167 6.566 6.052 5.608 5.222 4.882 4.583 4.316 4.077 3.862 230° 15.348 15.531 13.823 11.820 10.204 8.944 7.143 5.933 5.467 5.068 4.723 4.421 4.154 3.918 3.706 3.516 3.344 3.188 240° 16.488 14.271 10.484 7.942 6.308 5.199 3.966 3.237 2.963 2.730 2.529 2.356 2.203 2.069 1.949 1.842 1.745 1.658 250° 20.694 22.884 20.862 18.472 16.379 14.625 11.949 10.060 9.317 8.676 8.117 7.626 7.192 6.805 6.458 6.146 5.863 5.605 260° 17.893 18.231 13.410 8.799 5.905 4.580 3.124 2.303 2.019 1.791 1.670 1.564 1.469 1.384 1.307 1.222 1.132 1.052 270° 15.614 14.296 14.031 13.459 12.789 12.055 10.609 9.355 8.814 8.324 7.882 7.482 7.119 6.789 6.487 6.212 5.959 5.726 280° 16.674 20.590 21.338 17.432 13.359 10.235 6.356 4.276 3.597 3.068 2.649 2.311 2.036 1.820 1.702 1.596 1.503 1.419 290° 14.626 22.312 10.146 5.957 5.018 5.128 5.106 4.897 4.763 4.621 4.477 4.334 4.196 4.061 3.933 3.810 3.693 3.581 300° 16.153 11.233 16.606 18.233 17.145 15.244 11.600 8.922 7.903 7.050 6.331 5.721 5.201 4.752 4.364 4.025 3.728 3.465 310° 18.404 23.584 21.312 12.012 6.601 3.916 3.439 3.066 2.901 2.752 2.615 2.491 2.378 2.275 2.180 2.092 2.012 1.943 320° 16.497 20.359 9.843 13.363 14.520 14.292 12.476 10.520 9.660 8.890 8.206 7.598 7.059 6.579 6.150 5.767 5.422 5.112 330° 17.739 15.693 24.173 17.552 11.269 7.366 3.891 2.805 2.431 2.082 1.772 1.524 1.325 1.185 1.142 1.102 1.053 0.972 340° 19.936 25.330 9.517 8.836 9.987 10.527 10.379 9.603 9.163 8.727 8.308 7.911 7.539 7.192 6.870 6.571 6.293 6.036 350° 15.318 12.074 19.339 20.098 15.579 11.657 6.767 4.159 3.332 2.707 2.229 1.858 1.597 1.435 1.299 1.181 1.080 0.992 360° 15.428 19.927 15.460 8.738 9.029 9.175 8.929 8.348 8.024 7.701 7.388 7.088 6.803 6.535 6.283 6.047 5.826 5.619

PPC
S
10°
Project Title : Project No. : Contract No. :
Shriram Institute
Ground Le
10 30°
50°
EIA Study for D21-1041/2007-HSIA: K:2007
for Industrial Res
evel Concen
70°
90°
0.000-10.0
Development of Indus-IA.III :1315 dt.09.10.200
search: Delhi
ntration Ra
110°
130°
000
strial Estate of HSIID
07
ange (µg/m3)
150°
170°
10
DC at Sec-37 & Sec-3
) with rece
190°
210°
0.000-20.00
3 Extn, Ph-III, Karnal
Page 53 of
eptor distan
230°
250°
00
l
f 184
nce (in m) 27
0°
290°
310°
20.0
& directio
310°
330°
350°
000-30.000
on (°)
500 m1000 m1500 m2000 m2500 m3000 m4000 m5000 m5500 m6000 m6500 m7000 m7500 m8000 m8500 m9000 m9500 m1000…
350

Project Title : EIA Study for Development of Industrial Estate of HSIIDC at Sec-37 & Sec-3 Extn, Ph-III, Karnal Project No. : 21-1041/2007-IA.III Contract No. : HSIA: K:2007:1315 dt.09.10.2007 Page 54 of 184
Shriram Institute for Industrial Research: Delhi
*** THE MAXIMUM 10 1-HR AVERAGE CONCENTRATION VALUES FOR SOURCE GROUP: ALL *** INCLUDING SOURCE(S): STACK1, STACK2, STACK3, STACK4, STACK5, STACK6, STACK7,STACK8,STACK9
** CONC OF SPM IN MICROGRAMS/M3 ** RANK CONC AT RECEPTOR (XR,YR)OF TYPE RANK CONC AT RECEPTOR (XR,YR)OF TYPE - - - - - - - - - - - - - - - - - - - - - - - - - - - - - - - - - - - - - - - - - - - - - - - - - 1. 27.31654 AT (939.69, -342.02) GP 6. 26.01246 AT (1299.04, -750.00) GP 2. 27.28515 AT (939.69, -342.02) GP 7. 26.01246 AT (1299.04, -750.00) GP 3. 26.05283 AT (1299.04,-750.00) GP 8. 26.00585 AT (1299.04, -750.00) GP 4. 26.05283 AT (1299.04,-750.00) GP 9. 26.00585 AT (1299.04, -750.00) GP 5. 26.04602 AT (1299.04,-750.00) GP 10. 25.37976 AT (-342.02, 939.69) GP
*** THE SUMMARY OF HIGHEST 1-HR RESULTS *** ** CONC OF SPM IN MICROGRAMS/M3 ** GROUP ID AVERAGE CONC RECEPTOR (XR,YR,ZELEV,ZFLAG) TYPE GRID-ID - - - - - - - - - - - - - - - - - - - - - - - - - - - - - - - - - - - - - - - - - - - - - - - - - - - - - ALL HIGH 1ST HIGH VALUE IS 27.31654 AT (939.69, -342.02, 0.00,0.00) GP POL1 HIGH 2ND HIGH VALUE IS 27.28515 AT (939.69, -342.02, 0.00, 0.00) GP POL1 *** RECEPTOR TYPES: GC = GRIDCART GP = GRIDPOLR DC = DISCCART DP = DISCPOLR BD = BOUNDARY
*** Message Summary : ISCST3 Model Execution *** --------- Summary of Total Messages -------- A Total of 0 Fatal Error Message(s)
A Total of 0 Warning Message(s) ******** FATAL ERROR MESSAGES ******** *** NONE *** ******** WARNING MESSAGES ******** *** NONE *** ************************************ *** ISCST3 Finishes Successfully *** ************************************

Project Title : EIA Study for Development of Industrial Estate of HSIIDC at Sec-37 & Sec-3 Extn, Ph-III, Karnal Project No. : 21-1041/2007-IA.III Contract No. : HSIA: K:2007:1315 dt.09.10.2007 Page 55 of 184
Shriram Institute for Industrial Research: Delhi
3.3 Meteorological Scenario Micro-meteorological data facilitates in identifying the major source(s) external to the project site that contributes to the local, sub-regional and regional degradation of air quality. Micro-meteorological parameters have considerable impact on the behavior of air pollutants. The transport and diffusion of the pollutants in the atmosphere are chiefly governed by meteorological factors. These indicators not only govern dispersion, diffusion and transportation of air pollutants but are capable of altering the nature of air pollutants too. A study of the meteorological characteristics of the area including wind speed and direction, rainfall, temperature and humidity has been undertaken to assess the effect of pollution on both, the animate and inanimate, receptors. Micro-meteorological data, as has been recorded in concurrence with ambient air quality monitoring period, is summarized as under.
3.3.1 Climatic Conditions of Karnal
District Karnal experiences a semi-arid climate, which is characterized by wide temperature variations and scanty and irregular rainfall. During summer, temperature may reach up to as high as 45°C , while in winter it drops to as low as 2°C. May and June are the hottest and driest months, when dust storms from the west prevail with high speed. The average annual rainfall recorded at the Faridabad rain gauge station is 845 mm as computed from the data of 1978 to 1997. Maximum rainfall occurs during July to September on account of the southeast monsoon. The number of actual rainy days varies between 7 and 22 in a year.
Rainfall
The normal annual rainfall of the district is 1107 mm, which is unevenly distributed over the area in 43 days. The south west monsoon sets in from last week of June and withdraws in end of September, contributed about 81% of annual rainfall. July and August are the wettest months. Rest 19% rainfall is received during non-monsoon period in the wake of western disturbances and thunderstorms.
Table-3.3 (a) Rainfall data of Karnal region Month 2008 2009 2010 2011 2012
R/F %Dep R/F %Dep R/F %Dep R/F %Dep R/F %DepJanuary 1.4 -95 7.5 -76 5.5 -82 1.1 -96 5.4 -82February 2.4 -89 5.5 -75 11.5 -48 21.3 0 0.6 -97March 0.0 -100 3.7 -81 0.0 -100 4.3 -78 0.4 -98April 15.6 73 19.0 111 2.5 -72 7.5 -16 15.1 70May 71.7 58 12.7 8 6.2 -47 23.9 82 1.2 -91June 155.0 181 16.2 -71 29.3 -47 92.8 54 0.0 -100July 103.7 -50 83.7 -60 280.5 35 81.2 -59 41.7 -79August 146.4 -34 65.6 -70 249.2 12 117.5 -48 230.5 3September 109.1 5 271.7 161 276.0 165 84.8 -10 56.7 -40October 1.2 -95 0.0 -100 0.0 -100 0.0 -100 0.0 -100November 7.1 27 0.0 -100 0.0 -100 0.0 -100 0.0 -100December 0.0 -100 0.0 -100 16.1 41 0.0 -100 8.0 -34R/F = Rainfall (in mm); %Dep : Departure of rainfall from long period average; n.a Data not available
(Source: Regional Meteorological Centre, New Delhi)
3.3.2 Micro-meteorological monitoring Data in the vicinity of Proposed Project Site
Micro-meteorological data comprising of parameters like ambient air temperature, relative humidity, wind speed, wind direction, cloud cover etc. for the period Feb-2009 to Apr-2009 has been given in the annexure of this chapter. Micro-meteorological observation recorded from the analysis of yearly data can be summed up as:
(a) Wind Velocity, Wind Direction and Windrose Summary
Wind velocity and direction plays the significant role on the dispersion of air-borne pollutants and therefore, have significant impact on the air quality of the area. A wind rose gives a very succinct but information-laden view of how wind speed and direction are typically distributed at

Project Title : EIA Study for Development of Industrial Estate of HSIIDC at Sec-37 & Sec-3 Extn, Ph-III, Karnal Project No. : 21-1041/2007-IA.III Contract No. : HSIA: K:2007:1315 dt.09.10.2007 Page 56 of 184
Shriram Institute for Industrial Research: Delhi
a particular location. Presented in a circular format, the wind rose shows the frequency of winds blowing “from” particular directions. The length of each “spoke” around the circle is related to the frequency of time that the wind blows from a particular direction. Each concentric circle represents a different frequency, emanating from zero at the center to increasing frequencies at the outer circles. The wind roses shown here contain additional information, in that each spoke is broken down into discrete frequency categories that show the percentage of time that winds blow from a particular direction and at certain speed ranges. All wind roses shown here use 16 cardinal directions, such as north (N), NNE, NE, etc.
(i) Windrose summary of Dec-2008
Wind direction & wind velocity data analysis along with the windrose diagrams day-night (24-hourly) for the month of Dec-2008 has been illustrated below.
Date Range Jan 24 - Jan 31 Time Range 00:00 - 23:00 Frequency Distribution (Count)
Wind Classes (m/s)Directions (°) 0.5 - 2.1 2.1 - 3.6 3.6 - 5.7 5.7 - 8.8 8.8 - 11.1 >= 11.1 Total 348.75 - 11.25 12 0 0 0 0 0 12 11.25 - 33.75 0 0 0 0 0 0 0 33.75 - 56.25 1 0 0 0 0 0 1 56.25 - 78.75 2 0 0 0 0 0 2 78.75 – 101.25 1 0 0 0 0 0 1 101.25 - 123.75 0 0 0 0 0 0 0123.75 - 146.25 1 0 0 0 0 0 0 146.25 - 168.75 1 0 0 0 0 0 1 168.75 - 191.25 1 0 0 0 0 0 1191.25 - 213.75 0 0 0 0 0 0 0 213.75 - 236.25 5 0 0 0 0 0 5 236.25 - 258.75 1 0 0 0 0 0 1258.75 - 281.25 27 5 0 0 0 0 32 281.25 - 303.75 0 0 0 0 0 0 0 303.75 - 326.25 16 7 0 0 0 0 23 326.25 - 348.75 1 0 0 0 0 0 1 Sub-Total 69 12 0 0 0 0 81 Calms 62 Missing/Incomplete 1 Total 144
Windrose : Dec-2008

Project Title : EIA Study for Development of Industrial Estate of HSIIDC at Sec-37 & Sec-3 Extn, Ph-III, Karnal Project No. : 21-1041/2007-IA.III Contract No. : HSIA: K:2007:1315 dt.09.10.2007 Page 57 of 184
Shriram Institute for Industrial Research: Delhi
Frequency Distribution (Normalized) Wind Direction 0.5 - 2.1 2.1 - 3.6 3.6 - 5.7 5.7 - 8.8 8.8 - 11.1 >= 11.1 Total 348.75 - 11.25 0.083916 0.000000 0.000000 0.000000 0.000000 0.000000 0.083916 11.25 - 33.75 0.000000 0.000000 0.000000 0.000000 0.000000 0.000000 0.000000 33.75 - 56.25 0.006993 0.000000 0.000000 0.000000 0.000000 0.000000 0.006993 56.25 - 78.75 0.013986 0.000000 0.000000 0.000000 0.000000 0.000000 0.013986 78.75 - 101.25 0.006993 0.000000 0.000000 0.000000 0.000000 0.000000 0.006993 101.25 - 123.75 0.000000 0.000000 0.000000 0.000000 0.000000 0.000000 0.000000123.75 - 146.25 0.006993 0.000000 0.000000 0.000000 0.000000 0.000000 0.006993 146.25 - 168.75 0.006993 0.000000 0.000000 0.000000 0.000000 0.000000 0.006993 168.75 - 191.25 0.006993 0.000000 0.000000 0.000000 0.000000 0.000000 0.006993191.25 - 213.75 0.000000 0.000000 0.000000 0.000000 0.000000 0.000000 0.000000 213.75 - 236.25 0.034965 0.000000 0.000000 0.000000 0.000000 0.000000 0.034965 236.25 - 258.75 0.006993 0.000000 0.000000 0.000000 0.000000 0.000000 0.006993258.75 - 281.25 0.188811 0.034965 0.000000 0.000000 0.000000 0.000000 0.223776 281.25 - 303.75 0.000000 0.000000 0.000000 0.000000 0.000000 0.000000 0.000000 303.75 - 326.25 0.111888 0.048951 0.000000 0.000000 0.000000 0.000000 0.160839326.25 - 348.75 0.006993 0.000000 0.000000 0.000000 0.000000 0.000000 0.006993 Sub-Total: 0.482517 0.083916 0.000000 0.000000 0.000000 0.000000 0.562500 Calms 0.430556 Missing/Incomplete 0.006944 Total 1.000000 Frequency of calm wind : 43.36% Average wind speed : 0.64 m/s
Average wind speed is estimated 0.64 m/s. The frequency of calm wind was estimated 43.36%. The predominant wind directions during Dec-2008 were observed from West and NW. (ii) Windrose summary of Jan-2009 Wind direction & wind velocity data analysis along with the windrose diagrams day-night (24-hourly) for the month of Jan-2009 has been illustrated below. Date Range Jan 1 - Jan 31 Time Range 00:00 - 23:00Frequency Distribution (Count)
Wind Classes (m/s)Directions (°)
0.5 - 2.1 2.1 - 3.6 3.6 - 5.7 5.7 - 8.8 8.8 - 11.1 >= 11.1 Total
348.75 - 11.25 18 1 1 0 0 0 20 11.25 - 33.75 11 0 0 0 0 0 11 33.75 - 56.25 16 3 0 0 0 0 19 56.25 - 78.75 8 2 0 0 0 0 10 78.75 - 101.25 31 3 0 0 0 0 34 101.25 - 123.75 5 2 0 0 0 0 7 123.75 - 146.25 12 3 0 0 0 0 15 146.25 - 168.75 3 1 0 0 0 0 4 168.75 - 191.25 21 3 0 0 0 0 24 191.25 - 213.75 23 2 0 0 0 0 25 213.75 - 236.25 63 16 2 0 0 0 81 236.25 - 258.75 14 0 0 0 0 0 14 258.75 - 281.25 93 21 2 0 0 0 116 281.25 - 303.75 21 1 0 0 0 0 22 303.75 - 326.25 110 29 4 0 0 0 143 326.25 - 348.75 59 7 2 0 0 0 68 Sub-Total 508 94 11 0 0 0 613 Calms 130 Missing/Incomplete 1 Total 744
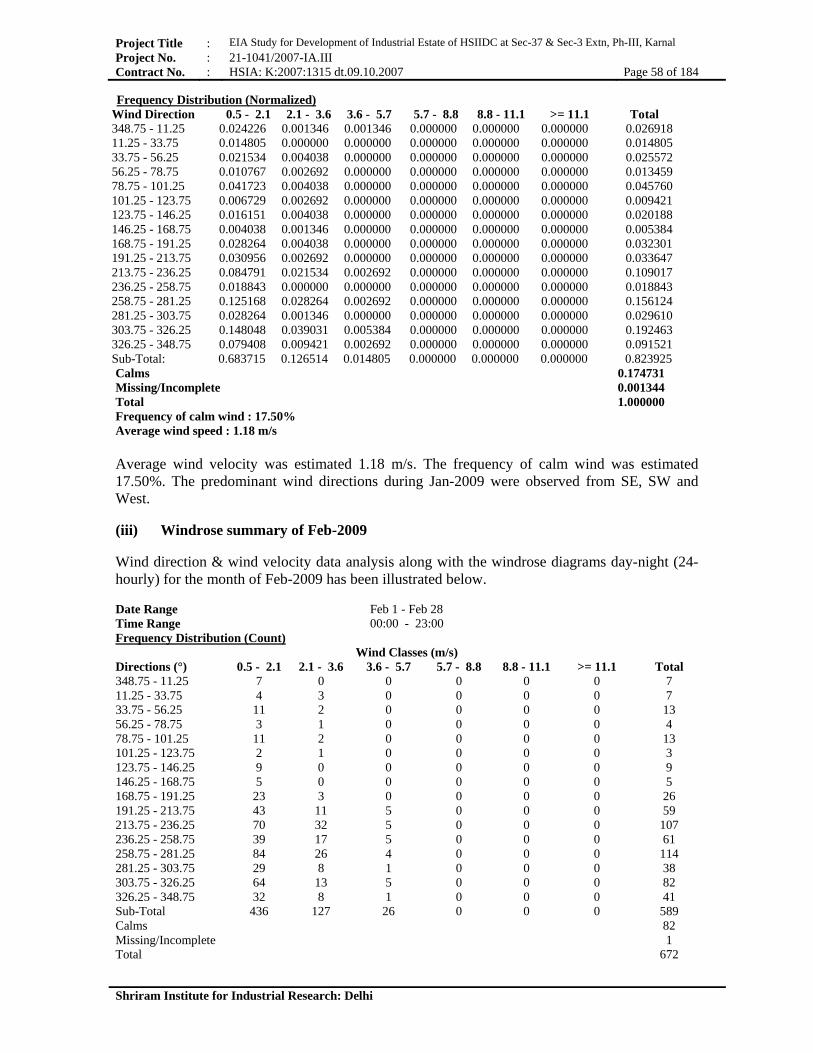
Project Title : EIA Study for Development of Industrial Estate of HSIIDC at Sec-37 & Sec-3 Extn, Ph-III, Karnal Project No. : 21-1041/2007-IA.III Contract No. : HSIA: K:2007:1315 dt.09.10.2007 Page 58 of 184
Shriram Institute for Industrial Research: Delhi
Frequency Distribution (Normalized) Wind Direction 0.5 - 2.1 2.1 - 3.6 3.6 - 5.7 5.7 - 8.8 8.8 - 11.1 >= 11.1 Total348.75 - 11.25 0.024226 0.001346 0.001346 0.000000 0.000000 0.000000 0.026918 11.25 - 33.75 0.014805 0.000000 0.000000 0.000000 0.000000 0.000000 0.014805 33.75 - 56.25 0.021534 0.004038 0.000000 0.000000 0.000000 0.000000 0.025572 56.25 - 78.75 0.010767 0.002692 0.000000 0.000000 0.000000 0.000000 0.013459 78.75 - 101.25 0.041723 0.004038 0.000000 0.000000 0.000000 0.000000 0.045760 101.25 - 123.75 0.006729 0.002692 0.000000 0.000000 0.000000 0.000000 0.009421123.75 - 146.25 0.016151 0.004038 0.000000 0.000000 0.000000 0.000000 0.020188 146.25 - 168.75 0.004038 0.001346 0.000000 0.000000 0.000000 0.000000 0.005384 168.75 - 191.25 0.028264 0.004038 0.000000 0.000000 0.000000 0.000000 0.032301191.25 - 213.75 0.030956 0.002692 0.000000 0.000000 0.000000 0.000000 0.033647 213.75 - 236.25 0.084791 0.021534 0.002692 0.000000 0.000000 0.000000 0.109017 236.25 - 258.75 0.018843 0.000000 0.000000 0.000000 0.000000 0.000000 0.018843258.75 - 281.25 0.125168 0.028264 0.002692 0.000000 0.000000 0.000000 0.156124 281.25 - 303.75 0.028264 0.001346 0.000000 0.000000 0.000000 0.000000 0.029610 303.75 - 326.25 0.148048 0.039031 0.005384 0.000000 0.000000 0.000000 0.192463326.25 - 348.75 0.079408 0.009421 0.002692 0.000000 0.000000 0.000000 0.091521 Sub-Total: 0.683715 0.126514 0.014805 0.000000 0.000000 0.000000 0.823925 Calms 0.174731 Missing/Incomplete 0.001344 Total 1.000000 Frequency of calm wind : 17.50% Average wind speed : 1.18 m/s Average wind velocity was estimated 1.18 m/s. The frequency of calm wind was estimated 17.50%. The predominant wind directions during Jan-2009 were observed from SE, SW and West. (iii) Windrose summary of Feb-2009 Wind direction & wind velocity data analysis along with the windrose diagrams day-night (24-hourly) for the month of Feb-2009 has been illustrated below. Date Range Feb 1 - Feb 28Time Range 00:00 - 23:00 Frequency Distribution (Count)
Wind Classes (m/s)Directions (°) 0.5 - 2.1 2.1 - 3.6 3.6 - 5.7 5.7 - 8.8 8.8 - 11.1 >= 11.1 Total 348.75 - 11.25 7 0 0 0 0 0 7 11.25 - 33.75 4 3 0 0 0 0 733.75 - 56.25 11 2 0 0 0 0 13 56.25 - 78.75 3 1 0 0 0 0 4 78.75 - 101.25 11 2 0 0 0 0 13101.25 - 123.75 2 1 0 0 0 0 3 123.75 - 146.25 9 0 0 0 0 0 9 146.25 - 168.75 5 0 0 0 0 0 5 168.75 - 191.25 23 3 0 0 0 0 26 191.25 - 213.75 43 11 5 0 0 0 59 213.75 - 236.25 70 32 5 0 0 0 107 236.25 - 258.75 39 17 5 0 0 0 61 258.75 - 281.25 84 26 4 0 0 0 114 281.25 - 303.75 29 8 1 0 0 0 38 303.75 - 326.25 64 13 5 0 0 0 82 326.25 - 348.75 32 8 1 0 0 0 41 Sub-Total 436 127 26 0 0 0 589 Calms 82 Missing/Incomplete 1Total 672

Project Title : EIA Study for Development of Industrial Estate of HSIIDC at Sec-37 & Sec-3 Extn, Ph-III, Karnal Project No. : 21-1041/2007-IA.III Contract No. : HSIA: K:2007:1315 dt.09.10.2007 Page 59 of 184
Shriram Institute for Industrial Research: Delhi
Frequency Distribution (Normalized)
Wind Direction 0.5 - 2.1 2.1 - 3.6 3.6 - 5.7 5.7 - 8.8 8.8 - 11.1 >= 11.1 Total 348.75 - 11.25 0.010432 0.000000 0.000000 0.000000 0.000000 0.000000 0.010432 11.25 - 33.75 0.005961 0.004471 0.000000 0.000000 0.000000 0.000000 0.010432 33.75 - 56.25 0.016393 0.002981 0.000000 0.000000 0.000000 0.000000 0.019374 56.25 - 78.75 0.004471 0.001490 0.000000 0.000000 0.000000 0.000000 0.005961 78.75 - 101.25 0.016393 0.002981 0.000000 0.000000 0.000000 0.000000 0.019374101.25 - 123.75 0.002981 0.001490 0.000000 0.000000 0.000000 0.000000 0.004471 123.75 - 146.25 0.013413 0.000000 0.000000 0.000000 0.000000 0.000000 0.013413 146.25 - 168.75 0.007452 0.000000 0.000000 0.000000 0.000000 0.000000 0.007452168.75 - 191.25 0.034277 0.004471 0.000000 0.000000 0.000000 0.000000 0.038748 191.25 - 213.75 0.064083 0.016393 0.007452 0.000000 0.000000 0.000000 0.087928 213.75 - 236.25 0.104322 0.047690 0.007452 0.000000 0.000000 0.000000 0.159463236.25 - 258.75 0.058122 0.025335 0.007452 0.000000 0.000000 0.000000 0.090909 258.75 - 281.25 0.125186 0.038748 0.005961 0.000000 0.000000 0.000000 0.169896 281.25 - 303.75 0.043219 0.011923 0.001490 0.000000 0.000000 0.000000 0.056632303.75 - 326.25 0.095380 0.019374 0.007452 0.000000 0.000000 0.000000 0.122206 326.25 - 348.75 0.047690 0.011923 0.001490 0.000000 0.000000 0.000000 0.061103 Sub-Total: 0.649776 0.189270 0.038748 0.000000 0.000000 0.000000 0.876488Sub-Total: 0.234186 0.110363 0.079408 0.020188 0.001346 0.000000 0.444892 Calms 0.122024 Missing/Incomplete 0.001488 Total 1.000000 Frequency of calm wind : 12.22% Average wind speed : 1.45 m/s
Average wind speed is estimated 1.45 m/s. The frequency of calm wind was estimated 12.22%. The predominant wind directions during Feb-2009 were observed from SW, SE & west (iv) Windrose summary of March-2009 Wind direction & wind velocity data analysis along with the windrose diagrams day-night (24-hourly) for the month of March-2009 has been illustrated below.
Windrose : Feb-2009 Windrose : Jan-2009

Project Title : EIA Study for Development of Industrial Estate of HSIIDC at Sec-37 & Sec-3 Extn, Ph-III, Karnal Project No. : 21-1041/2007-IA.III Contract No. : HSIA: K:2007:1315 dt.09.10.2007 Page 60 of 184
Shriram Institute for Industrial Research: Delhi
Date Range March 1 -March 26 Time Range 00:00 - 23:00 Frequency Distribution (Count)
Wind Classes (m/s)Directions (°) 0.5 - 2.1 2.1 - 3.6 3.6 - 5.7 5.7 - 8.8 8.8 - 11.1 >= 11.1 Total 348.75 - 11.25 9 0 0 0 0 0 9 11.25 - 33.75 5 0 0 0 0 0 5 33.75 - 56.25 7 3 0 0 0 0 1056.25 - 78.75 12 0 0 0 0 0 12 78.75 - 101.25 28 4 0 0 0 0 32 101.25 - 123.75 10 1 0 0 0 0 11123.75 - 146.25 22 3 0 0 0 0 25 146.25 - 168.75 7 0 0 0 0 0 7 168.75 - 191.25 21 5 0 0 0 0 26191.25 - 213.75 47 14 0 0 0 0 21 213.75 - 236.25 75 23 3 0 0 0 101 236.25 - 258.75 33 5 2 0 0 0 40258.75 - 281.25 95 24 0 0 0 0 119 281.25 - 303.75 27 4 1 0 0 0 32 303.75 - 326.25 23 5 0 0 0 0 28326.25 - 348.75 19 4 0 0 0 0 23 Sub-Total 440 95 6 0 0 0 541 Calms 82Missing/Incomplete 1 Total 624 Frequency Distribution (Normalized)
Wind Classes (m/s) Wind Direction 0.5 - 2.1 2.1 - 3.6 3.6 - 5.7 5.7 - 8.8 8.8 - 11.1 >= 11.1 Total 348.75 - 11.25 0.014446 0.000000 0.000000 0.000000 0.000000 0.000000 0.014446 11.25 - 33.75 0.008026 0.000000 0.000000 0.000000 0.000000 0.000000 0.008026 33.75 - 56.25 0.011236 0.004815 0.000000 0.000000 0.000000 0.000000 0.016051 56.25 - 78.75 0.019262 0.000000 0.000000 0.000000 0.000000 0.000000 0.019262 78.75 - 101.25 0.044944 0.006421 0.000000 0.000000 0.000000 0.000000 0.051364 101.25 - 123.75 0.016051 0.001605 0.000000 0.000000 0.000000 0.000000 0.017657 123.75 - 146.25 0.035313 0.004815 0.000000 0.000000 0.000000 0.000000 0.040128146.25 - 168.75 0.011236 0.000000 0.000000 0.000000 0.000000 0.000000 0.011236 168.75 - 191.25 0.033708 0.008026 0.000000 0.000000 0.000000 0.000000 0.041734 191.25 - 213.75 0.075441 0.022472 0.000000 0.000000 0.000000 0.000000 0.097913213.75 - 236.25 0.120385 0.036918 0.004815 0.000000 0.000000 0.000000 0.162119 236.25 - 258.75 0.052970 0.008026 0.003210 0.000000 0.000000 0.000000 0.064205 258.75 - 281.25 0.152488 0.038523 0.000000 0.000000 0.000000 0.000000 0.191011281.25 - 303.75 0.043339 0.006421 0.001605 0.000000 0.000000 0.000000 0.051364 303.75 - 326.25 0.036918 0.008026 0.000000 0.000000 0.000000 0.000000 0.044944 326.25 - 348.75 0.030498 0.006421 0.000000 0.000000 0.000000 0.000000 0.036918Sub-Total: 0.706260 0.152488 0.009631 0.000000 0.000000 0.000000 0.866987 Calms 0.131410 Missing/Incomplete 0.001603 Total 1.000000 Frequency of calm wind : 13.16% Average wind speed : 1.25 m/s Average wind speed has been estimated 1.25 m/s. The frequency of calm wind was estimated 13.16%. The predominant wind directions during Mar-2009 were observed from West, SW & South.

Project Title : EIA Study for Development of Industrial Estate of HSIIDC at Sec-37 & Sec-3 Extn, Ph-III, Karnal Project No. : 21-1041/2007-IA.III Contract No. : HSIA: K:2007:1315 dt.09.10.2007 Page 61 of 184
Shriram Institute for Industrial Research: Delhi
(b) Relative Humidity (RH) Moisture in the atmosphere changes the nature and characteristics of the pollutants. Fog provides surface area for suspended dust to coalesce and flow in size to settle out from the atmosphere and also enhance the chemical reaction of the gaseous pollutants. Daily maximum relative humidity varied between 68-100%, 77-100%, 82-100% and 64-100% respectively during Nov-2008, Dec-2008, Jan-2009 and Feb-2009. Daily minimum relative humidity varied between 24-53%, 24-78%, 31-77% and 19-64% respectively during Nov-2008, Dec-2008, Jan-2009 and Feb-2009. (c) Temperature Temperature plays the prominent role in conduction, convection, dispersion and diffusion of the pollutant and is a very significant attribute to describe local environment. Daily maximum temperature varied between 23-33°C, 13-28°C, 14-25°C and 20-28°C respectively during Nov-2008, Dec-2008, Jan-2009 and Feb-2009. Daily minimum temperature varied between 10-19°C, 7-16°C, 5-14°C and 8-16°C respectively during Nov-2008, Dec-2008, Jan-2009 and Feb-2009.
Table-3.3 (b) Meteorological Scenario in the vicinity of proposed project site (Daily Mean Max/Min Temperature, RH & WS) Date Wind Speed Temperature % Humidity Cloud Cover
Max Min Avg Max Min Avg Max Min Avg Max Min 25.12.2008 3.0 1.0 0.0 21.0 12.0 16.3 89.0 73.0 83.4 2.0 0.0 26.12.2008 1.8 0.1 0.7 23.0 9.0 14.3 89.0 63.0 79.8 2.0 0.0 27.12.2008 3.1 0.0 1.2 27.0 10.0 16.0 89.0 38.0 74.3 2.0 0.0 28.12.2008 5.2 0.0 1.7 27.0 12.0 16.8 89.0 56.0 80.9 2.0 0.0 29.12.2008 5.6 0.5 2.4 18.0 10.0 15.2 90.0 71.0 86.5 6.0 4.0 30.12.2008 11.8 0.5 3.5 17.0 10.0 12.5 94.0 79.0 88.0 6.0 6.0 31.12.2008 9.8 1.4 5.8 21.0 12.0 14.3 94.0 65.0 85.9 4.0 4.0 01.01.2009 6.5 0.3 2.9 16.0 10.0 12.9 94.0 53.0 85.7 8.0 4.0 02.01.2009 4.6 0.2 1.6 16.0 9.0 11.3 94.0 78.0 88.7 6.0 6.0 03.01.2009 6.4 0.2 3.1 18.0 10.0 12.3 90.0 71.0 86.1 0.0 0.0 04.01.2009 5.0 0.4 2.5 23.0 11.0 15.8 89.0 67.0 82.7 8.0 6.0 05.01.2009 7.5 0.0 1.7 23.0 11.0 14.6 90.0 53.0 83.3 8.0 0.0 06.01.2009 6.1 0.5 3.7 32.0 11.0 17.8 89.0 44.0 74.3 2.0 0.0 07.01.2009 9.6 1.5 4.3 27.0 10.0 16.8 89.0 47.0 77.4 2.0 0.0 08.01.2009 7.4 0.3 3.1 27.0 11.0 17.5 89.0 38.0 68.7 0.0 0.0 09.01.2009 6.7 0.5 3.5 24.0 11.0 15.3 89.0 60.0 79.8 8.0 0.0
Windrose : March-2009

Project Title : EIA Study for Development of Industrial Estate of HSIIDC at Sec-37 & Sec-3 Extn, Ph-III, Karnal Project No. : 21-1041/2007-IA.III Contract No. : HSIA: K:2007:1315 dt.09.10.2007 Page 62 of 184
Shriram Institute for Industrial Research: Delhi
10.01.2009 9.8 2.0 5.3 21.0 13.0 16.3 90.0 68.0 85.7 2.0 0.0 11.01.2009 7.1 1.9 4.3 22.0 11.0 16.1 89.0 62.0 81.2 0.0 0.0 12.01.2009 7.8 1.1 3.9 20.0 12.0 15.8 90.0 71.0 82.5 0.0 0.0 13.01.2009 8.1 0.3 3.1 20.0 11.0 15.0 89.0 61.0 79.8 6.0 0.0 14.01.2009 7.9 2.2 4.6 21.0 9.0 14.7 89.0 55.0 79.0 0.0 0.0 15.01.2009 10.0 2.0 4.8 21.0 11.0 14.9 89.0 57.0 82.3 0.0 0.0 16.01.2009 8.1 0.2 2.5 19.0 11.0 14.6 90.0 65.0 82.6 8.0 0.0 17.01.2009 9.1 0.7 4.4 19.0 12.0 15.3 90.0 80.0 88.6 8.0 8.0 20.01.2009 13.9 3.1 7.5 20.0 9.0 13.4 90.0 54.0 76.6 0.0 0.0 21.01.2009 13.2 3.4 7.9 20.0 10.0 14.8 88.0 54.0 71.4 0.0 0.0 22.01.2009 10.4 0.7 4.6 21.0 11.0 15.4 88.0 61.0 75.0 6.0 0.0 23.01.2009 20.1 1.5 8.0 24.0 11.0 16.8 88.0 53.0 68.9 6.0 0.0 24.01.2009 20.0 1.1 9.0 22.0 12.0 16.5 89.0 58.0 72.4 8.0 2.0 25.01.2009 12.8 1.3 5.2 20.0 12.0 15.9 89.0 55.0 72.7 8.0 4.0 26.01.2009 4.9 0.3 2.2 21.0 14.0 17.7 89.0 64.0 78.2 4.0 0.0 27.01.2009 14.2 0.1 3.7 22.0 11.0 16.3 90.0 58.0 75.8 0.0 0.0 28.01.2009 11.4 2.0 7.0 22.0 11.0 15.1 89.0 55.0 75.6 0.0 0.0 29.01.2009 8.0 0.8 3.1 20.0 9.0 15.1 89.0 53.0 71.8 0.0 0.0 30.01.2009 12.2 0.3 3.9 21.0 13.0 16.7 89.0 54.0 72.8 0.0 0.0 31.01.2009 17.1 1.3 7.2 20.0 11.0 14.6 88.0 64.0 75.9 2.0 0.0 01.02.2009 10.7 2.3 5.9 20.0 11.0 15.3 88.0 64.0 77.0 4.0 0.0 02.02.2009 8.3 0.2 2.8 19.0 11.0 15.0 88.0 54.0 73.7 2.0 0.0 03.02.2009 6.8 0.1 1.5 21.0 11.0 16.3 89.0 64.0 76.0 0.0 0.0 04.02.2009 3.3 0.1 1.0 22.0 12.0 15.7 89.0 64.0 80.4 4.0 0.0 05.02.2009 9.7 0.2 4.7 25.0 9.0 17.2 90.0 54.0 75.7 4.0 0.0 06.02.2009 8.2 2.1 3.9 25.0 11.0 15.9 90.0 60.0 82.1 0.0 0.0 07.02.2009 10.1 2.4 6.1 23.0 10.0 15.2 91.0 67.0 82.7 0.0 0.0 08.02.2009 10.1 1.8 4.8 23.0 9.0 14.0 91.0 74.0 85.9 0.0 0.0 09.02.2009 7.0 0.8 2.7 22.0 11.0 16.5 91.0 71.0 84.5 0.0 0.0 10.02.2009 17.3 1.0 5.3 23.0 14.0 17.3 89.0 59.0 73.3 8.0 0.0 11.02.2009 14.5 2.1 6.0 21.0 13.0 15.3 89.0 64.0 81.5 8.0 0.0 12.02.2009 14.5 2.1 6.0 21.0 13.0 15.3 89.0 64.0 81.5 8.0 0.0 13.02.2009 6.1 0.7 3.5 25.0 11.0 17.3 90.0 61.0 78.5 0.0 0.0 14.02.2009 8.1 1.5 4.6 23.0 15.0 18.3 90.0 66.0 80.5 8.0 0.0 15.02.2009 15.9 1.9 6.8 22.0 13.0 16.1 90.0 66.0 84.3 0.0 0.0 16.02.2009 11.3 1.7 5.3 22.0 14.0 16.4 89.0 63.0 80.1 0.0 0.0 17.02.2009 7.6 1.3 4.4 25.0 12.0 16.9 89.0 45.0 78.1 6.0 0.0 18.02.2009 19.0 1.9 5.6 24.0 13.0 17.3 89.0 58.0 75.2 6.0 0.0 19.02.2009 16.8 4.1 8.6 25.0 12.0 17.7 89.0 46.0 71.4 0.0 0.0 20.02.2009 7.4 1.7 4.5 28.0 12.0 18.8 89.0 44.0 68.1 0.0 0.0 21.02.2009 19.3 1.4 8.4 25.0 13.0 17.8 89.0 50.0 73.8 0.0 0.0 22.02.2009 15.9 3.7 8.3 25.0 12.0 17.2 89.0 41.0 70.7 2.0 0.0 23.02.2009 6.5 0.2 2.1 29.0 12.0 19.3 90.0 51.0 77.0 8.0 0.0 24.02.2009 7.3 0.5 3.4 24.0 12.0 17.9 90.0 47.0 78.0 8.0 0.0 25.02.2009 14.1 2.5 7.0 27.0 14.0 19.3 89.0 49.0 71.3 0.0 0.0 26.02.2009 13.3 3.2 7.6 26.0 16.0 19.9 79.0 36.0 59.2 0.0 0.0 27.02.2009 15.0 3.8 8.7 26.0 14.0 19.1 89.0 42.0 67.1 0.0 0.0 28.02.2009 18.2 3.9 9.6 25.0 16.0 19.5 79.0 45.0 62.8 0.0 0.0 01.03.2009 14.9 4.3 9.0 25.0 14.0 18.3 89.0 45.0 68.8 0.0 0.0 02.03.2009 10.3 2.6 6.0 26.0 14.0 20.2 79.0 42.0 64.5 0.0 0.0 03.03.2009 8.8 0.5 2.8 29.0 16.0 22.4 90.0 45.0 66.8 8.0 0.0 04.03.2009 10.8 1.2 4.8 30.0 24.0 26.4 76.0 47.0 60.5 8.0 0.0 05.03.2009 11.9 2.3 6.9 29.0 20.0 23.7 82.0 61.0 72.7 6.0 0.0

Project Title : EIA Study for Development of Industrial Estate of HSIIDC at Sec-37 & Sec-3 Extn, Ph-III, Karnal Project No. : 21-1041/2007-IA.III Contract No. : HSIA: K:2007:1315 dt.09.10.2007 Page 63 of 184
Shriram Institute for Industrial Research: Delhi
06.03.2009 10.2 1.9 5.6 29.0 18.0 22.7 82.0 49.0 66.6 0.0 0.0 07.03.2009 8.6 1.3 4.2 28.0 20.0 23.5 81.0 49.0 62.7 0.0 0.0 09.03.2009 8.6 0.4 2.9 30.0 27.0 20.6 81.0 48.0 56.8 0.0 20.6 10.03.2009 11.9 2.3 4.7 30.0 17.0 22.7 80.0 35.0 54.1 0.0 0.0 12.03.2009 18.4 1.8 8.6 28.0 19.0 23.9 64.0 40.0 55.4 0.0 0.0 13.03.2009 10.5 0.4 2.7 30.0 18.0 23.8 71.0 47.0 58.9 2.0 0.0 14.03.2009 7.1 0.8 3.3 30.0 18.0 23.8 74.0 47.0 61.3 0.0 0.0 15.03.2009 6.7 0.6 3.0 30.0 17.0 23.8 90.0 47.0 62.4 0.0 0.0 16.03.2009 6.2 0.9 3.0 31.0 19.0 25.2 82.0 44.0 59.2 0.0 0.0 17.03.2009 5.3 0.4 2.1 32.0 19.0 24.6 82.0 43.0 58.8 0.0 0.0 18.03.2009 6.4 0.9 3.5 30.0 19.0 23.6 76.0 50.0 62.4 4.0 0.0 19.03.2009 6.5 0.5 3.5 32.0 17.0 23.1 91.0 43.0 66.8 0.0 0.0 20.03.2009 5.2 0.4 3.2 30.0 18.0 22.5 81.0 39.0 59.5 8.0 0.0 21.03.2009 10.3 2.2 5.5 28.0 18.0 20.4 91.0 64.0 82.5 8.0 2.0 22.03.2009 4.2 0.3 2.3 32.0 16.0 21.4 91.0 49.0 82.3 8.0 0.0 23.03.2009 9.5 1.1 4.5 28.0 18.0 21.8 91.0 62.0 79.7 8.0 0.0 24.03.2009 11.4 0.8 4.0 30.0 16.0 23.7 90.0 47.0 70.5 2.0 0.0 25.03.2009 10.4 3.1 6.3 26.0 16.0 20.7 82.0 55.0 73.3 6.0 2.0 26.03.2009 9.8 1.1 4.7 26.0 15.0 18.8 89.0 55.0 76.0 6.0 0.0
Annexure : Micro-meteorological data
Date Time Wind Direction Wind Speed Air Temp. Humidity Condition Date Time Wind Direction Wind
Speed Air Temp. Humidity Condition
from Km/hr °C % from Km/hr °C % 25.12.2008 0:00 .. .. .. .. .. 26.12.2008 0:00 225 0.5 12 88 F 25.12.2008 1:00 -- -- -- -- -- 26.12.2008 1:00 225 0.5 11 87 F 25.12.2008 2:00 -- -- -- -- -- 26.12.2008 2:00 202.5 0.6 11 87 F 25.12.2008 3:00 -- -- -- -- -- 26.12.2008 3:00 225 0.9 10 87 F 25.12.2008 4:00 -- -- -- -- -- 26.12.2008 4:00 225 1 9 86 F 25.12.2008 5:00 -- -- -- -- -- 26.12.2008 5:00 225 0.3 9 86 F 25.12.2008 6:00 -- -- -- -- -- 26.12.2008 6:00 135 0.3 10 74 F 25.12.2008 7:00 -- -- -- -- -- 26.12.2008 7:00 157.5 0.5 10 87 F 25.12.2008 8:00 -- -- -- -- -- 26.12.2008 8:00 157.5 0.2 10 87 F 25.12.2008 9:00 -- -- -- -- -- 26.12.2008 9:00 135 0.2 10 87 F 25.12.2008 10:00 -- -- -- -- -- 26.12.2008 10:00 135 0.8 12 88 F 25.12.2008 11:00 .. -- .. -- -- 26.12.2008 11:00 135 1.2 14 89 F 25.12.2008 12:00 270 -- 15 89 F 26.12.2008 12:00 225 0.6 21 82 F 25.12.2008 13:00 247.5 2 21 74 F 26.12.2008 13:00 225 0.2 22 74 0 25.12.2008 14:00 247.5 2 20 73 2 26.12.2008 14:00 90 0.2 23 67 0 25.12.2008 15:00 180 2 20 81 0 26.12.2008 15:00 180 0.7 20 64 0 25.12.2008 16:00 0 3 19 81 0 26.12.2008 16:00 270 1.5 19 63 0 25.12.2008 17:00 135 2 15 80 0 26.12.2008 17:00 315 1.8 18 71 0 25.12.2008 18:00 202.5 0.1 15 80 0 26.12.2008 18:00 315 1.6 17 70 0 25.12.2008 19:00 225 0.1 15 89 0 26.12.2008 19:00 315 0.4 16 89 0 25.12.2008 20:00 225 0 15 89 0 26.12.2008 20:00 45 0.7 15 78 2 25.12.2008 21:00 225 0 15 89 0 26.12.2008 21:00 45 0.8 15 78 2 25.12.2008 22:00 225 0 13 88 0 26.12.2008 22:00 45 0.2 14 78 2 25.12.2008 23:00 225 0 12 88 0 26.12.2008 23:00 45 0.1 14 67 2
27.12.2008 0:00 270 0.4 10 87 2 28.12.2008 0:00 45 0.3 14 89 0 27.12.2008 1:00 270 0.7 10 87 2 28.12.2008 1:00 45 0.4 14 89 0 27.12.2008 2:00 225 0.8 11 87 2 28.12.2008 2:00 45 0.4 14 89 0 27.12.2008 3:00 225 1 10 87 2 28.12.2008 3:00 45 0.4 14 89 0 27.12.2008 4:00 180 0.2 11 87 0 28.12.2008 4:00 45 0.2 14 89 0 27.12.2008 5:00 45 0.2 11 87 F 28.12.2008 5:00 45 0.5 13 88 0 27.12.2008 6:00 45 0.2 10 87 F 28.12.2008 6:00 0 0.5 13 88 0 27.12.2008 7:00 45 0.1 10 87 F 28.12.2008 7:00 0 0.5 13 88 0 27.12.2008 8:00 45 0 11 87 F 28.12.2008 8:00 0 0.8 12 88 0 27.12.2008 9:00 45 0.4 16 69 F 28.12.2008 9:00 112.5 0 17 80 0 27.12.2008 10:00 135 1.7 21 57 2 28.12.2008 10:00 67.5 2 21 65 0 27.12.2008 11:00 90 1.8 27 38 2 28.12.2008 11:00 0 3.6 23 67 2 27.12.2008 12:00 90 1.2 26 42 2 28.12.2008 12:00 90 0.9 27 56 2 27.12.2008 13:00 0 2.1 23 59 0 28.12.2008 13:00 0 0.9 25 61 2 27.12.2008 14:00 67.5 2.7 21 57 0 28.12.2008 14:00 315 2.6 23 67 2 27.12.2008 15:00 67.5 1 22 58 0 28.12.2008 15:00 45 1.9 21 73 2 27.12.2008 16:00 90 0.3 21 57 0 28.12.2008 16:00 270 2.5 21 73 2 27.12.2008 17:00 270 1.3 18 80 0 28.12.2008 17:00 270 3.6 19 81 2 27.12.2008 18:00 315 3.1 17 80 0 28.12.2008 18:00 270 2.2 17 80 F 27.12.2008 19:00 180 2.5 16 79 0 28.12.2008 19:00 270 5.2 15 89 F 27.12.2008 20:00 0 2.4 16 79 0 28.12.2008 20:00 315 3.1 14 89 F 27.12.2008 21:00 0 1.6 15 78 0 28.12.2008 21:00 315 3.4 13 88 F 27.12.2008 22:00 0 0.4 15 89 0 28.12.2008 22:00 0 2.1 13 88 F 27.12.2008 23:00 0 1.5 16 79 0 28.12.2009 23:00 0 2.1 13 88 F

Project Title : EIA Study for Development of Industrial Estate of HSIIDC at Sec-37 & Sec-3 Extn, Ph-III, Karnal Project No. : 21-1041/2007-IA.III Contract No. : HSIA: K:2007:1315 dt.09.10.2007 Page 64 of 184
Shriram Institute for Industrial Research: Delhi
29.12.2008 0:00 0 1.9 13 88 F 30.12.2008 0:00 315 10.3 13 88 F
29.12.2008 1:00 0 2 12 88 F 30.12.2008 1:00 270 7 12 88 F
29.12.2008 2:00 315 3.1 12 88 F 30.12.2008 2:00 270 11.8 12 88 F
29.12.2008 3:00 315 3.2 11 87 F 30.12.2008 3:00 0 1.2 11 87 F
29.12.2008 4:00 315 1.2 11 87 F 30.12.2008 4:00 0 1.8 11 87 F
29.12.2008 5:00 315 2.7 11 87 F 30.12.2008 5:00 0 2.3 11 87 F
29.12.2008 6:00 315 1.4 11 87 F 30.12.2008 6:00 315 3.2 11 87 F
29.12.2008 7:00 315 3.9 11 87 F 30.12.2008 7:00 315 0.5 11 87 F
29.12.2008 8:00 315 0.5 11 87 F 30.12.2008 8:00 315 2.8 11 87 F
29.12.2008 9:00 157.5 2.6 10 87 F 30.12.2008 9:00 315 2.4 10 90 F
29.12.2008 10:00 180 1.8 12 88 F 30.12.2008 10:00 180 1.4 10 90 F
29.12.2008 11:00 225 1.2 12 88 F 30.12.2008 11:00 180 1 10 87 F
29.12.2008 12:00 225 3.2 13 88 F 30.12.2008 12:00 180 1.7 10 87 F
29.12.2008 13:00 247.5 2.5 16 79 F 30.12.2008 13:00 270 3.2 16 79 6
29.12.2008 14:00 225 1.6 17 90 4 30.12.2008 14:00 270 6.3 17 80 6
29.12.2008 15:00 270 3.9 18 71 6 30.12.2008 15:00 270 5.7 16 89 6
29.12.2008 16:00 270 5.2 17 90 6 30.12.2008 16:00 270 2.7 15 94 6
29.12.2008 17:00 225 5.6 17 90 6 30.12.2008 17:00 270 4.1 14 94 6
29.12.2008 18:00 270 0.8 15 78 6 30.12.2008 18:00 270 2.6 15 94 6
29.12.2008 19:00 270 1.6 14 89 4 30.12.2008 19:00 315 3.7 14 89 6
29.12.2008 20:00 225 0.8 14 89 4 30.12.2008 20:00 315 0.8 13 88 6
29.12.2008 21:00 270 2.4 13 88 F 30.12.2008 21:00 270 2.5 12 88 6
29.12.2008 22:00 270 2.1 13 88 F 30.12.2008 22:00 270 1.3 12 88 F
29.12.2008 23:00 0 1.9 12 88 F 30.12.2008 23:00 270 3.6 12 88 F
31.12.2008 0:00 270 5 12 88 F 01.01.2008 0:00 270 6.5 13 88 F
31.12.2008 1:00 270 7.2 12 94 F 01.01.2008 1:00 270 3.9 12 88 F
31.12.2008 2:00 270 8.8 13 94 F 01.01.2008 2:00 225 4.6 13 94 F
31.12.2008 3:00 315 9 13 88 F 01.01.2008 3:00 225 4.3 13 88 F
31.12.2008 4:00 315 7.5 12 88 F 01.01.2008 4:00 315 3.3 13 77 F
31.12.2008 5:00 270 8 13 88 F 01.01.2008 5:00 270 4.3 13 88 F
31.12.2008 6:00 315 7.7 13 88 F 01.01.2008 6:00 270 3.9 13 94 F
31.12.2008 7:00 315 8.8 13 88 F 01.01.2008 7:00 315 2.8 12 94 F
31.12.2008 8:00 315 9.8 13 88 F 01.01.2008 8:00 270 4.3 12 94 6
31.12.2008 9:00 270 8.2 13 77 F 01.01.2008 9:00 270 3.3 13 88 6
31.12.2008 10:00 315 7.5 14 78 4 01.01.2008 10:00 135 1.3 13 88 6
31.12.2008 11:00 315 6.7 15 78 4 01.01.2008 11:00 135 1.3 13 88 6
31.12.2008 12:00 315 6.2 16 79 4 01.01.2008 12:00 225 2.7 13 88 8
31.12.2008 13:00 270 4.5 16 89 4 01.01.2008 13:00 180 3.8 14 89 8
31.12.2008 14:00 270 2.8 17 90 4 01.01.2008 14:00 180 2.3 14 89 8
31.12.2008 15:00 270 3.1 19 81 4 01.01.2008 15:00 180 2 13 94 8
31.12.2008 16:00 270 5.6 21 65 4 01.01.2008 16:00 180 4.4 15 71 6
31.12.2008 17:00 270 8.7 16 89 4 01.01.2008 17:00 180 3.3 16 62 4
31.12.2008 18:00 270 3 15 89 4 01.01.2008 18:00 270 2.5 15 53 8
31.12.2008 19:00 270 1.9 15 89 4 01.01.2008 19:00 0 0.4 14 89 8
31.12.2008 20:00 270 2.1 14 89 4 01.01.2008 20:00 90 0.6 12 88 6
31.12.2008 21:00 225 2.4 14 89 F 01.01.2008 21:00 90 1.4 11 87 6
31.12.2008 22:00 225 2.3 13 88 F 01.01.2008 22:00 90 1.1 10 90 6
31.12.2008 23:00 225 1.4 12 88 F 01.01.2008 23:00 90 0.3 10 87 F
02.01.2009 0:00 180 0.2 10 87 F 03.01.2009 0:00 180 2.8 11 87 F
02.01.2009 1:00 180 0.3 10 93 F 03.01.2009 1:00 225 3.1 11 87 F
02.01.2009 2:00 225 0.3 10 93 F 03.01.2009 2:00 225 4.2 11 87 F
02.01.2009 3:00 225 0.5 10 87 F 03.01.2009 3:00 225 3.8 11 87 F

Project Title : EIA Study for Development of Industrial Estate of HSIIDC at Sec-37 & Sec-3 Extn, Ph-III, Karnal Project No. : 21-1041/2007-IA.III Contract No. : HSIA: K:2007:1315 dt.09.10.2007 Page 65 of 184
Shriram Institute for Industrial Research: Delhi
02.01.2009 4:00 180 0.2 9 93 F 03.01.2009 4:00 270 3.1 11 87 F
02.01.2009 5:00 225 0.3 9 86 F 03.01.2009 5:00 90 3.4 11 87 F
02.01.2009 6:00 225 0.3 9 93 F 03.01.2009 6:00 90 3.1 10 87 F
02.01.2009 7:00 225 0.3 9 93 F 03.01.2009 7:00 90 2.4 10 87 F
02.01.2009 8:00 315 1.8 10 87 F 03.01.2009 8:00 90 3.6 10 87 F
02.01.2009 9:00 315 1.2 11 87 F 03.01.2009 9:00 90 3.8 10 87 F
02.01.2009 10:00 315 1.8 11 87 F 03.01.2009 10:00 45 4.3 10 87 F
02.01.2009 11:00 315 0.3 11 94 F 03.01.2009 11:00 90 6.4 10 87 F
02.01.2009 12:00 270 2.5 12 88 F 03.01.2009 12:00 45 6.1 11 87 F
02.01.2009 13:00 180 2.3 12 94 F 03.01.2009 13:00 135 5.5 12 88 0
02.01.2009 14:00 270 2 16 79 6 03.01.2009 14:00 135 4.2 13 88 0
02.01.2009 15:00 270 1.7 15 89 6 03.01.2009 15:00 90 5.1 13 88 0
02.01.2009 16:00 45 2.4 15 78 6 03.01.2009 16:00 90 3.9 13 88 0
02.01.2009 17:00 90 3.4 14 89 6 03.01.2009 17:00 45 2.7 13 88 0
02.01.2009 18:00 90 2.2 14 89 F 03.01.2009 18:00 45 1.1 14 89 0
02.01.2009 19:00 0 1.9 12 88 F 03.01.2009 19:00 45 0.7 15 78 0
02.01.2009 20:00 0 4.6 11 87 F 03.01.2009 20:00 90 0.2 15 89 0
02.01.2009 21:00 315 2.3 11 87 F 03.01.2009 21:00 45 0.3 16 79 0
02.01.2009 22:00 315 3.4 11 87 F 03.01.2009 22:00 315 0.6 17 90 0
02.01.2009 23:00 315 2.1 10 93 F 03.01.2009 23:00 45 0.5 18 71 0
04.01.2009 0:00 0 0.9 13 88 F 05.01.2009 0:00 0 0 13 88 8
04.01.2009 1:00 0 1.9 12 88 F 05.01.2009 1:00 0 0.7 13 88 8
04.01.2009 2:00 315 3.6 12 88 F 05.01.2009 2:00 67.5 0.9 13 88 8
04.01.2009 3:00 315 2.9 11 87 F 05.01.2009 3:00 67.5 1.1 12 88 F
04.01.2009 4:00 315 3.4 11 87 F 05.01.2009 4:00 22.5 1.1 12 88 F
04.01.2009 5:00 315 2.1 11 87 F 05.01.2009 5:00 22.5 1.1 11 87 F
04.01.2009 6:00 315 1.3 11 87 F 05.01.2009 6:00 22.5 1.7 12 88 F
04.01.2009 7:00 0 2.3 13 88 F 05.01.2009 7:00 22.5 2.1 12 88 F
04.01.2009 8:00 90 2.9 13 88 6 05.01.2009 8:00 315 1 11 87 F
04.01.2009 9:00 90 2.4 13 88 6 05.01.2009 9:00 315 0.7 11 87 F
04.01.2009 10:00 180 2.4 19 72 6 05.01.2009 10:00 315 1.3 11 87 F
04.01.2009 11:00 180 4 21 73 6 05.01.2009 11:00 337.5 2.2 11 87 F
04.01.2009 12:00 180 4.5 23 67 6 05.01.2009 12:00 337.5 3.5 18 71 0
04.01.2009 13:00 180 5 23 67 6 05.01.2009 13:00 337.5 3 23 67 0
04.01.2009 14:00 180 3 22 82 6 05.01.2009 14:00 225 7.5 17 90 0
04.01.2009 15:00 112.5 4.3 22 82 6 05.01.2009 15:00 225 5.5 18 71 0
04.01.2009 16:00 135 4.4 21 82 8 05.01.2009 16:00 270 2 17 90 0
04.01.2009 17:00 135 4.4 21 73 8 05.01.2009 17:00 225 4.3 17 80 0
04.01.2009 18:00 112.5 0.4 16 89 8 05.01.2009 18:00 225 0.1 18 53 0
04.01.2009 19:00 45 1 16 89 8 05.01.2009 19:00 202.5 0.4 17 90 0
04.01.2009 20:00 45 0.7 15 78 8-D 05.01.2009 20:00 202.5 0.4 16 79 0
04.01.2009 21:00 225 0.7 15 78 8-D 05.01.2009 21:00 247.5 0.6 16 79 0
04.01.2009 22:00 225 0.4 13 88 8-D 05.01.2009 22:00 225 0.5 16 89 0
04.01.2009 23:00 225 0.5 13 88 8-D 05.01.2009 23:00 202.5 0.2 16 89 0
06.01.2009 0:00 247.5 1 15 89 F 07.01.2009 0:00 292.5 3 13 88 2
06.01.2009 1:00 202.5 2.8 16 79 F 07.01.2009 1:00 315 2.8 13 88 2
06.01.2009 2:00 270 2.5 15 89 F 07.01.2009 2:00 22.5 1.5 12 88 2
06.01.2009 3:00 270 3.4 13 88 F 07.01.2009 3:00 0 2.5 12 88 2
06.01.2009 4:00 225 2.6 12 88 F 07.01.2009 4:00 337.5 2.1 12 76 2
06.01.2009 5:00 225 5.1 12 88 F 07.01.2009 5:00 315 3 12 76 2
06.01.2009 6:00 202.5 5.4 11 87 F 07.01.2009 6:00 292.5 3.4 10 87 2

Project Title : EIA Study for Development of Industrial Estate of HSIIDC at Sec-37 & Sec-3 Extn, Ph-III, Karnal Project No. : 21-1041/2007-IA.III Contract No. : HSIA: K:2007:1315 dt.09.10.2007 Page 66 of 184
Shriram Institute for Industrial Research: Delhi
06.01.2009 7:00 270 5.7 12 88 F 07.01.2009 7:00 270 3.5 10 74 2
06.01.2009 8:00 180 0.5 13 88 0 07.01.2009 8:00 270 4 10 87 2
06.01.2009 9:00 180 1 18 62 0 07.01.2009 9:00 270 4.7 18 71 0
06.01.2009 10:00 225 2 25 47 0 07.01.2009 10:00 0 3.8 19 72 0
06.01.2009 11:00 270 2.8 30 53 0 07.01.2009 11:00 270 7 25 47 0
06.01.2009 12:00 270 3.8 32 44 0 07.01.2009 12:00 0 6.1 26 49 0
06.01.2009 13:00 315 4.7 30 53 0 07.01.2009 13:00 270 6.9 27 50 0
06.01.2009 14:00 270 5.6 23 59 0 07.01.2009 14:00 315 6.1 26 49 0
06.01.2009 15:00 270 5.8 20 71 0 07.01.2009 15:00 315 9.6 26 49 0
06.01.2009 16:00 315 6.1 19 81 0 07.01.2009 16:00 270 9 19 81 0
06.01.2009 17:00 315 4.7 19 81 0 07.01.2009 17:00 337.5 5.4 18 71 0
06.01.2009 18:00 315 3.2 18 62 2 07.01.2009 18:00 315 4.1 17 70 0
06.01.2009 19:00 315 3.8 18 62 2 07.01.2009 19:00 337.5 5.1 16 69 0
06.01.2009 20:00 292.5 4.1 16 69 2 07.01.2009 20:00 315 4.1 15 89 0
06.01.2009 21:00 337.5 4.3 15 78 2 07.01.2009 21:00 270 1.5 15 89 0
06.01.2009 22:00 315 3.9 13 88 2 07.01.2009 22:00 337.5 2.3 16 79 0
06.01.2009 23:00 337.5 4 13 88 2 07.01.2009 23:00 315 2.4 15 89 0
08.01.2009 0:00 270 1.1 15 89 0 09.01.2009 0:00 225 1.2 15 78 8
08.01.2009 1:00 337.5 3.5 15 89 0 09.01.2009 1:00 247.5 2.1 15 89 8
08.01.2009 2:00 315 3.3 16 69 0 09.01.2009 2:00 225 3.1 13 88 8
08.01.2009 3:00 225 3.4 13 88 0 09.01.2009 3:00 337.5 3.9 12 88 8
08.01.2009 4:00 315 3.1 13 88 0 09.01.2009 4:00 315 3.1 11 87 8
08.01.2009 5:00 337.5 3.2 12 88 0 09.01.2009 5:00 270 1.1 12 88 8
08.01.2009 6:00 225 3.4 12 88 0 09.01.2009 6:00 337.5 3.2 11 87 8
08.01.2009 7:00 202.5 4.1 11 87 0 09.01.2009 7:00 315 2.5 11 87 8
08.01.2009 8:00 315 2.3 15 68 0 09.01.2009 8:00 0 4.4 13 88 8
08.01.2009 9:00 315 0.7 18 62 0 09.01.2009 9:00 0 2.3 13 88 6
08.01.2009 10:00 315 2.3 22 50 0 09.01.2009 10:00 337.5 2.7 15 78 6
08.01.2009 11:00 270 5.7 24 46 0 09.01.2009 11:00 22.5 4.5 19 81 6
08.01.2009 12:00 270 6.7 27 38 0 09.01.2009 12:00 90 4.2 18 62 0
08.01.2009 13:00 315 7.4 26 42 0 09.01.2009 13:00 315 4.2 24 60 0
08.01.2009 14:00 270 4.2 25 47 0 09.01.2009 14:00 337.5 4.7 19 81 0
08.01.2009 15:00 337.5 4.2 24 46 0 09.01.2009 15:00 315 4.7 19 81 0
08.01.2009 16:00 315 5.1 22 50 0 09.01.2009 16:00 270 4.7 18 62 0
08.01.2009 17:00 315 4.2 18 62 0 09.01.2009 17:00 337.5 4.4 18 62 0
08.01.2009 18:00 315 1.4 16 69 0 09.01.2009 18:00 270 6.7 15 78 0
08.01.2009 19:00 315 1.1 16 69 0 09.01.2009 19:00 315 5.2 15 78 0
08.01.2009 20:00 202.5 0.3 15 68 0 09.01.2009 20:00 337.5 0.5 15 89 0
08.01.2009 21:00 225 0.4 15 68 0 09.01.2009 21:00 315 4.6 15 89 0
08.01.2009 22:00 270 1.1 15 89 0 09.01.2009 22:00 337.5 3.2 15 68 0
08.01.2009 23:00 270 1.2 15 89 0 09.01.2009 23:00 0 3.3 15 78 0
10.01.2009 0:00 292.5 4.1 15 89 0 11.01.2009 0:00 315 4.7 15 78 0
10.01.2009 1:00 315 3 16 89 0 11.01.2009 1:00 270 5.1 15 89 0
10.01.2009 2:00 337.5 2 16 89 0 11.01.2009 2:00 292.5 4.2 13 88 0
10.01.2009 3:00 0 3.4 15 89 0 11.01.2009 3:00 270 5.5 13 88 0
10.01.2009 4:00 270 4.1 14 89 2 11.01.2009 4:00 337.5 3.9 15 89 0
10.01.2009 5:00 315 4.2 13 88 2 11.01.2009 5:00 337.5 4 13 88 0
10.01.2009 6:00 292.5 4.1 13 88 2 11.01.2009 6:00 270 2.1 12 88 0
10.01.2009 7:00 337.5 4.2 15 68 2 11.01.2009 7:00 270 3.9 12 88 0
10.01.2009 8:00 292.5 3.6 15 89 2 11.01.2009 8:00 270 2.8 11 87 0
10.01.2009 9:00 292.5 4.9 16 89 2 11.01.2009 9:00 337.5 5.5 15 78 0

Project Title : EIA Study for Development of Industrial Estate of HSIIDC at Sec-37 & Sec-3 Extn, Ph-III, Karnal Project No. : 21-1041/2007-IA.III Contract No. : HSIA: K:2007:1315 dt.09.10.2007 Page 67 of 184
Shriram Institute for Industrial Research: Delhi
10.01.2009 10:00 180 3.8 19 81 0 11.01.2009 10:00 315 7.1 15 89 0
10.01.2009 11:00 180 8.2 21 82 0 11.01.2009 11:00 337.5 6.2 18 62 0
10.01.2009 12:00 180 7.5 19 81 0 11.01.2009 12:00 315 6.2 19 81 0
10.01.2009 13:00 180 8.3 19 81 0 11.01.2009 13:00 292.5 6.2 19 81 0
10.01.2009 14:00 225 9.8 19 81 0 11.01.2009 14:00 315 5.2 18 62 0
10.01.2009 15:00 270 8.8 19 90 0 11.01.2009 15:00 225 4.2 19 81 0
10.01.2009 16:00 292.5 6.7 19 81 0 11.01.2009 16:00 337.5 2.7 20 81 0
10.01.2009 17:00 292.5 6.2 16 89 0 11.01.2009 17:00 292.5 4 21 82 0
10.01.2009 18:00 315 6.1 16 89 0 11.01.2009 18:00 225 3.9 22 74 0
10.01.2009 19:00 315 6.1 15 89 0 11.01.2009 19:00 315 3.1 20 81 0
10.01.2009 20:00 270 3.9 15 89 0 11.01.2009 20:00 315 5.1 16 79 0
10.01.2009 21:00 270 4.2 15 78 0 11.01.2009 21:00 337.5 2.9 15 78 0
10.01.2009 22:00 270 5.2 15 89 0 11.01.2009 22:00 292.5 1.9 16 79 0
10.01.2009 23:00 292.5 5.2 15 89 0 11.01.2009 23:00 270 2.1 14 78 0
12.01.2009 0:00 225 2.1 15 78 0 13.01.2009 0:00 337.5 0.3 15 78 0
12.01.2009 1:00 247.5 4.3 15 78 0 13.01.2009 1:00 225 1.4 15 78 0
12.01.2009 2:00 225 3.2 15 89 0 13.01.2009 2:00 270 1.4 15 89 0
12.01.2009 3:00 337.5 2.1 16 79 0 13.01.2009 3:00 337.5 1 13 88 F
12.01.2009 4:00 315 2.3 16 89 0 13.01.2009 4:00 315 0.8 13 88 F
12.01.2009 5:00 270 1.1 15 78 0 13.01.2009 5:00 180 1.1 12 88 F
12.01.2009 6:00 0 1.3 13 88 0 13.01.2009 6:00 315 1.8 11 87 F
12.01.2009 7:00 315 2 15 89 0 13.01.2009 7:00 337.5 2.3 12 88 0
12.01.2009 8:00 270 4.4 12 88 0 13.01.2009 8:00 225 2.4 11 87 0
12.01.2009 9:00 270 3.5 12 88 0 13.01.2009 9:00 225 3 11 87 0
12.01.2009 10:00 270 7.8 13 88 0 13.01.2009 10:00 225 0.8 14 89 0
12.01.2009 11:00 270 5.8 16 89 0 13.01.2009 11:00 270 2.5 17 61 0
12.01.2009 12:00 270 7.1 19 72 0 13.01.2009 12:00 225 5.1 19 72 0
12.01.2009 13:00 225 7.2 19 81 0 13.01.2009 13:00 225 6.2 20 64 0
12.01.2009 14:00 202.5 7.1 19 72 0 13.01.2009 14:00 225 8.1 20 64 6
12.01.2009 15:00 225 7.2 19 81 0 13.01.2009 15:00 270 8 20 73 6
12.01.2009 16:00 202.5 7.3 20 81 0 13.01.2009 16:00 202.5 4.4 20 64 0
12.01.2009 17:00 225 3.9 18 71 0 13.01.2009 17:00 270 5.4 17 61 0
12.01.2009 18:00 225 3.1 17 90 0 13.01.2009 18:00 202.5 6.2 15 89 0
12.01.2009 19:00 247.5 2.1 16 89 0 13.01.2009 19:00 225 2.8 15 89 0
12.01.2009 20:00 202.5 1.5 15 78 0 13.01.2009 20:00 270 1.2 15 78 0
12.01.2009 21:00 315 2.2 15 89 0 13.01.2009 21:00 202.5 2.6 15 78 0
12.01.2009 22:00 337.5 2.3 15 78 0 13.01.2009 22:00 225 2 13 88 0
12.01.2009 23:00 270 2 15 78 0 13.01.2009 23:00 0 3.1 13 88 0
14.01.2009 0:00 225 3.1 13 88 0 15.01.2009 0:00 247.5 4.2 13 88 0
14.01.2009 1:00 315 4.1 14 89 0 15.01.2009 1:00 270 4.2 13 88 0
14.01.2009 2:00 337.5 3.1 12 88 0 15.01.2009 2:00 202.5 4.1 11 87 0
14.01.2009 3:00 337.5 3.3 11 87 0 15.01.2009 3:00 315 4.2 12 88 0
14.01.2009 4:00 270 2.2 12 88 0 15.01.2009 4:00 292.5 4.2 12 88 0
14.01.2009 5:00 315 4.2 11 87 0 15.01.2009 5:00 225 4.1 11 87 0
14.01.2009 6:00 270 4.2 10 87 0 15.01.2009 6:00 225 5.6 13 88 0
14.01.2009 7:00 315 4.1 9 86 0 15.01.2009 7:00 202.5 4.4 13 88 0
14.01.2009 8:00 315 5.8 11 63 0 15.01.2009 8:00 315 4.2 14 89 0
14.01.2009 9:00 225 5.8 13 55 0 15.01.2009 9:00 315 2 15 78 0
14.01.2009 10:00 225 3.7 16 89 0 15.01.2009 10:00 180 3 16 69 0
14.01.2009 11:00 270 5.8 18 71 0 15.01.2009 11:00 315 7 17 80 0
14.01.2009 12:00 270 7.6 20 64 0 15.01.2009 12:00 315 8.1 20 64 0

Project Title : EIA Study for Development of Industrial Estate of HSIIDC at Sec-37 & Sec-3 Extn, Ph-III, Karnal Project No. : 21-1041/2007-IA.III Contract No. : HSIA: K:2007:1315 dt.09.10.2007 Page 68 of 184
Shriram Institute for Industrial Research: Delhi
14.01.2009 13:00 202.5 7.1 19 72 0 15.01.2009 13:00 337.5 10 21 57 0
14.01.2009 14:00 270 7.1 20 56 0 15.01.2009 14:00 270 6 20 64 0
14.01.2009 15:00 337.5 7.9 21 64 0 15.01.2009 15:00 225 7.5 18 71 0
14.01.2009 16:00 315 5.5 18 71 0 15.01.2009 16:00 337.5 6 16 89 0
14.01.2009 17:00 315 4.6 18 71 0 15.01.2009 17:00 202.5 4.1 15 89 0
14.01.2009 18:00 337.5 4.1 16 89 0 15.01.2009 18:00 337.5 3.1 16 89 0
14.01.2009 19:00 315 3.3 15 89 0 15.01.2009 19:00 315 4.3 15 89 0
14.01.2009 20:00 225 4.1 15 89 0 15.01.2009 20:00 202.5 4.1 15 78 0
14.01.2009 21:00 337.5 3.1 15 78 0 15.01.2009 21:00 225 4.1 15 89 0
14.01.2009 22:00 270 2.3 13 88 0 15.01.2009 22:00 337.5 3.1 14 89 0
14.01.2009 23:00 202.5 4.1 13 88 0 15.01.2009 23:00 225 2.4 13 88 0
16.01.2009 0:00 315 2.5 13 88 0 17.01.2009 0:00 225 7.4 13 88 8
16.01.2009 1:00 225 2.1 12 88 0 17.01.2009 1:00 202.5 6.4 13 88 8
16.01.2009 2:00 202.5 1.2 13 77 0 17.01.2009 2:00 270 9.1 14 89 8
16.01.2009 3:00 337.5 1.1 12 65 0 17.01.2009 3:00 337.5 6.4 12 88 8
16.01.2009 4:00 315 1.1 11 87 0 17.01.2009 4:00 337.5 6.1 13 88 8
16.01.2009 5:00 202.5 2.2 12 88 0 17.01.2009 5:00 270 1.3 15 89 8
16.01.2009 6:00 225 1.3 12 88 0 17.01.2009 6:00 225 5.3 15 89 8
16.01.2009 7:00 270 2.3 11 87 0 17.01.2009 7:00 315 4.7 16 89 8
16.01.2009 8:00 337.5 0.2 13 88 0 17.01.2009 8:00 270 7.5 16 89 8
16.01.2009 9:00 225 0.8 14 89 8 17.01.2009 9:00 315 6 15 89 8-D
16.01.2009 10:00 225 2.3 16 79 8 17.01.2009 10:00 337.5 6.2 16 89 8-D
16.01.2009 11:00 225 2.6 17 90 6 17.01.2009 11:00 202.5 4 15 89 8-D
16.01.2009 12:00 315 5.1 15 78 6 17.01.2009 12:00 225 2.4 14 89 8-D
16.01.2009 13:00 225 2.8 18 80 6 17.01.2009 13:00 90 2 17 90 8
16.01.2009 14:00 337.5 8.1 16 79 6 17.01.2009 14:00 90 3 17 80 8
16.01.2009 15:00 315 8.1 15 78 6 17.01.2009 15:00 270 7 19 90 8
16.01.2009 16:00 225 3.1 17 80 6 17.01.2009 16:00 270 1.9 18 90 8
16.01.2009 17:00 225 3.1 19 81 6 17.01.2009 17:00 180 5.3 18 90 8
16.01.2009 18:00 337.5 0.8 18 80 6 17.01.2009 18:00 180 6 17 90 8
16.01.2009 19:00 315 1.2 17 90 4 17.01.2009 19:00 90 0.7 16 89 8
16.01.2009 20:00 337.5 1.2 16 89 4 17.01.2009 20:00 90 0.7 15 89 8
16.01.2009 21:00 315 4 15 78 4 17.01.2009 21:00 22.5 1.6 16 89 8
16.01.2009 22:00 225 1.3 15 78 4 17.01.2009 22:00 315 2.1 14 89 F
16.01.2009 23:00 315 2 14 78 4 17.01.2009 23:00 315 1.5 13 88 F
18.01.2009 0:00 90 2.1 14 89 F 19.01.2009 0:00 247.5 1.1 14 78 F
18.01.2009 1:00 22.5 3.1 15 89 F 19.01.2009 1:00 270 2.1 13 77 F
18.01.2009 2:00 45 3.2 16 89 F 19.01.2009 2:00 225 3.3 13 88 F
18.01.2009 3:00 90 3.5 13 88 F 19.01.2009 3:00 202.5 3.1 11 87 F
18.01.2009 4:00 315 2.2 14 89 F 19.01.2009 4:00 202.5 3.5 11 75 F
18.01.2009 5:00 337.5 2.2 12 88 F 19.01.2009 5:00 225 2.4 8 86 F
18.01.2009 6:00 315 2.1 13 88 F 19.01.2009 6:00 247.5 3.1 10 87 F
18.01.2009 7:00 337.5 1.1 16 89 8-D 19.01.2009 7:00 315 3.7 9 86 0
18.01.2009 8:00 315 1.2 16 89 8-D` 19.01.2009 8:00 315 3.7 13 88 F
18.01.2009 9:00 337.5 4.7 17 90 8 19.01.2009 9:00 315 8.7 14 89 F
18.01.2009 10:00 67.5 6.1 18 90 8 19.01.2009 10:00 315 10 15 89 F
18.01.2009 11:00 67.5 9.1 19 90 8 19.01.2009 11:00 315 7.6 16 89 2
18.01.2009 12:00 112.5 6.5 18 90 8 19.01.2009 12:00 315 10 17 90 6
18.01.2009 13:00 112.5 4.5 19 81 6 19.01.2009 13:00 315 11.1 17 90 6
18.01.2009 14:00 22.5 6 19 90 2 19.01.2009 14:00 315 6 18 90 6
18.01.2009 15:00 45 7.8 18 90 0 19.01.2009 15:00 292.5 7.1 17 90 6

Project Title : EIA Study for Development of Industrial Estate of HSIIDC at Sec-37 & Sec-3 Extn, Ph-III, Karnal Project No. : 21-1041/2007-IA.III Contract No. : HSIA: K:2007:1315 dt.09.10.2007 Page 69 of 184
Shriram Institute for Industrial Research: Delhi
18.01.2009 16:00 315 8.4 17 90 0 19.01.2009 16:00 270 6.1 19 81 6
18.01.2009 17:00 45 6 19 81 2 19.01.2009 17:00 22.5 6.4 17 90 6
18.01.2009 18:00 45 1.1 18 90 0 19.01.2009 18:00 45 5.2 16 69 6
18.01.2009 19:00 22.5 1.2 15 78 0 19.01.2009 19:00 67.5 6.3 15 89 6
18.01.2009 20:00 315 0.3 15 89 0 19.01.2009 20:00 0 6.4 16 89 4
18.01.2009 21:00 292.5 0.5 15 78 0 19.01.2009 21:00 337.5 6 15 78 4
18.01.2009 22:00 270 1.1 13 88 0 19.01.2009 22:00 315 6.8 14 89 4
18.01.2009 23:00 270 1.4 13 88 F 19.01.2009 23:00 292.5 2.1 14 89 4
20.01.2009 0:00 270 11.1 14 78 F 21.01.2009 0:00 270 10.1 10 74 0
20.01.2009 1:00 90 12.1 14 67 F 21.01.2009 1:00 337.5 5.4 11 63 0
20.01.2009 2:00 67.5 5.1 14 89 F 21.01.2009 2:00 315 3.4 12 54 0
20.01.2009 3:00 45 5.1 13 88 F 21.01.2009 3:00 0 5.1 12 65 0
20.01.2009 4:00 22.5 4.3 12 65 F 21.01.2009 4:00 337.5 5.3 12 76 0
20.01.2009 5:00 90 3.1 11 63 F 21.01.2009 5:00 315 5.3 12 88 0
20.01.2009 6:00 22.5 3.4 10 74 0 21.01.2009 6:00 270 5.3 13 66 0
20.01.2009 7:00 0 9.1 9 86 0 21.01.2009 7:00 247.5 6.2 14 57 0
20.01.2009 8:00 45 8.9 10 74 0 21.01.2009 8:00 247.5 5.6 13 88 0
20.01.2009 9:00 45 7.4 12 88 0 21.01.2009 9:00 315 8.4 11 87 0
20.01.2009 10:00 315 5.6 14 89 0 21.01.2009 10:00 315 7.2 13 88 0
20.01.2009 11:00 315 9.2 16 79 0 21.01.2009 11:00 315 8.5 16 79 0
20.01.2009 12:00 315 7.6 18 71 0 21.01.2009 12:00 315 13 17 70 0
20.01.2009 13:00 337.5 13 18 80 0 21.01.2009 13:00 337.5 13.2 19 63 0
20.01.2009 14:00 0 13.7 20 64 0 21.01.2009 14:00 315 12.3 20 64 0
20.01.2009 15:00 315 13.9 19 54 0 21.01.2009 15:00 337.5 7.4 20 56 0
20.01.2009 16:00 337.5 7.2 18 80 0 21.01.2009 16:00 315 10.1 19 63 0
20.01.2009 17:00 315 9.1 17 90 0 21.01.2009 17:00 270 10.4 17 70 0
20.01.2009 18:00 270 6.3 10 74 0 21.01.2009 18:00 225 9.2 18 71 0
20.01.2009 19:00 270 6.1 11 63 0 21.01.2009 19:00 247.5 7.6 17 70 0
20.01.2009 20:00 315 5.1 12 88 0 21.01.2009 20:00 315 5.3 16 79 0
20.01.2009 21:00 337.5 4.4 10 74 0 21.01.2009 21:00 270 10.2 15 78 0
20.01.2009 22:00 315 5.6 9 86 0 21.01.2009 22:00 225 7.3 14 78 0
20.01.2009 23:00 315 3.3 10 74 0 21.01.2009 23:00 270 8.4 14 67 0
22.01.2009 0:00 315 5.1 13 88 0 23.01.2009 0:00 337.5 4.3 14 67 6
22.01.2009 1:00 337.5 1.4 14 78 0 23.01.2009 1:00 315 6.1 14 57 6
22.01.2009 2:00 270 2.4 13 88 0 23.01.2009 2:00 0 6.5 13 66 6
22.01.2009 3:00 225 2.3 13 88 0 23.01.2009 3:00 337.5 7.1 13 77 4
22.01.2009 4:00 270 5.8 12 88 0 23.01.2009 4:00 292.5 5.3 14 67 4
22.01.2009 5:00 225 0.7 12 88 0 23.01.2009 5:00 270 7.3 12 88 4
22.01.2009 6:00 247.5 2 12 76 0 23.01.2009 6:00 247.5 7.2 11 87 4
22.01.2009 7:00 270 1.4 12 65 0 23.01.2009 7:00 225 8.2 11 63 2
22.01.2009 8:00 315 1 11 63 0 23.01.2009 8:00 202.5 6.1 11 87 0
22.01.2009 9:00 225 5.3 14 67 0 23.01.2009 9:00 315 8.1 15 78 0
22.01.2009 10:00 270 6.7 17 61 0 23.01.2009 10:00 315 10.3 17 70 0
22.01.2009 11:00 225 3.5 18 71 0 23.01.2009 11:00 337.5 10.2 19 72 0
22.01.2009 12:00 315 6.2 19 72 0 23.01.2009 12:00 315 12.9 21 57 0
22.01.2009 13:00 315 6.3 21 65 0 23.01.2009 13:00 315 12 20 64 0
22.01.2009 14:00 337.5 10.4 20 64 2 23.01.2009 14:00 292.5 11 24 53 0
22.01.2009 15:00 315 7.2 19 63 2 23.01.2009 15:00 225 11.9 23 59 0
22.01.2009 16:00 270 7.5 18 71 2 23.01.2009 16:00 225 9.2 22 58 0
22.01.2009 17:00 270 5.2 19 72 2 23.01.2009 17:00 202.5 8.6 20 73 0
22.01.2009 18:00 315 6 17 80 2 23.01.2009 18:00 270 1.5 19 72 4

Project Title : EIA Study for Development of Industrial Estate of HSIIDC at Sec-37 & Sec-3 Extn, Ph-III, Karnal Project No. : 21-1041/2007-IA.III Contract No. : HSIA: K:2007:1315 dt.09.10.2007 Page 70 of 184
Shriram Institute for Industrial Research: Delhi
22.01.2009 19:00 270 5.2 16 79 4 23.01.2009 19:00 225 4.1 20 64 4
22.01.2009 20:00 225 5.3 15 78 4 23.01.2009 20:00 270 4.2 18 71 4
22.01.2009 21:00 247.5 4.3 16 79 4 23.01.2009 21:00 270 4.3 19 63 4
22.01.2009 22:00 225 3.4 15 78 6 23.01.2009 22:00 315 6.5 17 61 4
22.01.2009 23:00 247.5 5.5 14 78 6 23.01.2009 23:00 270 20.1 16 79 4
24.01.2009 0:00 270 20 15 78 4 25.01.2009 0:00 315 5.1 16 `89 6
24.01.2009 1:00 315 20 14 78 4 25.01.2009 1:00 90 4.7 15 68 6
24.01.2009 2:00 270 6.8 14 67 4 25.01.2009 2:00 315 3.6 14 67 4
24.01.2009 3:00 315 17.1 13 88 4 25.01.2009 3:00 270 6.5 14 57 4
24.01.2009 4:00 270 7 13 66 6 25.01.2009 4:00 225 4.6 13 66 4
24.01.2009 5:00 225 10.3 12 76 4 25.01.2009 5:00 270 5.1 13 55 4
24.01.2009 6:00 225 11.2 12 88 2 25.01.2009 6:00 202.5 3.3 12 76 4
24.01.2009 7:00 270 7.1 12 65 6 25.01.2009 7:00 225 1.4 13 66 F
24.01.2009 8:00 225 8.5 12 76 6 25.01.2009 8:00 90 3.7 14 57 F
24.01.2009 9:00 270 8.2 13 88 6 25.01.2009 9:00 90 6.2 15 78 F
24.01.2009 10:00 270 9.2 18 71 6 25.01.2009 10:00 135 8.1 16 89 F
24.01.2009 11:00 225 5.6 19 72 6 25.01.2009 11:00 90 7.2 17 70 F
24.01.2009 12:00 225 12 22 58 8 25.01.2009 12:00 90 7.7 17 70 F
24.01.2009 13:00 225 10.5 21 65 8 25.01.2009 13:00 225 7.9 18 71 8
24.01.2009 14:00 202.5 12.4 22 58 8 25.01.2009 14:00 90 9.6 19 72 6
24.01.2009 15:00 225 15.3 21 65 8 25.01.2009 15:00 135 3.8 19 81 6
24.01.2009 16:00 270 7.7 20 64 8 25.01.2009 16:00 112.5 12.8 20 73 6
24.01.2009 17:00 270 6 20 64 6 25.01.2009 17:00 135 9 20 81 6
24.01.2009 18:00 225 1.1 19 63 6 25.01.2009 18:00 90 3.2 17 70 6
24.01.2009 19:00 112.5 4.2 18 80 6 25.01.2009 19:00 135 2.1 16 89 4
24.01.2009 20:00 135 6.3 17 70 6 25.01.2009 20:00 157.5 3.8 17 70 4
24.01.2009 21:00 90 3.2 16 89 6 25.01.2009 21:00 90 2.1 15 78 4
24.01.2009 22:00 90 3.2 18 71 6 25.01.2009 22:00 180 1.3 16 89 4
24.01.2009 23:00 112.5 3.1 15 78 6 25.01.2009 23:00 157.5 2.1 15 78 4
26.01.2009 0:00 180 1 16 89 4 27.01.2009 0:00 0 1.1 16 89 0
26.01.2009 1:00 180 0.3 15 68 F 27.01.2009 1:00 337.5 0.6 15 89 0
26.01.2009 2:00 180 4 14 89 F 27.01.2009 2:00 315 0.8 15 89 0
26.01.2009 3:00 135 2.1 15 89 F 27.01.2009 3:00 292.5 1.3 13 88 0
26.01.2009 4:00 180 2.5 16 89 F 27.01.2009 4:00 270 0.8 13 88 0
26.01.2009 5:00 180 4.9 16 89 F 27.01.2009 5:00 0 1.3 12 88 0
26.01.2009 6:00 180 1.7 16 89 F 27.01.2009 6:00 337.5 1.4 12 88 0
26.01.2009 7:00 180 2.2 16 89 F 27.01.2009 7:00 315 0.3 11 87 0
26.01.2009 8:00 135 1.2 17 70 F 27.01.2009 8:00 315 2.2 13 66 0
26.01.2009 9:00 157.5 2.1 18 71 F 27.01.2009 9:00 270 0.1 15 89 0
26.01.2009 10:00 135 0.6 19 72 0 27.01.2009 10:00 270 0.1 17 90 0
26.01.2009 11:00 157.5 0.9 19 81 0 27.01.2009 11:00 270 4.2 20 73 0
26.01.2009 12:00 90 1.2 20 64 0 27.01.2009 12:00 270 4.2 21 65 0
26.01.2009 13:00 45 2.2 20 64 0 27.01.2009 13:00 315 7.4 20 64 0
26.01.2009 14:00 22.5 2.1 21 65 0 27.01.2009 14:00 337.5 10.4 22 58 0
26.01.2009 15:00 45 2 20 81 0 27.01.2009 15:00 225 14.2 22 58 0
26.01.2009 16:00 67.5 3 19 81 0 27.01.2009 16:00 225 7 21 65 0
26.01.2009 17:00 45 4 20 81 0 27.01.2009 17:00 270 8.8 20 63 0
26.01.2009 18:00 22.5 3.1 21 65 0 27.01.2009 18:00 315 4.2 19 63 0
26.01.2009 19:00 45 3.3 19 72 0 27.01.2009 19:00 337.5 6.3 18 71 0
26.01.2009 20:00 0 3.1 18 71 0 27.01.2009 20:00 315 4.2 15 78 0
26.01.2009 21:00 45 0.9 17 70 0 27.01.2009 21:00 270 2.4 15 78 0

Project Title : EIA Study for Development of Industrial Estate of HSIIDC at Sec-37 & Sec-3 Extn, Ph-III, Karnal Project No. : 21-1041/2007-IA.III Contract No. : HSIA: K:2007:1315 dt.09.10.2007 Page 71 of 184
Shriram Institute for Industrial Research: Delhi
26.01.2009 22:00 0 3.2 16 89 0 27.01.2009 22:00 67.5 1.7 14 67 0
26.01.2009 23:00 67.5 2.1 16 89 0 27.01.2009 23:00 90 3.1 13 66 0
28.01.2009 0:00 90 2 13 66 0 29.01.2009 0:00 315 8 12 76 0
28.01.2009 1:00 45 9.1 13 77 0 29.01.2009 1:00 337.5 4.2 12 65 0
28.01.2009 2:00 67.5 8.4 12 88 0 29.01.2009 2:00 315 2.3 11 87 0
28.01.2009 3:00 90 8.1 13 88 0 29.01.2009 3:00 292.5 3.6 12 65 F
28.01.2009 4:00 45 7.3 12 88 F 29.01.2009 4:00 270 2.4 11 75 F
28.01.2009 5:00 112.5 9.1 12 76 F 29.01.2009 5:00 247.5 3.9 10 87 F
28.01.2009 6:00 90 5.4 12 65 F 29.01.2009 6:00 292.5 2.3 9 86 F
28.01.2009 7:00 157.5 8.7 11 87 F 29.01.2009 7:00 270 1.4 11 75 F
28.01.2009 8:00 135 5.7 13 55 0 29.01.2009 8:00 315 4.2 12 76 0
28.01.2009 9:00 135 7.3 14 78 0 29.01.2009 9:00 315 4.5 13 55 0
28.01.2009 10:00 135 8.4 15 89 0 29.01.2009 10:00 337.5 3.8 14 78 0
28.01.2009 11:00 90 9.5 17 80 0 29.01.2009 11:00 315 5.3 15 89 0
28.01.2009 12:00 270 8.8 20 64 0 29.01.2009 12:00 270 2.1 17 70 0
28.01.2009 13:00 225 11.4 21 65 0 29.01.2009 13:00 315 2.4 16 89 0
28.01.2009 14:00 315 8.3 22 58 0 29.01.2009 14:00 337.5 6.1 18 71 0
28.01.2009 15:00 315 11.1 21 65 0 29.01.2009 15:00 315 3.4 19 72 0
28.01.2009 16:00 270 8.5 20 64 0 29.01.2009 16:00 270 3.3 20 64 0
28.01.2009 17:00 315 7.5 19 72 0 29.01.2009 17:00 270 1.9 20 64 0
28.01.2009 18:00 315 6.1 17 70 0 29.01.2009 18:00 225 1.2 19 63 0
28.01.2009 19:00 67.5 4.3 15 89 0 29.01.2009 19:00 180 1.5 19 63 0
28.01.2009 20:00 45 2.4 14 78 0 29.01.2009 20:00 135 2.7 19 54 0
28.01.2009 21:00 0 2.8 12 88 0 29.01.2009 21:00 135 1.8 18 53 0
28.01.2009 22:00 270 3.6 13 88 0 29.01.2009 22:00 90 1.7 18 75 F
28.01.2009 23:00 225 3.2 12 76 0 29.01.2009 23:00 225 0.8 17 70 F
30.01.2009 0:00 157.5 0.7 15 78 F 31.01.2009 0:00 225 8.1 14 78 0
30.01.2009 1:00 67.5 2.1 15 68 F 31.01.2009 1:00 202.5 5.3 13 88 0
30.01.2009 2:00 315 1.8 15 68 F 31.01.2009 2:00 225 6.2 12 88 0
30.01.2009 3:00 337.5 2.1 15 68 F 31.01.2009 3:00 247.5 6.1 11 87 0
30.01.2009 4:00 225 0.8 14 67 F 31.01.2009 4:00 270 5.1 12 65 0
30.01.2009 5:00 180 1.3 14 67 F 31.01.2009 5:00 270 8.2 11 75 0
30.01.2009 6:00 180 1.2 14 67 F 31.01.2009 6:00 315 4.2 12 76 0
30.01.2009 7:00 225 0.5 13 88 F 31.01.2009 7:00 292.5 5.1 12 65 0
30.01.2009 8:00 225 1.6 13 88 F 31.01.2009 8:00 270 4.1 13 66 0
30.01.2009 9:00 180 0.3 13 88 F 31.01.2009 9:00 270 3.4 15 68 0
30.01.2009 10:00 180 1.6 15 78 F 31.01.2009 10:00 270 10.9 17 70 0
30.01.2009 11:00 315 3.5 17 80 0 31.01.2009 11:00 315 8.7 17 80 0
30.01.2009 12:00 292.5 5.2 20 73 0 31.01.2009 12:00 337.5 17.1 19 72 0
30.01.2009 13:00 315 8.9 21 65 0 31.01.2009 13:00 315 16.1 19 72 0
30.01.2009 14:00 315 8.7 21 65 0 31.01.2009 14:00 270 7 20 64 0
30.01.2009 15:00 337.5 6.8 20 73 0 31.01.2009 15:00 315 10.2 19 72 0
30.01.2009 16:00 270 12.2 19 63 0 31.01.2009 16:00 337.5 7.1 17 80 2
30.01.2009 17:00 315 9.5 19 63 0 31.01.2009 17:00 270 8.2 17 70 2
30.01.2009 18:00 315 3.5 19 54 0 31.01.2009 18:00 315 5.1 16 79 2
30.01.2009 19:00 337.5 3.2 20 64 0 31.01.2009 19:00 270 1.3 15 65 2
30.01.2009 20:00 315 3.2 20 64 0 31.01.2009 20:00 225 5.3 14 78 2
30.01.2009 21:00 270 4.3 17 80 0 31.01.2009 21:00 270 7 13 88 2
30.01.2009 22:00 270 4.2 16 89 0 31.01.2009 22:00 315 10.1 12 88 2
30.01.2009 23:00 225 7.3 15 89 0 31.01.2009 23:00 337.5 3.1 11 87 2

Project Title : EIA Study for Development of Industrial Estate of HSIIDC at Sec-37 & Sec-3 Extn, Ph-III, Karnal Project No. : 21-1041/2007-IA.III Contract No. : HSIA: K:2007:1315 dt.09.10.2007 Page 72 of 184
Shriram Institute for Industrial Research: Delhi
01.02.2009 0:00 315 5.1 12 88 2 02.02.2009 0:00 315 2.1 14 78 2
01.02.2009 1:00 270 5.2 12 88 2 02.02.2009 1:00 337.5 2 14 78 2
01.02.2009 2:00 225 5.2 13 88 2 02.02.2009 2:00 315 2.2 13 88 2
01.02.2009 3:00 270 7.1 12 76 2 02.02.2009 3:00 270 2.2 12 88 2
01.02.2009 4:00 292.5 6.3 12 65 2 02.02.2009 4:00 225 0.3 11 87 2
01.02.2009 5:00 270 7.5 11 87 2 02.02.2009 5:00 202.5 2.2 12 65 2
01.02.2009 6:00 315 8.2 12 88 4 02.02.2009 6:00 247.5 0.9 12 76 2
01.02.2009 7:00 337.5 4.3 12 76 4 02.02.2009 7:00 270 0.7 13 66 2
01.02.2009 8:00 270 4.2 12 65 4 02.02.2009 8:00 270 0.5 15 68 0
01.02.2009 9:00 315 4.3 13 88 4 02.02.2009 9:00 225 5.9 15 68 0
01.02.2009 10:00 337.5 3.1 14 78 4 02.02.2009 10:00 225 4.4 16 69 0
01.02.2009 11:00 292.5 2.3 15 68 4 02.02.2009 11:00 270 3.8 17 70 0
01.02.2009 12:00 270 2.8 17 80 4 02.02.2009 12:00 270 4.1 19 54 0
01.02.2009 13:00 270 7.2 18 71 2 02.02.2009 13:00 315 6.2 19 72 0
01.02.2009 14:00 315 8 18 80 0 02.02.2009 14:00 337.5 8.3 19 72 0
01.02.2009 15:00 292.5 9 19 72 0 02.02.2009 15:00 225 6.2 18 80 0
01.02.2009 16:00 270 10.7 19 72 0 02.02.2009 16:00 202.5 6.1 18 71 0
01.02.2009 17:00 270 8.6 20 64 2 02.02.2009 17:00 225 3.4 16 69 0
01.02.2009 18:00 315 5.5 19 72 2 02.02.2009 18:00 270 3.2 15 68 0
01.02.2009 19:00 337.5 5.2 19 72 2 02.02.2009 19:00 315 0.2 16 69 0
01.02.2009 20:00 315 5.2 17 80 2 02.02.2009 20:00 270 0.5 15 68 0
01.02.2009 21:00 270 4.3 17 80 2 02.02.2009 21:00 225 0.4 14 78 0
01.02.2009 22:00 225 4.1 16 79 2 02.02.2009 22:00 202.5 0.5 14 78 0
01.02.2009 23:00 270 8.1 17 70 2 02.02.2009 23:00 270 0.4 13 88 0
03.02.2009 0:00 315 1.2 13 88 F 04.02.2009 0:00 270 0.2 13 88 F
03.02.2009 1:00 337.5 0.4 12 88 F 04.02.2009 1:00 270 0.4 13 88 F
03.02.2009 2:00 270 0.3 12 88 F 04.02.2009 2:00 225 0.4 12 88 F
03.02.2009 3:00 315 0.3 12 76 F 04.02.2009 3:00 225 0.3 12 76 F
03.02.2009 4:00 0 0.4 12 65 F 04.02.2009 4:00 180 0.2 12 88 F
03.02.2009 5:00 315 0.5 12 76 F 04.02.2009 5:00 180 0.3 12 88 F
03.02.2009 6:00 270 0.8 11 87 F 04.02.2009 6:00 0 0.4 12 88 F
03.02.2009 7:00 337.5 1.1 11 87 F 04.02.2009 7:00 135 0.8 13 88 F
03.02.2009 8:00 180 1.4 13 88 0 04.02.2009 8:00 135 0.2 13 88 F
03.02.2009 9:00 135 0.4 14 89 0 04.02.2009 9:00 180 0.5 13 88 F
03.02.2009 10:00 135 0.4 14 89 0 04.02.2009 10:00 225 0.5 14 89 0
03.02.2009 11:00 225 0.3 21 65 0 04.02.2009 11:00 202.5 1.4 16 89 0
03.02.2009 12:00 225 3.4 20 64 0 04.02.2009 12:00 225 1.5 17 80 0
03.02.2009 13:00 202.5 3.6 21 65 0 04.02.2009 13:00 202.5 2.6 18 71 0
03.02.2009 14:00 225 3.5 20 64 0 04.02.2009 14:00 270 3.3 19 72 0
03.02.2009 15:00 225 2.7 21 65 0 04.02.2009 15:00 225 2.3 20 64 0
03.02.2009 16:00 225 5.5 21 65 0 04.02.2009 16:00 225 3.3 21 65 0
03.02.2009 17:00 225 6.8 21 65 0 04.02.2009 17:00 225 3.2 22 66 0
03.02.2009 18:00 0 1.3 20 73 0 04.02.2009 18:00 135 0.2 20 64 2
03.02.2009 19:00 315 0.2 20 64 0 04.02.2009 19:00 90 0.1 19 72 4
03.02.2009 20:00 337.5 0.4 19 72 0 04.02.2009 20:00 45 0.1 18 71 4
03.02.2009 21:00 315 0.3 18 71 0 04.02.2009 21:00 22.5 0.3 17 80 4
03.02.2009 22:00 270 0.1 17 80 0 04.02.2009 22:00 90 0.8 16 89 4
03.02.2009 23:00 225 0.4 16 89 0 04.02.2009 23:00 90 0.5 14 89 4
05.02.2009 0:00 90 0.2 14 89 4 06.02.2009 0:00 315 2.9 14 89 0
05.02.2009 1:00 135 3.1 13 88 4 06.02.2009 1:00 337.5 4.1 13 88 0
05.02.2009 2:00 157.5 2.6 13 77 0 06.02.2009 2:00 270 3.3 12 88 0

Project Title : EIA Study for Development of Industrial Estate of HSIIDC at Sec-37 & Sec-3 Extn, Ph-III, Karnal Project No. : 21-1041/2007-IA.III Contract No. : HSIA: K:2007:1315 dt.09.10.2007 Page 73 of 184
Shriram Institute for Industrial Research: Delhi
05.02.2009 3:00 90 4.3 12 76 0 06.02.2009 3:00 180 3.3 12 76 0
05.02.2009 4:00 45 2.1 12 65 0 06.02.2009 4:00 180 3.3 11 87 0
05.02.2009 5:00 90 6.6 11 87 0 06.02.2009 5:00 225 3.1 12 76 0
05.02.2009 6:00 22.5 6.1 10 74 0 06.02.2009 6:00 202.5 2.9 12 65 0
05.02.2009 7:00 90 5.5 9 86 0 06.02.2009 7:00 225 2.3 13 88 0
05.02.2009 8:00 90 2.2 15 78 0 06.02.2009 8:00 90 4.1 14 89 0
05.02.2009 9:00 90 4.9 15 78 0 06.02.2009 9:00 157.5 3.6 16 89 0
05.02.2009 10:00 135 6.1 18 90 0 06.02.2009 10:00 135 3.2 17 80 0
05.02.2009 11:00 180 7.7 21 73 0 06.02.2009 11:00 135 3.2 18 90 0
05.02.2009 12:00 180 3.3 23 59 0 06.02.2009 12:00 45 3.3 20 73 0
05.02.2009 13:00 180 9.7 24 60 0 06.02.2009 13:00 22.5 3.3 21 73 0
05.02.2009 14:00 180 8.9 25 54 0 06.02.2009 14:00 45 2.2 24 60 0
05.02.2009 15:00 225 4.1 24 60 0 06.02.2009 15:00 0 4 25 84 0
05.02.2009 16:00 315 3 23 59 0 06.02.2009 16:00 45 4.4 20 73 0
05.02.2009 17:00 270 6.3 24 68 0 06.02.2009 17:00 22.5 2.4 18 90 0
05.02.2009 18:00 315 3 22 74 0 06.02.2009 18:00 135 2.1 17 80 0
05.02.2009 19:00 270 3.1 20 73 0 06.02.2009 19:00 157.5 4.4 16 89 0
05.02.2009 20:00 315 3.1 18 90 0 06.02.2009 20:00 45 8.2 15 78 0
05.02.2009 21:00 315 6.3 17 80 0 06.02.2009 21:00 0 7.4 14 89 0
05.02.2009 22:00 337.5 6.2 16 89 0 06.02.2009 22:00 22.5 8 13 88 0
05.02.2009 23:00 225 4 14 89 0 06.02.2009 23:00 135 3.5 14 89 0
07.02.2009 0:00 0 4.1 14 89 0 08.02.2009 0:00 180 3.1 14 89 0
07.02.2009 1:00 45 2.4 14 78 0 08.02.2009 1:00 225 7.2 13 88 0
07.02.2009 2:00 22.5 8.5 14 67 0 08.02.2009 2:00 202.5 7.1 12 88 0
07.02.2009 3:00 45 6.4 13 77 0 08.02.2009 3:00 247.5 7.5 11 87 0
07.02.2009 4:00 337.5 6.4 13 88 0 08.02.2009 4:00 270 6.1 12 88 0
07.02.2009 5:00 315 5.5 12 88 0 08.02.2009 5:00 225 4.6 11 87 0
07.02.2009 6:00 67.5 8.8 11 87 0 08.02.2009 6:00 270 4.9 10 74 0
07.02.2009 7:00 45 10.1 10 74 0 08.02.2009 7:00 315 2.8 9 86 0
07.02.2009 8:00 270 7.1 14 78 0 08.02.2009 8:00 337.5 6.7 12 88 0
07.02.2009 9:00 270 3.6 15 78 0 08.02.2009 9:00 225 7.9 14 89 0
07.02.2009 10:00 247.5 4.9 16 89 0 08.02.2009 10:00 202.5 2.3 15 78 0
07.02.2009 11:00 270 5.6 17 80 0 08.02.2009 11:00 225 10.1 16 89 0
07.02.2009 12:00 225 9 18 90 0 08.02.2009 12:00 202.5 9.2 15 78 0
07.02.2009 13:00 270 5.5 19 72 0 08.02.2009 13:00 247.5 6.4 17 80 0
07.02.2009 14:00 225 9.2 20 91 0 08.02.2009 14:00 270 5.1 21 91 0
07.02.2009 15:00 202.5 9.2 21 91 0 08.02.2009 15:00 225 3.5 23 83 0
07.02.2009 16:00 270 6.3 23 83 0 08.02.2009 16:00 202.5 3.2 18 90 0
07.02.2009 17:00 315 5.2 17 80 0 08.02.2009 17:00 270 2.4 15 78 0
07.02.2009 18:00 337.5 5.3 16 79 0 08.02.2009 18:00 315 2.4 13 88 0
07.02.2009 19:00 315 5.2 15 78 0 08.02.2009 19:00 337.5 3.6 14 89 0
07.02.2009 20:00 270 6.1 13 88 0 08.02.2009 20:00 315 1.8 14 89 0
07.02.2009 21:00 337.5 4.2 14 89 0 08.02.2009 21:00 270 3.1 13 88 0
07.02.2009 22:00 270 4.3 13 85 0 08.02.2009 22:00 225 2 13 88 0
07.02.2009 23:00 315 4.4 12 85 0 08.02.2009 23:00 270 2.2 12 88 0
09.02.2009 0:00 315 0.9 14 89 0 10.02.2009 0:00 67.5 1 16 79 0
09.02.2009 1:00 337.5 2.1 13 88 0 10.02.2009 1:00 67.5 2.1 16 69 0
09.02.2009 2:00 292.5 0.8 12 88 0 10.02.2009 2:00 45 1.6 15 78 0
09.02.2009 3:00 270 1.1 11 88 0 10.02.2009 3:00 45 1.8 15 68 0
09.02.2009 4:00 315 2.9 12 88 0 10.02.2009 4:00 0 3.5 15 68 0
09.02.2009 5:00 337.5 4.4 12 88 0 10.02.2009 5:00 0 1 15 68 0

Project Title : EIA Study for Development of Industrial Estate of HSIIDC at Sec-37 & Sec-3 Extn, Ph-III, Karnal Project No. : 21-1041/2007-IA.III Contract No. : HSIA: K:2007:1315 dt.09.10.2007 Page 74 of 184
Shriram Institute for Industrial Research: Delhi
09.02.2009 6:00 315 1.5 12 74 0 10.02.2009 6:00 90 2.5 14 78 0
09.02.2009 7:00 270 1.1 12 74 0 10.02.2009 7:00 90 1.2 14 89 0
09.02.2009 8:00 315 1.4 13 88 0 10.02.2009 8:00 45 1.8 15 78 0
09.02.2009 9:00 315 1 15 78 0 10.02.2009 9:00 45 1.9 15 78 0
09.02.2009 10:00 180 1.6 16 89 0 10.02.2009 10:00 225 17.3 18 71 0
09.02.2009 11:00 225 3.8 19 90 0 10.02.2009 11:00 337.5 6.4 19 72 0
09.02.2009 12:00 315 3.4 21 91 0 10.02.2009 12:00 225 2.1 21 65 0
09.02.2009 13:00 315 4.8 21 91 0 10.02.2009 13:00 90 5.9 21 82 0
09.02.2009 14:00 180 6.2 22 91 0 10.02.2009 14:00 112.5 10.1 23 75 0
09.02.2009 15:00 180 1.1 22 91 0 10.02.2009 15:00 180 5.1 23 59 0
09.02.2009 16:00 270 6.2 22 91 0 10.02.2009 16:00 225 15.2 21 65 0
09.02.2009 17:00 270 2.9 21 82 0 10.02.2009 17:00 180 5.1 20 64 0
09.02.2009 18:00 315 7 20 81 0 10.02.2009 18:00 225 6.1 19 63 8
09.02.2009 19:00 315 0.9 18 80 0 10.02.2009 19:00 180 3.6 18 62 8
09.02.2009 20:00 270 3.4 18 71 0 10.02.2009 20:00 225 2.5 17 61 8
09.02.2009 21:00 315 1.7 17 80 0 10.02.2009 21:00 247.5 8 16 89 8
09.02.2009 22:00 270 2.1 16 79 0 10.02.2009 22:00 270 11.7 15 89 8
09.02.2009 23:00 270 1.8 16 79 0 10.02.2009 23:00 292.5 8.5 14 89 8
11.02.2009 0:00 270 9.1 14 89 8-D 12.02.2009 0:00 270 9.1 14 89 8-D
11.02.2009 1:00 225 10.1 13 88 8-D 12.02.2009 1:00 225 10.1 13 88 8-D
11.02.2009 2:00 337.5 11.3 13 88 8-D 12.02.2009 2:00 337.5 11.3 13 88 8-D
11.02.2009 3:00 315 5.4 13 88 8 12.02.2009 3:00 315 5.4 13 88 8
11.02.2009 4:00 247.5 14.5 13 88 8 12.02.2009 4:00 247.5 14.5 13 88 8
11.02.2009 5:00 247.5 4.5 13 88 8 12.02.2009 5:00 247.5 4.5 13 88 8
11.02.2009 6:00 270 8 13 88 8 12.02.2009 6:00 270 8 13 88 8
11.02.2009 7:00 315 2.3 13 88 8 12.02.2009 7:00 315 2.3 13 88 8
11.02.2009 8:00 292.5 4.4 13 88 8 12.02.2009 8:00 292.5 4.4 13 88 8
11.02.2009 9:00 0 3.1 14 89 6 12.02.2009 9:00 0 3.1 14 89 6
11.02.2009 10:00 315 3.6 15 89 4 12.02.2009 10:00 315 3.6 15 89 4
11.02.2009 11:00 225 11.4 16 79 0 12.02.2009 11:00 225 11.4 16 79 0
11.02.2009 12:00 270 9.5 17 70 0 12.02.2009 12:00 270 9.5 17 70 0
11.02.2009 13:00 180 7.5 20 64 0 12.02.2009 13:00 180 7.5 20 64 0
11.02.2009 14:00 180 3.5 21 65 0 12.02.2009 14:00 180 3.5 21 65 0
11.02.2009 15:00 270 4.9 19 72 0 12.02.2009 15:00 270 4.9 19 72 0
11.02.2009 16:00 225 3.1 19 72 0 12.02.2009 16:00 225 3.1 19 72 0
11.02.2009 17:00 270 3.9 19 72 0 12.02.2009 17:00 270 3.9 19 72 0
11.02.2009 18:00 315 5.4 17 80 8 12.02.2009 18:00 315 5.4 17 80 8
11.02.2009 19:00 337.5 4.9 16 79 8 12.02.2009 19:00 337.5 4.9 16 79 8
11.02.2009 20:00 315 3.5 15 89 8 12.02.2009 20:00 315 3.5 15 89 8
11.02.2009 21:00 292.5 4.9 15 78 8 12.02.2009 21:00 292.5 4.9 15 78 8
11.02.2009 22:00 270 3.2 14 78 8 12.02.2009 22:00 270 3.2 14 78 8
11.02.2009 23:00 337.5 2.1 13 88 8 12.02.2009 23:00 337.5 2.1 13 88 8
13.02.2009 0:00 315 5.1 14 89 0 14.02.2009 0:00 112.5 4.1 18 71 8
13.02.2009 1:00 337.5 5.3 14 89 0 14.02.2009 1:00 90 4.4 18 71 8
13.02.2009 2:00 292.5 4 14 89 0 14.02.2009 2:00 67.5 6.5 17 90 8
13.02.2009 3:00 225 6.1 13 88 F 14.02.2009 3:00 90 3.3 17 90 8
13.02.2009 4:00 247.5 2.8 13 88 F 14.02.2009 4:00 22.5 4.5 17 90 8
13.02.2009 5:00 270 3.2 13 88 F 14.02.2009 5:00 45 3.2 16 89 8
13.02.2009 6:00 225 6 12 88 F 14.02.2009 6:00 67.5 7 16 89 8

Project Title : EIA Study for Development of Industrial Estate of HSIIDC at Sec-37 & Sec-3 Extn, Ph-III, Karnal Project No. : 21-1041/2007-IA.III Contract No. : HSIA: K:2007:1315 dt.09.10.2007 Page 75 of 184
Shriram Institute for Industrial Research: Delhi
13.02.2009 7:00 225 2.1 11 87 F 14.02.2009 7:00 90 8.1 15 89 8
13.02.2009 8:00 247.5 3.5 13 88 0 14.02.2009 8:00 90 1.5 17 90 8
13.02.2009 9:00 292.5 3.7 15 89 0 14.02.2009 9:00 135 1.5 17 90 4
13.02.2009 10:00 315 4.5 17 90 0 14.02.2009 10:00 135 3.2 18 80 2
13.02.2009 11:00 270 4.2 18 80 0 14.02.2009 11:00 157.5 4.3 19 81 2
13.02.2009 12:00 270 3.2 19 81 0 14.02.2009 12:00 202.5 5.4 20 73 0
13.02.2009 13:00 247.5 3.4 22 66 0 14.02.2009 13:00 225 2.1 20 73 0
13.02.2009 14:00 225 3.3 23 67 0 14.02.2009 14:00 225 3.3 21 73 0
13.02.2009 15:00 180 4.1 25 61 0 14.02.2009 15:00 247.5 7.2 22 66 0
13.02.2009 16:00 225 0.7 23 67 0 14.02.2009 16:00 292.5 6.2 23 67 0
13.02.2009 17:00 247.5 1.1 22 66 0 14.02.2009 17:00 270 5.1 22 66 0
13.02.2009 18:00 202.5 1.2 21 65 0 14.02.2009 18:00 225 5.1 20 73 0
13.02.2009 19:00 180 1.5 20 73 0 14.02.2009 19:00 247.5 4.4 19 72 0
13.02.2009 20:00 157.5 1.8 19 72 0 14.02.2009 20:00 202.5 6.1 18 80 0
13.02.2009 21:00 135 4.1 18 71 0 14.02.2009 21:00 270 6.2 17 90 0
13.02.2009 22:00 112.5 4.5 18 71 0 14.02.2009 22:00 247.5 3.1 16 89 0
13.02.2009 23:00 135 4.1 18 71 0 14.02.2009 23:00 202.5 3.4 16 89 0
15.02.2009 0:00 90 2.9 16 89 F 16.02.2009 0:00 202.5 5 14 89 0
15.02.2009 1:00 225 3.1 16 89 F 16.02.2009 1:00 247.5 2.3 14 89 0
15.02.2009 2:00 247.5 2.9 15 89 F 16.02.2009 2:00 292.5 2.2 14 89 0
15.02.2009 3:00 225 1.9 15 89 F 16.02.2009 3:00 315 3 14 89 0
15.02.2009 4:00 315 3.1 14 89 F 16.02.2009 4:00 292.5 5.5 14 89 0
15.02.2009 5:00 292.5 2.1 14 89 F 16.02.2009 5:00 337.5 5.9 14 89 0
15.02.2009 6:00 270 8 13 88 F 16.02.2009 6:00 225 3.6 14 89 0
15.02.2009 7:00 225 8.1 13 88 F 16.02.2009 7:00 247.5 4.6 14 89 0
15.02.2009 8:00 247.5 9.9 13 88 F 16.02.2009 8:00 270 6.6 15 89 0
15.02.2009 9:00 270 10.1 15 89 F 16.02.2009 9:00 270 5.2 15 89 0
15.02.2009 10:00 202.5 9.3 17 90 0 16.02.2009 10:00 270 5.1 15 89 0
15.02.2009 11:00 247.5 6.3 18 71 0 16.02.2009 11:00 225 6.7 17 80 0
15.02.2009 12:00 202.5 7 19 81 0 16.02.2009 12:00 225 10.7 19 63 0
15.02.2009 13:00 247.5 15.1 20 81 0 16.02.2009 13:00 202.5 4.9 19 63 0
15.02.2009 14:00 270 15.9 22 66 0 16.02.2009 14:00 247.5 9.5 20 64 0
15.02.2009 15:00 315 5.1 20 81 0 16.02.2009 15:00 247.5 8.7 20 64 0
15.02.2009 16:00 292.5 8.2 18 71 0 16.02.2009 16:00 225 8.2 21 65 0
15.02.2009 17:00 247.5 5.3 18 71 0 16.02.2009 17:00 225 11.3 22 66 0
15.02.2009 18:00 225 9.3 17 90 0 16.02.2009 18:00 202.5 1.7 21 65 0
15.02.2009 19:00 247.5 5.3 16 89 0 16.02.2009 19:00 247.5 4 18 80 0
15.02.2009 20:00 270 9.1 15 89 0 16.02.2009 20:00 315 2.3 16 89 0
15.02.2009 21:00 225 7.3 15 78 0 16.02.2009 21:00 247.5 2.7 15 78 0
15.02.2009 22:00 292.5 5.1 14 89 0 16.02.2009 22:00 270 2.4 15 78 0
15.02.2009 23:00 315 3.6 14 89 0 16.02.2009 23:00 202.5 4.5 14 89 0
17.02.2009 0:00 292.5 3 14 89 2 18.02.2009 0:00 292.5 3 15 89 0
17.02.2009 1:00 247.5 1.6 14 89 2 18.02.2009 1:00 315 5.1 15 89 2
17.02.2009 2:00 202.5 3.2 14 89 2 18.02.2009 2:00 337.5 5.3 15 89 2
17.02.2009 3:00 225 3.1 14 89 4 18.02.2009 3:00 225 4.1 15 89 6
17.02.2009 4:00 247.5 3.2 14 89 4 18.02.2009 4:00 202.5 3.2 14 89 6
17.02.2009 5:00 270 1.3 13 88 4 18.02.2009 5:00 247.5 3.3 14 89 6
17.02.2009 6:00 247.5 2.5 13 88 4 18.02.2009 6:00 270 4.4 14 89 6
17.02.2009 7:00 202.5 4.2 12 88 4 18.02.2009 7:00 292.5 4.3 13 88 4
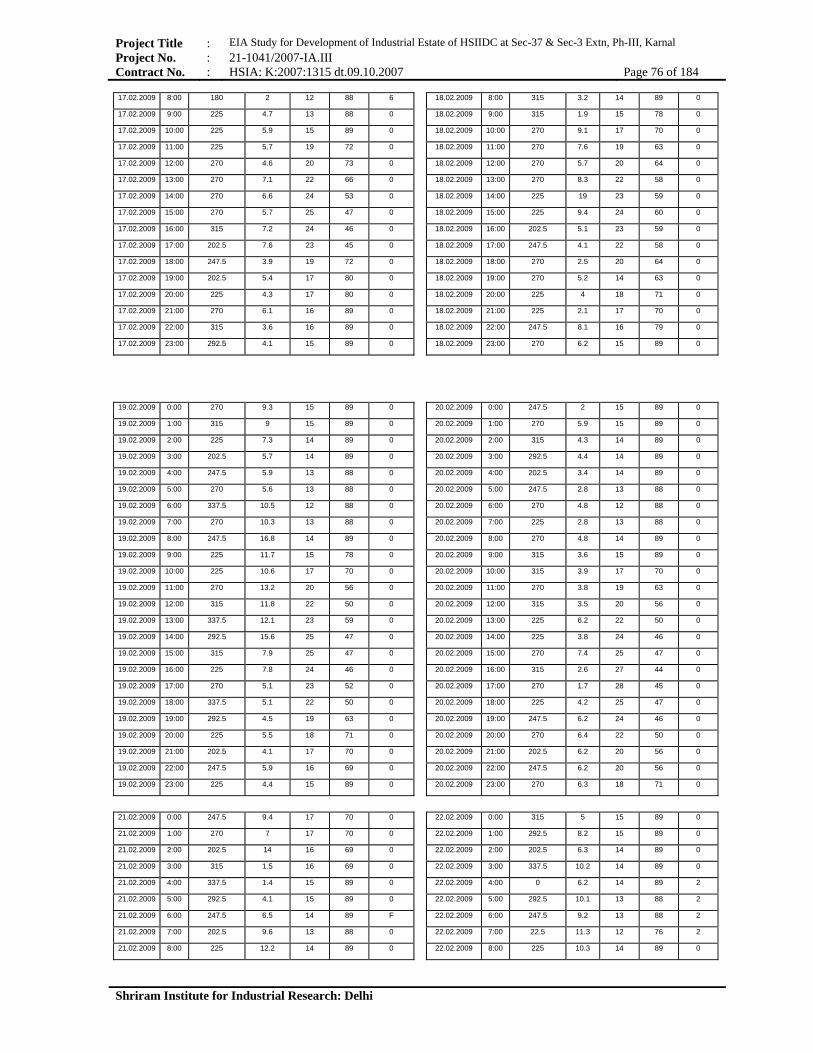
Project Title : EIA Study for Development of Industrial Estate of HSIIDC at Sec-37 & Sec-3 Extn, Ph-III, Karnal Project No. : 21-1041/2007-IA.III Contract No. : HSIA: K:2007:1315 dt.09.10.2007 Page 76 of 184
Shriram Institute for Industrial Research: Delhi
17.02.2009 8:00 180 2 12 88 6 18.02.2009 8:00 315 3.2 14 89 0
17.02.2009 9:00 225 4.7 13 88 0 18.02.2009 9:00 315 1.9 15 78 0
17.02.2009 10:00 225 5.9 15 89 0 18.02.2009 10:00 270 9.1 17 70 0
17.02.2009 11:00 225 5.7 19 72 0 18.02.2009 11:00 270 7.6 19 63 0
17.02.2009 12:00 270 4.6 20 73 0 18.02.2009 12:00 270 5.7 20 64 0
17.02.2009 13:00 270 7.1 22 66 0 18.02.2009 13:00 270 8.3 22 58 0
17.02.2009 14:00 270 6.6 24 53 0 18.02.2009 14:00 225 19 23 59 0
17.02.2009 15:00 270 5.7 25 47 0 18.02.2009 15:00 225 9.4 24 60 0
17.02.2009 16:00 315 7.2 24 46 0 18.02.2009 16:00 202.5 5.1 23 59 0
17.02.2009 17:00 202.5 7.6 23 45 0 18.02.2009 17:00 247.5 4.1 22 58 0
17.02.2009 18:00 247.5 3.9 19 72 0 18.02.2009 18:00 270 2.5 20 64 0
17.02.2009 19:00 202.5 5.4 17 80 0 18.02.2009 19:00 270 5.2 14 63 0
17.02.2009 20:00 225 4.3 17 80 0 18.02.2009 20:00 225 4 18 71 0
17.02.2009 21:00 270 6.1 16 89 0 18.02.2009 21:00 225 2.1 17 70 0
17.02.2009 22:00 315 3.6 16 89 0 18.02.2009 22:00 247.5 8.1 16 79 0
17.02.2009 23:00 292.5 4.1 15 89 0 18.02.2009 23:00 270 6.2 15 89 0
19.02.2009 0:00 270 9.3 15 89 0 20.02.2009 0:00 247.5 2 15 89 0
19.02.2009 1:00 315 9 15 89 0 20.02.2009 1:00 270 5.9 15 89 0
19.02.2009 2:00 225 7.3 14 89 0 20.02.2009 2:00 315 4.3 14 89 0
19.02.2009 3:00 202.5 5.7 14 89 0 20.02.2009 3:00 292.5 4.4 14 89 0
19.02.2009 4:00 247.5 5.9 13 88 0 20.02.2009 4:00 202.5 3.4 14 89 0
19.02.2009 5:00 270 5.6 13 88 0 20.02.2009 5:00 247.5 2.8 13 88 0
19.02.2009 6:00 337.5 10.5 12 88 0 20.02.2009 6:00 270 4.8 12 88 0
19.02.2009 7:00 270 10.3 13 88 0 20.02.2009 7:00 225 2.8 13 88 0
19.02.2009 8:00 247.5 16.8 14 89 0 20.02.2009 8:00 270 4.8 14 89 0
19.02.2009 9:00 225 11.7 15 78 0 20.02.2009 9:00 315 3.6 15 89 0
19.02.2009 10:00 225 10.6 17 70 0 20.02.2009 10:00 315 3.9 17 70 0
19.02.2009 11:00 270 13.2 20 56 0 20.02.2009 11:00 270 3.8 19 63 0
19.02.2009 12:00 315 11.8 22 50 0 20.02.2009 12:00 315 3.5 20 56 0
19.02.2009 13:00 337.5 12.1 23 59 0 20.02.2009 13:00 225 6.2 22 50 0
19.02.2009 14:00 292.5 15.6 25 47 0 20.02.2009 14:00 225 3.8 24 46 0
19.02.2009 15:00 315 7.9 25 47 0 20.02.2009 15:00 270 7.4 25 47 0
19.02.2009 16:00 225 7.8 24 46 0 20.02.2009 16:00 315 2.6 27 44 0
19.02.2009 17:00 270 5.1 23 52 0 20.02.2009 17:00 270 1.7 28 45 0
19.02.2009 18:00 337.5 5.1 22 50 0 20.02.2009 18:00 225 4.2 25 47 0
19.02.2009 19:00 292.5 4.5 19 63 0 20.02.2009 19:00 247.5 6.2 24 46 0
19.02.2009 20:00 225 5.5 18 71 0 20.02.2009 20:00 270 6.4 22 50 0
19.02.2009 21:00 202.5 4.1 17 70 0 20.02.2009 21:00 202.5 6.2 20 56 0
19.02.2009 22:00 247.5 5.9 16 69 0 20.02.2009 22:00 247.5 6.2 20 56 0
19.02.2009 23:00 225 4.4 15 89 0 20.02.2009 23:00 270 6.3 18 71 0
21.02.2009 0:00 247.5 9.4 17 70 0 22.02.2009 0:00 315 5 15 89 0
21.02.2009 1:00 270 7 17 70 0 22.02.2009 1:00 292.5 8.2 15 89 0
21.02.2009 2:00 202.5 14 16 69 0 22.02.2009 2:00 202.5 6.3 14 89 0
21.02.2009 3:00 315 1.5 16 69 0 22.02.2009 3:00 337.5 10.2 14 89 0
21.02.2009 4:00 337.5 1.4 15 89 0 22.02.2009 4:00 0 6.2 14 89 2
21.02.2009 5:00 292.5 4.1 15 89 0 22.02.2009 5:00 292.5 10.1 13 88 2
21.02.2009 6:00 247.5 6.5 14 89 F 22.02.2009 6:00 247.5 9.2 13 88 2
21.02.2009 7:00 202.5 9.6 13 88 0 22.02.2009 7:00 22.5 11.3 12 76 2
21.02.2009 8:00 225 12.2 14 89 0 22.02.2009 8:00 225 10.3 14 89 0

Project Title : EIA Study for Development of Industrial Estate of HSIIDC at Sec-37 & Sec-3 Extn, Ph-III, Karnal Project No. : 21-1041/2007-IA.III Contract No. : HSIA: K:2007:1315 dt.09.10.2007 Page 77 of 184
Shriram Institute for Industrial Research: Delhi
21.02.2009 9:00 270 9.8 15 89 0 22.02.2009 9:00 337.5 15.9 15 78 0
21.02.2009 10:00 315 11 15 89 0 22.02.2009 10:00 315 10.1 16 69 0
21.02.2009 11:00 315 11.8 17 70 0 22.02.2009 11:00 337.5 12.2 18 62 0
21.02.2009 12:00 292.5 11.4 18 71 0 22.02.2009 12:00 315 9.2 21 57 0
21.02.2009 13:00 270 6.4 19 63 0 22.02.2009 13:00 337.5 7.1 23 45 0
21.02.2009 14:00 247.5 19.3 20 73 0 22.02.2009 14:00 337.5 3.7 25 41 0
21.02.2009 15:00 225 7.6 21 73 0 22.02.2009 15:00 292.5 7.2 23 45 0
21.02.2009 16:00 202.5 11.2 24 60 0 22.02.2009 16:00 315 5.2 21 57 0
21.02.2009 17:00 225 7.7 25 54 0 22.02.2009 17:00 337.5 5.8 21 57 0
21.02.2009 18:00 247.5 8.8 24 60 0 22.02.2009 18:00 247.5 8.4 20 56 0
21.02.2009 19:00 292.5 11.1 22 50 0 22.02.2009 19:00 225 12.1 18 62 0
21.02.2009 20:00 315 4.2 20 56 0 22.02.2009 20:00 202.5 6.9 18 62 0
21.02.2009 21:00 270 5.4 18 71 0 22.02.2009 21:00 225 4.4 17 70 0
21.02.2009 22:00 337.5 5.1 17 80 0 22.02.2009 22:00 225 8.2 17 70 0
21.02.2009 23:00 270 5.2 16 89 0 22.02.2009 23:00 225 5.9 16 79 0
23.02.2009 0:00 247.5 1.2 16 79 0 24.02.2009 0:00 202.5 0.5 16 79 8
23.02.2009 1:00 225 3.7 16 79 0 24.02.2009 1:00 247.5 1.2 16 79 8
23.02.2009 2:00 202.5 2.3 16 79 0 24.02.2009 2:00 180 2.1 15 89 8
23.02.2009 3:00 292.5 1.3 15 89 0 24.02.2009 3:00 225 2.1 15 89 8
23.02.2009 4:00 270 2.1 15 89 0 24.02.2009 4:00 270 2.3 14 89 8
23.02.2009 5:00 247.5 1.3 14 89 0 24.02.2009 5:00 247.5 1.6 14 83 8
23.02.2009 6:00 225 2.3 13 88 0 24.02.2009 6:00 315 1.6 13 88 8
23.02.2009 7:00 202.5 2.4 12 88 0 24.02.2009 7:00 337.5 2.9 12 88 8
23.02.2009 8:00 225 1.2 14 89 0 24.02.2009 8:00 315 1.1 13 88 4
23.02.2009 9:00 225 1.3 16 89 0 24.02.2009 9:00 270 1.7 15 89 0
23.02.2009 10:00 180 1.8 18 90 0 24.02.2009 10:00 270 1.3 17 80 0
23.02.2009 11:00 180 1 21 82 0 24.02.2009 11:00 315 4.7 19 81 0
23.02.2009 12:00 180 1.3 23 75 0 24.02.2009 12:00 315 5.7 21 73 0
23.02.2009 13:00 180 2.4 25 61 0 24.02.2009 13:00 337.5 3.8 22 66 0
23.02.2009 14:00 225 6.4 27 56 0 24.02.2009 14:00 292.5 5.2 23 67 0
23.02.2009 15:00 225 4 28 51 0 24.02.2009 15:00 247.5 5.2 24 68 0
23.02.2009 16:00 180 6.5 29 52 0 24.02.2009 16:00 202.5 4.1 23 67 0
23.02.2009 17:00 225 2.9 27 56 0 24.02.2009 17:00 225 3.4 22 66 0
23.02.2009 18:00 202.5 1.1 25 61 0 24.02.2009 18:00 202.5 3.4 21 73 0
23.02.2009 19:00 247.5 0.2 23 75 0 24.02.2009 19:00 180 6.1 21 27 0
23.02.2009 20:00 270 0.9 21 82 0 24.02.2009 20:00 225 7.3 20 81 0
23.02.2009 21:00 315 0.8 18 90 8 24.02.2009 21:00 315 7.2 19 81 0
23.02.2009 22:00 292.5 0.7 16 79 8 24.02.2009 22:00 292.5 3.6 18 90 0
23.02.2009 23:00 337.5 1.2 16 79 8 24.02.2009 23:00 202.5 3.6 17 90 0
25.02.2009 0:00 270 4.1 16 89 0 26.02.2009 0:00 292.5 10 19 63 0
25.02.2009 1:00 202.5 2.6 16 89 0 26.02.2009 1:00 315 7.3 19 63 0
25.02.2009 2:00 315 5.1 15 89 0 26.02.2009 2:00 337.5 6.3 18 71 0
25.02.2009 3:00 292.5 5.4 15 89 0 26.02.2009 3:00 225 8.2 18 71 0
25.02.2009 4:00 202.5 2.5 15 89 0 26.02.2009 4:00 202.5 5.7 18 71 0
25.02.2009 5:00 247.5 7.3 14 89 0 26.02.2009 5:00 247.5 4.8 17 70 0
25.02.2009 6:00 292.5 5.3 14 89 0 26.02.2009 6:00 270 4.3 17 70 0
25.02.2009 7:00 270 2.7 14 89 0 26.02.2009 7:00 225 8.2 17 70 0
25.02.2009 8:00 225 8.3 15 89 0 26.02.2009 8:00 202.5 8.9 17 61 0
25.02.2009 9:00 202.5 6.1 16 89 0 26.02.2009 9:00 315 5.7 18 62 0
25.02.2009 10:00 247.5 12.3 17 80 0 26.02.2009 10:00 270 8.8 19 63 0
25.02.2009 11:00 337.5 8.2 19 72 0 26.02.2009 11:00 315 11.6 20 56 0

Project Title : EIA Study for Development of Industrial Estate of HSIIDC at Sec-37 & Sec-3 Extn, Ph-III, Karnal Project No. : 21-1041/2007-IA.III Contract No. : HSIA: K:2007:1315 dt.09.10.2007 Page 78 of 184
Shriram Institute for Industrial Research: Delhi
25.02.2009 12:00 225 10.4 22 58 0 26.02.2009 12:00 315 7.6 22 50 0
25.02.2009 13:00 202.5 5.1 24 53 0 26.02.2009 13:00 315 13.3 24 46 0
25.02.2009 14:00 247.5 6.4 25 61 0 26.02.2009 14:00 270 10.3 25 47 0
25.02.2009 15:00 270 8.5 27 50 0 26.02.2009 15:00 270 8.8 26 36 0
25.02.2009 16:00 225 14.1 26 49 0 26.02.2009 16:00 225 11.2 25 41 0
25.02.2009 17:00 225 12.7 25 54 0 26.02.2009 17:00 225 8.9 25 41 0
25.02.2009 18:00 247.5 7.5 24 53 0 26.02.2009 18:00 202.5 3.2 23 45 0
25.02.2009 19:00 202.5 7.2 22 58 0 26.02.2009 19:00 225 5.9 21 49 0
25.02.2009 20:00 225 6.3 22 58 0 26.02.2009 20:00 270 4.8 19 63 0
25.02.2009 21:00 270 7.2 21 57 0 26.02.2009 21:00 270 7.3 18 62 0
25.02.2009 22:00 202.5 7 20 56 0 26.02.2009 22:00 225 5.7 17 70 0
25.02.2009 23:00 180 6 19 63 0 26.02.2009 23:00 202.5 6.2 16 79 0
27.02.2009 0:00 202.5 10 16 79 0 28.02.2009 0:00 247.5 7 16 79 0
27.02.2009 1:00 247.5 9.1 16 79 0 28.02.2009 1:00 202.5 6.9 16 79 0
27.02.2009 2:00 225 7.8 16 79 0 28.02.2009 2:00 337.5 6.4 16 79 0
27.02.2009 3:00 292.5 5.1 16 79 0 28.02.2009 3:00 315 5.6 16 79 0
27.02.2009 4:00 202.5 4.5 15 89 0 28.02.2009 4:00 292.5 5 17 70 0
27.02.2009 5:00 337.5 4.4 15 89 0 28.02.2009 5:00 270 8.4 17 70 0
27.02.2009 6:00 292.5 6.6 15 89 0 28.02.2009 6:00 202.5 8.1 17 70 0
27.02.2009 7:00 270 3.8 14 89 0 28.02.2009 7:00 247.5 8.1 18 62 0
27.02.2009 8:00 202.5 9.4 16 89 0 28.02.2009 8:00 315 11 18 71 0
27.02.2009 9:00 247.5 9.1 18 71 0 28.02.2009 9:00 270 10.4 19 63 0
27.02.2009 10:00 315 14.4 20 56 0 28.02.2009 10:00 315 9.6 20 56 0
27.02.2009 11:00 247.5 8.9 21 57 0 28.02.2009 11:00 315 15 21 57 0
27.02.2009 12:00 225 11.2 22 50 0 28.02.2009 12:00 315 15.8 22 50 0
27.02.2009 13:00 270 11.2 23 52 0 28.02.2009 13:00 315 14.3 23 45 0
27.02.2009 14:00 202.5 14.2 24 46 0 28.02.2009 14:00 202.5 12.2 24 46 0
27.02.2009 15:00 270 13.4 25 47 0 28.02.2009 15:00 247.5 12.1 24 46 0
27.02.2009 16:00 315 9.1 26 42 0 28.02.2009 16:00 202.5 15.6 25 47 0
27.02.2009 17:00 270 15 25 47 0 28.02.2009 17:00 225 15.9 24 46 0
27.02.2009 18:00 202.5 14.1 24 46 0 28.02.2009 18:00 202.5 18.2 23 52 0
27.02.2009 19:00 247.5 4.2 22 50 0 28.02.2009 19:00 247.5 5.2 21 57 0
27.02.2009 20:00 270 6.3 20 56 0 28.02.2009 20:00 180 7.2 19 63 0
27.02.2009 21:00 315 7.4 18 71 0 28.02.2009 21:00 270 4.5 18 71 0
27.02.2009 22:00 292.5 6.4 16 79 0 28.02.2009 22:00 225 4.1 17 70 0
27.02.2009 23:00 337.5 4.1 16 79 0 28.02.2009 23:00 247.5 3.9 16 79 0
01.03.2009 0:00 247.5 7 15 89 0 02.03.2009 0:00 225 4.1 16 79 0
01.03.2009 1:00 202.5 6.9 15 89 0 02.03.2009 1:00 292.5 6.6 16 79 0
01.03.2009 2:00 270 5 14 89 0 02.03.2009 2:00 315 6.6 16 79 0
01.03.2009 3:00 315 5.1 14 89 0 02.03.2009 3:00 270 7.8 16 79 0
01.03.2009 4:00 337.5 5.8 14 89 0 02.03.2009 4:00 202.5 7.7 15 78 0
01.03.2009 5:00 292.5 9.1 14 89 0 02.03.2009 5:00 247.5 3.6 15 78 0
01.03.2009 6:00 225 10.4 14 78 0 02.03.2009 6:00 225 2.6 14 78 0
01.03.2009 7:00 292.5 13.7 14 78 0 02.03.2009 7:00 270 4.2 14 78 0
01.03.2009 8:00 225 14.1 15 89 0 02.03.2009 8:00 270 4.9 16 69 0
01.03.2009 9:00 247.5 14.9 17 70 0 02.03.2009 9:00 225 5.5 18 62 0
01.03.2009 10:00 337.5 10.1 19 63 0 02.03.2009 10:00 270 4.6 20 56 0
01.03.2009 11:00 202.5 10.2 21 57 0 02.03.2009 11:00 270 6.9 22 50 0
01.03.2009 12:00 225 7.8 23 45 0 02.03.2009 12:00 315 7.5 24 46 0
01.03.2009 13:00 202.5 9.2 24 46 0 02.03.2009 13:00 315 9.4 26 42 0
01.03.2009 14:00 247.5 9.7 25 47 0 02.03.2009 14:00 315 10.3 26 49 0

Project Title : EIA Study for Development of Industrial Estate of HSIIDC at Sec-37 & Sec-3 Extn, Ph-III, Karnal Project No. : 21-1041/2007-IA.III Contract No. : HSIA: K:2007:1315 dt.09.10.2007 Page 79 of 184
Shriram Institute for Industrial Research: Delhi
01.03.2009 15:00 270 8.5 24 46 0 02.03.2009 15:00 270 10 26 49 0
01.03.2009 16:00 315 10.9 23 45 0 02.03.2009 16:00 337.5 9.5 25 61 0
01.03.2009 17:00 337.5 10.1 22 50 0 02.03.2009 17:00 225 6.3 25 61 0
01.03.2009 18:00 292.5 13.4 21 57 0 02.03.2009 18:00 225 6.6 25 61 0
01.03.2009 19:00 225 12.3 20 64 0 02.03.2009 19:00 202.5 3.5 24 60 0
01.03.2009 20:00 247.5 5.2 19 63 0 02.03.2009 20:00 247.5 3.2 23 59 0
01.03.2009 21:00 202.5 6.4 18 71 0 02.03.2009 21:00 337.5 3.8 22 58 0
01.03.2009 22:00 225 6.3 17 70 0 02.03.2009 22:00 292.5 3.4 21 65 0
01.03.2009 23:00 202.5 4.3 16 79 0 02.03.2009 23:00 270 4.5 20 73 0
03.03.2009 0:00 270 3.8 20 73 0 04.03.2009 0:00 135 4.2 24 53 8
03.03.2009 1:00 247.5 1.5 20 73 0 04.03.2009 1:00 135 3.6 24 53 8
03.03.2009 2:00 202.5 1.3 18 90 0 04.03.2009 2:00 90 3.6 24 53 8
03.03.2009 3:00 225 1.2 18 90 0 04.03.2009 3:00 67.5 3.6 25 47 8
03.03.2009 4:00 247.5 1.4 17 90 0 04.03.2009 4:00 90 4.4 25 54 8
03.03.2009 5:00 270 1.3 17 90 0 04.03.2009 5:00 112.5 8.4 25 54 8
03.03.2009 6:00 315 1.3 17 90 0 04.03.2009 6:00 112.5 6.6 25 54 0
03.03.2009 7:00 225 0.5 16 89 0 04.03.2009 7:00 135 7.8 26 55 0
03.03.2009 8:00 135 1.7 17 80 0 04.03.2009 8:00 135 7.2 26 55 0
03.03.2009 9:00 90 2.2 18 80 0 04.03.2009 9:00 180 10.8 26 55 0
03.03.2009 10:00 90 3.8 20 73 0 04.03.2009 10:00 180 7.9 26 62 0
03.03.2009 11:00 135 8.8 22 66 0 04.03.2009 11:00 202.5 4.4 26 62 0
03.03.2009 12:00 135 5.9 24 60 0 04.03.2009 12:00 247.5 3.2 27 63 0
03.03.2009 13:00 90 4.8 26 49 2 04.03.2009 13:00 90 3.2 28 64 0
03.03.2009 14:00 90 2.1 28 45 2 04.03.2009 14:00 135 4.4 28 64 0
03.03.2009 15:00 90 4.3 29 46 4 04.03.2009 15:00 135 1.2 29 64 0
03.03.2009 16:00 135 4.5 28 51 4 04.03.2009 16:00 90 4.9 30 65 0
03.03.2009 17:00 135 2.1 28 51 4 04.03.2009 17:00 112.5 7.1 30 65 0
03.03.2009 18:00 90 2.4 27 50 6 04.03.2009 18:00 270 2.3 29 64 0
03.03.2009 19:00 112.5 2.8 27 50 6 04.03.2009 19:00 135 1.9 28 64 0
03.03.2009 20:00 112.5 1.4 26 55 6 04.03.2009 20:00 270 1.6 26 76 0
03.03.2009 21:00 90 2 25 54 6 04.03.2009 21:00 202.5 5.5 26 69 0
03.03.2009 22:00 90 2.8 25 54 8 04.03.2009 22:00 247.5 5.7 26 69 0
03.03.2009 23:00 135 2.8 24 53 8 04.03.2009 23:00 270 2.2 25 68 0
05.03.2009 0:00 292.5 4.1 25 68 0 06.03.2009 0:00 270 1.9 20 73 0
05.03.2009 1:00 337.5 2.9 25 68 0 06.03.2009 1:00 202.5 4.3 20 73 0
05.03.2009 2:00 315 3.5 25 61 0 06.03.2009 2:00 292.5 3.2 20 73 0
05.03.2009 3:00 0 5.2 24 68 0 06.03.2009 3:00 337.5 4.4 19 72 0
05.03.2009 4:00 270 3.4 23 67 0 06.03.2009 4:00 315 6.4 19 72 0
05.03.2009 5:00 180 4.5 23 67 0 06.03.2009 5:00 202.5 10.2 19 72 0
05.03.2009 6:00 157.5 2.3 22 82 0 06.03.2009 6:00 270 4.8 18 80 0
05.03.2009 7:00 180 5.8 22 82 0 06.03.2009 7:00 225 7.1 19 81 0
05.03.2009 8:00 225 5.4 22 82 0 06.03.2009 8:00 270 6.7 20 81 0
05.03.2009 9:00 270 7.4 22 82 0 06.03.2009 9:00 202.5 9.5 20 81 0
05.03.2009 10:00 225 6.6 24 75 0 06.03.2009 10:00 247.5 6.8 22 82 0
05.03.2009 11:00 225 9.4 25 76 0 06.03.2009 11:00 315 5.1 23 67 0
05.03.2009 12:00 225 7.1 26 76 0 06.03.2009 12:00 337.5 3.6 24 60 0
05.03.2009 13:00 202.5 6.2 27 70 0 06.03.2009 13:00 0 5.9 26 49 0
05.03.2009 14:00 247.5 7.5 28 64 0 06.03.2009 14:00 337.5 8.3 27 50 0
05.03.2009 15:00 270 8.5 29 64 0 06.03.2009 15:00 292.5 2.2 28 51 0
05.03.2009 16:00 202.5 9.2 26 76 2 06.03.2009 16:00 270 3.3 29 52 0
05.03.2009 17:00 292.5 10.6 25 76 2 06.03.2009 17:00 247.5 6.4 27 50 0

Project Title : EIA Study for Development of Industrial Estate of HSIIDC at Sec-37 & Sec-3 Extn, Ph-III, Karnal Project No. : 21-1041/2007-IA.III Contract No. : HSIA: K:2007:1315 dt.09.10.2007 Page 80 of 184
Shriram Institute for Industrial Research: Delhi
05.03.2009 18:00 270 11.9 23 75 2 06.03.2009 18:00 225 5.9 26 49 0
05.03.2009 19:00 202.5 9.7 22 74 6 06.03.2009 19:00 247.5 7.3 25 61 0
05.03.2009 20:00 247.5 8.2 21 73 6 06.03.2009 20:00 292.5 6.4 24 68 0
05.03.2009 21:00 270 7.6 20 73 6 06.03.2009 21:00 270 5.6 24 68 0
05.03.2009 22:00 202.5 8.6 20 73 0 06.03.2009 22:00 292.5 5.1 23 67 0
05.03.2009 23:00 247.5 9.7 20 73 0 06.03.2009 23:00 225 3.7 23 67 0
07.03.2009 0:00 337.5 4.3 23 67 0 08.03.2009 0:00 202.5 5.2 23 67 0
07.03.2009 1:00 292.5 1.3 23 67 0 08.03.2009 1:00 247.5 6.2 22 74 0
07.03.2009 2:00 270 3.5 23 67 0 08.03.2009 2:00 270 4.5 22 66 0
07.03.2009 3:00 202.5 3.2 23 67 0 08.03.2009 3:00 337.5 6.4 21 73 0
07.03.2009 4:00 225 3.4 22 66 0 08.03.2009 4:00 315 4.9 21 65 0
07.03.2009 5:00 180 2.4 22 66 0 08.03.2009 5:00 292.5 6.7 21 65 0
07.03.2009 6:00 270 2.2 20 81 0 08.03.2009 6:00 270 9.5 20 64 0
07.03.2009 7:00 337.5 2.9 20 81 0 08.03.2009 7:00 225 4.1 20 64 0
07.03.2009 8:00 202.5 2.3 21 73 0 08.03.2009 8:00 225 6.8 20 64 0
07.03.2009 9:00 225 4.9 23 67 0 08.03.2009 9:00 270 8.7 20 64 0
07.03.2009 10:00 180 2.2 24 60 0 08.03.2009 10:00 202.5 7.2 21 73 0
07.03.2009 11:00 202.5 3.8 25 54 0 08.03.2009 11:00 270 4.7 23 67 0
07.03.2009 12:00 247.5 5.4 26 49 0 08.03.2009 12:00 180 4.3 24 60 0
07.03.2009 13:00 270 4.1 27 50 0 08.03.2009 13:00 225 6.3 25 61 0
07.03.2009 14:00 292.5 5.4 28 51 0 08.03.2009 14:00 247.5 6.4 25 61 0
07.03.2009 15:00 337.5 4.5 27 50 0 08.03.2009 15:00 202.5 8.5 27 50 0
07.03.2009 16:00 315 8.6 26 49 0 08.03.2009 16:00 225 5.3 26 49 0
07.03.2009 17:00 337.5 1.4 26 49 0 08.03.2009 17:00 180 5.1 24 60 0
07.03.2009 18:00 270 7.2 24 60 0 08.03.2009 18:00 247.5 4.4 23 67 0
07.03.2009 19:00 202.5 6.9 23 67 0 08.03.2009 19:00 270 8.4 23 67 0
07.03.2009 20:00 225 7.5 22 66 0 08.03.2009 20:00 180 0.6 21 73 0
07.03.2009 21:00 202.5 6.2 22 66 0 08.03.2009 21:00 202.5 2.3 20 81 0
07.03.2009 22:00 270 2.8 22 66 0 08.03.2009 22:00 247.5 1.1 20 81 0
07.03.2009 23:00 202.5 4.1 22 66 0 08.03.2009 23:00 270 2.3 19 81 0
09.03.2009 0:00 202.5 0.6 19 81 0 10.03.2009 0:00 202.5 6.1 19 63 0
09.03.2009 1:00 247.5 0.7 19 81 0 10.03.2009 1:00 247.5 2.6 19 63 0
09.03.2009 2:00 270 0.7 18 80 0 10.03.2009 2:00 225 3.2 19 63 0
09.03.2009 3:00 202.5 0.6 18 80 0 10.03.2009 3:00 270 4.2 18 71 0
09.03.2009 4:00 225 0.5 17 80 0 10.03.2009 4:00 225 2.4 18 71 0
09.03.2009 5:00 270 0.4 17 80 0 10.03.2009 5:00 270 4.2 17 80 0
09.03.2009 6:00 270 0.5 17 80 0 10.03.2009 6:00 315 3.5 17 80 0
09.03.2009 7:00 202.5 1.5 16 79 0 10.03.2009 7:00 292.5 3.2 18 71 0
09.03.2009 8:00 247.5 0.5 17 80 0 10.03.2009 8:00 270 2.3 18 71 0
09.03.2009 9:00 270 0.7 18 80 0 10.03.2009 9:00 225 3.2 19 63 0
09.03.2009 10:00 225 1.9 20 73 0 10.03.2009 10:00 202.5 2.8 20 64 0
09.03.2009 11:00 180 3.6 22 66 0 10.03.2009 11:00 225 3.5 22 58 0
09.03.2009 12:00 180 3.8 24 60 0 10.03.2009 12:00 225 4.5 24 53 0
09.03.2009 13:00 225 3.4 25 61 0 10.03.2009 13:00 270 9.9 26 49 0
09.03.2009 14:00 225 6.1 26 62 0 10.03.2009 14:00 270 6.5 28 39 0
09.03.2009 15:00 180 8.6 27 63 0 10.03.2009 15:00 225 8.7 30 36 0
09.03.2009 16:00 202.5 3.8 26 62 0 10.03.2009 16:00 225 11.9 30 36 0
09.03.2009 17:00 270 6.6 24 68 0 10.03.2009 17:00 270 3.4 29 35 0
09.03.2009 18:00 202.5 5.2 23 67 0 10.03.2009 18:00 270 3.8 28 39 0
09.03.2009 19:00 202.5 5.6 22 66 0 10.03.2009 19:00 270 3.1 27 38 0
09.03.2009 20:00 247.5 5.8 21 65 0 10.03.2009 20:00 225 3.3 26 36 0

Project Title : EIA Study for Development of Industrial Estate of HSIIDC at Sec-37 & Sec-3 Extn, Ph-III, Karnal Project No. : 21-1041/2007-IA.III Contract No. : HSIA: K:2007:1315 dt.09.10.2007 Page 81 of 184
Shriram Institute for Industrial Research: Delhi
09.03.2009 21:00 270 3.3 20 64 0 10.03.2009 21:00 225 4.4 25 35 0
09.03.2009 22:00 270 2.9 20 64 0 10.03.2009 22:00 202.5 5.1 24 39 0
09.03.2009 23:00 270 2.3 19 63 0 10.03.2009 23:00 247.5 6.5 23 45 0
11.03.2009 0:00 202.5 9 23 45 0 12.03.2009 0:00 225 5 20 56 0
11.03.2009 1:00 247.5 14.1 23 45 0 12.03.2009 1:00 225 7.7 20 48 0
11.03.2009 2:00 180 8.4 22 43 0 12.03.2009 2:00 202.5 5.6 20 40 0
11.03.2009 3:00 225 7.9 21 42 0 12.03.2009 3:00 202.5 7.5 20 48 0
11.03.2009 4:00 247.5 7.1 20 48 0 12.03.2009 4:00 225 6.6 19 54 0
11.03.2009 5:00 270 3.5 19 54 0 12.03.2009 5:00 225 7.2 20 56 0
11.03.2009 6:00 225 3.6 18 62 0 12.03.2009 6:00 270 11.1 20 56 0
11.03.2009 7:00 225 2.8 17 70 0 12.03.2009 7:00 270 8.7 21 57 0
11.03.2009 8:00 225 3.2 19 63 0 12.03.2009 8:00 225 10 21 57 0
11.03.2009 9:00 270 3.4 21 49 0 12.03.2009 9:00 225 10.1 22 59 0
11.03.2009 10:00 270 10.4 23 38 0 12.03.2009 10:00 225 6.6 24 46 0
11.03.2009 11:00 225 11.1 25 35 0 12.03.2009 11:00 225 9.4 25 47 0
11.03.2009 12:00 225 10.7 25 35 0 12.03.2009 12:00 225 9.8 26 49 0
11.03.2009 13:00 225 7.9 26 36 0 12.03.2009 13:00 270 10.8 26 55 0
11.03.2009 14:00 225 10.2 25 41 0 12.03.2009 14:00 270 11.9 27 56 0
11.03.2009 15:00 270 9.5 24 46 0 12.03.2009 15:00 270 12.1 27 63 0
11.03.2009 16:00 270 8.6 23 52 0 12.03.2009 16:00 225 18.4 28 64 0
11.03.2009 17:00 270 11.2 22 59 0 12.03.2009 17:00 225 10.8 28 64 0
11.03.2009 18:00 202.5 9.8 21 57 0 12.03.2009 18:00 225 14.8 28 64 0
11.03.2009 19:00 270 10 21 57 0 12.03.2009 19:00 225 1.8 27 63 0
11.03.2009 20:00 225 5.8 21 57 0 12.03.2009 20:00 202.5 5.1 27 63 0
11.03.2009 21:00 225 10.8 21 57 0 12.03.2009 21:00 202.5 5.1 26 55 0
11.03.2009 22:00 225 9.4 21 57 0 12.03.2009 22:00 247.5 4.1 26 55 0
11.03.2009 23:00 225 5.2 20 56 0 12.03.2009 23:00 270 5.2 25 54 0
13.03.2009 0:00 225 5.2 25 54 2 14.03.2009 0:00 157.5 2.7 23 67 0
13.03.2009 1:00 270 10.5 24 53 2 14.03.2009 1:00 112.5 3.1 23 67 0
13.03.2009 2:00 202.5 9.3 23 52 2 14.03.2009 2:00 90 4.7 22 74 0
13.03.2009 3:00 315 4.6 22 50 2 14.03.2009 3:00 90 2.7 21 65 0
13.03.2009 4:00 292.5 6.1 20 56 2 14.03.2009 4:00 135 3.7 20 64 0
13.03.2009 5:00 270 3.4 20 56 2 14.03.2009 5:00 90 1.4 19 63 0
13.03.2009 6:00 270 2.7 19 63 2 14.03.2009 6:00 112.5 1.2 18 71 0
13.03.2009 7:00 270 1.2 18 71 0 14.03.2009 7:00 157.5 2.3 19 72 0
13.03.2009 8:00 135 1.4 19 63 0 14.03.2009 8:00 157.5 0.8 21 65 0
13.03.2009 9:00 135 1.7 20 64 0 14.03.2009 9:00 90 4.5 23 67 0
13.03.2009 10:00 157.5 1.2 22 59 0 14.03.2009 10:00 135 2.6 25 61 0
13.03.2009 11:00 135 2.2 23 67 0 14.03.2009 11:00 90 5.3 28 51 0
13.03.2009 12:00 112.5 1.3 27 50 0 14.03.2009 12:00 90 4.2 30 47 0
13.03.2009 13:00 135 1 30 47 0 14.03.2009 13:00 90 3.1 28 57 0
13.03.2009 14:00 135 0.4 30 47 0 14.03.2009 14:00 135 3.2 28 51 0
13.03.2009 15:00 90 0.4 28 57 0 14.03.2009 15:00 180 3.5 27 50 0
13.03.2009 16:00 135 0.5 26 69 0 14.03.2009 16:00 202.5 3.5 26 55 0
13.03.2009 17:00 112.5 0.5 26 69 0 14.03.2009 17:00 247.5 3.6 25 61 0
13.03.2009 18:00 157.5 0.5 26 62 0 14.03.2009 18:00 270 3.1 25 61 0
13.03.2009 19:00 135 3.1 26 62 0 14.03.2009 19:00 225 3.5 25 61 0
13.03.2009 20:00 90 1.1 25 61 0 14.03.2009 20:00 270 6.4 25 61 0
13.03.2009 21:00 135 3.5 25 61 0 14.03.2009 21:00 315 7.1 24 60 0
13.03.2009 22:00 112.5 1.2 24 60 0 14.03.2009 22:00 337.5 1.5 24 60 0
13.03.2009 23:00 157.5 1.5 24 60 0 14.03.2009 23:00 270 2.2 23 59 0

Project Title : EIA Study for Development of Industrial Estate of HSIIDC at Sec-37 & Sec-3 Extn, Ph-III, Karnal Project No. : 21-1041/2007-IA.III Contract No. : HSIA: K:2007:1315 dt.09.10.2007 Page 82 of 184
Shriram Institute for Industrial Research: Delhi
15.03.2009 0:00 270 3 23 59 0 16.03.2009 0:00 180 4.9 22 74 0
15.03.2009 1:00 315 1.6 22 74 0 16.03.2009 1:00 225 4.6 22 74 0
15.03.2009 2:00 337.5 2.2 21 65 0 16.03.2009 2:00 202.5 3.1 21 65 0
15.03.2009 3:00 270 1.5 21 57 0 16.03.2009 3:00 270 3.2 21 65 0
15.03.2009 4:00 225 0.6 20 56 0 16.03.2009 4:00 225 3.5 20 56 0
15.03.2009 5:00 247.5 1.4 19 72 0 16.03.2009 5:00 247.5 2 19 63 0
15.03.2009 6:00 292.5 1.3 17 90 0 16.03.2009 6:00 270 1.3 20 56 0
15.03.2009 7:00 270 1.1 19 72 0 16.03.2009 7:00 225 1.6 21 65 0
15.03.2009 8:00 225 0.8 21 65 0 16.03.2009 8:00 270 1 22 82 0
15.03.2009 9:00 270 2.7 23 59 0 16.03.2009 9:00 270 4.3 24 75 0
15.03.2009 10:00 225 1.4 25 61 0 16.03.2009 10:00 225 4.6 25 76 0
15.03.2009 11:00 202.5 4.4 26 62 0 16.03.2009 11:00 225 4 26 76 0
15.03.2009 12:00 270 3.8 27 63 0 16.03.2009 12:00 202.5 3.3 28 64 0
15.03.2009 13:00 225 2.4 28 57 0 16.03.2009 13:00 270 5.4 29 58 0
15.03.2009 14:00 180 1.5 30 0 16.03.2009 14:00 180 6.2 32 49 0
15.03.2009 15:00 270 2.9 30 47 0 16.03.2009 15:00 112.5 6.1 32 49 0
15.03.2009 16:00 225 3.6 28 57 0 16.03.2009 16:00 112.5 2.4 32 44 0
15.03.2009 17:00 247.5 4.7 27 50 0 16.03.2009 17:00 90 0.9 30 47 0
15.03.2009 18:00 202.5 5.3 26 55 0 16.03.2009 18:00 90 1.7 29 46 0
15.03.2009 19:00 225 6.5 25 61 0 16.03.2009 19:00 90 1 28 45 0
15.03.2009 20:00 180 6.4 24 60 0 16.03.2009 20:00 90 1.5 27 50 0
15.03.2009 21:00 225 6.7 24 60 0 16.03.2009 21:00 112.5 1.9 26 49 0
15.03.2009 22:00 180 3.1 23 59 0 16.03.2009 22:00 112.5 1.4 25 47 0
15.03.2009 23:00 225 2.4 22 74 0 16.03.2009 23:00 112.5 1.2 24 46 0
17.03.2009 0:00 180 0.5 23 45 0 18.03.2009 0:00 202.5 0.9 22 66 2
17.03.2009 1:00 90 0.4 23 45 0 18.03.2009 1:00 270 3.3 22 66 4
17.03.2009 2:00 112.5 0.5 22 43 0 18.03.2009 2:00 270 5.4 21 65 4
17.03.2009 3:00 112.5 1.4 21 49 0 18.03.2009 3:00 247.5 3.4 21 65 2
17.03.2009 4:00 135 0.8 20 64 0 18.03.2009 4:00 270 2.8 20 56 2
17.03.2009 5:00 135 1.1 19 81 0 18.03.2009 5:00 225 3.7 20 56 2
17.03.2009 6:00 112.5 1.7 20 81 0 18.03.2009 6:00 202.5 4.5 19 63 2
17.03.2009 7:00 112.5 1.1 21 82 0 18.03.2009 7:00 202.5 4.2 21 65 0
17.03.2009 8:00 270 1.5 22 82 0 18.03.2009 8:00 225 2.3 22 74 0
17.03.2009 9:00 225 1.1 23 68 0 18.03.2009 9:00 225 3.2 23 76 0
17.03.2009 10:00 225 5.3 25 68 0 18.03.2009 10:00 270 6.4 25 61 0
17.03.2009 11:00 270 4.3 27 56 0 18.03.2009 11:00 292.5 3.7 27 50 0
17.03.2009 12:00 202.5 3.1 29 52 0 18.03.2009 12:00 315 5.7 28 51 2
17.03.2009 13:00 225 1.5 30 59 0 18.03.2009 13:00 270 3.2 29 52 2
17.03.2009 14:00 225 2.2 32 49 0 18.03.2009 14:00 337.5 3.3 30 59 2
17.03.2009 15:00 270 2.5 30 59 0 18.03.2009 15:00 225 3.6 28 51 2
17.03.2009 16:00 202.5 4.3 30 47 0 18.03.2009 16:00 247.5 3.5 27 56 2
17.03.2009 17:00 247.5 2.7 28 45 0 18.03.2009 17:00 315 4.1 27 50 2
17.03.2009 18:00 270 2.5 27 50 0 18.03.2009 18:00 270 2.3 25 61 2
17.03.2009 19:00 270 3.3 26 49 0 18.03.2009 19:00 247.5 3.4 24 68 2
17.03.2009 20:00 225 2.5 25 47 0 18.03.2009 20:00 225 2.6 23 67 2
17.03.2009 21:00 270 2.6 23 59 0 18.03.2009 21:00 202.5 2.2 22 74 2
17.03.2009 22:00 270 1.5 22 66 0 18.03.2009 22:00 247.5 2.2 21 73 0
17.03.2009 23:00 225 2.5 22 66 0 18.03.2009 23:00 270 3.3 20 73 0
19.03.2009 0:00 225 1 19 90 0 20.03.2009 0:00 225 2.1 21 49 2
19.03.2009 1:00 247.5 0.9 19 90 0 20.03.2009 1:00 247.5 4.3 21 49 2

Project Title : EIA Study for Development of Industrial Estate of HSIIDC at Sec-37 & Sec-3 Extn, Ph-III, Karnal Project No. : 21-1041/2007-IA.III Contract No. : HSIA: K:2007:1315 dt.09.10.2007 Page 83 of 184
Shriram Institute for Industrial Research: Delhi
19.03.2009 2:00 315 0.5 18 90 0 20.03.2009 2:00 270 1.5 20 56 8
19.03.2009 3:00 337.5 1.6 18 90 0 20.03.2009 3:00 292.5 0.6 20 56 8
19.03.2009 4:00 270 3 17 90 0 20.03.2009 4:00 270 0.4 19 63 8
19.03.2009 5:00 247.5 4.4 17 90 0 20.03.2009 5:00 270 1.4 19 63 8
19.03.2009 6:00 225 3.1 18 90 0 20.03.2009 6:00 225 2.1 18 71 8
19.03.2009 7:00 270 1.8 19 91 0 20.03.2009 7:00 270 1.8 19 70 8
19.03.2009 8:00 270 4 20 82 0 20.03.2009 8:00 247.5 3.7 20 79 8-D
19.03.2009 9:00 202.5 4.2 22 75 0 20.03.2009 9:00 292.5 4.4 22 50 0
19.03.2009 10:00 225 2.5 24 76 0 20.03.2009 10:00 270 3.6 24 46 0
19.03.2009 11:00 270 2.2 25 76 0 20.03.2009 11:00 202.5 4.4 26 42 0
19.03.2009 12:00 292.5 5.2 26 64 0 20.03.2009 12:00 225 4.2 28 39 0
19.03.2009 13:00 337.5 6.4 28 49 0 20.03.2009 13:00 270 4.4 30 47 2
19.03.2009 14:00 270 2.6 32 44 0 20.03.2009 14:00 292.5 5.1 29 46 4
19.03.2009 15:00 270 2.3 32 44 0 20.03.2009 15:00 270 3.6 28 51 4
19.03.2009 16:00 225 4.6 30 47 0 20.03.2009 16:00 225 3.6 27 50 4
19.03.2009 17:00 270 6.5 29 46 0 20.03.2009 17:00 292.5 4.3 25 61 4
19.03.2009 18:00 202.5 6.2 26 49 0 20.03.2009 18:00 337.5 3.4 23 76 6
19.03.2009 19:00 292.5 4.2 25 47 0 20.03.2009 19:00 0 2.8 22 74 6
19.03.2009 20:00 270 5.3 24 46 0 20.03.2009 20:00 22.5 1.5 21 73 6
19.03.2009 21:00 225 5.3 23 45 0 20.03.2009 21:00 67.5 3.7 20 56 8
19.03.2009 22:00 225 2.1 22 43 0 20.03.2009 22:00 90 5.2 19 81 8
19.03.2009 23:00 270 3.2 21 49 0 20.03.2009 23:00 67.5 5.2 19 81 8
21.03.2009 0:00 0 4.9 19 81 8-D 22.03.2009 0:00 202.5 3.2 18 90 8-D
21.03.2009 1:00 45 5.2 19 81 8 22.03.2009 1:00 180 2.3 17 90 8-D
21.03.2009 2:00 112.5 7.2 18 80 8 22.03.2009 2:00 157.5 3.1 17 90 8
21.03.2009 3:00 135 7.4 18 80 8 22.03.2009 3:00 135 2.3 17 90 8
21.03.2009 4:00 90 8.5 18 80 8 22.03.2009 4:00 180 2.2 17 90 8
21.03.2009 5:00 67.5 7.1 18 80 8 22.03.2009 5:00 225 1.3 17 90 8
21.03.2009 6:00 45 7.1 18 80 8 22.03.2009 6:00 202.5 0.3 16 89 8
21.03.2009 7:00 45 5.2 18 90 6 22.03.2009 7:00 225 4.2 17 90 6
21.03.2009 8:00 67.5 2.2 19 90 6 22.03.2009 8:00 247.5 2.2 18 90 4
21.03.2009 9:00 90 5.2 20 91 4 22.03.2009 9:00 270 2.6 20 91 2
21.03.2009 10:00 112.5 5.3 22 82 4 22.03.2009 10:00 202.5 2.2 22 82 0
21.03.2009 11:00 135 3.5 23 76 4 22.03.2009 11:00 247.5 2.2 24 75 0
21.03.2009 12:00 157.5 2.3 24 75 4 22.03.2009 12:00 292.5 2.6 26 76 0
21.03.2009 13:00 180 4.2 25 76 2 22.03.2009 13:00 315 2.7 28 64 0
21.03.2009 14:00 247.5 2.2 28 64 4 22.03.2009 14:00 337.5 1.9 32 49 0
21.03.2009 15:00 202.5 3.6 25 76 4 22.03.2009 15:00 292.5 2.3 28 64 0
21.03.2009 16:00 270 3.1 23 76 4 22.03.2009 16:00 315 3.4 26 76 2
21.03.2009 17:00 180 4.7 22 82 4 22.03.2009 17:00 247.5 3.5 25 76 2
21.03.2009 18:00 135 6.2 20 91 4 22.03.2009 18:00 270 2.1 24 75 2
21.03.2009 19:00 157.5 6.2 19 90 6 22.03.2009 19:00 225 1.1 22 82 4
21.03.2009 20:00 180 9.2 19 90 4-D 22.03.2009 20:00 202.5 1.5 22 82 4
21.03.2009 21:00 202.5 10.3 18 90 6 22.03.2009 21:00 202.5 0.9 20 91 4
21.03.2009 22:00 225 7.5 18 90 6 22.03.2009 22:00 270 2.1 20 91 6
21.03.2009 23:00 225 4.3 18 90 6 22.03.2009 23:00 225 2.4 20 91 6
23.03.2009 0:00 225 3.6 20 91 6 24.03.2009 0:00 315 1.1 20 81 0
23.03.2009 1:00 247.5 8.7 20 91 6 24.03.2009 1:00 292.5 3.2 20 81 0
23.03.2009 2:00 202.5 7.2 19 90 8-D 24.03.2009 2:00 270 2.3 19 90 0
23.03.2009 3:00 202.5 7.4 19 90 8-D 24.03.2009 3:00 315 3.3 18 90 0
23.03.2009 4:00 180 7.2 18 90 8-D 24.03.2009 4:00 337.5 1.7 17 90 0

Project Title : EIA Study for Development of Industrial Estate of HSIIDC at Sec-37 & Sec-3 Extn, Ph-III, Karnal Project No. : 21-1041/2007-IA.III Contract No. : HSIA: K:2007:1315 dt.09.10.2007 Page 84 of 184
Shriram Institute for Industrial Research: Delhi
23.03.2009 5:00 202.5 9.5 18 90 8 24.03.2009 5:00 270 0.8 17 90 0
23.03.2009 6:00 180 7.4 18 90 8 24.03.2009 6:00 315 1.2 16 89 0
23.03.2009 7:00 202.5 5.4 20 90 8 24.03.2009 7:00 292.5 2 18 80 0
23.03.2009 8:00 225 6.2 22 74 2 24.03.2009 8:00 270 2.1 20 73 0
23.03.2009 9:00 270 2.4 24 68 2 24.03.2009 9:00 225 2.3 22 66 0
23.03.2009 10:00 270 4.2 26 62 2 24.03.2009 10:00 225 4.3 24 60 0
23.03.2009 11:00 292.5 4.2 26 62 4 24.03.2009 11:00 180 1.4 26 55 0
23.03.2009 12:00 315 4.2 28 64 4 24.03.2009 12:00 180 2.5 28 51 0
23.03.2009 13:00 270 2.4 26 62 4 24.03.2009 13:00 225 1.5 29 52 0
23.03.2009 14:00 315 1.1 25 76 0 24.03.2009 14:00 270 3.9 30 47 0
23.03.2009 15:00 270 3.2 24 75 0 24.03.2009 15:00 270 4.1 30 53 0
23.03.2009 16:00 292.5 3.3 23 76 0 24.03.2009 16:00 0 5.1 30 53 0
23.03.2009 17:00 315 4.3 22 82 0 24.03.2009 17:00 315 4.5 30 59 0
23.03.2009 18:00 292.5 2 22 82 0 24.03.2009 18:00 315 6 30 59 0
23.03.2009 19:00 270 2.7 21 82 0 24.03.2009 19:00 270 4.6 27 70 2
23.03.2009 20:00 292.5 4.7 21 82 0 24.03.2009 20:00 225 7.6 26 76 2
23.03.2009 21:00 315 2.2 20 81 0 24.03.2009 21:00 225 7.8 24 75 2
23.03.2009 22:00 337.5 2.1 20 81 0 24.03.2009 22:00 270 11.4 24 75 2
23.03.2009 23:00 315 3.1 20 81 0 24.03.2009 23:00 225 10.4 23 76 2
25.03.2009 0:00 270 8.2 22 82 6 26.03.2009 0:00 67.5 4.2 16 79 6
25.03.2009 1:00 315 7.4 22 74 6 26.03.2009 1:00 22.5 2.2 16 79 6
25.03.2009 2:00 315 8.4 21 82 6 26.03.2009 2:00 0 4.5 16 79 6
25.03.2009 3:00 0 6.2 21 82 6 26.03.2009 3:00 67.5 2.1. 15 89 4
25.03.2009 4:00 45 8.2 21 73 8-D 26.03.2009 4:00 90 4.3 15 89 4
25.03.2009 5:00 45 9.2 20 81 8-D 26.03.2009 5:00 45 2.4 15 89 4
25.03.2009 6:00 90 8.7 20 81 6 26.03.2009 6:00 22.5 2.1 15 89 2
25.03.2009 7:00 90 8.6 20 73 6 26.03.2009 7:00 67.5 1.9 16 89 2
25.03.2009 8:00 90 4.8 20 73 6 26.03.2009 8:00 67.5 1.2 17 80 0
25.03.2009 9:00 90 5.4 20 73 6 26.03.2009 9:00 45 1.1 18 80 0
25.03.2009 10:00 112.5 4.2 21 73 6 26.03.2009 10:00 22.5 4.8 20 73 0
25.03.2009 11:00 90 9.4 22 66 6 26.03.2009 11:00 0 4.4 22 66 0
25.03.2009 12:00 45 10.4 24 60 6 26.03.2009 12:00 337.5 4.7 24 60 0
25.03.2009 13:00 45 7.5 26 55 6 26.03.2009 13:00 315 3.3 25 55 0
25.03.2009 14:00 22.5 4.3 24 60 4 26.03.2009 14:00 292.5 4.6 26 55 2
25.03.2009 15:00 67.5 4.4 24 60 4 26.03.2009 15:00 225 7.5 24 60 2
25.03.2009 16:00 90 5.1 22 66 4 26.03.2009 16:00 270 5.2 22 66 2
25.03.2009 17:00 45 3.2 20 73 4 26.03.2009 17:00 292.5 8.4 20 73 2
25.03.2009 18:00 67.5 4.6 20 73 4 26.03.2009 18:00 247.5 8.7 20 73 2
25.03.2009 19:00 0 3.1 19 81 2 26.03.2009 19:00 270 8.4 19 81 2
25.03.2009 20:00 45 4.3 18 80 4 26.03.2009 20:00 135 9.8 19 81 2
25.03.2009 21:00 67.5 6.4 17 80 4 26.03.2009 21:00 135 4.4 18 80 4
25.03.2009 22:00 90 5.2 16 79 6 26.03.2009 22:00 270 4.8 17 80 4
25.03.2009 23:00 67.5 3.2 16 79 6 26.03.2009 23:00 247.5 4.4 17 80 4

Project Title : EIA Study for Development of Industrial Estate of HSIIDC at Sec-37 & Sec-3 Extn, Ph-III, Karnal Project No. : 21-1041/2007-IA.III Contract No. : HSIA: K:2007:1315 dt.09.10.2007 Page 85 of 184
Shriram Institute for Industrial Research: Delhi
3.4 Noise Environment Noise pollution is most often and most simply defined as unwanted sound, which interferes with speech communication, cause annoyance, distracts from work, disturbs sleep and thus adversely affects the quality of human environment. In order to assess the existing noise level, noise monitoring was undertaken at both the strategic locations in the study area. 3.4.1 Community Noise The ambient noise level is characterized by significant variations above a base called a Residual Noise Level, below which the ambient noise does not seem to drop during a given time interval and is generally caused by unidentified distant sources. It differs in rural and urban areas. At night, its level is low due to lesser elements of noise. 3.4.2 Noise Levels for Residential, Commercial, Industrial & Silence Zones Noise criteria values are designed to protect the general public from physiological impairment resulting from excessive levels of noise. The criteria include environmental noise exposure limits to protect the general public and to provide guidance for land use planning. Noise level criteria given in the Central Pollution Control Board Standard prescribe the Maximum Noise Level for Residential, Commercial and Industrial & Silence Zones as under:
Table-3.4 (a) Noise Level Criteria Zones
Maximum Noise Level (dBA) Day time Night time
Residential Area 55 45 Commercial Area 65 55 Industrial Area 75 70 Silence Zone 50 40 3.4.3 Study Area The noise level was monitored at six locations as per the following description for 24 Hrs. time.
Table-3.4 (b) Study area for Ambient Noise Level Source Code
Location/ Village Geo-codes Latitude Longitude
ANL-1 Kambhopura 29°38’12.9”N 76°59’02.9”E ANL-2 Ganjogarhi 29°37’35.5”N 77°02’32.0”E ANL-3 Bastara 29°34’07.0”N 76°59’19.2”E ANL-4 Baldi 29°43’06.9”N 76°59’24.7”E ANL-5 Ghogaripur 29°38’53.1”N 76°56’44.7”E ANL-6 Dabri 29°42’09.8”N 76°56’16.8”E
3.4.4 Monitoring Methodology Sound Pressure Level dB (A) Leq. was measured using Sound Pressure Level Meter. Hourly cumulative Leq. values were taken for 24 Hrs (day & Night) from each strategic location. Monitoring data was processed statistically to estimate ♦ Lmin. ♦ Lmax. ♦ Lday ♦ Lnight ♦ Ldn

Project Title : EIA Study for Development of Industrial Estate of HSIIDC at Sec-37 & Sec-3 Extn, Ph-III, Karnal Project No. : 21-1041/2007-IA.III Contract No. : HSIA: K:2007:1315 dt.09.10.2007 Page 86 of 184
Shriram Institute for Industrial Research: Delhi
3.4.5 Data Interpretation Observations noticed from the monitoring results summarised in following tables, can be illustrated as:
Table-3.4 (c) Analysis of Ambient Noise Level data Time Hrs. Noise level (Cum.Leq)
ANL-1 ANL-2 ANL-3 ANL-4 ANL-5 ANL-6 Kambopura Ganjogarhi Bastara Baldi Ghogaripur Dabri
Lmin. 41.0 41.8 41.8 42.0 42.2 44.0 Lmax. 54.3 53.0 54.0 54.8 54.0 55.2 Lday 50.7 50.8 51.2 51.6 51.4 51.9 Lnight 42.7 44.5 43.6 43.9 45.8 46.5 Ldn 47.8 48.4 48.2 48.7 49.3 49.9 (a) Core Zone of Project Area (ANL-1)
♦ Minimum and maximum Cumulative Leq. on hourly monitoring basis were observed respectively as 41.0 dB (A) during 0100-0200 hrs and 54.3 dB (A) during 18.00 – 19.00 hrs.
♦ Cumulative Leq during day time (Lday) were estimated 50.7 dB (A), whereas same during the night time (Lnight) have been estimated 42.7 dB (A). The estimated value of Ldn at this location is 47.8 dB (A).
(b) Buffer Zone of Project Area (ANL-2)
♦ Minimum and maximum Cumulative Leq. on hourly monitoring basis were observed respectively as 41.8 dB (A) during 0400-0500 hrs and 53.0 dB (A) during 17.00-18.00 hrs.
♦ Cumulative Leq during day time (Lday) were estimated 50.8 dB (A), whereas same during the night time (Lnight) have been estimated 44.5 dB (A). The estimated value of Ldn at this location is 48.4 dB (A).
(c) Buffer Zone of Project Area (ANL-3)
♦ Minimum and maximum Cumulative Leq. on hourly monitoring basis were observed respectively as 41.8 dB (A) during 0200-0300 hrs and 54.0 dB (A) during 18.00-19.00 hrs.
♦ Cumulative Leq during day time (Lday) were estimated 51.2 dB (A), whereas same during the night time (Lnight) have been estimated 43.6 dB (A). The estimated value of Ldn at this location is 48.2 dB (A).
(d) Buffer Zone of Project Area (ANL-4)
♦ Minimum and maximum Cumulative Leq. on hourly monitoring basis were observed respectively as 42.0 dB (A) during 0300-0400 hrs and 54.8 dB (A) during 17.00-18.00 hrs.
♦ Cumulative Leq during day time (Lday) were estimated 51.6 dB (A), whereas same during the night time (Lnight) have been estimated 43.9 dB (A). The estimated value of Ldn at this location is 48.7 dB (A).
(e) Buffer Zone of Project Area (ANL-5)
♦ Minimum and maximum Cumulative Leq. on hourly monitoring basis were observed respectively as 42.2 dB (A) during 0300-0400 hrs and 54.0 dB (A) during 19.00-20.00 hrs.
♦ Cumulative Leq during day time (Lday) were estimated 51.4 dB (A), whereas same during the night time (Lnight) have been estimated 45.8 dB (A). The estimated value of Ldn at this location is 49.3 dB (A).

Project Title : EIA Study for Development of Industrial Estate of HSIIDC at Sec-37 & Sec-3 Extn, Ph-III, Karnal Project No. : 21-1041/2007-IA.III Contract No. : HSIA: K:2007:1315 dt.09.10.2007 Page 87 of 184
Shriram Institute for Industrial Research: Delhi
(f) Buffer Zone of Project Area (ANL-6) ♦ Minimum and maximum Cumulative Leq. on hourly monitoring basis were observed
respectively as 44.0 dB (A) during 0200-0300 hrs and 55.2 dB (A) during 18.00-19.00 hrs. ♦ Cumulative Leq during day time (Lday) were estimated 51.9 dB (A), whereas same during the
night time (Lnight) have been estimated 46.5 dB (A). The estimated value of Ldn at this location is 49.9 dB (A).
Table-3.4(d) Hourly Ambient Noise Level Data of Project Site Time Hrs. Noise level (Cum.Leq)
ANL-1 ANL-2 ANL-3 ANL-4 ANL-5 ANL-6
Kambopura Ganjogarhi Bastara Baldi Ghogaripur Dabri
Day 06.00-07.00 47.8 45.8 43.4 47.4 47.6 47.4 07.00-08.00 49.4 48.0 47.2 50.0 49.2 47.8 08.00-09.00 50.2 49.0 49.2 50.4 50.4 47.8 09.00-10.00 49.8 49.2 50.0 50.8 50.9 48.8 10.00-11.00 51.2 49.6 50.2 51.2 51.6 50.2 11.00-12.00 51.2 50.0 50.4 51.4 52.7 51.4 12.00-13.00 52.8 50.4 51.0 52.0 52.4 52.0 13.00-14.00 49.0 51.0 52.0 52.0 50.0 52.4 14.00-15.00 48.7 51.2 52.8 52.2 51.2 53.0 15.00-16.00 50.1 52.0 52.8 52.8 49.6 53.6 16.00-17.00 52.3 52.2 53.2 54.0 49.3 54.2 17.00-18.00 53.6 53.0 53.6 54.8 52.0 55.0 18.00-19.00 54.3 52.4 54.0 53.0 53.4 55.2 19.00-20.00 52.7 52.0 53.0 51.0 54.0 54.4 20.00-21.00 48.8 51.0 51.2 50.0 53.6 52.0 21.00-22.00 47.0 50.6 47.4 48.4 51.2 51.4
Night 22.00-23.00 45.3 48.4 44.2 46.0 50.0 50.0 23.00-00.00 43.0 47.0 49.2 45.4 49.2 49.6 00.00-01.00 42.1 46.2 41.8 44.2 47.4 48.0 01.00-02.00 41.0 44.0 42.6 43.4 45.0 47.2 02.00-03.00 41.2 42.8 41.8 42.6 44.0 45.0 03.00.04.00 41.4 42.2 43.2 42.0 42.2 43.6 04.00-05.00 42.8 41.8 44.0 42.8 43.6 44.0 05.00-06.00 44.8 43.8 42.8 44.6 45.2 45.4
Lmin. 41.0 41.8 41.8 42.0 42.2 44.0 Lmax. 54.3 53.0 54.0 54.8 54.0 55.2 Lday 50.7 50.8 51.2 51.6 51.4 51.9 Lnight 42.7 44.5 43.6 43.9 45.8 46.5 Ldn 47.8 48.4 48.2 48.7 49.3 49.9

Project Title : EIA Study for Development of Industrial Estate of HSIIDC at Sec-37 & Sec-3 Extn, Ph-III, Karnal Project No. : 21-1041/2007-IA.III Contract No. : HSIA: K:2007:1315 dt.09.10.2007 Page 88 of 184
Shriram Institute for Industrial Research: Delhi
3.5 Water Environment Water is one of the basic requirements for the development of any area and should be available in sufficient quantity for residential, commercial or industrial uses. The objective of water environment impact assessment is the evaluation of the nature and magnitude of changes in water environment indicators as a result of the existing/proposed projects. A very important concern relative to development of an area is the demand of water by the project & the resulting impacts on the quality of available supplies. It is, therefore, obvious that establishment or expansion of any project may result in the affliction of the water resources of the area. The extent to which surface and ground water resources can be impacted in terms of quantity and quality depends upon the total water requirements by the project, i.e. quantity and quality of existing water resources and quantity and quality of effluent discharge by the new project. Development of new project also increases the competitiveness of water uses for domestic, agricultural and industrial purposes. Therefore, study of water environment is very significant for preparation of the environment management plan before the expansion of any new installation/expansion of a project. It includes the study of natural environment of existing water scenario and prediction of likely impacts on it due to the upcoming installation / expansion of any project. In order to assess the availability & adequacy of water in terms of its quantity and quality, geo-hydrological data of the area needs to be analyzed. 3.5.1 Water Resources in the Project Area
(a) Ground water availability in Karnal District Ground water resources – accumulated water below the ground surface, caused by rainfall and its subsequent percolation through pores and crevices. Percolated water accumulates till it reaches the impervious strata comprising of confined clay or confirmed rocks. Water quantity in Karnal region is illustrated in table-3.5 (a) & (b), which indicates groundwater potential, stages of groundwater exploitation and annual natural recharge rate.
Table-3.5 (a) Ground Water Quantity in Karnal Resources Estimations Qty (ha m)
Net groundwater availability 87850Annual Groundwater Draft Irrigation 119235
Domestic & Industrial Uses 1245 Total 120479
Projected demand for domestic & industrial uses upto 2025 1854 Groundwater availability for future irrigation 33238 Stage of groundwater development (%) 137% (Source : Dynamic Groundwater Resources of India (as on March-2004); CGWB)
Table-3.5 (b) Criteria for categorization of Assessment Units Stage of Groundwater Development
Significant long-term decline Categorization Pre-monsoon Post-monsoon
≤ 70% No No Safe > 70% and ≤ 90% No No Safe
Yes/ No No/ Yes Semi-critical > 90% and ≤ 100% Yes/ No No/ Yes Semi-critical
Yes Yes Critical > 100% Yes/ No No/ Yes Over-exploited
Yes Yes Over-exploited(Source : Dynamic Groundwater Resources of India (as on March-2004); CGWB)
Project Title : EIA Study for Development of Industrial Estate of HSIIDC at Sec-37 & Sec-3 Extn, Ph-III, Karnal Project No. : 21-1041/2007-IA.III Contract No. : HSIA: K:2007:1315 dt.09.10.2007 Page 89 of 184
Shriram Institute for Industrial Research: Delhi
(b) Geo-hydrological survey in the Project Area ♦ Water table in the area varies from 10 m to 20 m below ground level. ♦ Potable water is available only at 10 to 20 m depth. ♦ The draw down in water table is 10 to 20 m. Keeping in view of above facts, it is essential to find out some external source to meet the water requirement. ♦ Radial collector wells, which are more commonly known as Ranney wells, are found
suitable at certain places to meet the water requirement in the study area. ♦ Further digging of tube well requires special orders from Central Ground Water Board. Basically source generation and providing bulk water supply, to be carried out under the External Development Head out of EDC funds. Accordingly, it is proposed to generate only 20% of the water from the local ground water source by drilling tube wells of appropriate size, depth and location based on the geo-hydrological survey. Balance 80% demand of water would be met from external source 3.5.2 Water Demand & Supply in the Project Area Water supply for the industrial township can be estimated, based on the norms specified in the Manual for Water Supply published by the Ministry of Urban Development, Government of India. (a) Water demand for area under industries The industrial area, where different type of industries are to come up, has the varying water demand. Accordingly, the industries have been divided in two major groups: (i) Normal/ small industries with no specific demand of water for processing may require 45
lpcd. The employment may be to the extent of 250 PPA i.e 250 x 45 (lpcd) x 1.15 (un- accounted) = 13000 litres per acre in 80 % of the plotted area.
(ii) In case of industries, where water is required for processing, the demand may vary to the
larger extent. However, considering the average demand of such units as 50000 litres per acre in 20% of the plotted area.
Thus, the average water demand would be : 50000 x 0.2 +13000 x 0.8 = 20400 litre per acre. Hence the average water requirement for industrial area would be @ 21000 litre per acre. (b) Water demand for area under group housing ♦ The norms adopted are 135 lpcd for population density of 250 PPA + 20% + 15%
(unaccounted); 135 lpcd x 250 x 1.2 x 1.15 = 51750 litres (say 50000 litres/ acre).

Project Title : EIA Study for Development of Industrial Estate of HSIIDC at Sec-37 & Sec-3 Extn, Ph-III, Karnal Project No. : 21-1041/2007-IA.III Contract No. : HSIA: K:2007:1315 dt.09.10.2007 Page 90 of 184
Shriram Institute for Industrial Research: Delhi
♦ The institutional demand also varies from 70 lpcd to 450 lpcd as per the Manual of Water Supply. Taking the average demand of 150 lpcd with a population density of 100 PPA + 20% + 15% (150 lpcd x 100 x 1.2 x 1.15 = 20700 litres (say 25000 litres/ acre)
♦ Water requirement for green area is taken as 20000 litres/ acre ♦ Water requirement for public utilities & public buildings is taken as 25000 litres/ acre ♦ Water requirement for area under idle parking, roads & open spaces is taken as 10000 litres/
acre ♦ Fire fighting demand has been taken as 220000 litres/ 100 ha (c) Zoning of area & water demand Sector – 37 The total water demand works out to be 6300 KLD. As the sub-soil water is of potable quality and with adequate yield, it is proposed to have tube well as the source of supply for drinking water needs. Accordingly it has been proposed for five tube wells, capable of yielding 7000 litre per hour. It is also proposed to have size of tube well as 300 mm x 200 mm with provision of MS blind pipe and Johnson screens. The cost for the same is approximately Rs. 474.74 Lakhs. Sector – 3 Extn. The scheme has been designed for water consumption @ 4000 gallons / Acre/ per day as per standard norms. It is an extension of already existing Tube Well based water supply scheme having existing water work structures such as Tube Wells, UGSR, OHSR and distribution network. It has been proposed that all plots of size 2 acres and above shall treat the wastewater to the extent of 30% of their discharge to cater for air conditioning, horticulture and extra demand for processing, if any. (d) Design of water supply network for proposed project Water demand to be met through tube wells, 5 n. of Tube wells in sector – 37 and 3 no. of tube well are in sector – 3 Extn. Karnal.. (f) Design of Tube wells
♦ As explained the tube wells upto 70 m to 80 m depth would be required to be drilled at suitable places in the local area.
♦ The drilling may be done in 22’’ to 24’’ dia unto 70-80 m depth.
♦ The strainer depth would be provided in 14 - 20 m depths depending upon the strata.
♦ To avail maximum yield, it is recommended to provide V wires strainer of 0.75 mm c/c instead of conventional strainers.
♦ It s recommended to provide the gravel size 1.00 - 1.25 mm size.

Project Title : EIA Study for Development of Industrial Estate of HSIIDC at Sec-37 & Sec-3 Extn, Ph-III, Karnal Project No. : 21-1041/2007-IA.III Contract No. : HSIA: K:2007:1315 dt.09.10.2007 Page 91 of 184
Shriram Institute for Industrial Research: Delhi
(g) Distribution mains/ distribution network
♦ Sector - 37 will have independent water works with an underground storage in the shape of one No. of UGT and OHSR each of 500 KL capacity to work as a balancing reservoir.
♦ Water would be collected in the UGT through rising mains from internal tube wells.
♦ The capacity of the UGT would be of 8 hrs storage of respective distribution zone.
♦ There would be a separate distribution system for multistoried buildings and the low height buildings, so that the quality of service is not hampered and individual plot holders will get terminal head of 17 M and will not have to pump the water for over head storage. For multi storied buildings, the water would be supplied at the ground level into their UGT and then be pumped into over head tank. This would facilitate in economizing the power consumption.
♦ The system has been designed in such a way to have least number of crossings of the existing gas pipelines.
OHSR One no OHSR of 500 KL capacity is to be used as balancing reservoir and to provide a static head at each of the three water works.
UGT The UGT shall be designed as per the requirements (i) Criteria for design of distribution network
Distribution mains shall be designed for carrying capacity of minimum 250% of the average rate of supply. Hydraulic design of pressure pipes flowing under pressure have been designed based on modified Hazen Williams formula, which is expressed as below:
V = 3.83 CR d 0.6575 (gs) 0.5525/ v 0.105 CR = coefficient of roughness d = internal diameter of pipe in m g = acceleration due to gravity (9.81 m/s2) s = friction slope v = viscosity of liquid (for water v is 10-6 m2/s)
The distribution system is designed for the residual pressure of 17 m for industrial use at farthest point of the system considering the height of building not to be more than three storey. The separate distribution main from boosting station shall be laid for all multi storey group housing area and water shall be supplied at the ground level to avoid pressure loss/ head loss in the system and to achieve energy conservation.
Parameters Design Variable Peak Factor 2.5 x Average flow Minimum size in distribution system 100 mm
Water Supply distribution network, the storage and the boosting have been proposed as per HSIIDC/ HUDA norms.
Design of rising main from tube wells & Renny wells to boosting stations : The pipeline shall be designed on the basis of 150% of the average flow.

Project Title : EIA Study for Development of Industrial Estate of HSIIDC at Sec-37 & Sec-3 Extn, Ph-III, Karnal Project No. : 21-1041/2007-IA.III Contract No. : HSIA: K:2007:1315 dt.09.10.2007 Page 92 of 184
Shriram Institute for Industrial Research: Delhi
Rising main from boosting station to water works : This shall be based on 16 hours i.e 150% of the average discharge.
Rising main from local tubewells from water works This shall be 150% of the average discharge. However, maximum 5 Nos. of tubewells shall be connectedto 1 rising main. The size and the thickness shall be as per design standards. 3.5.3 Water Quality Assessment in the Project Area In order to assess the ground water & Surface water quality in the study area, water samples from different sources representative of the area were collected as per the description given in tables-3.5 (c).
Table-3.5 (c) Description of Water Sources Selected for the Study Source Code
Source Description Location/ Village Geo-codes Latitude Longitude
GW-1 Groundwater (80 ft) Kambhopura 29°38’12.9”N 76°59’02.9”E GW-2 Groundwater (60 ft) Ganjogarhi 29°37’35.5”N 77°02’32.0”E GW-3 Groundwater (80 ft) Bastara 29°34’07.0”N 76°59’19.2”E GW-4 Groundwater (100 ft) Baldi 29°43’06.9”N 76°59’24.7”E GW-5 Groundwater (80 ft) Ghogaripur 29°38’53.1”N 76°56’44.7”EGW-6 Borewell (100 ft) Dabri 29°42’09.8”N 76°56’16.8”ESW-1 Surface Water Western Yamuna canal (a) Methodology for Sampling & Analysis (i) Water Sampling
Objective of water sampling is to collect a portion of water, small enough in volume to be transported conveniently to the laboratory, while still accurately representing the water source being sampled. For present study, samples from selected water sources were collected as per following guidelines
♦ Grab water samples were collected from the water sources as described above.
♦ Prior to sampling, sample containers were rinsed thoroughly with the water of the source being sampled.
Tube Wells 8 nos.
External Water Works
Water Works 500 KLD
Distribution

Project Title : EIA Study for Development of Industrial Estate of HSIIDC at Sec-37 & Sec-3 Extn, Ph-III, Karnal Project No. : 21-1041/2007-IA.III Contract No. : HSIA: K:2007:1315 dt.09.10.2007 Page 93 of 184
Shriram Institute for Industrial Research: Delhi
♦ Collected samples were preserved as per the established guidelines and transported to the laboratory within the maximum permissible time limits.
♦ Samples for microbiological analysis were collected in clean, sterile bottle & transported to
laboratory within maximum permissible time limits. (ii) Water Analysis ♦ Water samples were analysed for following constituents adhering to drinking water standard
IS: 10500-1991 & MOEF guidelines for discharge of effluents on Inland Surface Water. - Physical parameters - Inorganic non-metallic constituents - Toxic metals - Mineral oil, phenolic compounds & Anionic detergents - Coliform bacteria, MPN/100 ml
♦ All reagents used in analytical work were of AR grade or higher purity. HPLC grade water was used for reagent preparation & blank correction.
♦ Guidelines of following protocols were followed for water analysis ♦ Standard Method for Examination of Water & Wastewater; APHA, AWWA, WEF; Ed.21st,
2005.
♦ Indian Standard Specification of Sampling & Analysis of Water & Wastewater; IS: 3025 (Relevant Parts).
♦ Indian Standard Specification for Method of Microbiological Analysis of Water; IS: 1622-
2003.
(b) Discussion on Water Quality Results Analytical results of all the samples, as illustrated in following tables, can be summed up as (i) Physical Characteristics (Colour, Odour, Turbidity & Dissolved Solids) Following inferences can be drawn from the analytical values ♦ Samples collected from locations of ground water i.e GW-1 to GW-6 and the surface water,
have no color as revealed by the value below 5 Hazen units. ♦ Except in case of sample collected from Ganjogarhi (Turbidity – 18 NTU), all other samples
drawn from groundwater sources and surface water source have the turbidity less than 5 NTU. Desirable limit of turbidity as per IS: 10500-1991 is 5 NTU, where as permissible limit in the absence of alternate source is 10 NTU.
♦ Both colour & turbidity in water, if present above the prescribed normal values, have
unaesthetic impact on the consumers. Consumer acceptance decreases, if water have high colour & turbidity levels.
♦ pH value was found in range of 7.4-8.4 in all the samples, which is the acceptable pH range.

Project Title : EIA Study for Development of Industrial Estate of HSIIDC at Sec-37 & Sec-3 Extn, Ph-III, Karnal Project No. : 21-1041/2007-IA.III Contract No. : HSIA: K:2007:1315 dt.09.10.2007 Page 94 of 184
Shriram Institute for Industrial Research: Delhi
♦ All the water samples drawn from groundwater sources, were found having the TDS values ranging between 280-1174 mg/l. In case of surface water sample, values of TDS have been found to be 148 mg/l. Desirable limit for TDS as per IS: 10500-1991 is 500 mg/l & permissible limit of same is 2000 mg/l in the absence of alternate sources. TDS in all the water sample is below extended limit of 2000 mg/l. If the level of TDS exceeds the normal values, it may cause gastro intestinal irritation & beyond the prescribed limit, TDS in water may reduce palatability on prolonged consumption of water.
Table-3.5 (d) Physical properties of water
Sample Code Colour, Hazen Unit Odour Turbidity NTU pH value Dissolved solids mg/l GW-1 <5 Unobjectionable 1 7.8 980 GW-2 <5 Unobjectionable 18 8.0 280 GW-3 <5 Unobjectionable <1 8.1 450 GW-4 <5 Unobjectionable <1 8.3 450 GW-5 <5 Unobjectionable <1 7.8 316 GW-6 <5 Unobjectionable 3 7.4 1174 SW-1 <5 Unobjectionable <1 8.4 148 (ii) Inorganic non-metallic constituents Calcium, Magnesium, Chloride, Sulfate, Bicarbonate, Nitrate & Fluoride: Following inference can be drawn from the analytical values: ♦ Calcium (as Ca) results varied in the range of 30-119 mg/l in all ground water samples . In
case of surface water, calcium (as Ca) has been found to be 28 mg/l. Desirable limit of calcium in drinking water is 75 mg/l & permissible limit in the absence of alternate sources is 200 mg/l. Analysis results indicates that, calcium in all samples are found within the extended limit of calcium (i.e. 200mg/l) for drinking purpose in the absence of alternate source of water.
♦ Magnesium (as Mg) results varied in the range of 21-41 mg/l in all ground water samples
except in case of GW-6, in which it has been found 100 mg/l. In case of surface water, magnesium (as Mg) has been found to be 6 mg/l. Desirable & permissible limits of Magnesium (as Mg) are 30 & 75 mg/l respectively.
♦ Higher concentration of calcium & magnesium in water may lead to encrustation in water
supply structure and adverse effects on domestic use. ♦ Chlorides (as Cl) was found in the range of 9-192 mg/l in case of all the ground samples. In
case of surface water, chloride has been found to be 4 mg/l. Desirable limit & permissible limits of same are 250 mg/l and 1000mg/l respectively. Beyond the permissible limits, taste, corrosion & palatability may be affected.
♦ Sulfate (as SO4) was found in range of 4-190 mg/l in case of all ground water samples. In
case of surface water, it was 36 mg/l. Desirable limit & permissible limits of same are 200 mg/l and 400 mg/l respectively. Beyond the permissible limits, sulfate may cause gastro-intestinal irritation, when magnesium & sodium are also present.
♦ Desirable limit for Alkalinity as CaCO3 in drinking water is 200 mg/l, whereas permissible
limit in the absence of alternate sources is 600 mg/l. Analytical result indicates the values of alkalinity in range of 219-458 mg/l in case of groundwater samples and 71 mg/l in case of surface water sample.

Project Title : EIA Study for Development of Industrial Estate of HSIIDC at Sec-37 & Sec-3 Extn, Ph-III, Karnal Project No. : 21-1041/2007-IA.III Contract No. : HSIA: K:2007:1315 dt.09.10.2007 Page 95 of 184
Shriram Institute for Industrial Research: Delhi
♦ Beyond permissible limits of 100 mg/l, nitrate (as NO3) may cause methaemoglobinemia. Analytical results suggests that nitrate in all the samples drawn from ground & surface water sources are found below the desirable limit of 45 mg/l except in case of GW-1 and GW-6, where values were found to be 183 and190 mg/l respectively.
♦ Above permissible limit of 1.5 mg/l in drinking water, Fluoride may cause Fluorosis of
varying nature. As indicated by analytical results, Fluoride (as F) was found ranging between 0.4-1.4 mg/l in all samples drawn from the groundwater sources. In case of samples drawn from surface water source, value of fluoride was found to be 0.1 mg/l.
Table-3.5 (e) Inorganic non-metallic properties in water
Parameters GW-1 GW-2 GW-3 GW-4 GW-5 GW-6 SW-1 Calcium (as Ca) 119 38 44 42 30 74 28Magnesium (as Mg) 41 28 21 30 39 100 6 Chlorides (as Cl) 102 9 18 12 16 192 4 Sulphate (as SO4) 183 4 46 49 30 190 34 Alkalinity (as CaCO3) 458 226 312 318 219 458 71 Nitrate (as NO3) 37 4 7 7 4 10 8 Fluoride (as F) 0.4 0.4 1.0 1.3 0.7 1.4 0.1 (iii) Toxic metals If water sources are contaminated with toxic metals above the prescribed norms, water becomes toxic & in some cases carcinogenic. Following inference can be drawn from the analytical values:
♦ Mercury, Cadmium, Arsenic, Selenium and Hexavalent Chromium are found below the detection limit.
♦ Manganese in all the samples drawn from groundwater sources were found in range <0.01 to
0.5 mg/l. In case of surface water sources, the value of manganese was found to be 0.01 mg/l. The maximum permissible limit of manganese in drinking water is 0.3 mg/l.
♦ Copper in all samples drawn from both ground water and surface water sources, were found
to be <0.01 mg/l, which is below desirable limit of 0.05 mg/l. ♦ Lead is found in range of 0.01-0.03 mg/l, which is below the desirable limit of 0.05 mg/l. ♦ Zinc was found to be in the range of <0.1 to 0.5 mg/l, in all samples (both ground water and
surface water). It is well below the desirable limit of 5 mg/l in case of all the samples.
Table-3.5 (f) Toxic metals in water Parameters GW-1 GW-2 GW-3 GW-4 GW-5 GW-6 SW-1 Mercury (as Hg) <0.001 <0.001 <0.001 <0.001 <0.001 <0.001 <0.001 Cadmium (as Cd) <0.01 <0.01 <0.01 <0.01 <0.01 <0.01 <0.01 Selenium (as Se) <0.005 <0.005 <0.005 <0.005 <0.005 <0.005 <0.005 Arsenic (as As) <0.005 <0.005 <0.005 <0.005 <0.005 <0.005 <0.005 Copper (as Cu) 0.03 0.03 0.01 0.01 <0.01 <0.01 0.1 Lead (as Pb) <0.01 <0.01 <0.01 <0.01 0.02 0.03 0.02 Zinc (as Zn) 0.5 0.4 0.8 <0.01 0.03 0.03 0.04 Manganese (as Mn) 0.5 0.05 0.01 <0.01 0.04 0.1 0.01 Chromium(as Cr+6) <0.01 <0.01 <0.01 <0.01 <0.01 <0.01 <0.01

Project Title : EIA Study for Development of Industrial Estate of HSIIDC at Sec-37 & Sec-3 Extn, Ph-III, Karnal Project No. : 21-1041/2007-IA.III Contract No. : HSIA: K:2007:1315 dt.09.10.2007 Page 96 of 184
Shriram Institute for Industrial Research: Delhi
(iv) Iron, Boron, Phenolic Compounds, Cyanide, Anionic Detergents, Mineral Oil & Aluminium
♦ In present study Boron was not detected in any of the sample. ♦ Cyanide, if present beyond the acceptable level, imparts toxicity in water. As evident from
the analysis results, it was not detected in any of the sample. ♦ Phenolic compounds, if present in water beyond permissible level, may produce
objectionable taste & odor as well as increase the toxicity of water. In present study concentration of these compounds are not detected in any of the water source.
♦ Anionic detergents, if found beyond the prescribed level, may cause froth in water & can
form harmful by-products on chlorination of water source. These compounds were not detected in any of the sample analyzed in present study.
♦ Iron is not hazardous to health but aesthetic value of water may be reduced appreciably due
to coloration of water, which may be yellowish brown to black and turbidity formed by precipitation of oxides. Excess iron in water imparts bitter characteristics & metallic taste. In addition, carrying capacity of pipeline in the distribution system may reduce due to the deposition of iron oxide & bacterial slimes as a result of the growth of microorganism (iron bacteria) in iron bearing water. Desirable limit of iron in water is 0.3 mg/l, whereas maximum permissible limit in the absence of alternate sources is 1.0-mg/l.
♦ In all other sources both ground as well as surface water, the values of iron (as Fe) were
found ranging between 0.1 to 1.0 mg/l. ♦ Aluminium (as Al) was found below the detection level in case of all the samples, which is
0.02 mg/l.
Table-3.5 (g) Iron, Phenolic Substances, Cyanide, Anionic Detergents, Mineral Oil, Aluminum & Boron in water Parameters GW-1 GW-2 GW-3 GW-4 GW-5 GW-6 SW-1 Iron (as Fe) 0.3 0.4 0.03 <0.01 0.06 <0.01 1.0 Phenols (as C6H5OH) <0.001 <0.001 <0.001 <0.001 <0.001 <0.001 <0.001 Cyanide (as CN) <0.01 <0.01 <0.01 <0.01 <0.01 <0.01 <0.01 An. detergents (MBAS) <0.01 <0.01 <0.01 <0.01 <0.01 <0.01 <0.01 Mineral Oil <0.01 <0.01 <0.01 <0.01 <0.01 <0.01 <0.01 Aluminium (as Al) <0.02 <0.02 <0.02 <0.02 <0.02 <0.02 <0.02 Boron (as B) <1 <1 <1 <1 <1 <1 <1 (v) Sodicity and Salinity Hazard of water
Sodicity is a good indicator to assess the water quality for irrigation applications and is represented by ‘percent sodium’ and ‘sodium adsorption ratio’. Based on sodicity, sodium hazard can be assessed though the suitability of irrigation water depending upon several other factors such as overall water quality, soil type, plant characteristics, irrigation method, drainage, climate etc. As far as water quality is concerned, following matrix can provide very useful information pertaining to Water Quality Rating (Sodicity and Salinity Hazard):
Table-3.5 (h) Sodicity & Salinity Hazard Rating

Project Title : EIA Study for Development of Industrial Estate of HSIIDC at Sec-37 & Sec-3 Extn, Ph-III, Karnal Project No. : 21-1041/2007-IA.III Contract No. : HSIA: K:2007:1315 dt.09.10.2007 Page 97 of 184
Shriram Institute for Industrial Research: Delhi
WQ Class Percent Sodium SAR EC Low <20 <10 <1500Medium 20-40 10-18 1500-3000 High 40-60 18-26 3000-6000 Very High >60 >26 >6000 Analysis results of the project area reveals that groundwater except that drawn from GW-3 which has high percent sodium, all other samples are rated as low to medium sodium hazard.
Table-3.5 (i) Percent Sodium and SAR of Water Source Type Location Code %Sodium SAR Ground Water GW-1 18.4 0.94 Ground Water GW-2 9.88 0.33 Ground Water GW-3 45.8 2.51 Ground Water GW-4 37.28 1.86 Ground Water GW-5 12.01 0.42 Ground Water GW-6 35.01 4.24 Surface Water SW-1 28.69 0.36 (vi) Bio-chemical Oxygen Demand and Chemical Oxygen Demand Bio-chemical Oxygen Demand (BOD) is the indicator of the organic pollution. It includes carbonaceous matter in biodegradable state. BOD of surface water is found <1 mg/l. COD was found to be <2. (vii) Microbiological quality Water samples should be free from coliform bacteria. In present study, water samples drawn from ground water sources GW-1, GW-5, & GW-6 were found free from microorganisms. In other samples, microorganisms were found ranging between 23 - 221 organisms / 100 ml of samples. E. coli was not detected GW-2. In the surface water 23 coliform organisms was found. E-Coli was not observed in surface water.
Table-3.5 (j) Microbiological Quality of Water Source Type Location Code MPN Coliform;
Organisms/ 100 ml Test for
detection of E.coliGround Water GW-1 No Growth -
Ground Water GW-2 23 Positive
Ground Water GW-3 221 Negative
Ground Water GW-4 141 Negative
Ground Water GW-5 No growth -
Ground Water GW-6 No growth -
Surface Water SW-1 23 Negative

Project Title : EIA Study for Development of Industrial Estate of HSIIDC at Sec-37 & Sec-3 Extn, Ph-III, Karnal Project No. : 21-1041/2007-IA.III Contract No. : HSIA: K:2007:1315 dt.09.10.2007 Page 98 of 184
Shriram Institute for Industrial Research: Delhi
Table – 3.5 (k) Detailed Analysis Results of water (GW-1, GW-2 & GW-3) Sl. Parameters Units Location Code
GW-1 GW-2 GW-3 1. Colour, Hazen Unit Hazen Units <5 <5 <5
2. Odour - Unobjectionable Unobjectionable Unobjectionable
3. Turbidity NTU 1 18 <1
4. pH value - 7.8 8.0 8.1
5. Total Hardness (as CaCO3) mg/l 470 214 196
6. Iron (as Fe) mg/l 0.3 0.4 0.03
7. Chlorides (as Cl) mg/l 102 9 18
8. Fluoride (as F) mg/l 0.4 0.4 1.0
9. Dissolved solids mg/l 980 280 450
10. Magnesium (as Mg) mg/l 41 28 21
11. Calcium (as Ca) mg/l 119 38 44
12. Copper (as Cu) mg/l <0.01 <0.01 <0.01
13. Manganese (as Mn) mg/l 0.5 0.05 0.01
14. Sulphate (as SO4) mg/l 183 4 46
15. Nitrate (as NO3) mg/l 37 4 7
16. Phenolic Compds. (as C6H5OH) mg/l <0.001 <0.001 <0.001
17. Mercury (as Hg) mg/l <0.001 <0.001 <0.001
18. Cadmium (as Cd) mg/l <0.01 <0.01 <0.01
19. Selenium (as Se) mg/l <0.005 <0.005 <0.005
20. Arsenic (as As) mg/l <0.005 <0.005 <0.005
21. Cyanide (as CN) mg/l <0.01 <0.01 <0.01
22. Lead (as Pb) mg/l <0.01 <0.01 <0.01
23. Zinc (as Zn) mg/l 0.5 0.4 0.8
24. Anionic detergents, (MBAS) mg/l <0.01 <0.01 <0.01
25. Chromium (as Cr+6) mg/l <0.01 <0.01 <0.01
26. Mineral Oil mg/l <0.01 <0.01 <0.01
27. Alkalinity (as CaCO3) mg/l 458 226 312
28. Aluminium (as Al) mg/l <0.02 <0.02 <0.02
29. Boron (as B) mg/l <1 <1 <1
30. Sodium (as Na) mg/l 54 11 81
31. Potassium (as K) mg/l 180 5 4
32. MPN Coliform/ 100 ml Organisms/ 100 ml No Growth 23 221
33. Test for detection of E.coli - - Positive Negative

Project Title : EIA Study for Development of Industrial Estate of HSIIDC at Sec-37 & Sec-3 Extn, Ph-III, Karnal Project No. : 21-1041/2007-IA.III Contract No. : HSIA: K:2007:1315 dt.09.10.2007 Page 99 of 184
Shriram Institute for Industrial Research: Delhi
Table – 3.5 (l) Detailed Analysis Results of water (GW-4, GW-5 & GW-6) Sl. Parameters Units Location Code
GW-4 GW-5 GW-6 1. Colour, Hazen Unit Hazen Units <5 <5 <5
2. Odour - Unobjectionable Unobjectionable Unobjectionable
3. Turbidity NTU <1 <1 3
4. pH value - 8.3 7.8 7.4
5. Total Hardness (as CaCO3) mg/l 231 236 600
6. Iron (as Fe) mg/l <0.01 0.06 <0.01
7. Chlorides (as Cl) mg/l 12 16 192
8. Fluoride (as F) mg/l 1.3 0.7 1.4
9. Dissolved solids mg/l 450 316 1174
10. Magnesium (as Mg) mg/l 30 39 100
11. Calcium (as Ca) mg/l 42 30 74
12. Copper (as Cu) mg/l <0.01 <0.01 <0.01
13. Manganese (as Mn) mg/l <0.01 0.04 0.1
14. Sulphate (as SO4) mg/l 49 30 190
15. Nitrate (as NO3) mg/l 7 4 10
16. Phenolic Compds. (as C6H5OH) mg/l <0.001 <0.001 <0.001
17. Mercury (as Hg) mg/l <0.001 <0.001 <0.001
18. Cadmium (as Cd) mg/l <0.01 <0.01 <0.01
19. Selenium (as Se) mg/l <0.005 <0.005 <0.005
20. Arsenic (as As) mg/l <0.005 <0.005 <0.005
21. Cyanide (as CN) mg/l <0.01 <0.01 <0.01
22. Lead (as Pb) mg/l <0.01 0.02 0.03
23. Zinc (as Zn) mg/l <0.01 0.03 0.03
24. Anionic detergents, (MBAS) mg/l <0.01 <0.01 <0.01
25. Chromium (as Cr+6) mg/l <0.01 <0.01 <0.01
26. Mineral Oil mg/l <0.01 <0.01 <0.01
27. Alkalinity (as CaCO3) mg/l 318 219 458
28. Aluminium (as Al) mg/l <0.02 <0.02 <0.02
29. Boron (as B) mg/l <1 <1 <1
30. Sodium (as Na) mg/l 65 15 151
31. Potassium (as K) mg/l 6 1 6
32. MPN Coliform/ 100 ml Organisms/ 100 ml 141 No growth No growth
33. Test for detection of E.coli - Negative - -

Project Title : EIA Study for Development of Industrial Estate of HSIIDC at Sec-37 & Sec-3 Extn, Ph-III, Karnal Project No. : 21-1041/2007-IA.III Contract No. : HSIA: K:2007:1315 dt.09.10.2007 Page 100 of 184
Shriram Institute for Industrial Research: Delhi
Table – 3.5 (m) Detailed Analysis Results of water (SW-1) Sl. Parameters Units Location Code
SW-1 1. Colour, Hazen Unit HU <5
2. Odour - Unobjectionable
3. Turbidity NTU <1
4. pH value - 8.4
5. Total Hardness (as CaCO3) mg/l 95
6. Iron (as Fe) mg/l 1.0
7. Chlorides (as Cl) mg/l 4
8. Fluoride (as F) mg/l 0.1
9. Dissolved solids mg/l 148
10. Magnesium (as Mg) mg/l 6
11. Calcium (as Ca) mg/l 28
12. Copper (as Cu) mg/l 0.02
13. Manganese (as Mn) mg/l 0.01
14. Sulphate (as SO4) mg/l 34
15. Nitrate (as NO3) mg/l 8
16. Phenolic Compds. ( C6H5OH) mg/l <0.001
17. Mercury (as Hg) mg/l <0.001
18. Cadmium (as Cd) mg/l <0.01
19. Selenium (as Se) mg/l <0.005
20. Arsenic (as As) mg/l <0.005
21. Cyanide (as CN) mg/l <0.01
22. Lead (as Pb) mg/l 0.02
23. Zinc (as Zn) mg/l 0.04
24. Anionic detergents, (MBAS) mg/l <0.01
25. Chromium (as Cr+6) mg/l <0.01
26. Mineral Oil mg/l <0.01
27. Alkalinity (as CaCO3) mg/l 71
28. Aluminium (as Al) mg/l <0.02
29. Boron (as B) mg/l <1
30. Sodium (as Na) mg/l 8
31. Potassium (as K) mg/l <1
32. COD mg/l <2
33. BOD5d/20°C mg/l <1
34. MPN Coliform/ 100 ml Organisms 23
35. Test for detection of E.coli - Negative

Project Title : EIA Study for Development of Industrial Estate of HSIIDC at Sec-37 & Sec-3 Extn, Ph-III, Karnal Project No. : 21-1041/2007-IA.III Contract No. : HSIA: K:2007:1315 dt.09.10.2007 Page 101 of 184
Shriram Institute for Industrial Research: Delhi
3.6 Wastewater Collection & Treatment It is assumed that the General Industries would come up in the area and as such all the planning & designing has been proposed accordingly. (a) Guidelines for planning of sewerage (i) Design criteria
The system will be designed as per the guidelines laid in the Manual of Water Supply & Sewerage published by Ministry of Urban Development, Govt. of India.
♦ The industries would treat their total wastewater to the extent to make it fit to be discharged into the Public Sewer as per guidelines laid in manual.
♦ The bigger plot holders (higher than 1 acre) shall treat at least 30% of the discharge to the extent of tertiary level treatment for the use as recycled water for air conditioning, horticulture & additional industrial demand.
♦ The site of Common Effluent Treatment Plant has been proposed in land marked for utilities in Sector-37, where as the effluent generated from sector – 3 extn is proposed to be discharged into the existing ETP of PWD (P.H.) at Karnal.
♦ The horticulture demand of water shall be met by recycling of wastewater up to tertiary treatment level.
(ii) Salient Features are summarized below:
♦ It is assumed that 75% of water supplied will find its way into sewerage system excluding horticulture demand.
♦ Peak flow during morning & evening hours will be 3 times the average flow. ♦ Peak flow in the main sewers will be 3 times the average flow. ♦ Infiltration of ground water is taken @ 25% of average flow. ♦ The spacing of manholes is based on plot width and their zoning. (iii) Summary of the waste water generation by proposed project
♦ The total generation of treated wastewater for re-circulation of sector – 37 has been worked out to be 0.10 M3/ Sec. This will be supplied to the industries, so that water usage can be minimized to a larger extend.
♦ As mentioned earlier, the wastewater generated at Sector – 3 extn. Will be sent to STP at Karnal for treatment.
♦ Water consumption as per standard practice will be 18000 litre/ acre/ per day. This figure can vary with respect to the type f industry that will be coming up in the area. It is estimated that 75 % of the water will come out as wastewater, which will be roughly 13500 litre / acre per day.
(b) Design of Wastewater Collection System
(i) Design Parameters
The parameters to be followed for the design and operation of wastewater collection network and appurtenances have been presented in following table:

Project Title : EIA Study for Development of Industrial Estate of HSIIDC at Sec-37 & Sec-3 Extn, Ph-III, Karnal Project No. : 21-1041/2007-IA.III Contract No. : HSIA: K:2007:1315 dt.09.10.2007 Page 102 of 184
Shriram Institute for Industrial Research: Delhi
Table-3.6 (a) Design parameters for wastewater collection network Sl. Description Design Criteria 1. Type of collection system separate system for wastewater & storm water 2. Design period ♦ 30 years for sewers & appurtenances
♦ 15 years for pumps & electric equipments 3. Wastewater flow 75% use of water supplied 4. Peak factor 3 5. Self cleansing velocity 0.60 m/s 6. Scouring velocity 3.00 m/s 7. Flow conditions in pipe 0.8 full running 8. Minimum size of pipe 300 mm 9. Minimum depth of sewer 0.9 M from formation level 10. Infiltration factor Add 25% of average discharge (for subsoil saturation conditions etc.) 11. Hydraulic formula for calculation
for design of sewer lines Manning’s formula V = 1/n (S2/3 S1/2) V = Velocity, R = Hydraulic mean depth (A/P), S = Slope
12. Manning’s Coefficient ‘n’ 0.013 13. Shape of sewers Circular 14. Material of Sewers SW pipe class A upto 600 mm & RCC pipe NP4 above 600 mm &
above with black coating inside 15. Location of sewers on roads One side of road
The other side connections shall be made through service manholes/ lamp holes before lying of roads
The collection system shall be designed for 3 times average discharge, which is proposed to be treated within the plots and recycled.
(c) Wastewater Treatment
Waste water treatment is the process by which the majority of the contaminants can be removed from wastewater or sewage so that treated water can be suitable disposed off at designated landuse. To be effective, sewage must be conveyed to a treatment plant by appropriate pipe and conveyance system. The adequacy study must be carried out to ensure the effectiveness of process and infrastructure to treat the sewage and effluent to meet the regulatory compliance.
(d) Industrial water treatment
Water treatment is required to treat industrial water for various applications like heating, cooling, processing, cleaning, etc. so that operating cost and risks are reduced. The industrial water treatment can be classified into following categories: ♦ Boiler water treatment ♦ Cooling water treatment ♦ Wastewater treatment
In many cases, effluent water from one process might be suitable for reuse in another process somewhere else in the site. With the adequate treatment, a significant proportion of industrial on-site wastewater can be reused. The optimization of water usage in this way will not only helps in reduction in effluent discharge but also facilitate in reduction in resource consumption. The treatment processes must be selected on the basis of composition, characteristics and concentration of materials present in solution or suspension. The processes are classified as pretreatment, preliminary, primary, secondary or tertiary treatment depending on type, sequence and method of removal of harmful and unacceptable constituents. Pretreatment processes equalizes flow & loading and precondition wastewater to neutralizes or remove toxics and industrial wastes that could adversely affect sewers or inhibit operational performance. ♦ Preliminary treatment processes protect plant mechanical equipment; remove extraneous
matter such as grit, trash and debris, reduce odors and render incoming sewage more amenable to subsequent treatment and handling.
♦ Primary treatment involves mechanical and physical unit processes to separate and remove floatable and suspended solids prior to biological treatment.

Project Title : EIA Study for Development of Industrial Estate of HSIIDC at Sec-37 & Sec-3 Extn, Ph-III, Karnal Project No. : 21-1041/2007-IA.III Contract No. : HSIA: K:2007:1315 dt.09.10.2007 Page 103 of 184
Shriram Institute for Industrial Research: Delhi
♦ Secondary treatment utilizes aerobic microorganisms in biological reactors to feed on dissolved and colloidal organic matter. Microorganisms facilitates the digestion of organic matter and consequently reduction in BOD & Suspended Solids and thus forms the organic flocs which can be removed in settling tank.
♦ Tertiary treatment or advanced treatment facilitates in removal of specific residual
substances, trace organic materials, nutrients and other constituents that can not be removed by biological process.
(e) Characteristics of Composite Untreated Effluent The expected characteristics of composite equalized untreated/ raw effluent containing both industrial and domestic wastewater are given in following table:
Table-3.6 (b) Characteristics of composite untreated effluent
Sl. Parameter Values 1. pH 6.0-8.5 2. Total Suspended Solids, mg/l 250 –500 3. Chemical Oxygen Demand (COD), mg/l 800-1000 4. Biochemical Oxygen Demand (BOD3/27°C), mg/l 400-500 5. Oil & grease, mg/l 40-50 The Common Effluent Treatment Plant would have following treatment units:
− Screen Chamber − Oil cum grease removal traps − Grit removal system/ pre-settlers − Pump House-1 − Equalization Tank − Chemical house-chemical store, solution tanks & dosing pumps − Flash mixing tanks − Flocculation Tank − Primary clarifier − Aeration Tank − Secondary clarifier − Return Activated Sludge (RAS) Pump House-2 − Sludge handling system-Filter Press − Tertiary Treatment Pump House-3 − Dual Media Pressure Filters − Wet sludge pit and Pump House-4 − Dry Sludge Storage
♦ The combined effluent from contributing units shall be conveyed under gravity flow through sewer lines approaching to CETP area. A sluice gate shall be provided in the main inlet channel. Effluent shall pass through bar screen (manual cleaned) for removal of coarse floating matter. Bar screens would be cleaned regularly in order to prevent surge in level / accumulation of influent into the sewers. The effluent shall enter into wet well and pumped into elevated receiving chamber followed by oil & grease traps. The pumps shall be fitted with online flow meters and linked to level controllers with automatic shut down functions. Equalization tank of sufficient capacity to be provided to dampen the variations in terms of volume and strength and to achieve consistent effluent quality in downstream processes.
♦ The combined effluent from equalization tank would flow under gravity into three stage flash mixer followed by flocculation tank. Chemical solutions such as ferrous sulphate and lime are to be added in the first two flash mixer and poly-electrolyte solution into the flocculation tank with the help of dosing pumps attached to chemical dosing tanks. Mixing in dosing tanks and flash mixers shall be done through mixers.

Project Title : EIA Study for Development of Industrial Estate of HSIIDC at Sec-37 & Sec-3 Extn, Ph-III, Karnal Project No. : 21-1041/2007-IA.III Contract No. : HSIA: K:2007:1315 dt.09.10.2007 Page 104 of 184
Shriram Institute for Industrial Research: Delhi
♦ The chemicals with effluent get completely mixed by rapid mixing in flash mixers whereas slow mixing in flocculation tank allows formation of bigger size flocs which facilitates the rapid settling in primary clarifier. The pH of the mixture of ferrous sulphate and effluent in flash mixer has to be maintained around 8.5 by adjusting dosing of lime solution.
♦ After floc formation, this mixture enters into primary clarifier where sludge settles at
bottom and the clear effluent collected through launders flows into aeration tank. The sludge from the primary clarifier is withdrawn into wet sludge pit with the help of valve provided in the valve chamber.
♦ In addition to colour and suspended solids removal, physico-chemical treatment would
remove about 20% of BOD load of raw effluent. The remaining portion of soluble BOD & COD load (organic material present in effluent) would be removed by biological treatment process.
♦ The chemically treated effluent from primary clarifier would be subjected to aerobic
biological treatment (activated sludge process) in the aeration tank for removal of residual BOD & COD load up to a desired level. Activated sludge process (ASP) involves the oxidation of biodegradable matter into carbon dioxide, water and bio-cell mass. The cell mass concentration in the aeration chamber is maintained at required level by optimizing the flow rate of sludge recycling from the secondary clarifier. Proper mixing of bio-cell mass with the effluent and necessary oxygen supply for oxidation of bio-degradable matter by aerobic bio-mass in aeration tank is done by means of Activated sludge process with fixed type mechanical surface aerators.
♦ The biological activities of microbes requires nutrients i.e nitrogen and phosphorous which
are vital for the growth of new cells in the effluent. The required DAP and urea shall be added for this purpose. The mixture of treated effluent and bio-mass from the aeration tank would flow into secondary clarifier for separation of bio-mass in the form of sludge. The settled active bio-mass at the bottom of secondary clarifier would be swept by mechanical scrapper into a sludge well provided at the central position of clarifier.
♦ The sludge slurry has to be collected under gravity into RAS pump sump, where from active
sludge would be recycled into the aeration tank with the help of pumps so as to maintain the required degree of MLVSS and excess part (waste sludge) would be sent into wet sludge collection pit.
♦ The treated effluent water over flowing from secondary clarifier outlet launder shall pass through a long channel fitted with 90° V-notch for flow measurement and then it would be collected into Tertiary Treatment pump house for filtration.
♦ The treated effluent would meet the effluent discharge standards as shown in following table subject to compliance with following:
− The implementation of treatment scheme in totality (CETP units matching with sizes, shapes/ configuration as per the Technical Feasibility Report).
− Total daily discharge of untreated effluent (combined influent to CETP) does not exceed 4.5 MLD (4500 m3/d).
− Regular operation of plant − Adequacy study of plant
Table-3.6 (c) Effluent discharge criteria Sl. Parameters Value 1. pH 6.5-9.0 2. Total Suspended Solids, mg/l 100, max 3. Chemical Oxygen Demand (COD) 250, max 4. Biochemical Oxygen Demand (BOD3/27°C), mg/l 30, max 5. Oil & grease, mg/l 10, max 6. Sulphates (as SO4), mg/l 1000, max 7. Total chromium (as Cr), mg/l 2.0, max 8. Phenolic Compounds (as C6H5OH), mg/l 1.0, max
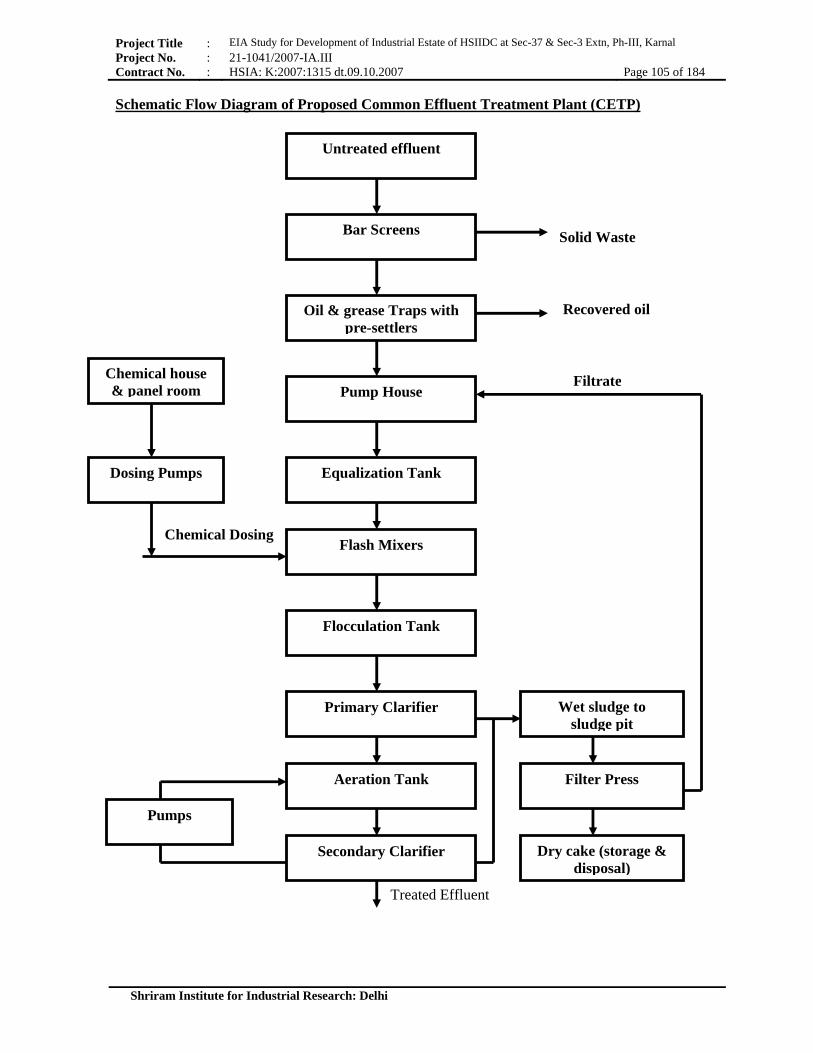
Project Title : EIA Study for Development of Industrial Estate of HSIIDC at Sec-37 & Sec-3 Extn, Ph-III, Karnal Project No. : 21-1041/2007-IA.III Contract No. : HSIA: K:2007:1315 dt.09.10.2007 Page 105 of 184
Shriram Institute for Industrial Research: Delhi
Schematic Flow Diagram of Proposed Common Effluent Treatment Plant (CETP)
Chemical Dosing
Filtrate
Treated Effluent
Untreated effluent
Bar Screens
Oil & grease Traps with pre-settlers
Pump House
Equalization Tank
Flash Mixers
Flocculation Tank
Primary Clarifier
Aeration Tank
Secondary Clarifier
Wet sludge to sludge pit
Filter Press
Dry cake (storage & disposal)
Pumps
Dosing Pumps
Chemical house & panel room
Recovered oil
Solid Waste

Project Title : EIA Study for Development of Industrial Estate of HSIIDC at Sec-37 & Sec-3 Extn, Ph-III, Karnal Project No. : 21-1041/2007-IA.III Contract No. : HSIA: K:2007:1315 dt.09.10.2007 Page 106 of 184
Shriram Institute for Industrial Research: Delhi
3.7 Land Environment
Land is a major source of livelihood for the population through agriculture and allied activities. Exponential population growth over the years resulted in more demand for land, water and biological resources, thereby exerting tremendous pressure on land. Every piece of land has its own carrying capacity in terms of assimilation and support. Land is a finite resource and put to many competing uses. It comprises of soils, minerals, water and biota. Agenda 21 of WSSD recognizes the need to allocate land for sustainable uses and promote the integrated planning and management of land resources and emphasizes on the following specific initiatives pertaining to sustainable use of land. (a) Encourage adoption of science-based, and traditional sustainable land use practices
through research and development, pilot scale demonstration, and large scale dissemination, including farmer’s training, and wherever necessary, access to institutional finance.
(b) Promote reclamation of waste land and degraded forest land through formulation and
adoption of multi stakeholder partnerships involving land owning agency, local communities and investors.
(c) Prepare and implement thematic action plans for arresting and reversing desertification. The degradation of land, through soil erosion, alkali salinization, water logging, pollution, and reduction in organic matter content has several proximate and underlying causes. The proximate causes include erosion by surface water run-offs and winds, excessive use of irrigation, improper and indiscriminate use of agricultural chemicals, diversion of animal waste for domestic fuel (leading to reduction in soil nitrogen and organic matter), and disposal of industrial and domestic wastes on productive land. Implicit and explicit subsidies for water, power, fertilizer and pesticides, and absence of conclusive policies and regulatory systems to enhance people’s incentives for afforestation and forest conservation drive these in turn. 3.7.1 Karnal Land Environment: Geography and Geology. Karnal is situated on the G.T. Road, at a distance of 125 KM from Delhi, at 28°41’00” North Latitude and 76°59’00” East Longitude. The Yamuna flows very near to the city at its northern side and moves away as it goes south. Karnal has equal distant from Delhi and Chandigarh. Quarternery Alluvium consisting of sand, clay and silt underlies the major part of Karnal City. In the western and northwestern part of the town, the quartzite ridges of the Delhi system can be observed. Along the Yamuna Flood Plain towards the eastern part of the town, the younger alluvium is mainly sand with a thickness of about 10-15 m. the main water bearing horizons (aquifers) consisting of a sandy layer is generally confined to 60m below ground level. Beyond this depth, alluvium is more clayey and generally aquifers are not potential water sources, eventhough depth of bed rock is more than 200 m. the limited thickness of aquifers further restricts the development of ground water on a large scale. 3.7.2 Land use in the Project Area. Land use area comprising of total geographic area of villages, forestland, area irrigated by source, un-irrigated area, cultivable wasteland and area not available for cultivation, has been extracted from the census record of Karnal district. Study has been carried out in case of villages come under10 km radius of core zone of proposed project activity.

Project Title : EIA Study for Development of Industrial Estate of HSIIDC at Sec-37 & Sec-3 Extn, Ph-III, Karnal Project No. : 21-1041/2007-IA.III Contract No. : HSIA: K:2007:1315 dt.09.10.2007 Page 107 of 184
Shriram Institute for Industrial Research: Delhi
(a) Land – use in 10-km buffer zone of the project area. Total area in the 10 km radius is 25140 ha, out of which 82.80 % land is irrigated by source, where as 4.92 % is un-irrigated area. Culturable wasteland constitutes 2.11 % of the total land, where as 10.17 % area is not available for cultivation.
Table 3.7 (a) Land use in 10 km buffer zone f the project area. Description Area (ha) Percentage of Geographical area. Geographical area 25140 100 % Forest Land - - Irrigated by source 20816 82.80 Un-irrigated Area 1237 4.92 Culturable Waste land 530 2.11 Area not available for Cultivation 2557 10.17 3.7.3 Soil Quality Soil represents the loose and unconsolidated materials derived through the disintegration of rocks. The soil comprises of natural body of animal, mineral and organic constituents differentiated into horizons of variable depth, which differ from the material underneath in morphology, physical make up, chemical properties & composition and biological characteristics. Soil serves as reservoir of nutrients for plants and craps and provide mechanical anchorage too. The impacts of pollutants on soil quality may be rather slow process but it may be a rather slow process, but it may be of greater concern in the long run. The percolation of pollutants may get accumulated in the soil and ultimately affects its quality. (a) Investigation of Soil Quality in the study area. To investigate the existing soil quality in the study area, six samples of soil from different locations were collected to cover important aspects of physical and chemical properties of soil quality therein. Samples were collected as per the following details.
Table – 3.7 (b) Description of Soil quality Sampling Locations. Station Code Location Geo - codes
Latitude Longitude SQ-1 Kambhopura 29°38’12.9” 76°59’02.9” SQ-2 Gangogarhi 29°37’33.4” 77°01’58.0” SQ-3 Bastara 39°34’07.0” 76°59’19.2” SQ-4 Baldi 29°42’56.4” 76°59’22.9” SQ-5 Ghogrpur 29°38’37.4” 76°56’58.8” SQ-6 Dabri 29°41’29.4 76°56’09.8”
(b) Methodology of Investigation (i) Sampling Adopting established sampling procedures given in BIS specifications carried out soil sampling from each strategic point. Undisturbed soil samples, representative of the area as given in Table – 3.7 (b), were collected by means of soil augur. Sub-surface samples were taken at the depth of 15 cm. (ii) Analysis
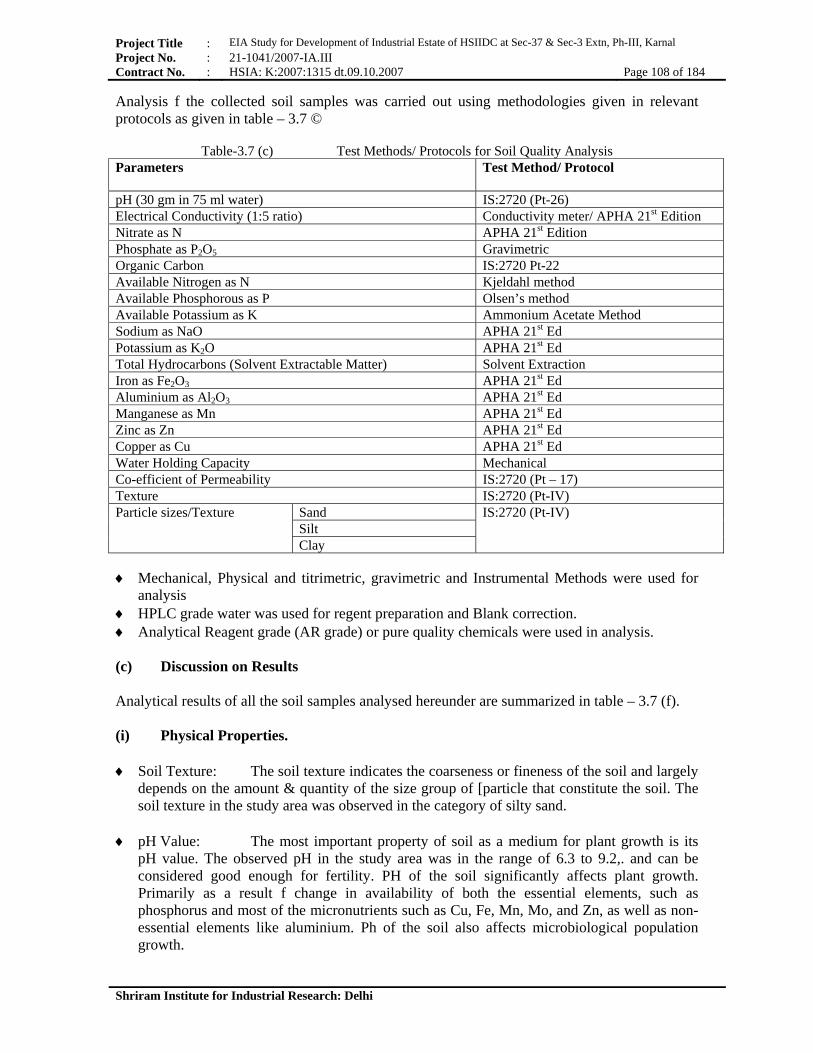
Project Title : EIA Study for Development of Industrial Estate of HSIIDC at Sec-37 & Sec-3 Extn, Ph-III, Karnal Project No. : 21-1041/2007-IA.III Contract No. : HSIA: K:2007:1315 dt.09.10.2007 Page 108 of 184
Shriram Institute for Industrial Research: Delhi
Analysis f the collected soil samples was carried out using methodologies given in relevant protocols as given in table – 3.7 ©
Table-3.7 (c) Test Methods/ Protocols for Soil Quality Analysis Parameters Test Method/ Protocol
pH (30 gm in 75 ml water) IS:2720 (Pt-26) Electrical Conductivity (1:5 ratio) Conductivity meter/ APHA 21st Edition Nitrate as N APHA 21st Edition Phosphate as P2O5 Gravimetric Organic Carbon IS:2720 Pt-22 Available Nitrogen as N Kjeldahl method Available Phosphorous as P Olsen’s method Available Potassium as K Ammonium Acetate Method Sodium as NaO APHA 21st Ed Potassium as K2O APHA 21st Ed Total Hydrocarbons (Solvent Extractable Matter) Solvent Extraction Iron as Fe2O3 APHA 21st Ed Aluminium as Al2O3 APHA 21st Ed Manganese as Mn APHA 21st Ed Zinc as Zn APHA 21st Ed Copper as Cu APHA 21st Ed Water Holding Capacity Mechanical Co-efficient of Permeability IS:2720 (Pt – 17) Texture IS:2720 (Pt-IV) Particle sizes/Texture Sand IS:2720 (Pt-IV)
Silt Clay
♦ Mechanical, Physical and titrimetric, gravimetric and Instrumental Methods were used for
analysis ♦ HPLC grade water was used for regent preparation and Blank correction. ♦ Analytical Reagent grade (AR grade) or pure quality chemicals were used in analysis. (c) Discussion on Results Analytical results of all the soil samples analysed hereunder are summarized in table – 3.7 (f). (i) Physical Properties. ♦ Soil Texture: The soil texture indicates the coarseness or fineness of the soil and largely
depends on the amount & quantity of the size group of [particle that constitute the soil. The soil texture in the study area was observed in the category of silty sand.
♦ pH Value: The most important property of soil as a medium for plant growth is its
pH value. The observed pH in the study area was in the range of 6.3 to 9.2,. and can be considered good enough for fertility. PH of the soil significantly affects plant growth. Primarily as a result f change in availability of both the essential elements, such as phosphorus and most of the micronutrients such as Cu, Fe, Mn, Mo, and Zn, as well as non-essential elements like aluminium. Ph of the soil also affects microbiological population growth.
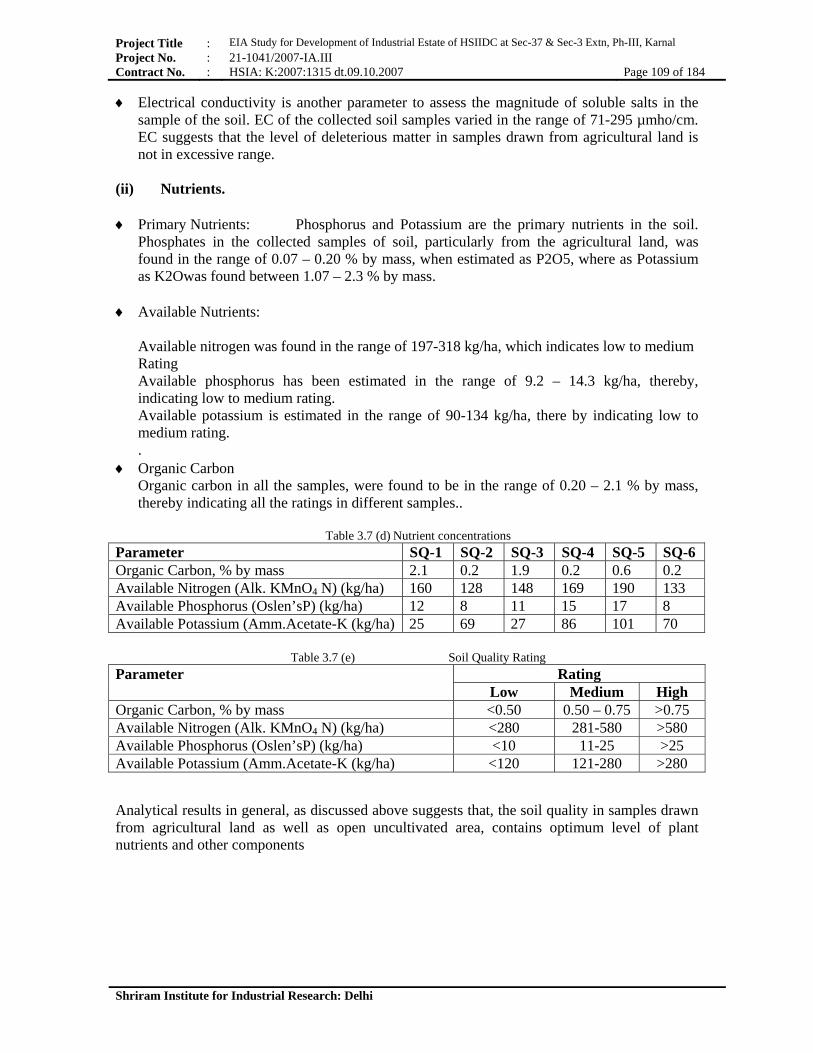
Project Title : EIA Study for Development of Industrial Estate of HSIIDC at Sec-37 & Sec-3 Extn, Ph-III, Karnal Project No. : 21-1041/2007-IA.III Contract No. : HSIA: K:2007:1315 dt.09.10.2007 Page 109 of 184
Shriram Institute for Industrial Research: Delhi
♦ Electrical conductivity is another parameter to assess the magnitude of soluble salts in the sample of the soil. EC of the collected soil samples varied in the range of 71-295 µmho/cm. EC suggests that the level of deleterious matter in samples drawn from agricultural land is not in excessive range.
(ii) Nutrients. ♦ Primary Nutrients: Phosphorus and Potassium are the primary nutrients in the soil.
Phosphates in the collected samples of soil, particularly from the agricultural land, was found in the range of 0.07 – 0.20 % by mass, when estimated as P2O5, where as Potassium as K2Owas found between 1.07 – 2.3 % by mass.
♦ Available Nutrients:
Available nitrogen was found in the range of 197-318 kg/ha, which indicates low to medium Rating Available phosphorus has been estimated in the range of 9.2 – 14.3 kg/ha, thereby, indicating low to medium rating. Available potassium is estimated in the range of 90-134 kg/ha, there by indicating low to medium rating. .
♦ Organic Carbon Organic carbon in all the samples, were found to be in the range of 0.20 – 2.1 % by mass, thereby indicating all the ratings in different samples..
Table 3.7 (d) Nutrient concentrations Parameter SQ-1 SQ-2 SQ-3 SQ-4 SQ-5 SQ-6 Organic Carbon, % by mass 2.1 0.2 1.9 0.2 0.6 0.2Available Nitrogen (Alk. KMnO4 N) (kg/ha) 160 128 148 169 190 133 Available Phosphorus (Oslen’sP) (kg/ha) 12 8 11 15 17 8 Available Potassium (Amm.Acetate-K (kg/ha) 25 69 27 86 101 70
Table 3.7 (e) Soil Quality Rating
Parameter Rating Low Medium High
Organic Carbon, % by mass <0.50 0.50 – 0.75 >0.75 Available Nitrogen (Alk. KMnO4 N) (kg/ha) <280 281-580 >580 Available Phosphorus (Oslen’sP) (kg/ha) <10 11-25 >25 Available Potassium (Amm.Acetate-K (kg/ha) <120 121-280 >280
Analytical results in general, as discussed above suggests that, the soil quality in samples drawn from agricultural land as well as open uncultivated area, contains optimum level of plant nutrients and other components
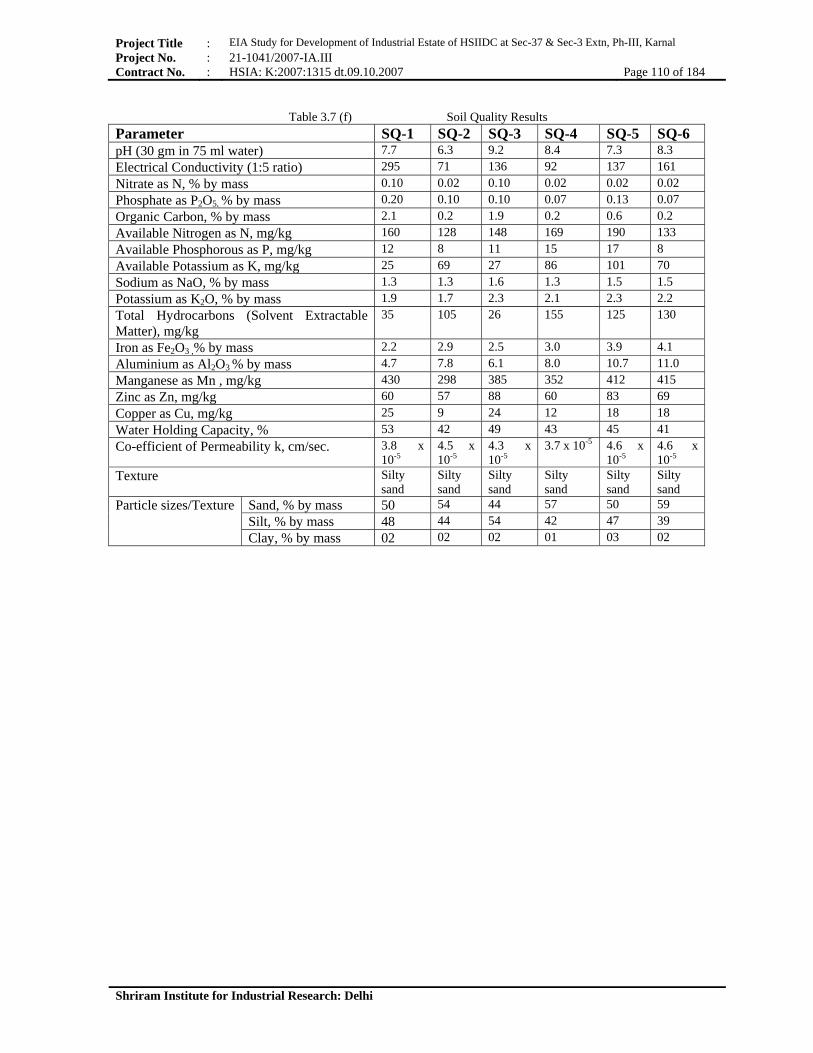
Project Title : EIA Study for Development of Industrial Estate of HSIIDC at Sec-37 & Sec-3 Extn, Ph-III, Karnal Project No. : 21-1041/2007-IA.III Contract No. : HSIA: K:2007:1315 dt.09.10.2007 Page 110 of 184
Shriram Institute for Industrial Research: Delhi
Table 3.7 (f) Soil Quality Results
Parameter SQ-1 SQ-2 SQ-3 SQ-4 SQ-5 SQ-6 pH (30 gm in 75 ml water) 7.7 6.3 9.2 8.4 7.3 8.3 Electrical Conductivity (1:5 ratio) 295 71 136 92 137 161 Nitrate as N, % by mass 0.10 0.02 0.10 0.02 0.02 0.02 Phosphate as P2O5, % by mass 0.20 0.10 0.10 0.07 0.13 0.07 Organic Carbon, % by mass 2.1 0.2 1.9 0.2 0.6 0.2 Available Nitrogen as N, mg/kg 160 128 148 169 190 133 Available Phosphorous as P, mg/kg 12 8 11 15 17 8 Available Potassium as K, mg/kg 25 69 27 86 101 70 Sodium as NaO, % by mass 1.3 1.3 1.6 1.3 1.5 1.5 Potassium as K2O, % by mass 1.9 1.7 2.3 2.1 2.3 2.2 Total Hydrocarbons (Solvent Extractable Matter), mg/kg
35 105 26 155 125 130
Iron as Fe2O3 ,% by mass 2.2 2.9 2.5 3.0 3.9 4.1 Aluminium as Al2O3 % by mass 4.7 7.8 6.1 8.0 10.7 11.0 Manganese as Mn , mg/kg 430 298 385 352 412 415 Zinc as Zn, mg/kg 60 57 88 60 83 69 Copper as Cu, mg/kg 25 9 24 12 18 18 Water Holding Capacity, % 53 42 49 43 45 41 Co-efficient of Permeability k, cm/sec. 3.8 x
10-5 4.5 x 10⁻⁵
4.3 x 10⁻⁵
3.7 x 10⁻⁵ 4.6 x 10⁻⁵
4.6 x 10⁻⁵
Texture Silty sand
Silty sand
Silty sand
Silty sand
Silty sand
Silty sand
Particle sizes/Texture Sand, % by mass 50 54 44 57 50 59 Silt, % by mass 48 44 54 42 47 39 Clay, % by mass 02 02 02 01 03 02

Project Title : EIA Study for Development of Industrial Estate of HSIIDC at Sec-37 & Sec-3 Extn, Ph-III, Karnal Project No. : 21-1041/2007-IA.III Contract No. : HSIA: K:2007:1315 dt.09.10.2007 Page 111 of 184
Shriram Institute for Industrial Research: Delhi
3.8 Socio-Economic Environment
3.8.1 Context Impact on socio-economic environment in the vicinity of any project, revolves around the mode of change that is likely to occur due to the beneficial and adverse effects arising out of the project activity. Generally, implementation of project activities result in a change in socio-economic profile of the surrounding area due to change in land use pattern, operation and maintenance of the project, change in the occupational pattern of the local residents, boost in the local economy due to employment opportunities, increased business, improved infrastructure etc. Due to the change basic amenities needs improvement so as to keep pace with the industrial development. The present study has been conducted to visualize and predict the impact on the socio economic environment due to the proposed development of the industrial estate of HSIIDC at Industrial estate Karnal. Efforts have been made to assess the existing socio-economic status of the study area, which will help in suggesting a viable Environment Management Plan, so as to mitigate the adverse impacts, if any, on the socio-economic environment. Therefore assessment of such an impact calls for collection of the baseline on the socio-economic profile. 3.8.2 Baseline Information As an integral part of the EIA study, baseline information is collected to define the socio-economic profile of the study area. In order to assess socio-economic status in the project area, study has been carried out in core zone and within 10-km radius of the core zone thereby representing the buffer zone of the proposed project activity. The database of human interest thus collected (based on Census-2001) includes following attributes:
♦ Demographic structure viz. number of house holds, total population, scheduled caste & scheduled tribes fraction of the population, literacy rate and occupational status.
♦ Provision of basic amenities.
♦ Baseline health and medical facilities.
All the information, as indicated above, has been retrieved from Census of India-2001 as well as Statistical Handbooks of the area.
3.8.3 Demographic Structure
The salient features of demographic structure in the project area are described below:
(a) Population
Total population in the buffer zone (10 km radius) is 126680 comprising of 68316 males & 58364 females. Population of <6 years category is 20257 comprising of 11098 males and 9159 females.
Table-3.8 (a) Population profile in the study area Land use representing Study area
No. of Households
Total Population
Total Male
Total Female
Population <6 years
Male <6 years
Female <6 years
Project Area (Buffer Zone) 10-km radius of core zone
22,115 1,26,680 68,316 58,364 20,257 11,098 9,159
Karnal District Rural - 9,36,341 - - - - -
Urban - 3,37,842 - - - - -
Total 2,24,230 1274183 6,83,368 5,90,815 1,30,815 - -

Project Title : EIA Study for Development of Industrial Estate of HSIIDC at Sec-37 & Sec-3 Extn, Ph-III, Karnal Project No. : 21-1041/2007-IA.III Contract No. : HSIA: K:2007:1315 dt.09.10.2007 Page 112 of 184
Shriram Institute for Industrial Research: Delhi
(b) Sex Ratio
♦ Sex Ratio in the study area (buffer zone of proposed project) is estimated 854 females per 1000 males. In case of population <6 years, it has been found 825 females per 1000 males.
♦ Sex Ratio in entire Karnal district has been found 865 females per 1000 males in case of total population and 808 females per 1000 males in case of population <6 years.
♦ As per the Census-2001, Sex Ratio in Haryana has been estimated 861 and that in case of India it has been estimated 933.
Table-3.8 (b) Sex Ratio in the study area Land use Sex Ratio (No. of females/ 1000 males)
Total Population Population <6 yrs 10-km radius of core zone of project area 854 825 Karnal District 865 808 Haryana 861 - India 933 -
(c) SC & ST Population Population of schedule castes in the buffer zone of the project area is 21.1% of total population, whereas there is no population in the category of schedule tribe. SC population in the entire Karnal district has been estimated as 14.2%.
Table-3.8 (c) Trend of SC/ST population in the study area Landuse Population of SC/ST vis-a-vis total population
SC (%) ST (%) 10-km radius of core zone of project area 21.1 0 Karnal District 14.2 0
(d) Literacy Rate (LR) Literacy Rate in the study area was estimated as 67.79%. Male LR was estimated 82.03 % whereas female LR has been found 51.15%. The overall Literacy Rate in the study area has been found higher than that of India but lower than that of Haryana State and Faridabad district.
Table-3.8 (d) Trend of Literacy Rate (LR) in the study area Land use No. of Literate Literacy Rate
Person Male Female Person Male Female 10-km radius 100846 65760 35086 67.79 82.03 51.15 Karnal District 1269801 986913 826336 70.03 81.52 56.31 Haryana 12225036 7558443 4666593 68.59 79.25 56.31 India 566714995 339969048 226745947 65.38 75.85 54.16 (e) Population Density Population Density (PD) of the study area (within 10 km radius of the core zone) has been estimated 717, whereas same in the Karnal district (rural) has been observed 667.
Table-3.8 (e) Population Density in the project area Land use Population Density per sq.km 10-km radius of core zone of project area 717 Karnal District (Rural) 667

Project Title : EIA Study for Development of Industrial Estate of HSIIDC at Sec-37 & Sec-3 Extn, Ph-III, Karnal Project No. : 21-1041/2007-IA.III Contract No. : HSIA: K:2007:1315 dt.09.10.2007 Page 113 of 184
Shriram Institute for Industrial Research: Delhi
(f) Work Participation Rate (WPR) Work is the participation in any economical productive activity. Work may be physical or mental in nature. It involves not only actual work but also effective supervision and direction of work. Work may be paid or unpaid. Percentage of working population to the total population is termed as “Work Participation Rate” (WPR). The summary of workers in the study zone is given as below:
Total Workers ♦ Main workers and marginal workers are together called the total workers. Main Worker ♦ A person who has worked for a major part of the year preceding the date of enumeration i.e.
one who was engaged in any economically productive activity for six months or more, in the previous year.
Marginal Worker
♦ A person who has done some work in the year proceeding the date of enumeration but does not qualify to be called a ‘main worker’. Period of work is less than six months.
Non Worker
♦ A person who has not worked at all in the year preceding the date of enumeration WPR in Project Area WPR in the buffer zone (10-km radius of core zone) of proposed project area is estimated, as 47.9%, while WPR in case of males is 58.0% that in case of females is 36.0%.
Table-3.8 (f) Trend of WPR in the study area Land use Work Participation Rate (WPR) %
Person Male Female 10-km radius of core zone of project area 47.9% 58.0% 36.0% Karnal District 43.3% 58.4% 25.3% Occupation Structure in the Project Area Main workers form 71.8 % of the total workers, whereas 28.2% are marginal workers in the buffer zone (10 km radius of the core zone of project area)
Table- 3.8 (g) Occupation Structure in the Project Area Land use Total Workers Main Workers Marginal Workers
Person Male Female Person Male Female Person Male Female10-km radius of core zone of project area
71205 46498 24707 51111 38155 12956 20094 8343 11751
Karnal District
785762 576478 209284 609663 504791 104872 176099 71687 104412
3.8.4 Amenities available in the study area: The basic amenities like Roads, Communication, Electricity, Education, Medical, Drinking water etc. are the main indicators of development in any region. The amenities available in the area under present study are described as under:

Project Title : EIA Study for Development of Industrial Estate of HSIIDC at Sec-37 & Sec-3 Extn, Ph-III, Karnal Project No. : 21-1041/2007-IA.III Contract No. : HSIA: K:2007:1315 dt.09.10.2007 Page 114 of 184
Shriram Institute for Industrial Research: Delhi
(a) Connectivity
Since most of the study has the closer proximity to urban areas, it has better connectivity through all modes.
(b) Power
Entire study area is covered with Power supply both in rural as well as urban area.
(c) Post & Telegraph and Telephone
There is a good network of communication modules in the study area. With telecommunication revolution numbers of landline and mobile telephone subscribers are rapidly increasing.
(d) Drinking water
Entire study area, both rural and urban, is covered with water supplies.
(e) Educational Facilities
Entire study area, both rural and urban, has educational facilities.
(f) Medical Facilities
Medical facilities are accessible to entire population in the project area.
3.8.5 Development of Socio-economic Index
Environmental-media-index development is considered as an excellent management and general administrative tool in communicating the information pertaining to various aspects using common scale. The objective of index development is to have a means of “describing various indicators as an overall entity” on a predefined scale, rather than in terms of series of attributes having variable units of expression. Socio-economic Index (ISE) based on secondary data (mainly census-2001).Attributes considered for development of (ISE) of present study, on spatial framework of villages in the project area, included following but not limited to ♦ Population Density ♦ Sex Ratio ♦ Literacy Rate ♦ WPR ♦ Education ♦ Water Supply ♦ Communication ♦ Connectivity ♦ Power Supply ♦ Medical Facilities Steps for Socio-economic Index Development Step-1 (i) Formation of sub-indices (S1, S2, ………. Sn) for the ‘n’ indicators, variables (X1, X2,
…………., Xn) using sub-index using designated weight Si = Wi for Xi where i = 1,2, ..........., n.
(ii) Sub–indices (Si) thus, formed can be aggregated together in a second mathematical form
called aggregated index or combined index as: S = f (S1, S2, …………. Sn)

Project Title : EIA Study for Development of Industrial Estate of HSIIDC at Sec-37 & Sec-3 Extn, Ph-III, Karnal Project No. : 21-1041/2007-IA.III Contract No. : HSIA: K:2007:1315 dt.09.10.2007 Page 115 of 184
Shriram Institute for Industrial Research: Delhi
This aggregate operation function ‘f’ is usually a summation process. Step-2 Calculation of Aggregate or combined index Once the sub – indices are formed, they are combined or aggregated in a simple addition form:
1 n ISE = ---- ∑ Si n i=1,2,….. n
Scale for Socio-economic Index Development (attributes wise)
Table-3.8 (h) Scale for Socio-economic Index Development (Population Density & Sex Ratio)
Attributes Range Weight Attributes Range Weight Population Density (PD)
<100 10 Sex Ratio (SR) <910 1 100-200 9 910-920 2 200-300 8 920-930 3 300-400 7 930-940 4 400-500 6 940-950 5 500-600 5 950-960 6 600-700 4 960-970 7700-800 3 970-980 8 800-900 2 980-990 9
>900 1 >990 10
Table-3.8 (i) Scale for Socio-economic Index Development (Literacy Rate, Amenities & WPR) Attributes Range
(%) Weight Attributes Range (%) Weight Attributes Range
(%) Weight
Literacy Rate (LR)
<40 1 Amenities ♦ Education (E) ♦ Medical Facility (M) ♦ Water Supply (W) ♦ Communication (C) ♦ Transportation (T) ♦ Connectivity (CN) ♦ Power Supply (P)
90-100 10 WPR 90-100 10 40-45 2 80-90 9 80-90 9 45-50 3 70-80 8 70-80 8 50-55 4 60-70 7 60-70 7 55-60 5 50-60 6 50-60 6 60-65 6 40-50 5 40-50 5 65-70 7 30-40 4 30-40 4 70-75 8 20-30 3 20-30 3 75-80 9 10-20 2 10-20 2 >80 10 <10 1 <10 1
Table-3.8 (j) Socio-economic Index Matrix
1 --- ∑ Wi n
Ranking
Rating Remarks
>9 A1 Excellent to Very good Almost Everything in good condition >8 to ≤9 A2 >7 to ≤8 B1 Good to Moderate Still needs betterment in few areas >6 to ≤7 B2 >5 to ≤6 C1 Average Needs betterment in almost all the areas >4 to ≤5 C2 >3 to ≤4 D1 Poor Needs specific attention >2 to ≤3 D2 >1 to ≤2 E1 Alarming Alert areas
≤1 E2

Project Title : EIA Study for Development of Industrial Estate of HSIIDC at Sec-37 & Sec-3 Extn, Ph-III, Karnal Project No. : 21-1041/2007-IA.III Contract No. : HSIA: K:2007:1315 dt.09.10.2007 Page 116 of 184
Shriram Institute for Industrial Research: Delhi
Table-3.8 (k) Socio-economic Index in the Project Area Attribute wise Sub-indices (Si) Weight
(10-km radius of core zone of proposed project) Population Density (SPD) 3 Sex Ratio (SSR) 1 Literacy Rate (SLR) 7 Work Participation Rate (SWPR) 5 Education (SE) 10 Medical Facility (SM) 10 Water Supply (SW) 10 Communication (SC) 10 Connectivity (SCN) 10 Power Supply (SP) 10 ∑WI 76 1 ISE = --- ∑Wi n
7.6
Socio-economic index of project area based on various socio-economic indicators as stated above indicates the index value 7.6, which describes the socio-economic rating as “Good (B1)”.

Project Title : EIA Study for Development of Industrial Estate of HSIIDC at Sec-37 & Sec-3 Extn, Ph-III, Karnal Project No. : 21-1041/2007-IA.III Contract No. : HSIA: K:2007:1315 dt.09.10.2007 Page 117 of 184
Shriram Institute for Industrial Research: Delhi
3.9 Biological Environment 3.9.1 Context Study of biological environment is an important aspect of Environment Impact Assessment study in view of the need for conservation of environmental quality. Ecological system consists of varieties of interrelationship between both biotic and abiotic components including dependence, competition and mutualism. Biotic components comprise of both plant and animal communities, which interact not only within and between themselves but also within the abiotic-physical and chemical components of the environment. A biological community depends on the condition and resources of its location. Variables like temperature, humidity, atmospheric conditions, soil quality and topographical features are responsible for maintaining the homeostasis of the environment and change in any one of the variables may lead to stresses on the ecosystem. Animal and plant communities in their natural habitat exist in a well-organized manner. This natural setting may be disturbed by any external, man induced or nature induced influences. Plants and animals are more susceptible to environmental stresses. These changes in the composition of biotic communities are reflected as a change in the distribution pattern, diversity, dominance of the natural species of flora and fauna existing in the ecosystem. Major component of Biological Environment is bio-diversity, which can be defined as “the variability among living organisms from all sources, including terrestrial and other aquatic ecosystems and the ecological complexes of which they are a part; this includes diversity within species, between species and of ecosystems”. Conservation and sustainable use of bio-diversity is fundamental to ecologically sustainable development. Bio-diversity is part of our daily lives and livelihood, and constitutes resources upon which families, communities, nations and future generations depend. An environment rich in biological diversity, therefore, offers the broadest array of options for sustainable economic activity, for sustaining human welfare and for adapting to change. Loss of bio-diversity has serious economic and social costs for any nation. 3.9.2 Biological Impact Assessment The structures, functions and distributions of plant and animal communities can be utilized to assess the impact of the project on flora and fauna of the region, which are important components of land and aquatic ecology. Conservation strategies of biological diversity can be achieved if the baseline condition of the area is studied and understood. The proposed project site has been surveyed physically as well as by study of toposheet to establish the status of the biological environment of the study area. The study area mainly comprised of a plane land surrounded by the agriculture land. The forest area is almost negligible in the buffer zone (10 km radius of the proposed site). Patches of thorny bushes along with the natural vegetation can be seen scattered around the area. There are plantation developed by forest department at some places and along the roadside. Some other private plantation is also available in the region. 3.9.3 Wild Life Management in Karnal The Government of Haryana framed rules under the wild-life (Protection) Act 1972 in 1973 for the protection of wild-life in the state. The wild life is managed by the wild-life department of the state. Wild life area were managed by Wild Life Department on year to year. Working scheme depending on availability of budget and specific requirement of management. 3.9.4 National Park There is no wild life sanctuary and national park in this division.

Project Title : EIA Study for Development of Industrial Estate of HSIIDC at Sec-37 & Sec-3 Extn, Ph-III, Karnal Project No. : 21-1041/2007-IA.III Contract No. : HSIA: K:2007:1315 dt.09.10.2007 Page 118 of 184
Shriram Institute for Industrial Research: Delhi
3.9.5 Wet Lands Wet lands are one of the major components of our ecosystem and play an important role in maintaining it. They not only serve as a feeding ground for water and water side birds but also as a source of survival for avifauna and large number of amphibians and reptiles. Haryana’s wet lands are most suitable feeding ground for migratory birds like cranes, geese, teals, flamingoes, pelicans, ducks and several other species. So, in a way wet lands are serving a useful role in preserving the gift of nature for our future generations. Traditionally, wet lands are considered as useless and unproductive and source of survival of our ecosystem. 3.9.6 Floristic Composition (Composition & Condition of the Crop) The floristic composition and species diversity of an area is an important parameter in defining the environmental condition of the area, which support only scrub vegetation because of shallow depth of soil. Soil from these hills has been eroded by water & wind over a period of millions of years. Excessive biotic interference has further reduced the composition & density of forests & these are in last stages of degradation. The forests belongs to Northern Dry Deciduous Forest sub-group. About 90% forest areas are situated along roads canals, drains & flood protection bunds in the shape of linear strips. These strips mainly pass through agricultural fields or wastelands & were part of these lands before its acquisition for the present purpose so there were devoid of natural forest vegetation. 3.9.7 Diversification of Species The species which can be planted in Karnal district apart from Eucalyptus, Kikar & Shisham are given below :
♦ Azadirachta indica (neem), prosopis cineraria (Khajri or Jand), Leucaena lencocephala (su-babul).
♦ Species like Acacia Senegal (khairi/khumber), Anogeissus penduala (dhauro), Azadirachta indica (neem), Cassia nodosa, Cassia siamea, Prosopis juliflora (tree variety) (kabli kikar) can be planted suceessfully. These species fulfil the need for small timber, fodder, firewood, labour, employment & shade.
♦ Beside oringa oleoifera, Melia azedarch (bakain), Cordia myxa (lasura), Zizyphus mortiana Mber) and a few fruit trees like mango, guava etc. can be also tried.
♦ In sandy areas emphasis should be on species like Acacia tortilis (Israeli kikar), Acacia albida, Azadirachta indica (neem), Ailanthus excelsa (motia aduso), Tamarix aphylla (frash), Tecomella acuelata (rohera), & Zizyphus mauritiana (beri).
♦ Species like Bauhinea purpured, Dichrastachya nutans, Caloperspermum mopne & Acacia leucophloea (raunj) can also be tried in the district in general. Many area generally there is thick layer of course sand below 30 cm or so. The following species are recommended for this category of soils – Acacia catechu (khari), Subabul, Mango, Frash, Ber and Poplar.
3.9.8 Injuries to crops is liable to natural agencies like draught & frost (i) Drought: The month of May and June are exceptionally dry and summer is extremely hot. Deficiency of moisture prevails over the greater part of the year. Less relative humidity and high temperature causes rapid loss of moisture from sandy loam soils. Scarcity of water in river Yamuna and

Project Title : EIA Study for Development of Industrial Estate of HSIIDC at Sec-37 & Sec-3 Extn, Ph-III, Karnal Project No. : 21-1041/2007-IA.III Contract No. : HSIA: K:2007:1315 dt.09.10.2007 Page 119 of 184
Shriram Institute for Industrial Research: Delhi
canals or closure of canals further increases the drought situation. Safeda and shisham plants are susceptible to drought during first two years of plantation. These species withstand drought well after they are three years old. (ii) Frost Frost is common during winter season and occurs usually during the month of January and February. Frosts are not uncommon during December also. Late frosts are generally more damaging than early frosts. Frost damage is exaggerated by sudden warming-up of cold plants. It’s effect is more in low lying areas, Kikar Israeli kikar, Siris and Neem are frost tender species and are seriously affected by frost in young stage. Severe frost even adversely affects young established plantation of kikar. Following spp. are frost hardy: Shisham, Safeda, Toot, Ranuj, Fransh, Mesquite, Jant, beri, Vitax negundo Casuarina equisetifolia. 3.9.9 Plantation done
Species Code Index Shady Trees Timber Trees Fuel Trees
Species Species Species Code Name Code Name Code Name NEM Neem SHM Shisham KKR Kikar BGD Bargad SFD Safeda DHK Dhauk PPL Pipal PPR Poplar JND Jand PLN Pilkhan RHR Rohera MST Musquite CSN Cut Sagwan TOT Toot JTA JatrophaPPI Papri TEK Teak JJB J.Jalebi KCP K.Champa SBL Simbal RHG Rhonge CKA Chukrasia AJN Arjun KHR Khairi MSR Maulsari ALS Ailanthus TOR A.tortilis BKN Bakain SRS Siris FRS Fransh BHR Bahera KHR Khari PPR P.Pari SHD Other Shady TIM Other Timber FUL Other Fuel
Fruit Trees Ornamental Trees Species Species
Code Name Code Name MNG Mango JKD Jakranda JMN Jamun AMS Amaltas AMD Amrood KCR Kachnar ANR Anar GMR G.Mohar IML Imli SOK Silver Oak PPT Papita CSM C.Siamea NBU Nimbu KGL Kigelia BER Beri CSN Casurina LSR Lasura ATN Alstonia ANL Anwala MLT Milletia BEL B/Pather PTJ Putranjiva FRT Other Fruit OMT Other Ornamental
3.9.10 Terrestrial Flora The existing terrestrial flora of the region is listed in following tables:

Project Title : EIA Study for Development of Industrial Estate of HSIIDC at Sec-37 & Sec-3 Extn, Ph-III, Karnal Project No. : 21-1041/2007-IA.III Contract No. : HSIA: K:2007:1315 dt.09.10.2007 Page 120 of 184
Shriram Institute for Industrial Research: Delhi
Table -3.9 (a) Terrestrial Flora in Study Area
S. No. Botanical name Local name (a) Trees
1. Acacia leucophloea Raunj2. Acacia nilotica var.indica Kikar3. Acacia senegal Khairi4. Acacia tortilis Israeli Kikar 5. Ailanthus excelsa Ulloo neam 6. Albizia lebbek Siris7. Azadirachta indica Neem8. Anogeissus pendula Dhauk9. Bauhinia racemosa -10. Bombax ceiba Semal11. Boswellia serrata -12. Butea monosperma Dhak13. Cassia fistula Amaltas14. Cassia siamea -15. Cordia dichotoma Lasura16. Cappairs decidua Kair or Karir 17. Dabergia sisoo Shisham18. Delonix regia Gulmohar 19. Eucatyptus hybrid Safeda20. Eucalyptus camaldulensis Safeda21. Ficus bengalensis Barh22. Ficus glomerata Gullar23. Ficus religiosa Peepal24. Holoptelia Papri25. Jacaranda mimosaefolia Jacranda26. Kigelia pinnata Kigelia27. Leucaena leucocephala Su-babul28. Mangifera Aam29. Melia azedarach Bakain30. Mitragyna parvifolia Phaldu31. Moringa oleifera Sanjna32. Parkinsonia aculeata Parkinsonia 33. Phoenix sylvetris Khajur34. Pongamia sylvetris Papri35. Pongamia glabra Papri36. Prosopis cineraria Jani37. Prosopis juliflora Vilati Kikar 38. Salvadora oleoides Jaal39. Sterculia urens Gum Karaya 40. Syzygium cumini Jamun41. Tamarindus indica Imli42. Taxarix articulata Fransh43. Tecomella undulata Rohera44. Terminalia arjuna Arjun45. Zizyphus mauritiana Beri(b) Shrub & Herba 1. Acacia jacquemontii Bambul2. Achyranthes aspera Puthkanda 3. Adhtoda vasica Bansa4. Aerva javanica Bui5. Agave americana Keora6. Alysicarpus minilifer -7. Amaranthus gracilis Cholai8. Argemone mexicana Kandheli or Kanteli

Project Title : EIA Study for Development of Industrial Estate of HSIIDC at Sec-37 & Sec-3 Extn, Ph-III, Karnal Project No. : 21-1041/2007-IA.III Contract No. : HSIA: K:2007:1315 dt.09.10.2007 Page 121 of 184
Shriram Institute for Industrial Research: Delhi
9. Asphodelus tenuifolius Piaza10. Balanites aegyptica Hingo or Hingot 11. Bougainvellea spp. Bougainvillea 12. Calotropis procera Aak13. Cannabis sativa Bhang14. Capparis horrida Hins15. Carissa spinarum Karaunda16. Cassia tora Panwar17. Chenophdium albus Bathua18. Crotolaria Juncea -19. Datura alba Dhatura20. Dodonaea viscosa -21. Luphorbia hirta Dudhi22. Euphorbia royalaena Thor23. Eichhomia crassipes Water hyacinth 24. Hydrilla verticellata -25. Indigofera oblongifolia Jhojhru26. Ipomea cornea Vilayati Aak 27. Lantana carnara Panchphuli 28. Leptadenia pyrotechnic Khimp29. Lyclum barbarum -30. Nerium odorum Kaner31. Opuntia dillenii Nagphani32. Occimum americanum Jungli tulsi 33. Parthenium spp. Carrot grass 34. Rumex dentatus Jungli palak 35. Ricinus communis Arand36. Solanum nigrum Mako37. Taxarix dioca Jhao38. Trapa bispinosa Singhara39. Tephrosia purpurea Jhojhru40. Typha elephantina Patera41. Xanthium strumarium Chirchita42. Zizyphus numularia Jhar/Palla/Jhar beri (c) Creepers, clibers, parasites & sedges1. Citrillus colocynthus -2. Cuscuta reflexa Akash bel 3. Cucumis pubescens Kachri4. Cyperus rotundus Motha5. Loranthus spp. -6. Mimordicancharantia Ban karela 7. Mimosa hamata -8. Portulaca oleracea -9. Solanum xanthocarpum Kateli10. Trianthema portulacasptrum Santa/Santri 11. Tribulus terrestris Gokhr12. Tridax procumbens Sadahari13. Vallaris solanacea Dudhi bel 14. Vallaris heyni -(d) Grasses 1. Andropogon lanager Khawi2. Aristida hertigluma -3. Cenchrus ciliaris Bhurat4. Cenchrus ciliaris Anjan5. Cenchrus setigerus -6. Chrysopogon montanus Dholu7. Cymbopogon martinii -8. Cynodon dactylon Doob9. Desmostachya bipinnata Dab

Project Title : EIA Study for Development of Industrial Estate of HSIIDC at Sec-37 & Sec-3 Extn, Ph-III, Karnal Project No. : 21-1041/2007-IA.III Contract No. : HSIA: K:2007:1315 dt.09.10.2007 Page 122 of 184
Shriram Institute for Industrial Research: Delhi
10. Dichanthium annulatum Palwan11. Digitaria ciliaria Jharania12. Datyloctenum aegyptium Makhra13. Dactyloctenium sindicum Tantia14. Ehinochloa colonum Sanwak15. Erianthus munja Jhund/Munj 16. Eragrostis tremula -17. Eleusine compressa Ghora dhab 18. Heteropogon contortus Suva ghas 19. Imperata cylindrica Siru20. Iseilma laxium -21. Lasiurus hirsntus Sevan22. Panicum antidotale Ghamur23. Panicum turgidum Swank24. Saccharum spontaneum Kans25. Sporobolus arabicus -26. Sporobolus arundinacea -27. Sorghum halepense Baru28. Sehima nervosum Seran29. Vertiveria zizanioides Panni/khas
3.9.11 Cultural Plant Communities Along with the natural vegetation of the area, certain other plant communities also exists which include food crops, garden plants and fruit plantations. Various orchards were observed in the study area. The area’s cultural plant communities include the following:
Table -3.9 (b) Food crops S. No. Scientific Name Common Name 1. Triticum aestivum Wheat 2. Zea mays Maize 3. Sorghum vulgare Jowar 4. Solanum tuberosum Potato 5. Aelium Cepa Onion6. Abrus Precatoris Lady finger 7. Daucus carota Carrot 8. Lycoperscion esculentum Tomato 9. Raphanus sativus Raddish
Table -3.9 (c) Garden Plants
S. No. Scientific Name Common Name 1. Bougainvellia spectabilis Bougainvellia 2. Hibiscus chinensis China rose 3. Saraca indica Ashok 4. Terminalia arjuna Arjun 5. Eucalyptus sp. Eucalyptus 6. Michelia champala Champa
Table -3.9 (d) Fruit trees
S. No. Scientific Name Common Name 1 Citrus reticulata Orange 2 Psidium gujava Guava 3 Litchi chinensis Litchi 4 Mangifera indica Mango 5 Syzygium cumini Jamun 6 Carica papaya Papaya

Project Title : EIA Study for Development of Industrial Estate of HSIIDC at Sec-37 & Sec-3 Extn, Ph-III, Karnal Project No. : 21-1041/2007-IA.III Contract No. : HSIA: K:2007:1315 dt.09.10.2007 Page 123 of 184
Shriram Institute for Industrial Research: Delhi
7 Zizyphus jujuba Ber 8 Tamarindus indica Imli 9 Citrus aurantifolia Lime 10 Musa paradisiaca Banana
3.9.12 Terrestrial Fauna As there is no suitable habitat, no major fauna was observed in the region. Mainly the domestic animals constitute the fauna population in the study area. Some wild animals in the adjoining areas are also reported to be noticed by the local sources. The list of terrestrial fauna of the study area is presented in following table. The avifauna of the study area is listed in table-3.9 (f).
Table -3.9 (e) List of terrestrial fauna of the study area
S.No Scientific Name English / Common Name Domestic animals 1 Bubulus bubalus Buffalo 2 Canis familiaris Dog 3 Eqnus Cabalus Cow 4 Eqnus sp. Goat 5 Bos indicus Domestic cat 6 Bandicota indica Horse 7 Ovis sp. Sheep 8 Ronsetlus leschenaulti Donkey Wild animals 1 Canis aureus Jackal 2 Vulpes sp. Fox 3 Boselplus tragocamelus Nilgai 4 Cervus unicolor Sambhar 5 Presdystis entellus Bunder 6 Ratus ratus Rat 7 Calotis vercicolor Lizard 8 Naja naja Cobra 9 Capra sp. Fruit bat
Table -3.9 (f) List of Avifauna of the Study Area
S.No. Scientific Name Common Name 1 Columba livia Pigeon 2 Crovus splenders Crow 3 Passer domesticus Sparrows 4 Acrido therestristis Common myna 5 Dinopium cyanocephala Wood pecker 6 Endynamus sclopacea Koel 7 Strix ocellata Wood owl 8 Pavo cristatus Peacock
Since the forest is virtually negligible in the study area (10 km buffer zone of the proposed project site), there is very less variety of natural flora and fauna. So the adverse impact on natural vegetation and fauna is envisaged to be low. However the impact on flora and fauna due to the industrial activities can be mitigated with proper green belt development and pollution control facilities.

Project Title : EIA Study for Development of Industrial Estate of HSIIDC at Sec-37 & Sec-3 Extn, Ph-III, Karnal Project No. : 21-1041/2007-IA.III Contract No. : HSIA: K:2007:1315 dt.09.10.2007 Page 124 of 184
Shriram Institute for Industrial Research: Delhi
3.10 Traffic Study Traffic density is a major development indicator and hence is a critical parameter of environmental impact assessment. More urbanization results in high traffic density. More population inflow has direct correlation with traffic density. Traffic density of an area is having direct impact on air & noise pollution and hence the need of management. Traffic is the predominant source of air and noise pollution in urban areas. The major air pollutants emitting out from vehicular traffic are Carbon monoxide, Sulphur dioxide, oxides of Nitrogen, Hydrocarbons etc. Any developmental project activity essentially results in increase in vehicular traffic. Hence, it is important to collect data on existing status of traffic composition and volume in the vicinity of proposed project site, so that the change in traffic composition and volume can be assessed. Traffic volume count is an important tool for decision-makers to understand adequacy of prevailing road infrastructure to handle the increased vehicular movement after the proposed project comes up. 3.10.1 Selection of Monitoring Locations: Two locations having direct relations with the access to the project site within the core zone were identified for traffic volume count survey. The details of the monitoring locations are as below:
(a) GT Road to Uchasawana
(b) Uchasawana to GT Road 3.10.2 Methodology for Traffic Density Survey Traffic movement was continuously monitored on either side of the road, for 24 hour for following type of traffic composition:
(a) Motorized Vehicles (i) Heavy Motor Vehicles (HMV) include Truck, Bus, Dumper, Tanker, Trailer etc. (ii) Light Motor Vehicles (LMV) include Car, Jeep, Van, Tractor, Mini Bus, Tempo etc. (iii) Two/ Three wheelers include Scooter, Motor cycle, TSR etc. (b) Non-motorized vehicles: Bicycle, cycle rickshaw, animal drawn. The data has been compiled and presented in table nos. 3.4(c) to 3.4(d). 3.10.3 Data Interpretation of Traffic Density Survey GT Road to Uchasawana Total number of HMV, LMV and 2-3 Wheelers plying at this cross-section were found to be 1408 Nos., 4008 Nos. and 5768 Nos. respectively, whereas non-motorized vehicles were estimated as 2331 Nos. Uchasawana to GT Road Total number of HMV, LMV and 2-3 Wheelers plying on this cross-section were found to be 1997 Nos., 3337 Nos. and 4568 Nos. respectively, whereas the numbers of non-motorized vehicles was estimated 2036 Nos.

Project Title : EIA Study for Development of Industrial Estate of HSIIDC at Sec-37 & Sec-3 Extn, Ph-III, Karnal Project No. : 21-1041/2007-IA.III Contract No. : HSIA: K:2007:1315 dt.09.10.2007 Page 125 of 184
Shriram Institute for Industrial Research: Delhi
(a) Equivalent Passenger Car Unit (PCU) Equivalent PCU is the uniform method for assessing the traffic volume. Criteria for the conversion of traffic volume to equivalent PCU is given in table-3.10 (a) and data is presented in table-3.10 (c) & 3.10 (d).
Table-3.10 (a) Criteria for computation of equivalent PCU Symbol Description Equivalent PCU MCH Motor Cycles on hire 0.75 MCS Motor Cycles and scooters 0.75 PCJ Private cars and jeeps 1.00 TX Motor Cabs (Taxi) 1.00 GV Goods Vehicle 2.00 BM Buses/Mini Buses 2.00 TR Tractors 1.00 AR Auto Rickshaws 1.00 GNV Government Vehicles 1.00
Maximum value of equivalent PCU at TM-1 was observed as 1320, which was estimated between 2200-2300 hrs, whereas minimum value of the same at this location was observed as 109 at 1600-1700 hrs. At location TM-2, maximum value of equivalent PCU (2161) was observed between 2000-2100 hrs, whereas minimum value at this location was observed 110 between 1300-1400 hrs.
0
500
1000
1500
2000
2500
13:0
0 -1
4:00
14:0
0 -1
5:00
15:0
0 -1
6:00
16:0
0 -1
7:00
17:0
0 -1
8:00
18:0
0 -1
9:00
19:0
0 -2
0:00
20:0
0 -2
1:00
21:0
0 -2
2:00
22:0
0 -2
3:00
23:0
0 -0
0:00
00:0
0 -0
1:00
01:0
0 -0
2:00
02:0
0 -0
3:00
03:0
0 -0
4:00
04:0
0 -0
5:00
05:0
0 -0
6:00
06:0
0 -0
7:00
07:0
0 -0
8:00
08:0
0 -0
9:00
09:0
0 -1
0:00
10:0
0 -1
1:00
11:0
0 -1
2:00
12:0
0 -1
3:00
Pass
enge
r Car
Uni
ts (P
CU
)
TM-1 TM-2

Project Title : EIA Study for Development of Industrial Estate of HSIIDC at Sec-37 & Sec-3 Extn, Ph-III, Karnal Project No. : 21-1041/2007-IA.III Contract No. : HSIA: K:2007:1315 dt.09.10.2007 Page 126 of 184
Shriram Institute for Industrial Research: Delhi
Table-3.10 (b) PCUs at TM-1 & TM-2 Time Passenger Car Unit (PCU)
TM-1 TM-2
HMV LMV 2-3W Total HMV LMV 2-3 W Total
13:00 - 14:00 18 65 104 187 14 33 63 110
14:00 - 15:00 36 104 125 265 8 53 74 135
15:00 - 16:00 42 117 164 323 56 50 56 162
16:00 - 17:00 6 30 73 109 60 50 55 165
17:00 - 18:00 0 79 98 177 130 90 67 287
18:00 - 19:00 52 93 196 341 240 137 150 527
19:00 - 20:00 110 535 525 1170 690 426 312 1428
20:00 - 21:00 146 385 422 953 1050 606 505 2161
21:00 - 22:00 112 101 272 485 412 332 352 1096
22:00 - 23:00 250 631 439 1320 100 109 67 276
23:00 - 00:00 178 124 221 523 84 70 45 199
00:00 - 01:00 50 81 136 267 56 63 34 153
01:00 - 02:00 70 115 98 283 30 96 49 175
02:00 - 03:00 210 180 75 465 48 80 62 190
03:00 - 04:00 142 177 108 427 24 64 49 137
04:00 - 05:00 60 50 42 152 60 97 122 279
05:00 - 06:00 80 60 52 192 92 87 120 299
06:00 - 07:00 270 190 131 591 118 50 76 244
07:00 - 08:00 80 190 105 375 372 300 312 984
08:00 - 09:00 326 162 161 649 282 253 447 982
09:00 - 10:00 316 135 237 688 30 162 149 341
10:00 - 11:00 110 143 143 396 18 40 88 146
11:00 - 12:00 132 141 215 488 12 34 83 129
12:00 - 13:00 20 120 185 325 8 55 93 156
Total 2816 4008 4327 11151 3994 3337 3430 10761

Project Title : EIA Study for Development of Industrial Estate of HSIIDC at Sec-37 & Sec-3 Extn, Ph-III, Karnal Project No. : 21-1041/2007-IA.III Contract No. : HSIA: K:2007:1315 dt.09.10.2007 Page 127 of 184
Shriram Institute for Industrial Research: Delhi
Table-3.10 (c) Traffic Monitoring at station TM-1 Time Monitoring Station : Uchasawana to GT Road
HMV LMV 2-3 wheelers Non-motorised Vehicles Total 13:00 - 14:00 9 65 139 89 302 14:00 - 15:00 18 104 167 39 328 15:00 - 16:00 21 117 218 91 447 16:00 - 17:00 3 30 97 10 140 17:00 - 18:00 0 79 131 46 256 18:00 - 19:00 26 93 261 90 470 19:00 - 20:00 55 535 700 350 1640 20:00 - 21:00 73 385 563 290 1311 21:00 - 22:00 56 101 362 85 604 22:00 - 23:00 125 631 585 179 1520 23:00 - 00:00 89 124 295 66 574 00:00 - 01:00 25 81 181 40 327 01:00 - 02:00 35 115 130 40 320 02:00 - 03:00 105 180 100 125 510 03:00 - 04:00 71 177 144 35 427 04:00 - 05:00 30 50 56 20 156 05:00 - 06:00 40 60 69 20 189 06:00 - 07:00 135 190 175 60 560 07:00 - 08:00 40 190 140 65 435 08:00 - 09:00 163 162 215 100 640 09:00 - 10:00 158 135 316 90 699 10:00 - 11:00 55 143 190 110 49811:00 - 12:00 66 141 287 164 658 12:00 - 13:00 10 120 247 127 504 Total 1408 4008 5768 2331 13515
Table-3.10 (d) Traffic Monitoring at station TM-2 Time Monitoring Station : GT Road to Uchasawana
HMV LMV 2-3 wheelers Non-motorised Vehicles Total
13:00 - 14:00 7 33 84 14 138 14:00 - 15:00 4 53 99 24 180 15:00 - 16:00 28 50 74 18 170 16:00 - 17:00 30 50 73 6 159 17:00 - 18:00 65 90 89 35 279 18:00 - 19:00 120 137 200 54 511 19:00 - 20:00 345 426 416 362 1549 20:00 - 21:00 525 606 673 407 2211 21:00 - 22:00 206 332 469 341 1348 22:00 - 23:00 50 109 89 30 278 23:00 - 00:00 42 70 60 16 188 00:00 - 01:00 28 63 45 12 14801:00 - 02:00 15 96 65 16 192 02:00 - 03:00 24 80 82 11 197 03:00 - 04:00 12 64 65 7 148 04:00 - 05:00 30 97 162 89 378 05:00 - 06:00 46 87 160 97 390 06:00 - 07:00 59 50 101 47 25707:00 - 08:00 186 300 416 183 1085 08:00 - 09:00 141 253 596 143 1133 09:00 - 10:00 15 162 198 55 430 10:00 - 11:00 9 40 117 26 192 11:00 - 12:00 6 34 111 19 170 12:00 - 13:00 4 55 124 24 207Total 1997 3337 4568 2036 11938

Project Title : EIA Study for Development of Industrial Estate of HSIIDC at Sec-37 & Sec-3 Extn, Ph-III, Karnal Project No. : 21-1041/2007-IA.III Contract No. : HSIA: K:2007:1315 dt.09.10.2007 Page 128 of 184
Shriram Institute for Industrial Research: Delhi
4. Anticipated Environmental Impacts
4.1 Context This section identifies, evaluate, predicts and illustrates the potential impacts on different environmental components due to the construction and operation of the proposed project. It describes all the potential impacts on physical and socio-economic components of the local environment due to the proposed activities and sub-activities. The Prediction of impacts is the most important component in the Environmental Impact Assessment studies. Both qualitative and quantitative techniques and methodologies can be used to conduct analysis of the potential impacts likely to occur as a result of the proposed development activities on physical, ecological and socio-economic environments. The potential impacts to be predicted can be superimposed over the baseline status of the environmental quality to derive post-project scenario of environmental conditions. The prediction of impacts would, therefore, help in minimizing the adverse impacts and to enhance the beneficial impacts on environmental quality both during pre and post project. The environmental impacts in this section have, as such, been discussed separately for the construction phase and the operation stages of the proposed project. The environmental impact assessment approach used to evaluate the proposed project comprises of the sequential elements such as identification, prediction and evaluation. The first step of the impact assessment process involves identifying the key issues associated with the construction and operation phases of the proposed project. Issues and concerns of the proposed project are scoped based on the knowledge and experience with respect to environmental setting and project elements. Accordingly, the existing environmental system is described and the components of the project are determined. This step involves identification of the environmental modification that may be significant, forecasting of the quality and spatial dimension of change in the environment identified and estimation of the probability that the impact will occur. This step involves determination of the incidence of benefit to end users and population affected by the project, specification and comparison of effects between various alternatives, and assessment of the likely effect of the project on the environmental, economical and social components indicating the nature & magnitude of impacts.
4.1.1 Impact Analysis The major element involved in the process of environment impact assessment is identification of impacts as it leads to other elements such as quantification and evaluation of impacts. Although, in general, a number of impacts have been identified while describing the existing environmental status. It is necessary at this stage to assess the existing environmental status to facilitate the identification of the critical impacts that are occurring due to “the proposed project” upon various components of environment therein. The network method has been adopted for the identification and evaluation of the environmental impacts. The method involves an understanding of cause-condition-effect relationship between an activity and the environmental indicators. The activities and actions as described herein before were considered for the evaluation of the impact. The method helps in recognizing the series of impacts that could be triggered by the “proposed project activities” in the area. The concept for impact evaluation will, therefore, be accounted for the “proposed project activities” and thereby to identify the types of associated impacts, which are likely to occur. The subsequent steps will be selected to define each impact and to identify the secondary and tertiary impacts, which may induce as a result of the project activities. This process may be repeated until all possible impacts will be identified. The greatest advantage of this type of approach is

Project Title : EIA Study for Development of Industrial Estate of HSIIDC at Sec-37 & Sec-3 Extn, Ph-III, Karnal Project No. : 21-1041/2007-IA.III Contract No. : HSIA: K:2007:1315 dt.09.10.2007 Page 129 of 184
Shriram Institute for Industrial Research: Delhi
that it allows identifying the impacts by selecting and tracing out the events as they are expected to occur due to existing activities. The impact network has been developed for (i) proposed project activities impacting environment and (ii) areas of environment being impacted.
4.1.2 Approach to the Impact Analysis (a) Overall approach The approach to impact analysis includes identification of both positive and negative impacts, which may be inclusive of following:
♦ Identification and summary of all anticipated environmental impacts.
♦ Description of all probable adverse impacts, which cannot be avoided, and are due to construction as well as operational phase of the project.
(b) Identification and Assessment of Impacts In order to assess the impact of proposed project, following scenarios are to be considered (i) No project (ii) Project without EMP (iii) Project with EMP in place.
The proposed development of Industrial Estate of HSIIDC at Industrial estate at Karnal would create impacts on the environment in two distinct phases: (i) During the construction phase, which may be regarded as temporary or short – term (ii) The other during the operation stage (when the proposed project will become
operational), would have long-term effects and hence require mitigation plan for management.
4.1.3 Impacts on Ambient Air Environment The impacts on Ambient Air Quality due to the proposed project activities during the construction phase of the project may be temporary or short-term. Suspended Particulate Matter (SPM) and Respirable Particulate Matter (RPM) would be the predominant pollutants generated from construction activities. The gaseous emissions such as SO2, NOx and CO would be generated from the construction equipments and vehicles. During operational phase, the significant contributor to the air pollution would be the DG sets (as point source of emission) and movement of vehicles in the industrial area (as line source of emission). (i) Impacts During Construction During construction phase, the project would have impacts on ambient air quality due to the emissions by construction equipments and vehicles, and an increase in dust level by the construction activities. Earth excavation work, foundation work, superstructure work, material storage, transportation and handling of construction materials together with wind erosion could be the major factors, which may produce a temporary and localized increase in SPM and RPM levels. The increased movement of heavy vehicles carrying construction materials, operation of DG sets as standby power back-up system would generate gaseous emissions. The degree of dust generated would depend on the soil compaction and moisture content of the ground surface during the construction. Dust and exhaust particulate emissions from heavy equipment operations would temporarily degrade air quality in the immediate construction zone.

Project Title : EIA Study for Development of Industrial Estate of HSIIDC at Sec-37 & Sec-3 Extn, Ph-III, Karnal Project No. : 21-1041/2007-IA.III Contract No. : HSIA: K:2007:1315 dt.09.10.2007 Page 130 of 184
Shriram Institute for Industrial Research: Delhi
The construction contractor has to ensure regular monitoring of dust levels in the vicinity of the proposed site during the construction activities. Dust suppression will have to be applied, using water tankers mounted on tractors, sprinklers and other means as necessary to suppress and curb dust pollution, in the event that high levels of dust are observed, and complaints about dust are received. Other diffused source of gaseous emissions from the construction site would be if the construction labors uses fuel wood for cooking and heating during winters. The construction contractor will have to ensure that such practice would not be adopted by the labours and they should be provided with LPG cylinders for cooking in their labor camps. (ii) Impacts during Operation During operational phase, the significant contributor to the air pollution would be the DG sets (as point source of emission) and movement of vehicles in the industrial area (as line source of emission). The impacts of DG sets emission would be minimized by taking adequate measures which may include raising of stake height as per the guidelines. This impact would be intermittent, scattered & short-term. Gaussian dispersion modeling reveals no significant impacts, while considering the Worst case scenario. Impacts, if any, during the operational stage would be further minimized by the development of adequate green belt in the vicinity.
4.1.4 Impacts on Ambient Noise Environment (i) Impacts During Construction Construction activities normally result in temporary and short term increases in noise levels. The main sources of noise during construction period includes movement of vehicles for loading and unloading of construction materials, fabrication, handling of equipment and materials, operation of power shovels, concrete mixing plants, generators etc. The areas likely to be affected are those close to the site. (ii) Impacts During Operation During operation, there will not be any significant increase in the ambient noise level as explained below:
♦ Noise due to operation of DG sets for power back-up would be controlled by adequate acoustic treatment and hence there will not be any significant impact.
♦ There may be marginal impact on ambient noise level due to the movement of vehicles but it will not increase the baseline. Impacts on noise environment, if any, due to the operational stage of the project would be appropriately attenuated by the development of green belt in the vicinity of the project.
♦ The intermittent and short-term noise may increase in the event of social ceremonies/ gathering etc. in residential areas due to the operation of DG sets meant for power back-up.
4.1.5 Impacts on Water Environment Total water demand for the operational phase of the proposed project would be 21000 Litre per acre out of which 9000 liter per acre is earmarked for horticultural purpose would be met through recycled wastewater. Hence net water demand for the proposed project would be 12000 litre per acre. ♦ The horticulture demand and the demand of open area
etc. to be met through the recycled water
: 9000 litre per acre

Project Title : EIA Study for Development of Industrial Estate of HSIIDC at Sec-37 & Sec-3 Extn, Ph-III, Karnal Project No. : 21-1041/2007-IA.III Contract No. : HSIA: K:2007:1315 dt.09.10.2007 Page 131 of 184
Shriram Institute for Industrial Research: Delhi
♦ The net water demand
: 12000 litre per acre
♦ Demand to be met from local tube wells (20% of the total demand)
: 12000 litre per acre
♦ Net demand to be met from external source through Canal Water
: 50 % of the water requirement
It has been proposed that all plots of size 2 acres and above shall treat the wastewater to the extent of 30% of their discharge to cater for air conditioning, horticulture and extra demand for processing, if any Water demand to be met through local tube-wells It is estimated that about 21000 litre per acre of water demand to be met through Five Nos. of tube-wells in sector 37 ( new ones) and three tube wells from sector 3-extn ( already existing). Total water demand excluding the fire fighting demand : 12000litr/ per acre Demand to be met through local tubewells (50% of total demand ) : 6000 litre/ per acre Anticipated yield from one tubewell - Rate : 7000 litres/ hour
Running hours : 16 hours Yield from one tubewell : 7000 litre/hour No. of tubewells planned: 5 new tube wells in sector –
37 and 3 existing tube wells from Sector – 3 extn.
Water demand to be met through Tube Wells Total water demand met through 8 tube wells (Five in Sector-37 and three from sector-3).
Rain Water Harvesting The rain water harvesting would be essential for the operational phase of proposed project because surface water would be inadequate to meet the water requirements of proposed project. Recharging would be done through pits, trenches, wells, shafts etc. In case of roof top area more than 100 m2, the roof top rain water harvesting would be made mandatory and would be done by individual plot holders.
Impacts on water quantity & quality during the operational phase of the project will be minimized by ♦ Recycling of treated wastewater for horticulture purposes. ♦ Rain water harvesting The water requirement during the construction phase will be partly met through tankers and in limited case through borewell and hence no adverse impacts on ground water could be anticipated.
4.1.6 Impacts Due to Wastewater Generation (i) During Construction The major source of water pollution during the construction phase of the project would be sewage from labour camps and makeshift office. It is expected that at any given time during the construction phase, the peak manpower strength on construction site comprising of contractor’s technical staff, administrative staff , skilled and unskilled workers. The water requirement would be @50 lpcd & waste water generation would be @40 lpcd. The generated sewage would pass

Project Title : EIA Study for Development of Industrial Estate of HSIIDC at Sec-37 & Sec-3 Extn, Ph-III, Karnal Project No. : 21-1041/2007-IA.III Contract No. : HSIA: K:2007:1315 dt.09.10.2007 Page 132 of 184
Shriram Institute for Industrial Research: Delhi
through a septic tank and would be discharged into the existing municipal sewage network of the area. (ii) During Operation The wastewater generation during the operational phase of the proposed project is expected to be 4500 KLD and net wastewater for treatment would be 4500 KLD as per the following statement: ♦ Total average waste water generated per day = 4500 KLD ♦ Waste water generated by bigger plots = cannot be predicted now ♦ 30% to be treated within the plot = cannot be predicted now ♦ Net waste water available = = Not applicable Waste water Treatment plant to be installed for treating 4500 KLD as its expected that demand may rise gradually in 10 years.
4.1.7 Impacts on Land Environment (i) Impacts on Land Use The project proponent has acquired 561 acres 5 kanal 7 marla of land in Karnal and Kambopura. The award of above said land was announced on 15.07.2008, 22.07.2008 & 29.07.2008 by District Revenue Officer-cum-Land Acquisition Collector Karnal. The proposed development of industrial estate would be in adherence with the Master Plan-2021 of Karnal issued by Dept. of Town & Country Planning, Haryana. Hence, the development of the proposed project will not have any impact on the landuse.
Moreover, local landuse planning will control the type, density and location of development in the future. Development of green belt and other landscape on the proposed site would further enhance the visual and aesthetic quality of the area. (ii) Impacts on Soil The site clearing and preparation activities will involve removal of only scanty vegetation, mainly bushes, existing in the vicinity of proposed site. The project site is primarily dominated by under growth and unwanted bushes. As the topography in and around the site is mostly plain with no significant slope, the digging of the site before the start of the construction work for the foundation work would not result any significant effect on soil erosion and silt run off, even during the heavy rains. The project requires extensive work on the excavation and removal of soil and hence will temporarily affect soil structure and stability with a localized impact. The project proponent will adopt good construction practices that will ensure the environmental impacts of waste effluents generated on-site during construction would be minimized. (iii) Construction Wastes The generation of waste material is inevitable during the construction phase of the development. Waste can be generated at different stages of construction process. Wastes may include the top soil, clay, sand, and gravel. These can be re-used as filler at the same site after completion of excavation work. Other miscellaneous materials that could arise as waste include glass, plastic material, general refuse, scrap metal, cardboard, etc. and the solidwastes from the construction workers temporary housing. Efforts would be done to recycle the waste material to the possible extent Non-recyclable solid wastes generated during construction will be disposed of to a designated landfill sites in the project area. Hence, waste generated during the construction would not be of significant quantify and would not have any significant potential impact.

Project Title : EIA Study for Development of Industrial Estate of HSIIDC at Sec-37 & Sec-3 Extn, Ph-III, Karnal Project No. : 21-1041/2007-IA.III Contract No. : HSIA: K:2007:1315 dt.09.10.2007 Page 133 of 184
Shriram Institute for Industrial Research: Delhi
4.1.8 Solid Wastes Generation and Disposal
(a) Industrial Solid Wastes Assessment of industrial solid waste management problem greatly varies depending on the nature of the industry, their location and mode of disposal of waste. In the absence of the knowledge about the number & type of industries that would be coming up in the proposed industrial area, it is not possible to provide estimate about the quantity. For this reason, the industrial waste is proposed to be considered separately from the MSW and has to be dealt in accordance with the Hazardous Wastes (Management & Handling) Rules 2003. Further, industries generating solid waste will have to manage such waste by themselves and are required to seek authorizations from state Pollution Control Boards (SPCB) under relevant rules. However, through joint efforts of SPCBs, local bodies and the industries, a mechanism could be evolved for better management. Following steps would be taken-up for better management of the waste to be generated in industrial estate (i) Inventory Management and Improved Operations
♦ Inventorisation and tracing of all raw materials ♦ Procurement of fewer toxic and more non-toxic production materials ♦ Implementation of employees’ training and management feedback ♦ Improving material receiving, storage, and handling practices.
(ii) Production Process Optimization ♦ Substitution of non-hazardous for hazardous raw materials ♦ Segregation of wastes by type for recovery ♦ Elimination of sources of leaks and spills ♦ Separation of hazardous from non-hazardous wastes ♦ Optimization of the process of raw material use ♦ Emphasis on reuse & recycling of wastes
(b) Municipal Solid Wastes The primary sources of solid waste in Karnal are local households, commercial establishments, markets, hotels, restaurants, etc. The total quantity of waste generated per day is in the order of 500 tonnes per day (TPD) at a per-capita generation of 377 grams per day. MCK is responsible for the collection, transportation and disposal of all solid waste generated, except the untreated bio-medical waste and hazardous industrial waste, which is taken care of by the respective generators. MCK organizes the collection and transportation of the waste through a team of its own conservancy workers and a fleet of vehicles and dumper-placers. A permanent dumping site –cum – solid waste treatment plant is in the final stage of completion, which is situated within five kilometers from the proposed industrial town ship of Sector – 37, by Municipal Corporation Karnal. Enough carrier vehicles will be employed by HSIIDC to transport the solid waste to this dumping site.
4.1.9 Impacts on the Drainage Development of proposed project will improve the drainage in the project area vicinity. There are proposal for development of storm water drainage and internal drainage system. (a) Proposal for storm water drainage To ensure the gravity flow of storm water, it is proposed that

Project Title : EIA Study for Development of Industrial Estate of HSIIDC at Sec-37 & Sec-3 Extn, Ph-III, Karnal Project No. : 21-1041/2007-IA.III Contract No. : HSIA: K:2007:1315 dt.09.10.2007 Page 134 of 184
Shriram Institute for Industrial Research: Delhi
♦ Covered pipe drainage system will be adopted for collection of storm water runoff from sectors instead of conventional un-covered drains. The system will ensure gravity flow into master storm water system.
♦ Kerbs and Channels have been proposed along roads to chennilize the storm water and is collected into pipe drain through road-gullys at regular intervals.
(b) Planning of internal drainage system The following factors would be taken into consideration for planning of the drainage system:
♦ The pattern & gradient of natural slope of the site, its extent and direction.
♦ The natural drainage system in the downstream area (outside the project area).
♦ The road network system envisaged and finished level of roads.
♦ The runoff from units and other built up areas to lead into catch basin connected to branch drains along the access roads. These drains will take storm water into nearest lateral drains and then into trunk drains on main roads, which would eventually take the storm water into the natural system.
♦ The rain water from open spaces as well as from isolated places, would flow over the ground following the natural slope gradient and get into the nearest drain through the vertical grating.
♦ No. of recharge wells (as per design) shall be provided all along the major roads and as such the runoff during the normal rains shall get absorbed through these recharge wells. While during the peak intensity of rainfall, the drainage system would carry the surplus water to be pumped into Yamuna Canal.
(c) Design of drains The under ground RCC pipes drainage system has been proposed with position of Gully – Gravity and Manholes at specified intervals for better cleaning facilities. (d) Location of drain & network The drains will be located near the carriageway along either side of all the roads, in case of roads having camber on both sides and on one side of road having camber on one side. Taking the advantage of road camber and embankments, the rainfall runoff from roads shall flow towards the drains. (e) Storm water drains & road crossings The RCC pipe of NP-2 class are to be used in the storm water drainage and RCC NP-4 class pipes shall be used under the road crossings.
4.1.10 Impacts on Socio-economic Environment
The project will definitely contribute towards the socio-economic development of the area. The land values around the project site are likely to be appreciated after the operation of the project. The direct and indirect employment to the local population during the operation of the project at both skilled and unskilled levels will benefit the local population and its specific groups.

Project Title : EIA Study for Development of Industrial Estate of HSIIDC at Sec-37 & Sec-3 Extn, Ph-III, Karnal Project No. : 21-1041/2007-IA.III Contract No. : HSIA: K:2007:1315 dt.09.10.2007 Page 135 of 184
Shriram Institute for Industrial Research: Delhi
Economic activity will also get a boost for small shopkeepers, vendors and hence have a positive impact. (i) Impacts on Physical Infrastructure The proposed project will have positive impacts as far as physical infrastructure is concerned. New physical infrastructure like road network, electrification, sewerage network, solid waste management facility, drainage network would be created and it would definitely benefit the local population. (ii) Landscaping & Visual Quality With the construction of the project, there will be improvement in the landscaping of the area, which will have adequate green belt not only for attenuation of air and noise pollution but also to enhance the visual quality. (iii) Employment Opportunities The construction of the proposed project is expected to provide temporary employment to a good number of skilled and unskilled workers directly and to others like owner of construction machinery and equipments, vehicles etc. during the construction period, thus have the positive impact. Along with direct employment, there will be scope for generation of secondary employment to provide services to the working people during the operation of the proposed project for various needs. All these will be beneficial to the local economy. During the operational phase, the scope for the generation of employment for both skilled and unskilled persons would increase. Once fully operational, it is expected that there will be a big boost in the employment sector for the local population both in the skilled and un-skilled category. (iv) Development of Roads (Internal & External) With the development of proposed project, the road network comprising of both external and internal roads will come up with the roads hierarchy proposed as under: External roads ♦ 45 M sectors dividing roads. Internal roads ♦ 30 M wide road : Internal major roads ♦ 20 M wide road : Collector streets ♦ 18 M wide road : Collector streets ♦ 15 M wide road : Collector streets Proposed Road Levels ♦ Formation level of 45 m wide sector dividing roads have been fixed above the natural
ground levels. ♦ The slope of the master roads would be kept according to proposed storm water drainage
proposal. The formation levels of other roads have been fixed accordingly, and are as per the standard specifications.

Project Title : EIA Study for Development of Industrial Estate of HSIIDC at Sec-37 & Sec-3 Extn, Ph-III, Karnal Project No. : 21-1041/2007-IA.III Contract No. : HSIA: K:2007:1315 dt.09.10.2007 Page 136 of 184
Shriram Institute for Industrial Research: Delhi
Right of Way The right of way as well as formation width together with metalled width, side slope, of various roads will be as under:
Table-4.1 (a) Design features of the Right of Way Right of Way (m)
Formation width (m)
Side slope Hort.-Vert.
Metalled width (m) Service Lanes Camber (%)
Kerbs & Channel
15 15 2:1 7.5 - 2.0 One side 18 18 2:1 7.5 - 2.0 One side 30 30 2:1 12.0 - 2.0 Both side 45 45 2:1 2 carriage ways 10
m wide - 2.0 Both sides on
main roads Pavement Design The pavement design will be done as per IRC-37 and IRC-58 depending upon the type of pavement. The soil classification will be carried out as per IS:1498 and tests like field density, CBR and other desirable laboratory tests shall be carried out as per IS:2720 (relevant parts). The following specifications for the pavement design would be considered:
♦ The side slopes to be 2 horizontal to 1 vertical with minimum camber 2.0%.
♦ The compaction of the embankment of the roads shall be considered satisfactory when desired DBD is achieved.
♦ The requirements of earth work in embankment and tentative proposed crust thicknesses for construction shall be as under
− Physical requirement of embankment and sub-grade shall be as per MORTH specifications.
− Compaction of embankment and sub grade shall be as per MORTH specifications. (v) Connectivity The project site is abutting NH – I and has good connectivity with respect road and rail.Keeping in view of this, the proposed project will have positive impacts towards the socio-economic environment and project proponent will do best efforts to enhance the positive impacts.
4.1.11 Impacts on Energy (a) During construction phase of the project Fossil fuels, such as diesel fuel, gasoline and oil will be used during the construction and operation of the project for mechanical and electrical equipments and should have marginal adverse effects on renewable resources. Electricity will be used during construction to provide power to construction equipment and in operation for lighting of buildings and running utilities equipments. Electricity consumption will be kept at a minimum whenever possible by adopting electricity conservation measures. (b) During operational phase of the project The load calculations for the industrial estate being developed by HSIIDC at Industrial Estate Karnal for various categories/ land uses would be as under:

Project Title : EIA Study for Development of Industrial Estate of HSIIDC at Sec-37 & Sec-3 Extn, Ph-III, Karnal Project No. : 21-1041/2007-IA.III Contract No. : HSIA: K:2007:1315 dt.09.10.2007 Page 137 of 184
Shriram Institute for Industrial Research: Delhi
Table-4.1 (b) Load estimation under various landuses Sl. Category/ Landuse Approx. Area (acres) Tentative Load
(MVA) 1. Industrial Plots 95.32 20 2. Commercial 17.57 11 3. R & R policy 18.33 0.5 4. Institutional use 4.12 0.25 5 Disposal Site 12.00 0.126 Multi – speciality Hospital 4.53 2 7 Utilities 5.67 0.05 8 Open Space, Green Belts etc 123.64 - Total 33.92
(i) Design & Proposal it is proposed to provide one no. of 132/11 KV substation with 2 x 16/20 MVA power transformers. The land required for the 132/11 KVsub-station would be 4 acres. (c) Minimization of Impact The project proponent will ensure that best management practices to be followed both during the construction & operational phases of the project to conserve renewable resources. These may include, but are not limited to: ♦ Lighting of only critical areas during non-working hours; ♦ Efficient scheduling of construction crews ♦ Use of energy-efficient lighting; ♦ Minimizing idling of construction equipment and vehicles; ♦ Recycling of used motor oils and hydraulic fluids. 4.1.12 Impacts on Biological Environment The proposed project will have no adverse impact on bio-diversity since there is no significant vegetation (flora) and fauna in the project core zone. In 10 km radius of the proposed project following are neither existing nor proposed ♦ National Park ♦ Sanctuary ♦ Elephant/ Tiger Reserve ♦ Migratory routes
Project Proponent would further ensure the development of adequate green belt as well as landscaping in the vicinity of the proposed project site. This would not only help in reducing the existing (baseline) level of air and noise pollution but also aim at enhancing the aesthetic and visual quality of entire area as well as provide habitation to local fauna to preserve the environmental quality. Hence, proposed project would definitely have the positive impacts as far as biological environment is concerned. 4.2 Statement of Environmental Impacts The assessment, as to be carried out by considering above situation and scenario, is described hereunder:

Project Title : EIA Study for Development of Industrial Estate of HSIIDC at Sec-37 & Sec-3 Extn, Ph-III, Karnal Project No. : 21-1041/2007-IA.III Contract No. : HSIA: K:2007:1315 dt.09.10.2007 Page 138 of 184
Shriram Institute for Industrial Research: Delhi
(a) Air Environment Air quality is influenced by a number of factors, which includes natural and anthropogenic or man-made. An assessment of the existing air quality status was carried out in the vicinity of the proposed project. Air Pollutant Dispersion Modeling was carried out considering two situation viz (i) Point Source of emission i.e. use of DG sets as power back-up (Guassian Model) and Line Source of emission i.e. movement of vehicles in the project vicinity (Caline Model) both considering the worst-case-scenario. The Air Quality Impact analysis of proposed project can be summarised as below: (i) No project Without the proposed project in place, baseline data Ambient Air Quality Data is generated at the Core Zone & Buffer Zone of the project site. Data is summarized in table-4.2 (a). Except in case of SPM & RSPM, other AAQ indicators like SO2, NOx & CO are within the norms of Rural, Residential and Other areas. However, in case of NAAQS for industrial area, all AQI indicators are within limit exept RSPM.
Table-4.2 (a) Baseline AAQ data at Core & Buffer Zones of Proposed Project Site
Data Indicator SPM concentration in µg/m3 AAQ-1 AAQ-2 AAQ-3 AAQ-4 AAQ-5 AAQ-6
Minimum 111 104 181 121 102 155 Average 206 237 308 291 251 280 Maximum 395 516 498 496 456 535 Data Indicator RSPM concentration in µg/m3
AAQ-1 AAQ-2 AAQ-3 AAQ-4 AAQ-5 AAQ-6 Minimum 65 72 111 94 87 99 Average 125 135 177 203 176 180 Maximum 218 359 261 369 313 315 Data Indicator SO2 concentration in µg/m3
AAQ-1 AAQ-2 AAQ-3 AAQ-4 AAQ-5 AAQ-6 Minimum BDL BDL BDL BDL BDL BDL Average 1.3 1.8 1.9 1.9 2.2 1.5 Maximum 4 6 8 8 6 5 Data Indicator NOx concentration in µg/m3
AAQ-1 AAQ-2 AAQ-3 AAQ-4 AAQ-5 AAQ-6 Minimum 12 10 14 15 13 12 Average 25.7 23.5 22.6 27.6 22.9 21.9 Maximum 49 47 56 51 36 51 Data Indicator CO concentration in mg/m3
AAQ-1 AAQ-2 AAQ-3 AAQ-4 AAQ-5 AAQ-6 Minimum 0.1 0.1 0.1 0.1 0.1 0.1 Average 0.54 0.38 0.55 0.53 0.39 0.45Maximum 1.2 0.9 1.2 1.1 0.8 1.0 Data Indicator Hydrocarbon concentration in ppm
AAQ-1 AAQ-2 AAQ-3 AAQ-4 AAQ-5 AAQ-6 Minimum 3.0 3.0 3.6 3.4 3.1 3.0 Average 4.98 4.04 5.18 5.09 4.22 4.39 Maximum 6.9 5.4 6.9 6.7 5.6 6.1

Project Title : EIA Study for Development of Industrial Estate of HSIIDC at Sec-37 & Sec-3 Extn, Ph-III, Karnal Project No. : 21-1041/2007-IA.III Contract No. : HSIA: K:2007:1315 dt.09.10.2007 Page 139 of 184
Shriram Institute for Industrial Research: Delhi
(ii) The project without EMP With the implementation of proposed project, there will be amelioration in the ambient air quality as the proposed project is aiming at development of green belt and landscaping. Further, after the completion of construction activities, soil of the area will be stabilized and there will be drastic reduction in the area of loose soil. All these efforts will drastically reduce the air pollution in the area.
(iii) The project with EMP With the implementation of EMP, there will be attenuation in the existing air pollution due to the development of green belt and landscaping of entire core zone of the project.. In addition, industrial units will implement adequate air pollution control measures in respect units, which will further help in reduction of ground level concentration of ambient air quality pollutants. (b) Noise Environment Noise pollution is most often and most simply defined as unwanted sound, which interferes with speech communication, causes annoyance, distracts from work, disturbs sleep and thus adversely affects the quality of human environment. In order to assess the existing noise level, noise monitoring was undertaken in the project vicinity. The ambient noise level is characterized by significant variations above a base called a Residual Noise Level, below which the ambient noise does not seem to drop during a given time interval and is generally caused by unidentified distant sources. It differs in rural and urban areas. At night, its level is low due to lesser elements of noise. As suggested by monitoring data and its statistical analysis, the residual noise level (L90) during the monitoring period was well within the prescribed limit of the residential areas. The results as discussed in this report indicate that during most of the monitoring time noise level was observed to be within prescribed norms. However, some higher values, as observed in the study, may be due to the movement of vehicles, aircrafts etc. The Noise Quality Impact analysis of proposed project can be summarised as below: (i) No project Without the proposed project, the noise level in the project area is within the norms prescribed for land uses such as residential, commercial & industrial areas in spite of the intense human activities both in the core and buffer zone of the project (ii) The project without EMP With the implementation of proposed project, there may be some increase in the ambient noise level due to operation of DG sets & machinery as well as movement of vehicles in the industrial area, but this impact would only be limited to day time. There may also be short-term and localized impact on noise quality during the construction of the project. However, residual noise level (L90) is expected to be within the prescribed norms of industrial areas in the core zone and residential areas in the buffer zone. (iii) The project with EMP With the implementation of EMP, chances of localized and intermittent noise level could well be attenuated by appropriate acoustic enclosure (wherever applicable in case of the operation of DG sets) and development of appropriate and adequate green belt, which would further help the project proponent in reduction of the existing level of noise.

Project Title : EIA Study for Development of Industrial Estate of HSIIDC at Sec-37 & Sec-3 Extn, Ph-III, Karnal Project No. : 21-1041/2007-IA.III Contract No. : HSIA: K:2007:1315 dt.09.10.2007 Page 140 of 184
Shriram Institute for Industrial Research: Delhi
(c) Water Environment The study of water environment is very significant for Environmental Impact Assessment of any new installation/ expansion of a project. It includes the study of natural environment of existing water scenario and prediction of likely impacts on it due to the upcoming installation / expansion of any project. The impact analysis on water quantity & quality of proposed project can be summarized as below:
(i) No project Ground water quality in general is saline and hard in nature in the vicinity of project area. There is no significant pollution in the ground water as far as toxic constituents are concerned like heavy metals and organics. (ii) The project without EMP
♦ The proposed project activities will not contaminate the ground & surface water in the vicinity. There will not be any discharge on the open land. Domestic sewage & industrial effluent would be treated adequately. Hence, there is no threat with regard to the pollution or contamination of water resources.
♦ With respect to quantity of water, there is a proposal to construct tubewells to meet the water demand for industrial use.
♦ There is also a proposal for Rain Water Harvesting and reuse of treated water for horticulture purpose.
(iii) The project with EMP EMP would address all the problems associated with respect to water pollution, water quality and quantity due to the proposed project. (d) Land Environment
Land is a major resource for sustainable development. Exponential population growth over the year resulted in the more demand for land, water and biological resources, thereby exerting tremendous pressure on land. Every piece of land has its own carrying capacity in terms of support and assimilation. The Land Environment Impact analysis of proposed project can be summarized as below:
(i) No project
Land use is as per the Master Development Plan of Karnal. In context to soil quality, analytical results, in general suggests that the soil quality in samples drawn from agricultural land as well as open uncultivated area, contains optimum level of plant nutrients and other components required for the soil for agricultural purposes.
(ii) The project without EMP The proposed project of the development of industrial Estate, Karnal will not have any significant impacts on the land environment. Landuse in the vicinity would be in adherence to the Master Development Plan. (iii) The project with EMP
With the implementation of EMP, landscaping of the area would be ameliorated, which would result in the stabilization of soil as well as improvement in the visual quality of the area.

Project Title : EIA Study for Development of Industrial Estate of HSIIDC at Sec-37 & Sec-3 Extn, Ph-III, Karnal Project No. : 21-1041/2007-IA.III Contract No. : HSIA: K:2007:1315 dt.09.10.2007 Page 141 of 184
Shriram Institute for Industrial Research: Delhi
(e) Biological Environment Forests are a key element of biological & ecological systems comprised of tree-dominated vegetative associations with an innate complexity, inherent diversity, and serve as a renewable resource base as well as a habitat for a myriad of life forms. Forests render numerous goods and services, and maintain life-support systems so essential for life on earth. Some of these life support systems of major economic and environmental importance are: ♦ Supply of wood & non-wood forest products, ♦ Natural habitat for bio-diversity and repository of genetic wealth, ♦ Provision of recreation and opportunity for eco-tourism, ♦ Playing an integral part of the watershed to regulate the water regime, conserve soil, and
control floods ♦ Carbon sequestration and functions as a carbon sink. The Biological Environment Impact analysis of proposed project can be summarized as below:
(i) No project There is no forest land in the proposed project vicinity. (ii) The project without EMP Since there is no forest land in the project area, impact of the Biological Environment could not be envisaged both during the construction and operation of the project. The proposed project will, therefore, have no adverse impact on bio-diversity since there is no significant vegetation (flora) and fauna in the project core zone. (iii) The project with EMP Project Proponent would ensure the development of adequate green belt as well as landscaping as a part of EMP. This would not only help in reducing the existing (baseline) level of air and noise pollution but also aim at enhancing the aesthetic and visual quality of entire area and also, provide habitation to local fauna to preserve the environmental quality. Hence, proposed project would definitely have the positive impacts as far as biological environment is concerned. (f) Socio-economic Environment Impact on socio-economic environment in the vicinity of any project, revolves around the mode of change that is likely to occur due to the beneficial and adverse effects arising out of the project activity. Generally, implementation of project activities results in a change in socio-economic profile of the surrounding area due to change in land use pattern, operation and maintenance of the project, change in the occupational pattern of the local residents, boost in the local economy due to employment opportunities, increased business, improved infrastructure etc. Due to this change basic amenities needs improvement so as to keep pace with the industrial development. The Socio-economic Environment Impact analysis of proposed project can be summarized as below: (i) No project Presently project area is having good socio-economic index.

Project Title : EIA Study for Development of Industrial Estate of HSIIDC at Sec-37 & Sec-3 Extn, Ph-III, Karnal Project No. : 21-1041/2007-IA.III Contract No. : HSIA: K:2007:1315 dt.09.10.2007 Page 142 of 184
Shriram Institute for Industrial Research: Delhi
(ii) The project without EMP ♦ The project would contribute towards the socio-economic development of the area at the
local level. ♦ The land values around the project site are likely to be appreciated after the operation of the
project. ♦ The direct and indirect employment to the local population during the operation of the
project at both skilled and unskilled levels will benefit the local population and its specific groups.
♦ Project would facilitate the creation of physical infrastructure in the core and buffer zone. ♦ The construction of the proposed project is expected to provide temporary employment to a
good number of skilled and unskilled workers directly and to others like owner of plant and equipments, vehicles etc. during the construction period, thus have the positive impact.
♦ Along with direct employment, there will be scope for generation of secondary employment
to provide services to the working people during the operation of the proposed project for various needs. All these will be beneficial to the local economy.
(iii) The project with EMP With the implementation of EMP, there will be a general amelioration of the socio-economic environment of the area. It would have following socio-economic advantages: ♦ Enhanced visual and aesthetic quality of the area. ♦ Better employment opportunities for skilled workers. ♦ Indirect employment opportunities for the inhabitants. ♦ Better infrastructure of the area. ♦ Improved landscaping. ♦ Better connectivity.

Project Title : EIA Study for Development of Industrial Estate of HSIIDC at Sec-37 & Sec-3 Extn, Ph-III, Karnal Project No. : 21-1041/2007-IA.III Contract No. : HSIA: K:2007:1315 dt.09.10.2007 Page 143 of 184
Shriram Institute for Industrial Research: Delhi
5.0 ENVIRONMENTAL MANAGEMENT PLAN INCLUDING MITIGATION MEASURES, ENVIRONMENTAL MONITORING PROGRAM AND
PROJECT BENEFIT Environmental Management is an integral part of the planning process for any ongoing / expansion of project activities. Environmental planning & sustainable development approach is essential to maintain balance between “supportive” and “assimilative” capacities of a region and hence to stay within the carrying capacity. The Management Plan for construction and operation phases of the development of the proposed industrial estate of HSIIDC at Karnal would include measures that minimize adverse impacts to the environment. 5.1 The Objective & Scope for EMP The objectives of the development of Environmental Management Plan for the proposed project activities would be to reduce the negative impacts to acceptable level & enhance the positive impact to achieve “Sustainable Development in the region”. The Environmental Management Plan (EMP) has been designed within the framework of various regulatory requirements on environmental and Socio-economic aspects aiming at the following: ♦ Minimize disturbance to native flora and fauna, if any.
♦ Prevent and to attenuate air, water, soil and noise pollution, if any.
♦ Encourage the socio-economic development. Major Targets of EMP includes ♦ Sustainable development in the region.
♦ To reduce or eliminate the detrimental impacts on environment
♦ To reduce or eliminate the hazards associated with the project activities.
♦ A better protection and conservation of the natural resources.
♦ To facilitate linkage between inter-sectoral development. Overall aim to be pursued by ♦ Prevention of the deterioration of the environment.
♦ Protection and enhancement of the ecosystems.
♦ Promotion of the sustainable use of resources.
♦ Protection of environment against prioritised hazardous substances.
♦ Management of the risks to reduce or eliminate hazards.
5.2 Environment Management Plan for Proposed Project The Environmental Management Plan for the proposed project activities envisage to outlines the key environmental management and safeguards that will be initiated by the project proponent to manage the key environmental issues associated with the construction and operation of the proposed project. The major concerns for the EMP of the proposed project activities would be:

Project Title : EIA Study for Development of Industrial Estate of HSIIDC at Sec-37 & Sec-3 Extn, Ph-III, Karnal Project No. : 21-1041/2007-IA.III Contract No. : HSIA: K:2007:1315 dt.09.10.2007 Page 144 of 184
Shriram Institute for Industrial Research: Delhi
♦ Delineation of mitigation and compensation measures for all the identified significant impacts.
♦ Delineation of unmitigated impacts. ♦ Physical planning including work programme, time schedule and locations for putting
mitigation and compensation systems in place. Environmental Management Plan (EMP) is the process to ensure that environmental considerations are integrated into the project scope. These are tools for mitigating or offsetting the potential adverse environmental impacts resulting from various activities of the project. The environmental management plan (EMP) would, therefore, consists of following main components:
♦ To integrate potential impacts (positive or negative), environmental mitigation measures implementation schedule, and monitoring plans.
♦ To describe the potential environmental impacts and proposed management associated with
each stage of the project development. ♦ To control environmental impacts to levels within acceptable standards, and to minimize
possible impact on the community and the workforce of foreseeable risks during the construction and subsequent operational phases of the project.
♦ To highlight that the environmental mitigation measures shall be used in consonance with
good management practices and good engineering design, construction and operation practices.
The EMP would, hence, be a working document that concerned stakeholders need to both understand environmental concerns and to address associated issues to facilitate environmental management.
5.3 Impact Mitigation during Construction Phase Environment protection measures/precautions shall be adopted to minimize the impacts due to activities during the construction stage. The impacts during the construction phase on the environment would be of transient and short-term nature and are expected to reduce gradually on completion of construction activities. Nevertheless, efforts are needed to reduce these short-term impacts on various components of the environment, as illustrated below, to the possible extent. 5.3.1 Air Quality Management During the construction phase, certain amount of dust shall be generated due to the mobilization of men, machinery and materials. The processes, which causes pollution includes land clearing, leveling of land, operation of construction machinery/equipment, foundations, buildings and other requisite infrastructure etc. closed to the construction site. The impacts may be temporary in nature and shall marginally deteriorate the ambient air quality. However, Project Proponent would ensure following measure for reduction of the dust generation:
♦ Topsoil removed shall be preserved for later reinstatement purposes by piling it along a boundary the site.

Project Title : EIA Study for Development of Industrial Estate of HSIIDC at Sec-37 & Sec-3 Extn, Ph-III, Karnal Project No. : 21-1041/2007-IA.III Contract No. : HSIA: K:2007:1315 dt.09.10.2007 Page 145 of 184
Shriram Institute for Industrial Research: Delhi
♦ Construction dust materials should be sprayed with water for dust suppression prior to any loading, unloading or transfer operation so as to maintain the dusty materials wet to avoid dispersion. Stockpiles of aggregate or spoil shall be covered and water applied.
♦ Vehicles involved in transportation of loose and fine materials like sand and fine aggregates
shall be covered to reduce spills on roads. ♦ The height from which excavated materials are dropped shall be controlled to a minimum
practical height to limit fugitive dust generation from unloading. ♦ Earth moving equipment, typically a bulldozer with a grader blade and ripper shall be used
for excavation work All vehicles, equipment and machinery used for construction shall be regularly maintained to ensure that the pollution emission levels conform to the CPCB norms. Another source of gaseous emissions is the DG sets, which may be used as back up for power generation for pumping stations. The DG sets shall be properly maintained to fulfil the statutory requirements. The periodical ambient air quality monitoring shall be done to ensure that the significant impacts are being mitigated adequately.
5.3.2 Noise Level Management The noise shall be generated mainly due to operations of machinery/equipment/DG Sets used for construction and transportation of materials to the site. The Project Proponent would ensure following measures to minimize the noise levels generated at the site:
♦ DG sets for back-up power to be provided with adequate acoustic enclosure and to be fitted with muffler to reduce the noise in adherence with the regulatory requirements.
♦ All plants and construction equipments shall be fitted with noise control measures.
♦ Acoustic enclosures to be provided for compressors for drills and rock cutters.
♦ Provision of protective devices such as ear muffs/plugs to the workers
♦ Servicing of all construction vehicles and machinery to be done regularly and during routine servicing operations, the effectiveness of exhaust silencers will be checked and if found defective to be replaced.
♦ Vehicles hired for bringing construction materials at site shall conform to the noise emission standards and to be operated during non-peak hours.
♦ To have the provision of Noise Barriers in form of Dense Tree Belt around the Periphery and particularly facing residential areas.
Ambient noise level monitoring shall be conducted at suitable locations at periodic intervals during construction phase to conform to the stipulated standards both during day and nighttime. Data shall be reviewed and analyzed by the project manager for adhering to any strict measure.

Project Title : EIA Study for Development of Industrial Estate of HSIIDC at Sec-37 & Sec-3 Extn, Ph-III, Karnal Project No. : 21-1041/2007-IA.III Contract No. : HSIA: K:2007:1315 dt.09.10.2007 Page 146 of 184
Shriram Institute for Industrial Research: Delhi
(a) Guidelines for control of Pollution from Stationary Diesel Generator (DG) Sets (i) Noise Standards for DG Sets (15-500 KVA) The total sound power level, Lw, of a DG set should be less than, 94+10 log10 (KVA), dB (A), at the manufacturing stage, where, KVA is the nominal power rating of a DG set. (ii) Acoustic enclosure/acoustic treatment of room for stationary DG sets (5 KVA and
above) ♦ Noise from the DG set should be controlled by providing an acoustic enclosure or by treating
the room acoustically. ♦ The acoustic enclosure/acoustic treatment of the room should be designed for minimum 25
dB(A) of Insertion Loss or for meeting the ambient noise standards, which ever is on the higher side (if the actual ambient noise is on the higher side, it may not be possible to check the performance of the acoustic enclosure/acoustic treatment. Under such circumstances the performance may be checked for noise reduction upto actual ambient noise level, preferably, in the nighttime). The measurement for Insertion Loss may be done at different points at 0.5m from the acoustic enclosure/room, and then averaged.
♦ The DG set should also be provided with proper exhaust muffler with Insertion Loss of
minimum 25-dB (A). 5.3.3 Water Resource Management The proper drainage system shall be constructed at site on temporary basis at an early stage. Salient features of water quality management shall comprise of following, which would be ensured by Project Proponent: ♦ Raw water quality shall be checked on regular basis for essential parameters as per BIS
guidelines. ♦ All the waste from the site shall be treated in the septic tanks provided. ♦ All the debris resulting from the site shall be isolated from the waste water and disposed of
separately
♦ A sediment trap shall be provided to prevent the discharge of excessive suspended solids.
♦ Wash down area for cleaning of vehicles wheels shall be provided and wheel wash waste shall be drained properly.
♦ No untreated discharge is to be made to watercourses.
♦ To prevent contamination from accidental spillage of oil, the storage areas shall be bonded and will be inspected and cleaned at regular intervals
♦ Water availability to the construction staff should be fit for drinking purpose. Code to ensure drinking water quality is Indian Standard Specification for Drinking Water Quality IS 10500-1991.

Project Title : EIA Study for Development of Industrial Estate of HSIIDC at Sec-37 & Sec-3 Extn, Ph-III, Karnal Project No. : 21-1041/2007-IA.III Contract No. : HSIA: K:2007:1315 dt.09.10.2007 Page 147 of 184
Shriram Institute for Industrial Research: Delhi
5.3.4 Land Environment Management The following measure shall be adapted by the Project Proponent to prevent/ reduce the soil contamination: ♦ It will be ensured that no construction spoils of any unsuitable material are disposed off on
roadside or any other place in the project area. Litter, fuel, oil drums, used grease cartridges will be collected and removed properly. Dust bins shall be placed at requisite locations
♦ Lubrication waste oil shall be collected separately in drums and shall be disposed of as per
standard practice ♦ Solid waste (building material, metal scrap, wood, plastic etc) generated during the
construction phase shall be properly segregated. The recyclable plastic, metal etc waste should be separately stored. Other material will be used for land filling or the designated Solid waste disposal sites.
♦ Construction debris will be collected and suitably used on site as per construction waste
management plan. The project proponent will take prior permission from the competent authority for disposal of construction waste on landfill site in the project area.
♦ Careful attention will be given for design and maintenance of earthwork and drainage
systems during construction to avoid creation of significant habitat areas for mosquito larvae. Use of larvicides may be required to prevent mosquito breeding in silt traps.
5.3.5 Land Use Pattern and Ecology Management Disturbance during the construction phase shall be of very localized. To keep the disturbance at a minimum, the following measures are recommended: ♦ Land clearing for the construction site will be kept at the absolute minimum practicable ♦ Construction site will be designed to minimize the removal of soil and vegetation ♦ Topsoil will be cleared and stored for later reinstatement purposes by piling along the
boundary of the site 5.3.6 Traffic Movement Management In order to minimize impact of Traffic Movement, following measures would be taken up:
♦ Planning vehicle movements would ensure the minimal use of road and help in reducing the adverse impacts, if any.
♦ Appraisal to traffic police about the construction activities would help in better management.
♦ Road crossings to be used during the construction period shall be well marked to prevent the accidents.
♦ Spray down dirt roads if too dusty
Project Title : EIA Study for Development of Industrial Estate of HSIIDC at Sec-37 & Sec-3 Extn, Ph-III, Karnal Project No. : 21-1041/2007-IA.III Contract No. : HSIA: K:2007:1315 dt.09.10.2007 Page 148 of 184
Shriram Institute for Industrial Research: Delhi
5.3.7 Socioeconomic Environment Management The Project Proponent would ensure the positive impacts on socioeconomic environment and would envisage measures to minimize the negative impacts, if any. ♦ The construction contractor would ensure that kerosene or cooking gas to be provided to
construction workers on-site so that they do not resort to using fuel wood for cooking. ♦ The construction contractor would ensure that temporary sanitary facilities shall be provided
on-site to workers so that proper hygienic conditions could be maintained. ♦ Provide temporary employment generation opportunities 5.3.8 Construction Workers Health & Safety Plan In order to ensure the health and safety of construction workers, project proponent would advise construction contractors to envisage adequate steps, as described below. ♦ To allocate adequate & appropriate place to construction workers so that they can make
temporary sheds for the purpose of dwelling under hygienic conditions. ♦ To provide potable water at site so that workers should not get exposed to water borne
diseases. ♦ To provide first-aid facilities in the proximity of the construction sites and to work on the
modalities for providing immediate ambulance services in the event of any major injury to facilitate workers to avail hospital services well in time.
♦ To provide all necessary safety gadgets to construction workers like helmets, protective
footwear and gloves. The personnel engaged in the work of mixing, cement, lime mortars, concrete etc. to be provided with masks to reduce the impact of direct exposure. Persons to be engaged in welding activities to be provided with protective eye-shields to ensure safety during welding. Ear-plugs are to be provided to workers exposed to high noise areas. Labors working on elevated platforms to be provided with safety belts.
♦ The construction contractor will strictly adhere to the statutory child labour act. ♦ The construction contractor will also ensure that no paint containing lead or lead products is
used except in the form of paste or readymade paint. Facemasks will be provided for use to the workers when paint is applied in the form of spray.
♦ Adequate safety measures will be ensured for workers during handling of materials at site.
The contractor will adhere to all regulations regarding safe scaffolding, ladders, working platforms, gangway, stairwells, excavations, and safe means of entry and exit.
♦ The construction contractor will take adequate precautions to prevent danger from electrical
equipments.

Project Title : EIA Study for Development of Industrial Estate of HSIIDC at Sec-37 & Sec-3 Extn, Ph-III, Karnal Project No. : 21-1041/2007-IA.III Contract No. : HSIA: K:2007:1315 dt.09.10.2007 Page 149 of 184
Shriram Institute for Industrial Research: Delhi
♦ All machines to be used in the construction will conform to the relevant Indian Standard Codes, and will be kept in good working order. These would be regularly inspected and properly maintained as per the provision of standard.
♦ The construction contractor would ensure that no danger or inconvenience to be caused to
any person or the public by placing or stacking the material for construction. ♦ All necessary fencing and lights will be provided to protect the public. ♦ Utmost efforts would be put-up by construction contractor to maintain the aesthetic quality
of the area as well as maintain the optimum lightening in the area to avert any mishappening. 5.4 Impact Mitigation during Operational Phase The Project Proponent would do all out efforts to minimize the negative impacts and enhance the positive impacts during operational phase of the project. 5.4.1 Air Quality Management The operational phase impact of the proposed project would be due to the operation of DG sets in the industrial estate and movement of vehicles The impacts on local air quality would be minimized by adopting following measures: ♦ Development of Green belt with specific species, which would help to attenuate SPM level
as well as the impact of gaseous pollutants. ♦ Use of ultra low sulfur diesel for DG sets and raising the height of stack as per the standard. ♦ Heavy and light vehicles are the other major sources of CO. Awareness to be created among
users of the vehicles to ensure that all vehicles and their exhausts shall be well maintained and regularly tested for emission concentration
♦ All DG sets should have properly insulated exhausts and chimney heights as per MoEF
norms. ♦ Ambient Air Quality would be monitored periodically. 5.4.2 Noise Level Management The Project Proponent would suggest industrial associations as well as housing societies to adopt measures to curb Noise Pollution. Some of the design features would ensure low noise levels, which are given below:
♦ Provision of acoustic enclosure would be ensured by the users, wherever possible (mainly DG sets).
♦ Restricted use of loudspeakers in the sensitive zone.
♦ Noise barriers in form of trees are recommended to be grown around the vicinity. This is the plan as per the landscaping of the area.
Project Title : EIA Study for Development of Industrial Estate of HSIIDC at Sec-37 & Sec-3 Extn, Ph-III, Karnal Project No. : 21-1041/2007-IA.III Contract No. : HSIA: K:2007:1315 dt.09.10.2007 Page 150 of 184
Shriram Institute for Industrial Research: Delhi
All noise generating sources in the industrial area will be equipped with appropriate noise control measures. Sound levels will be consistent with local government regulations. Ambient noise levels will be periodically monitored to determine compliance with the norms. By these measures, it is anticipated that the noise levels in the vicinity would be maintained below the regulatory level. 5.4.3 Land Environment Management Plan (a) Solid waste management With the adoption of sustainable development as an approach to manage the environment, quality waste management techniques is essential. The principle aim of waste management is to sustain the environment by ensuring that waste does not contaminate the environment at such a rate or in such a form or quantity as to overload natural assimilative processes and cause pollution. Eliminating or minimizing waste generation is becoming crucial, both environmentally and economically, for reducing waste-related liabilities and costs. Awareness would be created among industrial associations & housing societies to adopt following practices: Organic waste : Such type of waste (food waste, wood or other biodegradable waste) can be composed and later used as manure Recyclable waste : Wastes like plastic, metals, etc. can be recycled Other wastes control : The sludge generated from the sewage treatment plant (STP) at the plant shall be used as manure for the green belt. Regular monitoring shall be carried out to assess any adverse impact (characterization). The solid waste generated as municipal waste (Garbage & Households) can be collected and segregated along with the domestic waste generated from the plant and will be sent to a municipal waste disposal site allocated by local administrative authorities. MSW Handling & Management Plan (i) Storage of Wastes Appropriate provisions would be made for storage of solid wastes. Adequate means of access would also be provided from the place of storage to a collection point specified by the waste collection authority. Coloured wheeled bins would be provided such as ♦ dark grey for non-recyclable waste ♦ green for kitchen food/ compostable garden waste ♦ blue for paper (generally used for flats, schools, offices etc).
In addition, boxes would be provided for the collection of other recyclable materials; ♦ a green box can be used for paper ♦ a black box can be used for cans and plastic collections. (ii) Bin area design and layout

Project Title : EIA Study for Development of Industrial Estate of HSIIDC at Sec-37 & Sec-3 Extn, Ph-III, Karnal Project No. : 21-1041/2007-IA.III Contract No. : HSIA: K:2007:1315 dt.09.10.2007 Page 151 of 184
Shriram Institute for Industrial Research: Delhi
The diagram shows a suggested possible layout for 1100 litre bin and is only to illustrate the practical set out. A minimum clearance of 150 mm is required around all sides of the bins. Design and choice of construction materials for the bin area will depend upon the individual site. (iii) All bin storage areas should have ♦ Adequate lighting – natural and / or artificial; ♦ Good natural ventilation if completely enclosed e.g. high and low level air bricks; ♦ A smooth, easily cleanable floor e.g. paving or concrete float finished; ♦ The floor laid to a fall with suitable drainage; ♦ A suitable enclosure e.g. wooden fencing, brick or bamboo walls: The diagram below shows
a typical wall construction. In addition, bin storage areas for flats and Multi-storeyed buildings should have:- − A notice showing which properties are entitled to deposit refuse; − Suitable “bump strips” provided internally on doors and walls to help prevent damage
from loaded bins; and − Double doors with a clear opening of at least 1500 mm and a facility to hold doors open
during collection.
(iv) Solid Wastes Management for Proposed Project A permanent dumping site –cum – solid waste treatment plant is in the final stage of completion, which is situated within five kilometers from the proposed industrial town ship of Sector – 37, by Municipal Corporation Karnal. Enough carrier vehicles will be employed by HSIIDC to transport the solid waste to this dumping site. (b) Landscape The Landscape concept for the development of Industrial Estate at Karnal evolves a system of open spaces, which have the potential to develop into a landscape with distinctive visual qualities, fulfilling the required ecological and recreational functions. The location and alignment of existing landscape features would have been used to structure the development.
Bin layout

Project Title : EIA Study for Development of Industrial Estate of HSIIDC at Sec-37 & Sec-3 Extn, Ph-III, Karnal Project No. : 21-1041/2007-IA.III Contract No. : HSIA: K:2007:1315 dt.09.10.2007 Page 152 of 184
Shriram Institute for Industrial Research: Delhi
Advantage would be taken of topographic assets such as the natural drainage as well as major city level open spaces along these corridors, integrating existing landscape and new development. Essentially the proposed landscape comprises of the following interlinked but hierarchical distinct components.
♦ The informal naturalistic component along canal, serving a regional recreation function.
♦ The more formal and organized component serving as a local space system on the East-west drainage corridors.
♦ The open space system within the sectors and neighborhood. (i) Land use : It would be in accordance with the Master Development Plan.
5.4.4 Green Belt Development Plan Mitigation of environmental pollution has emerged as one of the challenging task during the environmental management plan. The status is further likely to become more acute with continued and enhanced rate of development and limitation of the carrying capacity of the respective environmental basins. Hence, a systematic afforestation/ plantation work needs to be carried out in the vicinity of proposed industrial estate, which would be promoted by project proponent and necessary awareness to this effect would also be created by the project proponent. Plantation would facilitate the attenuation of both air and noise pollution. The conceptual approach for development of green belt in and around the project area has multifaceted objectives. Capacity of plants to reduce air pollution is very well known and has been reported in literature. In order to attenuate air and noise pollution and recycling of wastewater, optimum greenbelt development is essential. In this context, size of greenbelt, width of greenbelt and height of greenbelt are critical parameters. Selection of tree species, which can be grown around, is also a matter of concern. Plants differ considerably with reference to their response towards pollutants attenuation, some being highly sensitive and others hardy and tolerant.
(a) Objective of the development of green belt
The objective of optimal development of greenbelt in the project area would be ♦ Attenuation of air/ noise pollutants ♦ Recycling of wastewater ♦ Balancing the ecology of the area ♦ Enhancing the aesthetics and visual quality of the area. (b) Area for the development of greenbelt It is suggested to develop greenbelt in maximum possible area, which would have intensive as well as extensive landscape. The extensive landscape would include trees planted along the periphery of the premises in line as well as in cluster form.
(c) Selection of Plant Species Based on the regional background, soil quality, rainfall, temperature and human interactions, greenbelt has to be developed. For the development of greenbelt, adequate information is required regarding climate, and human interactions. Greenbelt with varieties of species is preferred to maintain species diversity, rational utilization of nutrients and for maintaining health of the trees. Well planned greenbelt will develop a favorable micro-climate to support different micro-organisms in the soil and as a result of which soil quality will improve further,

Project Title : EIA Study for Development of Industrial Estate of HSIIDC at Sec-37 & Sec-3 Extn, Ph-III, Karnal Project No. : 21-1041/2007-IA.III Contract No. : HSIA: K:2007:1315 dt.09.10.2007 Page 153 of 184
Shriram Institute for Industrial Research: Delhi
depending upon the climatological conditions and regional ecological status. Plant species shall be selected based on: ♦ The agro–climatic conditions of the area ♦ Properties of soil ♦ Nature of pollutants The selected plant species should be: ♦ Fast growing, evergreen & with thick canopy ♦ Resistant to pollutants discharged ♦ Indigenous Detailed floral description of the project area has been illustrated in Chapter- 3.8 (Biological Environment). Plants having adaptability with the local agro-climatic conditions can be selected from detailed floral inventory. Major focus would be given on Horticulture & Road Side Plantation, with development in following areas: (i) Development of Parks ♦ The total green area is in the shape of various small parks, which would be fenced with toe
wall & grill fencing.
♦ The central portion of the parks would be covered with fine grassing while the bigger trees would be planted on outer periphery.
(ii) Green Belt
♦ Green belts will be fenced with toe wall & grill fencing and will be developed with thick plantation.
♦ The green belt proposed under the HT over head lines shall be provided with fine grassing and variety of flowering shrubs.
(iii) Road side plantation
♦ Road side plantation will be carried out by sapling of Pikhan, Kusum, Silver Oak, Bahera, Neem and Kanak Chama.
♦ Jamun, Gulmohar, Papri, Putranjiva, Amaltas, Pilkhan and Maulsari would be planted for development of green belt.
♦ Plantation of Neem, Amaltas, Pipal, Pilkhan and Maulsiri are recommended for parking areas.
(iv) Other plants
Peacock flower, Paper-chase tree, Gardenia brilliant gardenia, Golden champak, Yellow oleander, Rangoon creeper, oinsettia, Coral creeper, Moonbeam, Golden shower, Redbell bush tree of sorrow, Glory lily heavenly blue etc. would be planted in the vicinity of project site.
(d) Plantation Technique
For plantation of small plants digging of pits is very important for preparing soil environment near the roots of the plants. Size of the pit should be optimum enough to supply required nutrients to the roots of the plants. The usual method is to dig pit of required size, 3 to 4 months before planting of species, which is generally done at the break of the monsoon. The pits of 45 x 45 x 45 cm size in case of hardier species, like eucalyptus, shisham, acacia, etc., but larger pit size is preferred for fruit yielding trees like mango, jamun, etc. 1 x 1 x 1 m pits may be used for
Project Title : EIA Study for Development of Industrial Estate of HSIIDC at Sec-37 & Sec-3 Extn, Ph-III, Karnal Project No. : 21-1041/2007-IA.III Contract No. : HSIA: K:2007:1315 dt.09.10.2007 Page 154 of 184
Shriram Institute for Industrial Research: Delhi
plantation of other trees. The soils of the plant side should be mixed with one-third farm yard manure before refilling about a week prior to planting. In poor soils where nutrient contents are inadequate, it is necessary to add chemical fertilizers for optimum growth. Details of the plantation procedure to be followed is described below: ♦ Excavate a trench of about 1 x 1 x 1m size. ♦ Removes excavate earth from the trenches. ♦ Fill up excavated trench with equal quantity of soil and compost with little quantity of gypsum. ♦ Add water continuously 3-4 days after refilling the trench with soil and compost.
(e) Water Demand for Landscaping
Landscaping forms an important part of the building environment. This is constituted by combination of vegetation, paving and various other landscape features such as water bodies. The vegetation includes lawns, shrubs, herbs and trees. In general, the water demand for lawns and shrubs are higher as compared to trees, which does not require or require less water after establishment. In addition, native species also require less water.
Measures for reducing water demand for landscape
The water consumption for the gardening depends on the type of plant species and the plant factors. As the plant factor for native species and trees is the minimum, one of the options to reduce the water demand for gardening is to include more native species and low water consuming species. Other options include use of efficient fixtures for watering, following certain best practices to minimize losses and optimize consumption. (i) Xeriscaping: Xeriscape is one of the efficient ways to reduce water consumption through creative landscaping. This involves plantation of dry plants and those plants, which can live, once established, with little or no supplemental watering. Some of these are also drought tolerant and can survive even in areas with minimal rainfall. Some of the palm trees such as Phoenix dactylifera, Yucca starlite and groundcovers such as Asparagus sprengeri, which is succulent, can be used as part of the landscape to conserve water. Other species namely, Pandanus Dwarf, which is xerophytic, and Bougainvillea which is a climber would also help in water use minimization. (ii) Native vegetation Native vegetation is original to a particular place, including trees, shrubs, and other plants. These generally require less water and less maintenance.
(iii) Efficient irrigation equipments Drip irrigation To save water, drip irrigation is an efficient technique as it prevents loss of water due to evaporation, run-off and percolation. Further, it has a better control and facilitates uniform water distribution. However, this system cannot be used for lawns and ground covers but for non-native turf and other non-xerophytic plants. Sprinkler irrigation Sprinkler irrigation system requires a network of pipes and pumping system to maintain sufficient pressure for uniform distribution. It is best suited for areas with sandy soils, which have high infiltration rates. To prevent water logging, the system should be designed in such a

Project Title : EIA Study for Development of Industrial Estate of HSIIDC at Sec-37 & Sec-3 Extn, Ph-III, Karnal Project No. : 21-1041/2007-IA.III Contract No. : HSIA: K:2007:1315 dt.09.10.2007 Page 155 of 184
Shriram Institute for Industrial Research: Delhi
way that infiltration rate exceeds the application rate. Sprinklers, which can produce fine sprays, are more efficient as compared to those that produce large water droplets. The efficiencies of irrigation systems differ widely. Further, to improve the efficiency certain measures can be followed, which includes use of a pressure regulator for pressures greater than 30 psi which will significantly reduce the loss during watering. Efficiencies of different kinds of irrigation equipment are given below: Irrigation System Efficiency♦ Micro, drip : 85% ♦ Micro, spray : 80% ♦ Multiple sprinkler : 75% ♦ Sprinkler, container nursery : 20% ♦ Sprinkler, large guns : 70% ♦ Seepage : 50% ♦ Crown floods : 50% Fixed time schedule for watering Time schedule for watering of plants plays an important role in saving water. Irrigation should be done during the coolest time of the day (early mornings and evenings) to avoid loss due to evaporation and wind drift. Also, the frequency of irrigation should be reduced during the winters. Regular flushing of the irrigation lines and other parts should be done. The use of combination of mitigation options can result in savings of water as indicated below. It indicates the reduction in water that is possible by stepwise reduction in areas of high water consuming species. By reducing the lawn area by 50% and replacing it with shrubs, it is possible to achieve 32 % savings and by further introducing native species to the level of 25%, further increase in savings of 42% is achieved.
Options Savings in water (%) ♦ 100% Lawn : - ♦ 50% lawn : 50% shrubs : 32 % ♦ 50% lawn : 25% shrubs : 25% natives : 75 % ♦ 100% native : 64 %
Ecological system consisting of varieties of interrelationship between both Biotic and abiotic components including dependence, competition and mutualism. Biotic components comprising of both plant and animal communities used to interact with abiotic physical and chemical components of the environment. The choice of the plant species is broadly determined by the climate and ground condition. In the development of green belt areas, multipurpose plant species should be selected. This will automatically satisfy the ecological requirement of plant diversity.
(e) Green belt design for proposed on the layout The layout has been enclosed for the green belt design for the proposed, which indicates 30 metre wide green belt all along 90 metre road as well as along one of 45 m roads. In addition, various parks have been carved out. The green strips below 400 KV and 220 KV H.T lines may also be developed. Walkways have also been proposed in the green belt of 30 m wide road. A total of around 186 acres of land under green belts and parks have been planned.
Project Title : EIA Study for Development of Industrial Estate of HSIIDC at Sec-37 & Sec-3 Extn, Ph-III, Karnal Project No. : 21-1041/2007-IA.III Contract No. : HSIA: K:2007:1315 dt.09.10.2007 Page 156 of 184
Shriram Institute for Industrial Research: Delhi
(f) Budget for Horticulture and Road Side Plantation Sizable amount will be earmarked for hrticulture as per Govt. of Haryana Rules. 5.4.5 Water Environment Management (a) Ground Water Quality and Quantity Rainwater harvesting for optimum utilization of rainwater would help in recharging the ground water level / bore well area. It can be facilitated by well-designed storm water networks to collect the rainwater from the site area and diverted to the rainwater harvesting pits for recharging the ground water. Run off from building areas during rains will be utilized for harvesting and recharge of ground water. Appropriate water conservation measures will be adopted in regular activities. The Project Proponent would create awareness among industrial associations and housing societies to adopt rainwater-housing practices for conservation of groundwater resources.
(b) Water Supply Half of the water demand will be met through canal water and the rest by eight tube wells (5 new tube wells in sector – 37 and three existing tube well from Sector – 3 Extn. Design of tube wells Total water demand excluding the fire fighting demand : 12000litr/ per acre Demand to be met through local tubewells (50% of total demand ) : 6000 litre/ per acre Anticipated yield from one tubewell - Rate : 7000 litres/ hour
Running hours : 16 hours Yield from one tubewell : 7000 litre/hour No. of tubewells planned: 5 new tube wells in sector –
37 and 3 existing tube wells from Sector – 3 extn.
Water demand to be met bore wells wells and tube wells along river Yamuna has been described in table-5.4 (d). It has been proposed that all plots of size 2 acres and above shall treat the wastewater to the extent of 30% of their discharge to cater for air conditioning, horticulture and extra demand for processing, if any. 5.4.6 Wastewater Management The wastewater collection & treatment system will be designed as per the guidelines laid in the Manual of Water Supply & Sewerage published by Ministry of Urban Development, Govt. of India. ♦ The industries would treat their total wastewater to the extent to make it fit to be discharged
into the Public Sewer as per guidelines laid in manual.
♦ The bigger plot holders (higher than 1 acre) shall treat atleast 30% of the discharge to the extent of tertiary level treatment for the use as recycled water for air conditioning, horticulture & additional industrial demand.
♦ The site of Common Effluent Treatment Plant has been proposed in land marked for utilities in Sector-37.
♦ The horticulture demand of water shall be met by recycling of wastewater up to tertiary treatment level.

Project Title : EIA Study for Development of Industrial Estate of HSIIDC at Sec-37 & Sec-3 Extn, Ph-III, Karnal Project No. : 21-1041/2007-IA.III Contract No. : HSIA: K:2007:1315 dt.09.10.2007 Page 157 of 184
Shriram Institute for Industrial Research: Delhi
(a) Wastewater Generation The wastewater generation by proposed project would be as per the following details: ♦ It is assumed that 75% of water supplied will find its way into sewerage system excluding
horticulture demand.
♦ Peak flow during morning & evening hours will be 3 times the average flow.
♦ Peak flow in the main sewers will be 3 times the average flow.
♦ Infiltration of ground water is taken @ 25% of average flow. Summary of wastewater generation
♦ Total average waste water generated per day = 4500 KLD
♦ Waste water generated by bigger plots = Will be presented later
♦ 30% to be treated within the plot = Will be presented later
♦ Net waste water available = Will be presented later
(b) Wastewater Treatment Waste water Treatment plant will be installed for treating 4500KLD wastewater as its expected that demand may rise gradually in 10 years. The expected characteristics of composite equalized untreated/ raw effluent containing both industrial and domestic wastewater are given in following table:
Table-5.4 (a) Characteristics of composite equalized untreated/ raw effluent
Sl. Parameter Values 1. pH 6.0-8.5 2. Total Suspended Solids, mg/l 250 –500 3. Chemical Oxygen Demand (COD), mg/l 800-1000 4. Biochemical Oxygen Demand (BOD3/27°C), mg/l 400-500 5. Oil & grease, mg/l 40-50 The Common Effluent Treatment Plant would have following treatment units:
− Screen Chamber − Oil cum grease removal traps − Grit removal system/ pre-settlers − Pump House-1 − Equalization Tank − Chemical house-chemical store, solution tanks & dosing pumps − Flash mixing tanks − Flocculation Tank − Primary clarifier − Aeration Tank − Secondary clarifier − Return Activated Sludge (RAS) Pump House-2 − Sludge handling system-Filter Press

Project Title : EIA Study for Development of Industrial Estate of HSIIDC at Sec-37 & Sec-3 Extn, Ph-III, Karnal Project No. : 21-1041/2007-IA.III Contract No. : HSIA: K:2007:1315 dt.09.10.2007 Page 158 of 184
Shriram Institute for Industrial Research: Delhi
− Tertiary Treatment Pump House-3 − Dual Media Pressure Filters − Wet sludge pit and Pump House-4 − Dry Sludge Storage
The treated effluent would meet the effluent discharge standards as shown in following table subject to compliance with following:
− The implementation of treatment scheme in totality (CETP units matching with sizes, shapes/ configuration as per the Technical Feasibility Report).
− Total daily discharge of untreated effluent (combined influent to CETP) does not exceed 10.5 MLD.
− Regular operation of plant − Adequacy study of plant
Table-5.4 (b) Effluent discharge standards for treated effluent
Sl. Parameters Value 1. pH 6.5-9.0 2. Total Suspended Solids, mg/l 100, max 3. Chemical Oxygen Demand (COD), mg/l 250, max 4. Biochemical Oxygen Demand (BOD3/27°C), mg/l 30, max 5. Oil & grease, mg/l 10, max 6. Sulphates (as SO4), mg/l 1000, max 7. Total chromium (as Cr), mg/l 2.0, max 8. Phenolic Compounds (as C6H5OH), mg/l 1.0, max 5.4.7 Storm Water Drainage Storm water drainage scheme would be designed as per the guidelines laid in Manual of Sewerage issued by Ministry of Works & Housing, Govt. of India. To ensure the gravity flow of storm water, it is proposed that
♦ Covered rectangular drainage system has to be adopted for collection of storm water runoff from sectors instead of conventional covered pipe drains. The system will ensure gravity flow into master storm water system.
♦ Covered underground RCC pipes have been proposed on one side of all roads to ensure gravity flow of storm water into master storm water system.
The anticipated storm water flow has to be calculated as under: ♦ The internal storm water drains will be designed for ¼” rainfall per hour per acre intensity.
The main connecting trunk storm sewers will be designed at 1/8” rainfall per hour per acre.
♦ Commercial area will be designed at ¼” rainfall per hour/ acre.
(a) Planning of internal drainage system The following factors would be taken into consideration for planning of the drainage system:
♦ The pattern & gradient of natural slope of the site, its extent and direction.
♦ The natural drainage system in the downstream area (outside the project area).

Project Title : EIA Study for Development of Industrial Estate of HSIIDC at Sec-37 & Sec-3 Extn, Ph-III, Karnal Project No. : 21-1041/2007-IA.III Contract No. : HSIA: K:2007:1315 dt.09.10.2007 Page 159 of 184
Shriram Institute for Industrial Research: Delhi
♦ The road network system envisaged and finished level of roads. ♦ The runoff from units and other built up areas to lead into catch basin connected to branch
drains along the access roads. These drains will take storm water into nearest lateral drains and then into trunk drains on main roads, which would eventually take the storm water into the natural system.
♦ The rain water from open spaces as well as from isolated places, would flow over the ground
following the natural slope gradient and get into the nearest drain through the vertical grating.
(b) Quantification of Rainfall Runoff Estimated by following the rational formula as per Indian Road Congress Special Publications (IRC 13, IRC 40, IS 50) Q = 0.098 * P * F * A * Lo * 2/ Tc+1 Where P = Runoff factor = 0.80 Lo = Maximum intensity of rainfall = 2.5 cm/hr
F = Intensity Factor = 1 Tc = Time of concentration (in hour)
A = Area in hectares Q = Max. Runoff in Cusecs
♦ The total runoff would be about 190 cusecs.
♦ No. of recharge wells (as per design) shall be provided all along the major roads and as such the runoff during the normal rains shall get absorbed through these recharge wells. While during the peak intensity of rainfall, the drainage system would carry the surplus water to be pumped into Agra canal.
(c) Design of drains To ensure the gravity flow of storm water, it is proposed that
♦ Covered pipe drainage system will be adopted for collection of storm water runoff from sectors instead of conventional un-covered drains. The system will ensure gravity flow into master storm water system.
♦ Kerbs and Channels have been proposed along roads to chennilize the storm water and is collected into pipe drain through road-gullys at regular intervals.
(d) Location of drain & network The drains will be located near the carriageway along either side of all the roads, in case of roads having camber on both sides and on one side of road having camber on one side. Taking the advantage of road camber and embankments, the rainfall runoff from roads shall flow towards the drains. 5.4.8 Rain Water Harvesting The rain water harvesting would be essential for the operational phase of proposed project because surface water would be inadequate to meet the water requirements of proposed project. Recharging would be done through pits, trenches, wells, shafts etc. In case of roof top area more

Project Title : EIA Study for Development of Industrial Estate of HSIIDC at Sec-37 & Sec-3 Extn, Ph-III, Karnal Project No. : 21-1041/2007-IA.III Contract No. : HSIA: K:2007:1315 dt.09.10.2007 Page 160 of 184
Shriram Institute for Industrial Research: Delhi
than 100 m2, the roof top rain water harvesting would be made mandatory and would be done by individual plot holders. Rooftop Rain Water Harvesting through trench with Recharge Well In areas where the surface soil is impervious and large quantities of roof water or surface runoff is available within a very short period of heavy rainfall, the use of trench/ pits is made to store the water in a filter media and subsequently recharge to ground water through specially constructed recharge wells. This technique is ideally suited for area where permeable horizon is within 3 m below ground level.Recharge well of 100-300 diameter is constructed to a depth of at least 3 to 5 m below the water level. Based on the lithology of the area well assembly is designed with slotted pipe against the shallow and deeper aquifer. A lateral trench of 1.5 to 3m width and 10 to 30 m length, depending upon the availability of water is constructed with the recharge well in the centre. The number of recharge wells in the trench can be decided on the basis of water availability and local vertical permeability of the rocks. The trench should be backfilled with boulders, gravels and coarse sand to act as a filter media for the recharge wells.

Project Title : EIA Study for Development of Industrial Estate of HSIIDC at Sec-37 & Sec-3 Extn, Ph-III, Karnal Project No. : 21-1041/2007-IA.III Contract No. : HSIA: K:2007:1315 dt.09.10.2007 Page 161 of 184
Shriram Institute for Industrial Research: Delhi
If the aquifer is available at greater depth say more than 20 m, a shallow shaft of 2 to 5 m diameter and 3-5 metres deep may be constructed depending upon availability of runoff. Inside the shaft a recharge well of 100-300 mm dia is constructed for recharging the available water to the deeper aquifers. At the bottom of the shaft a filter media is provided to avoid choking of recharge well.
5.4.9 Parking in Karnal Due to the widespread development & exponential increase in the number of vehicles, parking problem has been witnessed at many places and it becomes a severe problem, if left unmanaged. Most of the parking is, in fact, being done on the road, which significantly reduces the carriageway width. Measures to be taken up by project proponent together with industrial associations, housing societies & other stakeholders to alleviate the problem, to some extent, would be as under:
♦ No encroachments on residential streets in the form of kitchen gardens/roadside private greens, large projections/ramps, etc.
♦ The road cross sections may be redesigned wherever possible to accommodate planned car parking along residential streets, and also to create more surface movement space.
♦ The RWAs will have to be called upon to participate in the process for addressing the parking problems in the residential areas.
The Project Proponent would take adequate measures to address the parking problems. 5.4.10 Energy Management proposed The Renewable Energy Department, Haryana Government issued following order vide No. 22/52/05-5p dated 25th June 2008
♦ The use of compact Fluorescent Lamps (CFLs) and / or T-5 (28 watt) energy efficient tube lights and/ or Light Emitting Diode (LED) lamps shall be mandatory for all electricity consumers in industrial, commercial and institutional sectors having connected load of 30 KW or above.
♦ In all Central Government offices and Central Public Sector Undertaking institutions/ establishments located in the state of Haryana, the use of Compact Fluorescent Lamps (CFLs) and/ or T-5 (28 Watt) energy efficient tube lights and/ or Light Emitting Diode (LED) lamps shall be mandatory.
Mandatory use of Energy Efficient Street Lights It shall be mandatory that the street lighting in all existing and new colonies and urban areas notified by the Urban Local Bodies Department, Haryana Urban Development Authority, Haryana State Industrial and Infrastructure Development Corporation, housing complexes, colonies and townships developed by private/ semi government/ autonomous institutions shall use energy efficient street lighting fixtures using T-5 tube lights/ Light Emitting Diode (LED) Lamps/ Low Pressure Sodium Vapour (LPSV)/ High Pressure Sodium Vapour (HPSV)/ Induction Arc Lamps.
HSIIDC, Head Office, at Panchkula issued notice vide letter No. HSIIDC:IA:2009:5533 to 49 dated 18.03.2009 to all field offices to strictly comply with the mandatory requirements of The Renewable Energy Department, Haryana Government, in context to the use of

Project Title : EIA Study for Development of Industrial Estate of HSIIDC at Sec-37 & Sec-3 Extn, Ph-III, Karnal Project No. : 21-1041/2007-IA.III Contract No. : HSIA: K:2007:1315 dt.09.10.2007 Page 162 of 184
Shriram Institute for Industrial Research: Delhi
Energy Efficient Lighting (CFL & T5) energy efficient tube lights and energy efficient street lights. The notification issued to field offices :
♦ To replace all the incandescent lamps and 40W tubelights with conventional choke with CFL & T5-28W tube lights respectively.
♦ To replace all the old tube light street light fixtures with energy efficient street fixtures.
(a) Electrification Requirement : There are no standard norms for calculation of electrical load for industrial areas. It is also not possible to fix norms as the electric load requirements will be different for different type of industry. However, based on the actual experience of IMT Manesar, following benchmark can be made for industrial areas:
Table-5.4 (c) Area wise benchmarking for electric load Sl. Area Electric Load 1. 0.125 acre 30 KW 2. 0.25 acre 50 KW 3. 0.5 acre 75 KW 4. 1 acre 100 KW5. 2 acre 200 KW 6. 5 acre 1000 KW 7. 10 acre 4000 KW 8. Above 10 acre 5000 KW
(b) Load Calculations The load calculations for the industrial estate being developed by HSIIDC at Karnal for various categories/ landuses would be as under
Table-5.4 (d) Areawise tentative electrical load in MW Sl. Category/ Landuse Approx. Area
(acres) Tentative Load
(MVA) 1. Industrial Plots 89.8 20.0 2. Commercial Use 185.37 11.0 3. R & R Policy 11.53 0.54. Institutional use 4.55 0.255. Disposal Site 8.40 0.12 6. Multi – Specialty Hospital 4.53 2.0 7 Utilities 5.67 0.05 8 Open Space, Green Belts etc 92.70 - Total 33.92 MVA
35 MVA (c) Design & Proposal As per norms of HVPN/ DHBVN, for load above 63 MVA, the consumer has to provide 220 kV sub-station. Since the present load is 35 MVA, one no. of 132/11 KV Substation is proposed with 2 x 16/20 MVA power transformers. The area requirement is 4 acre approximately. (d) Distribution System The distribution system is proposed as under:

Project Title : EIA Study for Development of Industrial Estate of HSIIDC at Sec-37 & Sec-3 Extn, Ph-III, Karnal Project No. : 21-1041/2007-IA.III Contract No. : HSIA: K:2007:1315 dt.09.10.2007 Page 163 of 184
Shriram Institute for Industrial Research: Delhi
♦ In the pockets sector 37 and Sector – 3 (extn.), where there is concentration of small plots measuring 450/ 900 m2 and load requirement is mostly of LT category, it is proposed to make provision for 1000 KVA & 630 KVA distribution transformers & only under ground LT system.
♦ The composite LT & HT system is proposed in front of 0.5 acre plot while only HT over head system is proposed in the rest of area.
♦ The transformers for other common services should be separately provided for connections.
♦ The street lights shall be of LED & CFL fittings to economize power consumption. (e) Phasing for implementation The system is proposed to be laid in phases depending upon the requirements
♦ In the 1st phase, it is proposed to lay the entire 33 kV, 11 kV & LT lines, but only 4 Nos. 33 kV sub-stations at the locations where there is load demand.
♦ Initially 33 kV independent line would be erected from 400 kV sub-station or nearby 33 kV sub-station under erection for feeding this load.
♦ The remaining 33 kV sub-stations would subsequently be added according to the load
demand. ♦ The 220 kV sub-station at industrial estate would then be erected when the load
requirements exceed 50 MVA
(f) Street lighting As per notification issued by Govt. of Haryana vide ref. No. 22/52/05-5 dated 25.06.2008 & DHBVN circular No. D-35/2008 the use of CFL/T-28 Energy Efficient tube lights/ LED lamps shall be mandatory for all electricity consumed in industrial, institutional & commercial sectors having connected load of 30 kW or above. In this context, following proposal has been made:
♦ CFL & LED lights have been proposed on street lights consisting of 2 units of CFL of 36 watts each to economize power consumption.
♦ 80 watts LED lights have been proposed on 30 metre road on one side at a convenient distance as per design with 9 metre high steel tabular poles.
♦ 80 watts LED lamps have been proposed on 45 metre road in central verge at a convenient distance as per design with 11 metre high steel tubular poles.
♦ At road junctions also 80 watts LED lamps have been proposed.
♦ All street lighting shall be flexible non-metallic, suitable for direct burial, sized to suit wire sizes with a minimum of 50 mm diameter. Road crossing shall be indirect burial conduit.
♦ Phase wise circuits shall be maintained from pole to pole to ensure energy conservation i.e 1/3” of illumination can be switched off at a time.
(g) Mandatory use of Solar Water Heating Systems

Project Title : EIA Study for Development of Industrial Estate of HSIIDC at Sec-37 & Sec-3 Extn, Ph-III, Karnal Project No. : 21-1041/2007-IA.III Contract No. : HSIA: K:2007:1315 dt.09.10.2007 Page 164 of 184
Shriram Institute for Industrial Research: Delhi
The Government of Haryana has issued following directions for efficient use of energy and its conservation in the State of Haryana vide notification No. 22/52/05-5P dated 29th July 2005. (i) The use of solar water heating systems will be mandatory in the following categories of
buildings namely:
♦ Industries where hot water is required for processing
♦ Hospitals and Nursing homes including Government hospitals
♦ Hotels, Motels and Banquet halls ♦ Jail Barracks, Canteens ♦ Housing complexes set up by Group Housing Societies/ Housing Boards
♦ All residential buildings built on a plot of size 500 square yards and above falling within the limits of municipal committees/ corporations and HUDA sectors.
♦ All Government buildings, residential schools, educational colleges, hostels, technical/ vocational education institutes, District Institutes of Education and Training, Tourism Complexes and Universities etc.
(ii) Haryana Renewable Energy Development Agency will act as an approved source for
supply and installation of solar water heating system in the state to ensure the installation of optimally designed quality systems as per the specifications.
(iii) All the line departments like Town and Country Planning Dept, PWD, Housing Board,
PHED, Architecture Dept. will amend their rules/ bye-laws within a period of two months from the date of issue of this order to make the use of solar water heating systems mandatory.
(iv) These departments will also designate a district and a state level nodal officer to monitor
and report the progress of enforcement of the State Government decisions to the Department of Renewable Energy on quarterly basis in the prescribed format.
HSIIDC, Head Office, at Panchkula issued notice vide letter No. HSIIDC:IA:2006:392 dated 20.04.2006 to all field offices to strictly comply with the mandatory requirements of The Renewable Energy Department, Haryana Government, in context to the use of Solar Water Heating System in buildings. Following proposal has been made for the proposed industrial estste in above context: ♦ All traffic signals to operate on the solar system. ♦ All public buildings for proposed estate will have solar water heating system in accordance
with rules in force. (h) Energy Efficient Building Design Keeping in view the potential of energy conservation in the buildings by incorporating energy efficient and solar passive building design concepts, the Haryana Government has made it mandatory that all the new building to be constructed in Government/ Government aided sector
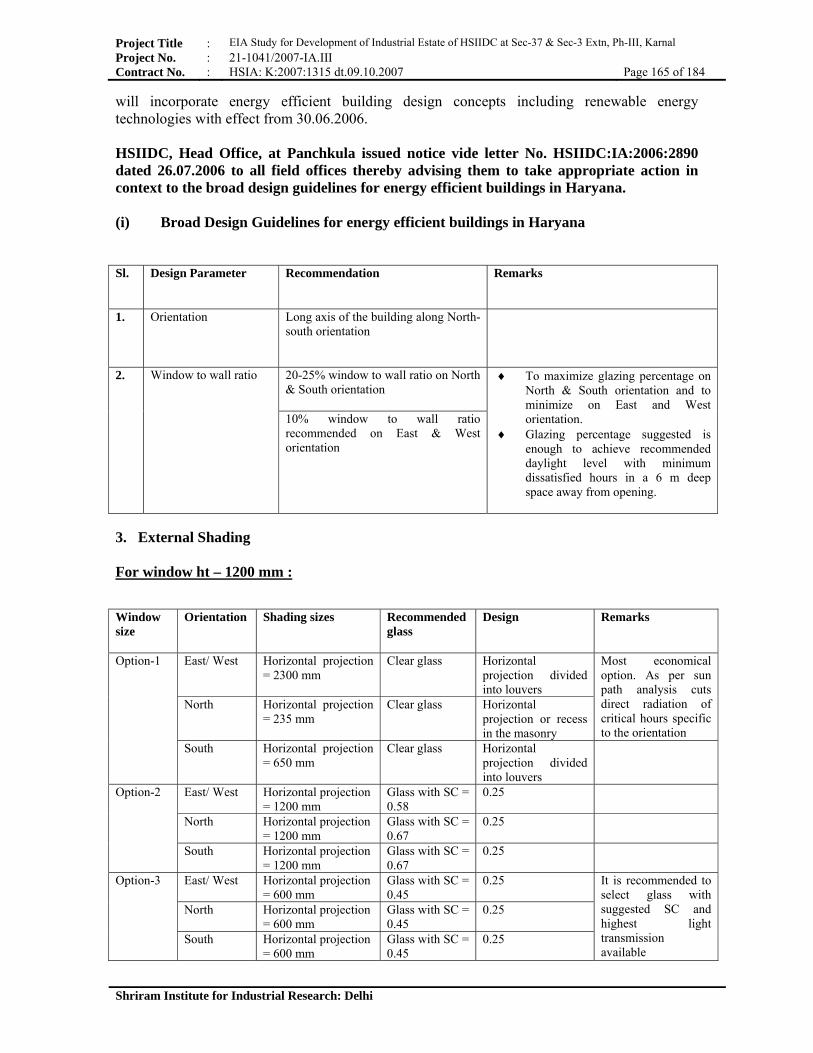
Project Title : EIA Study for Development of Industrial Estate of HSIIDC at Sec-37 & Sec-3 Extn, Ph-III, Karnal Project No. : 21-1041/2007-IA.III Contract No. : HSIA: K:2007:1315 dt.09.10.2007 Page 165 of 184
Shriram Institute for Industrial Research: Delhi
will incorporate energy efficient building design concepts including renewable energy technologies with effect from 30.06.2006. HSIIDC, Head Office, at Panchkula issued notice vide letter No. HSIIDC:IA:2006:2890 dated 26.07.2006 to all field offices thereby advising them to take appropriate action in context to the broad design guidelines for energy efficient buildings in Haryana. (i) Broad Design Guidelines for energy efficient buildings in Haryana Sl. Design Parameter Recommendation Remarks
1. Orientation Long axis of the building along North-south orientation
2. Window to wall ratio 20-25% window to wall ratio on North & South orientation
♦ To maximize glazing percentage on North & South orientation and to minimize on East and West orientation.
♦ Glazing percentage suggested is enough to achieve recommended daylight level with minimum dissatisfied hours in a 6 m deep space away from opening.
10% window to wall ratio recommended on East & West orientation
3. External Shading For window ht – 1200 mm : Window size
Orientation Shading sizes Recommended glass
Design Remarks
Option-1 East/ West Horizontal projection = 2300 mm
Clear glass Horizontal projection divided into louvers
Most economical option. As per sun path analysis cuts direct radiation of critical hours specific to the orientation
North Horizontal projection = 235 mm
Clear glass Horizontal projection or recess in the masonry
South Horizontal projection = 650 mm
Clear glass Horizontal projection divided into louvers
Option-2 East/ West Horizontal projection = 1200 mm
Glass with SC = 0.58
0.25
North Horizontal projection = 1200 mm
Glass with SC = 0.67
0.25
South Horizontal projection = 1200 mm
Glass with SC = 0.67
0.25
Option-3 East/ West Horizontal projection = 600 mm
Glass with SC = 0.45
0.25 It is recommended to select glass with suggested SC and highest light transmission available
North Horizontal projection = 600 mm
Glass with SC = 0.45
0.25
South Horizontal projection = 600 mm
Glass with SC = 0.45
0.25

Project Title : EIA Study for Development of Industrial Estate of HSIIDC at Sec-37 & Sec-3 Extn, Ph-III, Karnal Project No. : 21-1041/2007-IA.III Contract No. : HSIA: K:2007:1315 dt.09.10.2007 Page 166 of 184
Shriram Institute for Industrial Research: Delhi
Option-4 East/ West No external shading Glass with SC = 0.29
0.25
North No external shading Glass with SC = 0.29
0.25
South No external shading Glass with SC = 0.29
0.25
Non-air conditioned Spaces Design Parameters Recommendations Construction Remarks
Wall alternatives Double brick cavity walls Internal plaster + single brick + air
gap + single brick + external plaster
No insulation required between the cavity
Roof alternatives 1. Shaded + insulated roof with white china mosaic finish
Internal plaster +concrete slab + 3” insulation & water proofing + tile finish
2. Non air conditioned spaces below air conditioned spaces
Ground floor non-air conditioned comfort would be achieved through ceiling fans, while on the upper floors where roofs are exposed to direct solar radiation additional mechanical ventilation is required
Glazing alternatives Single glazing 100% shaded by external shading devices
Airconditioned Spaces (i) Wall alternatives Design Parameters
Recommendations Construction Remarks Annual Energy Saving
For both daytime and 24-hour occupied building
U-factor : 0.062 Btu/hr ft2 F (0.352 W/m2 C)
1. Brick wall + 3” Extruded polystyrene
Internal plaster + Single brick + insulation + External plaster
Rs.975 / m2 3-10%
2. Brick wall + 3.5” Rock wool Internal plaster + insulation + single brick + external plaster
Rs.525 / m2
3. Brick wall + 3.5” expanded polystyrene
Internal plaster + insulation + single brick + external plaster
Rs.600 / m2
4. Brick wall + 3” polyurethane/ polyisocyanurate spray
Brick wall + 3” polyurethane/ polyisocyanurate spray
Rs.1600 / m2
(ii) Roof alternatives Design Parameters
Recommendations Construction Remarks Annual Energy Saving
For daytime (8-hour) occupied building
U-factor : 0.072 Btu/hr ft2 F (0.409 W/m2 C)
- -

Project Title : EIA Study for Development of Industrial Estate of HSIIDC at Sec-37 & Sec-3 Extn, Ph-III, Karnal Project No. : 21-1041/2007-IA.III Contract No. : HSIA: K:2007:1315 dt.09.10.2007 Page 167 of 184
Shriram Institute for Industrial Research: Delhi
1. Roof insulation + 2.5” extruded polystyrene and reflective external surface
Internal plaster + concrete slab + water proofing + insulation + tile finish
Rs.1100 / m2 3-10%
2. Roof insulation + 2” polyurethane spray and reflective external surface
Internal plaster + concrete slab + water proofing + insulation + tile finish
Rs.820 / m2 -
3. Roof insulation + 3.2” perlite and reflective external surface
Internal plaster + concrete slab + water proofing + insulation + tile finish
Rs.570 / m2 -
4. Roof insulation + 6” insuplast and reflective external surface
Internal plaster + concrete slab + water proofing + insulation + tile finish
Rs.608 / m2 -
Design Parameters
Recommendations Construction Remarks Annual Energy Saving
For 24-hour occupied building
U-factor : 0.046 Btu/hr ft2 F (0.261 W/m2 C)
- -
1. Roof insulation + 4” extruded polystyrene and reflective external surface
Internal plaster + concrete slab + water proofing + insulation + tile finish
- 3-10%
2. Roof insulation + 3.2” polyurethane spray and reflective external surface
Internal plaster + concrete slab + water proofing + insulation + tile finish
- -
3. Roof insulation + 5.5” perlite and reflective external surface
Internal plaster + concrete slab + water proofing + insulation + tile finish
- -
(iii) Glazing alternatives Sl. Recommendations Remarks Annual Energy
Saving 1. U-factor : 0.56 Btu/hr ft2 F
(3.177 W/m2 C) ♦ Solar heat gain coefficient : 0.25 ♦ Visible light transmittance : 50%
-
(j) Lighting System
Building Component NBC standard for illumination ECBC standard for
LPD Drawing boards 500-750-1000 15.1 General office 300-500-750 11.8 Computer workstation 300-500-750 11.8 Conference room 300-500-750 14 Executive office 300-500-750 11.8Computer & data preparation rooms 300-500-750 11.8 Drawing office general 300-500-750 11.8 Filing 200-300-500 8.6 Computer aided design & drafting 200-300-500 11.8 Print rooms 200-300-500 11.8 Public area 200-300-500 11.8 Entrance hall 150-200-300 12.9 Lobby atrium 150-200-300 6.5 waiting rooms 150-200-300 12.9 Canteen 150-200-300 12.9

Project Title : EIA Study for Development of Industrial Estate of HSIIDC at Sec-37 & Sec-3 Extn, Ph-III, Karnal Project No. : 21-1041/2007-IA.III Contract No. : HSIA: K:2007:1315 dt.09.10.2007 Page 168 of 184
Shriram Institute for Industrial Research: Delhi
Dining rooms 150-200-300 9.7 Rest rooms 100-150-200 9.7 Circulation 50-100-150 5.4 Lift 50-100-150 5.4 Corridors 50-100-150 5.4 Stairs (active) 50-100-150 6.5 Ramps 30 6.5 Interior parking area 5-20 - 5.4.11 Rehabilitation and Resettlement (R&R) Plan The aim of R&R plan is to minimize large-scale displacement, as far as possible. Only the minimum area of land commensurate with the purpose of the project may be acquired. Also, as far as possible, projects may be set up on wasteland, degraded land or un-irrigated land. Acquisition of agricultural land for non-agricultural use in the project may be kept to the minimum; multi-cropped land may be avoided to the extent possible for such 'purposes, and acquisition of irrigated land, if unavoidable, may be kept to the minimum. (a) Land Acquisition for Proposed Project In pursuance of the Government Notification No. 2/6/7-1-IBII-2006 dated 27th April, 2006, published in Government Gazette dated 27th April 2006, u/s-4 of the Land Acquisition Act 1894 (hereinafter referred to as the Act) and declared vide notification No. 2/6/7-1-IBII-2006 dated 26th April, 2007, u/s-6 of the Land Acquisition Act 1894 thereinafter published in Government Gazette dated 27th April 2007, the government acquired 226 acres 5 kanal 10 marla of land in villages Karnal and Kambopura at public expense, for public purpose namely for the development of Industrial Estate, Sector - 37 (Phase – III) of Karnal District. The award of above said land was announced by District Revenue Officer-cum-Land Acquisition Collector, Karnal. Money was paid through LAC as compensation to the owners of the land. HSIIDC has taken the physical possession of the clear land. The proposed development of Industrial Estate, Karnal (Phase – III) at Karnal would be in adherence with the Master Plan-2021 of Karnal, issued by Dept. of Town & Country Planning, Haryana, copy of which has been enclosed in annexure. Moreover, in pursuance of Govt. Notification No. 2/6/13-1-1B-11-2006 dated 11-07-2006, published in Govt. Gazette dated 11-07-2006, u/s – 4 of land acquisition act 1894, (herein after referred to as act) and declared vide notification no. 2/6/13 – 1 – 1B – 11 – 2006 dated 16-07-2007, u/s – 6 of land acquisition act 1894, therein after published in Govt. Gazette dated 16 07-2007, the Govt. acquired 62 acre, 0 kanal 7 marla of land in village Karnal at public expenses for public purpose namely for expansion of Industrial Estate, Sector – 3 Karnal vide award no.2 dated 23-06-2009. The possession of clear land has been taken over. (a) R&R Policy for Proposed Project Area under R&R policy has been earmarked 11.53 acres of land in sector – 37. The State Government has formulated a path breaking policy for rehabilitation and resettlement of land owners whose land is acquired by the State Government. Under the policy the developers are liable to pay Rs.30,000/- per acre per annum with annual increase of Rs.1,000/- per acre for a period of 33 years for the land acquired for setting up of SEZ, Technology City

Project Title : EIA Study for Development of Industrial Estate of HSIIDC at Sec-37 & Sec-3 Extn, Ph-III, Karnal Project No. : 21-1041/2007-IA.III Contract No. : HSIA: K:2007:1315 dt.09.10.2007 Page 169 of 184
Shriram Institute for Industrial Research: Delhi
and Park. In case of acquisition by the State Government, the payment shall be Rs.15,000/- per acre per annum with an annual increase of Rs.500/- per acre. After the issuance of R&R policy in December 2007, instructions have been issued to all the departments to pay royalty to the farmers as per R&R policy. In order to ensure that the payment is smoothly released to the landowners, it has been proposed that an annuity policy may be purchased from any Insurance Company or a Bank so that they can directly pay the annuity to the farmers for a period of 33 years. Meanwhile, in order to ensure that the farmers get the royalty as per the announcement, HSIIDC has requested the Land Acquisition Collectors of all the districts where the land has been acquired by HSIIDC after 5th March 2005 to release the money to the Landowners upto 31st March 2007. The process of disbursement of money to the landowners is in process. 5.5 Management Plan for Handling Emergencies An important element of mitigation is the emergency planning i.e. recognizing that accidents are possible, assessing the consequences of such accidents and deciding on the emergency procedure both onsite and offsite, which are to be implemented in the event of an emergency. Emergency planning is just one aspect of safety and can not be considered in isolation. In particular, it is not a substitute for maintaining good standards within plant operations. Before starting to prepare the plan, plant management should ensure that the necessary standards and safety precautions are in place. Hence, the overall objectives of a Disaster Management Plan would be ♦ To localize the emergency and if possible, eliminate it. ♦ To minimize the effects of the accident on people and property.
(a) Fire Fighting Measures In order to ensure effectiveness in management of fire hazard, following instructions could be envisaged by housing societies, project proponent and other stakeholders. ♦ Inform fire brigade in the event of major fire. ♦ Evacuate area and fight fire from a safe distance or protected location. ♦ Approach fire from upwind to avoid toxic decomposition products. ♦ Stop leak before attempting to stop the fire. If the leak cannot be stopped, and if there is no
risk to the surrounding area, let the fire burn itself out. ♦ If the flames are extinguished without stopping the leak, vapors could form explosive
mixtures with air and re-ignite. ♦ Water can extinguish the fire if used under favorable conditions and when hose streams are
applied by experienced firefighters trained in fighting all types of flammable liquid fires. ♦ If possible, isolate materials not yet involved in the fire, and move these from fire area if
this can be done without risk, and protect personnel. ♦ Fire-exposed material should be cooled by application of hose streams and this should begin
as soon as possible (within the first several minutes).

Project Title : EIA Study for Development of Industrial Estate of HSIIDC at Sec-37 & Sec-3 Extn, Ph-III, Karnal Project No. : 21-1041/2007-IA.III Contract No. : HSIA: K:2007:1315 dt.09.10.2007 Page 170 of 184
Shriram Institute for Industrial Research: Delhi
♦ Water sprinklers can be used to dilute spills to nonflammable mixtures and flush spills away from ignition sources.
♦ Do not enter in the area of fire without wearing specialized protective equipment suitable
for the situation. Firefighter's normal protective equipment (Bunker Gear) may not provide adequate protection. Chemical resistant clothing (e.g. chemical splash suit) and positive pressure self-contained breathing apparatus (MSHA/NIOSH approved or equivalent) may be necessary.
(b) Emergency Plan
Project proponent is suggested to envisage the Onsite Emergency Plan for the proposed industrial estate at Karnal, to maintain the Environmental Health & Safety, to the best conditions with following salient features: ♦ Designation & responsibility for contingency management as well as emergency response
system to be made known to each industry in the industrial estate and their employees. ♦ Standard operating procedure for handling for specific accident and emergency to be
circulated among industries and individual industry will also make theirown SOP in this regard.
♦ Effective co-ordination should be made with the outside agencies, such as fire Brigade,
Civil, Defense Hospitals etc. ♦ Every person directly or indirectly to be involved with the proposed industrial estate should
be made known about the safety procedures. ♦ Safety Checklist should be made by individual industries of various emergencies and safety
of equipment, to ensure effectiveness of the system in place. ♦ Full utilization of available resources, internal as well as external should be ensured for
handling emergencies. ♦ A multi-disciplinary team should be formed to handle emergencies. Adequate protective
equipment should be kept in the unit. ♦ Communication meeting dealing with safety would be held regularly among member
industries. (c) Emergency Organization Project Proponent is suggested to set up Emergency Organization for management of disaster, if any occurred, during the operational phase of the proposed project. There will be the Crisis Coordinators from the members industries. A Chief Coordinator will ensure the functioning of organization structure during emergency. The Chief Coordinator will organize a team responsible for controlling the incidence with the personnel under his control. Emergency Coordinators would be appointed who would undertake the responsibilities like fire fighting, rescue, rehabilitation, transport and provide essential support services. For these purposes, Security In-charge, Personnel Department, Essential services personnel would be engaged.

Project Title : EIA Study for Development of Industrial Estate of HSIIDC at Sec-37 & Sec-3 Extn, Ph-III, Karnal Project No. : 21-1041/2007-IA.III Contract No. : HSIA: K:2007:1315 dt.09.10.2007 Page 171 of 184
Shriram Institute for Industrial Research: Delhi
(d) Emergency Communication
Communication is a significant factor in handling an emergency. Communication includes physical and administrative means by which information with respect to emergency can be rapidly disseminated for off site emergency response. These also include emergency response actions, which must be taken to protect health and safety of the personnel and the public. Without adequate communication, successful emergency planning cannot be exercised. (e) On- site Plan The on-site protective actions include. ♦ Notification of emergency to all the personnel within the industrial estate by siren or alarm
or public address system ♦ Notification for evacuation of personnel by based on the extent of emergency. ♦ Examination of evacuees for injuries and / or exposure to hazardous material. ♦ Search and rescue operations for missing persons. (f) Off-site Areas In the event of a significant emergency condition potentially affecting off-site population, off-site authorities should be immediately notified in accordance with the emergency response procedures. Prompt off-site notification is essential for mitigating the emergency condition and minimization of any impact on personnel off-site, particularly in case of an emergency occurring along the pipeline corridor outside the pumping station
5.6 Post-Project Monitoring Present study for EIA/EMP has been carried out over a shorter period and the data cannot bring out all variations induced by natural or by human activities. Therefore, regular monitoring program of the environmental parameters is essential to take into account the changes in the environment. The objectives of monitoring, therefore, would be:
♦ To follow the trend of parameters which have been identified as critical;
♦ To ensure the efficiency of the controlling measures;
♦ To ensure that new parameters, other than those identified in the impact assessment study, which do not become critical through the commissioning of new installations or through the modification in the operation of existing facilities;
♦ To check assumption made with regard to the development and to detect deviations in order to initiate necessary measures.

Project Title : EIA Study for Development of Industrial Estate of HSIIDC at Sec-37 & Sec-3 Extn, Ph-III, Karnal Project No. : 21-1041/2007-IA.III Contract No. : HSIA: K:2007:1315 dt.09.10.2007 Page 172 of 184
Shriram Institute for Industrial Research: Delhi
Table-5.6 (a) Post-project Monitoring Schedule Component of Environment
No. of Location Parameter Frequency
Ambient Air Quality
4-5 locations in project vicinity
SPM, RSPM, PM2.5, NOx, SO2, CO, Pb, Ammonia, Ozone, Benzene, BaP, Arsenic and Nickel
Four times in a year for 24 hrs
DG Set Emission & Noise
Each DG set in the Industrial area (at individual industry level)
Emission : PM, NOx, Sox, CO, HC Noise : Insertion Loss
As per the norms of Pollution Control Board (Consent Purpose)
Ambient Noise Level
4-5 location in project vicinity
Leq, Lmax, Lmin Four times in a year
Drinking Water 4-5 locations: ♦ Supply Water ♦ Ground water ♦ RO system ♦ Softening Plants
As per IS:10500-1991
Twice in a year
Wastewater (Before & after treatment at CETP & STP
Two locations: ♦ Raw effluent ♦ Treated effluent)
pH, BOD, COD, TSS, Oil & Grease, Anionic Detergents
♦ Monitoring once in 3 months
♦ Adequacy once in year
Hazardous Waste 2-3 samples Complete characterization inclusive of toxicity, ignitability, reactivity & corrosivity
♦ Once in year
Regular monitoring of important and crucial environmental parameters is of immense importance to assess the status of environment during operation of the proposed project. With the knowledge of baseline conditions, the monitoring program can serve as an indicator for any deterioration in environmental conditions due to operation of the project and suitable mitigating steps could be taken in time to safeguard the environment. Monitoring is as important as that of control of pollution since the efficacy of control measures can only be determined by monitoring. The following routine monitoring program, would therefore be implemented. 5.7 Environmental Management Plan (EMP) Benefits Environmental Management Plan would help Project Proponent ♦ In prioritizing area as well as setting targets to address various environmental issues to
achieve sustainable development in the area. ♦ In developing “operating procedures /systems”, which would lead to quicker dissemination
of ‘best practices’ and identification of ‘corrective actions’ needs to be envisaged to meet environmental objectives and targets.

Project Title : EIA Study for Development of Industrial Estate of HSIIDC at Sec-37 & Sec-3 Extn, Ph-III, Karnal Project No. : 21-1041/2007-IA.III Contract No. : HSIA: K:2007:1315 dt.09.10.2007 Page 173 of 184
Shriram Institute for Industrial Research: Delhi
5.8 Project Benefits The project aims at development of Industrial Estate at Karnal, which would help in creation state-of-the-art industrial infrastructure in the district. The proposed project will facilitate in creation of employment opportunities both direct and indirect for local population. The project will help in the urban development by creating residential housing, providing all essential amenities in the estate and hence the project will have immense benefit for social upliftment. The project also aims at development of better landscaping in the vicinity as well as creation of green belt in the area which would eventually helps in the improvement of visual and aesthetic quality of the area. With the implementation of the project, other utilities would also be created like development of road network, sewerage network, augmentation of water supply system & wastewater treatment, solid-waste collection facility, educational and health facilities etc. In nutshell, project aims at amelioration of the socio-economy of the areas as well as providing basic amenities to people.
*****

Project Title : EIA Study for Development of Industrial Estate of HSIIDC at Sec-37 & Sec-3 Extn, Ph-III, Karnal Project No. : 21-1041/2007-IA.III Contract No. : HSIA: K:2007:1315 dt.09.10.2007 Page 174 of 184
Shriram Institute for Industrial Research: Delhi
6.0 PUBLIC CONSULTATION 6.1 Purpose of Public Consultation Public consultation is an integral part of any project undergoing prior EC. Public consultation is the process by which the concerns of local affected persons and others who have reasonable stake in the environmental impacts of the project or activity are ascertained. The projects that comes in the Category ‘A’ or ‘B1, activities shall undertake Public Consultation as per the provisions of EIA notification 14 Sep. 2006. The application was submitted to Haryana State Pollution Control Board by the PP alongwith the EIA report, executive summary in Hindi, and English for its wide circulation. Notice for Public Hearing as shown below was published in the Local and National News Papers for the for the information of General Public, stake holders, residents, villagers, panchayats, Industrial unit owners, educational institutions, NGO’s , etc.

Project Title : EIA Study for Development of Industrial Estate of HSIIDC at Sec-37 & Sec-3 Extn, Ph-III, Karnal Project No. : 21-1041/2007-IA.III Contract No. : HSIA: K:2007:1315 dt.09.10.2007 Page 175 of 184
Shriram Institute for Industrial Research: Delhi
The general norms for conducting PH are given below:
♦ Public hearing at the site or in its close proximity-district wise, to be carried out in the manner prescribed in Appendix IV, of EIA notification 2006 for ascertaining concerns of local affected persons
♦ Obtaining responses in writing from other concerned persons having a plausible stake in the environmental aspects of the project
♦ Public hearing shall be conducted by the State Pollution Control Board (SPCB) in a fair manner.
♦ The proceedings are forwarded to the regulatory authority concerned within 45 days.
♦ Use other appropriate media for ensuring wide publicity about the project. Final EIA report shall be submitted by the applicant to the concerned regulatory authority for appraisal. 5.2 Proceedings and response given by PP MINUTES OF THE PUBLIC HEARING PERTAINING TO ENVIRONMENTAL CLEARANCE FOR M/S HSIIDC, at sector -37 and sector-3 Ext. (PB-3) Industrial Estate, Karnal on 10.01.2014 at 11.30 a.m at seminar hall of Industrial Association, HSIIDC Sector -3, Karnal Under the chairmanship of Ld. Deputy commissioner, Karnal. The Public Hearing M/s HSIIDC, at sector – 37 and sector – 3 (PB-3) Industrial Estate, Karnal was conducted at seminar hall of Industrial Association , HSIIDC sector-3, Karnal for obtaining the Environmental Clearance regarding the project regarding the New Indusrial Growth Sector. As per the MOEF guidelines all the responsible persons of the area were informed through written request vide letter no. HSPCB/2013/617 Dated 25.11.2013 to attend this hearing. Notice for public Hearing was also given in leading English and Hindi Newspapers (copy attached as Annexure’B’). Worthy Deputy Commissioner, Yamuna Nagar was requested to preside the hearing on 09.01.2014 as per annexure ‘C’. The lists of the officers present from various departments and the residents of hereby villages are given in Annexure- ‘D’. Worthy Deputy Commissioner was present at the outset of the hearing but the same later presided over by the Sh. Mohinder Singh Duty Magistrate Karnal on behalf , of Deputy Commissioner, Yamuna Nagar . Project proponent was asked to give the presentation about the project before the public. Sh. P.K Sharma, Regional Officer, HSPCB, Yamuna Nagar, Welcomed all the participants representative from DIC Office, Govt. Hospital, Karnal, DC of Karnal, Industrial Association & Villagers of surrounding area. With the permission of the Chair, he asked the project proponent to describe the project in detail. The project proponent described the details of the project. The Project Proponent distributed the executive summary to the public present and submitted the presentation about the proposed project. During public hearing detailed presentation, introduction, salient features, benefits and environmental aspects of the proposed project were discussed. Various question from the officers from District Administration and from public were raised and the project proponent and their consultant replied to those questions. Objections/ suggestions, if any from the public attending the hearing were invited after the presentation. The question/ Observation raised are as follows:

Project Title : EIA Study for Development of Industrial Estate of HSIIDC at Sec-37 & Sec-3 Extn, Ph-III, Karnal Project No. : 21-1041/2007-IA.III Contract No. : HSIA: K:2007:1315 dt.09.10.2007 Page 176 of 184
Shriram Institute for Industrial Research: Delhi
Sh. P. K Sharma, Regional Officer Ques.1 Whether the project proponent has provisions of CETP for the treatment of Trade Effluent? Ans. Project Proponent replied that there is a provision of CETP in the newly develop Industrial Sector. In addition Sh. Rajbir Singh, Manager IA HSIIDC describe that the Land has been asquired for the development of Industrial growth sector. There will be purpose Parking & Hospital in this project. Sh. P. K Sharma, Regional Officer Ques.1 What arrangement will be made for rain water harvesting system to recharge the ground water? Ans: Project Proponent HSIIDC replied that the provisions of rain harvesting systems are there. Sh. P. K Sharma, Regional Officer The Pollution Control Board is the implementing Agency of Environmental Law. If the any Industry Violate the Environmental Laws, the Haryana Sate Pollution Control Board will take the closure action as well as legal action and file a complaint in the Special Environment Court Kurulshetra. Sh. Jai Singh, Village-KaMBOPURA, Karnal Ques.1 The land of the near by villagers has been acquired by the HSIIDC. The Industries running in the HSIIDC having labour from other State like Bihar, U.P etc. The labour person threating the near by villagers. Ans: Sh. P. K Sharma, Regional Officer The local labour will be introduce in their project by the industries and action will be taken by the Police Authority. Sh. Prem Kumar, Karnal Ques.1 What arrangement wil be made by the project proponent for the public having land behind the Industrial growth sector? Ans : Sh. Ajay Pathak, Sr. Manager, HSIIDC replied the road will be provided to the public having land behind the sector. Sh. Shyam Lal Goyal Karnal Ques.1 What arrangement will be made for the plots remains uncovered? Ans: Sh. Ajay Pathak, Sr. Manager, HSIIDC replied that there is some provision for the re-allotment of plots remain uncovered. Sh.Nasibu deen, Ram dev colony, Karnal Ques.1 What about the provision for the shopkeeper whose shop has been adopt/taken by the HSIIDC? Ans: Sh. Ajay Pathak, Sr. Manager, HSIIDC replied that the matter is in the Court & decision will be taken after the judgment of Court.

Project Title : EIA Study for Development of Industrial Estate of HSIIDC at Sec-37 & Sec-3 Extn, Ph-III, Karnal Project No. : 21-1041/2007-IA.III Contract No. : HSIA: K:2007:1315 dt.09.10.2007 Page 177 of 184
Shriram Institute for Industrial Research: Delhi
Sh. P. K Sharma, Regional Officer The industry will be allowed to run only after providing the effluent treatment plant for the treatment of effluent generated from the various Industries. The Industry will provide Air pollution Control Devoce to control the emission generated from the boiler / furnace. The Haryana Sate pollution Control Board will take the closure action as wellas legal action i.e. file a complaint in the special Environment Court Kurukshetra if nat industry violating the Environmental Laws. Sh. Rohtas Kumar Sweeper, HSIIDC, Karnal The complaint will be not made timely wages to the labour on contract basis. Sh. Ajay Pathak, Sr. Manager, HSIIDC The Complaint will be noted and action will be taken immediately. Sh. Rampal, O/o District Industry Center, Karnal. Ques.1 What arrangement will be made by the project proponent for the treatment of waste water? Ans: Sh. Ajay Pathak, Sr. Manager, HSIIDC replied that the CETP will be provided for the treatment of waste water. Sh. Mohinder Singh, NAib Tehsildar representative of Deputy Commissioner, Karnal Asked the public to ask more query about the project. Regional officer , HSPCB, Yamuna Nagar requested the representative of Deputy Commissioner, Karnal to close the hearing as no question raised by the public. Sh. Mohinder Singh, Naib Tehsildar representative of Deputy Commissioner, Karnal Concluded the hearing.
The public Hearing ended with the vote of thanks Regional Officer
HSPCB, Yamuna Nagar Mohinder Singh Naib Tehsildar Representative of Deputy Commissioner, Karnal Deputy Commissioner, Karnal

Project Title : EIA Study for Development of Industrial Estate of HSIIDC at Sec-37 & Sec-3 Extn, Ph-III, Karnal Project No. : 21-1041/2007-IA.III Contract No. : HSIA: K:2007:1315 dt.09.10.2007 Page 178 of 184
Shriram Institute for Industrial Research: Delhi

Project Title : EIA Study for Development of Industrial Estate of HSIIDC at Sec-37 & Sec-3 Extn, Ph-III, Karnal Project No. : 21-1041/2007-IA.III Contract No. : HSIA: K:2007:1315 dt.09.10.2007 Page 179 of 184
Shriram Institute for Industrial Research: Delhi
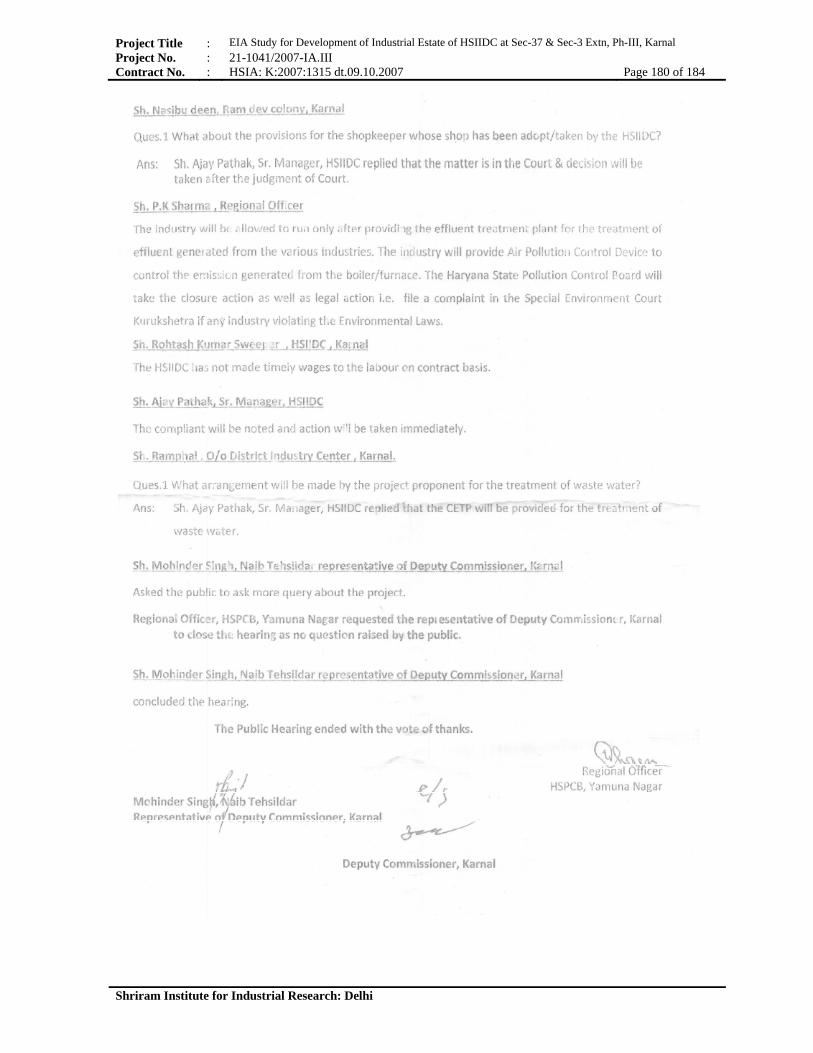
Project Title : EIA Study for Development of Industrial Estate of HSIIDC at Sec-37 & Sec-3 Extn, Ph-III, Karnal Project No. : 21-1041/2007-IA.III Contract No. : HSIA: K:2007:1315 dt.09.10.2007 Page 180 of 184
Shriram Institute for Industrial Research: Delhi

Project Title : EIA Study for Development of Industrial Estate of HSIIDC at Sec-37 & Sec-3 Extn, Ph-III, Karnal Project No. : 21-1041/2007-IA.III Contract No. : HSIA: K:2007:1315 dt.09.10.2007 Page 181 of 184
Shriram Institute for Industrial Research: Delhi
7. DISCLOSURE OF CONSULTANTS ENGAGED Shriram Institute for Industrial Research (SRI) has been engaged by HSIIDC, Panchkula to undertake EIA/EMP Study for the proposed project. SRI has accomplished this assignment in adherence to the requirements of EIA notification of the Ministry of Environment and Forests, the Government of India dated September 14, 2006. Brief profile of the organization is given hereunder: Organisation Profile Shriram Institute for Industrial Research, a premier research organization since 1950 is an independent not for profit, self supporting contract research organization undertaking R&D activities in various fields. SRI is fully equipped in terms of both state-of-art- art facilities and expertise in various fields including Residue analysis, Microbiology, Toxicology, Pharmacology, Environmental pollution and Radiation Technology. The Analytical Science Division provides services related to the different aspects of food and farm products, drugs, pharmaceuticals and the herbal products. The major focus areas are product and process development and validation; product quality certification as per the national and the international norms; product differentiation; shelf life studies; compatibility studies on food packaging material; trace residue analysis; New analytical method development and validation; inspection; training; etc.
Accreditations
♦ SRI is the Accredited EIA Consultant Organization by National Accreditation Board for Education and Training (NABET)/ Quality Council of India (QCI) in the following sectors: - Project/ Activity (6 a) : Oil & gas transportation pipeline (crude and refinery/
petrochemical products), passing through national parks /sanctuaries/coral reefs /ecologically sensitive areas including LNGTerminal
- Project/ Activity (6 a) : Isolated storage & handling of hazardous chemicals (As per threshold planning quantity indicated in column 3 of schedule 2 & 3 of MSIHC Rules 1989 amended 2000)
- Project/ Activity (7c) : Industrial estates/ parks/ complexes/areas, export processing Zones (EPZs), Special Economic Zones (SEZs), Biotech Parks, Leather Complexes.
- Functional Areas like WP, AP, AQ, RH, GEO, HG, LU, Noise, SHW and SE. ♦ SRI is the recognized Environmental Laboratory of the Ministry of Environment & Forests
(S.No.33); The Gazette of India, S.No.834 dated April 9, 2013.
♦ SRI’s laboratories are accredited by the National Accreditation Board for Testing & Calibration Laboratories (NABL) in the fields of Chemical, Mechanical, Biological and Calibration (thermal, Mechanical, fluid flow and mass).
♦ SRI is accredited by ISO 9001-2008 certification by DNV, The Netherlands.
♦ ISO 14001 certified Organization.
♦ OHSAS 18001 certified Organisation.

Project Title : EIA Study for Development of Industrial Estate of HSIIDC at Sec-37 & Sec-3 Extn, Ph-III, Karnal Project No. : 21-1041/2007-IA.III Contract No. : HSIA: K:2007:1315 dt.09.10.2007 Page 182 of 184
Shriram Institute for Industrial Research: Delhi
THE THRUST AREAS OF SRI’S EPS ARE AS FOLLOWS:
♦ Water and Wastewater ♦ Air Emission ♦ Soil and Solid Waste Characterization ♦ EIA Studies WATER & WASTEWATERS STUDIES ♦ Drinking Purposes; Irrigation Purposes; Building Construction; Recreational Purposes &
Industrial Applications ♦ Adequacy of STPs; ETPs and CETPs ♦ River Action Plans AIR & EMISSION STUDIES
♦ Ambient Air Quality ♦ Stack Emissions ♦ Fugitive Emissions ♦ Testing of Industrial Gases ♦ Performance Evaluation of Pollution Control Devices ♦ Certification of Pollution Load ♦ Indoor Air Quality ♦ Performance Evaluation of Incinerators ♦ Toxicity index of combustible materials ♦ Leak detection of hydrocarbons in petrochemical and refineries SOIL CHARACTERIZATION
♦ Physical tests - Load Bearing Capacity; Shear Strength; Standard Penetration tests etc. ♦ Soil reclamation; Salinity studies & Remedial measures. ♦ Heavy metals, Pesticides & Soil microbes and VOC’s in soils ♦ Soil fertility & Micro–nutrient suitability for different types of crops. SOLID WASTE CHARACTERIZATION ♦ Categorization of wastes ♦ Leachability behavior ♦ Recycling & reuse options; Suitability for landfills & composting ♦ Incineration studies of wastes. EIA STUDIES
♦ Environment Monitoring & Socio-economic Survey ♦ Environmental & Socio-economic Impact Analyses ♦ Risk Analysis & Disaster Management Plan ♦ Environmental Management Plan

Project Title : EIA Study for Development of Industrial Estate of HSIIDC at Sec-37 & Sec-3 Extn, Ph-III, Karnal Project No. : 21-1041/2007-IA.III Contract No. : HSIA: K:2007:1315 dt.09.10.2007 Page 183 of 184
Shriram Institute for Industrial Research: Delhi
List of Abbreviations AAQ : Ambient Air Quality ANL : Ambient Noise Level APHA : American Public Health Association AQI : Air Quality IndexAWWA : American Water Works Association BOD : Bio-chemical Oxygen Demand CFL : Compact Fluoroscent Lamp CGWB : Central Ground Water Board CO : Carbon Monoxide COD : Chemical Oxygen Demand CPCB : Central Pollution Control Board CPHEEO : Central Public Health & Environmental Engineering Organisation cumecs : cubic metre per seconds DHBVN : Dakshin Haryana Bijli Vitran Nigam EIA : Environmental Impact Assessment EC : Environmental clearance ECBC : Energy Conservation Building Code EMP : Environmental Management Plan ENE : East North East EPZ : Export Processing Zones ESE : East South East ESE : East South East ESI : Employee State Insurance ETP : Effluent Treatment Plant GW : Ground Water HPSV : High Pressure Sodium Vapour HMV : Heavy Motor Vehicle HSIIDC : Haryana State Industrial and Infrastructure Development Corporation Ltd HVPN : Haryana Vidyut Prasaran Nigam IMT : Industrial Model Township IMD : Indian Meteorological Department IRC : Indian Road Congress KLD : Kilo litre per day LED : Light Emitting Diode LMV : Light Motor Vehicle LPD : Lighting Power Density LPSV : Light Pressure Sodium Vapour lpcd : litre per capita per day MSHA : Mine Safety and Health Act mg/kg : milligram per kilogram mg/l : milligram per litre mg/m3 : milligram per cubic metre NIOSH : National Institute for Occupational Safety and Health µg/kg : microgram per kilogram µg/m3 : microgram per cubic metre MCF : Municipal Corporation of Faridabad MLD : Million Litres per Day MoEF : Ministry of Environment & Forests

Project Title : EIA Study for Development of Industrial Estate of HSIIDC at Sec-37 & Sec-3 Extn, Ph-III, Karnal Project No. : 21-1041/2007-IA.III Contract No. : HSIA: K:2007:1315 dt.09.10.2007 Page 184 of 184
Shriram Institute for Industrial Research: Delhi
MORTH : Ministry of Road Transport & Highways MRTS : Mass Rapid Transport System MSW : Municipal Solid Wastes NAAQS : National Ambient Air Quality Standards NBC : National Building Code NCT : National Capital Territory NGO : Non-government Organisation NHAI : National Highways Authority of India NIOSH : National Institute for Occupational Safety and Health NNE : North North East NNW : North North West NOx : Oxides of Nitrogen NTPC : National Thermal Power Corporation NW : North West NW : North West PCU : Passenger Car Units PPMP : Post Project Monitoring Plan PWD : Public Works Department RAS : Return Activated Sludge R&R : Rehabilitation and Resettlement r/f : Rainfall RH : Relative Humidity RSPM : Respirable Suspended Particulate Matter SEIAA : State Environment Impact Assessment Authority SLF : Sanitary Landfills SO2 : Sulphur Dioxide SPM : Suspended Particulate Matter SPCB : State Pollution Control Board SQ : Soil Quality SRI : Shriram Institute for Industrial Research SSE : South South East SSW : South South West STP : Sewage Treatment Plant SW : South West; Surface Water THC : Total Hydrocarbon TPD : Tonnes per Day TSS : Total Suspended Solids UT : Union Territory WEF : Water Environment Federation WNE : West North East WNW : West North West WPR : Work Participation Rate WQ : Water Quality WS : Wind Speed WSW : West South West