eia - annual energy outlook 2016
TRANSCRIPT

For further information . . .The Annual Energy Outlook 2015 (AEO2015) was prepared by the U.S. Energy Information Administration (EIA), under the direction of John J. Conti ([email protected], 202/586-2222), Assistant Administrator of Energy Analysis; Paul D. Holtberg ([email protected], 202/586-1284), Team Leader, Analysis Integration Team, Office of Integrated and International Energy Analysis; James R. Diefenderfer ([email protected], 202/586-2432), Director, Office of Electricity, Coal, Nuclear, and Renewables Analysis; Sam A. Napolitano ([email protected], 202/586-0687), Director, Office of Integrated and International Energy Analysis; A. Michael Schaal ([email protected], 202/586-5590), Director, Office of Petroleum, Natural Gas, and Biofuels Analysis; James T. Turnure ([email protected], 202/586-1762), Director, Office of Energy Consumption and Efficiency Analysis; and Lynn D. Westfall ([email protected], 202/586-9999), Director, Office of Energy Markets and Financial Analysis.Complimentary copies are available to certain groups, such as public and academic libraries; Federal, State, local, and foreign governments; EIA survey respondents; and the media. For further information and answers to questions, contact: Office of Communications, EI-40
Forrestal Building, Room 2G-090 1000 Independence Avenue, S.W. Washington, DC 20585
Telephone: 202/586-8800 Fax: 202/586-0727 (24-hour automated information line) Website: www.eia.gov E-mail: [email protected] questions about the information in this report may be directed to:
General questions ..................................................... Paul Holtberg ([email protected], 202/586-1284) National Energy Modeling System ....................... Dan Skelly ([email protected], 202/586-1722) Data availability ......................................................... Paul Kondis ([email protected], 202/586-1469) Executive summary .................................................. Perry Lindstrom ([email protected], 202/586-0934) Economic activity ...................................................... Kay Smith ([email protected], 202/586-1132) World oil prices ......................................................... Laura Singer ([email protected], 202/586-4787) International oil production .................................... Laura Singer ([email protected], 202/586-4787) International oil demand ......................................... Linda E. Doman ([email protected], 202/586-1041) Residential demand .................................................. Kevin Jarzomski ([email protected], 202/586-3208) Commercial demand ................................................ Kevin Jarzomski ([email protected], 202/586-3208) Industrial demand ..................................................... Kelly Perl ([email protected], 202/586-1743) Transportation demand .......................................... John Maples ([email protected], 202/586-1757) Electricity generation, capacity ............................. Jeff Jones ([email protected], 202/586-2038) Electricity generation, emissions .......................... Laura Martin ([email protected], 202/586-1494) Electricity prices ........................................................ Lori Aniti ([email protected], 202/586-2867) Nuclear energy .......................................................... Nancy Slater-Thompson ([email protected], 202/586-9322) Renewable energy .................................................... Gwen Bredehoeft ([email protected], 202/586-5847) Oil and natural gas production .............................. Terry Yen ([email protected], 202/586-6185) Wholesale natural gas markets ............................ Katherine Teller ([email protected], 202/586-6201) Oil refining and markets .......................................... John Powell ([email protected], 202/586-1814) Ethanol and biodiesel ............................................... Anthony Radich ([email protected], 202/586-0504) Coal supply and prices ............................................ Michael Mellish ([email protected], 202/586-2136) Carbon dioxide emissions ....................................... Perry Lindstrom ([email protected], 202/586-0934)AEO2015 is available on the EIA website at www.eia.gov/forecasts/aeo. Assumptions underlying the projections, tables of regional results, and other detailed results are available at www.eia.gov/forecasts/aeo/assumptions.Other contributors to the report include Greg Adams, Vipin Arora, Justine Barden, Bruce Bawks, Joseph Benneche, Erin Boedecker, Michelle Bowman, Scott Bradley, Michael Bredehoeft, William Brown, Phil Budzik, Nicholas Chase, Michael Cole, Owen Comstock, Troy Cook, David Daniels, Margie Daymude, Laurie Falter, Mindi Farber-DeAnda, Faouzi Aloulou, Michael Ford, Adrian Geagla, Peter Gross, Susan Hicks, Sean Hill, Behjat Hojjati, Patricia Hutchins, Ayaka Jones, Diane Kearney, Eric Krall, Angelina LaRose, Thomas Lee, Tancred Lidderdale, Danielle Lowenthal-Savy, David Manowitz, Vishakh Mantri, Elizabeth May, Chris Namovicz, Paul Otis, Stefanie Palumbo, Jack Perrin, David Peterson, Chetha Phang, Mark Schipper, Elizabeth Sendich, John Staub, Russell Tarver, Dana Van Wagener, and Steven Wade.
Annual Energy Outlook 2015
With Projections to 2040
April 2015
U.S. Energy Information AdministrationOffice of Integrated and International Energy Analysis
U.S. Department of EnergyWashington, DC 20585
This report was prepared by the U.S. Energy Information Administration (EIA), the statistical and analytical agency within the U.S. Department of Energy. By law, EIA’s data, analyses, and forecasts are independent of approval by any other officer or employee of the United States Government. The views in this report therefore should not be construed as representing those of the Department of Energy or other Federal agencies.
This publication is on the WEB at:www.eia.gov/forecasts/aeo

U.S. Energy Information Administration | Annual Energy Outlook 2015ii
PrefaceThe Annual Energy Outlook 2015 (AEO2015), prepared by the U.S. Energy Information Administration (EIA), presents long-term annual projections of energy supply, demand, and prices through 2040. The projections, focused on U.S. energy markets, are based on results from EIA’s National Energy Modeling System (NEMS). NEMS enables EIA to make projections under alternative, internally-consistent sets of assumptions, the results of which are presented as cases. The analysis in AEO2015 focuses on six cases: Reference case, Low and High Economic Growth cases, Low and High Oil Price cases, and High Oil and Gas Resource case.For the first time, the Annual Energy Outlook (AEO) is presented as a shorter edition under a newly adopted two-year release cycle. With this approach, full editions and shorter editions of the AEO will be produced in alternating years. This approach will allow EIA to focus more resources on rapidly changing energy markets both in the United States and internationally and how they might evolve over the next few years. The shorter edition of the AEO includes a more limited number of model updates, predominantly to reflect historical data updates and changes in legislation and regulation. The AEO shorter editions will include this publication, which discusses the Reference case and five alternative cases, and an accompanying Assumptions Report.1 Other documentation—including documentation for each of the NEMS models and a Retrospective Review—will be completed only in years when the full edition of the AEO is published.This AEO2015 report includes the following major sections:• Executive summary, highlighting key results of the projections• Economic growth, discussing the economic outlooks completed for each of the AEO2015 cases• Energy prices, discussing trends in the markets and prices for crude oil, petroleum and other liquids,2 natural gas, coal, and
electricity for each of the AEO2015 cases
• Delivered energy consumption by sector, discussing energy consumption trends in the transportation, industrial, residential,and commercial sectors
• Energy consumption by primary fuel, discussing trends in energy consumption by fuel, including natural gas, renewables, coal,nuclear, liquid biofuels, and oil and other liquids
• Energy intensity, examining trends in energy use per capita, energy use per 2009 dollar of gross domestic product (GDP), andcarbon dioxide (CO2) emissions per 2009 dollar of GDP
• Energy production, imports, and exports, examining production, import, and export trends for petroleum and other liquids,natural gas, and coal
• Electricity generation, discussing trends in electricity generation by fuel and prime mover for each of the AEO2015 cases• Energy-related CO2 emissions, examining trends in CO2 emissions by sector and AEO2015 case.Summary tables for the six cases are provided in Appendixes A through D. Complete tables are available in a table browser on EIA’s website, at http://www.eia.gov/oiaf/aeo/tablebrowser. Appendix E provides a short discussion of the major changes adopted in AEO2015 and a brief comparison of the AEO2015 and Annual Energy Outlook 2014 results. Appendix F provides a summary of the regional formats, and Appendix G provides a summary of the energy conversion factors used in AEO2015.The AEO2015 projections are based generally on federal, state, and local laws and regulations in effect as of the end of October 2014. The potential impacts of pending or proposed legislation, regulations, and standards (and sections of existing legislation that require implementing regulations or funds that have not been appropriated) are not reflected in the projections (for example, the proposed Clean Power Plan3). In certain situations, however, where it is clear that a law or a regulation will take effect shortly after AEO2015 is completed, it may be considered in the projection.AEO2015 is published in accordance with Section 205c of the U.S. Department of Energy (DOE) Organization Act of 1977 (Public Law 95-91), which requires the EIA Administrator to prepare annual reports on trends and projections for energy use and supply.
1 U.S. Energy Information Administration, Assumptions to the Annual Energy Outlook 2015, DOE/EIA-0554(2015) (Washington, DC, to be published), http://www.eia.gov/forecasts/aeo/assumptions.
2 Liquid fuels (or petroleum and other liquids) include crude oil and products of petroleum refining, natural gas liquids, biofuels, and liquids derived from other hydrocarbon sources (including coal-to-liquids and gas-to-liquids).
3 U.S. Environmental Protection Agency, “Carbon Pollution Emission Guidelines for Existing Stationary Sources: Electric Utility Generating Units,” Federal Register, pp. 34829-34958 (Washington, DC: June 18, 2014), https://www.federalregister.gov/articles/2014/06/18/2014-13726/carbon-pollution-emission-guidelines-for-existing-stationary-sources-electric-utility-generating.

iiiU.S. Energy Information Administration | Annual Energy Outlook 2015
Projections by EIA are not statements of what will happen but of what might happen, given the assumptions and methodologies used for any particular case. The AEO2015 Reference case projection is a business-as-usual trend estimate, given known technology and technological and demographic trends. EIA explores the impacts of alternative assumptions in other cases with different macroeconomic growth rates, world oil prices, and resource assumptions. The main cases in AEO2015 generally assume that current laws and regulations are maintained throughout the projections. Thus, the projections provide policy-neutral baselines that can be used to analyze policy initiatives.While energy markets are complex, energy models are simplified representations of energy production and consumption, regulations, and producer and consumer behavior. Projections are highly dependent on the data, methodologies, model structures, and assumptions used in their development. Behavioral characteristics are indicative of real-world tendencies rather than representations of specific outcomes.Energy market projections are subject to much uncertainty. Many of the events that shape energy markets are random and cannot be anticipated. In addition, future developments in technologies, demographics, and resources cannot be foreseen with certainty. Some key uncertainties in the AEO2015 projections are addressed through alternative cases.EIA has endeavored to make these projections as objective, reliable, and useful as possible; however, they should serve as an adjunct to, not a substitute for, a complete and focused analysis of public policy initiatives.
U.S. Energy Information Administration | Annual Energy Outlook 2015iv
ContentsPreface ................................................................................................................................................................................................................. ii
Executive summary ..................................................................................................................................................................................... ES-1
Introduction ........................................................................................................................................................................................................ 1 Text box: Changes in release cycle for EIA’s Annual Energy Outlook .............................................................................................. 2
Economic growth ............................................................................................................................................................................................... 2
Energy prices ...................................................................................................................................................................................................... 4 Crude oil ....................................................................................................................................................................................................... 4 Petroleum and other liquids products ...................................................................................................................................................... 5 Natural gas ................................................................................................................................................................................................... 6 Coal ............................................................................................................................................................................................................... 7 Electricity ...................................................................................................................................................................................................... 8
Delivered energy consumption by sector ...................................................................................................................................................... 9 Transportation .............................................................................................................................................................................................. 9 Text box: Future gasoline vehicles are strong competitors when compared with other vehicle technology types
on the basis of fuel economics ............................................................................................................................................. 11 Text box: The Annual Energy Outlook 2015 includes several types of light-duty vehicle hybrid technology .......................... 11 Industrial .................................................................................................................................................................................................... 12 Residential and commercial ................................................................................................................................................................... 13
Energy consumption by primary fuel ........................................................................................................................................................... 15
Energy intensity ............................................................................................................................................................................................... 16
Energy production, imports, and exports ................................................................................................................................................... 17 Petroleum and other liquids .................................................................................................................................................................... 18 Natural gas ................................................................................................................................................................................................ 20 Coal ............................................................................................................................................................................................................ 22
Electricity generation ..................................................................................................................................................................................... 24
Energy-related carbon dioxide emissions ................................................................................................................................................... 26
List of acronyms .............................................................................................................................................................................................. 29
Figure and Table Sources ............................................................................................................................................................................... 31
vU.S. Energy Information Administration | Annual Energy Outlook 2015
Contents
Tables
Executive summary ES-1. Growth of trade-related factors in the Reference case, 1983-2040 ................................................................................ ES-3
Introduction 1. Summary of AEO2015 cases .............................................................................................................................................................. 1
Economic growth 2. Growth in key economic factors in historical data and in the Reference case ........................................................................... 2 3. Average annual growth of labor productivity, employment, income, and consumption in three cases ................................. 4
Delivered energy consumption by sector 4. Residential households and commercial indicators in three AEO2015 cases, 2013 and 2040 ........................................... 14
Appendix E E1. Comparison of projections in the AEO2015 and AEO2014 Reference cases, 2012-2040 ................................................ E-2
Appendixes A. Reference case .............................................................................................................................................................................. A-1 B. Economic growth case comparisons ......................................................................................................................................... B-1 C. Price case comparisons ............................................................................................................................................................... C-1 D. High oil and gas resource case comparisons .......................................................................................................................... D-1 E. Comparison of AEO2015 and AEO2014 Reference cases and key updates to models and data ................................. E-1 F. Regional Maps ................................................................................................................................................................................. F-1 G. Conversion factors .......................................................................................................................................................................... G-1
Figures
Executive summary ES-1. North Sea Brent crude oil spot prices in four cases, 2005-40 ........................................................................................ ES-2 ES-2. Average Henry Hub spot prices for natural gas in four cases, 2005-40 ....................................................................... ES-2 ES-3. U.S. net energy imports in six cases, 2005-40 .................................................................................................................. ES-3 ES-4. Net crude oil and petroleum product imports as a percentage of U.S. product supplied
in four cases, 2005-40 ............................................................................................................................................................ ES-4 ES-5. U.S. total net natural gas imports in four cases, 2005-40 ................................................................................................ ES-4 ES-6. Change in U.S. Lower 48 onshore crude oil production by region in six cases, 2013-40 .......................................... ES-5 ES-7. Delivered energy consumption for transportation in six cases, 2008-40 ...................................................................... ES-6 ES-8. Total U.S. renewable generation in all sectors by fuel in six cases, 2013 and 2040 ................................................... ES-7
Economic growth 1. Annual changes in U.S. gross domestic product, business investment, and exports
in the Reference case, 2015-40 ....................................................................................................................................................... 3 2. Annual growth rates for industrial output in three cases, 2013-40 ............................................................................................. 3
Energy prices 3. North Sea Brent crude oil prices in three cases, 2005-40 .......................................................................................................... 5 4. Motor gasoline prices in three cases, 2005-40 ............................................................................................................................. 5 5. Distillate fuel oil prices in three cases, 2005-40 ............................................................................................................................ 5 6. Average Henry Hub spot prices for natural gas in four cases, 2005-40 ................................................................................... 6 7. Average minemouth coal prices by region in the Reference case, 1990-2040 ....................................................................... 7 8. Average delivered coal prices in six cases, 1990-2040 ............................................................................................................... 8 9. Average retail electricity prices in six cases, 2013-40 .................................................................................................................. 8
Delivered energy consumption by sector 10. Delivered energy consumption for transportation by mode in the Reference case, 2013 and 2040 ................................ 10 11. Delivered energy consumption for transportation in six cases, 2008-40 ............................................................................... 10 12. Industrial sector total delivered energy consumption in three cases, 2010-40 ..................................................................... 12 13. Industrial sector natural gas consumption for heat and power in three cases, 2010-40 ..................................................... 12 14. Residential sector delivered energy consumption by fuel in the Reference case, 2010-40 ............................................... 13 15. Commercial sector delivered energy consumption by fuel in the Reference case, 2010-40 ............................................. 13 16. Residential sector delivered energy intensity for selected end uses in the Reference case, 2013 and 2040 ................. 15 17. Commercial sector delivered energy intensity for selected end uses in the Reference case, 2013 and 2040 ............... 15
U.S. Energy Information Administration | Annual Energy Outlook 2015vi
Contents
Energy consumption by primary fuel 18. Primary energy consumption by fuel in the Reference case, 1980-2040 .............................................................................. 15
Energy intensity 19. Energy use per capita and per 2009 dollar of gross domestic product, and carbon dioxide emissions
per 2009 dollar of gross domestic product, in the Reference case, 1980-2040 ................................................................... 17
Energy production, imports, and exports 20. Total energy production and consumption in the Reference case, 1980-2040 .................................................................... 17 21. U.S. tight oil production in four cases, 2005-40 ......................................................................................................................... 18 22. U.S. total crude oil production in four cases, 2005-40 .............................................................................................................. 18 23. U.S. net crude oil imports in four cases, 2005-40 ...................................................................................................................... 19 24. U.S. net petroleum product imports in four cases, 2005-40 .................................................................................................... 20 25. U.S. total dry natural gas production in four cases, 2005-40 ................................................................................................... 20 26. U.S. shale gas production in four cases, 2005-40 ..................................................................................................................... 21 27. U.S. total natural gas net imports in four cases, 2005-40 ........................................................................................................ 21 28. U.S.liquefiednaturalgasnetimportsinfourcases,2005-40 ................................................................................................. 22 29. U.S. coal production in six cases, 1990-2040 ............................................................................................................................. 23 30. U.S. coal exports in six cases, 1990-2040 .................................................................................................................................. 23
Electricity generation 31. Electricity generation by fuel in the Reference case, 2000-2040 ............................................................................................ 24 32. Electricity generation by fuel in six cases, 2013 and 2040 ....................................................................................................... 24 33. Coal and natural gas combined-cycle generation capacity factors in two cases, 2010-40 ................................................ 25 34. Renewable electricity generation byfuel type in the Reference case, 2000-2040 ............................................................... 25 35. Cumulative additions to electricity generation capacity by fuel in six cases, 2013-40 ........................................................ 26
Energy-related carbon dioxide emissions 36. Energy-related carbon dioxide emissions in six cases. 2000-2040 ........................................................................................ 26 37. Energy-related carbon dioxide emissions by sector in the Reference case, 2005, 2013, 2025, and 2040 ..................... 27
Appendix E E1. Average annual Brent crude oil spot prices in the AEO2015 and AEO2014 Reference cases, 1990-2040 .................. E-6 E2. Delivered energy consumption by end-use sector in the AEO2015 and AEO2014 Reference cases,
2013, 2020, 2030, and 2040 ......................................................................................................................................................... E-8 E3. Primary energy consumption by fuel in the AEO2015 and AEO2014 Reference cases, 2013 and 2040 ....................... E-9 E4. Total energy production and consumption in the AEO2015 and AEO2014 Reference cases, 1980-2040 ................. E-10 E5. Share of U.S. liquid fuels supply from net imports in the AEO2015 and AEO2014 Reference cases, 1970-2040 .... E-10 E6. Electricity generation by fuel in the AEO2015 and AEO2014 Reference cases, 2013, 2020, 2030, and 2040 .......... E-12
Appendix F F1. United States Census Divisions ..................................................................................................................................................... F-1 F2. Electricity market module regions .................................................................................................................................................. F-3 F3. Liquid fuels market module regions ............................................................................................................................................... F-4 F4. Oil and gas supply model regions .................................................................................................................................................. F-5 F5. Natural gas transmission and distribution model regions .......................................................................................................... F-6 F6. Coal supply regions .......................................................................................................................................................................... F-7 F7. Coal demand regions ....................................................................................................................................................................... F-8

ES-1U.S. Energy Information Administration | Annual Energy Outlook 2015
Executive summary
Executive summaryProjections in the Annual Energy Outlook 2015 (AEO2015) focus on the factors expected to shape U.S. energy markets through 2040. The projections provide a basis for examination and discussion of energy market trends and serve as a starting point for analysis of potential changes in U.S. energy policies, rules, and regulations, as well as the potential role of advanced technologies.Key results from the AEO2015 Reference and alternative cases include the following:• The future path of crude oil and natural gas prices can vary substantially, depending on assumptions about the size of global
and domestic resources, demand for petroleum products and natural gas (particularly in non-Organization for Economic Cooperation and Development (non-OECD) countries), levels of production, and supplies of other fuels. AEO2015 considers these factors in examining alternative price and resource availability cases.
• Growth in U.S. energy production—led by crude oil and natural gas—and only modest growth in demand reduces U.S. reliance on imported energy supplies. Energy imports and exports come into balance in the United States starting in 2028 in the AEO2015 Reference case and in 2019 in the High Oil Price and High Oil and Gas Resource cases. Natural gas is the dominant U.S. energy export, while liquid fuels4 continue to be imported.
• Through 2020, strong growth in domestic crude oil production from tight formations leads to a decline in net petroleum imports5 and growth in net petroleum product exports in all AEO2015 cases. In the High Oil and Gas Resource case, increased crude production before 2020 results in increased processed condensate6 exports. Slowing growth in domestic production after 2020 is offset by increased vehicle fuel economy standards that limit growth in domestic demand. The net import share of crude oil and petroleum products supplied falls from 33% of total supply in 2013 to 17% of total supply in 2040 in the Reference case. The United States becomes a net exporter of petroleum and other liquids after 2020 in the High Oil Price and High Oil and Gas Resource cases because of greater U.S. crude oil production.
• The United States transitions from being a modest net importer of natural gas to a net exporter by 2017. U.S. export growth continues after 2017, with net exports in 2040 ranging from 3.0 trillion cubic feet (Tcf) in the Low Oil Price case to 13.1 Tcf in the High Oil and Gas Resource case.
• Growth in crude oil and dry natural gas production varies significantly across oil and natural gas supply regions and cases, forcing shifts in crude oil and natural gas flows between U.S. regions, and requiring investment in or realignment of pipelines and other midstream infrastructure.
• U.S. energy consumption grows at a modest rate over the AEO2015 projection period, averaging 0.3%/year from 2013 through 2040 in the Reference case. A marginal decrease in transportation sector energy consumption contrasts with growth in most other sectors. Declines in energy consumption tend to result from the adoption of more energy-efficient technologies and existing policies that promote increased energy efficiency.
• Growth in production of dry natural gas and natural gas plant liquids (NGPL) contributes to the expansion of several manufacturing industries (such as bulk chemicals and primary metals) and the increased use of NGPL feedstocks in place of petroleum-based naphtha7 feedstocks.
• Rising long-term natural gas prices, the high capital costs of new coal and nuclear generation capacity, state-level policies, and cost reductions for renewable generation in a market characterized by relatively slow electricity demand growth favor increased use of renewables.
• Rising costs for electric power generation, transmission, and distribution, coupled with relatively slow growth of electricity demand, produce an 18% increase in the average retail price of electricity over the period from 2013 to 2040 in the AEO2015 Reference case. The AEO2015 cases do not include the proposed Clean Power Plan.8
• Improved efficiency in the end-use sectors and a shift away from more carbon-intensive fuels help to stabilize U.S. energy-related carbon dioxide (CO2) emissions, which remain below the 2005 level through 2040.
The future path of crude oil prices can vary substantially, depending on assumptions about the size of the resource and growth in demand, particularly in non-OECD countriesAEO2015 considers a number of factors related to the uncertainty of future crude oil prices, including changes in worldwide demand for petroleum products, crude oil production, and supplies of other liquid fuels. In all the AEO2015 cases, the North Sea 4 Liquid fuels (or petroleum and other liquids) includes crude oil and products of petroleum refining, natural gas liquids, biofuels, and liquids derived from other hydrocarbon sources (including coal-to-liquids and gas-to-liquids).
5 Net product imports includes trade in crude oil and petroleum products.6 The U.S. Department of Commerce, Bureau of Industry and Security has determined that condensate which has been processed through a distillate tower can be exported without licensing.
7 Naphtha is a refined or semi-refined petroleum fraction used in chemical feedstocks and many other petroleum products. For a complete definition, see www.eia.gov/tools/glossary/index.cfm?id=naphtha.
8 U.S. Environmental Protection Agency, “Carbon Pollution Emission Guidelines for Existing Stationary Sources: Electric Utility Generating Units,” Federal Register, pp. 34829-34958 (Washington, DC: June 18, 2014) https://www.federalregister.gov/articles/2014/06/18/2014-13726/carbon-pollution-emission-guidelines-for-existing-stationary-sources-electric-utility-generating.
U.S. Energy Information Administration | Annual Energy Outlook 2015ES-2
Executive summary
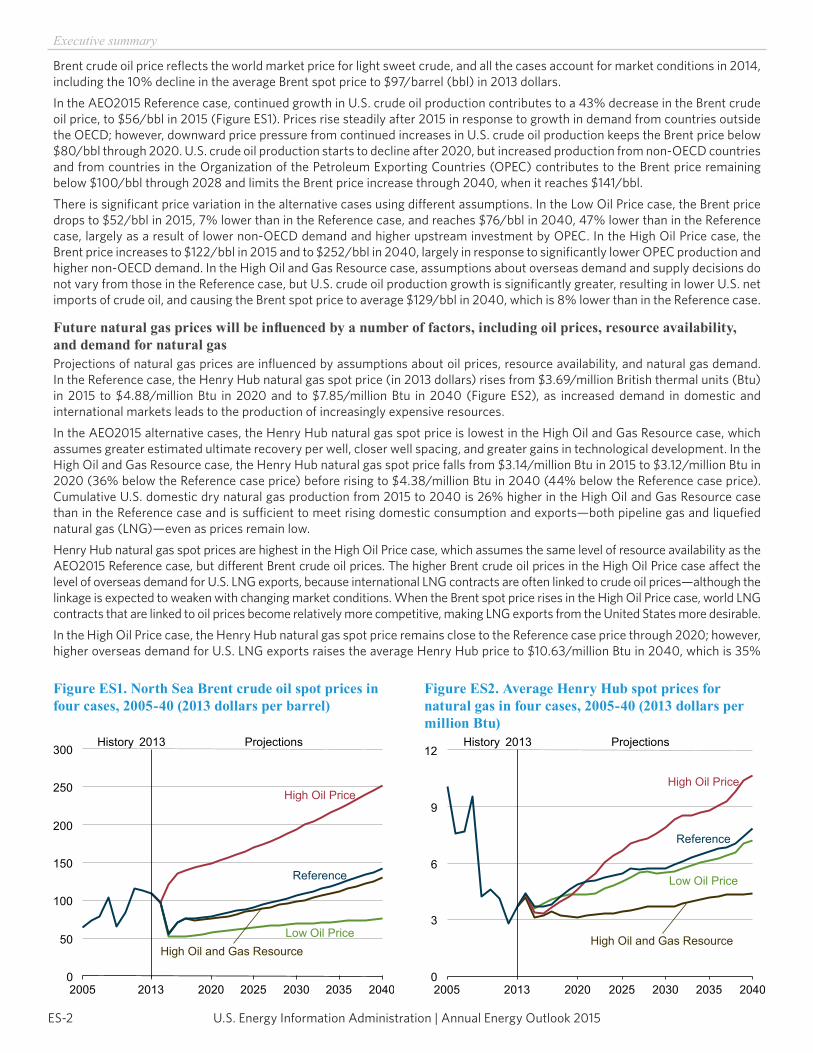
Brent crude oil price reflects the world market price for light sweet crude, and all the cases account for market conditions in 2014, including the 10% decline in the average Brent spot price to $97/barrel (bbl) in 2013 dollars.In the AEO2015 Reference case, continued growth in U.S. crude oil production contributes to a 43% decrease in the Brent crude oil price, to $56/bbl in 2015 (Figure ES1). Prices rise steadily after 2015 in response to growth in demand from countries outside the OECD; however, downward price pressure from continued increases in U.S. crude oil production keeps the Brent price below $80/bbl through 2020. U.S. crude oil production starts to decline after 2020, but increased production from non-OECD countries and from countries in the Organization of the Petroleum Exporting Countries (OPEC) contributes to the Brent price remaining below $100/bbl through 2028 and limits the Brent price increase through 2040, when it reaches $141/bbl.There is significant price variation in the alternative cases using different assumptions. In the Low Oil Price case, the Brent price drops to $52/bbl in 2015, 7% lower than in the Reference case, and reaches $76/bbl in 2040, 47% lower than in the Reference case, largely as a result of lower non-OECD demand and higher upstream investment by OPEC. In the High Oil Price case, the Brent price increases to $122/bbl in 2015 and to $252/bbl in 2040, largely in response to significantly lower OPEC production and higher non-OECD demand. In the High Oil and Gas Resource case, assumptions about overseas demand and supply decisions do not vary from those in the Reference case, but U.S. crude oil production growth is significantly greater, resulting in lower U.S. net imports of crude oil, and causing the Brent spot price to average $129/bbl in 2040, which is 8% lower than in the Reference case.
Future natural gas prices will be influenced by a number of factors, including oil prices, resource availability, and demand for natural gasProjections of natural gas prices are influenced by assumptions about oil prices, resource availability, and natural gas demand. In the Reference case, the Henry Hub natural gas spot price (in 2013 dollars) rises from $3.69/million British thermal units (Btu) in 2015 to $4.88/million Btu in 2020 and to $7.85/million Btu in 2040 (Figure ES2), as increased demand in domestic and international markets leads to the production of increasingly expensive resources.In the AEO2015 alternative cases, the Henry Hub natural gas spot price is lowest in the High Oil and Gas Resource case, which assumes greater estimated ultimate recovery per well, closer well spacing, and greater gains in technological development. In the High Oil and Gas Resource case, the Henry Hub natural gas spot price falls from $3.14/million Btu in 2015 to $3.12/million Btu in 2020 (36% below the Reference case price) before rising to $4.38/million Btu in 2040 (44% below the Reference case price). Cumulative U.S. domestic dry natural gas production from 2015 to 2040 is 26% higher in the High Oil and Gas Resource case than in the Reference case and is sufficient to meet rising domestic consumption and exports—both pipeline gas and liquefied natural gas (LNG)—even as prices remain low.Henry Hub natural gas spot prices are highest in the High Oil Price case, which assumes the same level of resource availability as the AEO2015 Reference case, but different Brent crude oil prices. The higher Brent crude oil prices in the High Oil Price case affect the level of overseas demand for U.S. LNG exports, because international LNG contracts are often linked to crude oil prices—although the linkage is expected to weaken with changing market conditions. When the Brent spot price rises in the High Oil Price case, world LNG contracts that are linked to oil prices become relatively more competitive, making LNG exports from the United States more desirable.In the High Oil Price case, the Henry Hub natural gas spot price remains close to the Reference case price through 2020; however, higher overseas demand for U.S. LNG exports raises the average Henry Hub price to $10.63/million Btu in 2040, which is 35%
0
50
100
150
200
250
300
2005 2013 2020 2025 2030 2035 2040
History 2013 Projections
High Oil Price
Reference
Low Oil PriceHigh Oil and Gas Resource
Figure ES1. North Sea Brent crude oil spot prices in four cases, 2005-40 (2013 dollars per barrel)
0
3
6
9
12
2005 2013 2020 2025 2030 2035 2040
History 2013 Projections
High Oil Price
Reference
Low Oil Price
High Oil and Gas Resource
Figure ES2. Average Henry Hub spot prices for natural gas in four cases, 2005-40 (2013 dollars per million Btu)
ES-3U.S. Energy Information Administration | Annual Energy Outlook 2015
Executive summary
above the Reference case price. Cumulative U.S. exports of LNG from 2015 to 2040 in the High Oil Price case are more than twice those in the Reference case. The opposite occurs in the Low Oil Price case: low Brent crude oil prices cause oil-linked LNG contracts to become relatively less competitive and make U.S. LNG exports less desirable. Lower overseas demand for U.S. LNG exports causes the average Henry Hub price to reach only $7.15/million Btu in 2040, 9% lower than in the Reference case.
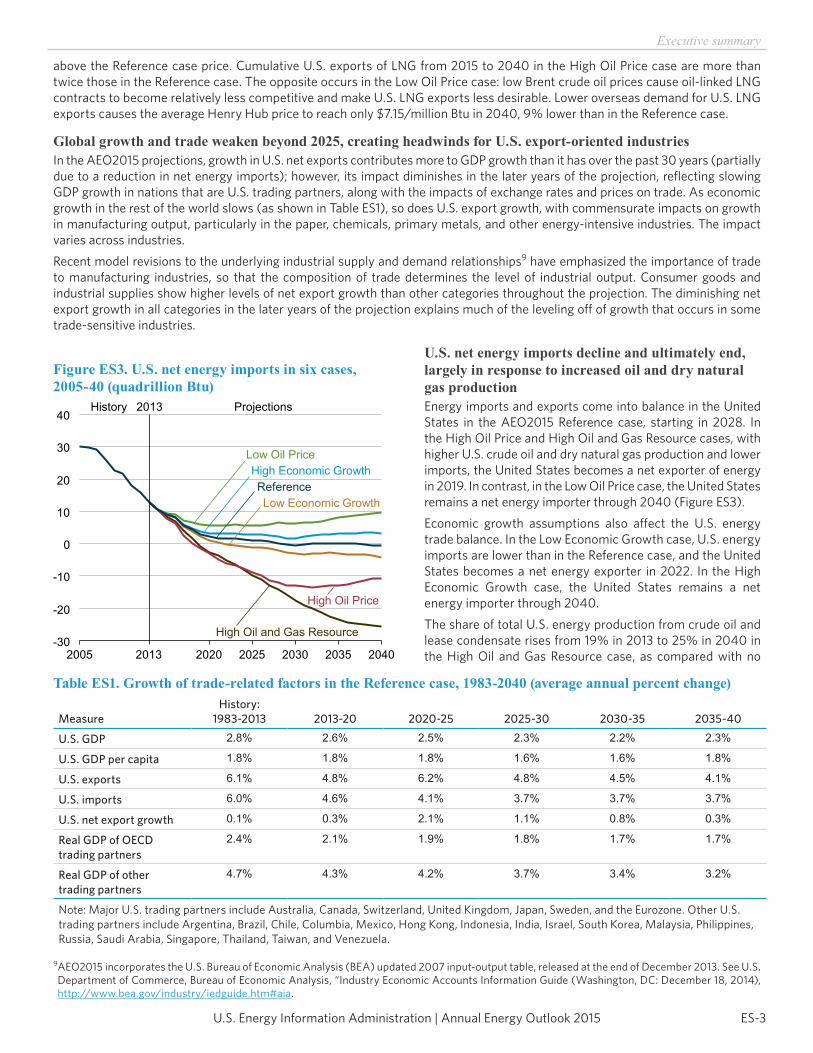
Global growth and trade weaken beyond 2025, creating headwinds for U.S. export-oriented industriesIn the AEO2015 projections, growth in U.S. net exports contributes more to GDP growth than it has over the past 30 years (partially due to a reduction in net energy imports); however, its impact diminishes in the later years of the projection, reflecting slowing GDP growth in nations that are U.S. trading partners, along with the impacts of exchange rates and prices on trade. As economic growth in the rest of the world slows (as shown in Table ES1), so does U.S. export growth, with commensurate impacts on growth in manufacturing output, particularly in the paper, chemicals, primary metals, and other energy-intensive industries. The impact varies across industries.Recent model revisions to the underlying industrial supply and demand relationships9 have emphasized the importance of trade to manufacturing industries, so that the composition of trade determines the level of industrial output. Consumer goods and industrial supplies show higher levels of net export growth than other categories throughout the projection. The diminishing net export growth in all categories in the later years of the projection explains much of the leveling off of growth that occurs in some trade-sensitive industries.
U.S. net energy imports decline and ultimately end, largely in response to increased oil and dry natural gas productionEnergy imports and exports come into balance in the United States in the AEO2015 Reference case, starting in 2028. In the High Oil Price and High Oil and Gas Resource cases, with higher U.S. crude oil and dry natural gas production and lower imports, the United States becomes a net exporter of energy in 2019. In contrast, in the Low Oil Price case, the United States remains a net energy importer through 2040 (Figure ES3).Economic growth assumptions also affect the U.S. energy trade balance. In the Low Economic Growth case, U.S. energy imports are lower than in the Reference case, and the United States becomes a net energy exporter in 2022. In the High Economic Growth case, the United States remains a net energy importer through 2040.The share of total U.S. energy production from crude oil and lease condensate rises from 19% in 2013 to 25% in 2040 in the High Oil and Gas Resource case, as compared with no
9 AEO2015 incorporates the U.S. Bureau of Economic Analysis (BEA) updated 2007 input-output table, released at the end of December 2013. See U.S. Department of Commerce, Bureau of Economic Analysis, “Industry Economic Accounts Information Guide (Washington, DC: December 18, 2014), http://www.bea.gov/industry/iedguide.htm#aia.
-30
-20
-10
0
10
20
30
40
2005 2013 2020 2025 2030 2035 2040
2013History Projections
High Oil Price
Low Economic GrowthReference
Low Oil Price
High Oil and Gas Resource
High Economic Growth
Figure ES3. U.S. net energy imports in six cases, 2005-40 (quadrillion Btu)
Table ES1. Growth of trade-related factors in the Reference case, 1983-2040 (average annual percent change)
MeasureHistory:
1983-2013 2013-20 2020-25 2025-30 2030-35 2035-40
U.S. GDP 2.8% 2.6% 2.5% 2.3% 2.2% 2.3%
U.S. GDP per capita 1.8% 1.8% 1.8% 1.6% 1.6% 1.8%
U.S. exports 6.1% 4.8% 6.2% 4.8% 4.5% 4.1%
U.S. imports 6.0% 4.6% 4.1% 3.7% 3.7% 3.7%
U.S. net export growth 0.1% 0.3% 2.1% 1.1% 0.8% 0.3%
Real GDP of OECD trading partners
2.4% 2.1% 1.9% 1.8% 1.7% 1.7%
Real GDP of other trading partners
4.7% 4.3% 4.2% 3.7% 3.4% 3.2%
Note: Major U.S. trading partners include Australia, Canada, Switzerland, United Kingdom, Japan, Sweden, and the Eurozone. Other U.S. trading partners include Argentina, Brazil, Chile, Columbia, Mexico, Hong Kong, Indonesia, India, Israel, South Korea, Malaysia, Philippines, Russia, Saudi Arabia, Singapore, Thailand, Taiwan, and Venezuela.
U.S. Energy Information Administration | Annual Energy Outlook 2015ES-4
Executive summary
change in the Reference case. Dry natural gas production remains the largest contributor to total U.S. energy production through 2040 in all the AEO2015 cases, with a higher share in the High Oil and Gas Resource case (38%) than in the Reference case (34%) and all other cases. In 2013, dry natural gas accounted for 30% of total U.S. energy production.Coal’s share of total U.S. energy production in the High Oil and Gas Resource case falls from 26% in 2013 to 15% in 2040. In the Reference case and most of the other AEO2015 cases, the coal share remains slightly above 20% of total U.S. energy production through 2040; in the Low Oil Price case, with lower oil and gas production levels, it remains essentially flat at 23% through 2040.
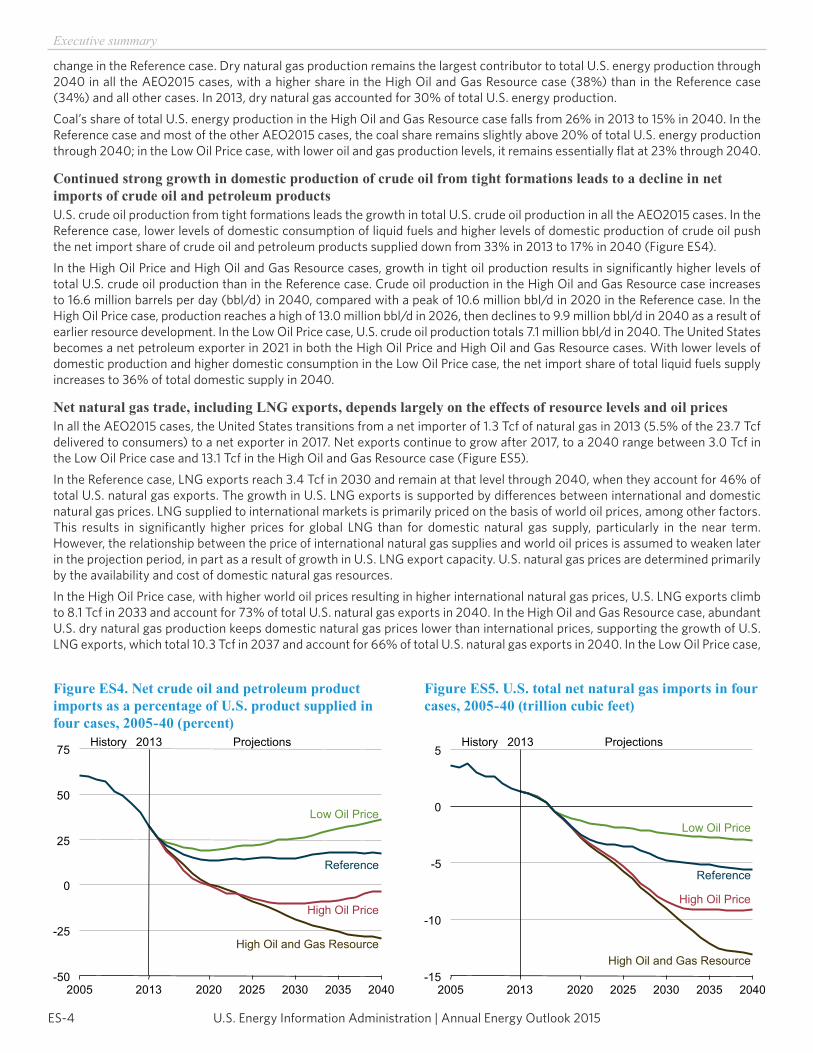
Continued strong growth in domestic production of crude oil from tight formations leads to a decline in net imports of crude oil and petroleum productsU.S. crude oil production from tight formations leads the growth in total U.S. crude oil production in all the AEO2015 cases. In the Reference case, lower levels of domestic consumption of liquid fuels and higher levels of domestic production of crude oil push the net import share of crude oil and petroleum products supplied down from 33% in 2013 to 17% in 2040 (Figure ES4).In the High Oil Price and High Oil and Gas Resource cases, growth in tight oil production results in significantly higher levels of total U.S. crude oil production than in the Reference case. Crude oil production in the High Oil and Gas Resource case increases to 16.6 million barrels per day (bbl/d) in 2040, compared with a peak of 10.6 million bbl/d in 2020 in the Reference case. In the High Oil Price case, production reaches a high of 13.0 million bbl/d in 2026, then declines to 9.9 million bbl/d in 2040 as a result of earlier resource development. In the Low Oil Price case, U.S. crude oil production totals 7.1 million bbl/d in 2040. The United States becomes a net petroleum exporter in 2021 in both the High Oil Price and High Oil and Gas Resource cases. With lower levels of domestic production and higher domestic consumption in the Low Oil Price case, the net import share of total liquid fuels supply increases to 36% of total domestic supply in 2040.
Net natural gas trade, including LNG exports, depends largely on the effects of resource levels and oil pricesIn all the AEO2015 cases, the United States transitions from a net importer of 1.3 Tcf of natural gas in 2013 (5.5% of the 23.7 Tcf delivered to consumers) to a net exporter in 2017. Net exports continue to grow after 2017, to a 2040 range between 3.0 Tcf in the Low Oil Price case and 13.1 Tcf in the High Oil and Gas Resource case (Figure ES5).In the Reference case, LNG exports reach 3.4 Tcf in 2030 and remain at that level through 2040, when they account for 46% of total U.S. natural gas exports. The growth in U.S. LNG exports is supported by differences between international and domestic natural gas prices. LNG supplied to international markets is primarily priced on the basis of world oil prices, among other factors. This results in significantly higher prices for global LNG than for domestic natural gas supply, particularly in the near term. However, the relationship between the price of international natural gas supplies and world oil prices is assumed to weaken later in the projection period, in part as a result of growth in U.S. LNG export capacity. U.S. natural gas prices are determined primarily by the availability and cost of domestic natural gas resources.In the High Oil Price case, with higher world oil prices resulting in higher international natural gas prices, U.S. LNG exports climb to 8.1 Tcf in 2033 and account for 73% of total U.S. natural gas exports in 2040. In the High Oil and Gas Resource case, abundant U.S. dry natural gas production keeps domestic natural gas prices lower than international prices, supporting the growth of U.S. LNG exports, which total 10.3 Tcf in 2037 and account for 66% of total U.S. natural gas exports in 2040. In the Low Oil Price case,
-50
-25
0
25
50
75
2005 2013 2020 2025 2030 2035 2040
2013History Projections
Reference
High Oil Price
Low Oil Price
High Oil and Gas Resource
Figure ES4. Net crude oil and petroleum product imports as a percentage of U.S. product supplied in four cases, 2005-40 (percent)
-15
-10
-5
0
5
2005 2013 2020 2025 2030 2035 2040
2013History Projections
Reference
High Oil Price
Low Oil Price
High Oil and Gas Resource
Figure ES5. U.S. total net natural gas imports in four cases, 2005-40 (trillion cubic feet)
ES-5U.S. Energy Information Administration | Annual Energy Outlook 2015
Executive summary
with lower world oil prices, U.S. LNG exports are less competitive and grow more slowly, to a peak of 0.8 Tcf in 2018, and account for 13% of total U.S. natural gas exports in 2040.Additional growth in net natural gas exports comes from growing natural gas pipeline exports to Mexico, which reach a high of 4.7 Tcf in 2040 in the High Oil and Gas Resource case (compared with 0.7 Tcf in 2013). In the High Oil Price case, U.S. natural gas pipeline exports to Mexico peak at 2.2 Tcf in 2040, as higher domestic natural gas prices resulting from increased world demand for LNG reduce the incentive to export natural gas via pipeline. Natural gas pipeline net imports from Canada remain below 2013 levels through 2040 in all the AEO2015 cases, but these imports do increase in response to higher natural gas prices in the latter part of the projection period.
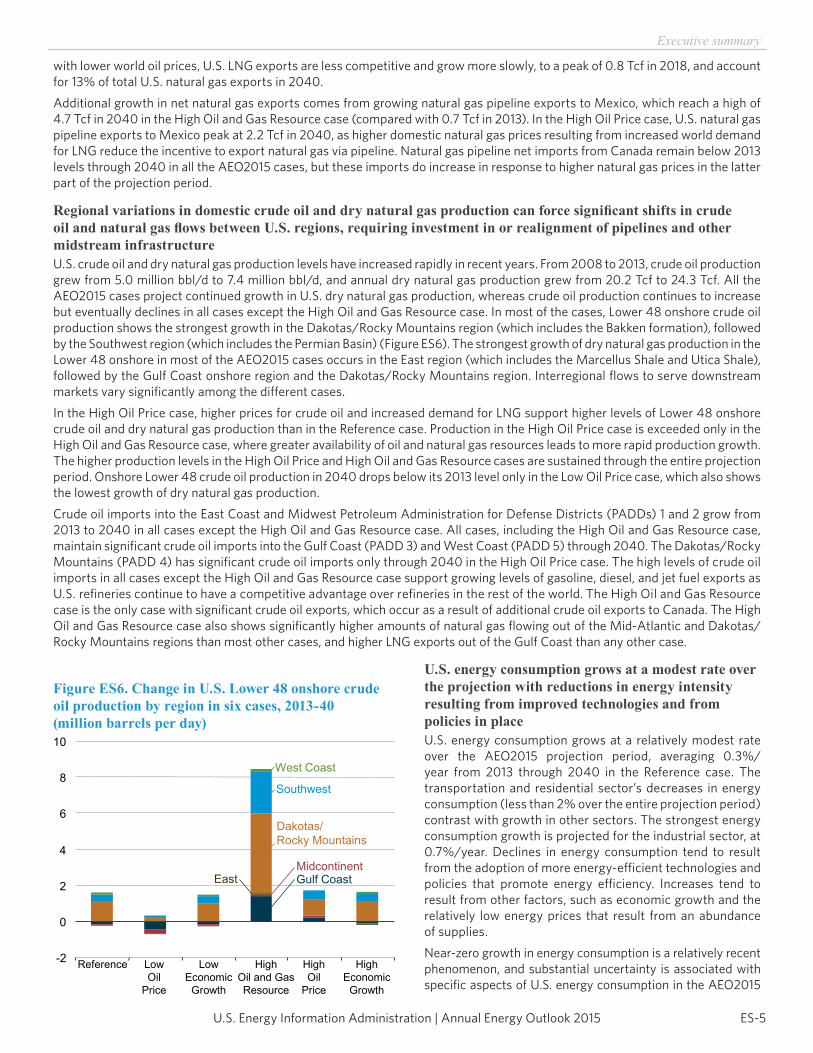
Regional variations in domestic crude oil and dry natural gas production can force significant shifts in crude oil and natural gas flows between U.S. regions, requiring investment in or realignment of pipelines and other midstream infrastructureU.S. crude oil and dry natural gas production levels have increased rapidly in recent years. From 2008 to 2013, crude oil production grew from 5.0 million bbl/d to 7.4 million bbl/d, and annual dry natural gas production grew from 20.2 Tcf to 24.3 Tcf. All the AEO2015 cases project continued growth in U.S. dry natural gas production, whereas crude oil production continues to increase but eventually declines in all cases except the High Oil and Gas Resource case. In most of the cases, Lower 48 onshore crude oil production shows the strongest growth in the Dakotas/Rocky Mountains region (which includes the Bakken formation), followed by the Southwest region (which includes the Permian Basin) (Figure ES6). The strongest growth of dry natural gas production in the Lower 48 onshore in most of the AEO2015 cases occurs in the East region (which includes the Marcellus Shale and Utica Shale), followed by the Gulf Coast onshore region and the Dakotas/Rocky Mountains region. Interregional flows to serve downstream markets vary significantly among the different cases.In the High Oil Price case, higher prices for crude oil and increased demand for LNG support higher levels of Lower 48 onshore crude oil and dry natural gas production than in the Reference case. Production in the High Oil Price case is exceeded only in the High Oil and Gas Resource case, where greater availability of oil and natural gas resources leads to more rapid production growth. The higher production levels in the High Oil Price and High Oil and Gas Resource cases are sustained through the entire projection period. Onshore Lower 48 crude oil production in 2040 drops below its 2013 level only in the Low Oil Price case, which also shows the lowest growth of dry natural gas production.
Crude oil imports into the East Coast and Midwest Petroleum Administration for Defense Districts (PADDs) 1 and 2 grow from 2013 to 2040 in all cases except the High Oil and Gas Resource case. All cases, including the High Oil and Gas Resource case, maintain significant crude oil imports into the Gulf Coast (PADD 3) and West Coast (PADD 5) through 2040. The Dakotas/Rocky Mountains (PADD 4) has significant crude oil imports only through 2040 in the High Oil Price case. The high levels of crude oil imports in all cases except the High Oil and Gas Resource case support growing levels of gasoline, diesel, and jet fuel exports as U.S. refineries continue to have a competitive advantage over refineries in the rest of the world. The High Oil and Gas Resource case is the only case with significant crude oil exports, which occur as a result of additional crude oil exports to Canada. The High Oil and Gas Resource case also shows significantly higher amounts of natural gas flowing out of the Mid-Atlantic and Dakotas/Rocky Mountains regions than most other cases, and higher LNG exports out of the Gulf Coast than any other case.
U.S. energy consumption grows at a modest rate over the projection with reductions in energy intensity resulting from improved technologies and from policies in placeU.S. energy consumption grows at a relatively modest rate over the AEO2015 projection period, averaging 0.3%/year from 2013 through 2040 in the Reference case. The transportation and residential sector’s decreases in energy consumption (less than 2% over the entire projection period) contrast with growth in other sectors. The strongest energy consumption growth is projected for the industrial sector, at 0.7%/year. Declines in energy consumption tend to result from the adoption of more energy-efficient technologies and policies that promote energy efficiency. Increases tend to result from other factors, such as economic growth and the relatively low energy prices that result from an abundance of supplies.Near-zero growth in energy consumption is a relatively recent phenomenon, and substantial uncertainty is associated with specific aspects of U.S. energy consumption in the AEO2015
-2
0
2
4
6
8
10
Reference LowOil
Price
LowEconomic
Growth
HighOil and GasResource
HighOil
Price
HighEconomic
Growth
Gulf CoastMidcontinent
East
Dakotas/Rocky Mountains
Southwest
West Coast
Figure ES6. Change in U.S. Lower 48 onshore crude oil production by region in six cases, 2013-40 (million barrels per day)
U.S. Energy Information Administration | Annual Energy Outlook 2015ES-6
Executive summary
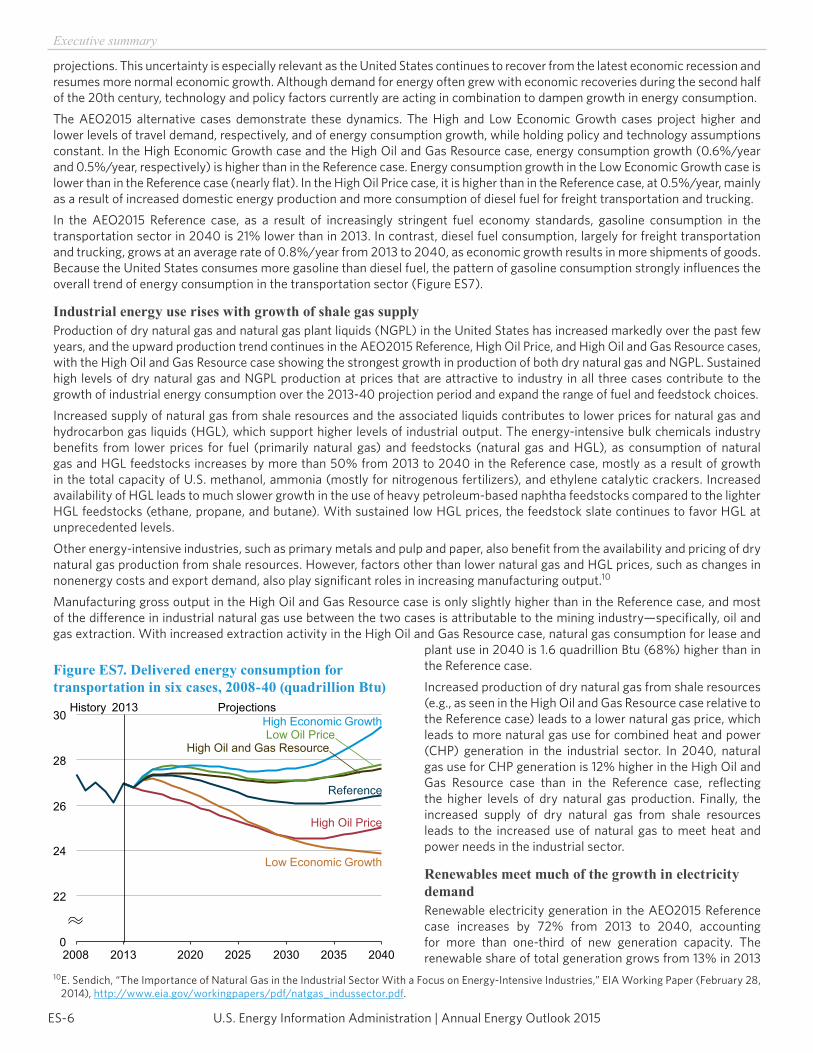
projections. This uncertainty is especially relevant as the United States continues to recover from the latest economic recession and resumes more normal economic growth. Although demand for energy often grew with economic recoveries during the second half of the 20th century, technology and policy factors currently are acting in combination to dampen growth in energy consumption.The AEO2015 alternative cases demonstrate these dynamics. The High and Low Economic Growth cases project higher and lower levels of travel demand, respectively, and of energy consumption growth, while holding policy and technology assumptions constant. In the High Economic Growth case and the High Oil and Gas Resource case, energy consumption growth (0.6%/year and 0.5%/year, respectively) is higher than in the Reference case. Energy consumption growth in the Low Economic Growth case is lower than in the Reference case (nearly flat). In the High Oil Price case, it is higher than in the Reference case, at 0.5%/year, mainly as a result of increased domestic energy production and more consumption of diesel fuel for freight transportation and trucking.In the AEO2015 Reference case, as a result of increasingly stringent fuel economy standards, gasoline consumption in the transportation sector in 2040 is 21% lower than in 2013. In contrast, diesel fuel consumption, largely for freight transportation and trucking, grows at an average rate of 0.8%/year from 2013 to 2040, as economic growth results in more shipments of goods. Because the United States consumes more gasoline than diesel fuel, the pattern of gasoline consumption strongly influences the overall trend of energy consumption in the transportation sector (Figure ES7).
Industrial energy use rises with growth of shale gas supplyProduction of dry natural gas and natural gas plant liquids (NGPL) in the United States has increased markedly over the past few years, and the upward production trend continues in the AEO2015 Reference, High Oil Price, and High Oil and Gas Resource cases, with the High Oil and Gas Resource case showing the strongest growth in production of both dry natural gas and NGPL. Sustained high levels of dry natural gas and NGPL production at prices that are attractive to industry in all three cases contribute to the growth of industrial energy consumption over the 2013-40 projection period and expand the range of fuel and feedstock choices.Increased supply of natural gas from shale resources and the associated liquids contributes to lower prices for natural gas and hydrocarbon gas liquids (HGL), which support higher levels of industrial output. The energy-intensive bulk chemicals industry benefits from lower prices for fuel (primarily natural gas) and feedstocks (natural gas and HGL), as consumption of natural gas and HGL feedstocks increases by more than 50% from 2013 to 2040 in the Reference case, mostly as a result of growth in the total capacity of U.S. methanol, ammonia (mostly for nitrogenous fertilizers), and ethylene catalytic crackers. Increased availability of HGL leads to much slower growth in the use of heavy petroleum-based naphtha feedstocks compared to the lighter HGL feedstocks (ethane, propane, and butane). With sustained low HGL prices, the feedstock slate continues to favor HGL at unprecedented levels.Other energy-intensive industries, such as primary metals and pulp and paper, also benefit from the availability and pricing of dry natural gas production from shale resources. However, factors other than lower natural gas and HGL prices, such as changes in nonenergy costs and export demand, also play significant roles in increasing manufacturing output.10
Manufacturing gross output in the High Oil and Gas Resource case is only slightly higher than in the Reference case, and most of the difference in industrial natural gas use between the two cases is attributable to the mining industry—specifically, oil and gas extraction. With increased extraction activity in the High Oil and Gas Resource case, natural gas consumption for lease and
plant use in 2040 is 1.6 quadrillion Btu (68%) higher than in the Reference case.Increased production of dry natural gas from shale resources (e.g., as seen in the High Oil and Gas Resource case relative to the Reference case) leads to a lower natural gas price, which leads to more natural gas use for combined heat and power (CHP) generation in the industrial sector. In 2040, natural gas use for CHP generation is 12% higher in the High Oil and Gas Resource case than in the Reference case, reflecting the higher levels of dry natural gas production. Finally, the increased supply of dry natural gas from shale resources leads to the increased use of natural gas to meet heat and power needs in the industrial sector.
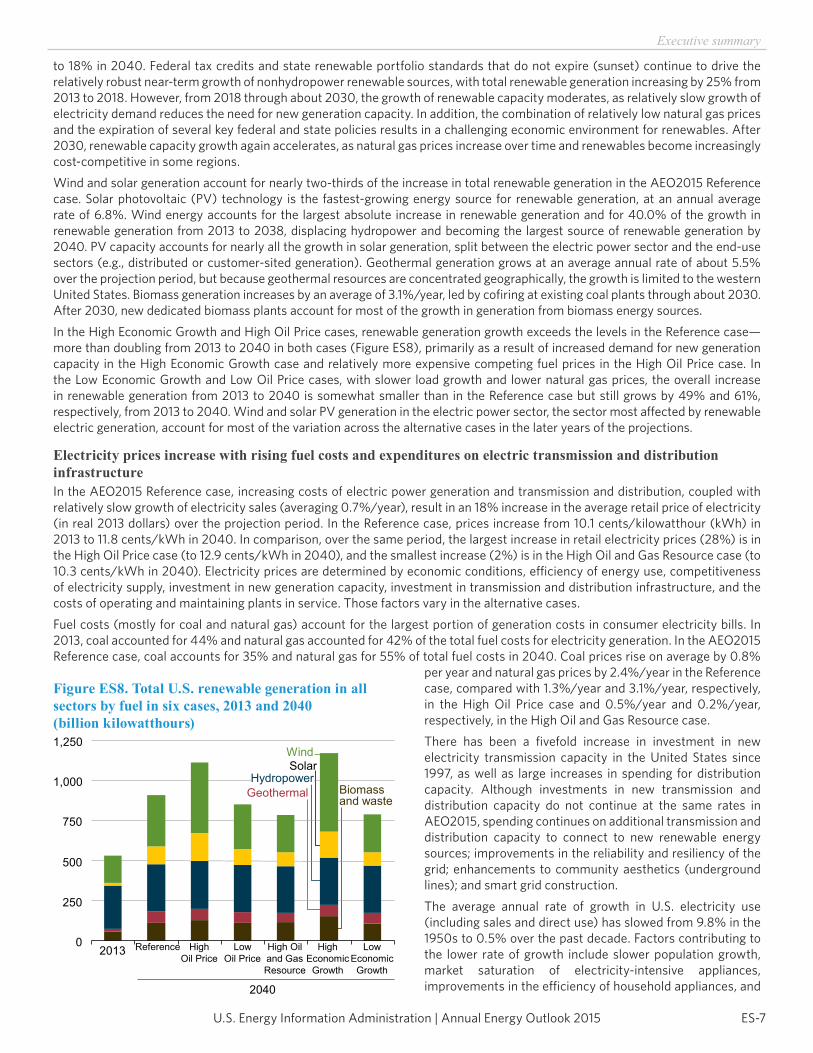
Renewables meet much of the growth in electricity demandRenewable electricity generation in the AEO2015 Reference case increases by 72% from 2013 to 2040, accounting for more than one-third of new generation capacity. The renewable share of total generation grows from 13% in 2013
10 E. Sendich, “The Importance of Natural Gas in the Industrial Sector With a Focus on Energy-Intensive Industries,” EIA Working Paper (February 28, 2014), http://www.eia.gov/workingpapers/pdf/natgas_indussector.pdf.
0
22
24
26
28
30
2008 2013 2020 2025 2030 2035 2040
History 2013 Projections
High Oil Price
Low Economic Growth
Reference
High Economic Growth
High Oil and Gas ResourceLow Oil Price
Figure ES7. Delivered energy consumption for transportation in six cases, 2008-40 (quadrillion Btu)
ES-7U.S. Energy Information Administration | Annual Energy Outlook 2015
Executive summary
to 18% in 2040. Federal tax credits and state renewable portfolio standards that do not expire (sunset) continue to drive the relatively robust near-term growth of nonhydropower renewable sources, with total renewable generation increasing by 25% from 2013 to 2018. However, from 2018 through about 2030, the growth of renewable capacity moderates, as relatively slow growth of electricity demand reduces the need for new generation capacity. In addition, the combination of relatively low natural gas prices and the expiration of several key federal and state policies results in a challenging economic environment for renewables. After 2030, renewable capacity growth again accelerates, as natural gas prices increase over time and renewables become increasingly cost-competitive in some regions.Wind and solar generation account for nearly two-thirds of the increase in total renewable generation in the AEO2015 Reference case. Solar photovoltaic (PV) technology is the fastest-growing energy source for renewable generation, at an annual average rate of 6.8%. Wind energy accounts for the largest absolute increase in renewable generation and for 40.0% of the growth in renewable generation from 2013 to 2038, displacing hydropower and becoming the largest source of renewable generation by 2040. PV capacity accounts for nearly all the growth in solar generation, split between the electric power sector and the end-use sectors (e.g., distributed or customer-sited generation). Geothermal generation grows at an average annual rate of about 5.5% over the projection period, but because geothermal resources are concentrated geographically, the growth is limited to the western United States. Biomass generation increases by an average of 3.1%/year, led by cofiring at existing coal plants through about 2030. After 2030, new dedicated biomass plants account for most of the growth in generation from biomass energy sources.In the High Economic Growth and High Oil Price cases, renewable generation growth exceeds the levels in the Reference case—more than doubling from 2013 to 2040 in both cases (Figure ES8), primarily as a result of increased demand for new generation capacity in the High Economic Growth case and relatively more expensive competing fuel prices in the High Oil Price case. In the Low Economic Growth and Low Oil Price cases, with slower load growth and lower natural gas prices, the overall increase in renewable generation from 2013 to 2040 is somewhat smaller than in the Reference case but still grows by 49% and 61%, respectively, from 2013 to 2040. Wind and solar PV generation in the electric power sector, the sector most affected by renewable electric generation, account for most of the variation across the alternative cases in the later years of the projections.
Electricity prices increase with rising fuel costs and expenditures on electric transmission and distribution infrastructureIn the AEO2015 Reference case, increasing costs of electric power generation and transmission and distribution, coupled with relatively slow growth of electricity sales (averaging 0.7%/year), result in an 18% increase in the average retail price of electricity (in real 2013 dollars) over the projection period. In the Reference case, prices increase from 10.1 cents/kilowatthour (kWh) in 2013 to 11.8 cents/kWh in 2040. In comparison, over the same period, the largest increase in retail electricity prices (28%) is in the High Oil Price case (to 12.9 cents/kWh in 2040), and the smallest increase (2%) is in the High Oil and Gas Resource case (to 10.3 cents/kWh in 2040). Electricity prices are determined by economic conditions, efficiency of energy use, competitiveness of electricity supply, investment in new generation capacity, investment in transmission and distribution infrastructure, and the costs of operating and maintaining plants in service. Those factors vary in the alternative cases.Fuel costs (mostly for coal and natural gas) account for the largest portion of generation costs in consumer electricity bills. In 2013, coal accounted for 44% and natural gas accounted for 42% of the total fuel costs for electricity generation. In the AEO2015 Reference case, coal accounts for 35% and natural gas for 55% of total fuel costs in 2040. Coal prices rise on average by 0.8%
per year and natural gas prices by 2.4%/year in the Reference case, compared with 1.3%/year and 3.1%/year, respectively, in the High Oil Price case and 0.5%/year and 0.2%/year, respectively, in the High Oil and Gas Resource case.There has been a fivefold increase in investment in new electricity transmission capacity in the United States since 1997, as well as large increases in spending for distribution capacity. Although investments in new transmission and distribution capacity do not continue at the same rates in AEO2015, spending continues on additional transmission and distribution capacity to connect to new renewable energy sources; improvements in the reliability and resiliency of the grid; enhancements to community aesthetics (underground lines); and smart grid construction.The average annual rate of growth in U.S. electricity use (including sales and direct use) has slowed from 9.8% in the 1950s to 0.5% over the past decade. Factors contributing to the lower rate of growth include slower population growth, market saturation of electricity-intensive appliances, improvements in the efficiency of household appliances, and
2013 HighOil Price
LowOil Price
High Oiland GasResource
HighEconomic
Growth
LowEconomic
Growth
2040
Reference
Biomassand waste
Geothermal
SolarWind
0
250
500
750
1,000
1,250
Hydropower
Figure ES8. Total U.S. renewable generation in all sectors by fuel in six cases, 2013 and 2040 (billion kilowatthours)
U.S. Energy Information Administration | Annual Energy Outlook 2015ES-8
Executive summary
a shift in the economy toward a larger share of consumption in less energy-intensive industries. In the AEO2015 Reference case, U.S. electricity use grows by an average of 0.8%/year from 2013 to 2040.
Energy-related CO2 emissions stabilize with improvements in the energy intensity and carbon intensity of electricity generationU.S. energy-related CO2 emissions in 2013 totaled 5,405 million metric tons (mt).11 In the AEO2015 Reference case, CO2 emissions increase by 144 million mt (2.7%) from 2013 to 2040, to 5,549 million mt—still 444 million mt below the 2005 level of 5,993 million mt. Among the AEO2015 alternative cases, total emissions in 2040 range from a high of 5,979 million mt in the High Economic Growth case to a low of 5,160 million mt in the Low Economic Growth case.In the Reference case:• CO2 emissions from the electric power sector increase by an average of 0.2%/year from 2013 to 2040, as a result of relatively
slow growth in electricity sales (averaging 0.7%/year) and increasing substitution of lower-carbon fuels, such as natural gasand renewable energy sources, for coal in electricity generation.
• CO2 emissions from the transportation sector decline by an average of 0.2%/year, with overall improvements in vehicle energy efficiency offsetting increased travel demand, growth in diesel consumption in freight trucks, and consumer’s preference forlarger, less-efficient vehicles as a result of the lower fuel prices that accompany strong growth of domestic oil and dry naturalgas production.
• CO2 emissions from the industrial sector increase by an average of 0.5%/year, reflecting a resurgence of industrial activityfueled by low energy prices, particularly for natural gas and HGL feedstocks in the bulk chemical sector.
• CO2 emissions from the residential sector decline by an average of 0.2%/year, with improvements in appliance and buildingshell efficiencies more than offsetting growth in housing units.
• CO2 emissions from the commercial sector increase by an average of 0.3%/year even with improvements in equipment andbuilding shell efficiency, as a result of increased electricity consumption resulting from the growing proliferation of data centers and electric devices, such as networking equipment and video displays, as well as greater use of natural gas-fueled combinedheat and power distributed generation.
11 Based on EIA, Monthly Energy Review (November 2014), and reported here for consistency with data and other calculations in the AEO2015 tables. The 2013 total was subsequently updated to 5,363 million metric tons in EIA’s February 2015 Monthly Energy Review, DOE/EIA-0035(2015/02), http://www.eia.gov/totalenergy/data/monthly/archive/00351502.pdf.
U.S. Energy Information Administration | Annual Energy Outlook 2015 1
Introduction
IntroductionIn preparing the Annual Energy Outlook 2015 (AEO2015)—a shorter edition; see text box on page 2—the U.S. Energy Information Administration (EIA) evaluated a range of trends and issues that could have major implications for U.S. energy markets. This report presents the AEO2015 Reference case and compares it with five alternative cases (Low and High Oil Price, Low and High Economic Growth, and High Oil and Gas Resource) that were completed as part of AEO2015 (see Appendixes A, B, C, and D).Because of the uncertainties inherent in any energy market projection, the Reference case results should not be viewed in isolation. Readers are encouraged to review the alternative cases to gain perspective on how variations in key assumptions can lead to different outlooks for energy markets. In addition to the alternative cases prepared for AEO2015, EIA has examined many proposed policies affecting energy markets over the past few years. Reports describing the results of those analyses are available on EIA’s website.12
Table 1 provides a summary of the six cases produced as part of AEO2015. For each case, the table gives the name used in AEO2015 and a brief description of the major assumptions underlying the projections. Regional results and other details of the projections are available at http://www.eia.gov/forecasts/aeo/tables_ref.cfm#supplement.
12 See “Congressional and other requests,” http://www.eia.gov/analysis/reports.cfm?t=138.
Table 1. Summary of AEO2015 casesCase name Description
Reference Real gross domestic product (GDP) grows at an average annual rate of 2.4% from 2013 to 2040, under the assumption that current laws and regulations remain generally unchanged throughout the projection period. North Sea Brent crude oil prices rise to $141/barrel (bbl) (2013 dollars) in 2040. Complete projection tables are provided in Appendix A.
Low Economic Growth Real GDP grows at an average annual rate of 1.8% from 2013 to 2040. Other energy market assumptions are the same as in the Reference case. Partial projection tables are provided in Appendix B.
High Economic Growth Real GDP grows at an average annual rate of 2.9% from 2013 to 2040. Other energy market assumptions are the same as in the Reference case. Partial projection tables are provided in Appendix B.
Low Oil Price Low oil prices result from a combination of low demand for petroleum and other liquids in nations outside the Organization for Economic Cooperation and Development (non-OECD nations) and higher global supply. On the supply side, the Organization of Petroleum Exporting Countries (OPEC) increases its liquids market share from 40% in 2013 to 51% in 2040, and the costs of other liquids production technologies are lower than in the Reference case. Light, sweet (Brent) crude oil prices remain around $52/bbl (2013 dollars) through 2017, and then rise slowly to $76/bbl in 2040. Other energy market assumptions are the same as in the Reference case. Partial projection tables are provided in Appendix C.
High Oil Price High oil prices result from a combination of higher demand for liquid fuels in non-OECD nations and lower global crude oil supply. OPEC’s liquids market share averages 32% throughout the projection. Non-OPEC crude oil production expands more slowly in short- to mid-term relative to the Reference case. Brent crude oil prices rise to $252/bbl (2013 dollars) in 2040. Other energy market assumptions are the same as in the Reference case. Partial projection tables are provided in Appendix C.
High Oil and Gas Resource Estimated ultimate recovery (EUR) per shale gas, tight gas, and tight oil well is 50% higher and well spacing is 50% closer (i.e., the number of wells drilled is 100% higher) than in the Reference case. In addition, tight oil resources are added to reflect new plays or the expansion of known tight oil plays, and the EUR for tight and shale wells increases by 1%/year more than the annual increase in the Reference case to reflect additional technology improvements. This case also includes kerogen development; undiscovered resources in the offshore Lower 48 states and Alaska; and coalbed methane and shale gas resources in Canada that are 50% higher than in the Reference case. Other energy market assumptions are the same as in the Reference case. Partial projection tables are provided in Appendix D.
U.S. Energy Information Administration | Annual Energy Outlook 20152
Economic growth
Changes in release cycle for EIA’s Annual Energy OutlookTo focus more resources on rapidly changing energy markets and the ways in which they might evolve over the next few years, the U.S. Energy Information Administration (EIA) is revising the schedule and approach for production of the Annual Energy Outlook (AEO). Starting with this Annual Energy Outlook 2015 (AEO2015), EIA is adopting a two-year release cycle for the AEO, with full and shorter editions of the AEO produced in alternating years. AEO2015 is a shorter edition of the AEO.The shorter AEO includes a limited number of model updates, which are selected predominantly to reflect historical data updates and changes in legislation and regulations. A complete listing of the changes made for AEO2015 is shown in Appendix E. The shorter edition includes a Reference case and five alternative cases: Low Oil Price, High Oil Price, Low Economic Growth, High Economic Growth, and High Oil and Gas Resource.The shorter AEO will include this publication, which discusses the Reference case and alternative cases, as well as the report, Assumptions to the Annual Energy Outlook 2015.13 Other documentation—including model documentation for each of the National Energy Modeling System (NEMS) models and the Retrospective Review—will be completed only for the years when a full edition of the AEO is produced.To provide a basis against which alternative cases and policies can be compared, the AEO Reference case generally assumes that current laws and regulations affecting the energy sector remain unchanged throughout the projection (including the assumption that laws that include sunset dates do, in fact, expire at the time of those sunset dates). This assumption enables policy analysis with less uncertainty regarding unstated legal or regulatory assumptions.
Economic growthThe AEO economic forecasts are trend projections, with no major shocks assumed and with potential growth determined by the economy’s supply capability. Growth in aggregate supply depends on increases in the labor force, growth of capital stocks, and improvements in productivity. Long-term demand growth depends on labor force growth, income growth, and population growth. The AEO2015 Reference case uses the U.S. Census Bureau’s December 2012 middle population projection: U.S. population grows
at an average annual rate of 0.7%, real GDP at 2.4%, labor force at 0.6%, and nonfarm labor productivity at 2.0% from 2013 to 2040.Table 2 compares key long-run economic growth projections in AEO2015 with actual growth rates over the past 30 years. In the AEO2015 Reference case, U.S. real GDP grows at an average annual rate of 2.4% from 2013 to 2040—a rate that is 0.4 percentage points slower than the average over the past 30 years. GDP expands in the Reference case by 3.1% in 2015, 2.5% in 2016, 2.6% from 2015 to 2025, and 2.4% from 2015 to 2040. As a share of GDP, consumption expenditures account for more than two-thirds of total GDP. In terms of growth, it is exports and business fixed investment that contribute the most to GDP. Growth in these is relatively strong during the first 10 years of the projection and then moderates for the remaining years. The growth rates for both exports and business fixed investment are above the rate of GDP growth with exports dominating throughout the projection (Figure 1).In the AEO2015 Reference case, nominal interest rates over the 2013-40 period are generally lower than those observed for the preceding 30 years, based on an expectation of lower inflation rates in the projection period. At present, the term structure of interest rates is still at the lowest level seen over the past 40 years. In 2012, the federal funds rate averaged 0.1%. Longer-term nominal interest rates are projected to average around 6.0%, which is lower than the previous 30-year average of 7.8%. After 2015, interest rates in ensuing
13 U.S. Energy Information Administration, Assumptions to the Annual Energy Outlook 2015, DOE/EIA-0554(2015) (Washington, DC, to be published), http://www.eia.gov/forecasts/aeo/assumptions.
Table 2. Growth in key economic factors in historical data and in the Reference case
AEO2015 (2013-40)
Previous 30 Years
Real 2009 dollars (annual average percent change)
GDP 2.4 2.8
GDP per capita 1.7 1.8
Disposable income 2.5 2.9
Consumer spending 2.4 3.1
Private investment 3.0 3.5
Exports 4.9 6.1
Imports 4.0 6.0
Government expenditures
0.9 1.7
GDP: Major trading countries
1.9 2.4
GDP: Other trading countries
3.8 4.7
Average annual rate
Federal funds rate 3.2 4.5
Unemployment rate 5.3 6.3
Nonfarm business output per hour
2.0 2.0
Source: AEO2015 Reference case D021915a, based on IHS Global Insight T301114.wf1.
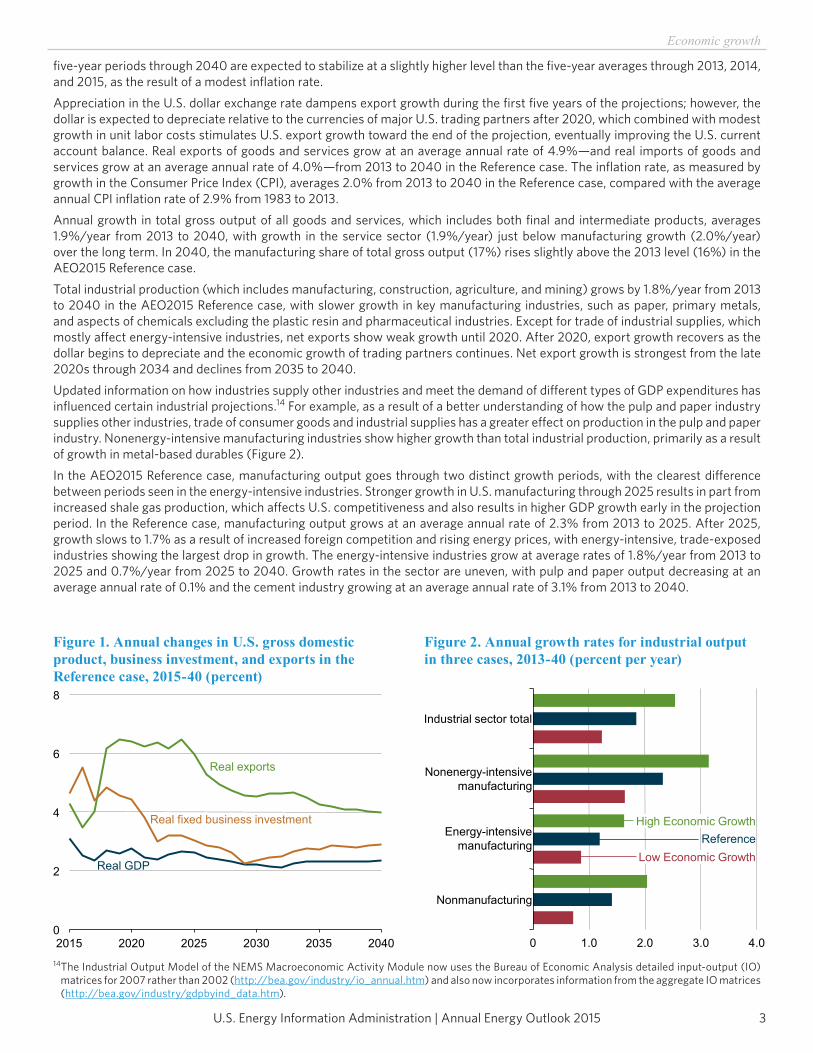
U.S. Energy Information Administration | Annual Energy Outlook 2015 3
Economic growth
five-year periods through 2040 are expected to stabilize at a slightly higher level than the five-year averages through 2013, 2014, and 2015, as the result of a modest inflation rate.Appreciation in the U.S. dollar exchange rate dampens export growth during the first five years of the projections; however, the dollar is expected to depreciate relative to the currencies of major U.S. trading partners after 2020, which combined with modest growth in unit labor costs stimulates U.S. export growth toward the end of the projection, eventually improving the U.S. current account balance. Real exports of goods and services grow at an average annual rate of 4.9%—and real imports of goods and services grow at an average annual rate of 4.0%—from 2013 to 2040 in the Reference case. The inflation rate, as measured by growth in the Consumer Price Index (CPI), averages 2.0% from 2013 to 2040 in the Reference case, compared with the average annual CPI inflation rate of 2.9% from 1983 to 2013.Annual growth in total gross output of all goods and services, which includes both final and intermediate products, averages 1.9%/year from 2013 to 2040, with growth in the service sector (1.9%/year) just below manufacturing growth (2.0%/year) over the long term. In 2040, the manufacturing share of total gross output (17%) rises slightly above the 2013 level (16%) in the AEO2015 Reference case.Total industrial production (which includes manufacturing, construction, agriculture, and mining) grows by 1.8%/year from 2013 to 2040 in the AEO2015 Reference case, with slower growth in key manufacturing industries, such as paper, primary metals, and aspects of chemicals excluding the plastic resin and pharmaceutical industries. Except for trade of industrial supplies, which mostly affect energy-intensive industries, net exports show weak growth until 2020. After 2020, export growth recovers as the dollar begins to depreciate and the economic growth of trading partners continues. Net export growth is strongest from the late 2020s through 2034 and declines from 2035 to 2040.Updated information on how industries supply other industries and meet the demand of different types of GDP expenditures has influenced certain industrial projections.14 For example, as a result of a better understanding of how the pulp and paper industry supplies other industries, trade of consumer goods and industrial supplies has a greater effect on production in the pulp and paper industry. Nonenergy-intensive manufacturing industries show higher growth than total industrial production, primarily as a result of growth in metal-based durables (Figure 2).In the AEO2015 Reference case, manufacturing output goes through two distinct growth periods, with the clearest difference between periods seen in the energy-intensive industries. Stronger growth in U.S. manufacturing through 2025 results in part from increased shale gas production, which affects U.S. competitiveness and also results in higher GDP growth early in the projection period. In the Reference case, manufacturing output grows at an average annual rate of 2.3% from 2013 to 2025. After 2025, growth slows to 1.7% as a result of increased foreign competition and rising energy prices, with energy-intensive, trade-exposed industries showing the largest drop in growth. The energy-intensive industries grow at average rates of 1.8%/year from 2013 to 2025 and 0.7%/year from 2025 to 2040. Growth rates in the sector are uneven, with pulp and paper output decreasing at an average annual rate of 0.1% and the cement industry growing at an average annual rate of 3.1% from 2013 to 2040.
14 The Industrial Output Model of the NEMS Macroeconomic Activity Module now uses the Bureau of Economic Analysis detailed input-output (IO) matrices for 2007 rather than 2002 (http://bea.gov/industry/io_annual.htm) and also now incorporates information from the aggregate IO matrices (http://bea.gov/industry/gdpbyind_data.htm).
0
2
4
6
8
2015 2020 2025 2030 2035 2040
Real fixed business investment
Real exports
Real GDP
Figure 1. Annual changes in U.S. gross domestic product, business investment, and exports in the Reference case, 2015-40 (percent)
0 1.0 2.0 3.0 4.0
Nonmanufacturing
Energy-intensivemanufacturing
Nonenergy-intensivemanufacturing
Industrial sector total
ReferenceLow Economic Growth
High Economic Growth
Figure 2. Annual growth rates for industrial output in three cases, 2013-40 (percent per year)
U.S. Energy Information Administration | Annual Energy Outlook 20154
Energy prices
AEO2015 presents three economic growth cases: Reference, High, and Low. The High Economic Growth case assumes higher growth and lower inflation, compared with the Reference case, and the Low Economic Growth case assumes lower growth and higher inflation. Differences among the Reference, High Economic Growth, and Low Economic Growth cases reflect different expectations for growth in population (specifically, net immigration), labor force, capital stock, and productivity, which are above trend in the High Economic Growth case and below trend in the Low Economic Growth case. The average annual growth rate for real GDP from 2013 to 2040 in the Reference case is 2.4%, compared with 2.9% in the High Economic Growth case and 1.8% in the Low Economic Growth case.In the High Economic Growth case, with greater productivity gains and a larger labor force, the U.S. economy expands by 4.1% in 2015, 3.6% in 2016, 3.2% from 2015 to 2025, and 2.9% from 2015 to 2040. In the Low Economic Growth case, the current economic recovery (which is now more than five years old) stalls in the near term, and productivity and labor force growth are weak in the long term. As a result, economic growth averages 2.4% in 2015, 1.6% in 2016, 1.7% from 2015 to 2025, and 1.8% from 2015 to 2040 in the Low Economic Growth case (Table 3).
Energy pricesCrude oilAEO2015 considers a number of factors related to the uncertainty of future world crude oil prices, including changes in worldwide demand for petroleum products, crude oil production, and supplies of other liquid fuels.15 In the Reference, High Oil Price, and Low Oil Price cases, the North Sea Brent (Brent) crude oil price reflects the market price for light sweet crude oil free on board (FOB) at the Sullen Voe oil terminal in Scotland.The Reference case reflects global oil market events through the end of 2014. Over the past two years, growth in U.S. crude oil production, along with the late-2014 drop in global crude oil prices, has altered the economics of the oil market. These new market conditions are assumed to continue in the Reference case, with the average Brent price dropping from $109/barrel (bbl) in 2013 to $56/bbl in 2015, before increasing to $76/bbl in 2018. After 2018, growth in demand from non-OECD countries—countries outside the Organization for Economic Cooperation and Development (OECD)—pushes the Brent price to $141/bbl in 2040 (in 2013 dollars). The increase in oil prices supports growth in domestic crude oil production.The High Oil Price case assumes higher world demand for petroleum products, less upstream investment by the Organization of the Petroleum Exporting Countries (OPEC), and higher non-OPEC exploration and development costs. These factors all contribute to a rise in the average spot market price for Brent crude oil to $252/bbl in 2040, 78% above the Reference case. The reverse is true in the Low Oil Price case: lower non-OECD demand, higher OPEC upstream investment, and lower non-OPEC exploration
15 Liquid fuels, or petroleum and other liquids, includes crude oil and products of petroleum refining, natural gas liquids, biofuels, and liquids derived from other hydrocarbon sources (including coal-to-liquids and gas-to-liquids).
Table 3. Average annual growth of labor productivity, employment, income, and consumption in three cases (percent per year)
2015 2016 2015-25 2015-40
Productivity
High Economic Growth 2.3 2.3 2.4 2.3
Reference 1.9 1.6 2.1 2.0
Low Economic Growth 1.3 0.9 1.7 1.6
Non-farm employment
High Economic Growth 2.9 1.9 1.2 0.9
Reference 2.2 1.6 0.8 0.7
Low Economic Growth 1.6 1.1 0.6 0.5
Real personal income
High Economic Growth 3.6 3.3 3.4 2.8
Reference 3.3 2.8 2.8 2.5
Low Economic Growth 2.7 2.4 2.4 2.3
Real personal consumption
High Economic Growth 3.6 3.5 3.2 2.9
Reference 3.0 3.0 2.5 2.4
Low Economic Growth 2.5 2.6 1.7 1.7
Source: AEO2015 Reference case D021915a, based on IHS Global Insight T301114.wf1.
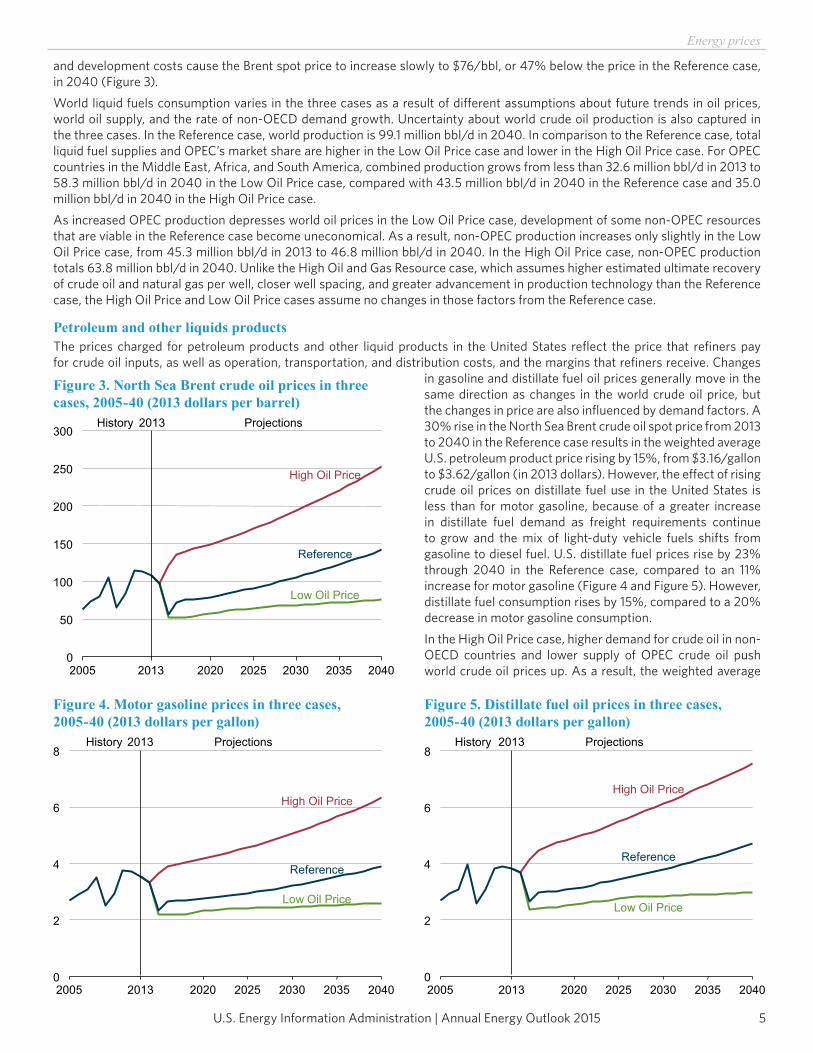
U.S. Energy Information Administration | Annual Energy Outlook 2015 5
Energy prices
and development costs cause the Brent spot price to increase slowly to $76/bbl, or 47% below the price in the Reference case, in 2040 (Figure 3).World liquid fuels consumption varies in the three cases as a result of different assumptions about future trends in oil prices, world oil supply, and the rate of non-OECD demand growth. Uncertainty about world crude oil production is also captured in the three cases. In the Reference case, world production is 99.1 million bbl/d in 2040. In comparison to the Reference case, total liquid fuel supplies and OPEC’s market share are higher in the Low Oil Price case and lower in the High Oil Price case. For OPEC countries in the Middle East, Africa, and South America, combined production grows from less than 32.6 million bbl/d in 2013 to 58.3 million bbl/d in 2040 in the Low Oil Price case, compared with 43.5 million bbl/d in 2040 in the Reference case and 35.0 million bbl/d in 2040 in the High Oil Price case.As increased OPEC production depresses world oil prices in the Low Oil Price case, development of some non-OPEC resources that are viable in the Reference case become uneconomical. As a result, non-OPEC production increases only slightly in the Low Oil Price case, from 45.3 million bbl/d in 2013 to 46.8 million bbl/d in 2040. In the High Oil Price case, non-OPEC production totals 63.8 million bbl/d in 2040. Unlike the High Oil and Gas Resource case, which assumes higher estimated ultimate recovery of crude oil and natural gas per well, closer well spacing, and greater advancement in production technology than the Reference case, the High Oil Price and Low Oil Price cases assume no changes in those factors from the Reference case.
Petroleum and other liquids productsThe prices charged for petroleum products and other liquid products in the United States reflect the price that refiners pay for crude oil inputs, as well as operation, transportation, and distribution costs, and the margins that refiners receive. Changes
in gasoline and distillate fuel oil prices generally move in the same direction as changes in the world crude oil price, but the changes in price are also influenced by demand factors. A 30% rise in the North Sea Brent crude oil spot price from 2013 to 2040 in the Reference case results in the weighted average U.S. petroleum product price rising by 15%, from $3.16/gallon to $3.62/gallon (in 2013 dollars). However, the effect of rising crude oil prices on distillate fuel use in the United States is less than for motor gasoline, because of a greater increase in distillate fuel demand as freight requirements continue to grow and the mix of light-duty vehicle fuels shifts from gasoline to diesel fuel. U.S. distillate fuel prices rise by 23% through 2040 in the Reference case, compared to an 11% increase for motor gasoline (Figure 4 and Figure 5). However, distillate fuel consumption rises by 15%, compared to a 20% decrease in motor gasoline consumption.In the High Oil Price case, higher demand for crude oil in non-OECD countries and lower supply of OPEC crude oil push world crude oil prices up. As a result, the weighted average
0
2
4
6
8
2005 2013 2020 2025 2030 2035 2040
2013 ProjectionsHistory
Reference
High Oil Price
Low Oil Price
Figure 4. Motor gasoline prices in three cases, 2005-40 (2013 dollars per gallon)
0
2
4
6
8
2005 2013 2020 2025 2030 2035 2040
2013 ProjectionsHistory
Reference
High Oil Price
Low Oil Price
Figure 5. Distillate fuel oil prices in three cases, 2005-40 (2013 dollars per gallon)
0
50
100
150
200
250
300
2005 2013 2020 2025 2030 2035 2040
History 2013 Projections
Reference
High Oil Price
Low Oil Price
Figure 3. North Sea Brent crude oil prices in three cases, 2005-40 (2013 dollars per barrel)
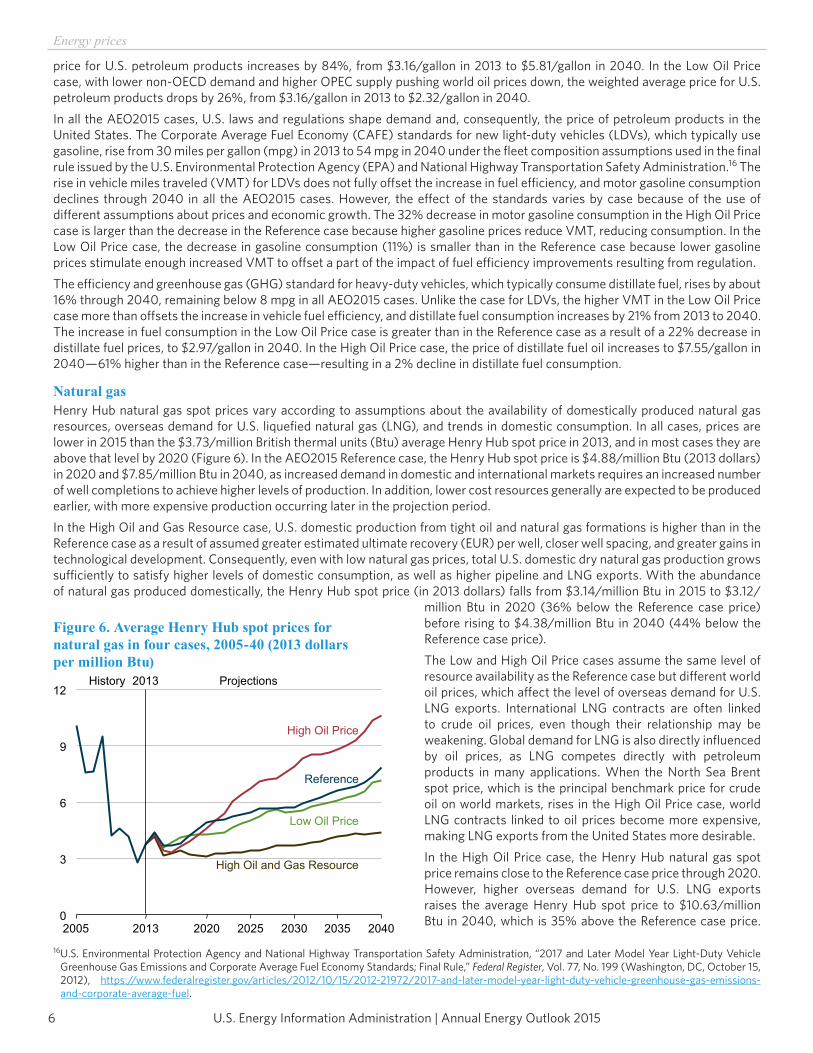
U.S. Energy Information Administration | Annual Energy Outlook 20156
Energy prices
price for U.S. petroleum products increases by 84%, from $3.16/gallon in 2013 to $5.81/gallon in 2040. In the Low Oil Price case, with lower non-OECD demand and higher OPEC supply pushing world oil prices down, the weighted average price for U.S. petroleum products drops by 26%, from $3.16/gallon in 2013 to $2.32/gallon in 2040.In all the AEO2015 cases, U.S. laws and regulations shape demand and, consequently, the price of petroleum products in the United States. The Corporate Average Fuel Economy (CAFE) standards for new light-duty vehicles (LDVs), which typically use gasoline, rise from 30 miles per gallon (mpg) in 2013 to 54 mpg in 2040 under the fleet composition assumptions used in the final rule issued by the U.S. Environmental Protection Agency (EPA) and National Highway Transportation Safety Administration.16 The rise in vehicle miles traveled (VMT) for LDVs does not fully offset the increase in fuel efficiency, and motor gasoline consumption declines through 2040 in all the AEO2015 cases. However, the effect of the standards varies by case because of the use of different assumptions about prices and economic growth. The 32% decrease in motor gasoline consumption in the High Oil Price case is larger than the decrease in the Reference case because higher gasoline prices reduce VMT, reducing consumption. In the Low Oil Price case, the decrease in gasoline consumption (11%) is smaller than in the Reference case because lower gasoline prices stimulate enough increased VMT to offset a part of the impact of fuel efficiency improvements resulting from regulation.The efficiency and greenhouse gas (GHG) standard for heavy-duty vehicles, which typically consume distillate fuel, rises by about 16% through 2040, remaining below 8 mpg in all AEO2015 cases. Unlike the case for LDVs, the higher VMT in the Low Oil Price case more than offsets the increase in vehicle fuel efficiency, and distillate fuel consumption increases by 21% from 2013 to 2040. The increase in fuel consumption in the Low Oil Price case is greater than in the Reference case as a result of a 22% decrease in distillate fuel prices, to $2.97/gallon in 2040. In the High Oil Price case, the price of distillate fuel oil increases to $7.55/gallon in 2040—61% higher than in the Reference case—resulting in a 2% decline in distillate fuel consumption.
Natural gasHenry Hub natural gas spot prices vary according to assumptions about the availability of domestically produced natural gas resources, overseas demand for U.S. liquefied natural gas (LNG), and trends in domestic consumption. In all cases, prices are lower in 2015 than the $3.73/million British thermal units (Btu) average Henry Hub spot price in 2013, and in most cases they are above that level by 2020 (Figure 6). In the AEO2015 Reference case, the Henry Hub spot price is $4.88/million Btu (2013 dollars) in 2020 and $7.85/million Btu in 2040, as increased demand in domestic and international markets requires an increased number of well completions to achieve higher levels of production. In addition, lower cost resources generally are expected to be produced earlier, with more expensive production occurring later in the projection period.In the High Oil and Gas Resource case, U.S. domestic production from tight oil and natural gas formations is higher than in the Reference case as a result of assumed greater estimated ultimate recovery (EUR) per well, closer well spacing, and greater gains in technological development. Consequently, even with low natural gas prices, total U.S. domestic dry natural gas production grows sufficiently to satisfy higher levels of domestic consumption, as well as higher pipeline and LNG exports. With the abundance of natural gas produced domestically, the Henry Hub spot price (in 2013 dollars) falls from $3.14/million Btu in 2015 to $3.12/
million Btu in 2020 (36% below the Reference case price) before rising to $4.38/million Btu in 2040 (44% below the Reference case price).The Low and High Oil Price cases assume the same level of resource availability as the Reference case but different world oil prices, which affect the level of overseas demand for U.S. LNG exports. International LNG contracts are often linked to crude oil prices, even though their relationship may be weakening. Global demand for LNG is also directly influenced by oil prices, as LNG competes directly with petroleum products in many applications. When the North Sea Brent spot price, which is the principal benchmark price for crude oil on world markets, rises in the High Oil Price case, world LNG contracts linked to oil prices become more expensive, making LNG exports from the United States more desirable.In the High Oil Price case, the Henry Hub natural gas spot price remains close to the Reference case price through 2020. However, higher overseas demand for U.S. LNG exports raises the average Henry Hub spot price to $10.63/million Btu in 2040, which is 35% above the Reference case price.
16 U.S. Environmental Protection Agency and National Highway Transportation Safety Administration, “2017 and Later Model Year Light-Duty Vehicle Greenhouse Gas Emissions and Corporate Average Fuel Economy Standards; Final Rule,” Federal Register, Vol. 77, No. 199 (Washington, DC, October 15, 2012), https://www.federalregister.gov/articles/2012/10/15/2012-21972/2017-and-later-model-year-light-duty-vehicle-greenhouse-gas-emissions-and-corporate-average-fuel.
0
3
6
9
12
2005 2013 2020 2025 2030 2035 2040
2013 ProjectionsHistory
Reference
High Oil Price
Low Oil Price
High Oil and Gas Resource
Figure 6. Average Henry Hub spot prices for natural gas in four cases, 2005-40 (2013 dollars per million Btu)
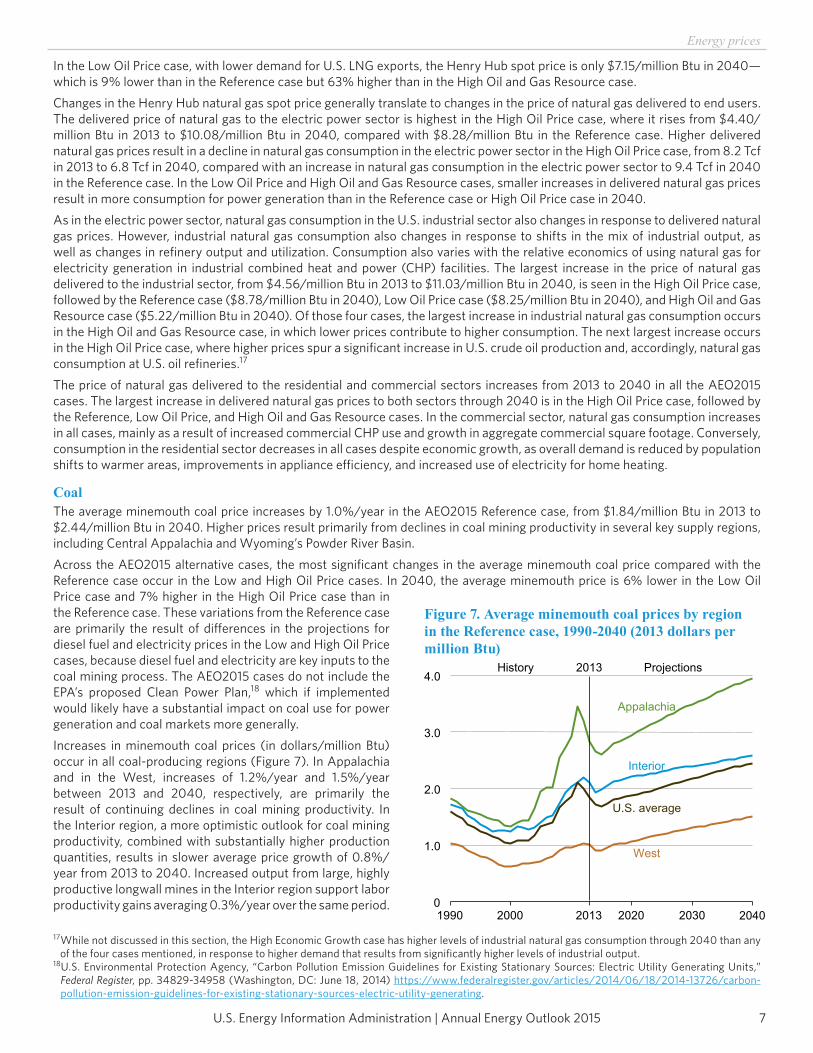
U.S. Energy Information Administration | Annual Energy Outlook 2015 7
Energy prices
In the Low Oil Price case, with lower demand for U.S. LNG exports, the Henry Hub spot price is only $7.15/million Btu in 2040—which is 9% lower than in the Reference case but 63% higher than in the High Oil and Gas Resource case.Changes in the Henry Hub natural gas spot price generally translate to changes in the price of natural gas delivered to end users. The delivered price of natural gas to the electric power sector is highest in the High Oil Price case, where it rises from $4.40/million Btu in 2013 to $10.08/million Btu in 2040, compared with $8.28/million Btu in the Reference case. Higher delivered natural gas prices result in a decline in natural gas consumption in the electric power sector in the High Oil Price case, from 8.2 Tcf in 2013 to 6.8 Tcf in 2040, compared with an increase in natural gas consumption in the electric power sector to 9.4 Tcf in 2040 in the Reference case. In the Low Oil Price and High Oil and Gas Resource cases, smaller increases in delivered natural gas prices result in more consumption for power generation than in the Reference case or High Oil Price case in 2040.As in the electric power sector, natural gas consumption in the U.S. industrial sector also changes in response to delivered natural gas prices. However, industrial natural gas consumption also changes in response to shifts in the mix of industrial output, as well as changes in refinery output and utilization. Consumption also varies with the relative economics of using natural gas for electricity generation in industrial combined heat and power (CHP) facilities. The largest increase in the price of natural gas delivered to the industrial sector, from $4.56/million Btu in 2013 to $11.03/million Btu in 2040, is seen in the High Oil Price case, followed by the Reference case ($8.78/million Btu in 2040), Low Oil Price case ($8.25/million Btu in 2040), and High Oil and Gas Resource case ($5.22/million Btu in 2040). Of those four cases, the largest increase in industrial natural gas consumption occurs in the High Oil and Gas Resource case, in which lower prices contribute to higher consumption. The next largest increase occurs in the High Oil Price case, where higher prices spur a significant increase in U.S. crude oil production and, accordingly, natural gas consumption at U.S. oil refineries.17
The price of natural gas delivered to the residential and commercial sectors increases from 2013 to 2040 in all the AEO2015 cases. The largest increase in delivered natural gas prices to both sectors through 2040 is in the High Oil Price case, followed by the Reference, Low Oil Price, and High Oil and Gas Resource cases. In the commercial sector, natural gas consumption increases in all cases, mainly as a result of increased commercial CHP use and growth in aggregate commercial square footage. Conversely, consumption in the residential sector decreases in all cases despite economic growth, as overall demand is reduced by population shifts to warmer areas, improvements in appliance efficiency, and increased use of electricity for home heating.
CoalThe average minemouth coal price increases by 1.0%/year in the AEO2015 Reference case, from $1.84/million Btu in 2013 to $2.44/million Btu in 2040. Higher prices result primarily from declines in coal mining productivity in several key supply regions, including Central Appalachia and Wyoming’s Powder River Basin.Across the AEO2015 alternative cases, the most significant changes in the average minemouth coal price compared with the Reference case occur in the Low and High Oil Price cases. In 2040, the average minemouth price is 6% lower in the Low Oil Price case and 7% higher in the High Oil Price case than in the Reference case. These variations from the Reference case are primarily the result of differences in the projections for diesel fuel and electricity prices in the Low and High Oil Price cases, because diesel fuel and electricity are key inputs to the coal mining process. The AEO2015 cases do not include the EPA’s proposed Clean Power Plan,18 which if implemented would likely have a substantial impact on coal use for power generation and coal markets more generally.Increases in minemouth coal prices (in dollars/million Btu) occur in all coal-producing regions (Figure 7). In Appalachia and in the West, increases of 1.2%/year and 1.5%/year between 2013 and 2040, respectively, are primarily the result of continuing declines in coal mining productivity. In the Interior region, a more optimistic outlook for coal mining productivity, combined with substantially higher production quantities, results in slower average price growth of 0.8%/year from 2013 to 2040. Increased output from large, highly productive longwall mines in the Interior region support labor productivity gains averaging 0.3%/year over the same period.
17 While not discussed in this section, the High Economic Growth case has higher levels of industrial natural gas consumption through 2040 than any of the four cases mentioned, in response to higher demand that results from significantly higher levels of industrial output.
18 U.S. Environmental Protection Agency, “Carbon Pollution Emission Guidelines for Existing Stationary Sources: Electric Utility Generating Units,” Federal Register, pp. 34829-34958 (Washington, DC: June 18, 2014) https://www.federalregister.gov/articles/2014/06/18/2014-13726/carbon-pollution-emission-guidelines-for-existing-stationary-sources-electric-utility-generating.
0
1.0
2.0
3.0
4.0
1990 2000 2013 2020 2030 2040
2013 ProjectionsHistory
West
Interior
U.S. average
Appalachia
Figure 7. Average minemouth coal prices by region in the Reference case, 1990-2040 (2013 dollars per million Btu)
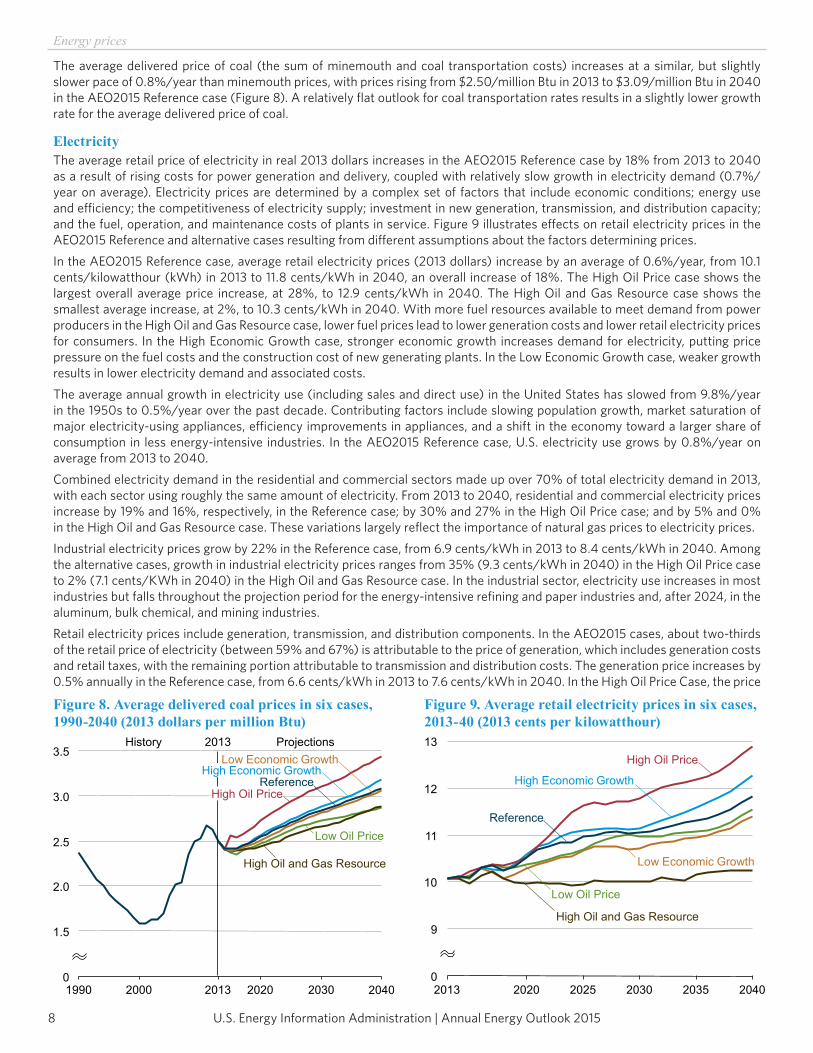
U.S. Energy Information Administration | Annual Energy Outlook 20158
Energy prices
The average delivered price of coal (the sum of minemouth and coal transportation costs) increases at a similar, but slightly slower pace of 0.8%/year than minemouth prices, with prices rising from $2.50/million Btu in 2013 to $3.09/million Btu in 2040 in the AEO2015 Reference case (Figure 8). A relatively flat outlook for coal transportation rates results in a slightly lower growth rate for the average delivered price of coal.
ElectricityThe average retail price of electricity in real 2013 dollars increases in the AEO2015 Reference case by 18% from 2013 to 2040 as a result of rising costs for power generation and delivery, coupled with relatively slow growth in electricity demand (0.7%/year on average). Electricity prices are determined by a complex set of factors that include economic conditions; energy use and efficiency; the competitiveness of electricity supply; investment in new generation, transmission, and distribution capacity; and the fuel, operation, and maintenance costs of plants in service. Figure 9 illustrates effects on retail electricity prices in the AEO2015 Reference and alternative cases resulting from different assumptions about the factors determining prices.In the AEO2015 Reference case, average retail electricity prices (2013 dollars) increase by an average of 0.6%/year, from 10.1 cents/kilowatthour (kWh) in 2013 to 11.8 cents/kWh in 2040, an overall increase of 18%. The High Oil Price case shows the largest overall average price increase, at 28%, to 12.9 cents/kWh in 2040. The High Oil and Gas Resource case shows the smallest average increase, at 2%, to 10.3 cents/kWh in 2040. With more fuel resources available to meet demand from power producers in the High Oil and Gas Resource case, lower fuel prices lead to lower generation costs and lower retail electricity prices for consumers. In the High Economic Growth case, stronger economic growth increases demand for electricity, putting price pressure on the fuel costs and the construction cost of new generating plants. In the Low Economic Growth case, weaker growth results in lower electricity demand and associated costs.The average annual growth in electricity use (including sales and direct use) in the United States has slowed from 9.8%/year in the 1950s to 0.5%/year over the past decade. Contributing factors include slowing population growth, market saturation of major electricity-using appliances, efficiency improvements in appliances, and a shift in the economy toward a larger share of consumption in less energy-intensive industries. In the AEO2015 Reference case, U.S. electricity use grows by 0.8%/year on average from 2013 to 2040.Combined electricity demand in the residential and commercial sectors made up over 70% of total electricity demand in 2013, with each sector using roughly the same amount of electricity. From 2013 to 2040, residential and commercial electricity prices increase by 19% and 16%, respectively, in the Reference case; by 30% and 27% in the High Oil Price case; and by 5% and 0% in the High Oil and Gas Resource case. These variations largely reflect the importance of natural gas prices to electricity prices.Industrial electricity prices grow by 22% in the Reference case, from 6.9 cents/kWh in 2013 to 8.4 cents/kWh in 2040. Among the alternative cases, growth in industrial electricity prices ranges from 35% (9.3 cents/kWh in 2040) in the High Oil Price case to 2% (7.1 cents/KWh in 2040) in the High Oil and Gas Resource case. In the industrial sector, electricity use increases in most industries but falls throughout the projection period for the energy-intensive refining and paper industries and, after 2024, in the aluminum, bulk chemical, and mining industries.Retail electricity prices include generation, transmission, and distribution components. In the AEO2015 cases, about two-thirds of the retail price of electricity (between 59% and 67%) is attributable to the price of generation, which includes generation costs and retail taxes, with the remaining portion attributable to transmission and distribution costs. The generation price increases by 0.5% annually in the Reference case, from 6.6 cents/kWh in 2013 to 7.6 cents/kWh in 2040. In the High Oil Price Case, the price
0
1.5
2.0
2.5
3.0
3.5
1990 2000 2013 2020 2030 2040
2013 ProjectionsHistory
Reference
Low Oil Price
High Oil and Gas Resource
High Economic Growth
High Oil Price
Low Economic Growth
Figure 8. Average delivered coal prices in six cases, 1990-2040 (2013 dollars per million Btu)
0
9
10
11
12
13
2013 2020 2025 2030 2035 2040
Reference
Low Oil Price
Low Economic Growth
High Oil and Gas Resource
High Economic Growth
High Oil Price
Figure 9. Average retail electricity prices in six cases, 2013-40 (2013 cents per kilowatthour)
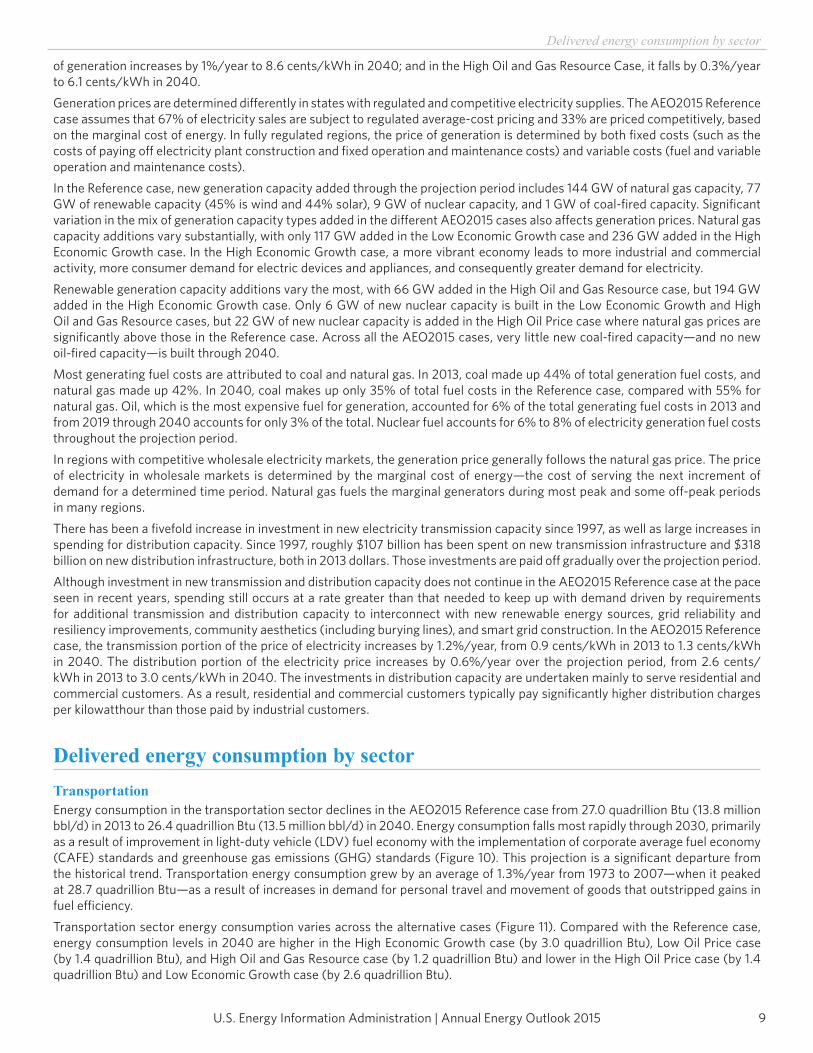
U.S. Energy Information Administration | Annual Energy Outlook 2015 9
Delivered energy consumption by sector
of generation increases by 1%/year to 8.6 cents/kWh in 2040; and in the High Oil and Gas Resource Case, it falls by 0.3%/year to 6.1 cents/kWh in 2040.Generation prices are determined differently in states with regulated and competitive electricity supplies. The AEO2015 Reference case assumes that 67% of electricity sales are subject to regulated average-cost pricing and 33% are priced competitively, based on the marginal cost of energy. In fully regulated regions, the price of generation is determined by both fixed costs (such as the costs of paying off electricity plant construction and fixed operation and maintenance costs) and variable costs (fuel and variable operation and maintenance costs).In the Reference case, new generation capacity added through the projection period includes 144 GW of natural gas capacity, 77 GW of renewable capacity (45% is wind and 44% solar), 9 GW of nuclear capacity, and 1 GW of coal-fired capacity. Significant variation in the mix of generation capacity types added in the different AEO2015 cases also affects generation prices. Natural gas capacity additions vary substantially, with only 117 GW added in the Low Economic Growth case and 236 GW added in the High Economic Growth case. In the High Economic Growth case, a more vibrant economy leads to more industrial and commercial activity, more consumer demand for electric devices and appliances, and consequently greater demand for electricity. Renewable generation capacity additions vary the most, with 66 GW added in the High Oil and Gas Resource case, but 194 GW added in the High Economic Growth case. Only 6 GW of new nuclear capacity is built in the Low Economic Growth and High Oil and Gas Resource cases, but 22 GW of new nuclear capacity is added in the High Oil Price case where natural gas prices are significantly above those in the Reference case. Across all the AEO2015 cases, very little new coal-fired capacity—and no new oil-fired capacity—is built through 2040.Most generating fuel costs are attributed to coal and natural gas. In 2013, coal made up 44% of total generation fuel costs, and natural gas made up 42%. In 2040, coal makes up only 35% of total fuel costs in the Reference case, compared with 55% for natural gas. Oil, which is the most expensive fuel for generation, accounted for 6% of the total generating fuel costs in 2013 and from 2019 through 2040 accounts for only 3% of the total. Nuclear fuel accounts for 6% to 8% of electricity generation fuel costs throughout the projection period.In regions with competitive wholesale electricity markets, the generation price generally follows the natural gas price. The price of electricity in wholesale markets is determined by the marginal cost of energy—the cost of serving the next increment of demand for a determined time period. Natural gas fuels the marginal generators during most peak and some off-peak periods in many regions.There has been a fivefold increase in investment in new electricity transmission capacity since 1997, as well as large increases in spending for distribution capacity. Since 1997, roughly $107 billion has been spent on new transmission infrastructure and $318 billion on new distribution infrastructure, both in 2013 dollars. Those investments are paid off gradually over the projection period.Although investment in new transmission and distribution capacity does not continue in the AEO2015 Reference case at the pace seen in recent years, spending still occurs at a rate greater than that needed to keep up with demand driven by requirements for additional transmission and distribution capacity to interconnect with new renewable energy sources, grid reliability and resiliency improvements, community aesthetics (including burying lines), and smart grid construction. In the AEO2015 Reference case, the transmission portion of the price of electricity increases by 1.2%/year, from 0.9 cents/kWh in 2013 to 1.3 cents/kWh in 2040. The distribution portion of the electricity price increases by 0.6%/year over the projection period, from 2.6 cents/kWh in 2013 to 3.0 cents/kWh in 2040. The investments in distribution capacity are undertaken mainly to serve residential and commercial customers. As a result, residential and commercial customers typically pay significantly higher distribution charges per kilowatthour than those paid by industrial customers.
Delivered energy consumption by sectorTransportationEnergy consumption in the transportation sector declines in the AEO2015 Reference case from 27.0 quadrillion Btu (13.8 million bbl/d) in 2013 to 26.4 quadrillion Btu (13.5 million bbl/d) in 2040. Energy consumption falls most rapidly through 2030, primarily as a result of improvement in light-duty vehicle (LDV) fuel economy with the implementation of corporate average fuel economy (CAFE) standards and greenhouse gas emissions (GHG) standards (Figure 10). This projection is a significant departure from the historical trend. Transportation energy consumption grew by an average of 1.3%/year from 1973 to 2007—when it peaked at 28.7 quadrillion Btu—as a result of increases in demand for personal travel and movement of goods that outstripped gains in fuel efficiency.Transportation sector energy consumption varies across the alternative cases (Figure 11). Compared with the Reference case, energy consumption levels in 2040 are higher in the High Economic Growth case (by 3.0 quadrillion Btu), Low Oil Price case (by 1.4 quadrillion Btu), and High Oil and Gas Resource case (by 1.2 quadrillion Btu) and lower in the High Oil Price case (by 1.4 quadrillion Btu) and Low Economic Growth case (by 2.6 quadrillion Btu).
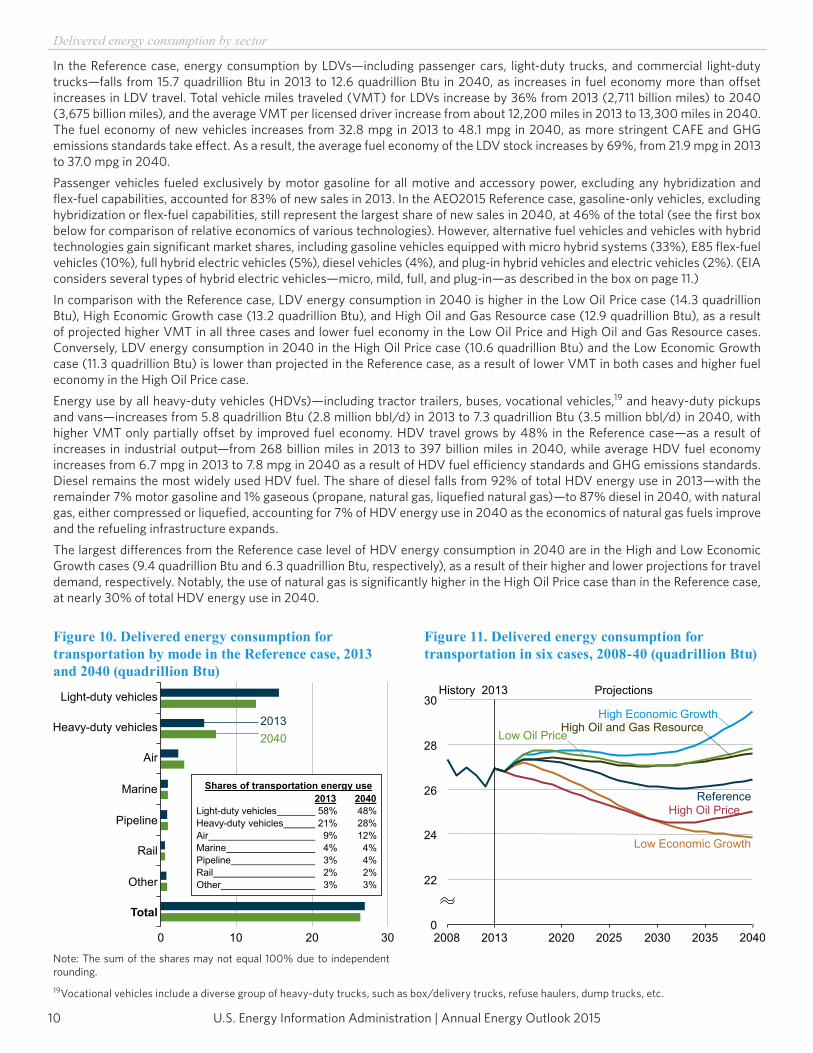
U.S. Energy Information Administration | Annual Energy Outlook 201510
Delivered energy consumption by sector
In the Reference case, energy consumption by LDVs—including passenger cars, light-duty trucks, and commercial light-duty trucks—falls from 15.7 quadrillion Btu in 2013 to 12.6 quadrillion Btu in 2040, as increases in fuel economy more than offset increases in LDV travel. Total vehicle miles traveled (VMT) for LDVs increase by 36% from 2013 (2,711 billion miles) to 2040 (3,675 billion miles), and the average VMT per licensed driver increase from about 12,200 miles in 2013 to 13,300 miles in 2040. The fuel economy of new vehicles increases from 32.8 mpg in 2013 to 48.1 mpg in 2040, as more stringent CAFE and GHG emissions standards take effect. As a result, the average fuel economy of the LDV stock increases by 69%, from 21.9 mpg in 2013 to 37.0 mpg in 2040.Passenger vehicles fueled exclusively by motor gasoline for all motive and accessory power, excluding any hybridization and flex-fuel capabilities, accounted for 83% of new sales in 2013. In the AEO2015 Reference case, gasoline-only vehicles, excluding hybridization or flex-fuel capabilities, still represent the largest share of new sales in 2040, at 46% of the total (see the first box below for comparison of relative economics of various technologies). However, alternative fuel vehicles and vehicles with hybrid technologies gain significant market shares, including gasoline vehicles equipped with micro hybrid systems (33%), E85 flex-fuel vehicles (10%), full hybrid electric vehicles (5%), diesel vehicles (4%), and plug-in hybrid vehicles and electric vehicles (2%). (EIA considers several types of hybrid electric vehicles—micro, mild, full, and plug-in—as described in the box on page 11.)In comparison with the Reference case, LDV energy consumption in 2040 is higher in the Low Oil Price case (14.3 quadrillion Btu), High Economic Growth case (13.2 quadrillion Btu), and High Oil and Gas Resource case (12.9 quadrillion Btu), as a result of projected higher VMT in all three cases and lower fuel economy in the Low Oil Price and High Oil and Gas Resource cases. Conversely, LDV energy consumption in 2040 in the High Oil Price case (10.6 quadrillion Btu) and the Low Economic Growth case (11.3 quadrillion Btu) is lower than projected in the Reference case, as a result of lower VMT in both cases and higher fuel economy in the High Oil Price case.Energy use by all heavy-duty vehicles (HDVs)—including tractor trailers, buses, vocational vehicles,19 and heavy-duty pickups and vans—increases from 5.8 quadrillion Btu (2.8 million bbl/d) in 2013 to 7.3 quadrillion Btu (3.5 million bbl/d) in 2040, with higher VMT only partially offset by improved fuel economy. HDV travel grows by 48% in the Reference case—as a result of increases in industrial output—from 268 billion miles in 2013 to 397 billion miles in 2040, while average HDV fuel economy increases from 6.7 mpg in 2013 to 7.8 mpg in 2040 as a result of HDV fuel efficiency standards and GHG emissions standards. Diesel remains the most widely used HDV fuel. The share of diesel falls from 92% of total HDV energy use in 2013—with the remainder 7% motor gasoline and 1% gaseous (propane, natural gas, liquefied natural gas)—to 87% diesel in 2040, with natural gas, either compressed or liquefied, accounting for 7% of HDV energy use in 2040 as the economics of natural gas fuels improve and the refueling infrastructure expands.The largest differences from the Reference case level of HDV energy consumption in 2040 are in the High and Low Economic Growth cases (9.4 quadrillion Btu and 6.3 quadrillion Btu, respectively), as a result of their higher and lower projections for travel demand, respectively. Notably, the use of natural gas is significantly higher in the High Oil Price case than in the Reference case, at nearly 30% of total HDV energy use in 2040.
19 Vocational vehicles include a diverse group of heavy-duty trucks, such as box/delivery trucks, refuse haulers, dump trucks, etc.
Total
Other
Rail
Pipeline
Marine
Heavy-duty vehicles
Light-duty vehicles
20402013
0 10 20 30
Air
Shares of transportation energy use 2013 2040
Light-duty vehicles 58% 48%Heavy-duty vehicles 21% 28%Air 9% 12%Marine 4% 4%Pipeline 3% 4%Rail 2% 2%Other 3% 3%
Figure 10. Delivered energy consumption for transportation by mode in the Reference case, 2013 and 2040 (quadrillion Btu)
0
22
24
26
28
30
2008 2013 2020 2025 2030 2035 2040
2013 ProjectionsHistory
Reference
Low Oil Price
Low Economic Growth
High Economic Growth
High Oil Price
High Oil and Gas Resource
Figure 11. Delivered energy consumption for transportation in six cases, 2008-40 (quadrillion Btu)
Note: The sum of the shares may not equal 100% due to independent rounding.
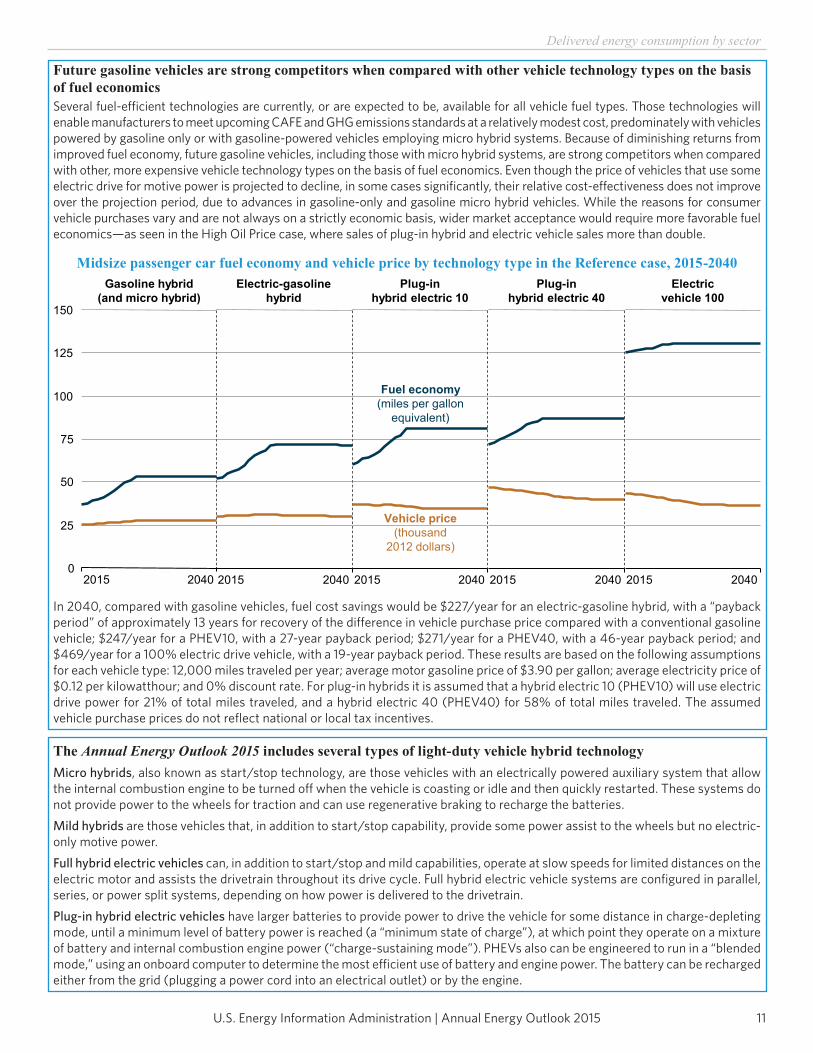
U.S. Energy Information Administration | Annual Energy Outlook 2015 11
Delivered energy consumption by sector
Future gasoline vehicles are strong competitors when compared with other vehicle technology types on the basis of fuel economicsSeveral fuel-efficient technologies are currently, or are expected to be, available for all vehicle fuel types. Those technologies will enable manufacturers to meet upcoming CAFE and GHG emissions standards at a relatively modest cost, predominately with vehicles powered by gasoline only or with gasoline-powered vehicles employing micro hybrid systems. Because of diminishing returns from improved fuel economy, future gasoline vehicles, including those with micro hybrid systems, are strong competitors when compared with other, more expensive vehicle technology types on the basis of fuel economics. Even though the price of vehicles that use some electric drive for motive power is projected to decline, in some cases significantly, their relative cost-effectiveness does not improve over the projection period, due to advances in gasoline-only and gasoline micro hybrid vehicles. While the reasons for consumer vehicle purchases vary and are not always on a strictly economic basis, wider market acceptance would require more favorable fuel economics—as seen in the High Oil Price case, where sales of plug-in hybrid and electric vehicle sales more than double.
In 2040, compared with gasoline vehicles, fuel cost savings would be $227/year for an electric-gasoline hybrid, with a “payback period” of approximately 13 years for recovery of the difference in vehicle purchase price compared with a conventional gasoline vehicle; $247/year for a PHEV10, with a 27-year payback period; $271/year for a PHEV40, with a 46-year payback period; and $469/year for a 100% electric drive vehicle, with a 19-year payback period. These results are based on the following assumptions for each vehicle type: 12,000 miles traveled per year; average motor gasoline price of $3.90 per gallon; average electricity price of $0.12 per kilowatthour; and 0% discount rate. For plug-in hybrids it is assumed that a hybrid electric 10 (PHEV10) will use electric drive power for 21% of total miles traveled, and a hybrid electric 40 (PHEV40) for 58% of total miles traveled. The assumed vehicle purchase prices do not reflect national or local tax incentives.
The Annual Energy Outlook 2015 includes several types of light-duty vehicle hybrid technologyMicro hybrids, also known as start/stop technology, are those vehicles with an electrically powered auxiliary system that allow the internal combustion engine to be turned off when the vehicle is coasting or idle and then quickly restarted. These systems do not provide power to the wheels for traction and can use regenerative braking to recharge the batteries.Mild hybrids are those vehicles that, in addition to start/stop capability, provide some power assist to the wheels but no electric-only motive power.Full hybrid electric vehicles can, in addition to start/stop and mild capabilities, operate at slow speeds for limited distances on the electric motor and assists the drivetrain throughout its drive cycle. Full hybrid electric vehicle systems are configured in parallel, series, or power split systems, depending on how power is delivered to the drivetrain.Plug-in hybrid electric vehicles have larger batteries to provide power to drive the vehicle for some distance in charge-depleting mode, until a minimum level of battery power is reached (a “minimum state of charge”), at which point they operate on a mixture of battery and internal combustion engine power (“charge-sustaining mode”). PHEVs also can be engineered to run in a “blended mode,” using an onboard computer to determine the most efficient use of battery and engine power. The battery can be recharged either from the grid (plugging a power cord into an electrical outlet) or by the engine.
2015 20400
25
50
75
100
125
150
2015 2040 2015 2040 2015 2040 2015 2040
Gasoline hybrid(and micro hybrid)
Electric-gasolinehybrid
Plug-inhybrid electric 10
Plug-inhybrid electric 40
Electricvehicle 100
Fuel economy(miles per gallon
equivalent)
Vehicle price(thousand
2012 dollars)
Midsize passenger car fuel economy and vehicle price by technology type in the Reference case, 2015-2040
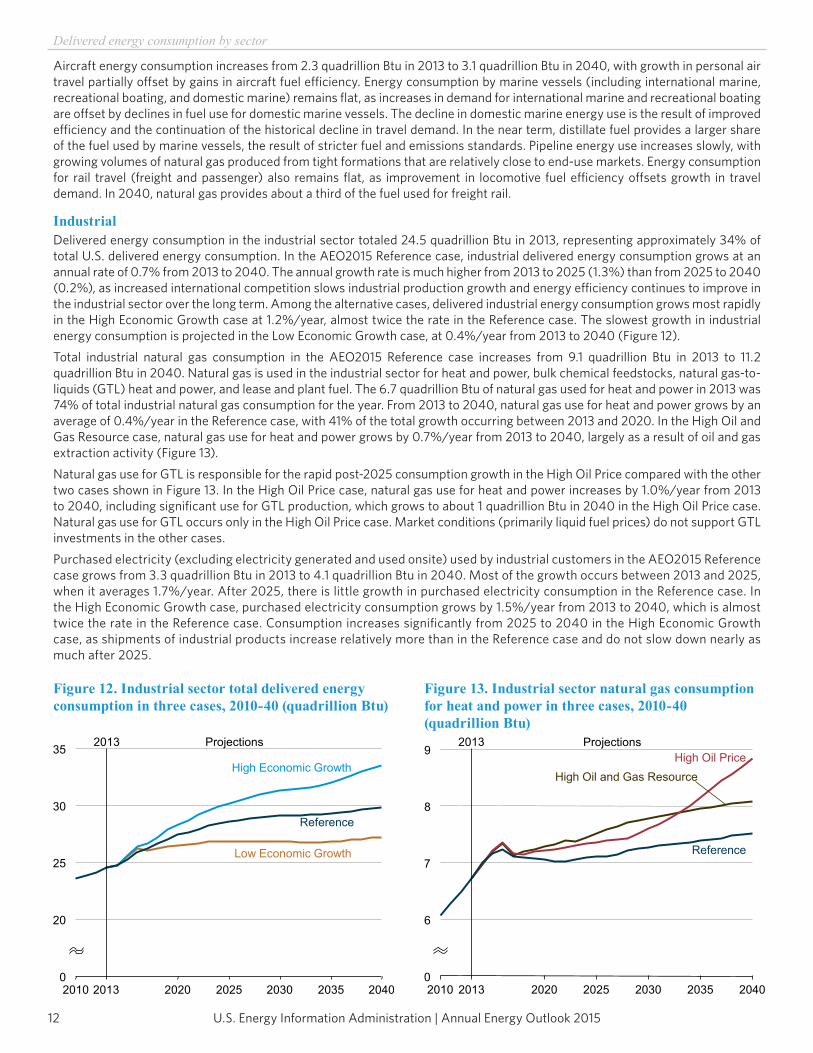
U.S. Energy Information Administration | Annual Energy Outlook 201512
Delivered energy consumption by sector
Aircraft energy consumption increases from 2.3 quadrillion Btu in 2013 to 3.1 quadrillion Btu in 2040, with growth in personal air travel partially offset by gains in aircraft fuel efficiency. Energy consumption by marine vessels (including international marine, recreational boating, and domestic marine) remains flat, as increases in demand for international marine and recreational boating are offset by declines in fuel use for domestic marine vessels. The decline in domestic marine energy use is the result of improved efficiency and the continuation of the historical decline in travel demand. In the near term, distillate fuel provides a larger share of the fuel used by marine vessels, the result of stricter fuel and emissions standards. Pipeline energy use increases slowly, with growing volumes of natural gas produced from tight formations that are relatively close to end-use markets. Energy consumption for rail travel (freight and passenger) also remains flat, as improvement in locomotive fuel efficiency offsets growth in travel demand. In 2040, natural gas provides about a third of the fuel used for freight rail.
IndustrialDelivered energy consumption in the industrial sector totaled 24.5 quadrillion Btu in 2013, representing approximately 34% of total U.S. delivered energy consumption. In the AEO2015 Reference case, industrial delivered energy consumption grows at an annual rate of 0.7% from 2013 to 2040. The annual growth rate is much higher from 2013 to 2025 (1.3%) than from 2025 to 2040 (0.2%), as increased international competition slows industrial production growth and energy efficiency continues to improve in the industrial sector over the long term. Among the alternative cases, delivered industrial energy consumption grows most rapidly in the High Economic Growth case at 1.2%/year, almost twice the rate in the Reference case. The slowest growth in industrial energy consumption is projected in the Low Economic Growth case, at 0.4%/year from 2013 to 2040 (Figure 12).Total industrial natural gas consumption in the AEO2015 Reference case increases from 9.1 quadrillion Btu in 2013 to 11.2 quadrillion Btu in 2040. Natural gas is used in the industrial sector for heat and power, bulk chemical feedstocks, natural gas-to-liquids (GTL) heat and power, and lease and plant fuel. The 6.7 quadrillion Btu of natural gas used for heat and power in 2013 was 74% of total industrial natural gas consumption for the year. From 2013 to 2040, natural gas use for heat and power grows by an average of 0.4%/year in the Reference case, with 41% of the total growth occurring between 2013 and 2020. In the High Oil and Gas Resource case, natural gas use for heat and power grows by 0.7%/year from 2013 to 2040, largely as a result of oil and gas extraction activity (Figure 13).Natural gas use for GTL is responsible for the rapid post-2025 consumption growth in the High Oil Price compared with the other two cases shown in Figure 13. In the High Oil Price case, natural gas use for heat and power increases by 1.0%/year from 2013 to 2040, including significant use for GTL production, which grows to about 1 quadrillion Btu in 2040 in the High Oil Price case. Natural gas use for GTL occurs only in the High Oil Price case. Market conditions (primarily liquid fuel prices) do not support GTL investments in the other cases.Purchased electricity (excluding electricity generated and used onsite) used by industrial customers in the AEO2015 Reference case grows from 3.3 quadrillion Btu in 2013 to 4.1 quadrillion Btu in 2040. Most of the growth occurs between 2013 and 2025, when it averages 1.7%/year. After 2025, there is little growth in purchased electricity consumption in the Reference case. In the High Economic Growth case, purchased electricity consumption grows by 1.5%/year from 2013 to 2040, which is almost twice the rate in the Reference case. Consumption increases significantly from 2025 to 2040 in the High Economic Growth case, as shipments of industrial products increase relatively more than in the Reference case and do not slow down nearly as much after 2025.
0
20
25
30
35
2010 2013 2020 2025 2030 2035 2040
Low Economic Growth
High Economic Growth
Reference
2013 Projections
Figure 12. Industrial sector total delivered energy consumption in three cases, 2010-40 (quadrillion Btu)
0
6
7
8
9
2010 2013 2020 2025 2030 2035 2040
Reference
High Oil and Gas ResourceHigh Oil Price
2013 Projections
Figure 13. Industrial sector natural gas consumption for heat and power in three cases, 2010-40 (quadrillion Btu)
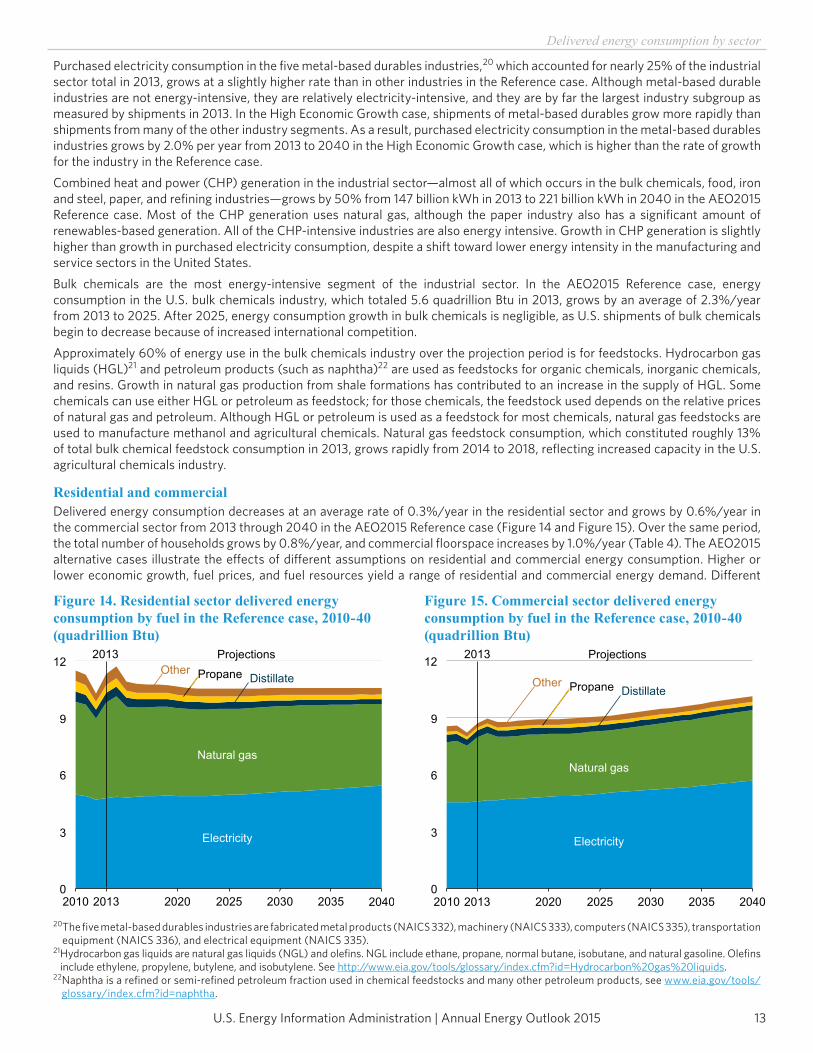
U.S. Energy Information Administration | Annual Energy Outlook 2015 13
Delivered energy consumption by sector
Purchased electricity consumption in the five metal-based durables industries,20 which accounted for nearly 25% of the industrial sector total in 2013, grows at a slightly higher rate than in other industries in the Reference case. Although metal-based durable industries are not energy-intensive, they are relatively electricity-intensive, and they are by far the largest industry subgroup as measured by shipments in 2013. In the High Economic Growth case, shipments of metal-based durables grow more rapidly than shipments from many of the other industry segments. As a result, purchased electricity consumption in the metal-based durables industries grows by 2.0% per year from 2013 to 2040 in the High Economic Growth case, which is higher than the rate of growth for the industry in the Reference case.Combined heat and power (CHP) generation in the industrial sector—almost all of which occurs in the bulk chemicals, food, iron and steel, paper, and refining industries—grows by 50% from 147 billion kWh in 2013 to 221 billion kWh in 2040 in the AEO2015 Reference case. Most of the CHP generation uses natural gas, although the paper industry also has a significant amount of renewables-based generation. All of the CHP-intensive industries are also energy intensive. Growth in CHP generation is slightly higher than growth in purchased electricity consumption, despite a shift toward lower energy intensity in the manufacturing and service sectors in the United States.Bulk chemicals are the most energy-intensive segment of the industrial sector. In the AEO2015 Reference case, energy consumption in the U.S. bulk chemicals industry, which totaled 5.6 quadrillion Btu in 2013, grows by an average of 2.3%/year from 2013 to 2025. After 2025, energy consumption growth in bulk chemicals is negligible, as U.S. shipments of bulk chemicals begin to decrease because of increased international competition.Approximately 60% of energy use in the bulk chemicals industry over the projection period is for feedstocks. Hydrocarbon gas liquids (HGL)21 and petroleum products (such as naphtha)22 are used as feedstocks for organic chemicals, inorganic chemicals, and resins. Growth in natural gas production from shale formations has contributed to an increase in the supply of HGL. Some chemicals can use either HGL or petroleum as feedstock; for those chemicals, the feedstock used depends on the relative prices of natural gas and petroleum. Although HGL or petroleum is used as a feedstock for most chemicals, natural gas feedstocks are used to manufacture methanol and agricultural chemicals. Natural gas feedstock consumption, which constituted roughly 13% of total bulk chemical feedstock consumption in 2013, grows rapidly from 2014 to 2018, reflecting increased capacity in the U.S. agricultural chemicals industry.
Residential and commercialDelivered energy consumption decreases at an average rate of 0.3%/year in the residential sector and grows by 0.6%/year in the commercial sector from 2013 through 2040 in the AEO2015 Reference case (Figure 14 and Figure 15). Over the same period, the total number of households grows by 0.8%/year, and commercial floorspace increases by 1.0%/year (Table 4). The AEO2015 alternative cases illustrate the effects of different assumptions on residential and commercial energy consumption. Higher or lower economic growth, fuel prices, and fuel resources yield a range of residential and commercial energy demand. Different
20 The five metal-based durables industries are fabricated metal products (NAICS 332), machinery (NAICS 333), computers (NAICS 335), transportation equipment (NAICS 336), and electrical equipment (NAICS 335).
21 Hydrocarbon gas liquids are natural gas liquids (NGL) and olefins. NGL include ethane, propane, normal butane, isobutane, and natural gasoline. Olefins include ethylene, propylene, butylene, and isobutylene. See http://www.eia.gov/tools/glossary/index.cfm?id=Hydrocarbon%20gas%20liquids.
22 Naphtha is a refined or semi-refined petroleum fraction used in chemical feedstocks and many other petroleum products, see www.eia.gov/tools/glossary/index.cfm?id=naphtha.
0
3
6
9
12
2010 2013 2020 2025 2030 2035 2040
Other Propane Distillate
Natural gas
Electricity
2013 Projections
Figure 14. Residential sector delivered energy consumption by fuel in the Reference case, 2010-40 (quadrillion Btu)
0
3
6
9
12
2010 2013 2020 2025 2030 2035 2040
Other Propane Distillate
Natural gas
Electricity
2013 Projections
Figure 15. Commercial sector delivered energy consumption by fuel in the Reference case, 2010-40 (quadrillion Btu)
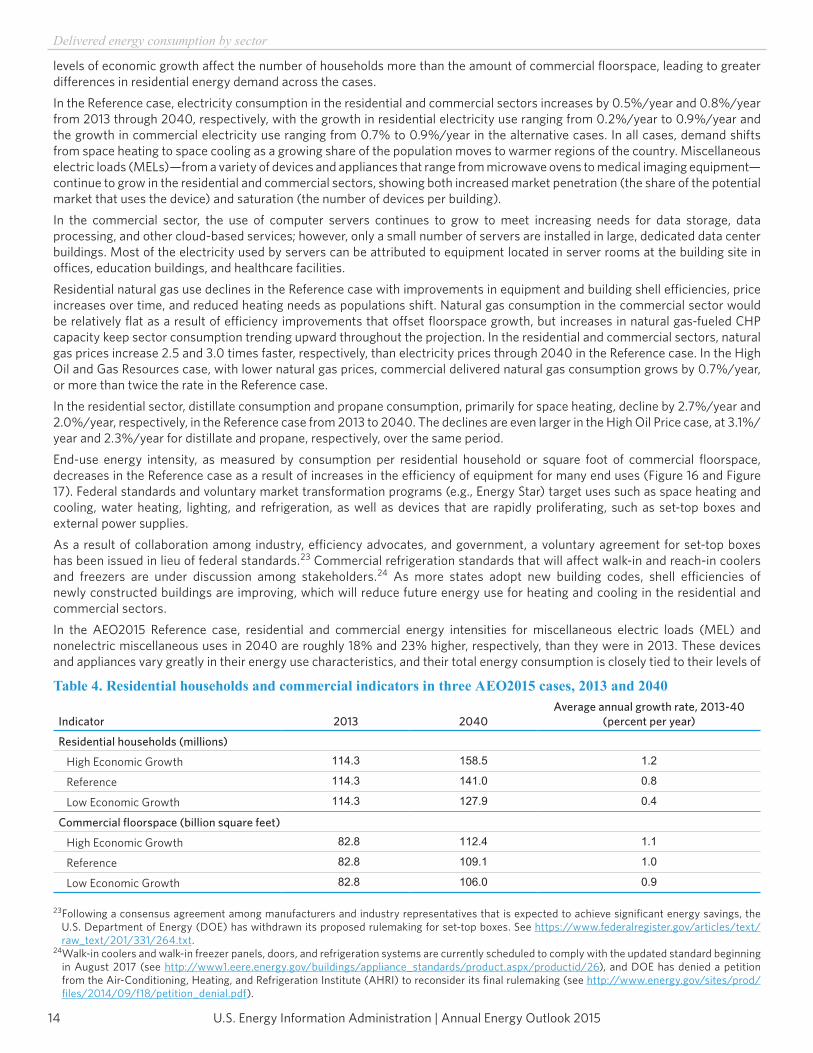
U.S. Energy Information Administration | Annual Energy Outlook 201514
Delivered energy consumption by sector
levels of economic growth affect the number of households more than the amount of commercial floorspace, leading to greater differences in residential energy demand across the cases.In the Reference case, electricity consumption in the residential and commercial sectors increases by 0.5%/year and 0.8%/year from 2013 through 2040, respectively, with the growth in residential electricity use ranging from 0.2%/year to 0.9%/year and the growth in commercial electricity use ranging from 0.7% to 0.9%/year in the alternative cases. In all cases, demand shifts from space heating to space cooling as a growing share of the population moves to warmer regions of the country. Miscellaneous electric loads (MELs)—from a variety of devices and appliances that range from microwave ovens to medical imaging equipment—continue to grow in the residential and commercial sectors, showing both increased market penetration (the share of the potential market that uses the device) and saturation (the number of devices per building).In the commercial sector, the use of computer servers continues to grow to meet increasing needs for data storage, data processing, and other cloud-based services; however, only a small number of servers are installed in large, dedicated data center buildings. Most of the electricity used by servers can be attributed to equipment located in server rooms at the building site in offices, education buildings, and healthcare facilities.Residential natural gas use declines in the Reference case with improvements in equipment and building shell efficiencies, price increases over time, and reduced heating needs as populations shift. Natural gas consumption in the commercial sector would be relatively flat as a result of efficiency improvements that offset floorspace growth, but increases in natural gas-fueled CHP capacity keep sector consumption trending upward throughout the projection. In the residential and commercial sectors, natural gas prices increase 2.5 and 3.0 times faster, respectively, than electricity prices through 2040 in the Reference case. In the High Oil and Gas Resources case, with lower natural gas prices, commercial delivered natural gas consumption grows by 0.7%/year, or more than twice the rate in the Reference case.In the residential sector, distillate consumption and propane consumption, primarily for space heating, decline by 2.7%/year and 2.0%/year, respectively, in the Reference case from 2013 to 2040. The declines are even larger in the High Oil Price case, at 3.1%/year and 2.3%/year for distillate and propane, respectively, over the same period.End-use energy intensity, as measured by consumption per residential household or square foot of commercial floorspace, decreases in the Reference case as a result of increases in the efficiency of equipment for many end uses (Figure 16 and Figure 17). Federal standards and voluntary market transformation programs (e.g., Energy Star) target uses such as space heating and cooling, water heating, lighting, and refrigeration, as well as devices that are rapidly proliferating, such as set-top boxes and external power supplies.As a result of collaboration among industry, efficiency advocates, and government, a voluntary agreement for set-top boxes has been issued in lieu of federal standards.23 Commercial refrigeration standards that will affect walk-in and reach-in coolers and freezers are under discussion among stakeholders.24 As more states adopt new building codes, shell efficiencies of newly constructed buildings are improving, which will reduce future energy use for heating and cooling in the residential and commercial sectors.In the AEO2015 Reference case, residential and commercial energy intensities for miscellaneous electric loads (MEL) and nonelectric miscellaneous uses in 2040 are roughly 18% and 23% higher, respectively, than they were in 2013. These devices and appliances vary greatly in their energy use characteristics, and their total energy consumption is closely tied to their levels of
23 Following a consensus agreement among manufacturers and industry representatives that is expected to achieve significant energy savings, the U.S. Department of Energy (DOE) has withdrawn its proposed rulemaking for set-top boxes. See https://www.federalregister.gov/articles/text/raw_text/201/331/264.txt.
24 Walk-in coolers and walk-in freezer panels, doors, and refrigeration systems are currently scheduled to comply with the updated standard beginning in August 2017 (see http://www1.eere.energy.gov/buildings/appliance_standards/product.aspx/productid/26), and DOE has denied a petition from the Air-Conditioning, Heating, and Refrigeration Institute (AHRI) to reconsider its final rulemaking (see http://www.energy.gov/sites/prod/files/2014/09/f18/petition_denial.pdf).
Table 4. Residential households and commercial indicators in three AEO2015 cases, 2013 and 2040
Indicator 2013 2040Average annual growth rate, 2013-40
(percent per year)
Residential households (millions)
High Economic Growth 114.3 158.5 1.2
Reference 114.3 141.0 0.8
Low Economic Growth 114.3 127.9 0.4
Commercial floorspace (billion square feet)
High Economic Growth 82.8 112.4 1.1
Reference 82.8 109.1 1.0
Low Economic Growth 82.8 106.0 0.9
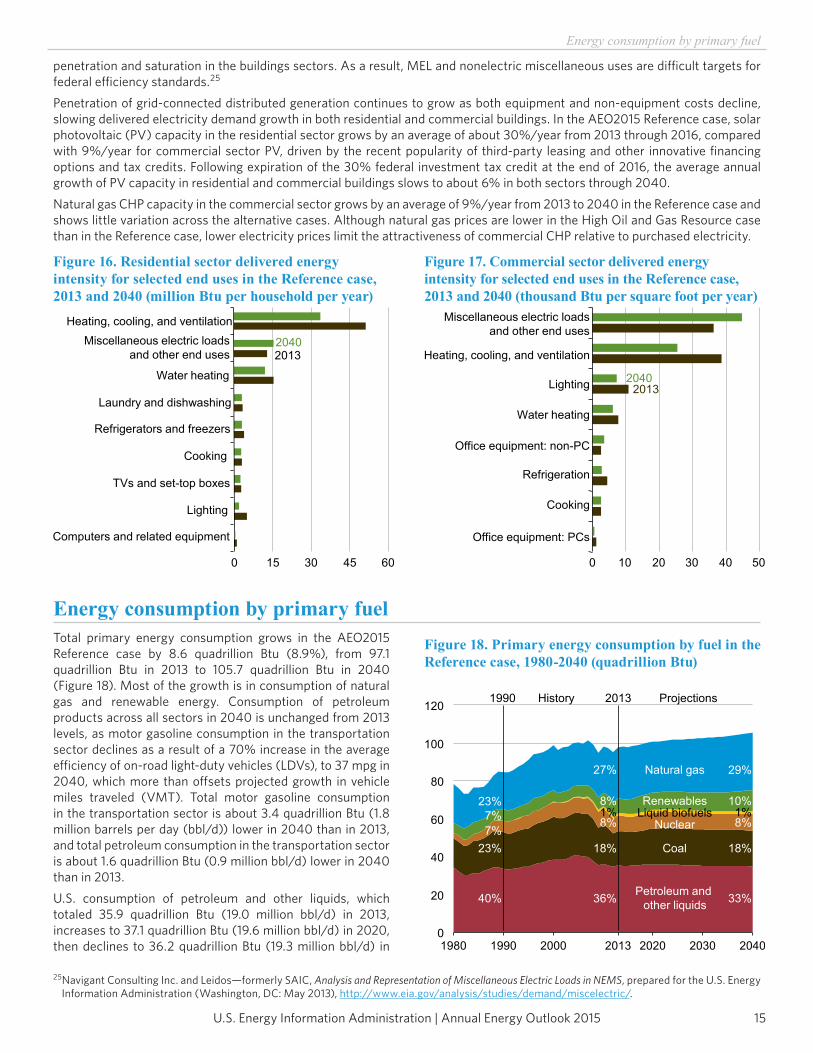
U.S. Energy Information Administration | Annual Energy Outlook 2015 15
Energy consumption by primary fuel
penetration and saturation in the buildings sectors. As a result, MEL and nonelectric miscellaneous uses are difficult targets for federal efficiency standards.25
Penetration of grid-connected distributed generation continues to grow as both equipment and non-equipment costs decline, slowing delivered electricity demand growth in both residential and commercial buildings. In the AEO2015 Reference case, solar photovoltaic (PV) capacity in the residential sector grows by an average of about 30%/year from 2013 through 2016, compared with 9%/year for commercial sector PV, driven by the recent popularity of third-party leasing and other innovative financing options and tax credits. Following expiration of the 30% federal investment tax credit at the end of 2016, the average annual growth of PV capacity in residential and commercial buildings slows to about 6% in both sectors through 2040.Natural gas CHP capacity in the commercial sector grows by an average of 9%/year from 2013 to 2040 in the Reference case and shows little variation across the alternative cases. Although natural gas prices are lower in the High Oil and Gas Resource case than in the Reference case, lower electricity prices limit the attractiveness of commercial CHP relative to purchased electricity.
Energy consumption by primary fuelTotal primary energy consumption grows in the AEO2015 Reference case by 8.6 quadrillion Btu (8.9%), from 97.1 quadrillion Btu in 2013 to 105.7 quadrillion Btu in 2040 (Figure 18). Most of the growth is in consumption of natural gas and renewable energy. Consumption of petroleum products across all sectors in 2040 is unchanged from 2013 levels, as motor gasoline consumption in the transportation sector declines as a result of a 70% increase in the average efficiency of on-road light-duty vehicles (LDVs), to 37 mpg in 2040, which more than offsets projected growth in vehicle miles traveled (VMT). Total motor gasoline consumption in the transportation sector is about 3.4 quadrillion Btu (1.8 million barrels per day (bbl/d)) lower in 2040 than in 2013, and total petroleum consumption in the transportation sector is about 1.6 quadrillion Btu (0.9 million bbl/d) lower in 2040 than in 2013.U.S. consumption of petroleum and other liquids, which totaled 35.9 quadrillion Btu (19.0 million bbl/d) in 2013, increases to 37.1 quadrillion Btu (19.6 million bbl/d) in 2020, then declines to 36.2 quadrillion Btu (19.3 million bbl/d) in
25 Navigant Consulting Inc. and Leidos—formerly SAIC, Analysis and Representation of Miscellaneous Electric Loads in NEMS, prepared for the U.S. Energy Information Administration (Washington, DC: May 2013), http://www.eia.gov/analysis/studies/demand/miscelectric/.
0 15 30 45 60
Computers and related equipment
Lighting
TVs and set-top boxes
Cooking
Refrigerators and freezers
Laundry and dishwashing
Water heating
Miscellaneous electric loadsand other end uses
Heating, cooling, and ventilation
20402013
Figure 16. Residential sector delivered energy intensity for selected end uses in the Reference case, 2013 and 2040 (million Btu per household per year)
Cooking
Office equipment: non-PC
Office equipment: PCs
Refrigeration
Water heating
Lighting
Miscellaneous electric loadsand other end uses
Heating, cooling, and ventilation
0 10 20 30 40 50
20132040
Figure 17. Commercial sector delivered energy intensity for selected end uses in the Reference case, 2013 and 2040 (thousand Btu per square foot per year)
0
20
40
60
80
100
120
1980 1990 2000 2013 2020 2030 2040
2013 ProjectionsHistory
Natural gas
RenewablesLiquid biofuels
Nuclear
Coal
Petroleum and other liquids
27%
8%
18%
8%1%
36%
29%
10%
18%
8%1%
33%
1990
23%
7%23%
7%
40%
Figure 18. Primary energy consumption by fuel in the Reference case, 1980-2040 (quadrillion Btu)
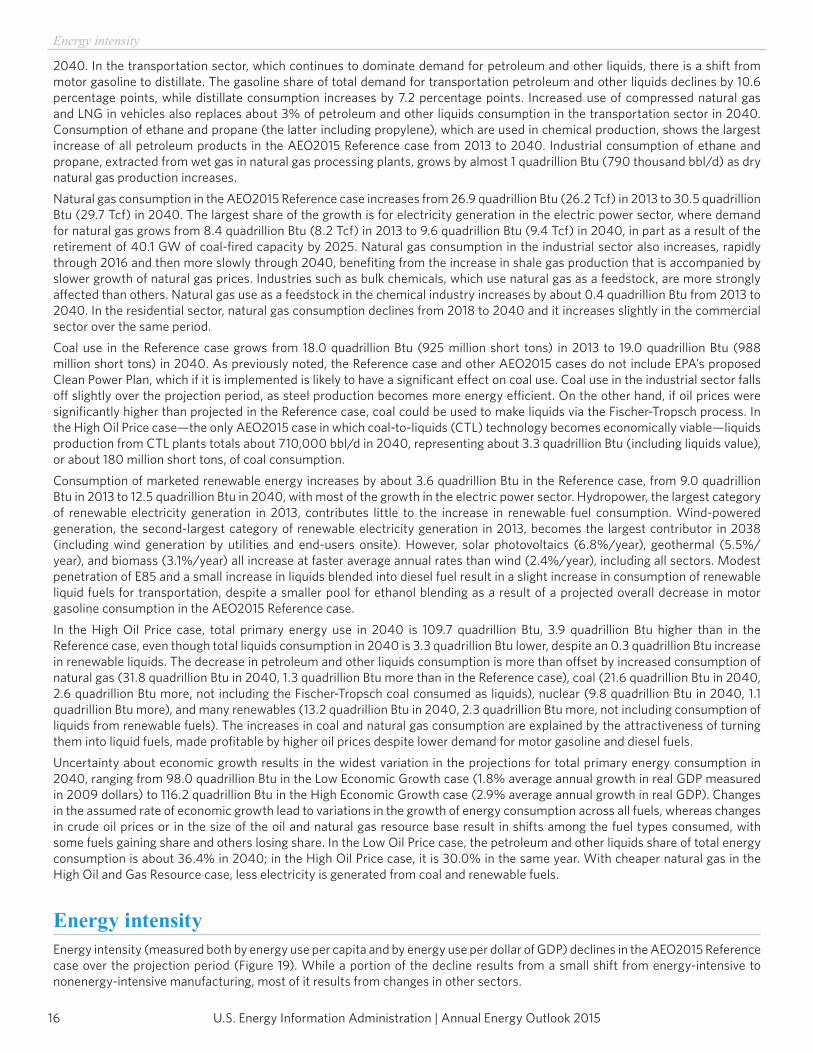
U.S. Energy Information Administration | Annual Energy Outlook 201516
Energy intensity
2040. In the transportation sector, which continues to dominate demand for petroleum and other liquids, there is a shift from motor gasoline to distillate. The gasoline share of total demand for transportation petroleum and other liquids declines by 10.6 percentage points, while distillate consumption increases by 7.2 percentage points. Increased use of compressed natural gas and LNG in vehicles also replaces about 3% of petroleum and other liquids consumption in the transportation sector in 2040. Consumption of ethane and propane (the latter including propylene), which are used in chemical production, shows the largest increase of all petroleum products in the AEO2015 Reference case from 2013 to 2040. Industrial consumption of ethane and propane, extracted from wet gas in natural gas processing plants, grows by almost 1 quadrillion Btu (790 thousand bbl/d) as dry natural gas production increases.Natural gas consumption in the AEO2015 Reference case increases from 26.9 quadrillion Btu (26.2 Tcf) in 2013 to 30.5 quadrillion Btu (29.7 Tcf) in 2040. The largest share of the growth is for electricity generation in the electric power sector, where demand for natural gas grows from 8.4 quadrillion Btu (8.2 Tcf) in 2013 to 9.6 quadrillion Btu (9.4 Tcf) in 2040, in part as a result of the retirement of 40.1 GW of coal-fired capacity by 2025. Natural gas consumption in the industrial sector also increases, rapidly through 2016 and then more slowly through 2040, benefiting from the increase in shale gas production that is accompanied by slower growth of natural gas prices. Industries such as bulk chemicals, which use natural gas as a feedstock, are more strongly affected than others. Natural gas use as a feedstock in the chemical industry increases by about 0.4 quadrillion Btu from 2013 to 2040. In the residential sector, natural gas consumption declines from 2018 to 2040 and it increases slightly in the commercial sector over the same period.Coal use in the Reference case grows from 18.0 quadrillion Btu (925 million short tons) in 2013 to 19.0 quadrillion Btu (988 million short tons) in 2040. As previously noted, the Reference case and other AEO2015 cases do not include EPA’s proposed Clean Power Plan, which if it is implemented is likely to have a significant effect on coal use. Coal use in the industrial sector falls off slightly over the projection period, as steel production becomes more energy efficient. On the other hand, if oil prices were significantly higher than projected in the Reference case, coal could be used to make liquids via the Fischer-Tropsch process. In the High Oil Price case—the only AEO2015 case in which coal-to-liquids (CTL) technology becomes economically viable—liquids production from CTL plants totals about 710,000 bbl/d in 2040, representing about 3.3 quadrillion Btu (including liquids value), or about 180 million short tons, of coal consumption.Consumption of marketed renewable energy increases by about 3.6 quadrillion Btu in the Reference case, from 9.0 quadrillion Btu in 2013 to 12.5 quadrillion Btu in 2040, with most of the growth in the electric power sector. Hydropower, the largest category of renewable electricity generation in 2013, contributes little to the increase in renewable fuel consumption. Wind-powered generation, the second-largest category of renewable electricity generation in 2013, becomes the largest contributor in 2038 (including wind generation by utilities and end-users onsite). However, solar photovoltaics (6.8%/year), geothermal (5.5%/year), and biomass (3.1%/year) all increase at faster average annual rates than wind (2.4%/year), including all sectors. Modest penetration of E85 and a small increase in liquids blended into diesel fuel result in a slight increase in consumption of renewable liquid fuels for transportation, despite a smaller pool for ethanol blending as a result of a projected overall decrease in motor gasoline consumption in the AEO2015 Reference case.In the High Oil Price case, total primary energy use in 2040 is 109.7 quadrillion Btu, 3.9 quadrillion Btu higher than in the Reference case, even though total liquids consumption in 2040 is 3.3 quadrillion Btu lower, despite an 0.3 quadrillion Btu increase in renewable liquids. The decrease in petroleum and other liquids consumption is more than offset by increased consumption of natural gas (31.8 quadrillion Btu in 2040, 1.3 quadrillion Btu more than in the Reference case), coal (21.6 quadrillion Btu in 2040, 2.6 quadrillion Btu more, not including the Fischer-Tropsch coal consumed as liquids), nuclear (9.8 quadrillion Btu in 2040, 1.1 quadrillion Btu more), and many renewables (13.2 quadrillion Btu in 2040, 2.3 quadrillion Btu more, not including consumption of liquids from renewable fuels). The increases in coal and natural gas consumption are explained by the attractiveness of turning them into liquid fuels, made profitable by higher oil prices despite lower demand for motor gasoline and diesel fuels.Uncertainty about economic growth results in the widest variation in the projections for total primary energy consumption in 2040, ranging from 98.0 quadrillion Btu in the Low Economic Growth case (1.8% average annual growth in real GDP measured in 2009 dollars) to 116.2 quadrillion Btu in the High Economic Growth case (2.9% average annual growth in real GDP). Changes in the assumed rate of economic growth lead to variations in the growth of energy consumption across all fuels, whereas changes in crude oil prices or in the size of the oil and natural gas resource base result in shifts among the fuel types consumed, with some fuels gaining share and others losing share. In the Low Oil Price case, the petroleum and other liquids share of total energy consumption is about 36.4% in 2040; in the High Oil Price case, it is 30.0% in the same year. With cheaper natural gas in the High Oil and Gas Resource case, less electricity is generated from coal and renewable fuels.
Energy intensityEnergy intensity (measured both by energy use per capita and by energy use per dollar of GDP) declines in the AEO2015 Reference case over the projection period (Figure 19). While a portion of the decline results from a small shift from energy-intensive to nonenergy-intensive manufacturing, most of it results from changes in other sectors.
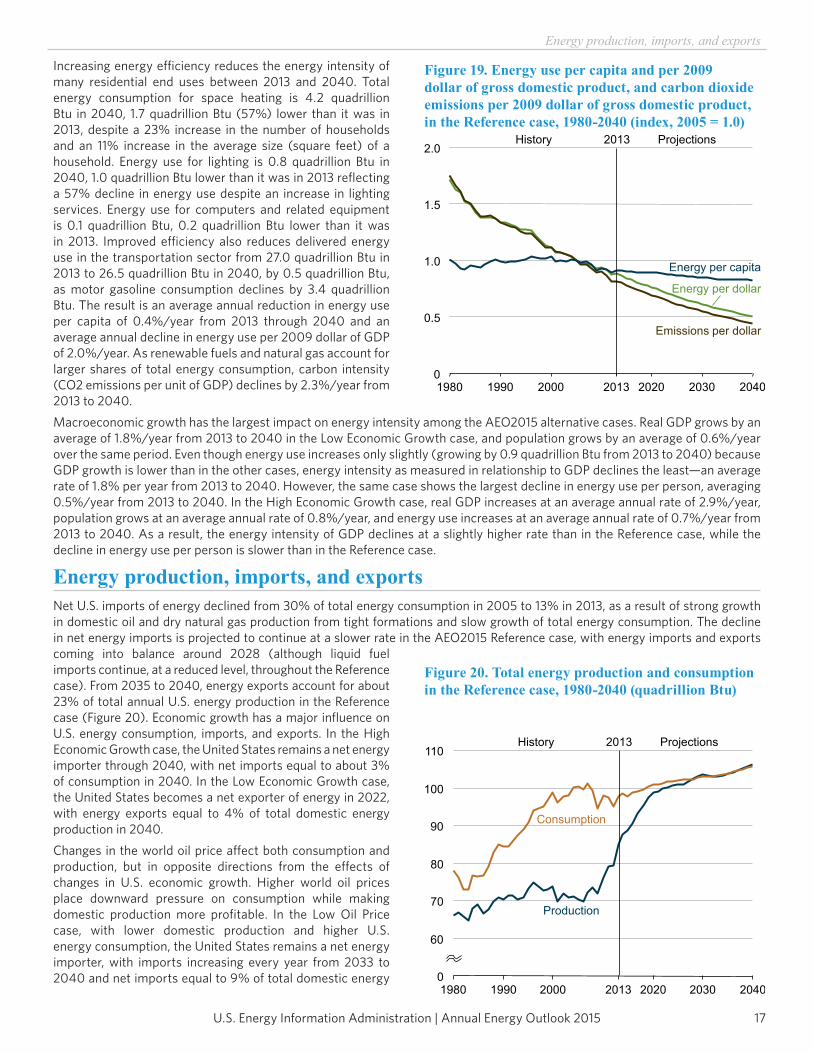
U.S. Energy Information Administration | Annual Energy Outlook 2015 17
Energy production, imports, and exports
Increasing energy efficiency reduces the energy intensity of many residential end uses between 2013 and 2040. Total energy consumption for space heating is 4.2 quadrillion Btu in 2040, 1.7 quadrillion Btu (57%) lower than it was in 2013, despite a 23% increase in the number of households and an 11% increase in the average size (square feet) of a household. Energy use for lighting is 0.8 quadrillion Btu in 2040, 1.0 quadrillion Btu lower than it was in 2013 reflecting a 57% decline in energy use despite an increase in lighting services. Energy use for computers and related equipment is 0.1 quadrillion Btu, 0.2 quadrillion Btu lower than it was in 2013. Improved efficiency also reduces delivered energy use in the transportation sector from 27.0 quadrillion Btu in 2013 to 26.5 quadrillion Btu in 2040, by 0.5 quadrillion Btu, as motor gasoline consumption declines by 3.4 quadrillion Btu. The result is an average annual reduction in energy use per capita of 0.4%/year from 2013 through 2040 and an average annual decline in energy use per 2009 dollar of GDP of 2.0%/year. As renewable fuels and natural gas account for larger shares of total energy consumption, carbon intensity (CO2 emissions per unit of GDP) declines by 2.3%/year from 2013 to 2040.Macroeconomic growth has the largest impact on energy intensity among the AEO2015 alternative cases. Real GDP grows by an average of 1.8%/year from 2013 to 2040 in the Low Economic Growth case, and population grows by an average of 0.6%/year over the same period. Even though energy use increases only slightly (growing by 0.9 quadrillion Btu from 2013 to 2040) because GDP growth is lower than in the other cases, energy intensity as measured in relationship to GDP declines the least—an average rate of 1.8% per year from 2013 to 2040. However, the same case shows the largest decline in energy use per person, averaging 0.5%/year from 2013 to 2040. In the High Economic Growth case, real GDP increases at an average annual rate of 2.9%/year, population grows at an average annual rate of 0.8%/year, and energy use increases at an average annual rate of 0.7%/year from 2013 to 2040. As a result, the energy intensity of GDP declines at a slightly higher rate than in the Reference case, while the decline in energy use per person is slower than in the Reference case.
Energy production, imports, and exportsNet U.S. imports of energy declined from 30% of total energy consumption in 2005 to 13% in 2013, as a result of strong growth in domestic oil and dry natural gas production from tight formations and slow growth of total energy consumption. The decline in net energy imports is projected to continue at a slower rate in the AEO2015 Reference case, with energy imports and exports coming into balance around 2028 (although liquid fuel imports continue, at a reduced level, throughout the Reference case). From 2035 to 2040, energy exports account for about 23% of total annual U.S. energy production in the Reference case (Figure 20). Economic growth has a major influence on U.S. energy consumption, imports, and exports. In the High Economic Growth case, the United States remains a net energy importer through 2040, with net imports equal to about 3% of consumption in 2040. In the Low Economic Growth case, the United States becomes a net exporter of energy in 2022, with energy exports equal to 4% of total domestic energy production in 2040.Changes in the world oil price affect both consumption and production, but in opposite directions from the effects of changes in U.S. economic growth. Higher world oil prices place downward pressure on consumption while making domestic production more profitable. In the Low Oil Price case, with lower domestic production and higher U.S. energy consumption, the United States remains a net energy importer, with imports increasing every year from 2033 to 2040 and net imports equal to 9% of total domestic energy
0
0.5
1.0
1.5
2.0
1980 1990 2000 2013 2020 2030 2040
2013 ProjectionsHistory
Energy per dollar
Energy per capita
Emissions per dollar
Figure 19. Energy use per capita and per 2009 dollar of gross domestic product, and carbon dioxide emissions per 2009 dollar of gross domestic product, in the Reference case, 1980-2040 (index, 2005 = 1.0)
0
60
70
80
90
100
110
1980 1990 2000 2013 2020 2030 2040
2013 ProjectionsHistory
Consumption
Production
Figure 20. Total energy production and consumption in the Reference case, 1980-2040 (quadrillion Btu)
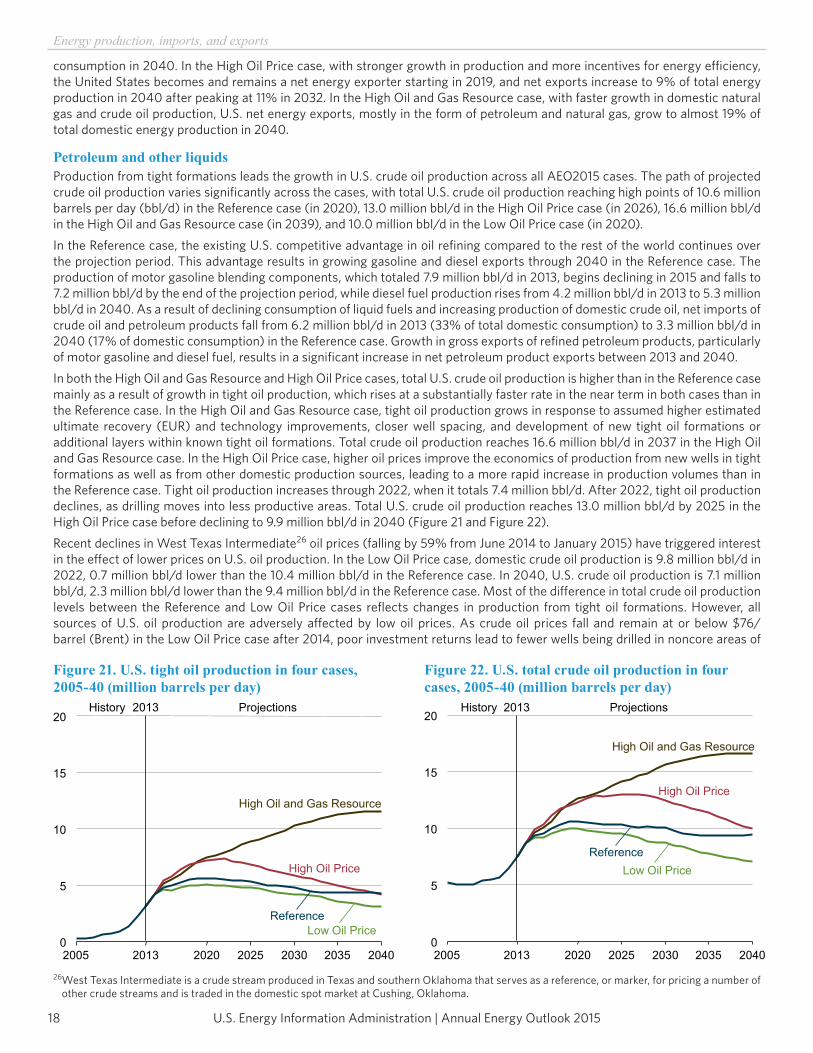
U.S. Energy Information Administration | Annual Energy Outlook 201518
Energy production, imports, and exports
consumption in 2040. In the High Oil Price case, with stronger growth in production and more incentives for energy efficiency, the United States becomes and remains a net energy exporter starting in 2019, and net exports increase to 9% of total energy production in 2040 after peaking at 11% in 2032. In the High Oil and Gas Resource case, with faster growth in domestic natural gas and crude oil production, U.S. net energy exports, mostly in the form of petroleum and natural gas, grow to almost 19% of total domestic energy production in 2040.
Petroleum and other liquidsProduction from tight formations leads the growth in U.S. crude oil production across all AEO2015 cases. The path of projected crude oil production varies significantly across the cases, with total U.S. crude oil production reaching high points of 10.6 million barrels per day (bbl/d) in the Reference case (in 2020), 13.0 million bbl/d in the High Oil Price case (in 2026), 16.6 million bbl/d in the High Oil and Gas Resource case (in 2039), and 10.0 million bbl/d in the Low Oil Price case (in 2020).In the Reference case, the existing U.S. competitive advantage in oil refining compared to the rest of the world continues over the projection period. This advantage results in growing gasoline and diesel exports through 2040 in the Reference case. The production of motor gasoline blending components, which totaled 7.9 million bbl/d in 2013, begins declining in 2015 and falls to 7.2 million bbl/d by the end of the projection period, while diesel fuel production rises from 4.2 million bbl/d in 2013 to 5.3 million bbl/d in 2040. As a result of declining consumption of liquid fuels and increasing production of domestic crude oil, net imports of crude oil and petroleum products fall from 6.2 million bbl/d in 2013 (33% of total domestic consumption) to 3.3 million bbl/d in 2040 (17% of domestic consumption) in the Reference case. Growth in gross exports of refined petroleum products, particularly of motor gasoline and diesel fuel, results in a significant increase in net petroleum product exports between 2013 and 2040.In both the High Oil and Gas Resource and High Oil Price cases, total U.S. crude oil production is higher than in the Reference case mainly as a result of growth in tight oil production, which rises at a substantially faster rate in the near term in both cases than in the Reference case. In the High Oil and Gas Resource case, tight oil production grows in response to assumed higher estimated ultimate recovery (EUR) and technology improvements, closer well spacing, and development of new tight oil formations or additional layers within known tight oil formations. Total crude oil production reaches 16.6 million bbl/d in 2037 in the High Oil and Gas Resource case. In the High Oil Price case, higher oil prices improve the economics of production from new wells in tight formations as well as from other domestic production sources, leading to a more rapid increase in production volumes than in the Reference case. Tight oil production increases through 2022, when it totals 7.4 million bbl/d. After 2022, tight oil production declines, as drilling moves into less productive areas. Total U.S. crude oil production reaches 13.0 million bbl/d by 2025 in the High Oil Price case before declining to 9.9 million bbl/d in 2040 (Figure 21 and Figure 22).Recent declines in West Texas Intermediate26 oil prices (falling by 59% from June 2014 to January 2015) have triggered interest in the effect of lower prices on U.S. oil production. In the Low Oil Price case, domestic crude oil production is 9.8 million bbl/d in 2022, 0.7 million bbl/d lower than the 10.4 million bbl/d in the Reference case. In 2040, U.S. crude oil production is 7.1 million bbl/d, 2.3 million bbl/d lower than the 9.4 million bbl/d in the Reference case. Most of the difference in total crude oil production levels between the Reference and Low Oil Price cases reflects changes in production from tight oil formations. However, all sources of U.S. oil production are adversely affected by low oil prices. As crude oil prices fall and remain at or below $76/barrel (Brent) in the Low Oil Price case after 2014, poor investment returns lead to fewer wells being drilled in noncore areas of
26 West Texas Intermediate is a crude stream produced in Texas and southern Oklahoma that serves as a reference, or marker, for pricing a number of other crude streams and is traded in the domestic spot market at Cushing, Oklahoma.
0
5
10
15
20
2005 2013 2020 2025 2030 2035 2040
2013 ProjectionsHistory
Low Oil PriceReference
High Oil and Gas Resource
High Oil Price
Figure 21. U.S. tight oil production in four cases, 2005-40 (million barrels per day)
0
5
10
15
20
2005 2013 2020 2025 2030 2035 2040
2013 ProjectionsHistory
Low Oil PriceReference
High Oil and Gas Resource
High Oil Price
Figure 22. U.S. total crude oil production in four cases, 2005-40 (million barrels per day)
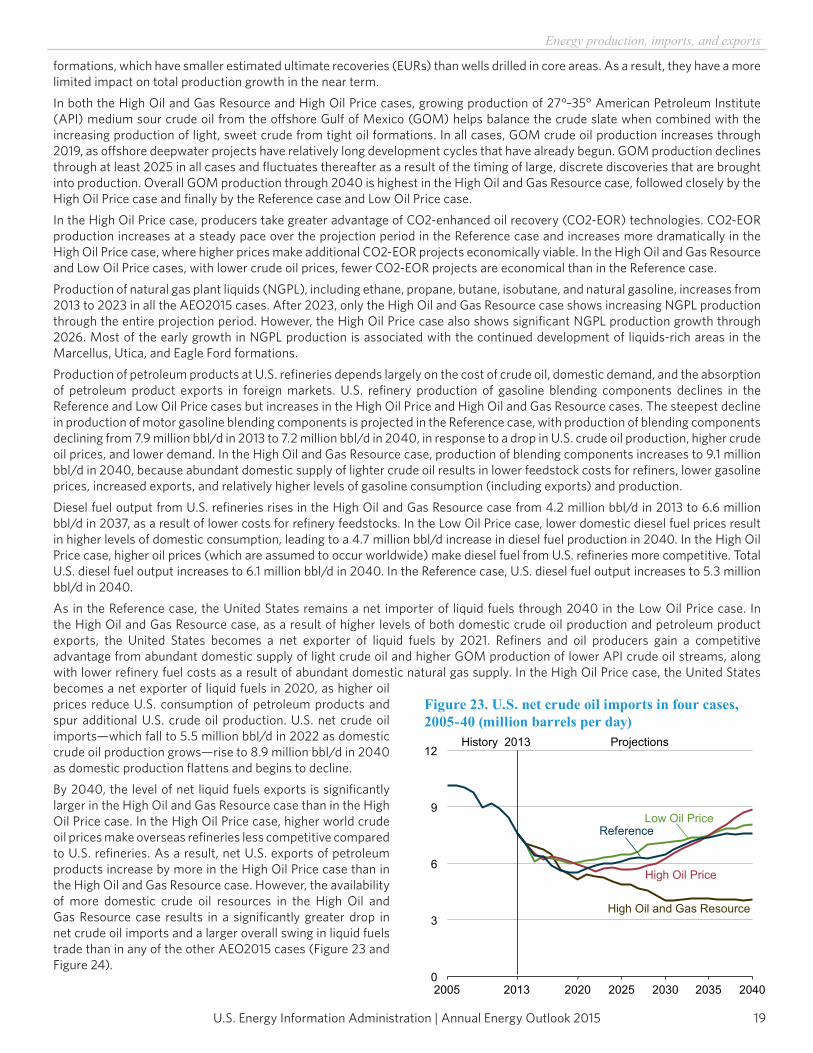
U.S. Energy Information Administration | Annual Energy Outlook 2015 19
Energy production, imports, and exports
formations, which have smaller estimated ultimate recoveries (EURs) than wells drilled in core areas. As a result, they have a more limited impact on total production growth in the near term.In both the High Oil and Gas Resource and High Oil Price cases, growing production of 27°–35° American Petroleum Institute (API) medium sour crude oil from the offshore Gulf of Mexico (GOM) helps balance the crude slate when combined with the increasing production of light, sweet crude from tight oil formations. In all cases, GOM crude oil production increases through 2019, as offshore deepwater projects have relatively long development cycles that have already begun. GOM production declines through at least 2025 in all cases and fluctuates thereafter as a result of the timing of large, discrete discoveries that are brought into production. Overall GOM production through 2040 is highest in the High Oil and Gas Resource case, followed closely by the High Oil Price case and finally by the Reference case and Low Oil Price case.In the High Oil Price case, producers take greater advantage of CO2-enhanced oil recovery (CO2-EOR) technologies. CO2-EOR production increases at a steady pace over the projection period in the Reference case and increases more dramatically in the High Oil Price case, where higher prices make additional CO2-EOR projects economically viable. In the High Oil and Gas Resource and Low Oil Price cases, with lower crude oil prices, fewer CO2-EOR projects are economical than in the Reference case.Production of natural gas plant liquids (NGPL), including ethane, propane, butane, isobutane, and natural gasoline, increases from 2013 to 2023 in all the AEO2015 cases. After 2023, only the High Oil and Gas Resource case shows increasing NGPL production through the entire projection period. However, the High Oil Price case also shows significant NGPL production growth through 2026. Most of the early growth in NGPL production is associated with the continued development of liquids-rich areas in the Marcellus, Utica, and Eagle Ford formations.Production of petroleum products at U.S. refineries depends largely on the cost of crude oil, domestic demand, and the absorption of petroleum product exports in foreign markets. U.S. refinery production of gasoline blending components declines in the Reference and Low Oil Price cases but increases in the High Oil Price and High Oil and Gas Resource cases. The steepest decline in production of motor gasoline blending components is projected in the Reference case, with production of blending components declining from 7.9 million bbl/d in 2013 to 7.2 million bbl/d in 2040, in response to a drop in U.S. crude oil production, higher crude oil prices, and lower demand. In the High Oil and Gas Resource case, production of blending components increases to 9.1 million bbl/d in 2040, because abundant domestic supply of lighter crude oil results in lower feedstock costs for refiners, lower gasoline prices, increased exports, and relatively higher levels of gasoline consumption (including exports) and production.Diesel fuel output from U.S. refineries rises in the High Oil and Gas Resource case from 4.2 million bbl/d in 2013 to 6.6 million bbl/d in 2037, as a result of lower costs for refinery feedstocks. In the Low Oil Price case, lower domestic diesel fuel prices result in higher levels of domestic consumption, leading to a 4.7 million bbl/d increase in diesel fuel production in 2040. In the High Oil Price case, higher oil prices (which are assumed to occur worldwide) make diesel fuel from U.S. refineries more competitive. Total U.S. diesel fuel output increases to 6.1 million bbl/d in 2040. In the Reference case, U.S. diesel fuel output increases to 5.3 million bbl/d in 2040.As in the Reference case, the United States remains a net importer of liquid fuels through 2040 in the Low Oil Price case. In the High Oil and Gas Resource case, as a result of higher levels of both domestic crude oil production and petroleum product exports, the United States becomes a net exporter of liquid fuels by 2021. Refiners and oil producers gain a competitive advantage from abundant domestic supply of light crude oil and higher GOM production of lower API crude oil streams, along with lower refinery fuel costs as a result of abundant domestic natural gas supply. In the High Oil Price case, the United States becomes a net exporter of liquid fuels in 2020, as higher oil prices reduce U.S. consumption of petroleum products and spur additional U.S. crude oil production. U.S. net crude oil imports—which fall to 5.5 million bbl/d in 2022 as domestic crude oil production grows—rise to 8.9 million bbl/d in 2040 as domestic production flattens and begins to decline.By 2040, the level of net liquid fuels exports is significantly larger in the High Oil and Gas Resource case than in the High Oil Price case. In the High Oil Price case, higher world crude oil prices make overseas refineries less competitive compared to U.S. refineries. As a result, net U.S. exports of petroleum products increase by more in the High Oil Price case than in the High Oil and Gas Resource case. However, the availability of more domestic crude oil resources in the High Oil and Gas Resource case results in a significantly greater drop in net crude oil imports and a larger overall swing in liquid fuels trade than in any of the other AEO2015 cases (Figure 23 and Figure 24).
0
3
6
9
12
2005 2013 2020 2025 2030 2035 2040
2013 ProjectionsHistory
Low Oil PriceReference
High Oil and Gas Resource
High Oil Price
Figure 23. U.S. net crude oil imports in four cases, 2005-40 (million barrels per day)
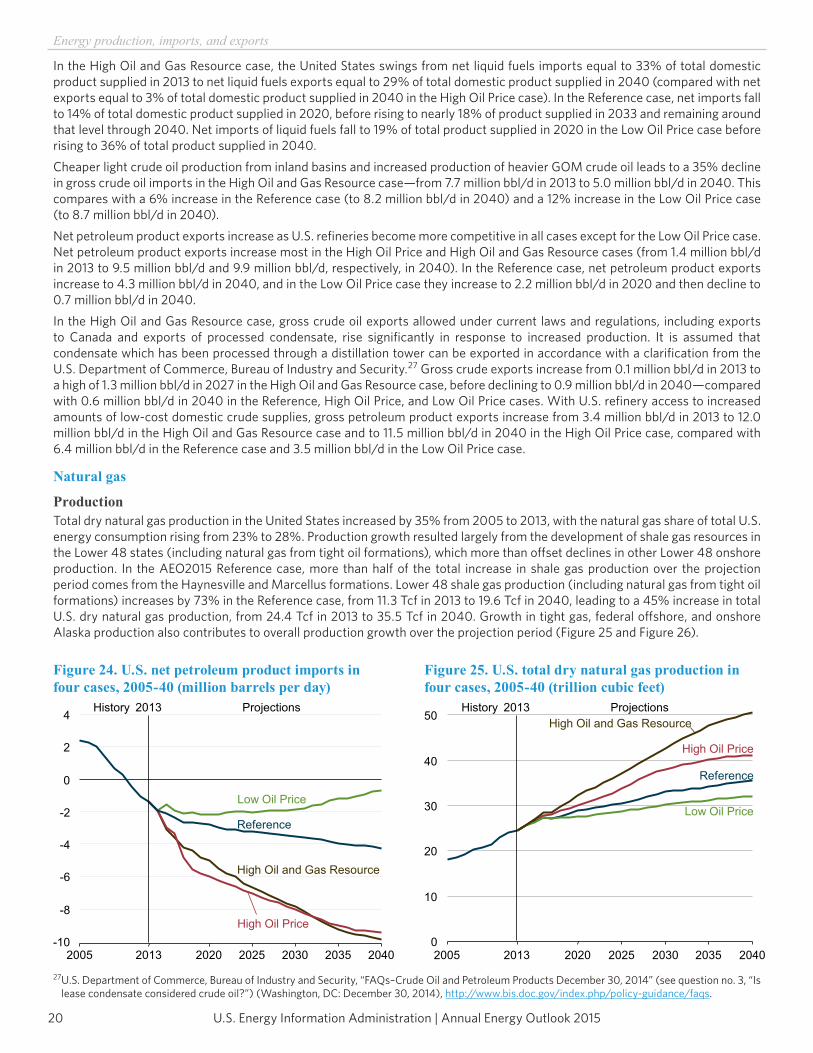
U.S. Energy Information Administration | Annual Energy Outlook 201520
Energy production, imports, and exports
In the High Oil and Gas Resource case, the United States swings from net liquid fuels imports equal to 33% of total domestic product supplied in 2013 to net liquid fuels exports equal to 29% of total domestic product supplied in 2040 (compared with net exports equal to 3% of total domestic product supplied in 2040 in the High Oil Price case). In the Reference case, net imports fall to 14% of total domestic product supplied in 2020, before rising to nearly 18% of product supplied in 2033 and remaining around that level through 2040. Net imports of liquid fuels fall to 19% of total product supplied in 2020 in the Low Oil Price case before rising to 36% of total product supplied in 2040.Cheaper light crude oil production from inland basins and increased production of heavier GOM crude oil leads to a 35% decline in gross crude oil imports in the High Oil and Gas Resource case—from 7.7 million bbl/d in 2013 to 5.0 million bbl/d in 2040. This compares with a 6% increase in the Reference case (to 8.2 million bbl/d in 2040) and a 12% increase in the Low Oil Price case (to 8.7 million bbl/d in 2040).Net petroleum product exports increase as U.S. refineries become more competitive in all cases except for the Low Oil Price case. Net petroleum product exports increase most in the High Oil Price and High Oil and Gas Resource cases (from 1.4 million bbl/d in 2013 to 9.5 million bbl/d and 9.9 million bbl/d, respectively, in 2040). In the Reference case, net petroleum product exports increase to 4.3 million bbl/d in 2040, and in the Low Oil Price case they increase to 2.2 million bbl/d in 2020 and then decline to 0.7 million bbl/d in 2040.In the High Oil and Gas Resource case, gross crude oil exports allowed under current laws and regulations, including exports to Canada and exports of processed condensate, rise significantly in response to increased production. It is assumed that condensate which has been processed through a distillation tower can be exported in accordance with a clarification from the U.S. Department of Commerce, Bureau of Industry and Security.27 Gross crude exports increase from 0.1 million bbl/d in 2013 to a high of 1.3 million bbl/d in 2027 in the High Oil and Gas Resource case, before declining to 0.9 million bbl/d in 2040—compared with 0.6 million bbl/d in 2040 in the Reference, High Oil Price, and Low Oil Price cases. With U.S. refinery access to increased amounts of low-cost domestic crude supplies, gross petroleum product exports increase from 3.4 million bbl/d in 2013 to 12.0 million bbl/d in the High Oil and Gas Resource case and to 11.5 million bbl/d in 2040 in the High Oil Price case, compared with 6.4 million bbl/d in the Reference case and 3.5 million bbl/d in the Low Oil Price case.
Natural gas
ProductionTotal dry natural gas production in the United States increased by 35% from 2005 to 2013, with the natural gas share of total U.S. energy consumption rising from 23% to 28%. Production growth resulted largely from the development of shale gas resources in the Lower 48 states (including natural gas from tight oil formations), which more than offset declines in other Lower 48 onshore production. In the AEO2015 Reference case, more than half of the total increase in shale gas production over the projection period comes from the Haynesville and Marcellus formations. Lower 48 shale gas production (including natural gas from tight oil formations) increases by 73% in the Reference case, from 11.3 Tcf in 2013 to 19.6 Tcf in 2040, leading to a 45% increase in total U.S. dry natural gas production, from 24.4 Tcf in 2013 to 35.5 Tcf in 2040. Growth in tight gas, federal offshore, and onshore Alaska production also contributes to overall production growth over the projection period (Figure 25 and Figure 26).
27 U.S. Department of Commerce, Bureau of Industry and Security, “FAQs–Crude Oil and Petroleum Products December 30, 2014” (see question no. 3, “Is lease condensate considered crude oil?”) (Washington, DC: December 30, 2014), http://www.bis.doc.gov/index.php/policy-guidance/faqs.
0
10
20
30
40
50
2005 2013 2020 2025 2030 2035 2040
2013 ProjectionsHistory
Low Oil Price
Reference
High Oil and Gas Resource
High Oil Price
Figure 25. U.S. total dry natural gas production in four cases, 2005-40 (trillion cubic feet)
-10
-8
-6
-4
-2
0
2
4
2005 2013 2020 2025 2030 2035 2040
2013 ProjectionsHistory
Low Oil Price
Reference
High Oil Price
High Oil and Gas Resource
Figure 24. U.S. net petroleum product imports in four cases, 2005-40 (million barrels per day)

U.S. Energy Information Administration | Annual Energy Outlook 2015 21
Energy production, imports, and exports
Future dry natural gas production depends primarily on the size and cost of tight and shale gas resources, technology improvements, domestic natural gas demand, and the relative price of oil. Projections in the High Oil and Gas Resource case assume closer well spacing; higher EURs per shale gas well, tight gas well, and tight oil well; development of new tight oil formations either from new discoveries or additional layers within known tight oil formations; and additional long-term technology improvements that further increase the EUR per tight gas and shale gas well over the projection period above those in the Reference case. Even with lower prices, total U.S. dry natural gas production increases in the High Oil and Gas Resource case to 50.6 Tcf in 2040, 43% above the Reference case level, with Lower 48 shale gas production of 34.6 Tcf in 2040, or 77% above the Reference case level.The High and Low Oil Price cases use the same natural gas resource assumptions as the Reference case, but production levels vary in response to natural gas demand, primarily from the transportation sector and global demand for U.S.-origin LNG. In the High Oil Price case, increased demand for natural gas as a fuel for motor vehicles, as LNG for export, and as plant fuel for natural gas liquefaction facilities accounts for the increase in total domestic dry natural gas production to 41.1 Tcf in 2040 (16% above the Reference case). U.S. shale gas production in the High Oil Price case totals 23.6 Tcf in 2040, 21% above the Reference case total. In the Low Oil Price case, with lower demand for natural gas and LNG exports, U.S. dry natural gas production totals 31.9 Tcf in 2040 (10% below the Reference case total), and U.S. shale gas production totals 18.1 Tcf in 2040 (8% below the Reference case).Tight gas accounts for a smaller, but still significant, portion of the increase in U.S. dry natural gas production compared to shale gas. Tight gas production responds largely to crude oil prices and the same levels of technological progress experienced with shale gas production. Tight gas production increases from 4.4 Tcf in 2013 to 7.0 Tcf in 2040 in the Reference case, compared with 8.1 Tcf in 2040 in the High Oil and Gas Resource case, 8.4 Tcf in the High Oil Price case, and 6.6 Tcf in the Low Oil Price case. Most of the tight gas production growth occurs in the Gulf Coast and Dakotas/Rocky Mountains regions. Tight gas production in the Midcontinent region—which declines in the Reference case—increases by 24% from 2013 to 2040 in the High Oil and Gas Resource case.Undiscovered crude oil and natural gas resources in the federal offshore and Alaska regions are assumed to be 50% higher in the High Oil and Gas Resource case than in the Reference case. Lower 48 offshore natural gas production increases from 1.5 Tcf in 2013 to 3.0 Tcf in 2040 in the High Oil and Gas Resource case, and to 2.8 Tcf in 2040 in both the High Oil Price and Reference cases. Cumulative federal offshore natural gas production is highest in the High Oil Price case, with federal offshore natural gas production increasing more than in any of the other AEO2015 cases through 2036, before declining. Alaska dry natural gas production begins increasing in 2026 in the High Oil Price case, and in 2027 in the Reference case. Alaska dry natural gas production reaches 1.2 Tcf in 2029 and remains at that level through 2040 in the High Oil Price case. Alaskan production reaches 1.1 Tcf in 2040 in the Reference case, following the projected completion of a new LNG export facility in Alaska. In the Low Oil Price and High Oil and Gas Resource cases, lower international natural gas prices make LNG exports from Alaska uneconomical, and Alaska dry natural gas production falls through 2040 as declines in oil production result in decreased use of natural gas for drilling operations.
Imports and exportsIn all the AEO2015 cases, net natural gas imports continue to decline through 2040, as they have since 2007. Gross exports of natural gas increase over the period, and gross imports decline. The rate of decline in net imports varies across the cases—depending on assumptions about changes in world oil prices and U.S. natural gas resources—and slows in the later years of the projections (Figure 27). In all the cases, the United States becomes a net exporter of natural gas in 2017, driven by LNG exports (Figure 28), increased pipeline exports to Mexico, and reduced imports from Canada.
-15
-10
-5
0
5
2005 2013 2020 2025 2030 2035 2040
2013 ProjectionsHistory
Low Oil Price
Reference
High Oil and Gas Resource
High Oil Price
Figure 27. U.S. total natural gas net imports in four cases, 2005-40 (trillion cubic feet)
0
10
20
30
40
50
2005 2013 2020 2025 2030 2035 2040
2013 ProjectionsHistory
Low Oil Price
Reference
High Oil and Gas Resource
High Oil Price
Figure 26. U.S. shale gas production in four cases, 2005-40 (trillion cubic feet)

U.S. Energy Information Administration | Annual Energy Outlook 201522
Energy production, imports, and exports
In the Reference case, net exports of natural gas from the United States total 5.6 Tcf in 2040. Most of the growth in U.S. net natural gas exports occurs before 2030, when gross liquefied natural gas (LNG) exports reach their highest level of 3.4 Tcf, where they remain through 2040. In all the cases, the United States remains a net pipeline importer of natural gas from Canada through 2040, but at lower levels than in recent history, while net pipeline exports of natural gas to Mexico grow from 0.7 Tcf in 2013 to 3.0 Tcf in 2040 in the Reference case.The price of LNG supplied to international markets, which in part reflects world oil prices, is significantly higher than the price of U.S. domestic natural gas supply, particularly in the near term. The growth in U.S. LNG exports is driven by this price difference, which also discourages U.S. LNG imports. LNG export growth after 2020 is highest in the High Oil and Gas Resource case, where higher production capability lowers the price of U.S. natural gas supply to the world market, leading to net LNG exports of 10.3 Tcf in 2040 (212% more than in the Reference case) and total net natural gas exports of 13.1 Tcf in 2040 (133% more than in the Reference case).Most of the variations in projected net exports of U.S. natural gas among the AEO2015 cases result from differences in levels of LNG exports. In the High Oil Price and Low Oil Price cases, projected LNG exports vary in response to differences between international and domestic natural gas prices, after accounting for the costs associated with processing and transporting the gas. Over the projection, the relationship between international LNG prices and world oil prices is assumed to weaken, particularly as U.S. LNG exports increase. Low world oil prices limit the competitiveness of domestic natural gas relative to oil itself and also to LNG volumes sold through contracts linked to oil prices, which are less likely to be renegotiated in a low oil price environment.In the High Oil Price case, U.S. LNG exports total 8.1 Tcf in 2040, or 142% more than in the Reference case. As a result, U.S. net natural gas exports total 9.1 Tcf in 2040 in the High Oil Price case, or 63% more than in the Reference case. In the Low World Oil Price case, LNG net exports never surpass 0.8 Tcf, and U.S. net exports of natural gas total 3.0 Tcf in 2040, or 46% below the Reference case level.Canada, which accounted for 97% of total U.S. pipeline imports of natural gas in 2013, continues as the source of nearly all U.S. pipeline imports through 2040. Most natural gas imported into the United States comes from western Canada and is delivered mainly to the West Coast and the Midwest.In the AEO2015 alternative cases, gross pipeline imports from Canada generally are higher than in the Reference case when prices in the United States are higher, and vice versa. However, gross pipeline imports from Canada in 2040 are highest in the High Oil and Gas Resource case, with growth after 2030 resulting from an assumed increase in Canada’s shale and coalbed resources. Gross exports of U.S. natural gas to Canada, largely into the eastern provinces, generally increase when prices are low in the United States, and vice versa.U.S. pipeline exports of natural gas—most flowing south to Mexico—have grown substantially since 2010 and are projected to continue increasing in all the AEO2015 cases because increases in Mexico’s production are not expected to keep pace with the country’s growing demand for natural gas, primarily for electric power generation. In the High Oil and Gas Resource case, with the lowest projected U.S. natural gas prices, pipeline exports to Mexico in 2040 total 4.7 Tcf, as compared with 3.3 Tcf in the Low Oil Price case and 2.2 Tcf by 2040 in the High Oil Price case.
CoalBetween 2008 and 2013, U.S. coal production fell by 187 million short tons (16%), as declining natural gas prices made coal less competitive as a fuel for generating electricity (Figure 29). In the AEO2015 Reference case, U.S. coal production increases at an average rate of 0.7%/year from 2013 to 2030, from 985 million short tons (19.9 quadrillion Btu) to 1,118 million short tons (22.4 quadrillion Btu). Over the same period, rising natural gas prices, particularly after 2017, contribute to increases in electricity generation from existing coal-fired power plants as coal prices increase more slowly. After 2030, coal consumption for electricity generation levels off through 2040. The cases presented in AEO2015 do not include EPA’s proposed Clean Power Plan, which would have a material impact on projected levels of coal-fired generation. A separate EIA analysis of the Clean Power Plan is forthcoming.Compliance with the Mercury and Air Toxics Standards (MATS),28 coupled with low natural gas prices and
28 U.S. Environmental Protection Agency, “Mercury and Air Toxics Standards,” http://www.epa.gov/mats (Washington, DC: March 27, 2012).
-15
-10
-5
0
5
2005 2013 2020 2025 2030 2035 2040
2013 ProjectionsHistory
Low Oil Price
Reference
High Oil and Gas Resource
High Oil Price
Figure 28. U.S. liquefied natural gas net imports in four cases, 2005-40 (trillion cubic feet)
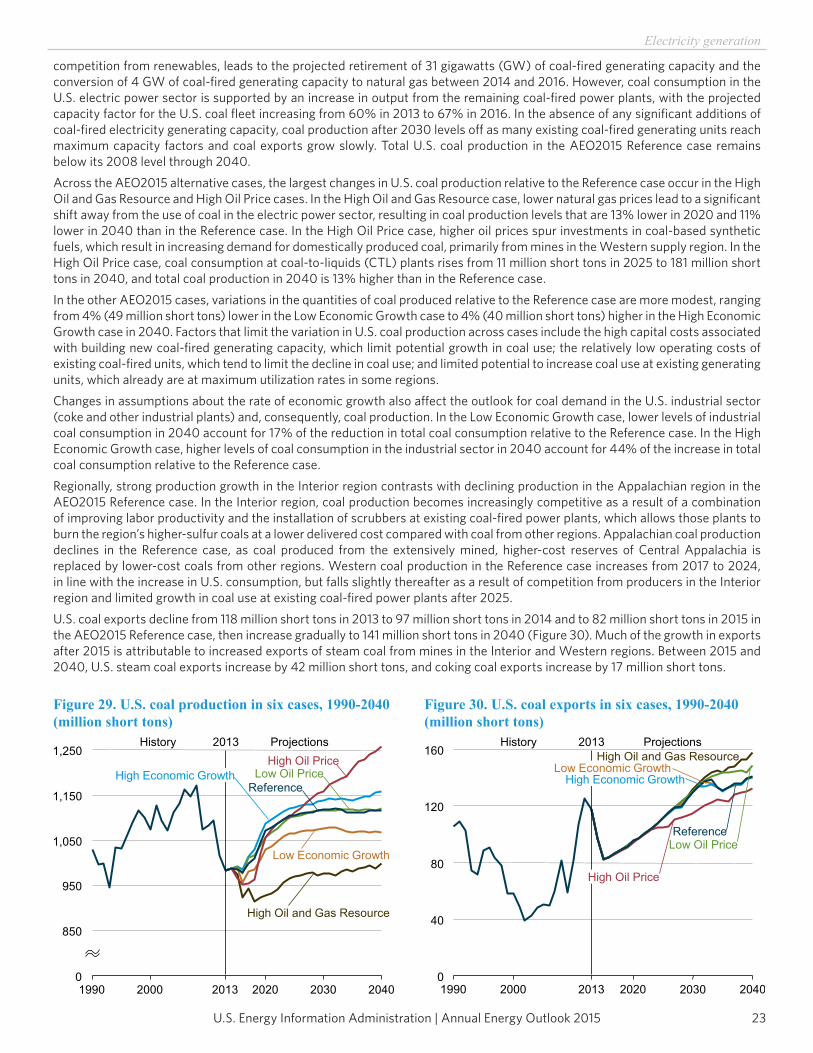
U.S. Energy Information Administration | Annual Energy Outlook 2015 23
Electricity generation
competition from renewables, leads to the projected retirement of 31 gigawatts (GW) of coal-fired generating capacity and the conversion of 4 GW of coal-fired generating capacity to natural gas between 2014 and 2016. However, coal consumption in the U.S. electric power sector is supported by an increase in output from the remaining coal-fired power plants, with the projected capacity factor for the U.S. coal fleet increasing from 60% in 2013 to 67% in 2016. In the absence of any significant additions of coal-fired electricity generating capacity, coal production after 2030 levels off as many existing coal-fired generating units reach maximum capacity factors and coal exports grow slowly. Total U.S. coal production in the AEO2015 Reference case remains below its 2008 level through 2040.Across the AEO2015 alternative cases, the largest changes in U.S. coal production relative to the Reference case occur in the High Oil and Gas Resource and High Oil Price cases. In the High Oil and Gas Resource case, lower natural gas prices lead to a significant shift away from the use of coal in the electric power sector, resulting in coal production levels that are 13% lower in 2020 and 11% lower in 2040 than in the Reference case. In the High Oil Price case, higher oil prices spur investments in coal-based synthetic fuels, which result in increasing demand for domestically produced coal, primarily from mines in the Western supply region. In the High Oil Price case, coal consumption at coal-to-liquids (CTL) plants rises from 11 million short tons in 2025 to 181 million short tons in 2040, and total coal production in 2040 is 13% higher than in the Reference case.In the other AEO2015 cases, variations in the quantities of coal produced relative to the Reference case are more modest, ranging from 4% (49 million short tons) lower in the Low Economic Growth case to 4% (40 million short tons) higher in the High Economic Growth case in 2040. Factors that limit the variation in U.S. coal production across cases include the high capital costs associated with building new coal-fired generating capacity, which limit potential growth in coal use; the relatively low operating costs of existing coal-fired units, which tend to limit the decline in coal use; and limited potential to increase coal use at existing generating units, which already are at maximum utilization rates in some regions.Changes in assumptions about the rate of economic growth also affect the outlook for coal demand in the U.S. industrial sector (coke and other industrial plants) and, consequently, coal production. In the Low Economic Growth case, lower levels of industrial coal consumption in 2040 account for 17% of the reduction in total coal consumption relative to the Reference case. In the High Economic Growth case, higher levels of coal consumption in the industrial sector in 2040 account for 44% of the increase in total coal consumption relative to the Reference case.Regionally, strong production growth in the Interior region contrasts with declining production in the Appalachian region in the AEO2015 Reference case. In the Interior region, coal production becomes increasingly competitive as a result of a combination of improving labor productivity and the installation of scrubbers at existing coal-fired power plants, which allows those plants to burn the region’s higher-sulfur coals at a lower delivered cost compared with coal from other regions. Appalachian coal production declines in the Reference case, as coal produced from the extensively mined, higher-cost reserves of Central Appalachia is replaced by lower-cost coals from other regions. Western coal production in the Reference case increases from 2017 to 2024, in line with the increase in U.S. consumption, but falls slightly thereafter as a result of competition from producers in the Interior region and limited growth in coal use at existing coal-fired power plants after 2025.U.S. coal exports decline from 118 million short tons in 2013 to 97 million short tons in 2014 and to 82 million short tons in 2015 in the AEO2015 Reference case, then increase gradually to 141 million short tons in 2040 (Figure 30). Much of the growth in exports after 2015 is attributable to increased exports of steam coal from mines in the Interior and Western regions. Between 2015 and 2040, U.S. steam coal exports increase by 42 million short tons, and coking coal exports increase by 17 million short tons.
0
850
950
1,050
1,150
1,250
1990 2000 2013 2020 2030 2040
2013 ProjectionsHistory
Low Oil PriceReference
High Oil and Gas Resource
High Oil PriceHigh Economic Growth
Low Economic Growth
Figure 29. U.S. coal production in six cases, 1990-2040 (million short tons)
0
40
80
120
160
1990 2000 2013 2020 2030 2040
2013 ProjectionsHistory
Low Oil PriceReference
High Oil Price
High Economic GrowthLow Economic Growth
High Oil and Gas Resource
Figure 30. U.S. coal exports in six cases, 1990-2040 (million short tons)
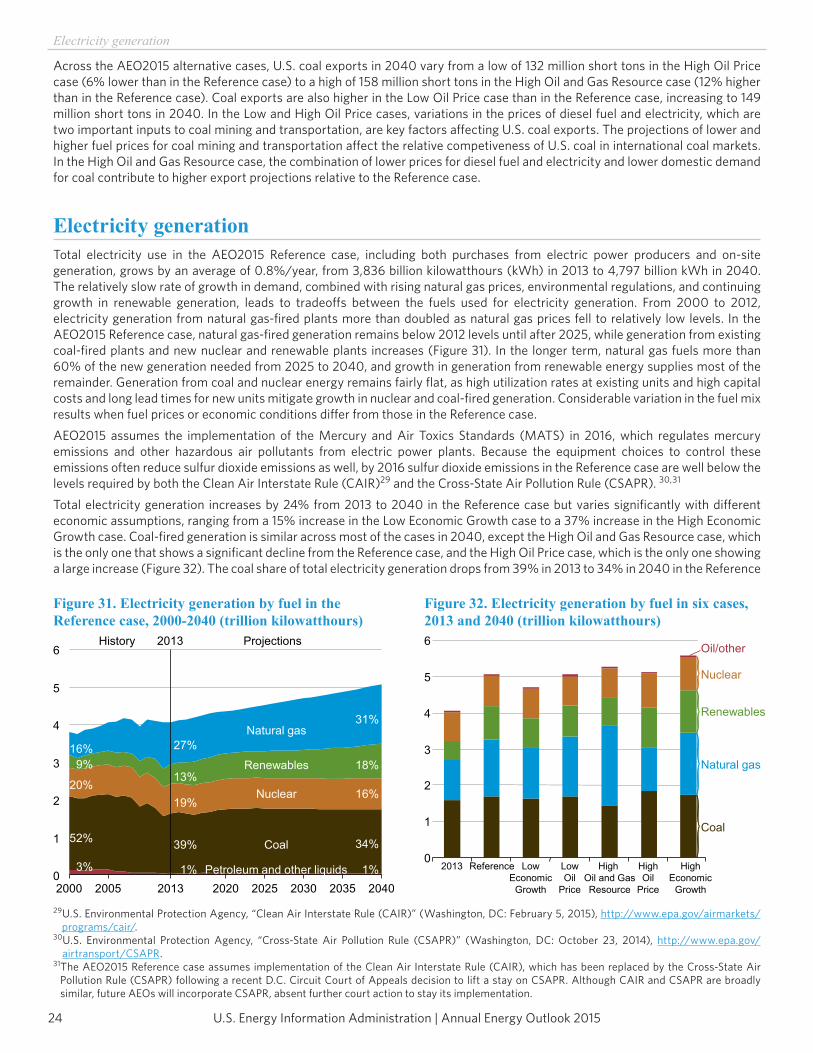
U.S. Energy Information Administration | Annual Energy Outlook 201524
Electricity generation
Across the AEO2015 alternative cases, U.S. coal exports in 2040 vary from a low of 132 million short tons in the High Oil Price case (6% lower than in the Reference case) to a high of 158 million short tons in the High Oil and Gas Resource case (12% higher than in the Reference case). Coal exports are also higher in the Low Oil Price case than in the Reference case, increasing to 149 million short tons in 2040. In the Low and High Oil Price cases, variations in the prices of diesel fuel and electricity, which are two important inputs to coal mining and transportation, are key factors affecting U.S. coal exports. The projections of lower and higher fuel prices for coal mining and transportation affect the relative competiveness of U.S. coal in international coal markets. In the High Oil and Gas Resource case, the combination of lower prices for diesel fuel and electricity and lower domestic demand for coal contribute to higher export projections relative to the Reference case.
Electricity generationTotal electricity use in the AEO2015 Reference case, including both purchases from electric power producers and on-site generation, grows by an average of 0.8%/year, from 3,836 billion kilowatthours (kWh) in 2013 to 4,797 billion kWh in 2040. The relatively slow rate of growth in demand, combined with rising natural gas prices, environmental regulations, and continuing growth in renewable generation, leads to tradeoffs between the fuels used for electricity generation. From 2000 to 2012, electricity generation from natural gas-fired plants more than doubled as natural gas prices fell to relatively low levels. In the AEO2015 Reference case, natural gas-fired generation remains below 2012 levels until after 2025, while generation from existing coal-fired plants and new nuclear and renewable plants increases (Figure 31). In the longer term, natural gas fuels more than 60% of the new generation needed from 2025 to 2040, and growth in generation from renewable energy supplies most of the remainder. Generation from coal and nuclear energy remains fairly flat, as high utilization rates at existing units and high capital costs and long lead times for new units mitigate growth in nuclear and coal-fired generation. Considerable variation in the fuel mix results when fuel prices or economic conditions differ from those in the Reference case.AEO2015 assumes the implementation of the Mercury and Air Toxics Standards (MATS) in 2016, which regulates mercury emissions and other hazardous air pollutants from electric power plants. Because the equipment choices to control these emissions often reduce sulfur dioxide emissions as well, by 2016 sulfur dioxide emissions in the Reference case are well below the levels required by both the Clean Air Interstate Rule (CAIR)29 and the Cross-State Air Pollution Rule (CSAPR). 30,31
Total electricity generation increases by 24% from 2013 to 2040 in the Reference case but varies significantly with different economic assumptions, ranging from a 15% increase in the Low Economic Growth case to a 37% increase in the High Economic Growth case. Coal-fired generation is similar across most of the cases in 2040, except the High Oil and Gas Resource case, which is the only one that shows a significant decline from the Reference case, and the High Oil Price case, which is the only one showing a large increase (Figure 32). The coal share of total electricity generation drops from 39% in 2013 to 34% in 2040 in the Reference
29 U.S. Environmental Protection Agency, “Clean Air Interstate Rule (CAIR)” (Washington, DC: February 5, 2015), http://www.epa.gov/airmarkets/programs/cair/.
30 U.S. Environmental Protection Agency, “Cross-State Air Pollution Rule (CSAPR)” (Washington, DC: October 23, 2014), http://www.epa.gov/airtransport/CSAPR.
31 The AEO2015 Reference case assumes implementation of the Clean Air Interstate Rule (CAIR), which has been replaced by the Cross-State Air Pollution Rule (CSAPR) following a recent D.C. Circuit Court of Appeals decision to lift a stay on CSAPR. Although CAIR and CSAPR are broadly similar, future AEOs will incorporate CSAPR, absent further court action to stay its implementation.
0
1
2
3
4
5
6
2000 2005 2013 2020 2025 2030 2035 2040
Natural gas
Renewables
Nuclear
Coal
16%9%
20%
52%
27%
13%
19%
39%
31%
18%
16%
34%
Petroleum and other liquids3% 1% 1%
2013 ProjectionsHistory
Figure 31. Electricity generation by fuel in the Reference case, 2000-2040 (trillion kilowatthours)
Coal
Natural gas
Renewables
Nuclear
Oil/other
HighEconomic
Growth
02013 Reference Low
EconomicGrowth
LowOil
Price
HighOil
Price
High Oil and GasResource
1
2
3
4
5
6
Figure 32. Electricity generation by fuel in six cases, 2013 and 2040 (trillion kilowatthours)
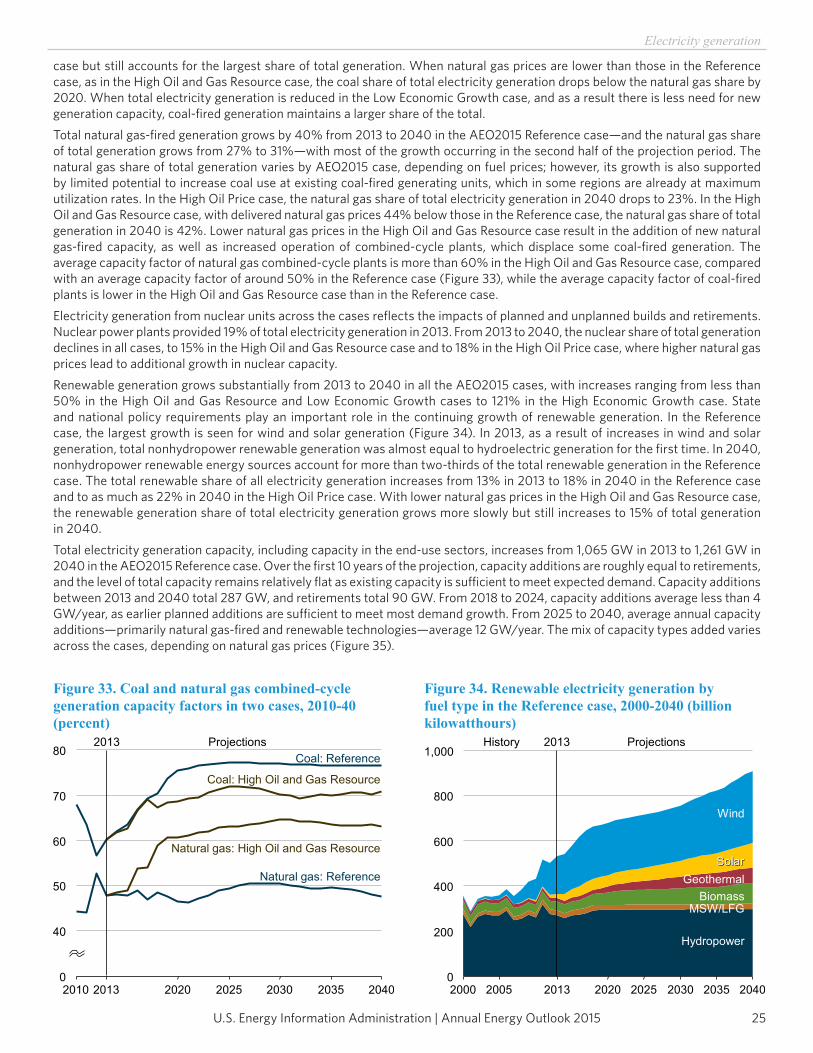
U.S. Energy Information Administration | Annual Energy Outlook 2015 25
Electricity generation
case but still accounts for the largest share of total generation. When natural gas prices are lower than those in the Reference case, as in the High Oil and Gas Resource case, the coal share of total electricity generation drops below the natural gas share by 2020. When total electricity generation is reduced in the Low Economic Growth case, and as a result there is less need for new generation capacity, coal-fired generation maintains a larger share of the total.Total natural gas-fired generation grows by 40% from 2013 to 2040 in the AEO2015 Reference case—and the natural gas share of total generation grows from 27% to 31%—with most of the growth occurring in the second half of the projection period. The natural gas share of total generation varies by AEO2015 case, depending on fuel prices; however, its growth is also supported by limited potential to increase coal use at existing coal-fired generating units, which in some regions are already at maximum utilization rates. In the High Oil Price case, the natural gas share of total electricity generation in 2040 drops to 23%. In the High Oil and Gas Resource case, with delivered natural gas prices 44% below those in the Reference case, the natural gas share of total generation in 2040 is 42%. Lower natural gas prices in the High Oil and Gas Resource case result in the addition of new natural gas-fired capacity, as well as increased operation of combined-cycle plants, which displace some coal-fired generation. The average capacity factor of natural gas combined-cycle plants is more than 60% in the High Oil and Gas Resource case, compared with an average capacity factor of around 50% in the Reference case (Figure 33), while the average capacity factor of coal-fired plants is lower in the High Oil and Gas Resource case than in the Reference case.Electricity generation from nuclear units across the cases reflects the impacts of planned and unplanned builds and retirements. Nuclear power plants provided 19% of total electricity generation in 2013. From 2013 to 2040, the nuclear share of total generation declines in all cases, to 15% in the High Oil and Gas Resource case and to 18% in the High Oil Price case, where higher natural gas prices lead to additional growth in nuclear capacity.Renewable generation grows substantially from 2013 to 2040 in all the AEO2015 cases, with increases ranging from less than 50% in the High Oil and Gas Resource and Low Economic Growth cases to 121% in the High Economic Growth case. State and national policy requirements play an important role in the continuing growth of renewable generation. In the Reference case, the largest growth is seen for wind and solar generation (Figure 34). In 2013, as a result of increases in wind and solar generation, total nonhydropower renewable generation was almost equal to hydroelectric generation for the first time. In 2040, nonhydropower renewable energy sources account for more than two-thirds of the total renewable generation in the Reference case. The total renewable share of all electricity generation increases from 13% in 2013 to 18% in 2040 in the Reference case and to as much as 22% in 2040 in the High Oil Price case. With lower natural gas prices in the High Oil and Gas Resource case, the renewable generation share of total electricity generation grows more slowly but still increases to 15% of total generation in 2040.Total electricity generation capacity, including capacity in the end-use sectors, increases from 1,065 GW in 2013 to 1,261 GW in 2040 in the AEO2015 Reference case. Over the first 10 years of the projection, capacity additions are roughly equal to retirements, and the level of total capacity remains relatively flat as existing capacity is sufficient to meet expected demand. Capacity additions between 2013 and 2040 total 287 GW, and retirements total 90 GW. From 2018 to 2024, capacity additions average less than 4 GW/year, as earlier planned additions are sufficient to meet most demand growth. From 2025 to 2040, average annual capacity additions—primarily natural gas-fired and renewable technologies—average 12 GW/year. The mix of capacity types added varies across the cases, depending on natural gas prices (Figure 35).
0
40
50
60
70
80
2010 2013 2020 2025 2030 2035 2040
2013 ProjectionsCoal: Reference
Natural gas: Reference
Natural gas: High Oil and Gas Resource
Coal: High Oil and Gas Resource
Figure 33. Coal and natural gas combined-cycle generation capacity factors in two cases, 2010-40 (percent)
0
200
400
600
800
1,000
2000 2005 2013 2020 2025 2030 2035 2040
2013 ProjectionsHistory
Wind
GeothermalBiomass
MSW/LFG
Hydropower
SolarSolar
Figure 34. Renewable electricity generation by fuel type in the Reference case, 2000-2040 (billion kilowatthours)
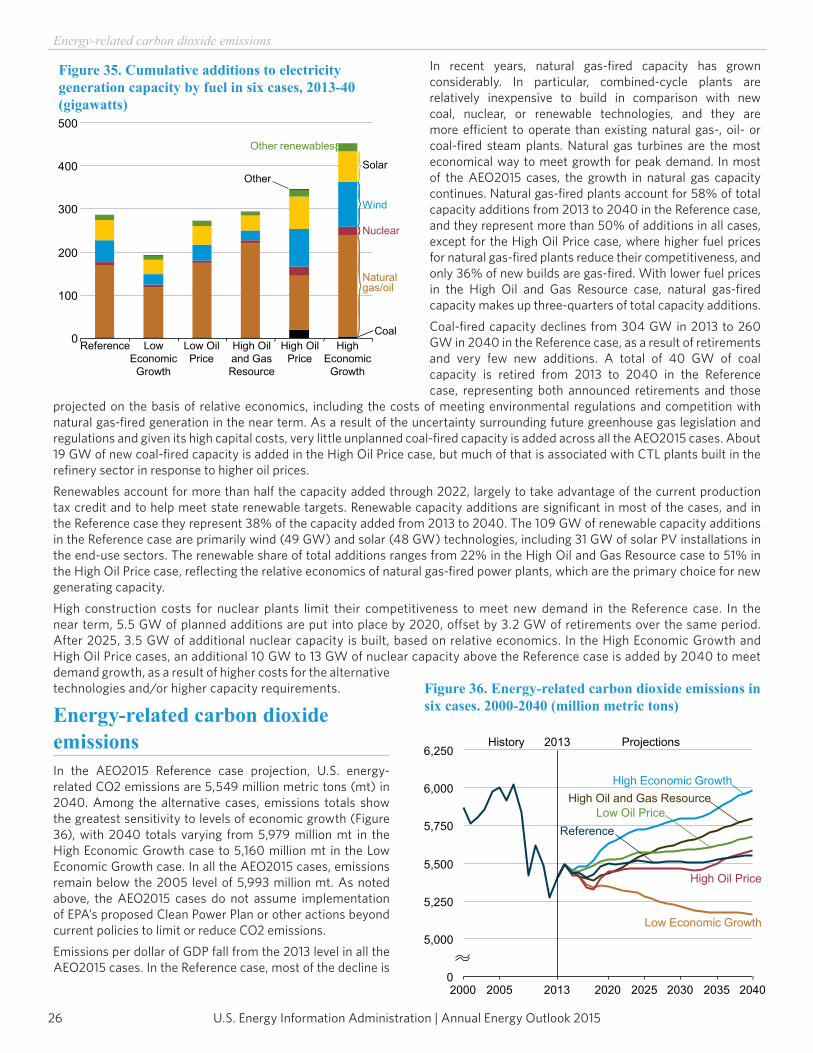
U.S. Energy Information Administration | Annual Energy Outlook 201526
Energy-related carbon dioxide emissions
In recent years, natural gas-fired capacity has grown considerably. In particular, combined-cycle plants are relatively inexpensive to build in comparison with new coal, nuclear, or renewable technologies, and they are more efficient to operate than existing natural gas-, oil- or coal-fired steam plants. Natural gas turbines are the most economical way to meet growth for peak demand. In most of the AEO2015 cases, the growth in natural gas capacity continues. Natural gas-fired plants account for 58% of total capacity additions from 2013 to 2040 in the Reference case, and they represent more than 50% of additions in all cases, except for the High Oil Price case, where higher fuel prices for natural gas-fired plants reduce their competitiveness, and only 36% of new builds are gas-fired. With lower fuel prices in the High Oil and Gas Resource case, natural gas-fired capacity makes up three-quarters of total capacity additions.Coal-fired capacity declines from 304 GW in 2013 to 260 GW in 2040 in the Reference case, as a result of retirements and very few new additions. A total of 40 GW of coal capacity is retired from 2013 to 2040 in the Reference case, representing both announced retirements and those
projected on the basis of relative economics, including the costs of meeting environmental regulations and competition with natural gas-fired generation in the near term. As a result of the uncertainty surrounding future greenhouse gas legislation and regulations and given its high capital costs, very little unplanned coal-fired capacity is added across all the AEO2015 cases. About 19 GW of new coal-fired capacity is added in the High Oil Price case, but much of that is associated with CTL plants built in the refinery sector in response to higher oil prices.Renewables account for more than half the capacity added through 2022, largely to take advantage of the current production tax credit and to help meet state renewable targets. Renewable capacity additions are significant in most of the cases, and in the Reference case they represent 38% of the capacity added from 2013 to 2040. The 109 GW of renewable capacity additions in the Reference case are primarily wind (49 GW) and solar (48 GW) technologies, including 31 GW of solar PV installations in the end-use sectors. The renewable share of total additions ranges from 22% in the High Oil and Gas Resource case to 51% in the High Oil Price case, reflecting the relative economics of natural gas-fired power plants, which are the primary choice for new generating capacity.High construction costs for nuclear plants limit their competitiveness to meet new demand in the Reference case. In the near term, 5.5 GW of planned additions are put into place by 2020, offset by 3.2 GW of retirements over the same period. After 2025, 3.5 GW of additional nuclear capacity is built, based on relative economics. In the High Economic Growth and High Oil Price cases, an additional 10 GW to 13 GW of nuclear capacity above the Reference case is added by 2040 to meet demand growth, as a result of higher costs for the alternative technologies and/or higher capacity requirements.
Energy-related carbon dioxide emissionsIn the AEO2015 Reference case projection, U.S. energy-related CO2 emissions are 5,549 million metric tons (mt) in 2040. Among the alternative cases, emissions totals show the greatest sensitivity to levels of economic growth (Figure 36), with 2040 totals varying from 5,979 million mt in the High Economic Growth case to 5,160 million mt in the Low Economic Growth case. In all the AEO2015 cases, emissions remain below the 2005 level of 5,993 million mt. As noted above, the AEO2015 cases do not assume implementation of EPA’s proposed Clean Power Plan or other actions beyond current policies to limit or reduce CO2 emissions.Emissions per dollar of GDP fall from the 2013 level in all the AEO2015 cases. In the Reference case, most of the decline is
0
5,000
5,250
5,500
5,750
6,000
6,250
2000 2005 2013 2020 2025 2030 2035 2040
2013 ProjectionsHistory
High Economic Growth
Low Economic Growth
High Oil and Gas Resource
High Oil Price
Low Oil PriceReference
Figure 36. Energy-related carbon dioxide emissions in six cases. 2000-2040 (million metric tons)
0
100
200
300
400
500
Reference LowEconomic
Growth
Low OilPrice
High Oiland GasResource
High OilPrice
HighEconomic
Growth
Other renewables
OtherSolar
Wind
Nuclear
Naturalgas/oil
Coal
Figure 35. Cumulative additions to electricity generation capacity by fuel in six cases, 2013-40 (gigawatts)
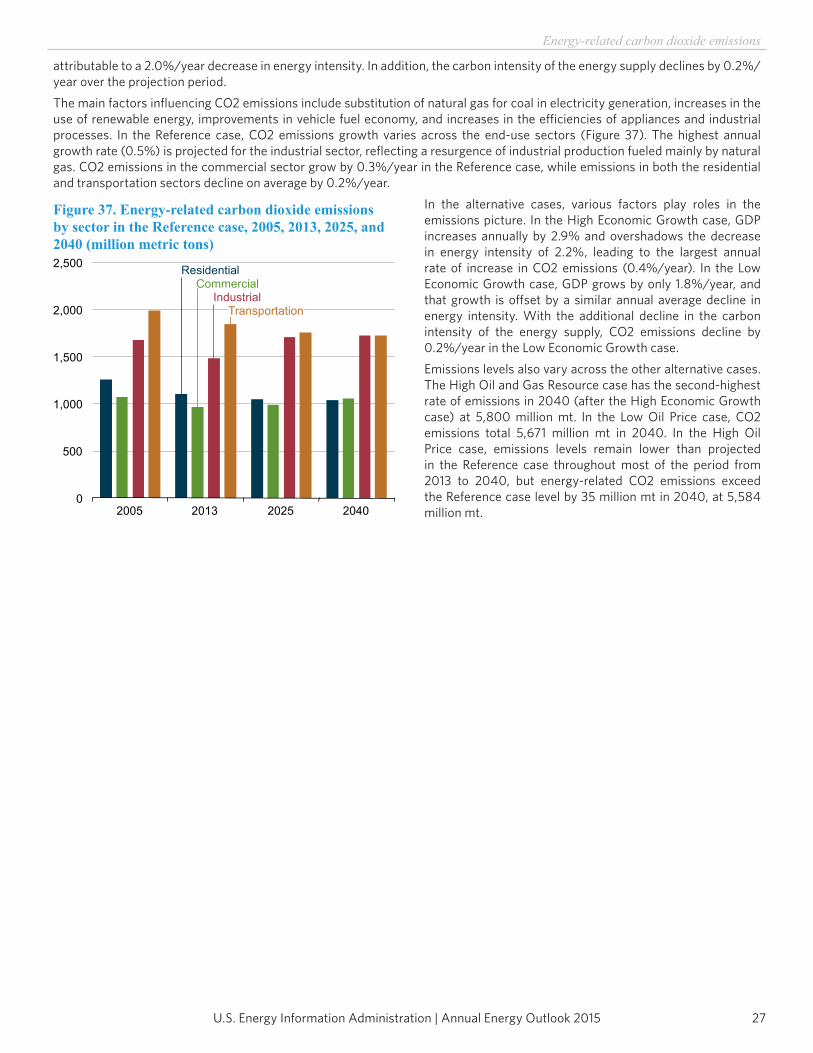
U.S. Energy Information Administration | Annual Energy Outlook 2015 27
Energy-related carbon dioxide emissions
attributable to a 2.0%/year decrease in energy intensity. In addition, the carbon intensity of the energy supply declines by 0.2%/year over the projection period.The main factors influencing CO2 emissions include substitution of natural gas for coal in electricity generation, increases in the use of renewable energy, improvements in vehicle fuel economy, and increases in the efficiencies of appliances and industrial processes. In the Reference case, CO2 emissions growth varies across the end-use sectors (Figure 37). The highest annual growth rate (0.5%) is projected for the industrial sector, reflecting a resurgence of industrial production fueled mainly by natural gas. CO2 emissions in the commercial sector grow by 0.3%/year in the Reference case, while emissions in both the residential and transportation sectors decline on average by 0.2%/year.
In the alternative cases, various factors play roles in the emissions picture. In the High Economic Growth case, GDP increases annually by 2.9% and overshadows the decrease in energy intensity of 2.2%, leading to the largest annual rate of increase in CO2 emissions (0.4%/year). In the Low Economic Growth case, GDP grows by only 1.8%/year, and that growth is offset by a similar annual average decline in energy intensity. With the additional decline in the carbon intensity of the energy supply, CO2 emissions decline by 0.2%/year in the Low Economic Growth case.Emissions levels also vary across the other alternative cases. The High Oil and Gas Resource case has the second-highest rate of emissions in 2040 (after the High Economic Growth case) at 5,800 million mt. In the Low Oil Price case, CO2 emissions total 5,671 million mt in 2040. In the High Oil Price case, emissions levels remain lower than projected in the Reference case throughout most of the period from 2013 to 2040, but energy-related CO2 emissions exceed the Reference case level by 35 million mt in 2040, at 5,584 million mt.
0
500
1,000
1,500
2,000
2,500
2005 2013 2025 2040
ResidentialCommercial
IndustrialTransportation
Figure 37. Energy-related carbon dioxide emissions by sector in the Reference case, 2005, 2013, 2025, and 2040 (million metric tons)

This page inTenTionally lefT blank
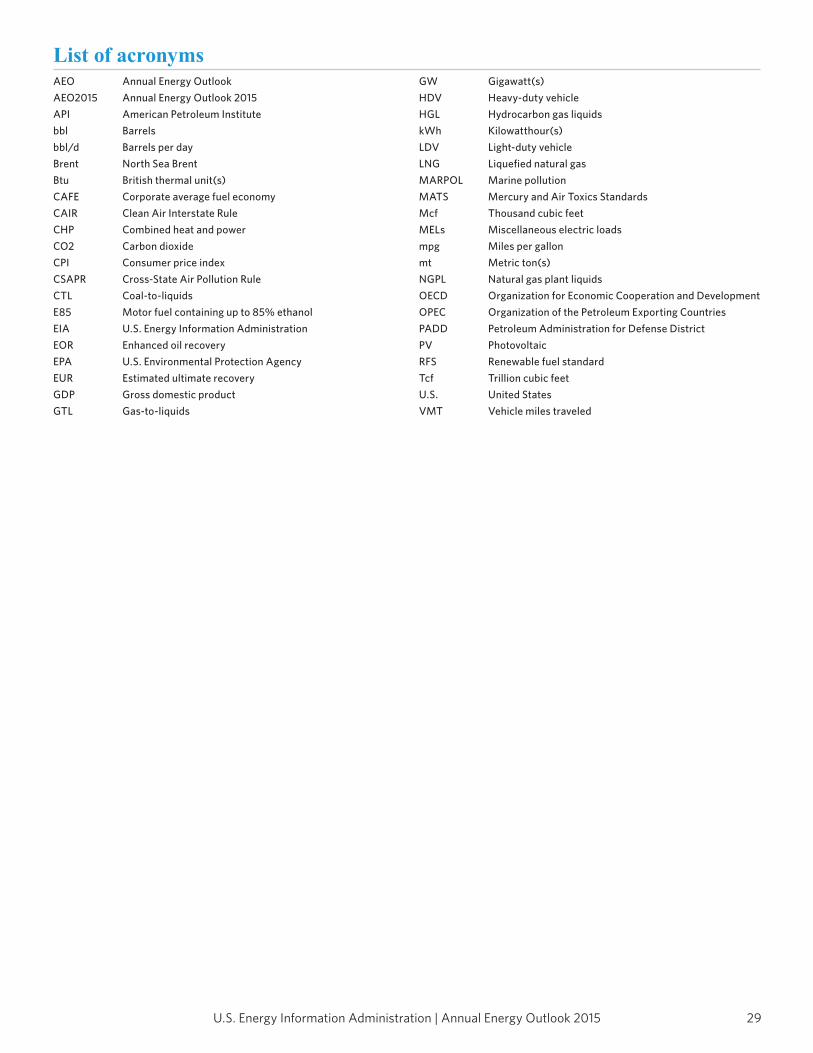
29U.S. Energy Information Administration | Annual Energy Outlook 2015
AEO Annual Energy OutlookAEO2015 Annual Energy Outlook 2015API American Petroleum Institutebbl Barrelsbbl/d Barrels per dayBrent North Sea BrentBtu British thermal unit(s)CAFE Corporate average fuel economyCAIR Clean Air Interstate RuleCHP Combined heat and powerCO2 Carbon dioxideCPI Consumer price indexCSAPR Cross-State Air Pollution RuleCTL Coal-to-liquidsE85 Motor fuel containing up to 85% ethanolEIA U.S. Energy Information AdministrationEOR Enhanced oil recoveryEPA U.S. Environmental Protection AgencyEUR Estimated ultimate recoveryGDP Gross domestic productGTL Gas-to-liquids
GW Gigawatt(s)HDV Heavy-duty vehicleHGL Hydrocarbon gas liquidskWh Kilowatthour(s)LDV Light-duty vehicleLNG Liquefied natural gasMARPOL Marine pollutionMATS Mercury and Air Toxics StandardsMcf Thousand cubic feetMELs Miscellaneous electric loadsmpg Miles per gallonmt Metric ton(s)NGPL Natural gas plant liquidsOECD Organization for Economic Cooperation and DevelopmentOPEC Organization of the Petroleum Exporting CountriesPADD Petroleum Administration for Defense DistrictPV PhotovoltaicRFS Renewable fuel standardTcf Trillion cubic feetU.S. United StatesVMT Vehicle miles traveled
List of acronyms

This page inTenTionally lefT blank
31U.S. Energy Information Administration | Annual Energy Outlook 2015
Figure ES1. North Sea Brent crude oil spot prices in four cases, 2005-40: History: U.S. Energy Information Administration, Petroleum & Other Liquids, Europe Bent Spot Price FOB, http://www.eia.gov/dnav/pet/hist/LeafHandler.ashx?n=PET&s=RBRTE&f=D. Projections: AEO2015 National Energy Modeling System, runs REF2015.D021915A, LOWPRICE.D021915A, HIGHPRICE.D021915A, and HIGHRESOURCE.D021915B.Figure ES2. Average Henry Hub spot prices for natural gas in four cases, 2005-40: History: U.S. Energy Information Administration, Natural Gas Annual 2013, DOE/EIA-0131(2013) (Washington, DC, October 2014). Projections: AEO2015 National Energy Modeling System, runs REF2015.D021915A, LOWPRICE.D021915A, HIGHPRICE.D021915A, and HIGHRESOURCE.D021915B.Figure ES3. U.S. net energy imports in six cases, 2005-40: History: U.S. Energy Information Administration, Monthly Energy Review, November 2014, DOE/EIA-0035(2014/11). Projections: AEO2015 National Energy Modeling System, runs REF2015.D021915A, LOWPRICE.D021915A, HIGHPRICE.D021915A, LOWMACRO.D021915A, HIGHMACRO.D021915A, and HIGHRESOURCE.D021915B. Table ES1. Growth of trade-related factors in the Reference case, 1983-2040: AEO2015 National Energy Modeling System, runs REF2015.D021915A.Figure ES4. Net crude oil and petroleum product imports as a percentage of U.S. product supplied in four cases, 2005-40: History: U.S. Energy Information Administration, Monthly Energy Review, November 2014, DOE/EIA-0035(2014/11). Projections: AEO2015 National Energy Modeling System, runs REF2015.D021915A, LOWPRICE.D021915A, HIGHPRICE.D021915A, and HIGHRESOURCE.D021915B. Figure ES5. U.S. total net natural gas imports in four cases, 2005-40: History: U.S. Energy Information Administration, Monthly Energy Review, November 2014, DOE/EIA-0035(2014/11). Projections: AEO2015 National Energy Modeling System, runs REF2015.D021915A, LOWPRICE.D021915A, HIGHPRICE.D021915A, and HIGHRESOURCE.D021915B.Figure ES6. Change in U.S. Lower 48 onshore crude oil production by region in six cases, 2013-40: Projections: AEO2015 National Energy Modeling System, runs REF2015.D021915A, LOWPRICE.D021915A, HIGHPRICE.D021915A, LOWMACRO.D021915A, HIGHMACRO.D021915A, and HIGHRESOURCE.D021915B.Figure ES7. Delivered energy consumption for transportation in six cases, 2008-40: History: U.S. Energy Information Administration, Monthly Energy Review, November 2014, DOE/EIA-0035(2014/11). Projections: AEO2015 National Energy Modeling System, runs REF2015.D021915A, LOWPRICE.D021915A, HIGHPRICE.D021915A, LOWMACRO.D021915A, HIGHMACRO.D021915A, and HIGHRESOURCE.D021915B.Figure ES8. Total U.S. renewable generation in all sectors by fuel in six cases, 2013 and 2040: History: U.S. Energy Information Administration, Monthly Energy Review, November 2014, DOE/EIA-0035(2014/11). Projections: AEO2015 National Energy Modeling System, runs REF2015.D021915A, LOWPRICE.D021915A, HIGHPRICE.D021915A, LOWMACRO.D021915A, HIGHMACRO.D021915A, and HIGHRESOURCE.D021915B.Table 1. Summary of AEO2015 cases: U.S. Energy Information Administration.Table 2. Growth in key economic factors in historical data and in the Reference case: AEO2015 National Energy Modeling System, run REF2015.D021915A. Figure 1. Annual changes in U.S. gross domestic product, business investment, and exports in the Reference case, 2015-40: Projections: AEO2015 National Energy Modeling System, run REF2015.D021915A.Figure 2. Annual growth rates for industrial output in three cases, 2013-40: Projections: AEO2015 National Energy Modeling System, runs REF2015.D021915A, LOWMACRO.D021915A, and HIGHMACRO.D021915A.Table 3. Average annual growth of labor productivity, employment, income, and consumption in three cases: Projections: AEO2015 National Energy Modeling System, runs REF2015.D021915A, LOWMACRO.D021915A, and HIGHMACRO.D021915A. Figure 3. North Sea Brent crude oil spot prices in four cases, 2005-40: History: U.S. Energy Information Administration, Petroleum & Other Liquids, Europe Bent Spot Price FOB, http://www.eia.gov/dnav/pet/hist/LeafHandler.ashx?n=PET&s=RBRTE&f=D. Projections: AEO2015 National Energy Modeling System, runs REF2015.D021915A, LOWPRICE.D021915A, and HIGHPRICE.D021915A. Figure 4. Motor gasoline prices in three cases, 2005-40: History: U.S. Energy Information Administration, Monthly Energy Review, November 2014, DOE/EIA-0035(2014/11). Projections: AEO2015 National Energy Modeling System, runs REF2015.D021915A, LOWPRICE.D021915A, and HIGHPRICE.D021915A.Figure 5. Distillate fuel oil prices in three cases, 2005-40: History: U.S. Energy Information Administration, Monthly Energy Review, November 2014, DOE/EIA-0035(2014/11). Projections: AEO2015 National Energy Modeling System, runs REF2015.D021915A, LOWPRICE.D021915A, and HIGHPRICE.D021915A.
Figure and table sourcesLinks current as of April 2015
U.S. Energy Information Administration | Annual Energy Outlook 201532
Figure and table sources
Figure 6. Average Henry Hub spot prices for natural gas in four cases, 2005-40: History: U.S. Energy Information Administration, Natural Gas Annual 2013, DOE/EIA-0131(2013) (Washington, DC, October 2014). Projections: AEO2015 National Energy Modeling System, runs REF2015.D021915A, LOWPRICE.D021915A, HIGHPRICE.D021915A, and HIGHRESOURCE.D021915B.Figure 7. Average minemouth coal prices by region in the Reference case, 1990-2040: History: U.S. Energy Information Administration, Monthly Energy Review, November 2014, DOE/EIA-0035(2014/11). Projections: AEO2015 National Energy Modeling System, run REF2015.D021915A.Figure 8. Average delivered coal prices in six cases, 1990-2040: History: U.S. Energy Information Administration, Monthly Energy Review, November 2014, DOE/EIA-0035(2014/11). Projections: AEO2015 National Energy Modeling System, runs REF2015.D021915A, LOWPRICE.D021915A, HIGHPRICE.D021915A, LOWMACRO.D021915A, HIGHMACRO.D021915A, and HIGHRESOURCE.D021915B.Figure 9. Average retail electricity prices in six cases, 2013-40: AEO2015 National Energy Modeling System, runs REF2015.D021915A, LOWPRICE.D021915A, HIGHPRICE.D021915A, LOWMACRO.D021915A, HIGHMACRO.D021915A, and HIGHRESOURCE.D021915B.Figure 10. Delivered energy consumption for transportation by mode in the Reference case, 2013 and 2040: History: U.S. Energy Information Administration, Natural Gas Annual 2013, DOE/EIA-0131(2013) (Washington, DC, October 2014). Projections: AEO2015 National Energy Modeling System, run REF2015.D021915A.Figure 11. Delivered energy consumption for transportation in six cases, 2008-40: History: U.S. Energy Information Administration, Monthly Energy Review, November 2014, DOE/EIA-0035(2014/11). Projections: AEO2015 National Energy Modeling System, runs REF2015.D021915A, LOWPRICE.D021915A, HIGHPRICE.D021915A, LOWMACRO.D021915A, HIGHMACRO.D021915A, and HIGHRESOURCE.D021915B.Figure 12. Industrial sector total delivered energy consumption in three cases, 2010-40: History: U.S. Energy Information Administration, Monthly Energy Review, November 2014, DOE/EIA-0035(2014/11). Projections: AEO2015 National Energy Modeling System, runs REF2015.D021915A, LOWMACRO.D021915A, and HIGHMACRO.D021915A.Figure 13. Industrial sector natural gas consumption for heat and power in three cases, 2010-40: History: U.S. Energy Information Administration, Monthly Energy Review, November 2014, DOE/EIA-0035(2014/11). Projections: AEO2015 National Energy Modeling System, runs REF2015.D021915A, HIGHPRICE.D021915A, and HIGHRESOURCE.D021915B.Figure 14. Residential sector delivered energy consumption by fuel in the Reference case, 2010-40: History: U.S. Energy Information Administration, Monthly Energy Review, November 2014, DOE/EIA-0035(2014/11). Projections: AEO2015 National Energy Modeling System, run REF2015.D021915A.Figure 15. Commercial sector delivered energy consumption by fuel in the Reference case, 2010-40: History: U.S. Energy Information Administration, Monthly Energy Review, November 2014, DOE/EIA-0035(2014/11). Projections: AEO2015 National Energy Modeling System, run REF2015.D021915A.Table 4. Residential households and commercial indicators in three AEO2015 cases, 2013 and 2040: AEO2015 National Energy Modeling System, runs REF2015.D021915A, LOWMACRO.D021915A, and HIGHMACRO.D021915A.Figure 16. Residential sector delivered energy intensity for selected end uses in the Reference case, 2013 and 2040: AEO2015 National Energy Modeling System, run REF2015.D021915A.Figure 17. Commercial sector delivered energy intensity for selected end uses in the Reference case, 2013 and 2040: AEO2015 National Energy Modeling System, run REF2015.D021915A.Figure 18. Primary energy consumption by fuel in the Reference case, 1980-2040: History: U.S. Energy Information Administration, Monthly Energy Review, November 2014, DOE/EIA-0035(2014/11). Projections: AEO2015 National Energy Modeling System, run REF2015.D021915A.Figure 19. Energy use per capita and per 2009 dollar of gross domestic product, and carbon dioxide emissions per 2009 dollar of gross domestic product, in the Reference case, 1980-2040: History: U.S. Energy Information Administration, Monthly Energy Review, November 2014, DOE/EIA-0035(2014/11). Projections: AEO2015 National Energy Modeling System, run REF2015.D021915A.Figure 20. Total energy production and consumption in the Reference case, 1980-2040: History: U.S. Energy Information Administration, Monthly Energy Review, November 2014, DOE/EIA-0035(2014/11). Projections: AEO2015 National Energy Modeling System, run REF2015.D021915A.Figure 21. U.S. tight oil production in four cases, 2005-40: AEO2015 National Energy Modeling System, run REF2015.D021915A.Figure 22. U.S. total crude oil production in four cases, 2005-40: History: U.S. Energy Information Administration, Monthly Energy Review, November 2014, DOE/EIA-0035(2014/11). Projections: AEO2015 National Energy Modeling System, run REF2015.D021915A.
33U.S. Energy Information Administration | Annual Energy Outlook 2015
Figure and table sources
Figure 23. U.S. net crude oil imports in four cases, 2005-40: History: U.S. Energy Information Administration, Monthly Energy Review, November 2014, DOE/EIA-0035(2014/11). Projections: AEO2015 National Energy Modeling System, runs REF2015.D021915A, LOWPRICE.D021915A, HIGHPRICE.D021915A, and HIGHRESOURCE.D021915B.Figure 24. U.S. net petroleum product imports in four cases, 2005-40: History: U.S. Energy Information Administration, Monthly Energy Review, November 2014, DOE/EIA-0035(2014/11). Projections: AEO2015 National Energy Modeling System, runs REF2015.D021915A, LOWPRICE.D021915A, HIGHPRICE.D021915A, and HIGHRESOURCE.D021915B.Figure 25. U.S. total dry natural gas production in four cases, 2005-40: History: U.S. Energy Information Administration, Monthly Energy Review, November 2014, DOE/EIA-0035(2014/11). Projections: AEO2015 National Energy Modeling System, runs REF2015.D021915A, LOWPRICE.D021915A, HIGHPRICE.D021915A, and HIGHRESOURCE.D021915B.Figure 26. U.S. shale gas production in four cases, 2005-40: AEO2015 National Energy Modeling System, runs REF2015.D021915A, LOWPRICE.D021915A, HIGHPRICE.D021915A, and HIGHRESOURCE.D021915B.Figure 27. U.S. total natural gas net imports in four cases, 2005-40: History: U.S. Energy Information Administration, Monthly Energy Review, November 2014, DOE/EIA-0035(2014/11). Projections: AEO2015 National Energy Modeling System, runs REF2015.D021915A, LOWPRICE.D021915A, HIGHPRICE.D021915A, and HIGHRESOURCE.D021915B.Figure 28. U.S. liquefied natural gas net imports in four cases, 2005-40: History: U.S. Energy Information Administration, Monthly Energy Review, November 2014, DOE/EIA-0035(2014/11). Projections: AEO2015 National Energy Modeling System, runs REF2015.D021915A, LOWPRICE.D021915A, HIGHPRICE.D021915A, and HIGHRESOURCE.D021915B.Figure 29. U.S. coal production in six cases, 1990-2040: History: U.S. Energy Information Administration, Monthly Energy Review, November 2014, DOE/EIA-0035(2014/11). Projections: AEO2015 National Energy Modeling System, runs REF2015.D021915A, LOWPRICE.D021915A, HIGHPRICE.D021915A, LOWMACRO.D021915A, HIGHMACRO.D021915A, and HIGHRESOURCE.D021915B.Figure 30. U.S. coal exports in six cases, 1990-2040: History: U.S. Energy Information Administration, Monthly Energy Review, November 2014, DOE/EIA-0035(2014/11). Projections: AEO2015 National Energy Modeling System, runs REF2015.D021915A, LOWPRICE.D021915A, HIGHPRICE.D021915A, LOWMACRO.D021915A, HIGHMACRO.D021915A, and HIGHRESOURCE.D021915B.Figure 31. Electricity generation by fuel in the Reference case, 2000-2040: History: U.S. Energy Information Administration, Monthly Energy Review, November 2014, DOE/EIA-0035(2014/11). Projections: AEO2015 National Energy Modeling System, run REF2015.D021915A.Figure 32. Electricity generation by fuel in six cases, 2013 and 2040: History: U.S. Energy Information Administration, Monthly Energy Review, November 2014, DOE/EIA-0035(2014/11). Projections: AEO2015 National Energy Modeling System, runs REF2015.D021915A, LOWPRICE.D021915A, HIGHPRICE.D021915A, LOWMACRO.D021915A, HIGHMACRO.D021915A, and HIGHRESOURCE.D021915B.Figure 33. Coal and natural gas combined-cycle generation capacity factors in two cases, 2010-40: History: U.S. Energy Information Administration, Monthly Energy Review, November 2014, DOE/EIA-0035(2014/11). Projections: AEO2015 National Energy Modeling System, runs REF2015.D021915A and HIGHRESOURCE.D021915B.Figure 34. Renewable electricity generation by fuel type in the Reference case, 2000-2040: History: U.S. Energy Information Administration, Monthly Energy Review, November 2014, DOE/EIA-0035(2014/11). Projections: AEO2015 National Energy Modeling System, run REF2015.D021915A.Figure 35. Cumulative additions to electricity generation capacity by fuel in six cases, 2013-40: AEO2015 National Energy Modeling System, runs REF2015.D021915A, LOWPRICE.D021915A, HIGHPRICE.D021915A, LOWMACRO.D021915A, HIGHMACRO.D021915A, and HIGHRESOURCE.D021915B.Figure 36. Energy-related carbon dioxide emissions in six cases, 2000-2040: History: U.S. Energy Information Administration, Monthly Energy Review, November 2014, DOE/EIA-0035(2014/11). Projections: AEO2015 National Energy Modeling System, runs REF2015.D021915A, LOWPRICE.D021915A, HIGHPRICE.D021915A, LOWMACRO.D021915A, HIGHMACRO.D021915A, and HIGHRESOURCE.D021915B.Figure 37. Energy-related carbon dioxide emissions by sector in the Reference cases, 2005, 2013, 2025, and 2040: History: U.S. Energy Information Administration, Monthly Energy Review, November 2014, DOE/EIA-0035(2014/11). Projections: AEO2015 National Energy Modeling System, run REF2015.D021915A.

This page inTenTionally lefT blank
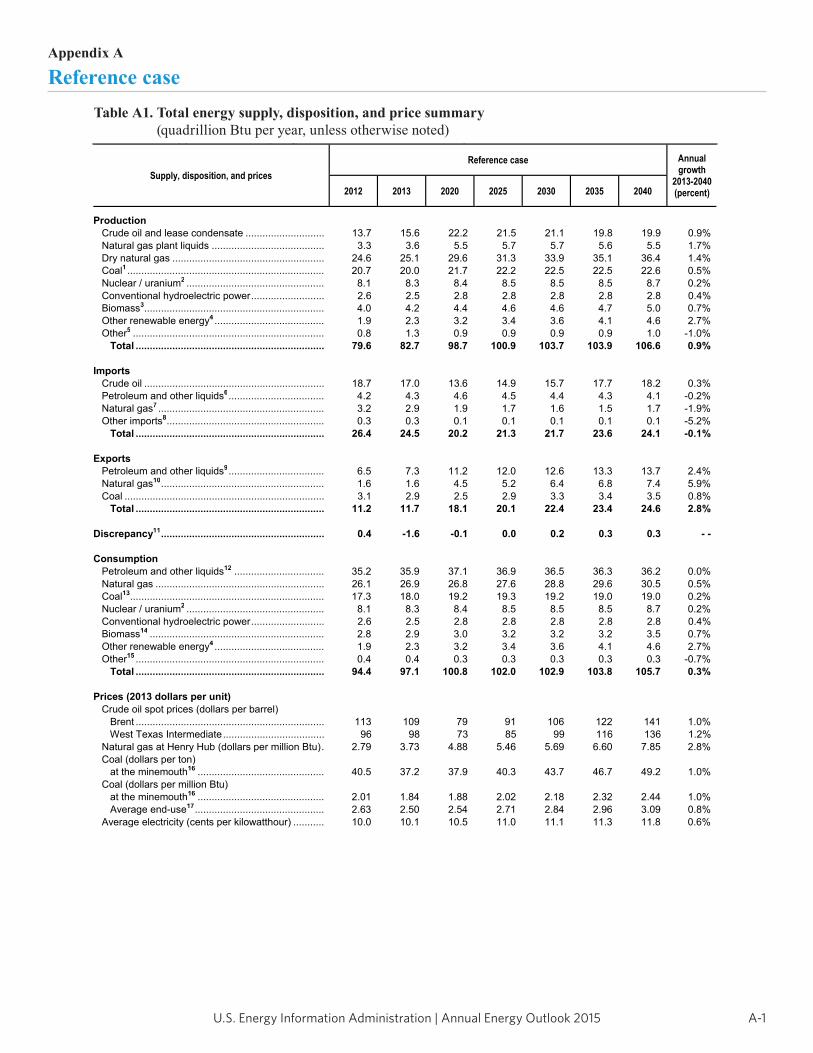
A-1U.S. Energy Information Administration | Annual Energy Outlook 2015
Table A1. Total energy supply, disposition, and price summary(quadrillion Btu per year, unless otherwise noted)
Supply, disposition, and prices Reference case Annual
growth 2013-2040(percent) 2012 2013 2020 2025 2030 2035 2040
Production Crude oil and lease condensate ............................ 13.7 15.6 22.2 21.5 21.1 19.8 19.9 0.9% Natural gas plant liquids ........................................ 3.3 3.6 5.5 5.7 5.7 5.6 5.5 1.7% Dry natural gas ...................................................... 24.6 25.1 29.6 31.3 33.9 35.1 36.4 1.4% Coal1 ...................................................................... 20.7 20.0 21.7 22.2 22.5 22.5 22.6 0.5% Nuclear / uranium2 ................................................. 8.1 8.3 8.4 8.5 8.5 8.5 8.7 0.2% Conventional hydroelectric power .......................... 2.6 2.5 2.8 2.8 2.8 2.8 2.8 0.4% Biomass3................................................................ 4.0 4.2 4.4 4.6 4.6 4.7 5.0 0.7% Other renewable energy4 ....................................... 1.9 2.3 3.2 3.4 3.6 4.1 4.6 2.7% Other5 .................................................................... 0.8 1.3 0.9 0.9 0.9 0.9 1.0 -1.0%
Total ................................................................... 79.6 82.7 98.7 100.9 103.7 103.9 106.6 0.9%
Imports Crude oil ................................................................ 18.7 17.0 13.6 14.9 15.7 17.7 18.2 0.3% Petroleum and other liquids6 .................................. 4.2 4.3 4.6 4.5 4.4 4.3 4.1 -0.2% Natural gas7 ........................................................... 3.2 2.9 1.9 1.7 1.6 1.5 1.7 -1.9% Other imports8........................................................ 0.3 0.3 0.1 0.1 0.1 0.1 0.1 -5.2%
Total ................................................................... 26.4 24.5 20.2 21.3 21.7 23.6 24.1 -0.1%
Exports Petroleum and other liquids9 .................................. 6.5 7.3 11.2 12.0 12.6 13.3 13.7 2.4% Natural gas10 .......................................................... 1.6 1.6 4.5 5.2 6.4 6.8 7.4 5.9% Coal ....................................................................... 3.1 2.9 2.5 2.9 3.3 3.4 3.5 0.8%
Total ................................................................... 11.2 11.7 18.1 20.1 22.4 23.4 24.6 2.8%
Discrepancy11 .......................................................... 0.4 -1.6 -0.1 0.0 0.2 0.3 0.3 - -
Consumption Petroleum and other liquids12 ................................ 35.2 35.9 37.1 36.9 36.5 36.3 36.2 0.0% Natural gas ............................................................ 26.1 26.9 26.8 27.6 28.8 29.6 30.5 0.5% Coal13..................................................................... 17.3 18.0 19.2 19.3 19.2 19.0 19.0 0.2% Nuclear / uranium2 ................................................. 8.1 8.3 8.4 8.5 8.5 8.5 8.7 0.2% Conventional hydroelectric power .......................... 2.6 2.5 2.8 2.8 2.8 2.8 2.8 0.4% Biomass14 .............................................................. 2.8 2.9 3.0 3.2 3.2 3.2 3.5 0.7% Other renewable energy4 ....................................... 1.9 2.3 3.2 3.4 3.6 4.1 4.6 2.7% Other15 ................................................................... 0.4 0.4 0.3 0.3 0.3 0.3 0.3 -0.7%
Total ................................................................... 94.4 97.1 100.8 102.0 102.9 103.8 105.7 0.3%
Prices (2013 dollars per unit) Crude oil spot prices (dollars per barrel)
Brent ................................................................... 113 109 79 91 106 122 141 1.0% West Texas Intermediate .................................... 96 98 73 85 99 116 136 1.2% Natural gas at Henry Hub (dollars per million Btu) . 2.79 3.73 4.88 5.46 5.69 6.60 7.85 2.8% Coal (dollars per ton)
at the minemouth16 ............................................. 40.5 37.2 37.9 40.3 43.7 46.7 49.2 1.0% Coal (dollars per million Btu)
at the minemouth16 ............................................. 2.01 1.84 1.88 2.02 2.18 2.32 2.44 1.0% Average end-use17 .............................................. 2.63 2.50 2.54 2.71 2.84 2.96 3.09 0.8%
Average electricity (cents per kilowatthour) ........... 10.0 10.1 10.5 11.0 11.1 11.3 11.8 0.6%
Appendix A
Reference caseTable A1. Total energy supply, disposition, and price summary
(quadrillion Btu per year, unless otherwise noted)
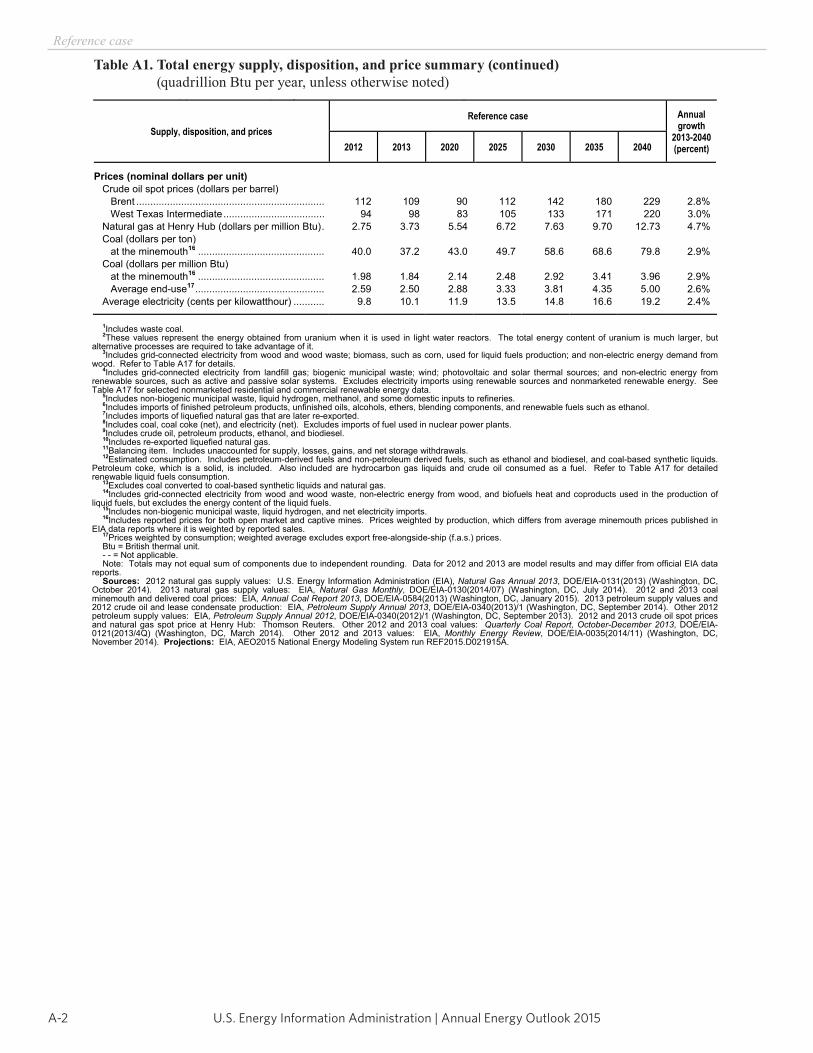
U.S. Energy Information Administration | Annual Energy Outlook 2015A-2
Reference case
Table A1. Total energy supply, disposition, and price summary (continued) (quadrillion Btu per year, unless otherwise noted)
Energy Information Administration / Annual Energy Outlook 2015
Table A1. Total energy supply, disposition, and price summary (continued)(quadrillion Btu per year, unless otherwise noted)
Supply, disposition, and prices Reference case Annual
growth 2013-2040(percent) 2012 2013 2020 2025 2030 2035 2040
Prices (nominal dollars per unit) Crude oil spot prices (dollars per barrel)
Brent ................................................................... 112 109 90 112 142 180 229 2.8% West Texas Intermediate .................................... 94 98 83 105 133 171 220 3.0% Natural gas at Henry Hub (dollars per million Btu) . 2.75 3.73 5.54 6.72 7.63 9.70 12.73 4.7% Coal (dollars per ton)
at the minemouth16 ............................................. 40.0 37.2 43.0 49.7 58.6 68.6 79.8 2.9% Coal (dollars per million Btu)
at the minemouth16 ............................................. 1.98 1.84 2.14 2.48 2.92 3.41 3.96 2.9% Average end-use17 .............................................. 2.59 2.50 2.88 3.33 3.81 4.35 5.00 2.6%
Average electricity (cents per kilowatthour) ........... 9.8 10.1 11.9 13.5 14.8 16.6 19.2 2.4%
1Includes waste coal. 2These values represent the energy obtained from uranium when it is used in light water reactors. The total energy content of uranium is much larger, but
alternative processes are required to take advantage of it. 3Includes grid-connected electricity from wood and wood waste; biomass, such as corn, used for liquid fuels production; and non-electric energy demand from
wood. Refer to Table A17 for details. 4Includes grid-connected electricity from landfill gas; biogenic municipal waste; wind; photovoltaic and solar thermal sources; and non-electric energy from
renewable sources, such as active and passive solar systems. Excludes electricity imports using renewable sources and nonmarketed renewable energy. See Table A17 for selected nonmarketed residential and commercial renewable energy data.
5Includes non-biogenic municipal waste, liquid hydrogen, methanol, and some domestic inputs to refineries. 6Includes imports of finished petroleum products, unfinished oils, alcohols, ethers, blending components, and renewable fuels such as ethanol. 7Includes imports of liquefied natural gas that are later re-exported. 8Includes coal, coal coke (net), and electricity (net). Excludes imports of fuel used in nuclear power plants. 9Includes crude oil, petroleum products, ethanol, and biodiesel. 10Includes re-exported liquefied natural gas. 11Balancing item. Includes unaccounted for supply, losses, gains, and net storage withdrawals. 12Estimated consumption. Includes petroleum-derived fuels and non-petroleum derived fuels, such as ethanol and biodiesel, and coal-based synthetic liquids.
Petroleum coke, which is a solid, is included. Also included are hydrocarbon gas liquids and crude oil consumed as a fuel. Refer to Table A17 for detailed renewable liquid fuels consumption.
13Excludes coal converted to coal-based synthetic liquids and natural gas. 14Includes grid-connected electricity from wood and wood waste, non-electric energy from wood, and biofuels heat and coproducts used in the production of
liquid fuels, but excludes the energy content of the liquid fuels. 15Includes non-biogenic municipal waste, liquid hydrogen, and net electricity imports. 16Includes reported prices for both open market and captive mines. Prices weighted by production, which differs from average minemouth prices published in
EIA data reports where it is weighted by reported sales. 17Prices weighted by consumption; weighted average excludes export free-alongside-ship (f.a.s.) prices. Btu = British thermal unit. - - = Not applicable. Note: Totals may not equal sum of components due to independent rounding. Data for 2012 and 2013 are model results and may differ from official EIA data
reports. Sources: 2012 natural gas supply values: U.S. Energy Information Administration (EIA), Natural Gas Annual 2013, DOE/EIA-0131(2013) (Washington, DC,
October 2014). 2013 natural gas supply values: EIA, Natural Gas Monthly, DOE/EIA-0130(2014/07) (Washington, DC, July 2014). 2012 and 2013 coal minemouth and delivered coal prices: EIA, Annual Coal Report 2013, DOE/EIA-0584(2013) (Washington, DC, January 2015). 2013 petroleum supply values and 2012 crude oil and lease condensate production: EIA, Petroleum Supply Annual 2013, DOE/EIA-0340(2013)/1 (Washington, DC, September 2014). Other 2012 petroleum supply values: EIA, Petroleum Supply Annual 2012, DOE/EIA-0340(2012)/1 (Washington, DC, September 2013). 2012 and 2013 crude oil spot prices and natural gas spot price at Henry Hub: Thomson Reuters. Other 2012 and 2013 coal values: Quarterly Coal Report, October-December 2013, DOE/EIA-0121(2013/4Q) (Washington, DC, March 2014). Other 2012 and 2013 values: EIA, Monthly Energy Review, DOE/EIA-0035(2014/11) (Washington, DC, November 2014). Projections: EIA, AEO2015 National Energy Modeling System run REF2015.D021915A.
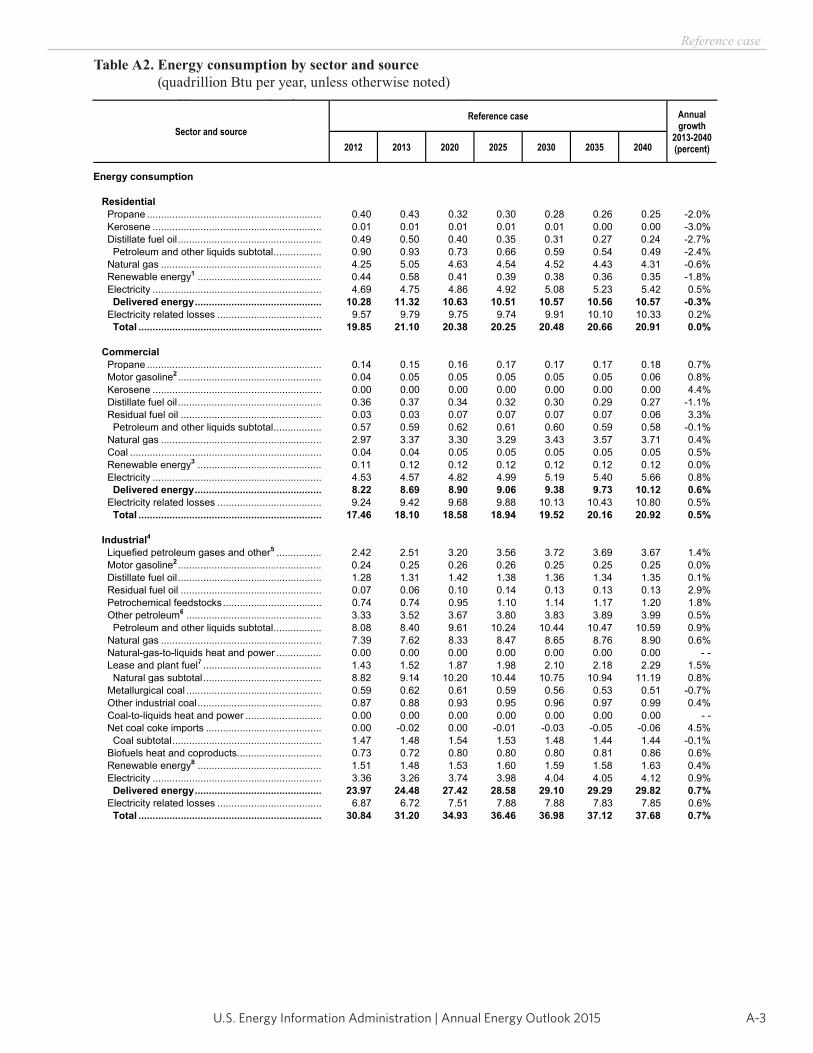
A-3U.S. Energy Information Administration | Annual Energy Outlook 2015
Reference case
Table A2. Energy consumption by sector and source (quadrillion Btu per year, unless otherwise noted)
Energy Information Administration / Annual Energy Outlook 2015
Table A2. Energy consumption by sector and source(quadrillion Btu per year, unless otherwise noted)
Sector and source Reference case Annual
growth 2013-2040(percent) 2012 2013 2020 2025 2030 2035 2040
Energy consumption
Residential Propane .............................................................. 0.40 0.43 0.32 0.30 0.28 0.26 0.25 -2.0% Kerosene ............................................................ 0.01 0.01 0.01 0.01 0.01 0.00 0.00 -3.0% Distillate fuel oil ................................................... 0.49 0.50 0.40 0.35 0.31 0.27 0.24 -2.7%
Petroleum and other liquids subtotal ................. 0.90 0.93 0.73 0.66 0.59 0.54 0.49 -2.4% Natural gas ......................................................... 4.25 5.05 4.63 4.54 4.52 4.43 4.31 -0.6% Renewable energy1 ............................................ 0.44 0.58 0.41 0.39 0.38 0.36 0.35 -1.8% Electricity ............................................................ 4.69 4.75 4.86 4.92 5.08 5.23 5.42 0.5%
Delivered energy ............................................. 10.28 11.32 10.63 10.51 10.57 10.56 10.57 -0.3% Electricity related losses ..................................... 9.57 9.79 9.75 9.74 9.91 10.10 10.33 0.2%
Total ................................................................. 19.85 21.10 20.38 20.25 20.48 20.66 20.91 0.0%
Commercial Propane .............................................................. 0.14 0.15 0.16 0.17 0.17 0.17 0.18 0.7% Motor gasoline2 ................................................... 0.04 0.05 0.05 0.05 0.05 0.05 0.06 0.8% Kerosene ............................................................ 0.00 0.00 0.00 0.00 0.00 0.00 0.00 4.4% Distillate fuel oil ................................................... 0.36 0.37 0.34 0.32 0.30 0.29 0.27 -1.1% Residual fuel oil .................................................. 0.03 0.03 0.07 0.07 0.07 0.07 0.06 3.3%
Petroleum and other liquids subtotal ................. 0.57 0.59 0.62 0.61 0.60 0.59 0.58 -0.1% Natural gas ......................................................... 2.97 3.37 3.30 3.29 3.43 3.57 3.71 0.4% Coal .................................................................... 0.04 0.04 0.05 0.05 0.05 0.05 0.05 0.5% Renewable energy3 ............................................ 0.11 0.12 0.12 0.12 0.12 0.12 0.12 0.0% Electricity ............................................................ 4.53 4.57 4.82 4.99 5.19 5.40 5.66 0.8%
Delivered energy ............................................. 8.22 8.69 8.90 9.06 9.38 9.73 10.12 0.6% Electricity related losses ..................................... 9.24 9.42 9.68 9.88 10.13 10.43 10.80 0.5% Total ................................................................. 17.46 18.10 18.58 18.94 19.52 20.16 20.92 0.5%
Industrial4 Liquefied petroleum gases and other5 ................ 2.42 2.51 3.20 3.56 3.72 3.69 3.67 1.4% Motor gasoline2 ................................................... 0.24 0.25 0.26 0.26 0.25 0.25 0.25 0.0% Distillate fuel oil ................................................... 1.28 1.31 1.42 1.38 1.36 1.34 1.35 0.1% Residual fuel oil .................................................. 0.07 0.06 0.10 0.14 0.13 0.13 0.13 2.9% Petrochemical feedstocks ................................... 0.74 0.74 0.95 1.10 1.14 1.17 1.20 1.8% Other petroleum6 ................................................ 3.33 3.52 3.67 3.80 3.83 3.89 3.99 0.5%
Petroleum and other liquids subtotal ................. 8.08 8.40 9.61 10.24 10.44 10.47 10.59 0.9% Natural gas ......................................................... 7.39 7.62 8.33 8.47 8.65 8.76 8.90 0.6% Natural-gas-to-liquids heat and power ................ 0.00 0.00 0.00 0.00 0.00 0.00 0.00 - - Lease and plant fuel7 .......................................... 1.43 1.52 1.87 1.98 2.10 2.18 2.29 1.5%
Natural gas subtotal .......................................... 8.82 9.14 10.20 10.44 10.75 10.94 11.19 0.8% Metallurgical coal ................................................ 0.59 0.62 0.61 0.59 0.56 0.53 0.51 -0.7% Other industrial coal ............................................ 0.87 0.88 0.93 0.95 0.96 0.97 0.99 0.4% Coal-to-liquids heat and power ........................... 0.00 0.00 0.00 0.00 0.00 0.00 0.00 - - Net coal coke imports ......................................... 0.00 -0.02 0.00 -0.01 -0.03 -0.05 -0.06 4.5%
Coal subtotal ..................................................... 1.47 1.48 1.54 1.53 1.48 1.44 1.44 -0.1% Biofuels heat and coproducts.............................. 0.73 0.72 0.80 0.80 0.80 0.81 0.86 0.6% Renewable energy8 ............................................ 1.51 1.48 1.53 1.60 1.59 1.58 1.63 0.4% Electricity ............................................................ 3.36 3.26 3.74 3.98 4.04 4.05 4.12 0.9%
Delivered energy ............................................. 23.97 24.48 27.42 28.58 29.10 29.29 29.82 0.7% Electricity related losses ..................................... 6.87 6.72 7.51 7.88 7.88 7.83 7.85 0.6%
Total ................................................................. 30.84 31.20 34.93 36.46 36.98 37.12 37.68 0.7%
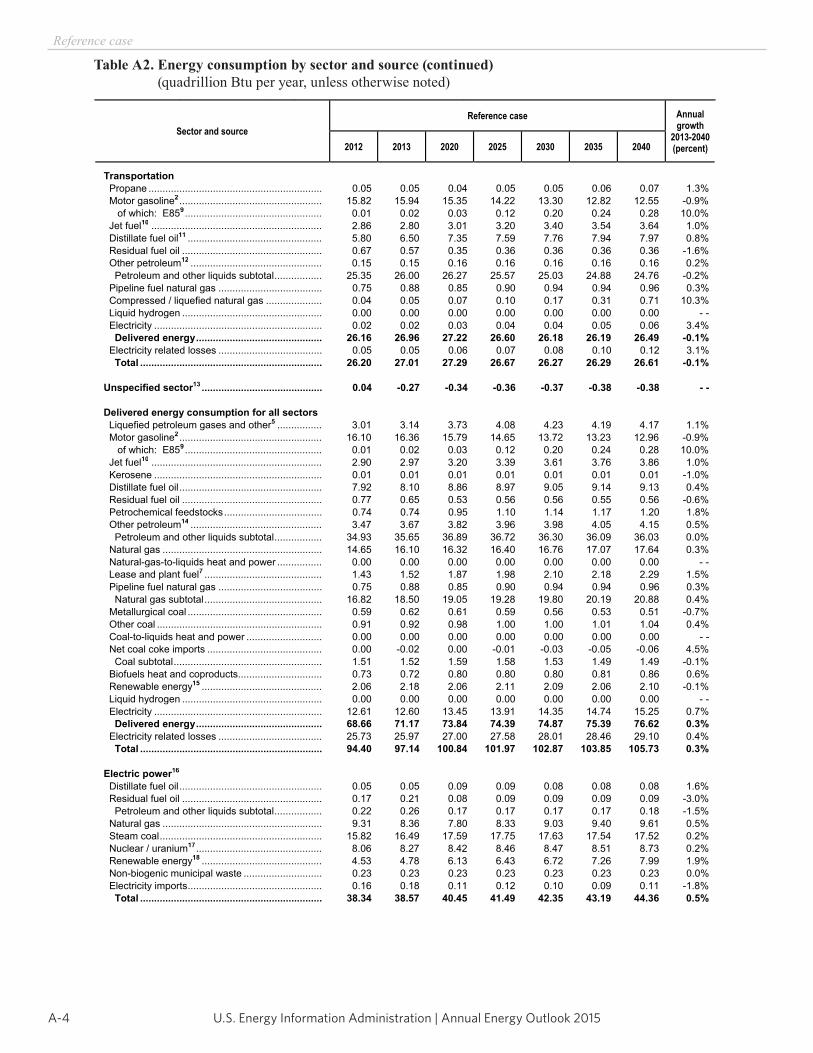
U.S. Energy Information Administration | Annual Energy Outlook 2015A-4
Reference case
Table A2. Energy consumption by sector and source (continued) (quadrillion Btu per year, unless otherwise noted)
Energy Information Administration / Annual Energy Outlook 2015
Table A2. Energy consumption by sector and source (continued)(quadrillion Btu per year, unless otherwise noted)
Sector and source Reference case Annual
growth 2013-2040(percent) 2012 2013 2020 2025 2030 2035 2040
Transportation Propane .............................................................. 0.05 0.05 0.04 0.05 0.05 0.06 0.07 1.3% Motor gasoline2 ................................................... 15.82 15.94 15.35 14.22 13.30 12.82 12.55 -0.9%
of which: E859 ................................................. 0.01 0.02 0.03 0.12 0.20 0.24 0.28 10.0% Jet fuel10 ............................................................. 2.86 2.80 3.01 3.20 3.40 3.54 3.64 1.0% Distillate fuel oil11 ................................................ 5.80 6.50 7.35 7.59 7.76 7.94 7.97 0.8% Residual fuel oil .................................................. 0.67 0.57 0.35 0.36 0.36 0.36 0.36 -1.6% Other petroleum12 ............................................... 0.15 0.15 0.16 0.16 0.16 0.16 0.16 0.2%
Petroleum and other liquids subtotal ................. 25.35 26.00 26.27 25.57 25.03 24.88 24.76 -0.2% Pipeline fuel natural gas ..................................... 0.75 0.88 0.85 0.90 0.94 0.94 0.96 0.3% Compressed / liquefied natural gas .................... 0.04 0.05 0.07 0.10 0.17 0.31 0.71 10.3% Liquid hydrogen .................................................. 0.00 0.00 0.00 0.00 0.00 0.00 0.00 - - Electricity ............................................................ 0.02 0.02 0.03 0.04 0.04 0.05 0.06 3.4%
Delivered energy ............................................. 26.16 26.96 27.22 26.60 26.18 26.19 26.49 -0.1% Electricity related losses ..................................... 0.05 0.05 0.06 0.07 0.08 0.10 0.12 3.1%
Total ................................................................. 26.20 27.01 27.29 26.67 26.27 26.29 26.61 -0.1%
Unspecified sector13 ........................................... 0.04 -0.27 -0.34 -0.36 -0.37 -0.38 -0.38 - -
Delivered energy consumption for all sectors Liquefied petroleum gases and other5 ................ 3.01 3.14 3.73 4.08 4.23 4.19 4.17 1.1% Motor gasoline2 ................................................... 16.10 16.36 15.79 14.65 13.72 13.23 12.96 -0.9%
of which: E859 ................................................. 0.01 0.02 0.03 0.12 0.20 0.24 0.28 10.0% Jet fuel10 ............................................................. 2.90 2.97 3.20 3.39 3.61 3.76 3.86 1.0% Kerosene ............................................................ 0.01 0.01 0.01 0.01 0.01 0.01 0.01 -1.0% Distillate fuel oil ................................................... 7.92 8.10 8.86 8.97 9.05 9.14 9.13 0.4% Residual fuel oil .................................................. 0.77 0.65 0.53 0.56 0.56 0.55 0.56 -0.6% Petrochemical feedstocks ................................... 0.74 0.74 0.95 1.10 1.14 1.17 1.20 1.8% Other petroleum14 ............................................... 3.47 3.67 3.82 3.96 3.98 4.05 4.15 0.5%
Petroleum and other liquids subtotal ................. 34.93 35.65 36.89 36.72 36.30 36.09 36.03 0.0% Natural gas ......................................................... 14.65 16.10 16.32 16.40 16.76 17.07 17.64 0.3% Natural-gas-to-liquids heat and power ................ 0.00 0.00 0.00 0.00 0.00 0.00 0.00 - - Lease and plant fuel7 .......................................... 1.43 1.52 1.87 1.98 2.10 2.18 2.29 1.5% Pipeline fuel natural gas ..................................... 0.75 0.88 0.85 0.90 0.94 0.94 0.96 0.3%
Natural gas subtotal .......................................... 16.82 18.50 19.05 19.28 19.80 20.19 20.88 0.4% Metallurgical coal ................................................ 0.59 0.62 0.61 0.59 0.56 0.53 0.51 -0.7% Other coal ........................................................... 0.91 0.92 0.98 1.00 1.00 1.01 1.04 0.4% Coal-to-liquids heat and power ........................... 0.00 0.00 0.00 0.00 0.00 0.00 0.00 - - Net coal coke imports ......................................... 0.00 -0.02 0.00 -0.01 -0.03 -0.05 -0.06 4.5%
Coal subtotal ..................................................... 1.51 1.52 1.59 1.58 1.53 1.49 1.49 -0.1% Biofuels heat and coproducts.............................. 0.73 0.72 0.80 0.80 0.80 0.81 0.86 0.6% Renewable energy15 ........................................... 2.06 2.18 2.06 2.11 2.09 2.06 2.10 -0.1% Liquid hydrogen .................................................. 0.00 0.00 0.00 0.00 0.00 0.00 0.00 - - Electricity ............................................................ 12.61 12.60 13.45 13.91 14.35 14.74 15.25 0.7%
Delivered energy ............................................. 68.66 71.17 73.84 74.39 74.87 75.39 76.62 0.3% Electricity related losses ..................................... 25.73 25.97 27.00 27.58 28.01 28.46 29.10 0.4%
Total ................................................................. 94.40 97.14 100.84 101.97 102.87 103.85 105.73 0.3%
Electric power16
Distillate fuel oil ................................................... 0.05 0.05 0.09 0.09 0.08 0.08 0.08 1.6% Residual fuel oil .................................................. 0.17 0.21 0.08 0.09 0.09 0.09 0.09 -3.0%
Petroleum and other liquids subtotal ................. 0.22 0.26 0.17 0.17 0.17 0.17 0.18 -1.5% Natural gas ......................................................... 9.31 8.36 7.80 8.33 9.03 9.40 9.61 0.5% Steam coal .......................................................... 15.82 16.49 17.59 17.75 17.63 17.54 17.52 0.2% Nuclear / uranium17 ............................................. 8.06 8.27 8.42 8.46 8.47 8.51 8.73 0.2% Renewable energy18 ........................................... 4.53 4.78 6.13 6.43 6.72 7.26 7.99 1.9% Non-biogenic municipal waste ............................ 0.23 0.23 0.23 0.23 0.23 0.23 0.23 0.0% Electricity imports ................................................ 0.16 0.18 0.11 0.12 0.10 0.09 0.11 -1.8%
Total ................................................................. 38.34 38.57 40.45 41.49 42.35 43.19 44.36 0.5%
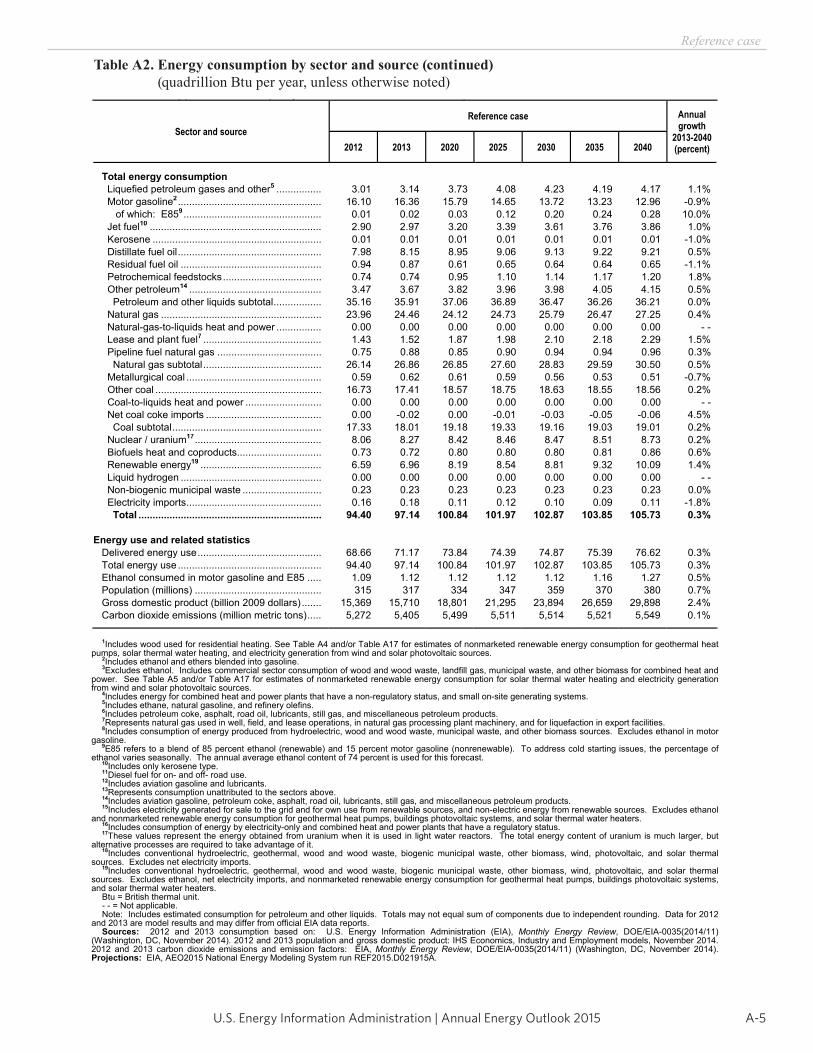
A-5U.S. Energy Information Administration | Annual Energy Outlook 2015
Reference case
Table A2. Energy consumption by sector and source (continued) (quadrillion Btu per year, unless otherwise noted)
Energy Information Administration / Annual Energy Outlook 2015
Table A2. Energy consumption by sector and source (continued)(quadrillion Btu per year, unless otherwise noted)
Sector and source Reference case Annual
growth 2013-2040(percent) 2012 2013 2020 2025 2030 2035 2040
Total energy consumption Liquefied petroleum gases and other5 ................ 3.01 3.14 3.73 4.08 4.23 4.19 4.17 1.1% Motor gasoline2 ................................................... 16.10 16.36 15.79 14.65 13.72 13.23 12.96 -0.9%
of which: E859 ................................................. 0.01 0.02 0.03 0.12 0.20 0.24 0.28 10.0% Jet fuel10 ............................................................. 2.90 2.97 3.20 3.39 3.61 3.76 3.86 1.0% Kerosene ............................................................ 0.01 0.01 0.01 0.01 0.01 0.01 0.01 -1.0% Distillate fuel oil ................................................... 7.98 8.15 8.95 9.06 9.13 9.22 9.21 0.5% Residual fuel oil .................................................. 0.94 0.87 0.61 0.65 0.64 0.64 0.65 -1.1% Petrochemical feedstocks ................................... 0.74 0.74 0.95 1.10 1.14 1.17 1.20 1.8% Other petroleum14 ............................................... 3.47 3.67 3.82 3.96 3.98 4.05 4.15 0.5%
Petroleum and other liquids subtotal ................. 35.16 35.91 37.06 36.89 36.47 36.26 36.21 0.0% Natural gas ......................................................... 23.96 24.46 24.12 24.73 25.79 26.47 27.25 0.4% Natural-gas-to-liquids heat and power ................ 0.00 0.00 0.00 0.00 0.00 0.00 0.00 - - Lease and plant fuel7 .......................................... 1.43 1.52 1.87 1.98 2.10 2.18 2.29 1.5% Pipeline fuel natural gas ..................................... 0.75 0.88 0.85 0.90 0.94 0.94 0.96 0.3%
Natural gas subtotal .......................................... 26.14 26.86 26.85 27.60 28.83 29.59 30.50 0.5% Metallurgical coal ................................................ 0.59 0.62 0.61 0.59 0.56 0.53 0.51 -0.7% Other coal ........................................................... 16.73 17.41 18.57 18.75 18.63 18.55 18.56 0.2% Coal-to-liquids heat and power ........................... 0.00 0.00 0.00 0.00 0.00 0.00 0.00 - - Net coal coke imports ......................................... 0.00 -0.02 0.00 -0.01 -0.03 -0.05 -0.06 4.5%
Coal subtotal ..................................................... 17.33 18.01 19.18 19.33 19.16 19.03 19.01 0.2% Nuclear / uranium17 ............................................. 8.06 8.27 8.42 8.46 8.47 8.51 8.73 0.2% Biofuels heat and coproducts.............................. 0.73 0.72 0.80 0.80 0.80 0.81 0.86 0.6% Renewable energy19 ........................................... 6.59 6.96 8.19 8.54 8.81 9.32 10.09 1.4% Liquid hydrogen .................................................. 0.00 0.00 0.00 0.00 0.00 0.00 0.00 - - Non-biogenic municipal waste ............................ 0.23 0.23 0.23 0.23 0.23 0.23 0.23 0.0% Electricity imports ................................................ 0.16 0.18 0.11 0.12 0.10 0.09 0.11 -1.8%
Total ................................................................. 94.40 97.14 100.84 101.97 102.87 103.85 105.73 0.3%
Energy use and related statistics Delivered energy use ............................................ 68.66 71.17 73.84 74.39 74.87 75.39 76.62 0.3% Total energy use ................................................... 94.40 97.14 100.84 101.97 102.87 103.85 105.73 0.3% Ethanol consumed in motor gasoline and E85 ..... 1.09 1.12 1.12 1.12 1.12 1.16 1.27 0.5% Population (millions) ............................................. 315 317 334 347 359 370 380 0.7% Gross domestic product (billion 2009 dollars) ....... 15,369 15,710 18,801 21,295 23,894 26,659 29,898 2.4% Carbon dioxide emissions (million metric tons) ..... 5,272 5,405 5,499 5,511 5,514 5,521 5,549 0.1%
1Includes wood used for residential heating. See Table A4 and/or Table A17 for estimates of nonmarketed renewable energy consumption for geothermal heat pumps, solar thermal water heating, and electricity generation from wind and solar photovoltaic sources.
2Includes ethanol and ethers blended into gasoline. 3Excludes ethanol. Includes commercial sector consumption of wood and wood waste, landfill gas, municipal waste, and other biomass for combined heat and
power. See Table A5 and/or Table A17 for estimates of nonmarketed renewable energy consumption for solar thermal water heating and electricity generation from wind and solar photovoltaic sources.
4Includes energy for combined heat and power plants that have a non-regulatory status, and small on-site generating systems. 5Includes ethane, natural gasoline, and refinery olefins. 6Includes petroleum coke, asphalt, road oil, lubricants, still gas, and miscellaneous petroleum products. 7Represents natural gas used in well, field, and lease operations, in natural gas processing plant machinery, and for liquefaction in export facilities. 8Includes consumption of energy produced from hydroelectric, wood and wood waste, municipal waste, and other biomass sources. Excludes ethanol in motor
gasoline. 9E85 refers to a blend of 85 percent ethanol (renewable) and 15 percent motor gasoline (nonrenewable). To address cold starting issues, the percentage of
ethanol varies seasonally. The annual average ethanol content of 74 percent is used for this forecast. 10Includes only kerosene type. 11Diesel fuel for on- and off- road use. 12Includes aviation gasoline and lubricants. 13Represents consumption unattributed to the sectors above. 14Includes aviation gasoline, petroleum coke, asphalt, road oil, lubricants, still gas, and miscellaneous petroleum products. 15Includes electricity generated for sale to the grid and for own use from renewable sources, and non-electric energy from renewable sources. Excludes ethanol
and nonmarketed renewable energy consumption for geothermal heat pumps, buildings photovoltaic systems, and solar thermal water heaters. 16Includes consumption of energy by electricity-only and combined heat and power plants that have a regulatory status. 17These values represent the energy obtained from uranium when it is used in light water reactors. The total energy content of uranium is much larger, but
alternative processes are required to take advantage of it. 18Includes conventional hydroelectric, geothermal, wood and wood waste, biogenic municipal waste, other biomass, wind, photovoltaic, and solar thermal
sources. Excludes net electricity imports. 19Includes conventional hydroelectric, geothermal, wood and wood waste, biogenic municipal waste, other biomass, wind, photovoltaic, and solar thermal
sources. Excludes ethanol, net electricity imports, and nonmarketed renewable energy consumption for geothermal heat pumps, buildings photovoltaic systems, and solar thermal water heaters.
Btu = British thermal unit. - - = Not applicable. Note: Includes estimated consumption for petroleum and other liquids. Totals may not equal sum of components due to independent rounding. Data for 2012
and 2013 are model results and may differ from official EIA data reports. Sources: 2012 and 2013 consumption based on: U.S. Energy Information Administration (EIA), Monthly Energy Review, DOE/EIA-0035(2014/11)
(Washington, DC, November 2014). 2012 and 2013 population and gross domestic product: IHS Economics, Industry and Employment models, November 2014. 2012 and 2013 carbon dioxide emissions and emission factors: EIA, Monthly Energy Review, DOE/EIA-0035(2014/11) (Washington, DC, November 2014). Projections: EIA, AEO2015 National Energy Modeling System run REF2015.D021915A.
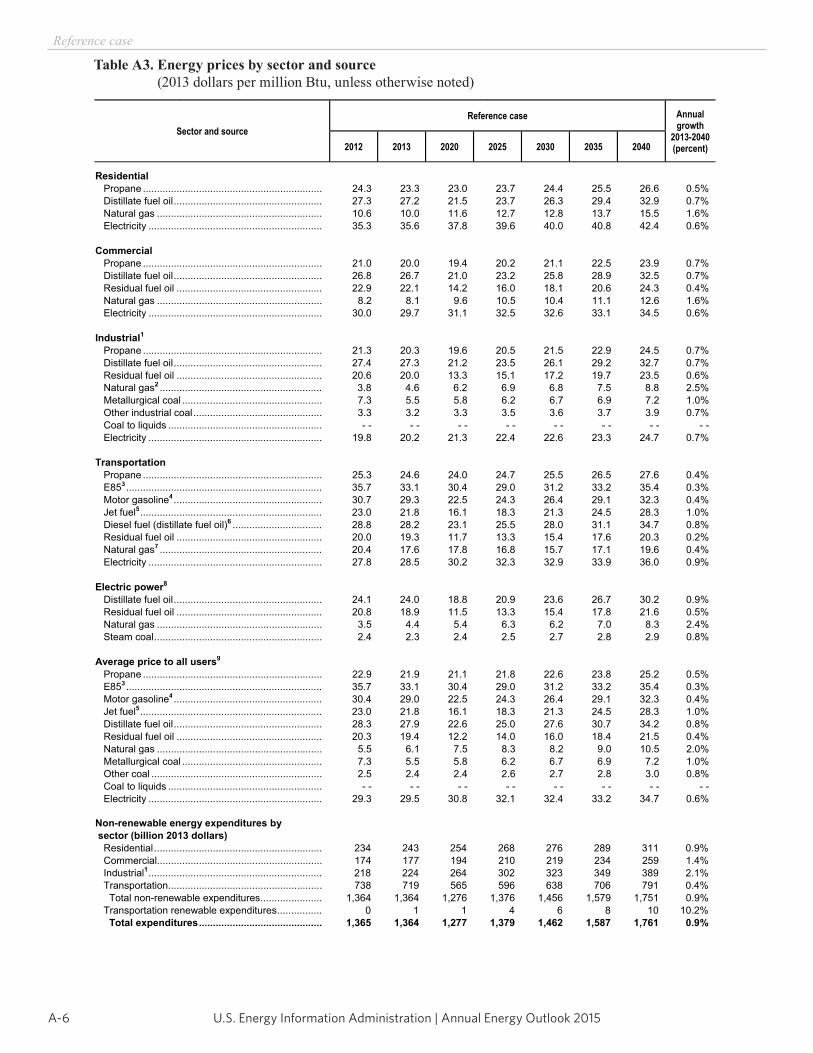
U.S. Energy Information Administration | Annual Energy Outlook 2015A-6
Reference case
Energy Information Administration / Annual Energy Outlook 2015
Table A3. Energy prices by sector and source(2013 dollars per million Btu, unless otherwise noted)
Sector and source Reference case Annual
growth 2013-2040(percent) 2012 2013 2020 2025 2030 2035 2040
Residential Propane ................................................................ 24.3 23.3 23.0 23.7 24.4 25.5 26.6 0.5% Distillate fuel oil ..................................................... 27.3 27.2 21.5 23.7 26.3 29.4 32.9 0.7% Natural gas ........................................................... 10.6 10.0 11.6 12.7 12.8 13.7 15.5 1.6% Electricity .............................................................. 35.3 35.6 37.8 39.6 40.0 40.8 42.4 0.6%
Commercial Propane ................................................................ 21.0 20.0 19.4 20.2 21.1 22.5 23.9 0.7% Distillate fuel oil ..................................................... 26.8 26.7 21.0 23.2 25.8 28.9 32.5 0.7% Residual fuel oil .................................................... 22.9 22.1 14.2 16.0 18.1 20.6 24.3 0.4% Natural gas ........................................................... 8.2 8.1 9.6 10.5 10.4 11.1 12.6 1.6% Electricity .............................................................. 30.0 29.7 31.1 32.5 32.6 33.1 34.5 0.6%
Industrial1 Propane ................................................................ 21.3 20.3 19.6 20.5 21.5 22.9 24.5 0.7% Distillate fuel oil ..................................................... 27.4 27.3 21.2 23.5 26.1 29.2 32.7 0.7% Residual fuel oil .................................................... 20.6 20.0 13.3 15.1 17.2 19.7 23.5 0.6% Natural gas2 .......................................................... 3.8 4.6 6.2 6.9 6.8 7.5 8.8 2.5% Metallurgical coal .................................................. 7.3 5.5 5.8 6.2 6.7 6.9 7.2 1.0% Other industrial coal .............................................. 3.3 3.2 3.3 3.5 3.6 3.7 3.9 0.7% Coal to liquids ....................................................... - - - - - - - - - - - - - - - - Electricity .............................................................. 19.8 20.2 21.3 22.4 22.6 23.3 24.7 0.7%
Transportation Propane ................................................................ 25.3 24.6 24.0 24.7 25.5 26.5 27.6 0.4% E853 ...................................................................... 35.7 33.1 30.4 29.0 31.2 33.2 35.4 0.3% Motor gasoline4 ..................................................... 30.7 29.3 22.5 24.3 26.4 29.1 32.3 0.4% Jet fuel5 ................................................................. 23.0 21.8 16.1 18.3 21.3 24.5 28.3 1.0% Diesel fuel (distillate fuel oil)6 ................................ 28.8 28.2 23.1 25.5 28.0 31.1 34.7 0.8% Residual fuel oil .................................................... 20.0 19.3 11.7 13.3 15.4 17.6 20.3 0.2% Natural gas7 .......................................................... 20.4 17.6 17.8 16.8 15.7 17.1 19.6 0.4% Electricity .............................................................. 27.8 28.5 30.2 32.3 32.9 33.9 36.0 0.9%
Electric power8
Distillate fuel oil ..................................................... 24.1 24.0 18.8 20.9 23.6 26.7 30.2 0.9% Residual fuel oil .................................................... 20.8 18.9 11.5 13.3 15.4 17.8 21.6 0.5% Natural gas ........................................................... 3.5 4.4 5.4 6.3 6.2 7.0 8.3 2.4% Steam coal ............................................................ 2.4 2.3 2.4 2.5 2.7 2.8 2.9 0.8%
Average price to all users9
Propane ................................................................ 22.9 21.9 21.1 21.8 22.6 23.8 25.2 0.5% E853 ...................................................................... 35.7 33.1 30.4 29.0 31.2 33.2 35.4 0.3% Motor gasoline4 ..................................................... 30.4 29.0 22.5 24.3 26.4 29.1 32.3 0.4% Jet fuel5 ................................................................. 23.0 21.8 16.1 18.3 21.3 24.5 28.3 1.0% Distillate fuel oil ..................................................... 28.3 27.9 22.6 25.0 27.6 30.7 34.2 0.8% Residual fuel oil .................................................... 20.3 19.4 12.2 14.0 16.0 18.4 21.5 0.4% Natural gas ........................................................... 5.5 6.1 7.5 8.3 8.2 9.0 10.5 2.0% Metallurgical coal .................................................. 7.3 5.5 5.8 6.2 6.7 6.9 7.2 1.0% Other coal ............................................................. 2.5 2.4 2.4 2.6 2.7 2.8 3.0 0.8% Coal to liquids ....................................................... - - - - - - - - - - - - - - - - Electricity .............................................................. 29.3 29.5 30.8 32.1 32.4 33.2 34.7 0.6%
Non-renewable energy expenditures by sector (billion 2013 dollars) Residential ............................................................ 234 243 254 268 276 289 311 0.9% Commercial........................................................... 174 177 194 210 219 234 259 1.4% Industrial1 .............................................................. 218 224 264 302 323 349 389 2.1% Transportation ....................................................... 738 719 565 596 638 706 791 0.4% Total non-renewable expenditures ...................... 1,364 1,364 1,276 1,376 1,456 1,579 1,751 0.9% Transportation renewable expenditures ................ 0 1 1 4 6 8 10 10.2% Total expenditures ............................................ 1,365 1,364 1,277 1,379 1,462 1,587 1,761 0.9%
Table A3. Energy prices by sector and source (2013 dollars per million Btu, unless otherwise noted)
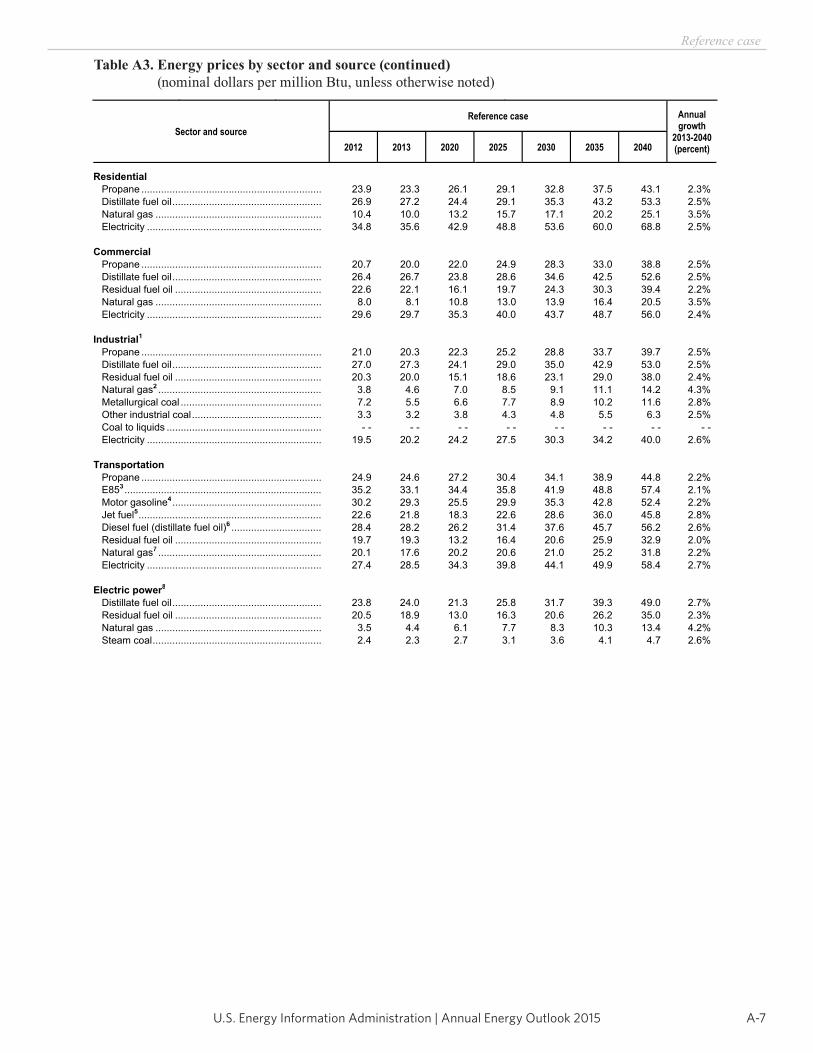
A-7U.S. Energy Information Administration | Annual Energy Outlook 2015
Reference case
Table A3. Energy prices by sector and source (continued) (nominal dollars per million Btu, unless otherwise noted)
Energy Information Administration / Annual Energy Outlook 2015
Table A3. Energy prices by sector and source (continued)(nominal dollars per million Btu, unless otherwise noted)
Sector and source Reference case Annual
growth 2013-2040(percent) 2012 2013 2020 2025 2030 2035 2040
Residential Propane ................................................................ 23.9 23.3 26.1 29.1 32.8 37.5 43.1 2.3% Distillate fuel oil ..................................................... 26.9 27.2 24.4 29.1 35.3 43.2 53.3 2.5% Natural gas ........................................................... 10.4 10.0 13.2 15.7 17.1 20.2 25.1 3.5% Electricity .............................................................. 34.8 35.6 42.9 48.8 53.6 60.0 68.8 2.5%
Commercial Propane ................................................................ 20.7 20.0 22.0 24.9 28.3 33.0 38.8 2.5% Distillate fuel oil ..................................................... 26.4 26.7 23.8 28.6 34.6 42.5 52.6 2.5% Residual fuel oil .................................................... 22.6 22.1 16.1 19.7 24.3 30.3 39.4 2.2% Natural gas ........................................................... 8.0 8.1 10.8 13.0 13.9 16.4 20.5 3.5% Electricity .............................................................. 29.6 29.7 35.3 40.0 43.7 48.7 56.0 2.4%
Industrial1 Propane ................................................................ 21.0 20.3 22.3 25.2 28.8 33.7 39.7 2.5% Distillate fuel oil ..................................................... 27.0 27.3 24.1 29.0 35.0 42.9 53.0 2.5% Residual fuel oil .................................................... 20.3 20.0 15.1 18.6 23.1 29.0 38.0 2.4% Natural gas2 .......................................................... 3.8 4.6 7.0 8.5 9.1 11.1 14.2 4.3% Metallurgical coal .................................................. 7.2 5.5 6.6 7.7 8.9 10.2 11.6 2.8% Other industrial coal .............................................. 3.3 3.2 3.8 4.3 4.8 5.5 6.3 2.5% Coal to liquids ....................................................... - - - - - - - - - - - - - - - - Electricity .............................................................. 19.5 20.2 24.2 27.5 30.3 34.2 40.0 2.6%
Transportation Propane ................................................................ 24.9 24.6 27.2 30.4 34.1 38.9 44.8 2.2% E853 ...................................................................... 35.2 33.1 34.4 35.8 41.9 48.8 57.4 2.1% Motor gasoline4 ..................................................... 30.2 29.3 25.5 29.9 35.3 42.8 52.4 2.2% Jet fuel5 ................................................................. 22.6 21.8 18.3 22.6 28.6 36.0 45.8 2.8% Diesel fuel (distillate fuel oil)6 ................................ 28.4 28.2 26.2 31.4 37.6 45.7 56.2 2.6% Residual fuel oil .................................................... 19.7 19.3 13.2 16.4 20.6 25.9 32.9 2.0% Natural gas7 .......................................................... 20.1 17.6 20.2 20.6 21.0 25.2 31.8 2.2% Electricity .............................................................. 27.4 28.5 34.3 39.8 44.1 49.9 58.4 2.7%
Electric power8
Distillate fuel oil ..................................................... 23.8 24.0 21.3 25.8 31.7 39.3 49.0 2.7% Residual fuel oil .................................................... 20.5 18.9 13.0 16.3 20.6 26.2 35.0 2.3% Natural gas ........................................................... 3.5 4.4 6.1 7.7 8.3 10.3 13.4 4.2% Steam coal ............................................................ 2.4 2.3 2.7 3.1 3.6 4.1 4.7 2.6%
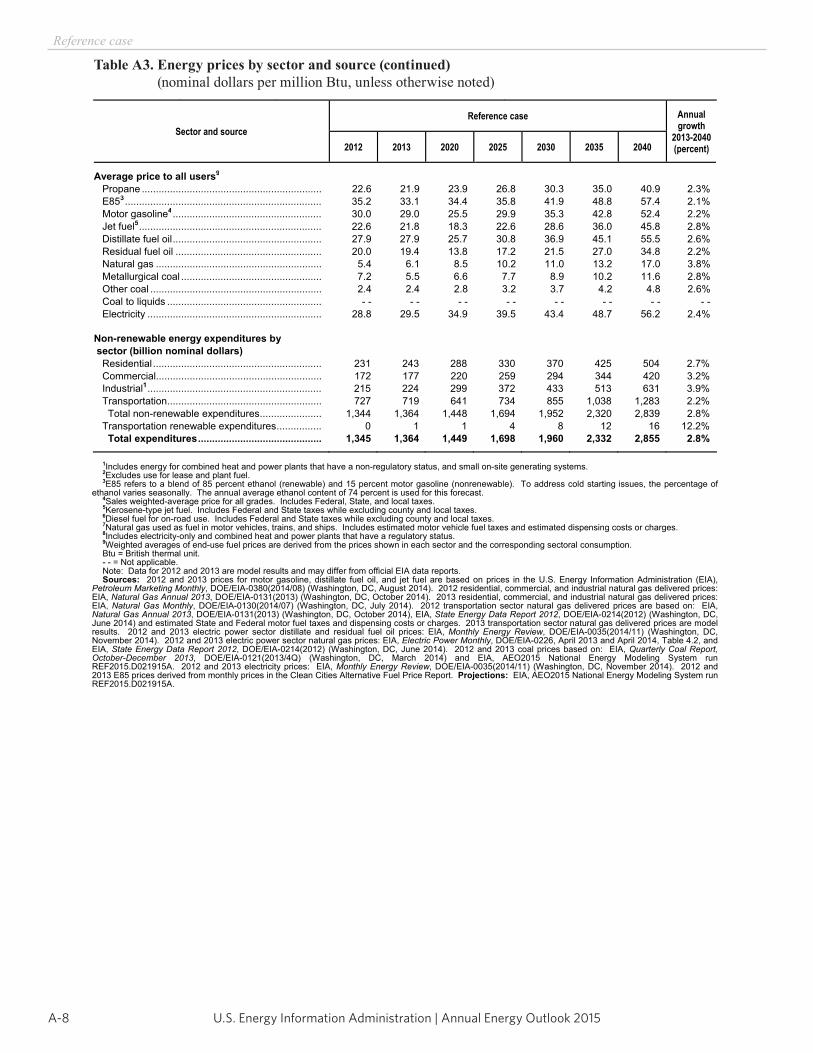
U.S. Energy Information Administration | Annual Energy Outlook 2015A-8
Reference case
Table A3. Energy prices by sector and source (continued) (nominal dollars per million Btu, unless otherwise noted)
Energy Information Administration / Annual Energy Outlook 2015
Table A3. Energy prices by sector and source (continued)(nominal dollars per million Btu, unless otherwise noted)
Sector and source Reference case Annual
growth 2013-2040(percent) 2012 2013 2020 2025 2030 2035 2040
Average price to all users9
Propane ................................................................ 22.6 21.9 23.9 26.8 30.3 35.0 40.9 2.3% E853 ...................................................................... 35.2 33.1 34.4 35.8 41.9 48.8 57.4 2.1% Motor gasoline4 ..................................................... 30.0 29.0 25.5 29.9 35.3 42.8 52.4 2.2% Jet fuel5 ................................................................. 22.6 21.8 18.3 22.6 28.6 36.0 45.8 2.8% Distillate fuel oil ..................................................... 27.9 27.9 25.7 30.8 36.9 45.1 55.5 2.6% Residual fuel oil .................................................... 20.0 19.4 13.8 17.2 21.5 27.0 34.8 2.2% Natural gas ........................................................... 5.4 6.1 8.5 10.2 11.0 13.2 17.0 3.8% Metallurgical coal .................................................. 7.2 5.5 6.6 7.7 8.9 10.2 11.6 2.8% Other coal ............................................................. 2.4 2.4 2.8 3.2 3.7 4.2 4.8 2.6% Coal to liquids ....................................................... - - - - - - - - - - - - - - - - Electricity .............................................................. 28.8 29.5 34.9 39.5 43.4 48.7 56.2 2.4%
Non-renewable energy expenditures by sector (billion nominal dollars) Residential ............................................................ 231 243 288 330 370 425 504 2.7% Commercial........................................................... 172 177 220 259 294 344 420 3.2% Industrial1 .............................................................. 215 224 299 372 433 513 631 3.9% Transportation ....................................................... 727 719 641 734 855 1,038 1,283 2.2%
Total non-renewable expenditures ...................... 1,344 1,364 1,448 1,694 1,952 2,320 2,839 2.8% Transportation renewable expenditures ................ 0 1 1 4 8 12 16 12.2% Total expenditures ............................................ 1,345 1,364 1,449 1,698 1,960 2,332 2,855 2.8%
1Includes energy for combined heat and power plants that have a non-regulatory status, and small on-site generating systems. 2Excludes use for lease and plant fuel. 3E85 refers to a blend of 85 percent ethanol (renewable) and 15 percent motor gasoline (nonrenewable). To address cold starting issues, the percentage of
ethanol varies seasonally. The annual average ethanol content of 74 percent is used for this forecast. 4Sales weighted-average price for all grades. Includes Federal, State, and local taxes. 5Kerosene-type jet fuel. Includes Federal and State taxes while excluding county and local taxes. 6Diesel fuel for on-road use. Includes Federal and State taxes while excluding county and local taxes. 7Natural gas used as fuel in motor vehicles, trains, and ships. Includes estimated motor vehicle fuel taxes and estimated dispensing costs or charges. 8Includes electricity-only and combined heat and power plants that have a regulatory status. 9Weighted averages of end-use fuel prices are derived from the prices shown in each sector and the corresponding sectoral consumption. Btu = British thermal unit. - - = Not applicable. Note: Data for 2012 and 2013 are model results and may differ from official EIA data reports. Sources: 2012 and 2013 prices for motor gasoline, distillate fuel oil, and jet fuel are based on prices in the U.S. Energy Information Administration (EIA),
Petroleum Marketing Monthly, DOE/EIA-0380(2014/08) (Washington, DC, August 2014). 2012 residential, commercial, and industrial natural gas delivered prices:EIA, Natural Gas Annual 2013, DOE/EIA-0131(2013) (Washington, DC, October 2014). 2013 residential, commercial, and industrial natural gas delivered prices:EIA, Natural Gas Monthly, DOE/EIA-0130(2014/07) (Washington, DC, July 2014). 2012 transportation sector natural gas delivered prices are based on: EIA,Natural Gas Annual 2013, DOE/EIA-0131(2013) (Washington, DC, October 2014), EIA, State Energy Data Report 2012, DOE/EIA-0214(2012) (Washington, DC, June 2014) and estimated State and Federal motor fuel taxes and dispensing costs or charges. 2013 transportation sector natural gas delivered prices are model results. 2012 and 2013 electric power sector distillate and residual fuel oil prices: EIA, Monthly Energy Review, DOE/EIA-0035(2014/11) (Washington, DC, November 2014). 2012 and 2013 electric power sector natural gas prices: EIA, Electric Power Monthly, DOE/EIA-0226, April 2013 and April 2014, Table 4.2, and EIA, State Energy Data Report 2012, DOE/EIA-0214(2012) (Washington, DC, June 2014). 2012 and 2013 coal prices based on: EIA, Quarterly Coal Report, October-December 2013, DOE/EIA-0121(2013/4Q) (Washington, DC, March 2014) and EIA, AEO2015 National Energy Modeling System run REF2015.D021915A. 2012 and 2013 electricity prices: EIA, Monthly Energy Review, DOE/EIA-0035(2014/11) (Washington, DC, November 2014). 2012 and 2013 E85 prices derived from monthly prices in the Clean Cities Alternative Fuel Price Report. Projections: EIA, AEO2015 National Energy Modeling System run REF2015.D021915A.
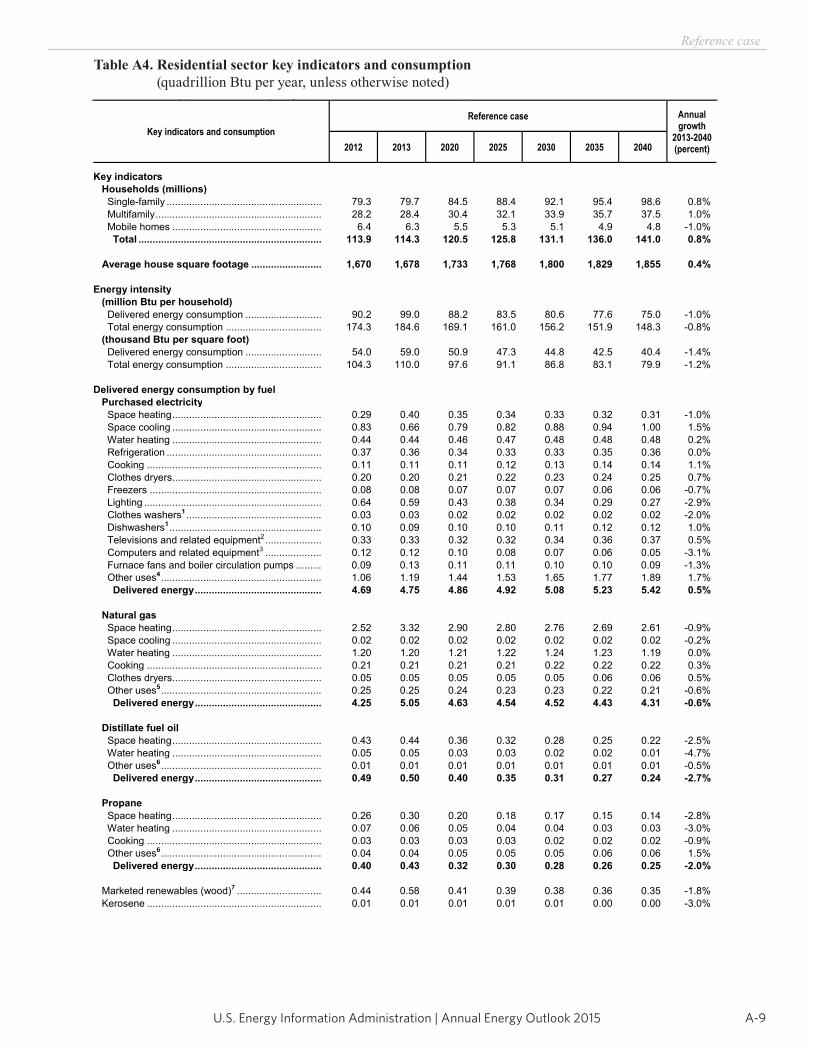
A-9U.S. Energy Information Administration | Annual Energy Outlook 2015
Reference case
Table A4. Residential sector key indicators and consumption (quadrillion Btu per year, unless otherwise noted)
Energy Information Administration / Annual Energy Outlook 2015
Table A4. Residential sector key indicators and consumption(quadrillion Btu per year, unless otherwise noted)
Key indicators and consumption Reference case Annual
growth 2013-2040(percent) 2012 2013 2020 2025 2030 2035 2040
Key indicators Households (millions) Single-family ....................................................... 79.3 79.7 84.5 88.4 92.1 95.4 98.6 0.8% Multifamily ........................................................... 28.2 28.4 30.4 32.1 33.9 35.7 37.5 1.0% Mobile homes ..................................................... 6.4 6.3 5.5 5.3 5.1 4.9 4.8 -1.0%
Total ................................................................. 113.9 114.3 120.5 125.8 131.1 136.0 141.0 0.8%
Average house square footage ......................... 1,670 1,678 1,733 1,768 1,800 1,829 1,855 0.4%
Energy intensity (million Btu per household) Delivered energy consumption ........................... 90.2 99.0 88.2 83.5 80.6 77.6 75.0 -1.0% Total energy consumption .................................. 174.3 184.6 169.1 161.0 156.2 151.9 148.3 -0.8% (thousand Btu per square foot) Delivered energy consumption ........................... 54.0 59.0 50.9 47.3 44.8 42.5 40.4 -1.4% Total energy consumption .................................. 104.3 110.0 97.6 91.1 86.8 83.1 79.9 -1.2%
Delivered energy consumption by fuel Purchased electricity Space heating ..................................................... 0.29 0.40 0.35 0.34 0.33 0.32 0.31 -1.0% Space cooling ..................................................... 0.83 0.66 0.79 0.82 0.88 0.94 1.00 1.5% Water heating ..................................................... 0.44 0.44 0.46 0.47 0.48 0.48 0.48 0.2% Refrigeration ....................................................... 0.37 0.36 0.34 0.33 0.33 0.35 0.36 0.0% Cooking .............................................................. 0.11 0.11 0.11 0.12 0.13 0.14 0.14 1.1% Clothes dryers ..................................................... 0.20 0.20 0.21 0.22 0.23 0.24 0.25 0.7% Freezers ............................................................. 0.08 0.08 0.07 0.07 0.07 0.06 0.06 -0.7% Lighting ............................................................... 0.64 0.59 0.43 0.38 0.34 0.29 0.27 -2.9% Clothes washers1 ................................................ 0.03 0.03 0.02 0.02 0.02 0.02 0.02 -2.0% Dishwashers1 ...................................................... 0.10 0.09 0.10 0.10 0.11 0.12 0.12 1.0% Televisions and related equipment2 .................... 0.33 0.33 0.32 0.32 0.34 0.36 0.37 0.5% Computers and related equipment3 .................... 0.12 0.12 0.10 0.08 0.07 0.06 0.05 -3.1% Furnace fans and boiler circulation pumps ......... 0.09 0.13 0.11 0.11 0.10 0.10 0.09 -1.3% Other uses4 ......................................................... 1.06 1.19 1.44 1.53 1.65 1.77 1.89 1.7%
Delivered energy ............................................. 4.69 4.75 4.86 4.92 5.08 5.23 5.42 0.5%
Natural gas Space heating ..................................................... 2.52 3.32 2.90 2.80 2.76 2.69 2.61 -0.9% Space cooling ..................................................... 0.02 0.02 0.02 0.02 0.02 0.02 0.02 -0.2% Water heating ..................................................... 1.20 1.20 1.21 1.22 1.24 1.23 1.19 0.0% Cooking .............................................................. 0.21 0.21 0.21 0.21 0.22 0.22 0.22 0.3% Clothes dryers ..................................................... 0.05 0.05 0.05 0.05 0.05 0.06 0.06 0.5% Other uses5 ......................................................... 0.25 0.25 0.24 0.23 0.23 0.22 0.21 -0.6%
Delivered energy ............................................. 4.25 5.05 4.63 4.54 4.52 4.43 4.31 -0.6%
Distillate fuel oil Space heating ..................................................... 0.43 0.44 0.36 0.32 0.28 0.25 0.22 -2.5% Water heating ..................................................... 0.05 0.05 0.03 0.03 0.02 0.02 0.01 -4.7% Other uses6 ......................................................... 0.01 0.01 0.01 0.01 0.01 0.01 0.01 -0.5%
Delivered energy ............................................. 0.49 0.50 0.40 0.35 0.31 0.27 0.24 -2.7%
Propane Space heating ..................................................... 0.26 0.30 0.20 0.18 0.17 0.15 0.14 -2.8% Water heating ..................................................... 0.07 0.06 0.05 0.04 0.04 0.03 0.03 -3.0% Cooking .............................................................. 0.03 0.03 0.03 0.03 0.02 0.02 0.02 -0.9% Other uses6 ......................................................... 0.04 0.04 0.05 0.05 0.05 0.06 0.06 1.5%
Delivered energy ............................................. 0.40 0.43 0.32 0.30 0.28 0.26 0.25 -2.0%
Marketed renewables (wood)7 .............................. 0.44 0.58 0.41 0.39 0.38 0.36 0.35 -1.8% Kerosene .............................................................. 0.01 0.01 0.01 0.01 0.01 0.00 0.00 -3.0%
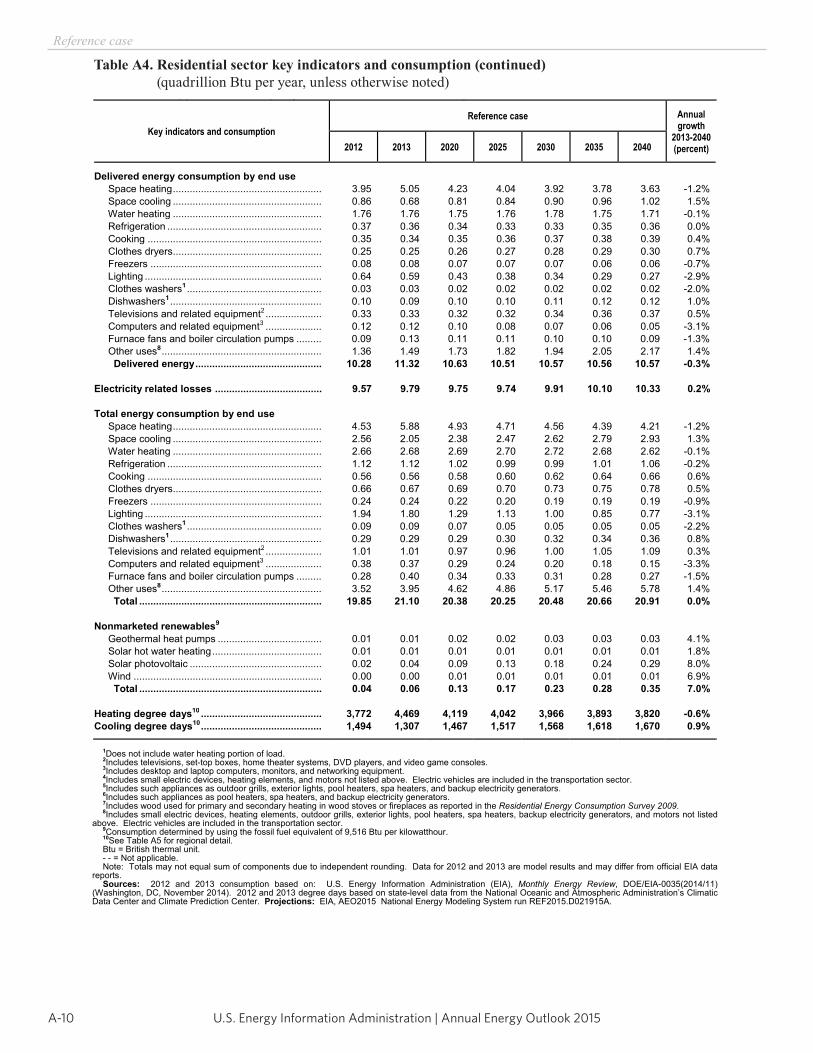
U.S. Energy Information Administration | Annual Energy Outlook 2015A-10
Reference case
Table A4. Residential sector key indicators and consumption (continued) (quadrillion Btu per year, unless otherwise noted)
Energy Information Administration / Annual Energy Outlook 2015
Table A4. Residential sector key indicators and consumption (continued)(quadrillion Btu per year, unless otherwise noted)
Key indicators and consumption Reference case Annual
growth 2013-2040(percent) 2012 2013 2020 2025 2030 2035 2040
Delivered energy consumption by end use Space heating ..................................................... 3.95 5.05 4.23 4.04 3.92 3.78 3.63 -1.2% Space cooling ..................................................... 0.86 0.68 0.81 0.84 0.90 0.96 1.02 1.5% Water heating ..................................................... 1.76 1.76 1.75 1.76 1.78 1.75 1.71 -0.1% Refrigeration ....................................................... 0.37 0.36 0.34 0.33 0.33 0.35 0.36 0.0% Cooking .............................................................. 0.35 0.34 0.35 0.36 0.37 0.38 0.39 0.4% Clothes dryers ..................................................... 0.25 0.25 0.26 0.27 0.28 0.29 0.30 0.7% Freezers ............................................................. 0.08 0.08 0.07 0.07 0.07 0.06 0.06 -0.7% Lighting ............................................................... 0.64 0.59 0.43 0.38 0.34 0.29 0.27 -2.9% Clothes washers1 ................................................ 0.03 0.03 0.02 0.02 0.02 0.02 0.02 -2.0% Dishwashers1 ...................................................... 0.10 0.09 0.10 0.10 0.11 0.12 0.12 1.0% Televisions and related equipment2 .................... 0.33 0.33 0.32 0.32 0.34 0.36 0.37 0.5% Computers and related equipment3 .................... 0.12 0.12 0.10 0.08 0.07 0.06 0.05 -3.1% Furnace fans and boiler circulation pumps ......... 0.09 0.13 0.11 0.11 0.10 0.10 0.09 -1.3% Other uses8 ......................................................... 1.36 1.49 1.73 1.82 1.94 2.05 2.17 1.4%
Delivered energy ............................................. 10.28 11.32 10.63 10.51 10.57 10.56 10.57 -0.3%
Electricity related losses ...................................... 9.57 9.79 9.75 9.74 9.91 10.10 10.33 0.2%
Total energy consumption by end use Space heating ..................................................... 4.53 5.88 4.93 4.71 4.56 4.39 4.21 -1.2% Space cooling ..................................................... 2.56 2.05 2.38 2.47 2.62 2.79 2.93 1.3% Water heating ..................................................... 2.66 2.68 2.69 2.70 2.72 2.68 2.62 -0.1% Refrigeration ....................................................... 1.12 1.12 1.02 0.99 0.99 1.01 1.06 -0.2% Cooking .............................................................. 0.56 0.56 0.58 0.60 0.62 0.64 0.66 0.6% Clothes dryers ..................................................... 0.66 0.67 0.69 0.70 0.73 0.75 0.78 0.5% Freezers ............................................................. 0.24 0.24 0.22 0.20 0.19 0.19 0.19 -0.9% Lighting ............................................................... 1.94 1.80 1.29 1.13 1.00 0.85 0.77 -3.1% Clothes washers1 ................................................ 0.09 0.09 0.07 0.05 0.05 0.05 0.05 -2.2% Dishwashers1 ...................................................... 0.29 0.29 0.29 0.30 0.32 0.34 0.36 0.8% Televisions and related equipment2 .................... 1.01 1.01 0.97 0.96 1.00 1.05 1.09 0.3% Computers and related equipment3 .................... 0.38 0.37 0.29 0.24 0.20 0.18 0.15 -3.3% Furnace fans and boiler circulation pumps ......... 0.28 0.40 0.34 0.33 0.31 0.28 0.27 -1.5% Other uses8 ......................................................... 3.52 3.95 4.62 4.86 5.17 5.46 5.78 1.4%
Total ................................................................. 19.85 21.10 20.38 20.25 20.48 20.66 20.91 0.0%
Nonmarketed renewables9
Geothermal heat pumps ..................................... 0.01 0.01 0.02 0.02 0.03 0.03 0.03 4.1% Solar hot water heating ....................................... 0.01 0.01 0.01 0.01 0.01 0.01 0.01 1.8% Solar photovoltaic ............................................... 0.02 0.04 0.09 0.13 0.18 0.24 0.29 8.0% Wind ................................................................... 0.00 0.00 0.01 0.01 0.01 0.01 0.01 6.9%
Total ................................................................. 0.04 0.06 0.13 0.17 0.23 0.28 0.35 7.0%
Heating degree days10 ........................................... 3,772 4,469 4,119 4,042 3,966 3,893 3,820 -0.6%Cooling degree days10 ........................................... 1,494 1,307 1,467 1,517 1,568 1,618 1,670 0.9%
1Does not include water heating portion of load. 2Includes televisions, set-top boxes, home theater systems, DVD players, and video game consoles. 3Includes desktop and laptop computers, monitors, and networking equipment. 4Includes small electric devices, heating elements, and motors not listed above. Electric vehicles are included in the transportation sector. 5Includes such appliances as outdoor grills, exterior lights, pool heaters, spa heaters, and backup electricity generators. 6Includes such appliances as pool heaters, spa heaters, and backup electricity generators. 7Includes wood used for primary and secondary heating in wood stoves or fireplaces as reported in the Residential Energy Consumption Survey 2009.8Includes small electric devices, heating elements, outdoor grills, exterior lights, pool heaters, spa heaters, backup electricity generators, and motors not listed
above. Electric vehicles are included in the transportation sector. 9Consumption determined by using the fossil fuel equivalent of 9,516 Btu per kilowatthour. 10See Table A5 for regional detail. Btu = British thermal unit. - - = Not applicable. Note: Totals may not equal sum of components due to independent rounding. Data for 2012 and 2013 are model results and may differ from official EIA data
reports. Sources: 2012 and 2013 consumption based on: U.S. Energy Information Administration (EIA), Monthly Energy Review, DOE/EIA-0035(2014/11)
(Washington, DC, November 2014). 2012 and 2013 degree days based on state-level data from the National Oceanic and Atmospheric Administration’s Climatic Data Center and Climate Prediction Center. Projections: EIA, AEO2015 National Energy Modeling System run REF2015.D021915A.
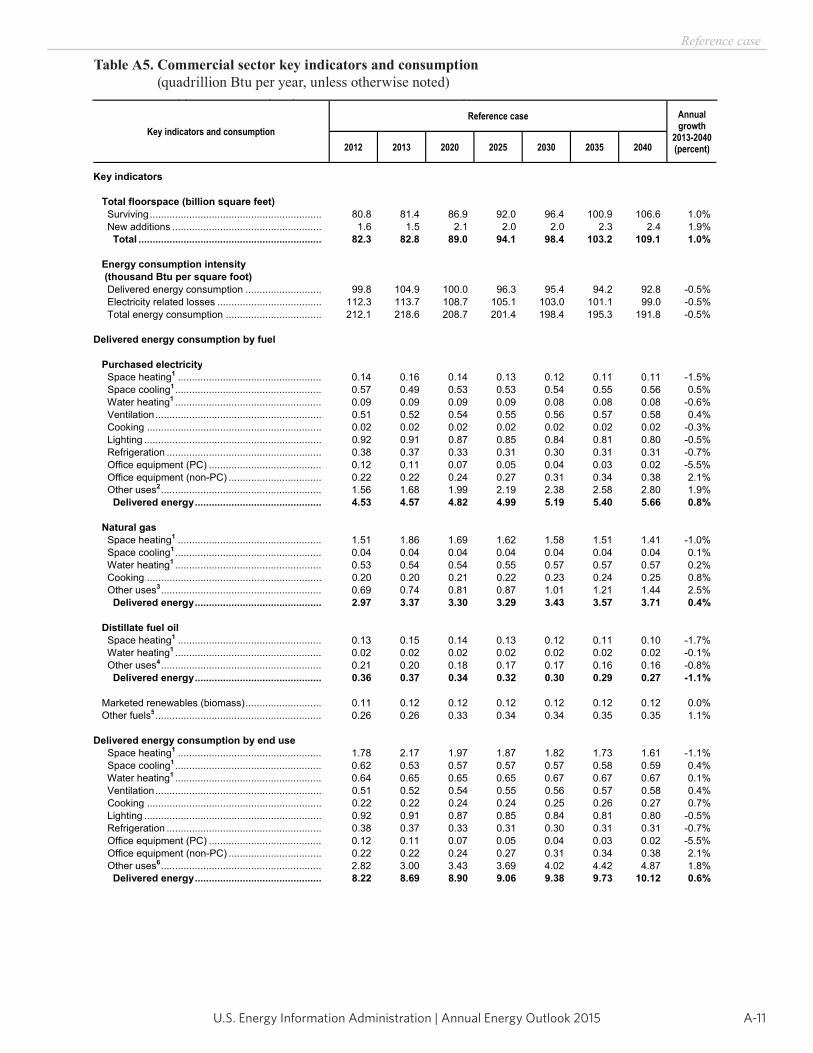
A-11U.S. Energy Information Administration | Annual Energy Outlook 2015
Reference case
Table A5. Commercial sector key indicators and consumption (quadrillion Btu per year, unless otherwise noted)
Energy Information Administration / Annual Energy Outlook 2015
Table A5. Commercial sector key indicators and consumption(quadrillion Btu per year, unless otherwise noted)
Key indicators and consumption Reference case Annual
growth 2013-2040(percent) 2012 2013 2020 2025 2030 2035 2040
Key indicators
Total floorspace (billion square feet) Surviving ............................................................. 80.8 81.4 86.9 92.0 96.4 100.9 106.6 1.0% New additions ..................................................... 1.6 1.5 2.1 2.0 2.0 2.3 2.4 1.9%
Total ................................................................. 82.3 82.8 89.0 94.1 98.4 103.2 109.1 1.0%
Energy consumption intensity (thousand Btu per square foot) Delivered energy consumption ........................... 99.8 104.9 100.0 96.3 95.4 94.2 92.8 -0.5% Electricity related losses ..................................... 112.3 113.7 108.7 105.1 103.0 101.1 99.0 -0.5% Total energy consumption .................................. 212.1 218.6 208.7 201.4 198.4 195.3 191.8 -0.5%
Delivered energy consumption by fuel
Purchased electricity Space heating1 ................................................... 0.14 0.16 0.14 0.13 0.12 0.11 0.11 -1.5% Space cooling1 .................................................... 0.57 0.49 0.53 0.53 0.54 0.55 0.56 0.5% Water heating1 .................................................... 0.09 0.09 0.09 0.09 0.08 0.08 0.08 -0.6% Ventilation ........................................................... 0.51 0.52 0.54 0.55 0.56 0.57 0.58 0.4% Cooking .............................................................. 0.02 0.02 0.02 0.02 0.02 0.02 0.02 -0.3% Lighting ............................................................... 0.92 0.91 0.87 0.85 0.84 0.81 0.80 -0.5% Refrigeration ....................................................... 0.38 0.37 0.33 0.31 0.30 0.31 0.31 -0.7% Office equipment (PC) ........................................ 0.12 0.11 0.07 0.05 0.04 0.03 0.02 -5.5% Office equipment (non-PC) ................................. 0.22 0.22 0.24 0.27 0.31 0.34 0.38 2.1% Other uses2 ......................................................... 1.56 1.68 1.99 2.19 2.38 2.58 2.80 1.9%
Delivered energy ............................................. 4.53 4.57 4.82 4.99 5.19 5.40 5.66 0.8%
Natural gas Space heating1 ................................................... 1.51 1.86 1.69 1.62 1.58 1.51 1.41 -1.0% Space cooling1 .................................................... 0.04 0.04 0.04 0.04 0.04 0.04 0.04 0.1% Water heating1 .................................................... 0.53 0.54 0.54 0.55 0.57 0.57 0.57 0.2% Cooking .............................................................. 0.20 0.20 0.21 0.22 0.23 0.24 0.25 0.8% Other uses3 ......................................................... 0.69 0.74 0.81 0.87 1.01 1.21 1.44 2.5%
Delivered energy ............................................. 2.97 3.37 3.30 3.29 3.43 3.57 3.71 0.4%
Distillate fuel oil Space heating1 ................................................... 0.13 0.15 0.14 0.13 0.12 0.11 0.10 -1.7% Water heating1 .................................................... 0.02 0.02 0.02 0.02 0.02 0.02 0.02 -0.1% Other uses4 ......................................................... 0.21 0.20 0.18 0.17 0.17 0.16 0.16 -0.8%
Delivered energy ............................................. 0.36 0.37 0.34 0.32 0.30 0.29 0.27 -1.1%
Marketed renewables (biomass) ........................... 0.11 0.12 0.12 0.12 0.12 0.12 0.12 0.0% Other fuels5 ........................................................... 0.26 0.26 0.33 0.34 0.34 0.35 0.35 1.1%
Delivered energy consumption by end use Space heating1 ................................................... 1.78 2.17 1.97 1.87 1.82 1.73 1.61 -1.1% Space cooling1 .................................................... 0.62 0.53 0.57 0.57 0.57 0.58 0.59 0.4% Water heating1 .................................................... 0.64 0.65 0.65 0.65 0.67 0.67 0.67 0.1% Ventilation ........................................................... 0.51 0.52 0.54 0.55 0.56 0.57 0.58 0.4% Cooking .............................................................. 0.22 0.22 0.24 0.24 0.25 0.26 0.27 0.7% Lighting ............................................................... 0.92 0.91 0.87 0.85 0.84 0.81 0.80 -0.5% Refrigeration ....................................................... 0.38 0.37 0.33 0.31 0.30 0.31 0.31 -0.7% Office equipment (PC) ........................................ 0.12 0.11 0.07 0.05 0.04 0.03 0.02 -5.5% Office equipment (non-PC) ................................. 0.22 0.22 0.24 0.27 0.31 0.34 0.38 2.1% Other uses6 ......................................................... 2.82 3.00 3.43 3.69 4.02 4.42 4.87 1.8%
Delivered energy ............................................. 8.22 8.69 8.90 9.06 9.38 9.73 10.12 0.6%
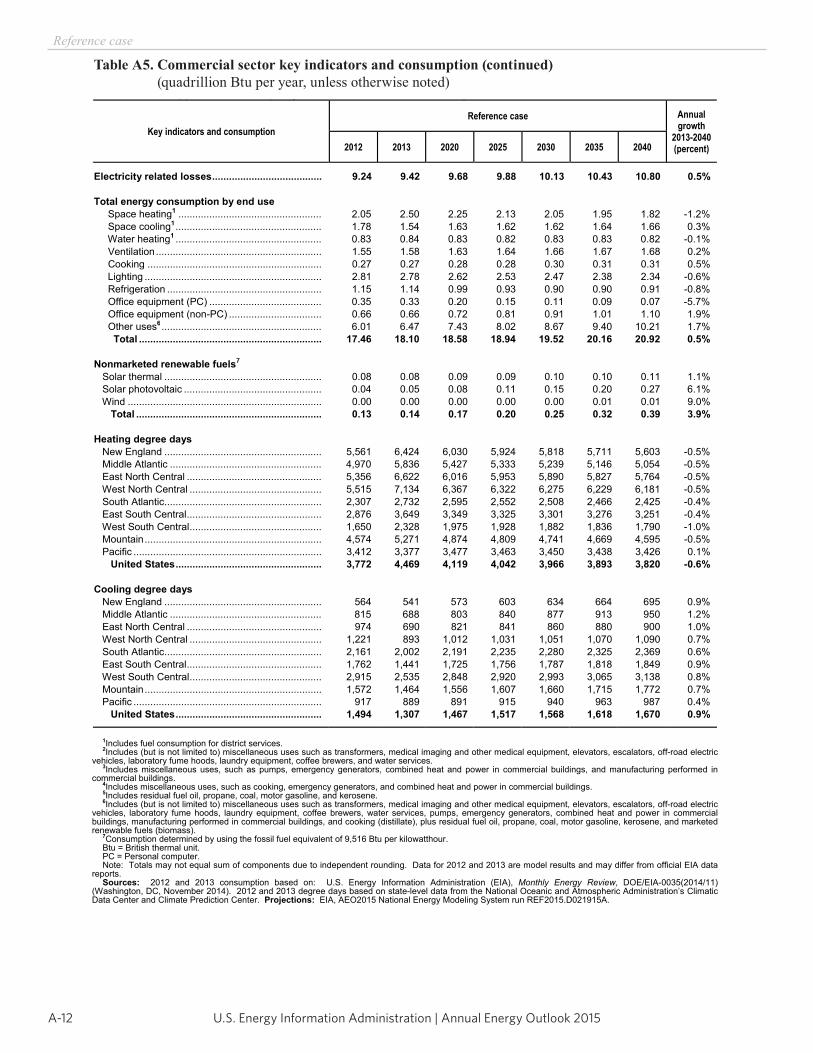
U.S. Energy Information Administration | Annual Energy Outlook 2015A-12
Reference case
Table A5. Commercial sector key indicators and consumption (continued) (quadrillion Btu per year, unless otherwise noted)
Energy Information Administration / Annual Energy Outlook 2015
Table A5. Commercial sector key indicators and consumption (continued)(quadrillion Btu per year, unless otherwise noted)
Key indicators and consumption Reference case Annual
growth 2013-2040(percent) 2012 2013 2020 2025 2030 2035 2040
Electricity related losses ....................................... 9.24 9.42 9.68 9.88 10.13 10.43 10.80 0.5%
Total energy consumption by end use Space heating1 ................................................... 2.05 2.50 2.25 2.13 2.05 1.95 1.82 -1.2% Space cooling1 .................................................... 1.78 1.54 1.63 1.62 1.62 1.64 1.66 0.3% Water heating1 .................................................... 0.83 0.84 0.83 0.82 0.83 0.83 0.82 -0.1% Ventilation ........................................................... 1.55 1.58 1.63 1.64 1.66 1.67 1.68 0.2% Cooking .............................................................. 0.27 0.27 0.28 0.28 0.30 0.31 0.31 0.5% Lighting ............................................................... 2.81 2.78 2.62 2.53 2.47 2.38 2.34 -0.6% Refrigeration ....................................................... 1.15 1.14 0.99 0.93 0.90 0.90 0.91 -0.8% Office equipment (PC) ........................................ 0.35 0.33 0.20 0.15 0.11 0.09 0.07 -5.7% Office equipment (non-PC) ................................. 0.66 0.66 0.72 0.81 0.91 1.01 1.10 1.9% Other uses6 ......................................................... 6.01 6.47 7.43 8.02 8.67 9.40 10.21 1.7%
Total ................................................................. 17.46 18.10 18.58 18.94 19.52 20.16 20.92 0.5%
Nonmarketed renewable fuels7
Solar thermal ........................................................ 0.08 0.08 0.09 0.09 0.10 0.10 0.11 1.1% Solar photovoltaic ................................................. 0.04 0.05 0.08 0.11 0.15 0.20 0.27 6.1% Wind ..................................................................... 0.00 0.00 0.00 0.00 0.00 0.01 0.01 9.0%
Total .................................................................. 0.13 0.14 0.17 0.20 0.25 0.32 0.39 3.9%
Heating degree days New England ........................................................ 5,561 6,424 6,030 5,924 5,818 5,711 5,603 -0.5% Middle Atlantic ...................................................... 4,970 5,836 5,427 5,333 5,239 5,146 5,054 -0.5% East North Central ................................................ 5,356 6,622 6,016 5,953 5,890 5,827 5,764 -0.5% West North Central ............................................... 5,515 7,134 6,367 6,322 6,275 6,229 6,181 -0.5% South Atlantic ........................................................ 2,307 2,732 2,595 2,552 2,508 2,466 2,425 -0.4% East South Central ................................................ 2,876 3,649 3,349 3,325 3,301 3,276 3,251 -0.4% West South Central ............................................... 1,650 2,328 1,975 1,928 1,882 1,836 1,790 -1.0% Mountain ............................................................... 4,574 5,271 4,874 4,809 4,741 4,669 4,595 -0.5% Pacific ................................................................... 3,412 3,377 3,477 3,463 3,450 3,438 3,426 0.1%
United States .................................................... 3,772 4,469 4,119 4,042 3,966 3,893 3,820 -0.6%
Cooling degree days New England ........................................................ 564 541 573 603 634 664 695 0.9% Middle Atlantic ...................................................... 815 688 803 840 877 913 950 1.2% East North Central ................................................ 974 690 821 841 860 880 900 1.0% West North Central ............................................... 1,221 893 1,012 1,031 1,051 1,070 1,090 0.7% South Atlantic ........................................................ 2,161 2,002 2,191 2,235 2,280 2,325 2,369 0.6% East South Central ................................................ 1,762 1,441 1,725 1,756 1,787 1,818 1,849 0.9% West South Central ............................................... 2,915 2,535 2,848 2,920 2,993 3,065 3,138 0.8% Mountain ............................................................... 1,572 1,464 1,556 1,607 1,660 1,715 1,772 0.7% Pacific ................................................................... 917 889 891 915 940 963 987 0.4%
United States .................................................... 1,494 1,307 1,467 1,517 1,568 1,618 1,670 0.9%
1Includes fuel consumption for district services. 2Includes (but is not limited to) miscellaneous uses such as transformers, medical imaging and other medical equipment, elevators, escalators, off-road electric
vehicles, laboratory fume hoods, laundry equipment, coffee brewers, and water services. 3Includes miscellaneous uses, such as pumps, emergency generators, combined heat and power in commercial buildings, and manufacturing performed in
commercial buildings. 4Includes miscellaneous uses, such as cooking, emergency generators, and combined heat and power in commercial buildings. 5Includes residual fuel oil, propane, coal, motor gasoline, and kerosene. 6Includes (but is not limited to) miscellaneous uses such as transformers, medical imaging and other medical equipment, elevators, escalators, off-road electric
vehicles, laboratory fume hoods, laundry equipment, coffee brewers, water services, pumps, emergency generators, combined heat and power in commercial buildings, manufacturing performed in commercial buildings, and cooking (distillate), plus residual fuel oil, propane, coal, motor gasoline, kerosene, and marketed renewable fuels (biomass).
7Consumption determined by using the fossil fuel equivalent of 9,516 Btu per kilowatthour. Btu = British thermal unit. PC = Personal computer. Note: Totals may not equal sum of components due to independent rounding. Data for 2012 and 2013 are model results and may differ from official EIA data
reports. Sources: 2012 and 2013 consumption based on: U.S. Energy Information Administration (EIA), Monthly Energy Review, DOE/EIA-0035(2014/11)
(Washington, DC, November 2014). 2012 and 2013 degree days based on state-level data from the National Oceanic and Atmospheric Administration’s Climatic Data Center and Climate Prediction Center. Projections: EIA, AEO2015 National Energy Modeling System run REF2015.D021915A.
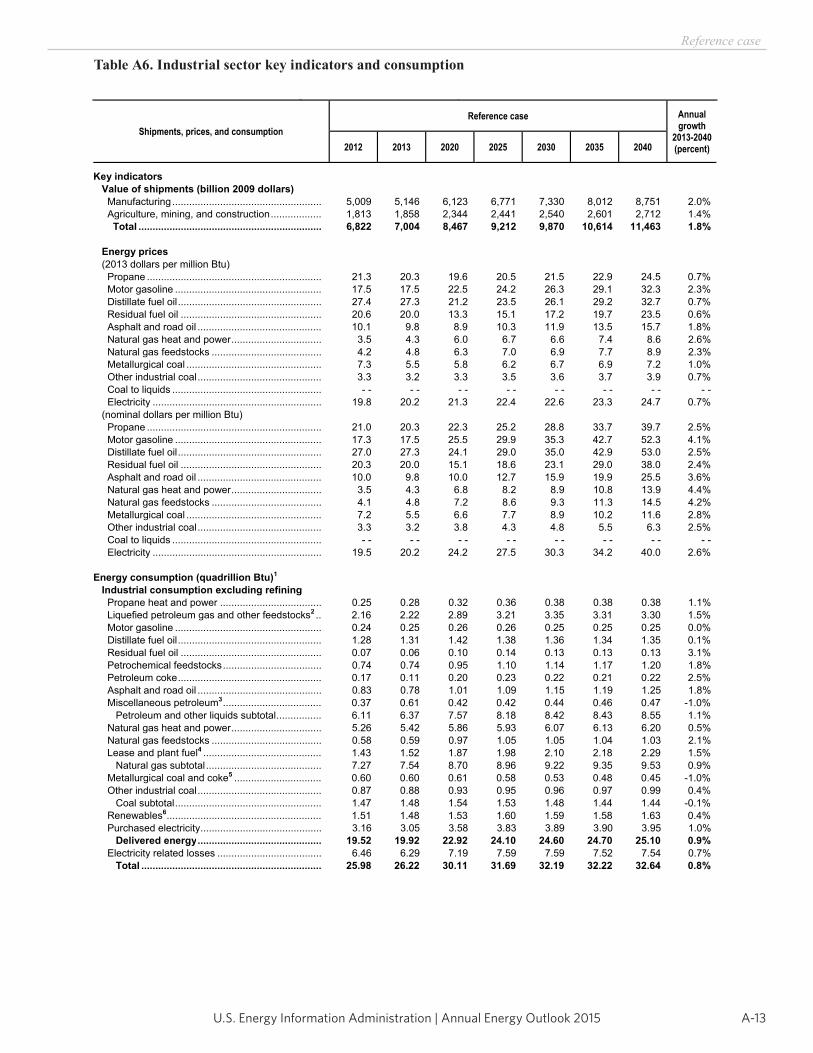
A-13U.S. Energy Information Administration | Annual Energy Outlook 2015
Reference case
Table A6. Industrial sector key indicators and consumption
Energy Information Administration / Annual Energy Outlook 2015
Table A6. Industrial sector key indicators and consumption
Shipments, prices, and consumption Reference case Annual
growth 2013-2040(percent) 2012 2013 2020 2025 2030 2035 2040
Key indicators Value of shipments (billion 2009 dollars)
Manufacturing ..................................................... 5,009 5,146 6,123 6,771 7,330 8,012 8,751 2.0% Agriculture, mining, and construction .................. 1,813 1,858 2,344 2,441 2,540 2,601 2,712 1.4%
Total ................................................................. 6,822 7,004 8,467 9,212 9,870 10,614 11,463 1.8%
Energy prices (2013 dollars per million Btu) Propane .............................................................. 21.3 20.3 19.6 20.5 21.5 22.9 24.5 0.7% Motor gasoline .................................................... 17.5 17.5 22.5 24.2 26.3 29.1 32.3 2.3% Distillate fuel oil ................................................... 27.4 27.3 21.2 23.5 26.1 29.2 32.7 0.7%
Residual fuel oil .................................................. 20.6 20.0 13.3 15.1 17.2 19.7 23.5 0.6% Asphalt and road oil ............................................ 10.1 9.8 8.9 10.3 11.9 13.5 15.7 1.8% Natural gas heat and power ................................ 3.5 4.3 6.0 6.7 6.6 7.4 8.6 2.6% Natural gas feedstocks ....................................... 4.2 4.8 6.3 7.0 6.9 7.7 8.9 2.3% Metallurgical coal ................................................ 7.3 5.5 5.8 6.2 6.7 6.9 7.2 1.0% Other industrial coal ............................................ 3.3 3.2 3.3 3.5 3.6 3.7 3.9 0.7% Coal to liquids ..................................................... - - - - - - - - - - - - - - - -
Electricity ............................................................ 19.8 20.2 21.3 22.4 22.6 23.3 24.7 0.7% (nominal dollars per million Btu) Propane .............................................................. 21.0 20.3 22.3 25.2 28.8 33.7 39.7 2.5% Motor gasoline .................................................... 17.3 17.5 25.5 29.9 35.3 42.7 52.3 4.1% Distillate fuel oil ................................................... 27.0 27.3 24.1 29.0 35.0 42.9 53.0 2.5%
Residual fuel oil .................................................. 20.3 20.0 15.1 18.6 23.1 29.0 38.0 2.4% Asphalt and road oil ............................................ 10.0 9.8 10.0 12.7 15.9 19.9 25.5 3.6% Natural gas heat and power ................................ 3.5 4.3 6.8 8.2 8.9 10.8 13.9 4.4% Natural gas feedstocks ....................................... 4.1 4.8 7.2 8.6 9.3 11.3 14.5 4.2% Metallurgical coal ................................................ 7.2 5.5 6.6 7.7 8.9 10.2 11.6 2.8% Other industrial coal ............................................ 3.3 3.2 3.8 4.3 4.8 5.5 6.3 2.5% Coal to liquids ..................................................... - - - - - - - - - - - - - - - -
Electricity ............................................................ 19.5 20.2 24.2 27.5 30.3 34.2 40.0 2.6%
Energy consumption (quadrillion Btu)1
Industrial consumption excluding refining Propane heat and power .................................... 0.25 0.28 0.32 0.36 0.38 0.38 0.38 1.1% Liquefied petroleum gas and other feedstocks2 .. 2.16 2.22 2.89 3.21 3.35 3.31 3.30 1.5% Motor gasoline .................................................... 0.24 0.25 0.26 0.26 0.25 0.25 0.25 0.0% Distillate fuel oil ................................................... 1.28 1.31 1.42 1.38 1.36 1.34 1.35 0.1% Residual fuel oil .................................................. 0.07 0.06 0.10 0.14 0.13 0.13 0.13 3.1% Petrochemical feedstocks ................................... 0.74 0.74 0.95 1.10 1.14 1.17 1.20 1.8% Petroleum coke ................................................... 0.17 0.11 0.20 0.23 0.22 0.21 0.22 2.5% Asphalt and road oil ............................................ 0.83 0.78 1.01 1.09 1.15 1.19 1.25 1.8% Miscellaneous petroleum3 ................................... 0.37 0.61 0.42 0.42 0.44 0.46 0.47 -1.0%
Petroleum and other liquids subtotal ................ 6.11 6.37 7.57 8.18 8.42 8.43 8.55 1.1% Natural gas heat and power ................................ 5.26 5.42 5.86 5.93 6.07 6.13 6.20 0.5% Natural gas feedstocks ....................................... 0.58 0.59 0.97 1.05 1.05 1.04 1.03 2.1% Lease and plant fuel4 .......................................... 1.43 1.52 1.87 1.98 2.10 2.18 2.29 1.5%
Natural gas subtotal ......................................... 7.27 7.54 8.70 8.96 9.22 9.35 9.53 0.9% Metallurgical coal and coke5 ............................... 0.60 0.60 0.61 0.58 0.53 0.48 0.45 -1.0% Other industrial coal ............................................ 0.87 0.88 0.93 0.95 0.96 0.97 0.99 0.4%
Coal subtotal .................................................... 1.47 1.48 1.54 1.53 1.48 1.44 1.44 -0.1% Renewables6....................................................... 1.51 1.48 1.53 1.60 1.59 1.58 1.63 0.4% Purchased electricity ........................................... 3.16 3.05 3.58 3.83 3.89 3.90 3.95 1.0%
Delivered energy ............................................ 19.52 19.92 22.92 24.10 24.60 24.70 25.10 0.9% Electricity related losses ..................................... 6.46 6.29 7.19 7.59 7.59 7.52 7.54 0.7%
Total ................................................................ 25.98 26.22 30.11 31.69 32.19 32.22 32.64 0.8%
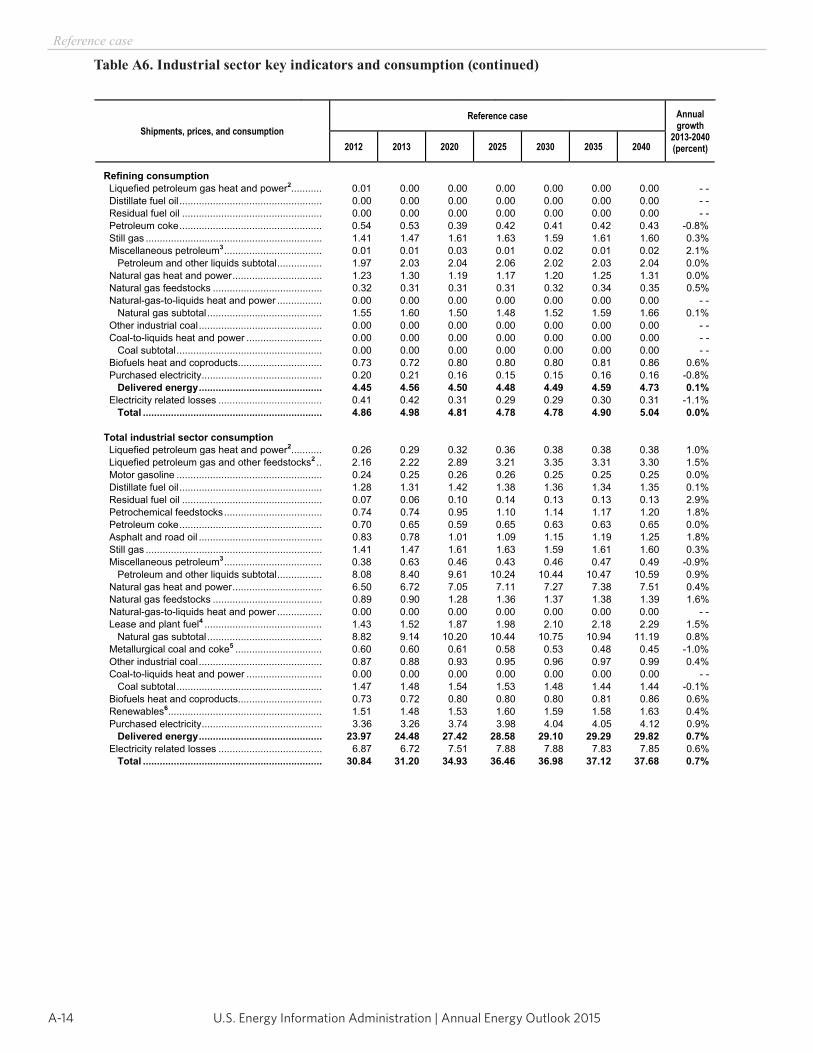
U.S. Energy Information Administration | Annual Energy Outlook 2015A-14
Reference case
Table A6. Industrial sector key indicators and consumption (continued)
Energy Information Administration / Annual Energy Outlook 2015
Table A6. Industrial sector key indicators and consumption (continued)
Shipments, prices, and consumption Reference case Annual
growth 2013-2040(percent) 2012 2013 2020 2025 2030 2035 2040
Refining consumption Liquefied petroleum gas heat and power2........... 0.01 0.00 0.00 0.00 0.00 0.00 0.00 - -
Distillate fuel oil ................................................... 0.00 0.00 0.00 0.00 0.00 0.00 0.00 - - Residual fuel oil .................................................. 0.00 0.00 0.00 0.00 0.00 0.00 0.00 - - Petroleum coke ................................................... 0.54 0.53 0.39 0.42 0.41 0.42 0.43 -0.8% Still gas ............................................................... 1.41 1.47 1.61 1.63 1.59 1.61 1.60 0.3% Miscellaneous petroleum3 ................................... 0.01 0.01 0.03 0.01 0.02 0.01 0.02 2.1%
Petroleum and other liquids subtotal ................ 1.97 2.03 2.04 2.06 2.02 2.03 2.04 0.0% Natural gas heat and power ................................ 1.23 1.30 1.19 1.17 1.20 1.25 1.31 0.0% Natural gas feedstocks ....................................... 0.32 0.31 0.31 0.31 0.32 0.34 0.35 0.5% Natural-gas-to-liquids heat and power ................ 0.00 0.00 0.00 0.00 0.00 0.00 0.00 - -
Natural gas subtotal ......................................... 1.55 1.60 1.50 1.48 1.52 1.59 1.66 0.1% Other industrial coal ............................................ 0.00 0.00 0.00 0.00 0.00 0.00 0.00 - - Coal-to-liquids heat and power ........................... 0.00 0.00 0.00 0.00 0.00 0.00 0.00 - -
Coal subtotal .................................................... 0.00 0.00 0.00 0.00 0.00 0.00 0.00 - - Biofuels heat and coproducts.............................. 0.73 0.72 0.80 0.80 0.80 0.81 0.86 0.6% Purchased electricity ........................................... 0.20 0.21 0.16 0.15 0.15 0.16 0.16 -0.8%
Delivered energy ............................................ 4.45 4.56 4.50 4.48 4.49 4.59 4.73 0.1% Electricity related losses ..................................... 0.41 0.42 0.31 0.29 0.29 0.30 0.31 -1.1%
Total ................................................................ 4.86 4.98 4.81 4.78 4.78 4.90 5.04 0.0%
Total industrial sector consumption Liquefied petroleum gas heat and power2........... 0.26 0.29 0.32 0.36 0.38 0.38 0.38 1.0%
Liquefied petroleum gas and other feedstocks2 .. 2.16 2.22 2.89 3.21 3.35 3.31 3.30 1.5% Motor gasoline .................................................... 0.24 0.25 0.26 0.26 0.25 0.25 0.25 0.0% Distillate fuel oil ................................................... 1.28 1.31 1.42 1.38 1.36 1.34 1.35 0.1% Residual fuel oil .................................................. 0.07 0.06 0.10 0.14 0.13 0.13 0.13 2.9% Petrochemical feedstocks ................................... 0.74 0.74 0.95 1.10 1.14 1.17 1.20 1.8% Petroleum coke ................................................... 0.70 0.65 0.59 0.65 0.63 0.63 0.65 0.0% Asphalt and road oil ............................................ 0.83 0.78 1.01 1.09 1.15 1.19 1.25 1.8% Still gas ............................................................... 1.41 1.47 1.61 1.63 1.59 1.61 1.60 0.3% Miscellaneous petroleum3 ................................... 0.38 0.63 0.46 0.43 0.46 0.47 0.49 -0.9%
Petroleum and other liquids subtotal ................ 8.08 8.40 9.61 10.24 10.44 10.47 10.59 0.9% Natural gas heat and power ................................ 6.50 6.72 7.05 7.11 7.27 7.38 7.51 0.4% Natural gas feedstocks ....................................... 0.89 0.90 1.28 1.36 1.37 1.38 1.39 1.6% Natural-gas-to-liquids heat and power ................ 0.00 0.00 0.00 0.00 0.00 0.00 0.00 - - Lease and plant fuel4 .......................................... 1.43 1.52 1.87 1.98 2.10 2.18 2.29 1.5%
Natural gas subtotal ......................................... 8.82 9.14 10.20 10.44 10.75 10.94 11.19 0.8% Metallurgical coal and coke5 ............................... 0.60 0.60 0.61 0.58 0.53 0.48 0.45 -1.0% Other industrial coal ............................................ 0.87 0.88 0.93 0.95 0.96 0.97 0.99 0.4% Coal-to-liquids heat and power ........................... 0.00 0.00 0.00 0.00 0.00 0.00 0.00 - -
Coal subtotal .................................................... 1.47 1.48 1.54 1.53 1.48 1.44 1.44 -0.1% Biofuels heat and coproducts.............................. 0.73 0.72 0.80 0.80 0.80 0.81 0.86 0.6% Renewables6....................................................... 1.51 1.48 1.53 1.60 1.59 1.58 1.63 0.4% Purchased electricity ........................................... 3.36 3.26 3.74 3.98 4.04 4.05 4.12 0.9%
Delivered energy ............................................ 23.97 24.48 27.42 28.58 29.10 29.29 29.82 0.7% Electricity related losses ..................................... 6.87 6.72 7.51 7.88 7.88 7.83 7.85 0.6%
Total ................................................................ 30.84 31.20 34.93 36.46 36.98 37.12 37.68 0.7%
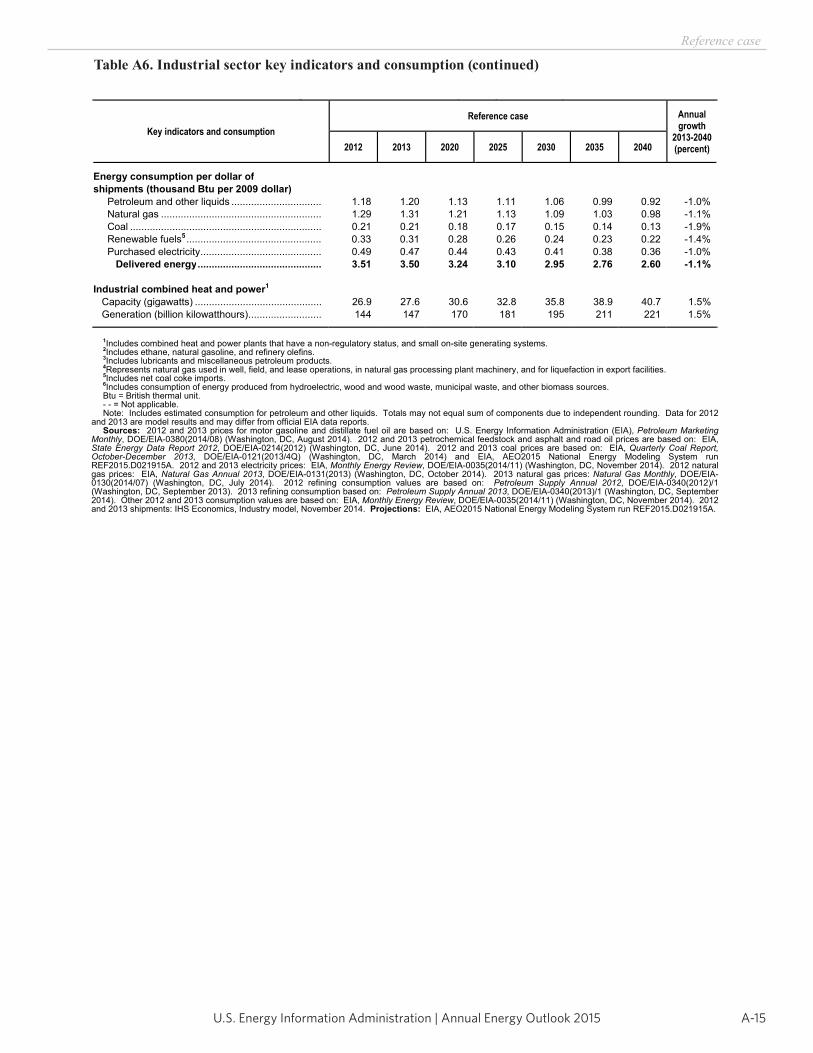
A-15U.S. Energy Information Administration | Annual Energy Outlook 2015
Reference case
Table A6. Industrial sector key indicators and consumption (continued)
Energy Information Administration / Annual Energy Outlook 2015
Table A6. Industrial sector key indicators and consumption (continued)
Key indicators and consumption Reference case Annual
growth 2013-2040(percent) 2012 2013 2020 2025 2030 2035 2040
Energy consumption per dollar ofshipments (thousand Btu per 2009 dollar) Petroleum and other liquids ................................ 1.18 1.20 1.13 1.11 1.06 0.99 0.92 -1.0% Natural gas ......................................................... 1.29 1.31 1.21 1.13 1.09 1.03 0.98 -1.1% Coal .................................................................... 0.21 0.21 0.18 0.17 0.15 0.14 0.13 -1.9% Renewable fuels5 ................................................ 0.33 0.31 0.28 0.26 0.24 0.23 0.22 -1.4% Purchased electricity ........................................... 0.49 0.47 0.44 0.43 0.41 0.38 0.36 -1.0%
Delivered energy ............................................ 3.51 3.50 3.24 3.10 2.95 2.76 2.60 -1.1%
Industrial combined heat and power1
Capacity (gigawatts) ............................................. 26.9 27.6 30.6 32.8 35.8 38.9 40.7 1.5% Generation (billion kilowatthours) .......................... 144 147 170 181 195 211 221 1.5%
1Includes combined heat and power plants that have a non-regulatory status, and small on-site generating systems. 2Includes ethane, natural gasoline, and refinery olefins. 3Includes lubricants and miscellaneous petroleum products. 4Represents natural gas used in well, field, and lease operations, in natural gas processing plant machinery, and for liquefaction in export facilities. 5Includes net coal coke imports. 6Includes consumption of energy produced from hydroelectric, wood and wood waste, municipal waste, and other biomass sources. Btu = British thermal unit. - - = Not applicable. Note: Includes estimated consumption for petroleum and other liquids. Totals may not equal sum of components due to independent rounding. Data for 2012
and 2013 are model results and may differ from official EIA data reports. Sources: 2012 and 2013 prices for motor gasoline and distillate fuel oil are based on: U.S. Energy Information Administration (EIA), Petroleum Marketing
Monthly, DOE/EIA-0380(2014/08) (Washington, DC, August 2014). 2012 and 2013 petrochemical feedstock and asphalt and road oil prices are based on: EIA, State Energy Data Report 2012, DOE/EIA-0214(2012) (Washington, DC, June 2014). 2012 and 2013 coal prices are based on: EIA, Quarterly Coal Report, October-December 2013, DOE/EIA-0121(2013/4Q) (Washington, DC, March 2014) and EIA, AEO2015 National Energy Modeling System run REF2015.D021915A. 2012 and 2013 electricity prices: EIA, Monthly Energy Review, DOE/EIA-0035(2014/11) (Washington, DC, November 2014). 2012 natural gas prices: EIA, Natural Gas Annual 2013, DOE/EIA-0131(2013) (Washington, DC, October 2014). 2013 natural gas prices: Natural Gas Monthly, DOE/EIA-0130(2014/07) (Washington, DC, July 2014). 2012 refining consumption values are based on: Petroleum Supply Annual 2012, DOE/EIA-0340(2012)/1 (Washington, DC, September 2013). 2013 refining consumption based on: Petroleum Supply Annual 2013, DOE/EIA-0340(2013)/1 (Washington, DC, September 2014). Other 2012 and 2013 consumption values are based on: EIA, Monthly Energy Review, DOE/EIA-0035(2014/11) (Washington, DC, November 2014). 2012 and 2013 shipments: IHS Economics, Industry model, November 2014. Projections: EIA, AEO2015 National Energy Modeling System run REF2015.D021915A.
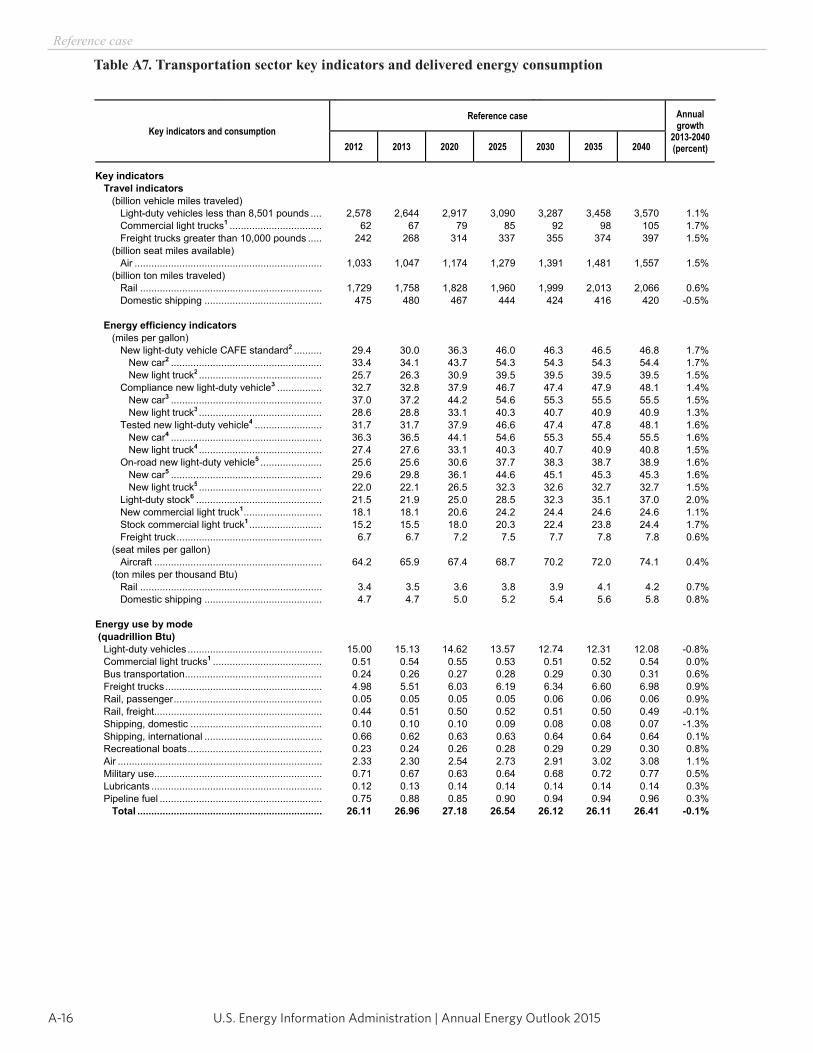
U.S. Energy Information Administration | Annual Energy Outlook 2015A-16
Reference case
Table A7. Transportation sector key indicators and delivered energy consumption
Energy Information Administration / Annual Energy Outlook 2015
Table A7. Transportation sector key indicators and delivered energy consumption
Key indicators and consumption Reference case Annual
growth 2013-2040(percent) 2012 2013 2020 2025 2030 2035 2040
Key indicators Travel indicators
(billion vehicle miles traveled) Light-duty vehicles less than 8,501 pounds .... 2,578 2,644 2,917 3,090 3,287 3,458 3,570 1.1% Commercial light trucks1 ................................. 62 67 79 85 92 98 105 1.7% Freight trucks greater than 10,000 pounds ..... 242 268 314 337 355 374 397 1.5% (billion seat miles available) Air ................................................................... 1,033 1,047 1,174 1,279 1,391 1,481 1,557 1.5% (billion ton miles traveled) Rail ................................................................. 1,729 1,758 1,828 1,960 1,999 2,013 2,066 0.6% Domestic shipping .......................................... 475 480 467 444 424 416 420 -0.5%
Energy efficiency indicators (miles per gallon) New light-duty vehicle CAFE standard2 .......... 29.4 30.0 36.3 46.0 46.3 46.5 46.8 1.7%
New car2 ...................................................... 33.4 34.1 43.7 54.3 54.3 54.3 54.4 1.7% New light truck2 ............................................ 25.7 26.3 30.9 39.5 39.5 39.5 39.5 1.5%
Compliance new light-duty vehicle3 ................ 32.7 32.8 37.9 46.7 47.4 47.9 48.1 1.4% New car3 ...................................................... 37.0 37.2 44.2 54.6 55.3 55.5 55.5 1.5% New light truck3 ............................................ 28.6 28.8 33.1 40.3 40.7 40.9 40.9 1.3%
Tested new light-duty vehicle4 ........................ 31.7 31.7 37.9 46.6 47.4 47.8 48.1 1.6% New car4 ...................................................... 36.3 36.5 44.1 54.6 55.3 55.4 55.5 1.6% New light truck4 ............................................ 27.4 27.6 33.1 40.3 40.7 40.9 40.8 1.5%
On-road new light-duty vehicle5 ...................... 25.6 25.6 30.6 37.7 38.3 38.7 38.9 1.6% New car5 ...................................................... 29.6 29.8 36.1 44.6 45.1 45.3 45.3 1.6% New light truck5 ............................................ 22.0 22.1 26.5 32.3 32.6 32.7 32.7 1.5%
Light-duty stock6 ............................................. 21.5 21.9 25.0 28.5 32.3 35.1 37.0 2.0% New commercial light truck1 ............................ 18.1 18.1 20.6 24.2 24.4 24.6 24.6 1.1% Stock commercial light truck1 .......................... 15.2 15.5 18.0 20.3 22.4 23.8 24.4 1.7% Freight truck .................................................... 6.7 6.7 7.2 7.5 7.7 7.8 7.8 0.6% (seat miles per gallon) Aircraft ............................................................ 64.2 65.9 67.4 68.7 70.2 72.0 74.1 0.4% (ton miles per thousand Btu) Rail ................................................................. 3.4 3.5 3.6 3.8 3.9 4.1 4.2 0.7% Domestic shipping .......................................... 4.7 4.7 5.0 5.2 5.4 5.6 5.8 0.8%
Energy use by mode (quadrillion Btu) Light-duty vehicles ................................................ 15.00 15.13 14.62 13.57 12.74 12.31 12.08 -0.8% Commercial light trucks1 ....................................... 0.51 0.54 0.55 0.53 0.51 0.52 0.54 0.0% Bus transportation ................................................. 0.24 0.26 0.27 0.28 0.29 0.30 0.31 0.6% Freight trucks ........................................................ 4.98 5.51 6.03 6.19 6.34 6.60 6.98 0.9% Rail, passenger ..................................................... 0.05 0.05 0.05 0.05 0.06 0.06 0.06 0.9% Rail, freight............................................................ 0.44 0.51 0.50 0.52 0.51 0.50 0.49 -0.1% Shipping, domestic ............................................... 0.10 0.10 0.10 0.09 0.08 0.08 0.07 -1.3% Shipping, international .......................................... 0.66 0.62 0.63 0.63 0.64 0.64 0.64 0.1% Recreational boats ................................................ 0.23 0.24 0.26 0.28 0.29 0.29 0.30 0.8% Air ......................................................................... 2.33 2.30 2.54 2.73 2.91 3.02 3.08 1.1% Military use............................................................ 0.71 0.67 0.63 0.64 0.68 0.72 0.77 0.5% Lubricants ............................................................. 0.12 0.13 0.14 0.14 0.14 0.14 0.14 0.3% Pipeline fuel .......................................................... 0.75 0.88 0.85 0.90 0.94 0.94 0.96 0.3%
Total .................................................................. 26.11 26.96 27.18 26.54 26.12 26.11 26.41 -0.1%
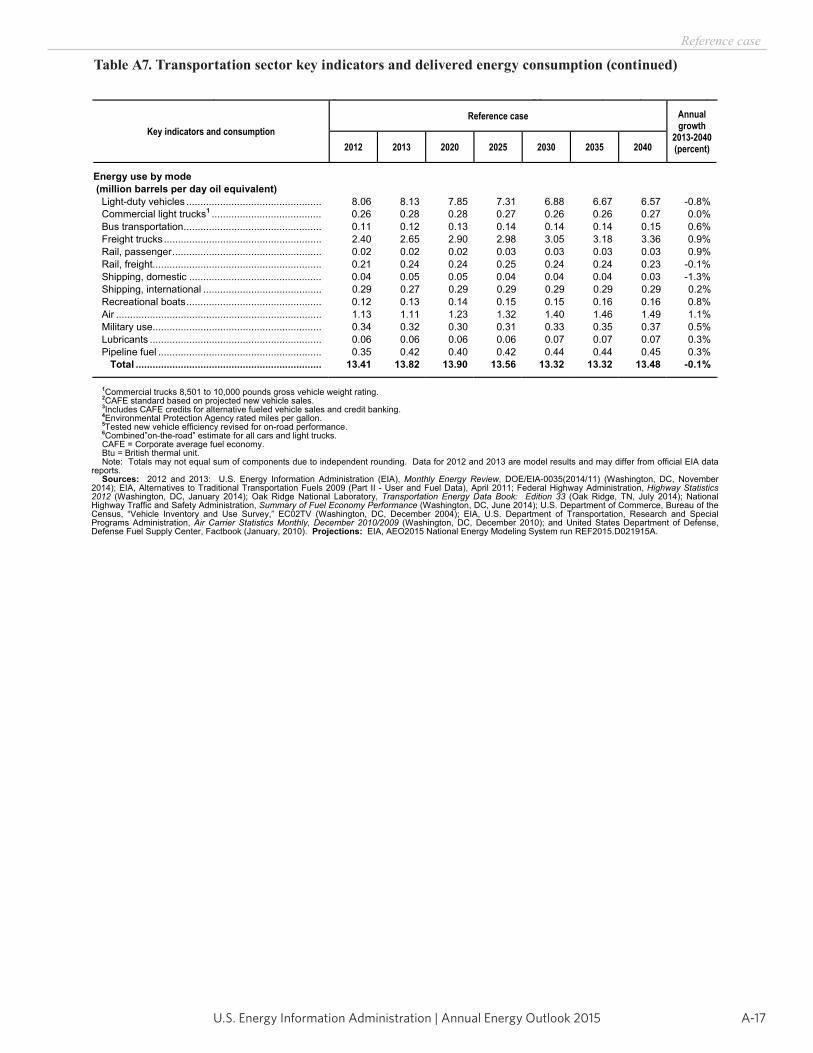
A-17U.S. Energy Information Administration | Annual Energy Outlook 2015
Reference case
Table A7. Transportation sector key indicators and delivered energy consumption (continued)
Energy Information Administration / Annual Energy Outlook 2015
Table A7. Transportation sector key indicators and delivered energy consumption (continued)
Key indicators and consumption Reference case Annual
growth 2013-2040(percent) 2012 2013 2020 2025 2030 2035 2040
Energy use by mode (million barrels per day oil equivalent) Light-duty vehicles ................................................ 8.06 8.13 7.85 7.31 6.88 6.67 6.57 -0.8% Commercial light trucks1 ....................................... 0.26 0.28 0.28 0.27 0.26 0.26 0.27 0.0% Bus transportation ................................................. 0.11 0.12 0.13 0.14 0.14 0.14 0.15 0.6% Freight trucks ........................................................ 2.40 2.65 2.90 2.98 3.05 3.18 3.36 0.9% Rail, passenger ..................................................... 0.02 0.02 0.02 0.03 0.03 0.03 0.03 0.9% Rail, freight............................................................ 0.21 0.24 0.24 0.25 0.24 0.24 0.23 -0.1% Shipping, domestic ............................................... 0.04 0.05 0.05 0.04 0.04 0.04 0.03 -1.3% Shipping, international .......................................... 0.29 0.27 0.29 0.29 0.29 0.29 0.29 0.2% Recreational boats ................................................ 0.12 0.13 0.14 0.15 0.15 0.16 0.16 0.8% Air ......................................................................... 1.13 1.11 1.23 1.32 1.40 1.46 1.49 1.1% Military use............................................................ 0.34 0.32 0.30 0.31 0.33 0.35 0.37 0.5% Lubricants ............................................................. 0.06 0.06 0.06 0.06 0.07 0.07 0.07 0.3% Pipeline fuel .......................................................... 0.35 0.42 0.40 0.42 0.44 0.44 0.45 0.3%
Total .................................................................. 13.41 13.82 13.90 13.56 13.32 13.32 13.48 -0.1%
1Commercial trucks 8,501 to 10,000 pounds gross vehicle weight rating. 2CAFE standard based on projected new vehicle sales. 3Includes CAFE credits for alternative fueled vehicle sales and credit banking. 4Environmental Protection Agency rated miles per gallon. 5Tested new vehicle efficiency revised for on-road performance. 6Combined”on-the-road” estimate for all cars and light trucks. CAFE = Corporate average fuel economy. Btu = British thermal unit. Note: Totals may not equal sum of components due to independent rounding. Data for 2012 and 2013 are model results and may differ from official EIA data
reports. Sources: 2012 and 2013: U.S. Energy Information Administration (EIA), Monthly Energy Review, DOE/EIA-0035(2014/11) (Washington, DC, November
2014); EIA, Alternatives to Traditional Transportation Fuels 2009 (Part II - User and Fuel Data), April 2011; Federal Highway Administration, Highway Statistics 2012 (Washington, DC, January 2014); Oak Ridge National Laboratory, Transportation Energy Data Book: Edition 33 (Oak Ridge, TN, July 2014); National Highway Traffic and Safety Administration, Summary of Fuel Economy Performance (Washington, DC, June 2014); U.S. Department of Commerce, Bureau of the Census, “Vehicle Inventory and Use Survey,” EC02TV (Washington, DC, December 2004); EIA, U.S. Department of Transportation, Research and Special Programs Administration, Air Carrier Statistics Monthly, December 2010/2009 (Washington, DC, December 2010); and United States Department of Defense, Defense Fuel Supply Center, Factbook (January, 2010). Projections: EIA, AEO2015 National Energy Modeling System run REF2015.D021915A.
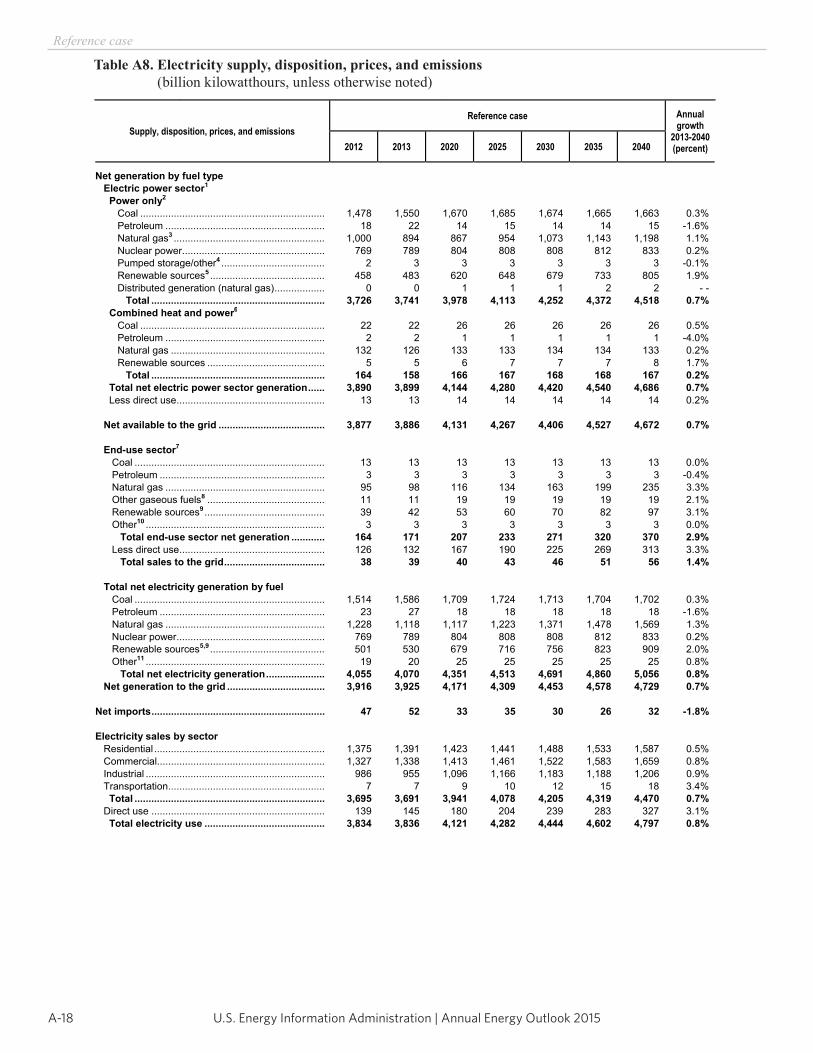
U.S. Energy Information Administration | Annual Energy Outlook 2015A-18
Reference case
Table A8. Electricity supply, disposition, prices, and emissions (billion kilowatthours, unless otherwise noted)
Energy Information Administration / Annual Energy Outlook 2015
Table A8. Electricity supply, disposition, prices, and emissions(billion kilowatthours, unless otherwise noted)
Supply, disposition, prices, and emissions Reference case Annual
growth 2013-2040(percent) 2012 2013 2020 2025 2030 2035 2040
Net generation by fuel type Electric power sector1
Power only2
Coal .................................................................. 1,478 1,550 1,670 1,685 1,674 1,665 1,663 0.3% Petroleum ......................................................... 18 22 14 15 14 14 15 -1.6% Natural gas3 ...................................................... 1,000 894 867 954 1,073 1,143 1,198 1.1% Nuclear power ................................................... 769 789 804 808 808 812 833 0.2% Pumped storage/other4 ..................................... 2 3 3 3 3 3 3 -0.1% Renewable sources5 ......................................... 458 483 620 648 679 733 805 1.9% Distributed generation (natural gas) .................. 0 0 1 1 1 2 2 - -
Total .............................................................. 3,726 3,741 3,978 4,113 4,252 4,372 4,518 0.7% Combined heat and power6
Coal .................................................................. 22 22 26 26 26 26 26 0.5% Petroleum ......................................................... 2 2 1 1 1 1 1 -4.0% Natural gas ....................................................... 132 126 133 133 134 134 133 0.2%
Renewable sources .......................................... 5 5 6 7 7 7 8 1.7% Total .............................................................. 164 158 166 167 168 168 167 0.2%
Total net electric power sector generation ...... 3,890 3,899 4,144 4,280 4,420 4,540 4,686 0.7% Less direct use ..................................................... 13 13 14 14 14 14 14 0.2%
Net available to the grid ...................................... 3,877 3,886 4,131 4,267 4,406 4,527 4,672 0.7%
End-use sector7
Coal .................................................................... 13 13 13 13 13 13 13 0.0% Petroleum ........................................................... 3 3 3 3 3 3 3 -0.4%
Natural gas ......................................................... 95 98 116 134 163 199 235 3.3% Other gaseous fuels8 .......................................... 11 11 19 19 19 19 19 2.1% Renewable sources9 ........................................... 39 42 53 60 70 82 97 3.1% Other10 ................................................................ 3 3 3 3 3 3 3 0.0% Total end-use sector net generation ............ 164 171 207 233 271 320 370 2.9% Less direct use .................................................... 126 132 167 190 225 269 313 3.3% Total sales to the grid .................................... 38 39 40 43 46 51 56 1.4%
Total net electricity generation by fuel Coal .................................................................... 1,514 1,586 1,709 1,724 1,713 1,704 1,702 0.3% Petroleum ........................................................... 23 27 18 18 18 18 18 -1.6%
Natural gas ......................................................... 1,228 1,118 1,117 1,223 1,371 1,478 1,569 1.3% Nuclear power ..................................................... 769 789 804 808 808 812 833 0.2% Renewable sources5,9 ......................................... 501 530 679 716 756 823 909 2.0% Other11 ................................................................ 19 20 25 25 25 25 25 0.8% Total net electricity generation ..................... 4,055 4,070 4,351 4,513 4,691 4,860 5,056 0.8%
Net generation to the grid ................................... 3,916 3,925 4,171 4,309 4,453 4,578 4,729 0.7%
Net imports .............................................................. 47 52 33 35 30 26 32 -1.8%
Electricity sales by sector Residential ............................................................. 1,375 1,391 1,423 1,441 1,488 1,533 1,587 0.5% Commercial............................................................ 1,327 1,338 1,413 1,461 1,522 1,583 1,659 0.8% Industrial ................................................................ 986 955 1,096 1,166 1,183 1,188 1,206 0.9% Transportation ........................................................ 7 7 9 10 12 15 18 3.4% Total .................................................................... 3,695 3,691 3,941 4,078 4,205 4,319 4,470 0.7% Direct use .............................................................. 139 145 180 204 239 283 327 3.1% Total electricity use ........................................... 3,834 3,836 4,121 4,282 4,444 4,602 4,797 0.8%
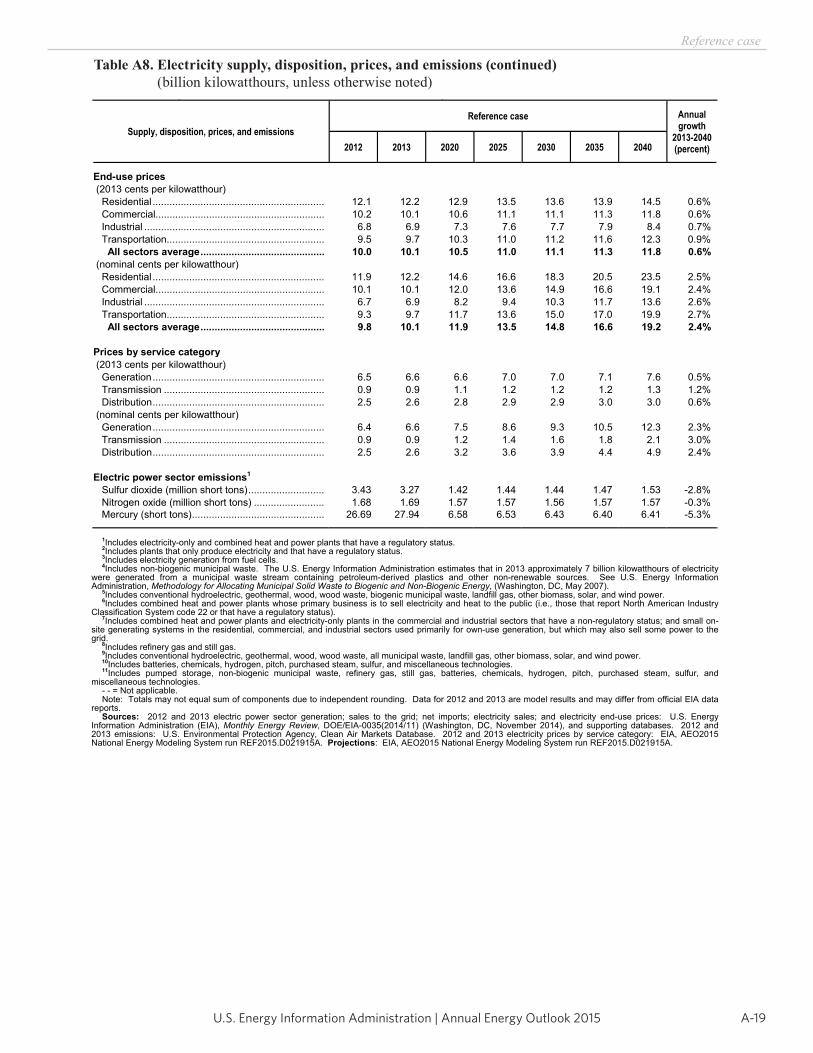
A-19U.S. Energy Information Administration | Annual Energy Outlook 2015
Reference case
Table A8. Electricity supply, disposition, prices, and emissions (continued) (billion kilowatthours, unless otherwise noted)
Energy Information Administration / Annual Energy Outlook 2015
Table A8. Electricity supply, disposition, prices, and emissions (continued)(billion kilowatthours, unless otherwise noted)
Supply, disposition, prices, and emissions Reference case Annual
growth 2013-2040(percent) 2012 2013 2020 2025 2030 2035 2040
End-use prices (2013 cents per kilowatthour) Residential ............................................................. 12.1 12.2 12.9 13.5 13.6 13.9 14.5 0.6% Commercial............................................................ 10.2 10.1 10.6 11.1 11.1 11.3 11.8 0.6% Industrial ................................................................ 6.8 6.9 7.3 7.6 7.7 7.9 8.4 0.7% Transportation ........................................................ 9.5 9.7 10.3 11.0 11.2 11.6 12.3 0.9% All sectors average ............................................ 10.0 10.1 10.5 11.0 11.1 11.3 11.8 0.6% (nominal cents per kilowatthour) Residential ............................................................. 11.9 12.2 14.6 16.6 18.3 20.5 23.5 2.5% Commercial............................................................ 10.1 10.1 12.0 13.6 14.9 16.6 19.1 2.4% Industrial ................................................................ 6.7 6.9 8.2 9.4 10.3 11.7 13.6 2.6% Transportation ........................................................ 9.3 9.7 11.7 13.6 15.0 17.0 19.9 2.7% All sectors average ............................................ 9.8 10.1 11.9 13.5 14.8 16.6 19.2 2.4%
Prices by service category (2013 cents per kilowatthour) Generation ............................................................. 6.5 6.6 6.6 7.0 7.0 7.1 7.6 0.5% Transmission ......................................................... 0.9 0.9 1.1 1.2 1.2 1.2 1.3 1.2% Distribution ............................................................. 2.5 2.6 2.8 2.9 2.9 3.0 3.0 0.6% (nominal cents per kilowatthour) Generation ............................................................. 6.4 6.6 7.5 8.6 9.3 10.5 12.3 2.3% Transmission ......................................................... 0.9 0.9 1.2 1.4 1.6 1.8 2.1 3.0% Distribution ............................................................. 2.5 2.6 3.2 3.6 3.9 4.4 4.9 2.4%
Electric power sector emissions1
Sulfur dioxide (million short tons) ........................... 3.43 3.27 1.42 1.44 1.44 1.47 1.53 -2.8% Nitrogen oxide (million short tons) ......................... 1.68 1.69 1.57 1.57 1.56 1.57 1.57 -0.3% Mercury (short tons) ............................................... 26.69 27.94 6.58 6.53 6.43 6.40 6.41 -5.3%
1Includes electricity-only and combined heat and power plants that have a regulatory status. 2Includes plants that only produce electricity and that have a regulatory status. 3Includes electricity generation from fuel cells. 4Includes non-biogenic municipal waste. The U.S. Energy Information Administration estimates that in 2013 approximately 7 billion kilowatthours of electricity
were generated from a municipal waste stream containing petroleum-derived plastics and other non-renewable sources. See U.S. Energy Information Administration, Methodology for Allocating Municipal Solid Waste to Biogenic and Non-Biogenic Energy, (Washington, DC, May 2007).
5Includes conventional hydroelectric, geothermal, wood, wood waste, biogenic municipal waste, landfill gas, other biomass, solar, and wind power. 6Includes combined heat and power plants whose primary business is to sell electricity and heat to the public (i.e., those that report North American Industry
Classification System code 22 or that have a regulatory status). 7Includes combined heat and power plants and electricity-only plants in the commercial and industrial sectors that have a non-regulatory status; and small on-
site generating systems in the residential, commercial, and industrial sectors used primarily for own-use generation, but which may also sell some power to the grid.
8Includes refinery gas and still gas. 9Includes conventional hydroelectric, geothermal, wood, wood waste, all municipal waste, landfill gas, other biomass, solar, and wind power. 10Includes batteries, chemicals, hydrogen, pitch, purchased steam, sulfur, and miscellaneous technologies. 11Includes pumped storage, non-biogenic municipal waste, refinery gas, still gas, batteries, chemicals, hydrogen, pitch, purchased steam, sulfur, and
miscellaneous technologies. - - = Not applicable. Note: Totals may not equal sum of components due to independent rounding. Data for 2012 and 2013 are model results and may differ from official EIA data
reports. Sources: 2012 and 2013 electric power sector generation; sales to the grid; net imports; electricity sales; and electricity end-use prices: U.S. Energy
Information Administration (EIA), Monthly Energy Review, DOE/EIA-0035(2014/11) (Washington, DC, November 2014), and supporting databases. 2012 and 2013 emissions: U.S. Environmental Protection Agency, Clean Air Markets Database. 2012 and 2013 electricity prices by service category: EIA, AEO2015 National Energy Modeling System run REF2015.D021915A. Projections: EIA, AEO2015 National Energy Modeling System run REF2015.D021915A.
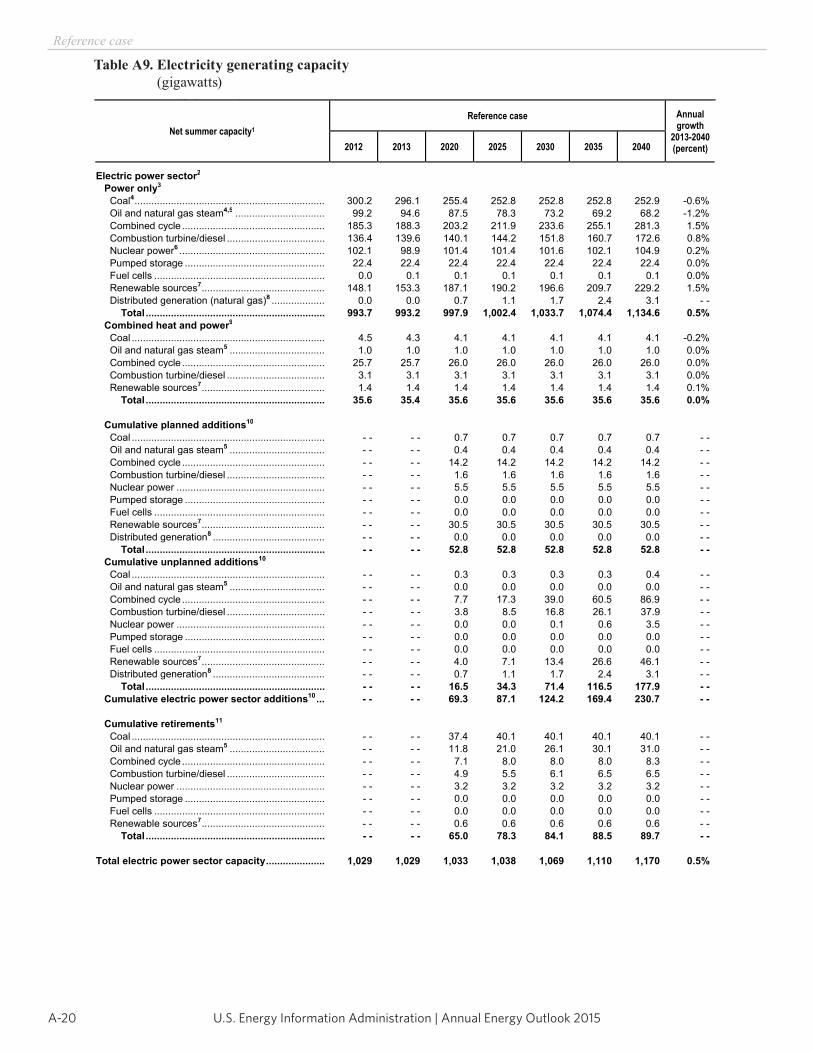
U.S. Energy Information Administration | Annual Energy Outlook 2015A-20
Reference case
Table A9. Electricity generating capacity (gigawatts)
Energy Information Administration / Annual Energy Outlook 2015
Table A9. Electricity generating capacity(gigawatts)
Net summer capacity1
Reference case Annual growth
2013-2040(percent) 2012 2013 2020 2025 2030 2035 2040
Electric power sector2
Power only3
Coal4 .................................................................... 300.2 296.1 255.4 252.8 252.8 252.8 252.9 -0.6% Oil and natural gas steam4,5 ................................ 99.2 94.6 87.5 78.3 73.2 69.2 68.2 -1.2% Combined cycle ................................................... 185.3 188.3 203.2 211.9 233.6 255.1 281.3 1.5% Combustion turbine/diesel ................................... 136.4 139.6 140.1 144.2 151.8 160.7 172.6 0.8% Nuclear power6 .................................................... 102.1 98.9 101.4 101.4 101.6 102.1 104.9 0.2% Pumped storage .................................................. 22.4 22.4 22.4 22.4 22.4 22.4 22.4 0.0% Fuel cells ............................................................. 0.0 0.1 0.1 0.1 0.1 0.1 0.1 0.0% Renewable sources7 ............................................ 148.1 153.3 187.1 190.2 196.6 209.7 229.2 1.5% Distributed generation (natural gas)8 ................... 0.0 0.0 0.7 1.1 1.7 2.4 3.1 - -
Total ................................................................ 993.7 993.2 997.9 1,002.4 1,033.7 1,074.4 1,134.6 0.5% Combined heat and power9
Coal ..................................................................... 4.5 4.3 4.1 4.1 4.1 4.1 4.1 -0.2% Oil and natural gas steam5 .................................. 1.0 1.0 1.0 1.0 1.0 1.0 1.0 0.0% Combined cycle ................................................... 25.7 25.7 26.0 26.0 26.0 26.0 26.0 0.0% Combustion turbine/diesel ................................... 3.1 3.1 3.1 3.1 3.1 3.1 3.1 0.0% Renewable sources7 ............................................ 1.4 1.4 1.4 1.4 1.4 1.4 1.4 0.1%
Total ................................................................ 35.6 35.4 35.6 35.6 35.6 35.6 35.6 0.0%
Cumulative planned additions10
Coal ..................................................................... - - - - 0.7 0.7 0.7 0.7 0.7 - - Oil and natural gas steam5 .................................. - - - - 0.4 0.4 0.4 0.4 0.4 - - Combined cycle ................................................... - - - - 14.2 14.2 14.2 14.2 14.2 - - Combustion turbine/diesel ................................... - - - - 1.6 1.6 1.6 1.6 1.6 - - Nuclear power ..................................................... - - - - 5.5 5.5 5.5 5.5 5.5 - -
Pumped storage .................................................. - - - - 0.0 0.0 0.0 0.0 0.0 - - Fuel cells ............................................................. - - - - 0.0 0.0 0.0 0.0 0.0 - - Renewable sources7 ............................................ - - - - 30.5 30.5 30.5 30.5 30.5 - - Distributed generation8 ........................................ - - - - 0.0 0.0 0.0 0.0 0.0 - -
Total ................................................................ - - - - 52.8 52.8 52.8 52.8 52.8 - - Cumulative unplanned additions10
Coal ..................................................................... - - - - 0.3 0.3 0.3 0.3 0.4 - - Oil and natural gas steam5 .................................. - - - - 0.0 0.0 0.0 0.0 0.0 - - Combined cycle ................................................... - - - - 7.7 17.3 39.0 60.5 86.9 - - Combustion turbine/diesel ................................... - - - - 3.8 8.5 16.8 26.1 37.9 - - Nuclear power ..................................................... - - - - 0.0 0.0 0.1 0.6 3.5 - -
Pumped storage .................................................. - - - - 0.0 0.0 0.0 0.0 0.0 - - Fuel cells ............................................................. - - - - 0.0 0.0 0.0 0.0 0.0 - - Renewable sources7 ............................................ - - - - 4.0 7.1 13.4 26.6 46.1 - - Distributed generation8 ........................................ - - - - 0.7 1.1 1.7 2.4 3.1 - -
Total ................................................................ - - - - 16.5 34.3 71.4 116.5 177.9 - - Cumulative electric power sector additions10 ... - - - - 69.3 87.1 124.2 169.4 230.7 - -
Cumulative retirements11
Coal ..................................................................... - - - - 37.4 40.1 40.1 40.1 40.1 - - Oil and natural gas steam5 .................................. - - - - 11.8 21.0 26.1 30.1 31.0 - - Combined cycle ................................................... - - - - 7.1 8.0 8.0 8.0 8.3 - - Combustion turbine/diesel ................................... - - - - 4.9 5.5 6.1 6.5 6.5 - - Nuclear power ..................................................... - - - - 3.2 3.2 3.2 3.2 3.2 - -
Pumped storage .................................................. - - - - 0.0 0.0 0.0 0.0 0.0 - - Fuel cells ............................................................. - - - - 0.0 0.0 0.0 0.0 0.0 - - Renewable sources7 ............................................ - - - - 0.6 0.6 0.6 0.6 0.6 - -
Total ................................................................ - - - - 65.0 78.3 84.1 88.5 89.7 - -
Total electric power sector capacity ..................... 1,029 1,029 1,033 1,038 1,069 1,110 1,170 0.5%

A-21U.S. Energy Information Administration | Annual Energy Outlook 2015
Reference case
Table A9. Electricity generating capacity (continued) (gigawatts)
Energy Information Administration / Annual Energy Outlook 2015
Table A9. Electricity generating capacity (continued)(gigawatts)
Net summer capacity1
Reference case Annual growth
2013-2040(percent) 2012 2013 2020 2025 2030 2035 2040
End-use generators12
Coal ....................................................................... 3.4 3.4 3.4 3.4 3.4 3.4 3.4 0.0% Petroleum .............................................................. 0.9 0.9 0.9 0.9 0.9 0.9 0.9 -0.4% Natural gas ............................................................ 16.3 16.9 19.5 22.7 27.6 33.6 38.9 3.1% Other gaseous fuels13 ............................................ 2.1 2.1 2.8 2.8 2.8 2.8 2.8 1.0% Renewable sources7 .............................................. 10.4 12.1 18.2 22.4 28.6 36.0 44.6 4.9% Other14 ................................................................... 0.5 0.5 0.5 0.5 0.5 0.5 0.5 0.0%
Total ................................................................... 33.6 36.0 45.3 52.8 63.8 77.2 91.1 3.5%
Cumulative capacity additions10......................... - - - - 10.5 18.0 29.1 42.6 56.5 - -
1Net summer capacity is the steady hourly output that generating equipment is expected to supply to system load (exclusive of auxiliary power), as demonstrated by tests during summer peak demand.
2Includes electricity-only and combined heat and power plants that have a regulatory status. 3Includes plants that only produce electricity and that have a regulatory status. Includes capacity increases (uprates) at existing units. 4Coal and oil and natural gas steam capacity reflect the impact of 4.1 GW of existing coal capacity converting to gas steam capacity. 5Includes oil-, gas-, and dual-fired capacity. 6Nuclear capacity includes 0.2 gigawatts of uprates. 7Includes conventional hydroelectric, geothermal, wood, wood waste, all municipal waste, landfill gas, other biomass, solar, and wind power. Facilities co-firing
biomass and coal are classified as coal. 8Primarily peak load capacity fueled by natural gas. 9Includes combined heat and power plants whose primary business is to sell electricity and heat to the public (i.e., those that report North American Industry
Classification System code 22 or that have a regulatory status). 10Cumulative additions after December 31, 2013. 11Cumulative retirements after December 31, 2013. 12Includes combined heat and power plants and electricity-only plants in the commercial and industrial sectors that have a non-regulatory status; and small on-
site generating systems in the residential, commercial, and industrial sectors used primarily for own-use generation, but which may also sell some power to the grid.
13Includes refinery gas and still gas. 14Includes batteries, chemicals, hydrogen, pitch, purchased steam, sulfur, and miscellaneous technologies. - - = Not applicable. Note: Totals may not equal sum of components due to independent rounding. Data for 2012 and 2013 are model results and may differ from official EIA data
reports. Sources: 2012 and 2013 capacity and projected planned additions: U.S. Energy Information Administration (EIA), Form EIA-860, "Annual Electric Generator
Report” (preliminary). Projections: EIA, AEO2015 National Energy Modeling System run REF2015.D021915A.
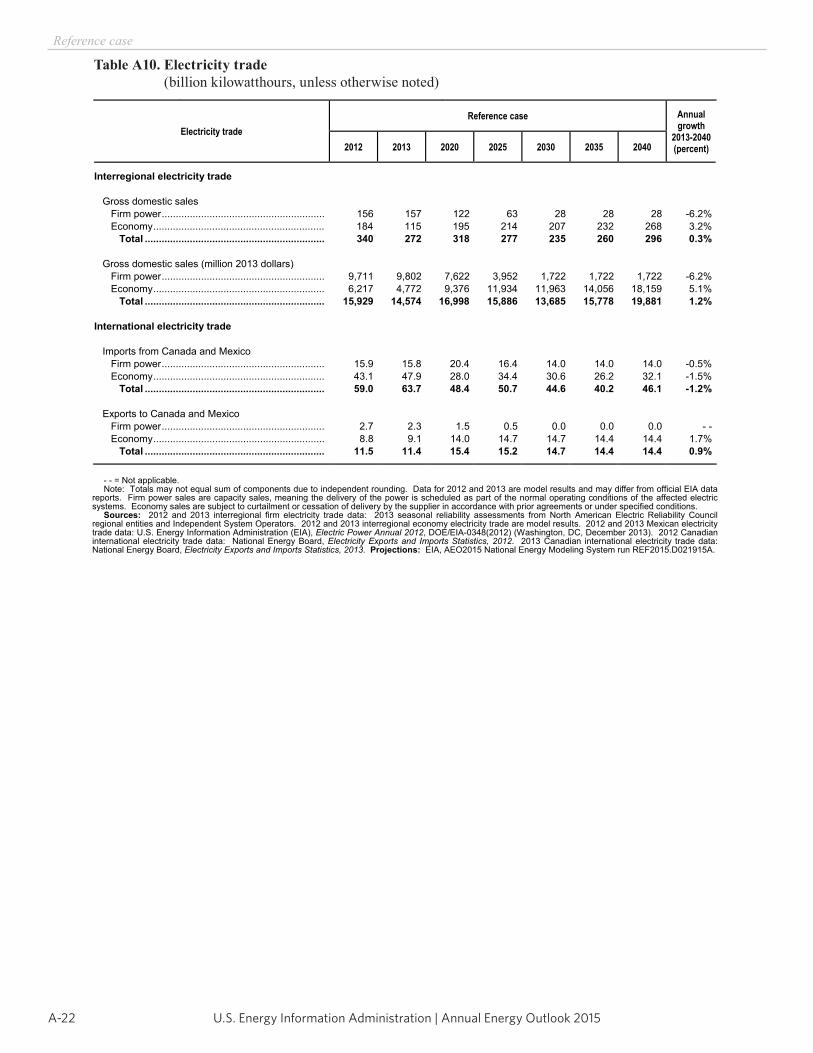
U.S. Energy Information Administration | Annual Energy Outlook 2015A-22
Reference case
Table A10. Electricity trade (billion kilowatthours, unless otherwise noted)
Energy Information Administration / Annual Energy Outlook 2015
Table A10. Electricity trade(billion kilowatthours, unless otherwise noted)
Electricity trade Reference case Annual
growth 2013-2040(percent) 2012 2013 2020 2025 2030 2035 2040
Interregional electricity trade
Gross domestic sales Firm power .......................................................... 156 157 122 63 28 28 28 -6.2% Economy ............................................................. 184 115 195 214 207 232 268 3.2% Total ................................................................ 340 272 318 277 235 260 296 0.3%
Gross domestic sales (million 2013 dollars) Firm power .......................................................... 9,711 9,802 7,622 3,952 1,722 1,722 1,722 -6.2% Economy ............................................................. 6,217 4,772 9,376 11,934 11,963 14,056 18,159 5.1% Total ................................................................ 15,929 14,574 16,998 15,886 13,685 15,778 19,881 1.2%
International electricity trade
Imports from Canada and Mexico Firm power .......................................................... 15.9 15.8 20.4 16.4 14.0 14.0 14.0 -0.5% Economy ............................................................. 43.1 47.9 28.0 34.4 30.6 26.2 32.1 -1.5% Total ................................................................ 59.0 63.7 48.4 50.7 44.6 40.2 46.1 -1.2%
Exports to Canada and Mexico Firm power .......................................................... 2.7 2.3 1.5 0.5 0.0 0.0 0.0 - - Economy ............................................................. 8.8 9.1 14.0 14.7 14.7 14.4 14.4 1.7% Total ................................................................ 11.5 11.4 15.4 15.2 14.7 14.4 14.4 0.9%
- - = Not applicable. Note: Totals may not equal sum of components due to independent rounding. Data for 2012 and 2013 are model results and may differ from official EIA data
reports. Firm power sales are capacity sales, meaning the delivery of the power is scheduled as part of the normal operating conditions of the affected electric systems. Economy sales are subject to curtailment or cessation of delivery by the supplier in accordance with prior agreements or under specified conditions.
Sources: 2012 and 2013 interregional firm electricity trade data: 2013 seasonal reliability assessments from North American Electric Reliability Council regional entities and Independent System Operators. 2012 and 2013 interregional economy electricity trade are model results. 2012 and 2013 Mexican electricity trade data: U.S. Energy Information Administration (EIA), Electric Power Annual 2012, DOE/EIA-0348(2012) (Washington, DC, December 2013). 2012 Canadian international electricity trade data: National Energy Board, Electricity Exports and Imports Statistics, 2012. 2013 Canadian international electricity trade data: National Energy Board, Electricity Exports and Imports Statistics, 2013. Projections: EIA, AEO2015 National Energy Modeling System run REF2015.D021915A.
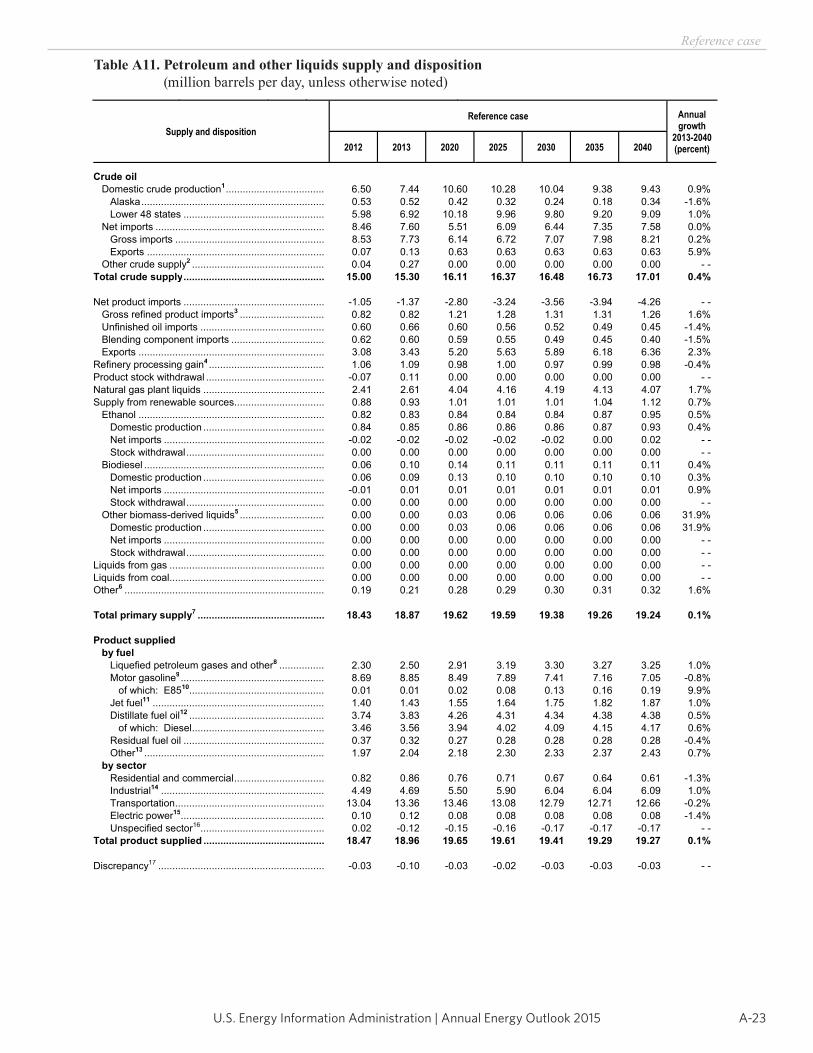
A-23U.S. Energy Information Administration | Annual Energy Outlook 2015
Reference case
Table A11. Petroleum and other liquids supply and disposition (million barrels per day, unless otherwise noted)
Energy Information Administration / Annual Energy Outlook 2015
Table A11. Petroleum and other liquids supply and disposition(million barrels per day, unless otherwise noted)
Supply and disposition Reference case Annual
growth 2013-2040(percent) 2012 2013 2020 2025 2030 2035 2040
Crude oil Domestic crude production1 ................................... 6.50 7.44 10.60 10.28 10.04 9.38 9.43 0.9% Alaska ................................................................. 0.53 0.52 0.42 0.32 0.24 0.18 0.34 -1.6%
Lower 48 states .................................................. 5.98 6.92 10.18 9.96 9.80 9.20 9.09 1.0% Net imports ............................................................ 8.46 7.60 5.51 6.09 6.44 7.35 7.58 0.0%
Gross imports ..................................................... 8.53 7.73 6.14 6.72 7.07 7.98 8.21 0.2% Exports ............................................................... 0.07 0.13 0.63 0.63 0.63 0.63 0.63 5.9% Other crude supply2 ............................................... 0.04 0.27 0.00 0.00 0.00 0.00 0.00 - - Total crude supply .................................................. 15.00 15.30 16.11 16.37 16.48 16.73 17.01 0.4%
Net product imports .................................................. -1.05 -1.37 -2.80 -3.24 -3.56 -3.94 -4.26 - - Gross refined product imports3 .............................. 0.82 0.82 1.21 1.28 1.31 1.31 1.26 1.6% Unfinished oil imports ............................................ 0.60 0.66 0.60 0.56 0.52 0.49 0.45 -1.4% Blending component imports ................................. 0.62 0.60 0.59 0.55 0.49 0.45 0.40 -1.5% Exports .................................................................. 3.08 3.43 5.20 5.63 5.89 6.18 6.36 2.3% Refinery processing gain4 ......................................... 1.06 1.09 0.98 1.00 0.97 0.99 0.98 -0.4% Product stock withdrawal .......................................... -0.07 0.11 0.00 0.00 0.00 0.00 0.00 - - Natural gas plant liquids ........................................... 2.41 2.61 4.04 4.16 4.19 4.13 4.07 1.7% Supply from renewable sources................................ 0.88 0.93 1.01 1.01 1.01 1.04 1.12 0.7% Ethanol .................................................................. 0.82 0.83 0.84 0.84 0.84 0.87 0.95 0.5%
Domestic production ........................................... 0.84 0.85 0.86 0.86 0.86 0.87 0.93 0.4% Net imports ......................................................... -0.02 -0.02 -0.02 -0.02 -0.02 0.00 0.02 - - Stock withdrawal ................................................. 0.00 0.00 0.00 0.00 0.00 0.00 0.00 - -
Biodiesel ................................................................ 0.06 0.10 0.14 0.11 0.11 0.11 0.11 0.4% Domestic production ........................................... 0.06 0.09 0.13 0.10 0.10 0.10 0.10 0.3%
Net imports ......................................................... -0.01 0.01 0.01 0.01 0.01 0.01 0.01 0.9% Stock withdrawal ................................................. 0.00 0.00 0.00 0.00 0.00 0.00 0.00 - -
Other biomass-derived liquids5 .............................. 0.00 0.00 0.03 0.06 0.06 0.06 0.06 31.9% Domestic production ........................................... 0.00 0.00 0.03 0.06 0.06 0.06 0.06 31.9% Net imports ......................................................... 0.00 0.00 0.00 0.00 0.00 0.00 0.00 - - Stock withdrawal ................................................. 0.00 0.00 0.00 0.00 0.00 0.00 0.00 - -
Liquids from gas ....................................................... 0.00 0.00 0.00 0.00 0.00 0.00 0.00 - - Liquids from coal ....................................................... 0.00 0.00 0.00 0.00 0.00 0.00 0.00 - - Other6 ....................................................................... 0.19 0.21 0.28 0.29 0.30 0.31 0.32 1.6%
Total primary supply7 ............................................. 18.43 18.87 19.62 19.59 19.38 19.26 19.24 0.1%
Product supplied by fuel
Liquefied petroleum gases and other8 ................ 2.30 2.50 2.91 3.19 3.30 3.27 3.25 1.0% Motor gasoline9 ................................................... 8.69 8.85 8.49 7.89 7.41 7.16 7.05 -0.8% of which: E8510................................................ 0.01 0.01 0.02 0.08 0.13 0.16 0.19 9.9% Jet fuel11 ............................................................. 1.40 1.43 1.55 1.64 1.75 1.82 1.87 1.0% Distillate fuel oil12 ................................................ 3.74 3.83 4.26 4.31 4.34 4.38 4.38 0.5% of which: Diesel ............................................... 3.46 3.56 3.94 4.02 4.09 4.15 4.17 0.6% Residual fuel oil .................................................. 0.37 0.32 0.27 0.28 0.28 0.28 0.28 -0.4% Other13 ................................................................ 1.97 2.04 2.18 2.30 2.33 2.37 2.43 0.7%
by sector Residential and commercial ................................ 0.82 0.86 0.76 0.71 0.67 0.64 0.61 -1.3% Industrial14 .......................................................... 4.49 4.69 5.50 5.90 6.04 6.04 6.09 1.0% Transportation ..................................................... 13.04 13.36 13.46 13.08 12.79 12.71 12.66 -0.2% Electric power15................................................... 0.10 0.12 0.08 0.08 0.08 0.08 0.08 -1.4% Unspecified sector16............................................ 0.02 -0.12 -0.15 -0.16 -0.17 -0.17 -0.17 - -
Total product supplied ........................................... 18.47 18.96 19.65 19.61 19.41 19.29 19.27 0.1%
Discrepancy17 ........................................................... -0.03 -0.10 -0.03 -0.02 -0.03 -0.03 -0.03 - -
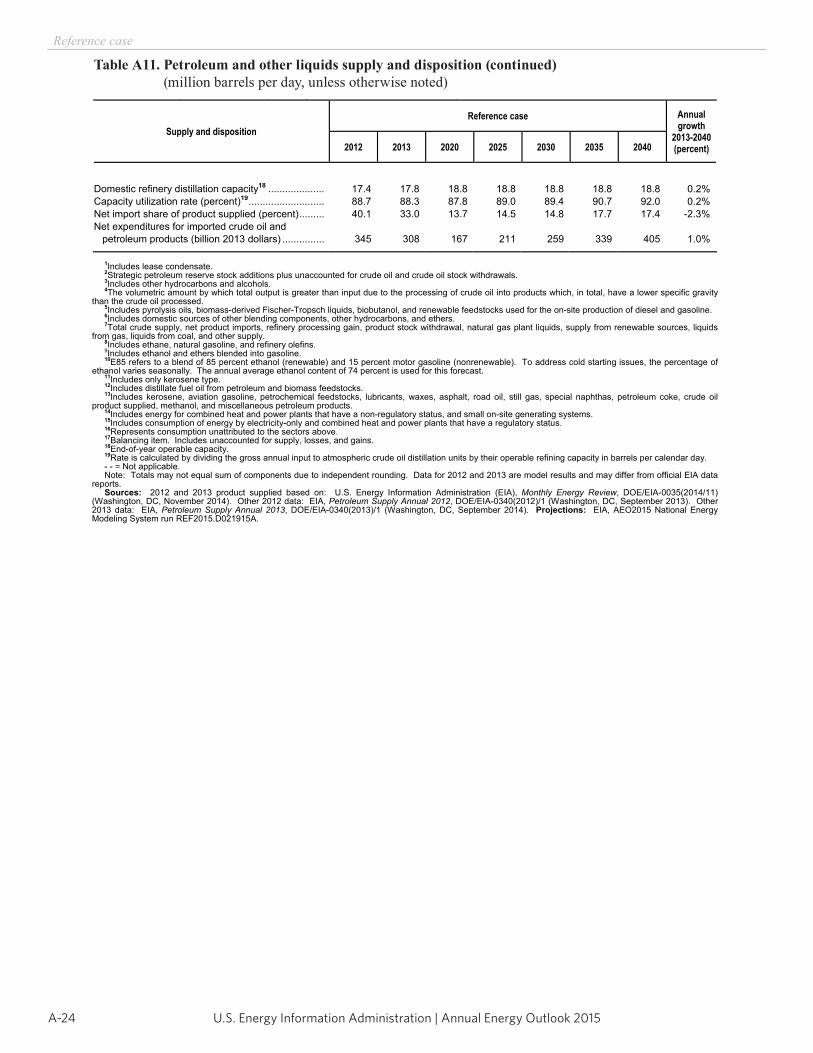
U.S. Energy Information Administration | Annual Energy Outlook 2015A-24
Reference case
Table A11. Petroleum and other liquids supply and disposition (continued) (million barrels per day, unless otherwise noted)
Energy Information Administration / Annual Energy Outlook 2015
Table A11. Petroleum and other liquids supply and disposition (continued)(million barrels per day, unless otherwise noted)
Supply and disposition Reference case Annual
growth 2013-2040(percent) 2012 2013 2020 2025 2030 2035 2040
Domestic refinery distillation capacity18 .................... 17.4 17.8 18.8 18.8 18.8 18.8 18.8 0.2% Capacity utilization rate (percent)19 ........................... 88.7 88.3 87.8 89.0 89.4 90.7 92.0 0.2% Net import share of product supplied (percent) ......... 40.1 33.0 13.7 14.5 14.8 17.7 17.4 -2.3% Net expenditures for imported crude oil and petroleum products (billion 2013 dollars) ............... 345 308 167 211 259 339 405 1.0%
1Includes lease condensate. 2Strategic petroleum reserve stock additions plus unaccounted for crude oil and crude oil stock withdrawals. 3Includes other hydrocarbons and alcohols. 4The volumetric amount by which total output is greater than input due to the processing of crude oil into products which, in total, have a lower specific gravity
than the crude oil processed. 5Includes pyrolysis oils, biomass-derived Fischer-Tropsch liquids, biobutanol, and renewable feedstocks used for the on-site production of diesel and gasoline. 6Includes domestic sources of other blending components, other hydrocarbons, and ethers. 7Total crude supply, net product imports, refinery processing gain, product stock withdrawal, natural gas plant liquids, supply from renewable sources, liquids
from gas, liquids from coal, and other supply. 8Includes ethane, natural gasoline, and refinery olefins.9Includes ethanol and ethers blended into gasoline. 10E85 refers to a blend of 85 percent ethanol (renewable) and 15 percent motor gasoline (nonrenewable). To address cold starting issues, the percentage of
ethanol varies seasonally. The annual average ethanol content of 74 percent is used for this forecast. 11Includes only kerosene type. 12Includes distillate fuel oil from petroleum and biomass feedstocks. 13Includes kerosene, aviation gasoline, petrochemical feedstocks, lubricants, waxes, asphalt, road oil, still gas, special naphthas, petroleum coke, crude oil
product supplied, methanol, and miscellaneous petroleum products. 14Includes energy for combined heat and power plants that have a non-regulatory status, and small on-site generating systems. 15Includes consumption of energy by electricity-only and combined heat and power plants that have a regulatory status. 16Represents consumption unattributed to the sectors above. 17Balancing item. Includes unaccounted for supply, losses, and gains. 18End-of-year operable capacity. 19Rate is calculated by dividing the gross annual input to atmospheric crude oil distillation units by their operable refining capacity in barrels per calendar day. - - = Not applicable. Note: Totals may not equal sum of components due to independent rounding. Data for 2012 and 2013 are model results and may differ from official EIA data
reports. Sources: 2012 and 2013 product supplied based on: U.S. Energy Information Administration (EIA), Monthly Energy Review, DOE/EIA-0035(2014/11)
(Washington, DC, November 2014). Other 2012 data: EIA, Petroleum Supply Annual 2012, DOE/EIA-0340(2012)/1 (Washington, DC, September 2013). Other 2013 data: EIA, Petroleum Supply Annual 2013, DOE/EIA-0340(2013)/1 (Washington, DC, September 2014). Projections: EIA, AEO2015 National Energy Modeling System run REF2015.D021915A.
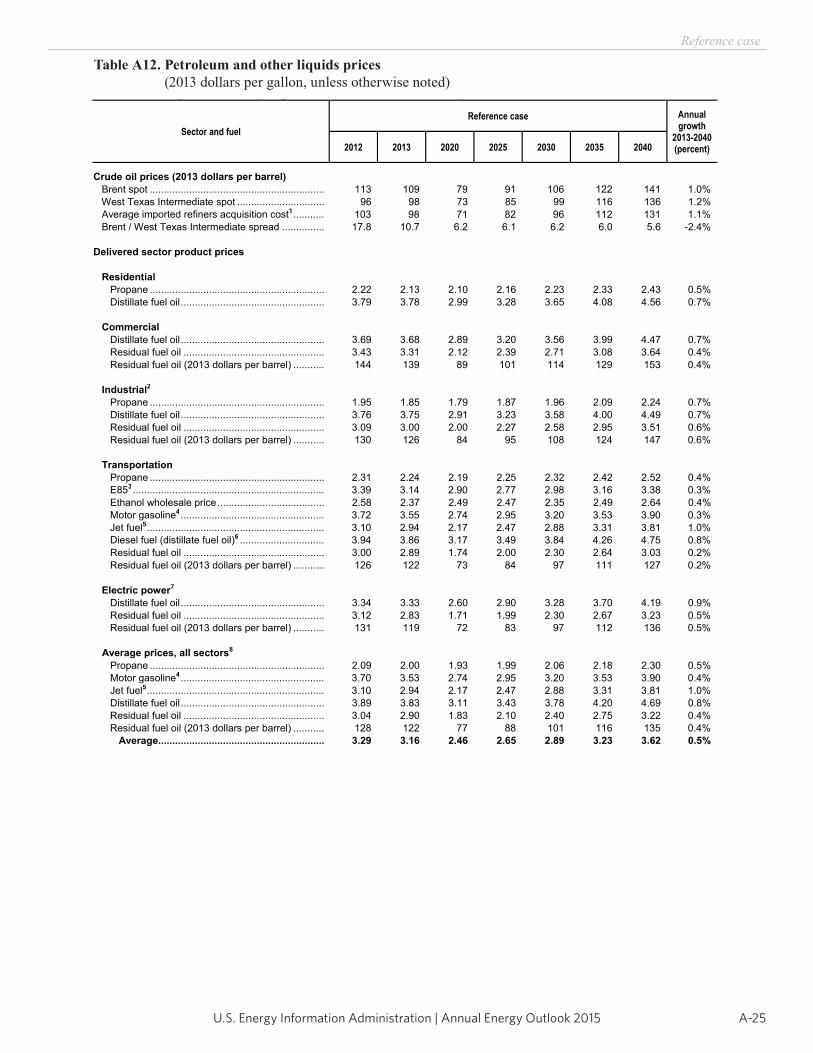
A-25U.S. Energy Information Administration | Annual Energy Outlook 2015
Reference case
Table A12. Petroleum and other liquids prices (2013 dollars per gallon, unless otherwise noted)
Energy Information Administration / Annual Energy Outlook 2015
Table A12. Petroleum and other liquids prices(2013 dollars per gallon, unless otherwise noted)
Sector and fuel Reference case Annual
growth 2013-2040(percent) 2012 2013 2020 2025 2030 2035 2040
Crude oil prices (2013 dollars per barrel) Brent spot .............................................................. 113 109 79 91 106 122 141 1.0% West Texas Intermediate spot ............................... 96 98 73 85 99 116 136 1.2% Average imported refiners acquisition cost1 ........... 103 98 71 82 96 112 131 1.1% Brent / West Texas Intermediate spread ............... 17.8 10.7 6.2 6.1 6.2 6.0 5.6 -2.4%
Delivered sector product prices
Residential Propane .............................................................. 2.22 2.13 2.10 2.16 2.23 2.33 2.43 0.5%
Distillate fuel oil ................................................... 3.79 3.78 2.99 3.28 3.65 4.08 4.56 0.7%
Commercial Distillate fuel oil ................................................... 3.69 3.68 2.89 3.20 3.56 3.99 4.47 0.7% Residual fuel oil .................................................. 3.43 3.31 2.12 2.39 2.71 3.08 3.64 0.4% Residual fuel oil (2013 dollars per barrel) ........... 144 139 89 101 114 129 153 0.4%
Industrial2 Propane .............................................................. 1.95 1.85 1.79 1.87 1.96 2.09 2.24 0.7%
Distillate fuel oil ................................................... 3.76 3.75 2.91 3.23 3.58 4.00 4.49 0.7% Residual fuel oil .................................................. 3.09 3.00 2.00 2.27 2.58 2.95 3.51 0.6% Residual fuel oil (2013 dollars per barrel) ........... 130 126 84 95 108 124 147 0.6%
Transportation Propane .............................................................. 2.31 2.24 2.19 2.25 2.32 2.42 2.52 0.4%
E853 .................................................................... 3.39 3.14 2.90 2.77 2.98 3.16 3.38 0.3% Ethanol wholesale price ...................................... 2.58 2.37 2.49 2.47 2.35 2.49 2.64 0.4% Motor gasoline4 ................................................... 3.72 3.55 2.74 2.95 3.20 3.53 3.90 0.3% Jet fuel5 ............................................................... 3.10 2.94 2.17 2.47 2.88 3.31 3.81 1.0% Diesel fuel (distillate fuel oil)6 .............................. 3.94 3.86 3.17 3.49 3.84 4.26 4.75 0.8% Residual fuel oil .................................................. 3.00 2.89 1.74 2.00 2.30 2.64 3.03 0.2% Residual fuel oil (2013 dollars per barrel) ........... 126 122 73 84 97 111 127 0.2%
Electric power7
Distillate fuel oil ................................................... 3.34 3.33 2.60 2.90 3.28 3.70 4.19 0.9% Residual fuel oil .................................................. 3.12 2.83 1.71 1.99 2.30 2.67 3.23 0.5% Residual fuel oil (2013 dollars per barrel) ........... 131 119 72 83 97 112 136 0.5%
Average prices, all sectors8
Propane .............................................................. 2.09 2.00 1.93 1.99 2.06 2.18 2.30 0.5% Motor gasoline4 ................................................... 3.70 3.53 2.74 2.95 3.20 3.53 3.90 0.4% Jet fuel5 ............................................................... 3.10 2.94 2.17 2.47 2.88 3.31 3.81 1.0% Distillate fuel oil ................................................... 3.89 3.83 3.11 3.43 3.78 4.20 4.69 0.8% Residual fuel oil .................................................. 3.04 2.90 1.83 2.10 2.40 2.75 3.22 0.4% Residual fuel oil (2013 dollars per barrel) ........... 128 122 77 88 101 116 135 0.4% Average........................................................... 3.29 3.16 2.46 2.65 2.89 3.23 3.62 0.5%
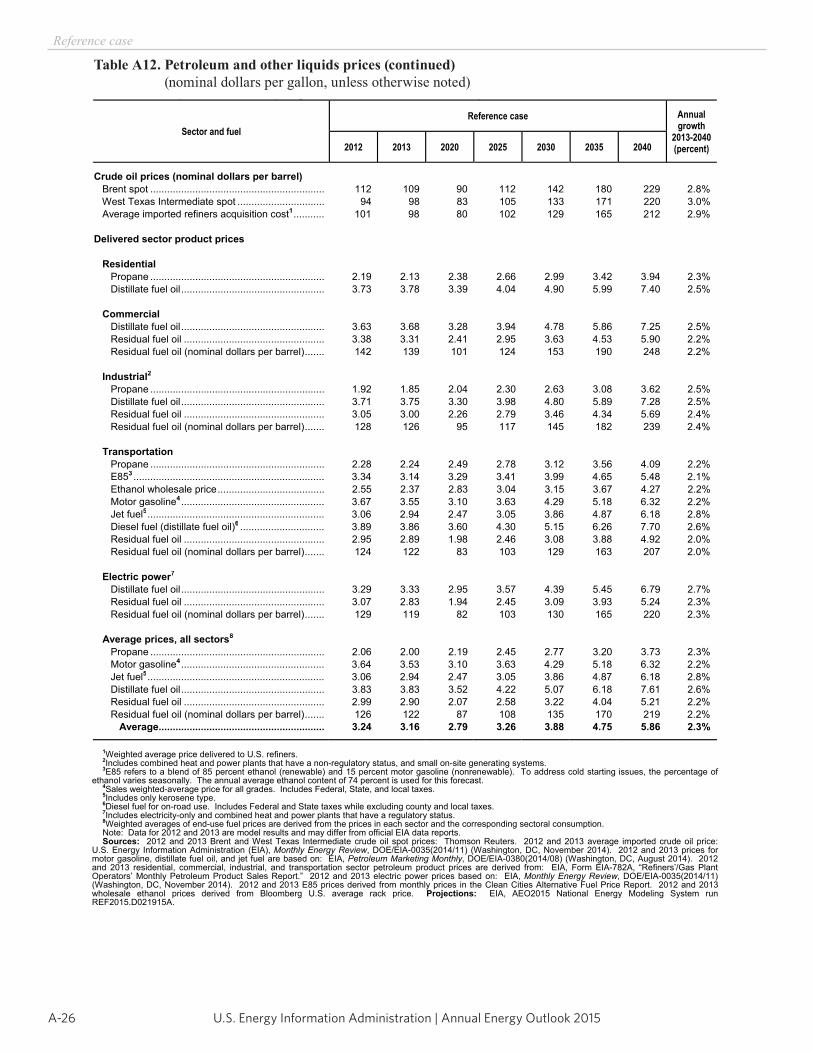
U.S. Energy Information Administration | Annual Energy Outlook 2015A-26
Reference case
Table A12. Petroleum and other liquids prices (continued) (nominal dollars per gallon, unless otherwise noted)
Energy Information Administration / Annual Energy Outlook 2015
Table A12. Petroleum and other liquids prices (continued)(nominal dollars per gallon, unless otherwise noted)
Sector and fuel Reference case Annual
growth 2013-2040(percent) 2012 2013 2020 2025 2030 2035 2040
Crude oil prices (nominal dollars per barrel) Brent spot .............................................................. 112 109 90 112 142 180 229 2.8% West Texas Intermediate spot ............................... 94 98 83 105 133 171 220 3.0% Average imported refiners acquisition cost1 ........... 101 98 80 102 129 165 212 2.9%
Delivered sector product prices
Residential Propane .............................................................. 2.19 2.13 2.38 2.66 2.99 3.42 3.94 2.3%
Distillate fuel oil ................................................... 3.73 3.78 3.39 4.04 4.90 5.99 7.40 2.5%
Commercial Distillate fuel oil ................................................... 3.63 3.68 3.28 3.94 4.78 5.86 7.25 2.5% Residual fuel oil .................................................. 3.38 3.31 2.41 2.95 3.63 4.53 5.90 2.2% Residual fuel oil (nominal dollars per barrel) ....... 142 139 101 124 153 190 248 2.2%
Industrial2 Propane .............................................................. 1.92 1.85 2.04 2.30 2.63 3.08 3.62 2.5%
Distillate fuel oil ................................................... 3.71 3.75 3.30 3.98 4.80 5.89 7.28 2.5% Residual fuel oil .................................................. 3.05 3.00 2.26 2.79 3.46 4.34 5.69 2.4% Residual fuel oil (nominal dollars per barrel) ....... 128 126 95 117 145 182 239 2.4%
Transportation Propane .............................................................. 2.28 2.24 2.49 2.78 3.12 3.56 4.09 2.2%
E853 .................................................................... 3.34 3.14 3.29 3.41 3.99 4.65 5.48 2.1% Ethanol wholesale price ...................................... 2.55 2.37 2.83 3.04 3.15 3.67 4.27 2.2% Motor gasoline4 ................................................... 3.67 3.55 3.10 3.63 4.29 5.18 6.32 2.2% Jet fuel5 ............................................................... 3.06 2.94 2.47 3.05 3.86 4.87 6.18 2.8% Diesel fuel (distillate fuel oil)6 .............................. 3.89 3.86 3.60 4.30 5.15 6.26 7.70 2.6% Residual fuel oil .................................................. 2.95 2.89 1.98 2.46 3.08 3.88 4.92 2.0% Residual fuel oil (nominal dollars per barrel) ....... 124 122 83 103 129 163 207 2.0%
Electric power7
Distillate fuel oil ................................................... 3.29 3.33 2.95 3.57 4.39 5.45 6.79 2.7% Residual fuel oil .................................................. 3.07 2.83 1.94 2.45 3.09 3.93 5.24 2.3% Residual fuel oil (nominal dollars per barrel) ....... 129 119 82 103 130 165 220 2.3%
Average prices, all sectors8
Propane .............................................................. 2.06 2.00 2.19 2.45 2.77 3.20 3.73 2.3% Motor gasoline4 ................................................... 3.64 3.53 3.10 3.63 4.29 5.18 6.32 2.2% Jet fuel5 ............................................................... 3.06 2.94 2.47 3.05 3.86 4.87 6.18 2.8% Distillate fuel oil ................................................... 3.83 3.83 3.52 4.22 5.07 6.18 7.61 2.6% Residual fuel oil .................................................. 2.99 2.90 2.07 2.58 3.22 4.04 5.21 2.2% Residual fuel oil (nominal dollars per barrel) ....... 126 122 87 108 135 170 219 2.2% Average........................................................... 3.24 3.16 2.79 3.26 3.88 4.75 5.86 2.3%
1Weighted average price delivered to U.S. refiners. 2Includes combined heat and power plants that have a non-regulatory status, and small on-site generating systems. 3E85 refers to a blend of 85 percent ethanol (renewable) and 15 percent motor gasoline (nonrenewable). To address cold starting issues, the percentage of
ethanol varies seasonally. The annual average ethanol content of 74 percent is used for this forecast. 4Sales weighted-average price for all grades. Includes Federal, State, and local taxes. 5Includes only kerosene type. 6Diesel fuel for on-road use. Includes Federal and State taxes while excluding county and local taxes. 7Includes electricity-only and combined heat and power plants that have a regulatory status. 8Weighted averages of end-use fuel prices are derived from the prices in each sector and the corresponding sectoral consumption.Note: Data for 2012 and 2013 are model results and may differ from official EIA data reports. Sources: 2012 and 2013 Brent and West Texas Intermediate crude oil spot prices: Thomson Reuters. 2012 and 2013 average imported crude oil price:
U.S. Energy Information Administration (EIA), Monthly Energy Review, DOE/EIA-0035(2014/11) (Washington, DC, November 2014). 2012 and 2013 prices for motor gasoline, distillate fuel oil, and jet fuel are based on: EIA, Petroleum Marketing Monthly, DOE/EIA-0380(2014/08) (Washington, DC, August 2014). 2012 and 2013 residential, commercial, industrial, and transportation sector petroleum product prices are derived from: EIA, Form EIA-782A, “Refiners’/Gas Plant Operators’ Monthly Petroleum Product Sales Report.” 2012 and 2013 electric power prices based on: EIA, Monthly Energy Review, DOE/EIA-0035(2014/11) (Washington, DC, November 2014). 2012 and 2013 E85 prices derived from monthly prices in the Clean Cities Alternative Fuel Price Report. 2012 and 2013 wholesale ethanol prices derived from Bloomberg U.S. average rack price. Projections: EIA, AEO2015 National Energy Modeling System run REF2015.D021915A.
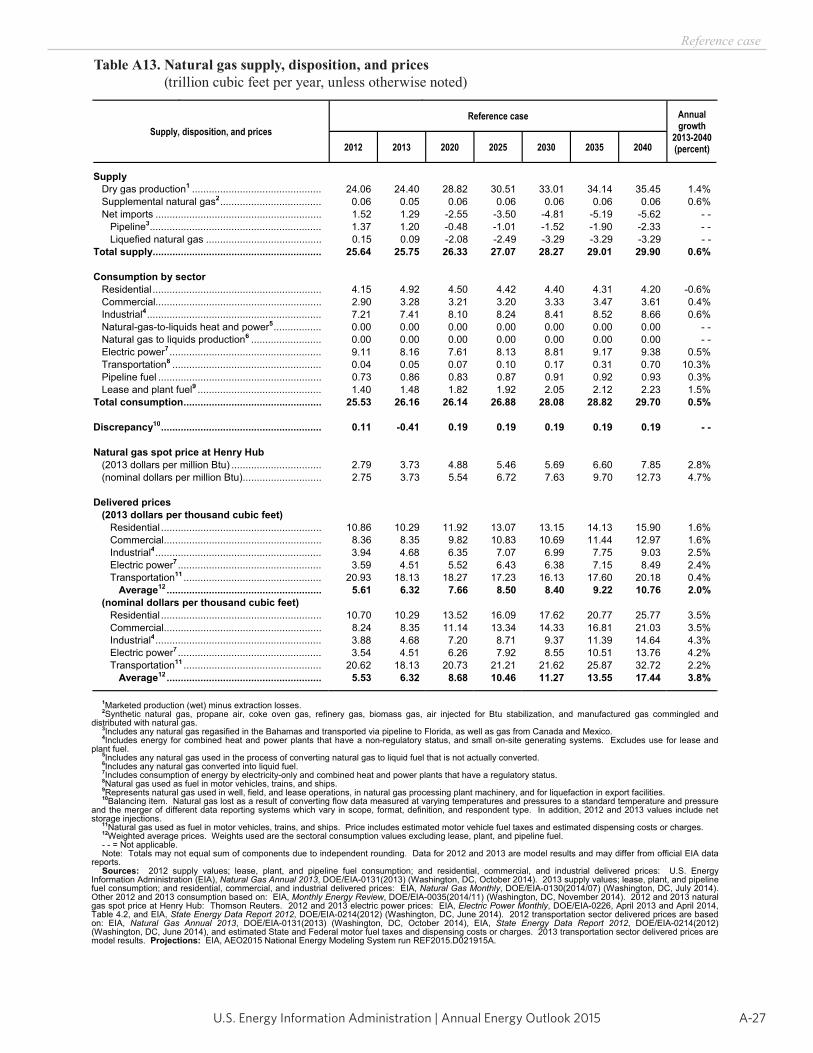
A-27U.S. Energy Information Administration | Annual Energy Outlook 2015
Reference case
Table A13. Natural gas supply, disposition, and prices (trillion cubic feet per year, unless otherwise noted)
Energy Information Administration / Annual Energy Outlook 2015
Table A13. Natural gas supply, disposition, and prices(trillion cubic feet, unless otherwise noted)
Supply, disposition, and prices Reference case Annual
growth 2013-2040(percent) 2012 2013 2020 2025 2030 2035 2040
Supply Dry gas production1 .............................................. 24.06 24.40 28.82 30.51 33.01 34.14 35.45 1.4% Supplemental natural gas2 .................................... 0.06 0.05 0.06 0.06 0.06 0.06 0.06 0.6% Net imports ........................................................... 1.52 1.29 -2.55 -3.50 -4.81 -5.19 -5.62 - -
Pipeline3............................................................. 1.37 1.20 -0.48 -1.01 -1.52 -1.90 -2.33 - - Liquefied natural gas ......................................... 0.15 0.09 -2.08 -2.49 -3.29 -3.29 -3.29 - -
Total supply............................................................ 25.64 25.75 26.33 27.07 28.27 29.01 29.90 0.6%
Consumption by sector Residential ............................................................ 4.15 4.92 4.50 4.42 4.40 4.31 4.20 -0.6% Commercial........................................................... 2.90 3.28 3.21 3.20 3.33 3.47 3.61 0.4% Industrial4 .............................................................. 7.21 7.41 8.10 8.24 8.41 8.52 8.66 0.6%
Natural-gas-to-liquids heat and power5 ................. 0.00 0.00 0.00 0.00 0.00 0.00 0.00 - - Natural gas to liquids production6 ......................... 0.00 0.00 0.00 0.00 0.00 0.00 0.00 - - Electric power7 ...................................................... 9.11 8.16 7.61 8.13 8.81 9.17 9.38 0.5% Transportation8 ..................................................... 0.04 0.05 0.07 0.10 0.17 0.31 0.70 10.3% Pipeline fuel .......................................................... 0.73 0.86 0.83 0.87 0.91 0.92 0.93 0.3% Lease and plant fuel9 ............................................ 1.40 1.48 1.82 1.92 2.05 2.12 2.23 1.5% Total consumption ................................................. 25.53 26.16 26.14 26.88 28.08 28.82 29.70 0.5%
Discrepancy10 ......................................................... 0.11 -0.41 0.19 0.19 0.19 0.19 0.19 - -
Natural gas spot price at Henry Hub (2013 dollars per million Btu) ................................ 2.79 3.73 4.88 5.46 5.69 6.60 7.85 2.8% (nominal dollars per million Btu) ............................ 2.75 3.73 5.54 6.72 7.63 9.70 12.73 4.7%
Delivered prices (2013 dollars per thousand cubic feet)
Residential ......................................................... 10.86 10.29 11.92 13.07 13.15 14.13 15.90 1.6% Commercial ........................................................ 8.36 8.35 9.82 10.83 10.69 11.44 12.97 1.6% Industrial4 ........................................................... 3.94 4.68 6.35 7.07 6.99 7.75 9.03 2.5% Electric power7 ................................................... 3.59 4.51 5.52 6.43 6.38 7.15 8.49 2.4% Transportation11 ................................................. 20.93 18.13 18.27 17.23 16.13 17.60 20.18 0.4% Average12 ....................................................... 5.61 6.32 7.66 8.50 8.40 9.22 10.76 2.0%
(nominal dollars per thousand cubic feet) Residential ......................................................... 10.70 10.29 13.52 16.09 17.62 20.77 25.77 3.5% Commercial ........................................................ 8.24 8.35 11.14 13.34 14.33 16.81 21.03 3.5% Industrial4 ........................................................... 3.88 4.68 7.20 8.71 9.37 11.39 14.64 4.3% Electric power7 ................................................... 3.54 4.51 6.26 7.92 8.55 10.51 13.76 4.2% Transportation11 ................................................. 20.62 18.13 20.73 21.21 21.62 25.87 32.72 2.2% Average12 ....................................................... 5.53 6.32 8.68 10.46 11.27 13.55 17.44 3.8%
1Marketed production (wet) minus extraction losses. 2Synthetic natural gas, propane air, coke oven gas, refinery gas, biomass gas, air injected for Btu stabilization, and manufactured gas commingled and
distributed with natural gas. 3Includes any natural gas regasified in the Bahamas and transported via pipeline to Florida, as well as gas from Canada and Mexico. 4Includes energy for combined heat and power plants that have a non-regulatory status, and small on-site generating systems. Excludes use for lease and
plant fuel. 5Includes any natural gas used in the process of converting natural gas to liquid fuel that is not actually converted. 6Includes any natural gas converted into liquid fuel. 7Includes consumption of energy by electricity-only and combined heat and power plants that have a regulatory status. 8Natural gas used as fuel in motor vehicles, trains, and ships. 9Represents natural gas used in well, field, and lease operations, in natural gas processing plant machinery, and for liquefaction in export facilities. 10Balancing item. Natural gas lost as a result of converting flow data measured at varying temperatures and pressures to a standard temperature and pressure
and the merger of different data reporting systems which vary in scope, format, definition, and respondent type. In addition, 2012 and 2013 values include net storage injections.
11Natural gas used as fuel in motor vehicles, trains, and ships. Price includes estimated motor vehicle fuel taxes and estimated dispensing costs or charges. 12Weighted average prices. Weights used are the sectoral consumption values excluding lease, plant, and pipeline fuel. - - = Not applicable. Note: Totals may not equal sum of components due to independent rounding. Data for 2012 and 2013 are model results and may differ from official EIA data
reports. Sources: 2012 supply values; lease, plant, and pipeline fuel consumption; and residential, commercial, and industrial delivered prices: U.S. Energy
Information Administration (EIA), Natural Gas Annual 2013, DOE/EIA-0131(2013) (Washington, DC, October 2014). 2013 supply values; lease, plant, and pipeline fuel consumption; and residential, commercial, and industrial delivered prices: EIA, Natural Gas Monthly, DOE/EIA-0130(2014/07) (Washington, DC, July 2014). Other 2012 and 2013 consumption based on: EIA, Monthly Energy Review, DOE/EIA-0035(2014/11) (Washington, DC, November 2014). 2012 and 2013 natural gas spot price at Henry Hub: Thomson Reuters. 2012 and 2013 electric power prices: EIA, Electric Power Monthly, DOE/EIA-0226, April 2013 and April 2014, Table 4.2, and EIA, State Energy Data Report 2012, DOE/EIA-0214(2012) (Washington, DC, June 2014). 2012 transportation sector delivered prices are based on: EIA, Natural Gas Annual 2013, DOE/EIA-0131(2013) (Washington, DC, October 2014), EIA, State Energy Data Report 2012, DOE/EIA-0214(2012) (Washington, DC, June 2014), and estimated State and Federal motor fuel taxes and dispensing costs or charges. 2013 transportation sector delivered prices are model results. Projections: EIA, AEO2015 National Energy Modeling System run REF2015.D021915A.
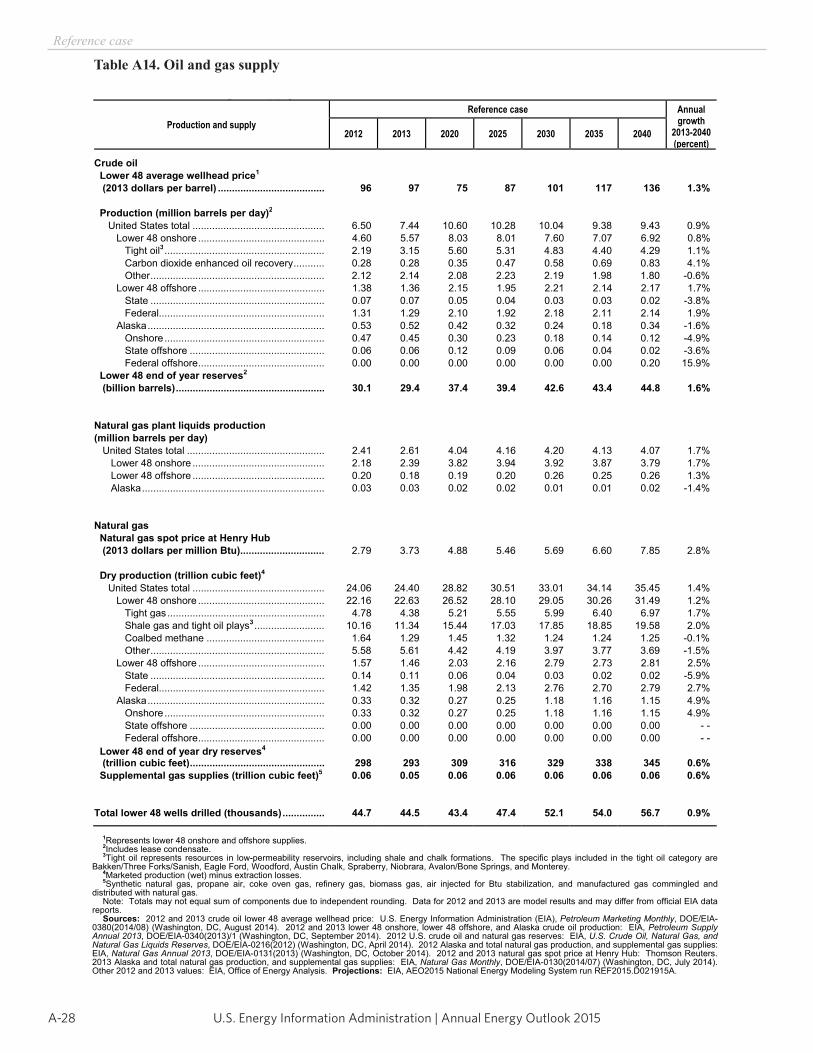
U.S. Energy Information Administration | Annual Energy Outlook 2015A-28
Reference case
Table A14. Oil and gas supply
Energy Information Administration / Annual Energy Outlook 2015
Table A14. Oil and gas supply
Production and supply Reference case Annual
growth 2013-2040(percent)
2012 2013 2020 2025 2030 2035 2040
Crude oil Lower 48 average wellhead price1
(2013 dollars per barrel) ...................................... 96 97 75 87 101 117 136 1.3%
Production (million barrels per day)2
United States total ............................................... 6.50 7.44 10.60 10.28 10.04 9.38 9.43 0.9% Lower 48 onshore ............................................. 4.60 5.57 8.03 8.01 7.60 7.07 6.92 0.8%
Tight oil3 ......................................................... 2.19 3.15 5.60 5.31 4.83 4.40 4.29 1.1% Carbon dioxide enhanced oil recovery ........... 0.28 0.28 0.35 0.47 0.58 0.69 0.83 4.1% Other .............................................................. 2.12 2.14 2.08 2.23 2.19 1.98 1.80 -0.6%
Lower 48 offshore ............................................. 1.38 1.36 2.15 1.95 2.21 2.14 2.17 1.7% State .............................................................. 0.07 0.07 0.05 0.04 0.03 0.03 0.02 -3.8% Federal........................................................... 1.31 1.29 2.10 1.92 2.18 2.11 2.14 1.9%
Alaska ............................................................... 0.53 0.52 0.42 0.32 0.24 0.18 0.34 -1.6% Onshore ......................................................... 0.47 0.45 0.30 0.23 0.18 0.14 0.12 -4.9% State offshore ................................................ 0.06 0.06 0.12 0.09 0.06 0.04 0.02 -3.6% Federal offshore ............................................. 0.00 0.00 0.00 0.00 0.00 0.00 0.20 15.9%
Lower 48 end of year reserves2
(billion barrels) ..................................................... 30.1 29.4 37.4 39.4 42.6 43.4 44.8 1.6%
Natural gas plant liquids production (million barrels per day) United States total ................................................. 2.41 2.61 4.04 4.16 4.20 4.13 4.07 1.7%
Lower 48 onshore ............................................... 2.18 2.39 3.82 3.94 3.92 3.87 3.79 1.7% Lower 48 offshore ............................................... 0.20 0.18 0.19 0.20 0.26 0.25 0.26 1.3%
Alaska ................................................................. 0.03 0.03 0.02 0.02 0.01 0.01 0.02 -1.4%
Natural gas Natural gas spot price at Henry Hub (2013 dollars per million Btu) .............................. 2.79 3.73 4.88 5.46 5.69 6.60 7.85 2.8%
Dry production (trillion cubic feet)4
United States total ............................................... 24.06 24.40 28.82 30.51 33.01 34.14 35.45 1.4% Lower 48 onshore ............................................. 22.16 22.63 26.52 28.10 29.05 30.26 31.49 1.2%
Tight gas ........................................................ 4.78 4.38 5.21 5.55 5.99 6.40 6.97 1.7% Shale gas and tight oil plays3 ......................... 10.16 11.34 15.44 17.03 17.85 18.85 19.58 2.0% Coalbed methane .......................................... 1.64 1.29 1.45 1.32 1.24 1.24 1.25 -0.1% Other .............................................................. 5.58 5.61 4.42 4.19 3.97 3.77 3.69 -1.5%
Lower 48 offshore ............................................. 1.57 1.46 2.03 2.16 2.79 2.73 2.81 2.5% State .............................................................. 0.14 0.11 0.06 0.04 0.03 0.02 0.02 -5.9% Federal........................................................... 1.42 1.35 1.98 2.13 2.76 2.70 2.79 2.7%
Alaska ............................................................... 0.33 0.32 0.27 0.25 1.18 1.16 1.15 4.9% Onshore ......................................................... 0.33 0.32 0.27 0.25 1.18 1.16 1.15 4.9% State offshore ................................................ 0.00 0.00 0.00 0.00 0.00 0.00 0.00 - - Federal offshore ............................................. 0.00 0.00 0.00 0.00 0.00 0.00 0.00 - -
Lower 48 end of year dry reserves4
(trillion cubic feet) ................................................ 298 293 309 316 329 338 345 0.6% Supplemental gas supplies (trillion cubic feet)5 0.06 0.05 0.06 0.06 0.06 0.06 0.06 0.6%
Total lower 48 wells drilled (thousands) ............... 44.7 44.5 43.4 47.4 52.1 54.0 56.7 0.9%
1Represents lower 48 onshore and offshore supplies. 2Includes lease condensate. 3Tight oil represents resources in low-permeability reservoirs, including shale and chalk formations. The specific plays included in the tight oil category are
Bakken/Three Forks/Sanish, Eagle Ford, Woodford, Austin Chalk, Spraberry, Niobrara, Avalon/Bone Springs, and Monterey. 4Marketed production (wet) minus extraction losses. 5Synthetic natural gas, propane air, coke oven gas, refinery gas, biomass gas, air injected for Btu stabilization, and manufactured gas commingled and
distributed with natural gas. Note: Totals may not equal sum of components due to independent rounding. Data for 2012 and 2013 are model results and may differ from official EIA data
reports. Sources: 2012 and 2013 crude oil lower 48 average wellhead price: U.S. Energy Information Administration (EIA), Petroleum Marketing Monthly, DOE/EIA-
0380(2014/08) (Washington, DC, August 2014). 2012 and 2013 lower 48 onshore, lower 48 offshore, and Alaska crude oil production: EIA, Petroleum Supply Annual 2013, DOE/EIA-0340(2013)/1 (Washington, DC, September 2014). 2012 U.S. crude oil and natural gas reserves: EIA, U.S. Crude Oil, Natural Gas, and Natural Gas Liquids Reserves, DOE/EIA-0216(2012) (Washington, DC, April 2014). 2012 Alaska and total natural gas production, and supplemental gas supplies:EIA, Natural Gas Annual 2013, DOE/EIA-0131(2013) (Washington, DC, October 2014). 2012 and 2013 natural gas spot price at Henry Hub: Thomson Reuters. 2013 Alaska and total natural gas production, and supplemental gas supplies: EIA, Natural Gas Monthly, DOE/EIA-0130(2014/07) (Washington, DC, July 2014). Other 2012 and 2013 values: EIA, Office of Energy Analysis. Projections: EIA, AEO2015 National Energy Modeling System run REF2015.D021915A.
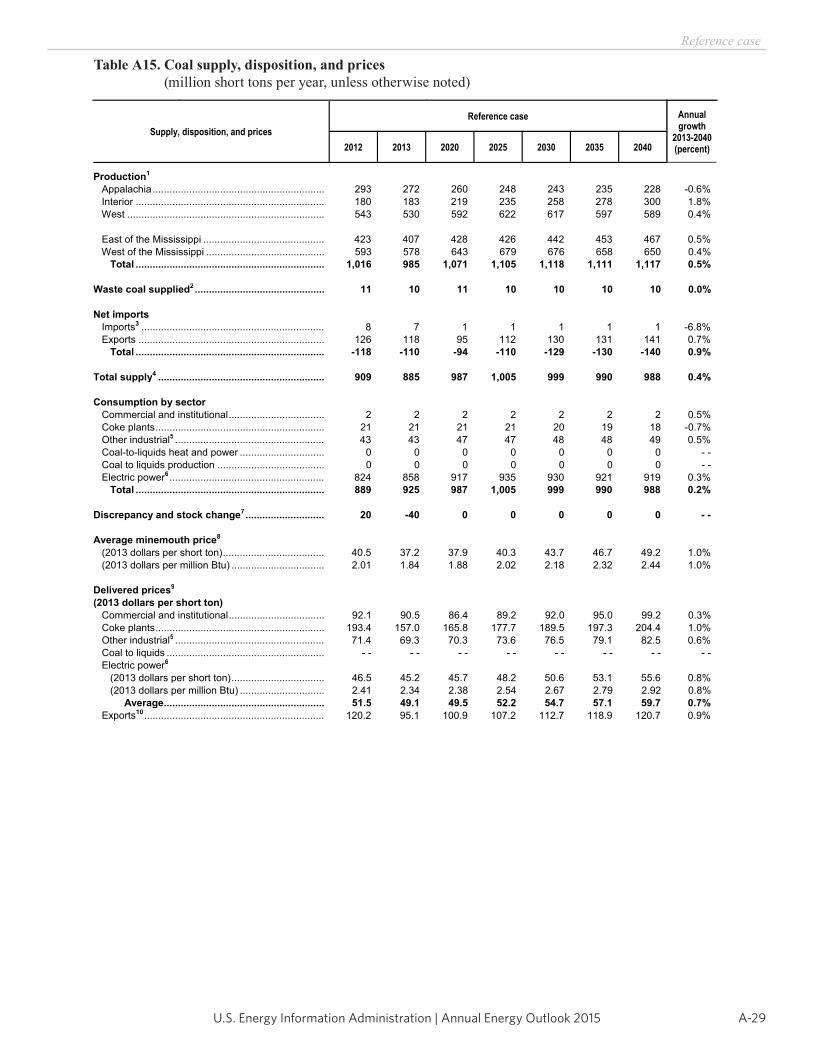
A-29U.S. Energy Information Administration | Annual Energy Outlook 2015
Reference case
Energy Information Administration / Annual Energy Outlook 2015
Table A15. Coal supply, disposition, and prices(million short tons, unless otherwise noted)
Supply, disposition, and prices Reference case Annual
growth 2013-2040(percent) 2012 2013 2020 2025 2030 2035 2040
Production1
Appalachia ............................................................. 293 272 260 248 243 235 228 -0.6% Interior ................................................................... 180 183 219 235 258 278 300 1.8% West ...................................................................... 543 530 592 622 617 597 589 0.4%
East of the Mississippi ........................................... 423 407 428 426 442 453 467 0.5% West of the Mississippi .......................................... 593 578 643 679 676 658 650 0.4%
Total ................................................................... 1,016 985 1,071 1,105 1,118 1,111 1,117 0.5%
Waste coal supplied2 .............................................. 11 10 11 10 10 10 10 0.0%
Net imports Imports3 ................................................................. 8 7 1 1 1 1 1 -6.8% Exports .................................................................. 126 118 95 112 130 131 141 0.7%
Total ................................................................... -118 -110 -94 -110 -129 -130 -140 0.9%
Total supply4 ........................................................... 909 885 987 1,005 999 990 988 0.4%
Consumption by sector Commercial and institutional .................................. 2 2 2 2 2 2 2 0.5% Coke plants ............................................................ 21 21 21 21 20 19 18 -0.7% Other industrial5 ..................................................... 43 43 47 47 48 48 49 0.5% Coal-to-liquids heat and power .............................. 0 0 0 0 0 0 0 - - Coal to liquids production ...................................... 0 0 0 0 0 0 0 - - Electric power6 ....................................................... 824 858 917 935 930 921 919 0.3%
Total ................................................................... 889 925 987 1,005 999 990 988 0.2%
Discrepancy and stock change7 ............................ 20 -40 0 0 0 0 0 - -
Average minemouth price8
(2013 dollars per short ton) .................................... 40.5 37.2 37.9 40.3 43.7 46.7 49.2 1.0% (2013 dollars per million Btu) ................................. 2.01 1.84 1.88 2.02 2.18 2.32 2.44 1.0%
Delivered prices9
(2013 dollars per short ton) Commercial and institutional .................................. 92.1 90.5 86.4 89.2 92.0 95.0 99.2 0.3% Coke plants ............................................................ 193.4 157.0 165.8 177.7 189.5 197.3 204.4 1.0% Other industrial5 ..................................................... 71.4 69.3 70.3 73.6 76.5 79.1 82.5 0.6% Coal to liquids ........................................................ - - - - - - - - - - - - - - - - Electric power6
(2013 dollars per short ton) ................................. 46.5 45.2 45.7 48.2 50.6 53.1 55.6 0.8% (2013 dollars per million Btu) .............................. 2.41 2.34 2.38 2.54 2.67 2.79 2.92 0.8%
Average ......................................................... 51.5 49.1 49.5 52.2 54.7 57.1 59.7 0.7% Exports10 ................................................................ 120.2 95.1 100.9 107.2 112.7 118.9 120.7 0.9%
Table A15. Coal supply, disposition, and prices (million short tons per year, unless otherwise noted)
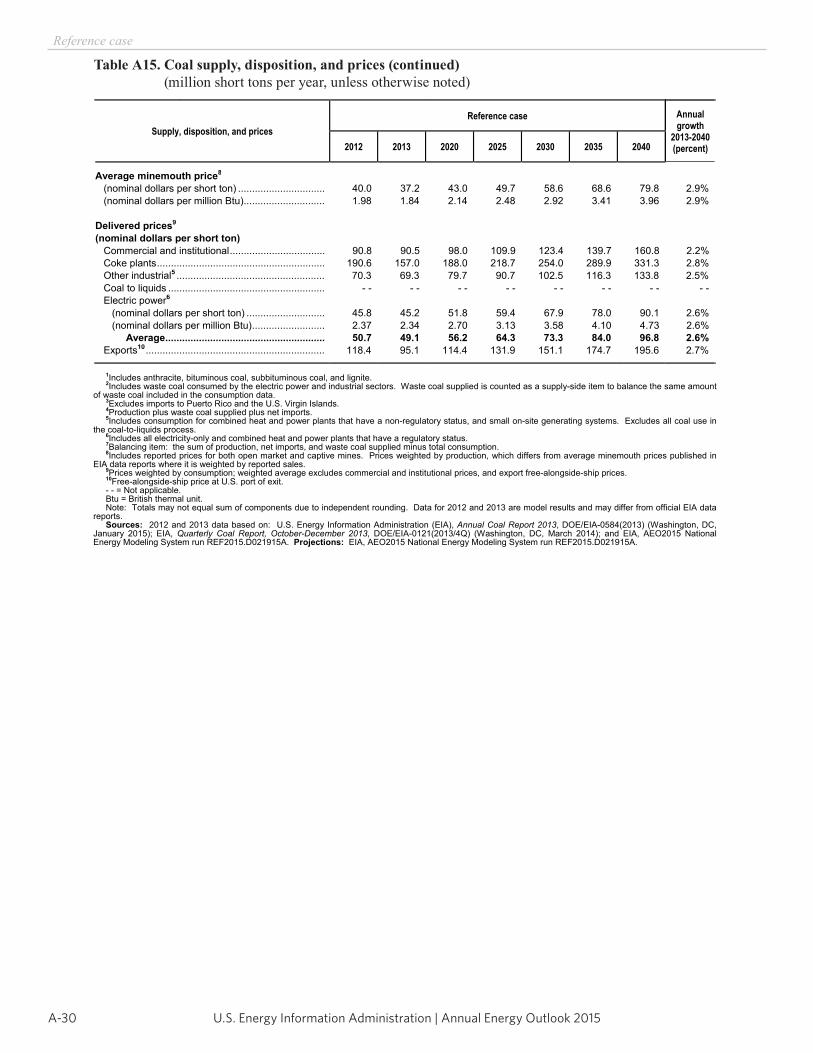
U.S. Energy Information Administration | Annual Energy Outlook 2015A-30
Reference case
Table A15. Coal supply, disposition, and prices (continued) (million short tons per year, unless otherwise noted)
Energy Information Administration / Annual Energy Outlook 2015
Table A15. Coal supply, disposition, and prices (continued)(million short tons, unless otherwise noted)
Supply, disposition, and prices Reference case Annual
growth 2013-2040(percent) 2012 2013 2020 2025 2030 2035 2040
Average minemouth price8
(nominal dollars per short ton) ............................... 40.0 37.2 43.0 49.7 58.6 68.6 79.8 2.9% (nominal dollars per million Btu) ............................. 1.98 1.84 2.14 2.48 2.92 3.41 3.96 2.9%
Delivered prices9
(nominal dollars per short ton) Commercial and institutional .................................. 90.8 90.5 98.0 109.9 123.4 139.7 160.8 2.2% Coke plants ............................................................ 190.6 157.0 188.0 218.7 254.0 289.9 331.3 2.8% Other industrial5 ..................................................... 70.3 69.3 79.7 90.7 102.5 116.3 133.8 2.5% Coal to liquids ........................................................ - - - - - - - - - - - - - - - - Electric power6
(nominal dollars per short ton) ............................ 45.8 45.2 51.8 59.4 67.9 78.0 90.1 2.6% (nominal dollars per million Btu) .......................... 2.37 2.34 2.70 3.13 3.58 4.10 4.73 2.6%
Average ......................................................... 50.7 49.1 56.2 64.3 73.3 84.0 96.8 2.6% Exports10 ................................................................ 118.4 95.1 114.4 131.9 151.1 174.7 195.6 2.7%
1Includes anthracite, bituminous coal, subbituminous coal, and lignite. 2Includes waste coal consumed by the electric power and industrial sectors. Waste coal supplied is counted as a supply-side item to balance the same amount
of waste coal included in the consumption data. 3Excludes imports to Puerto Rico and the U.S. Virgin Islands. 4Production plus waste coal supplied plus net imports. 5Includes consumption for combined heat and power plants that have a non-regulatory status, and small on-site generating systems. Excludes all coal use in
the coal-to-liquids process. 6Includes all electricity-only and combined heat and power plants that have a regulatory status. 7Balancing item: the sum of production, net imports, and waste coal supplied minus total consumption. 8Includes reported prices for both open market and captive mines. Prices weighted by production, which differs from average minemouth prices published in
EIA data reports where it is weighted by reported sales. 9Prices weighted by consumption; weighted average excludes commercial and institutional prices, and export free-alongside-ship prices. 10Free-alongside-ship price at U.S. port of exit. - - = Not applicable. Btu = British thermal unit. Note: Totals may not equal sum of components due to independent rounding. Data for 2012 and 2013 are model results and may differ from official EIA data
reports. Sources: 2012 and 2013 data based on: U.S. Energy Information Administration (EIA), Annual Coal Report 2013, DOE/EIA-0584(2013) (Washington, DC,
January 2015); EIA, Quarterly Coal Report, October-December 2013, DOE/EIA-0121(2013/4Q) (Washington, DC, March 2014); and EIA, AEO2015 National Energy Modeling System run REF2015.D021915A. Projections: EIA, AEO2015 National Energy Modeling System run REF2015.D021915A.
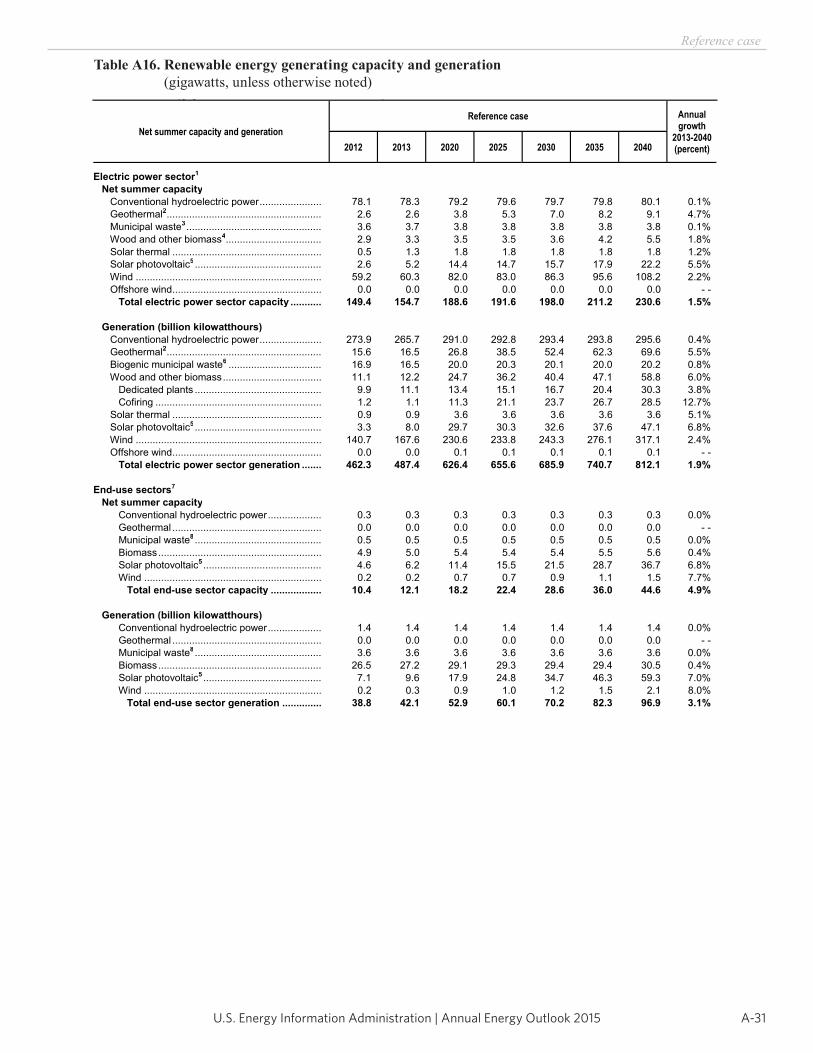
A-31U.S. Energy Information Administration | Annual Energy Outlook 2015
Reference case
Energy Information Administration / Annual Energy Outlook 2015
Table A16. Renewable energy generating capacity and generation(gigawatts, unless otherwise noted)
Net summer capacity and generation Reference case Annual
growth 2013-2040(percent) 2012 2013 2020 2025 2030 2035 2040
Electric power sector1
Net summer capacity Conventional hydroelectric power ...................... 78.1 78.3 79.2 79.6 79.7 79.8 80.1 0.1% Geothermal2....................................................... 2.6 2.6 3.8 5.3 7.0 8.2 9.1 4.7% Municipal waste3 ................................................ 3.6 3.7 3.8 3.8 3.8 3.8 3.8 0.1% Wood and other biomass4.................................. 2.9 3.3 3.5 3.5 3.6 4.2 5.5 1.8% Solar thermal ..................................................... 0.5 1.3 1.8 1.8 1.8 1.8 1.8 1.2% Solar photovoltaic5 ............................................. 2.6 5.2 14.4 14.7 15.7 17.9 22.2 5.5%
Wind .................................................................. 59.2 60.3 82.0 83.0 86.3 95.6 108.2 2.2% Offshore wind ..................................................... 0.0 0.0 0.0 0.0 0.0 0.0 0.0 - - Total electric power sector capacity ........... 149.4 154.7 188.6 191.6 198.0 211.2 230.6 1.5%
Generation (billion kilowatthours) Conventional hydroelectric power ...................... 273.9 265.7 291.0 292.8 293.4 293.8 295.6 0.4% Geothermal2....................................................... 15.6 16.5 26.8 38.5 52.4 62.3 69.6 5.5% Biogenic municipal waste6 ................................. 16.9 16.5 20.0 20.3 20.1 20.0 20.2 0.8% Wood and other biomass ................................... 11.1 12.2 24.7 36.2 40.4 47.1 58.8 6.0% Dedicated plants ............................................. 9.9 11.1 13.4 15.1 16.7 20.4 30.3 3.8% Cofiring ........................................................... 1.2 1.1 11.3 21.1 23.7 26.7 28.5 12.7% Solar thermal ..................................................... 0.9 0.9 3.6 3.6 3.6 3.6 3.6 5.1% Solar photovoltaic5 ............................................. 3.3 8.0 29.7 30.3 32.6 37.6 47.1 6.8%
Wind .................................................................. 140.7 167.6 230.6 233.8 243.3 276.1 317.1 2.4% Offshore wind ..................................................... 0.0 0.0 0.1 0.1 0.1 0.1 0.1 - - Total electric power sector generation ....... 462.3 487.4 626.4 655.6 685.9 740.7 812.1 1.9%
End-use sectors7
Net summer capacity Conventional hydroelectric power ................... 0.3 0.3 0.3 0.3 0.3 0.3 0.3 0.0% Geothermal ..................................................... 0.0 0.0 0.0 0.0 0.0 0.0 0.0 - - Municipal waste8 ............................................. 0.5 0.5 0.5 0.5 0.5 0.5 0.5 0.0% Biomass .......................................................... 4.9 5.0 5.4 5.4 5.4 5.5 5.6 0.4% Solar photovoltaic5 .......................................... 4.6 6.2 11.4 15.5 21.5 28.7 36.7 6.8% Wind ............................................................... 0.2 0.2 0.7 0.7 0.9 1.1 1.5 7.7%
Total end-use sector capacity .................. 10.4 12.1 18.2 22.4 28.6 36.0 44.6 4.9%
Generation (billion kilowatthours) Conventional hydroelectric power ................... 1.4 1.4 1.4 1.4 1.4 1.4 1.4 0.0% Geothermal ..................................................... 0.0 0.0 0.0 0.0 0.0 0.0 0.0 - - Municipal waste8 ............................................. 3.6 3.6 3.6 3.6 3.6 3.6 3.6 0.0% Biomass .......................................................... 26.5 27.2 29.1 29.3 29.4 29.4 30.5 0.4% Solar photovoltaic5 .......................................... 7.1 9.6 17.9 24.8 34.7 46.3 59.3 7.0% Wind ............................................................... 0.2 0.3 0.9 1.0 1.2 1.5 2.1 8.0%
Total end-use sector generation .............. 38.8 42.1 52.9 60.1 70.2 82.3 96.9 3.1%
Table A16. Renewable energy generating capacity and generation (gigawatts, unless otherwise noted)
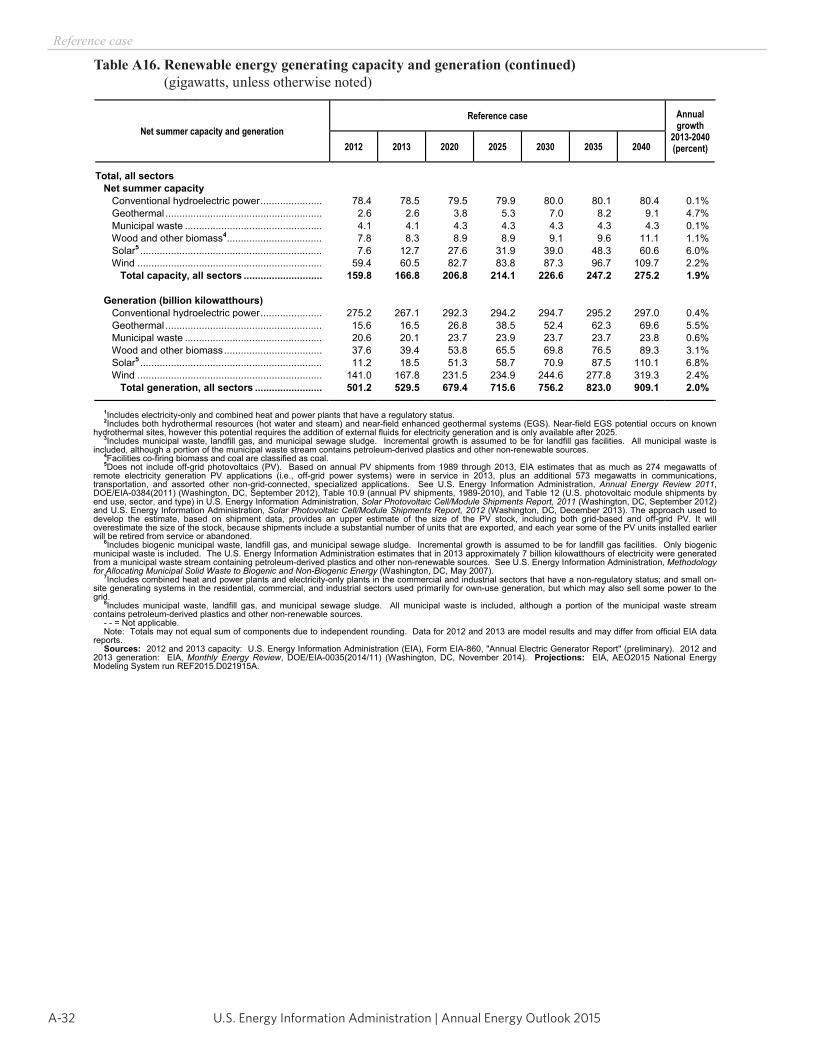
U.S. Energy Information Administration | Annual Energy Outlook 2015A-32
Reference case
Table A16. Renewable energy generating capacity and generation (continued) (gigawatts, unless otherwise noted)
Energy Information Administration / Annual Energy Outlook 2015
Table A16. Renewable energy generating capacity and generation (continued)(gigawatts, unless otherwise noted)
Net summer capacity and generation Reference case Annual
growth 2013-2040(percent) 2012 2013 2020 2025 2030 2035 2040
Total, all sectors Net summer capacity
Conventional hydroelectric power ...................... 78.4 78.5 79.5 79.9 80.0 80.1 80.4 0.1% Geothermal ........................................................ 2.6 2.6 3.8 5.3 7.0 8.2 9.1 4.7%
Municipal waste ................................................. 4.1 4.1 4.3 4.3 4.3 4.3 4.3 0.1% Wood and other biomass4.................................. 7.8 8.3 8.9 8.9 9.1 9.6 11.1 1.1% Solar5 ................................................................. 7.6 12.7 27.6 31.9 39.0 48.3 60.6 6.0%
Wind .................................................................. 59.4 60.5 82.7 83.8 87.3 96.7 109.7 2.2% Total capacity, all sectors ............................ 159.8 166.8 206.8 214.1 226.6 247.2 275.2 1.9%
Generation (billion kilowatthours) Conventional hydroelectric power ...................... 275.2 267.1 292.3 294.2 294.7 295.2 297.0 0.4% Geothermal ........................................................ 15.6 16.5 26.8 38.5 52.4 62.3 69.6 5.5% Municipal waste ................................................. 20.6 20.1 23.7 23.9 23.7 23.7 23.8 0.6% Wood and other biomass ................................... 37.6 39.4 53.8 65.5 69.8 76.5 89.3 3.1% Solar5 ................................................................. 11.2 18.5 51.3 58.7 70.9 87.5 110.1 6.8%
Wind .................................................................. 141.0 167.8 231.5 234.9 244.6 277.8 319.3 2.4% Total generation, all sectors ........................ 501.2 529.5 679.4 715.6 756.2 823.0 909.1 2.0%
1Includes electricity-only and combined heat and power plants that have a regulatory status. 2Includes both hydrothermal resources (hot water and steam) and near-field enhanced geothermal systems (EGS). Near-field EGS potential occurs on known
hydrothermal sites, however this potential requires the addition of external fluids for electricity generation and is only available after 2025. 3Includes municipal waste, landfill gas, and municipal sewage sludge. Incremental growth is assumed to be for landfill gas facilities. All municipal waste is
included, although a portion of the municipal waste stream contains petroleum-derived plastics and other non-renewable sources.4Facilities co-firing biomass and coal are classified as coal. 5Does not include off-grid photovoltaics (PV). Based on annual PV shipments from 1989 through 2013, EIA estimates that as much as 274 megawatts of
remote electricity generation PV applications (i.e., off-grid power systems) were in service in 2013, plus an additional 573 megawatts in communications, transportation, and assorted other non-grid-connected, specialized applications. See U.S. Energy Information Administration, Annual Energy Review 2011,DOE/EIA-0384(2011) (Washington, DC, September 2012), Table 10.9 (annual PV shipments, 1989-2010), and Table 12 (U.S. photovoltaic module shipments by end use, sector, and type) in U.S. Energy Information Administration, Solar Photovoltaic Cell/Module Shipments Report, 2011 (Washington, DC, September 2012) and U.S. Energy Information Administration, Solar Photovoltaic Cell/Module Shipments Report, 2012 (Washington, DC, December 2013). The approach used to develop the estimate, based on shipment data, provides an upper estimate of the size of the PV stock, including both grid-based and off-grid PV. It will overestimate the size of the stock, because shipments include a substantial number of units that are exported, and each year some of the PV units installed earlier will be retired from service or abandoned.
6Includes biogenic municipal waste, landfill gas, and municipal sewage sludge. Incremental growth is assumed to be for landfill gas facilities. Only biogenic municipal waste is included. The U.S. Energy Information Administration estimates that in 2013 approximately 7 billion kilowatthours of electricity were generated from a municipal waste stream containing petroleum-derived plastics and other non-renewable sources. See U.S. Energy Information Administration, Methodology for Allocating Municipal Solid Waste to Biogenic and Non-Biogenic Energy (Washington, DC, May 2007).
7Includes combined heat and power plants and electricity-only plants in the commercial and industrial sectors that have a non-regulatory status; and small on-site generating systems in the residential, commercial, and industrial sectors used primarily for own-use generation, but which may also sell some power to the grid.
8Includes municipal waste, landfill gas, and municipal sewage sludge. All municipal waste is included, although a portion of the municipal waste stream contains petroleum-derived plastics and other non-renewable sources.
- - = Not applicable. Note: Totals may not equal sum of components due to independent rounding. Data for 2012 and 2013 are model results and may differ from official EIA data
reports. Sources: 2012 and 2013 capacity: U.S. Energy Information Administration (EIA), Form EIA-860, "Annual Electric Generator Report" (preliminary). 2012 and
2013 generation: EIA, Monthly Energy Review, DOE/EIA-0035(2014/11) (Washington, DC, November 2014). Projections: EIA, AEO2015 National Energy Modeling System run REF2015.D021915A.
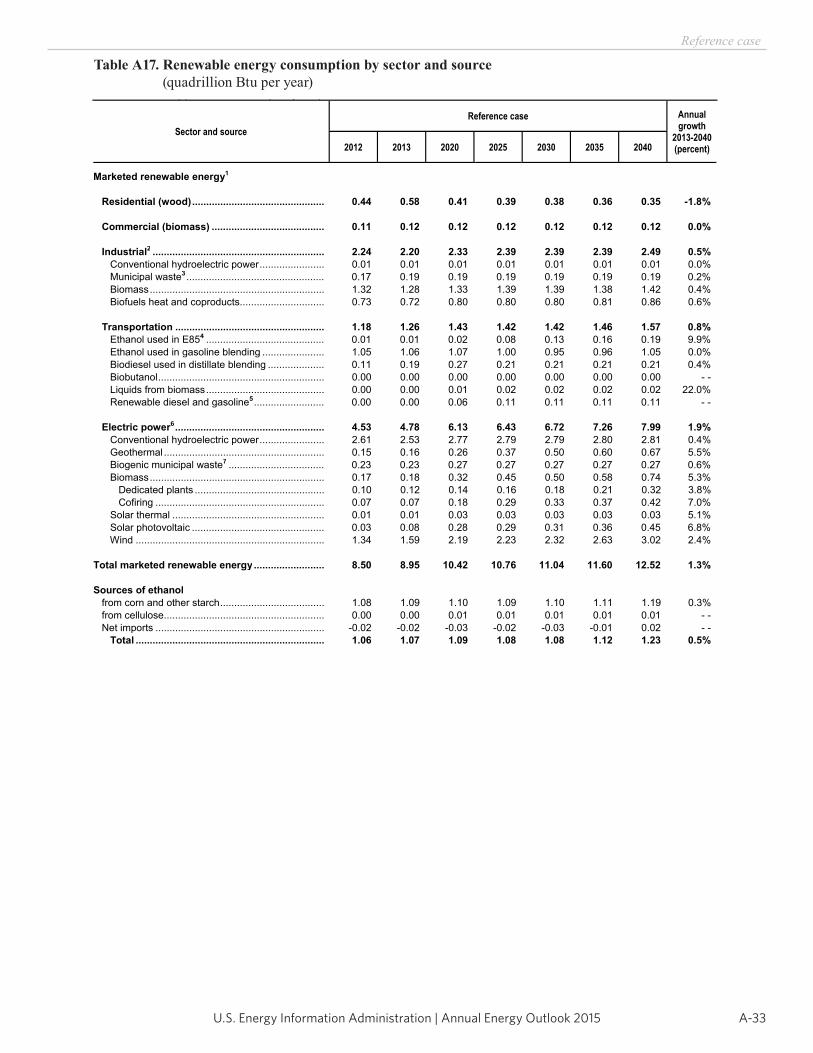
A-33U.S. Energy Information Administration | Annual Energy Outlook 2015
Reference case
Energy Information Administration / Annual Energy Outlook 2015
Table A17. Renewable energy consumption by sector and source(quadrillion Btu per year)
Sector and source Reference case Annual
growth 2013-2040(percent) 2012 2013 2020 2025 2030 2035 2040
Marketed renewable energy1
Residential (wood) ............................................... 0.44 0.58 0.41 0.39 0.38 0.36 0.35 -1.8%
Commercial (biomass) ........................................ 0.11 0.12 0.12 0.12 0.12 0.12 0.12 0.0%
Industrial2 ............................................................. 2.24 2.20 2.33 2.39 2.39 2.39 2.49 0.5% Conventional hydroelectric power ....................... 0.01 0.01 0.01 0.01 0.01 0.01 0.01 0.0% Municipal waste3 ................................................. 0.17 0.19 0.19 0.19 0.19 0.19 0.19 0.2%
Biomass .............................................................. 1.32 1.28 1.33 1.39 1.39 1.38 1.42 0.4% Biofuels heat and coproducts.............................. 0.73 0.72 0.80 0.80 0.80 0.81 0.86 0.6%
Transportation ..................................................... 1.18 1.26 1.43 1.42 1.42 1.46 1.57 0.8% Ethanol used in E854 .......................................... 0.01 0.01 0.02 0.08 0.13 0.16 0.19 9.9% Ethanol used in gasoline blending ...................... 1.05 1.06 1.07 1.00 0.95 0.96 1.05 0.0% Biodiesel used in distillate blending .................... 0.11 0.19 0.27 0.21 0.21 0.21 0.21 0.4% Biobutanol ........................................................... 0.00 0.00 0.00 0.00 0.00 0.00 0.00 - - Liquids from biomass .......................................... 0.00 0.00 0.01 0.02 0.02 0.02 0.02 22.0% Renewable diesel and gasoline5 ......................... 0.00 0.00 0.06 0.11 0.11 0.11 0.11 - -
Electric power6 ..................................................... 4.53 4.78 6.13 6.43 6.72 7.26 7.99 1.9% Conventional hydroelectric power ....................... 2.61 2.53 2.77 2.79 2.79 2.80 2.81 0.4%
Geothermal ......................................................... 0.15 0.16 0.26 0.37 0.50 0.60 0.67 5.5% Biogenic municipal waste7 .................................. 0.23 0.23 0.27 0.27 0.27 0.27 0.27 0.6%
Biomass .............................................................. 0.17 0.18 0.32 0.45 0.50 0.58 0.74 5.3% Dedicated plants .............................................. 0.10 0.12 0.14 0.16 0.18 0.21 0.32 3.8% Cofiring ............................................................ 0.07 0.07 0.18 0.29 0.33 0.37 0.42 7.0% Solar thermal ...................................................... 0.01 0.01 0.03 0.03 0.03 0.03 0.03 5.1%
Solar photovoltaic ............................................... 0.03 0.08 0.28 0.29 0.31 0.36 0.45 6.8% Wind ................................................................... 1.34 1.59 2.19 2.23 2.32 2.63 3.02 2.4%
Total marketed renewable energy ......................... 8.50 8.95 10.42 10.76 11.04 11.60 12.52 1.3%
Sources of ethanol from corn and other starch ..................................... 1.08 1.09 1.10 1.09 1.10 1.11 1.19 0.3% from cellulose ......................................................... 0.00 0.00 0.01 0.01 0.01 0.01 0.01 - - Net imports ............................................................ -0.02 -0.02 -0.03 -0.02 -0.03 -0.01 0.02 - -
Total ................................................................... 1.06 1.07 1.09 1.08 1.08 1.12 1.23 0.5%
Table A17. Renewable energy consumption by sector and source (quadrillion Btu per year)
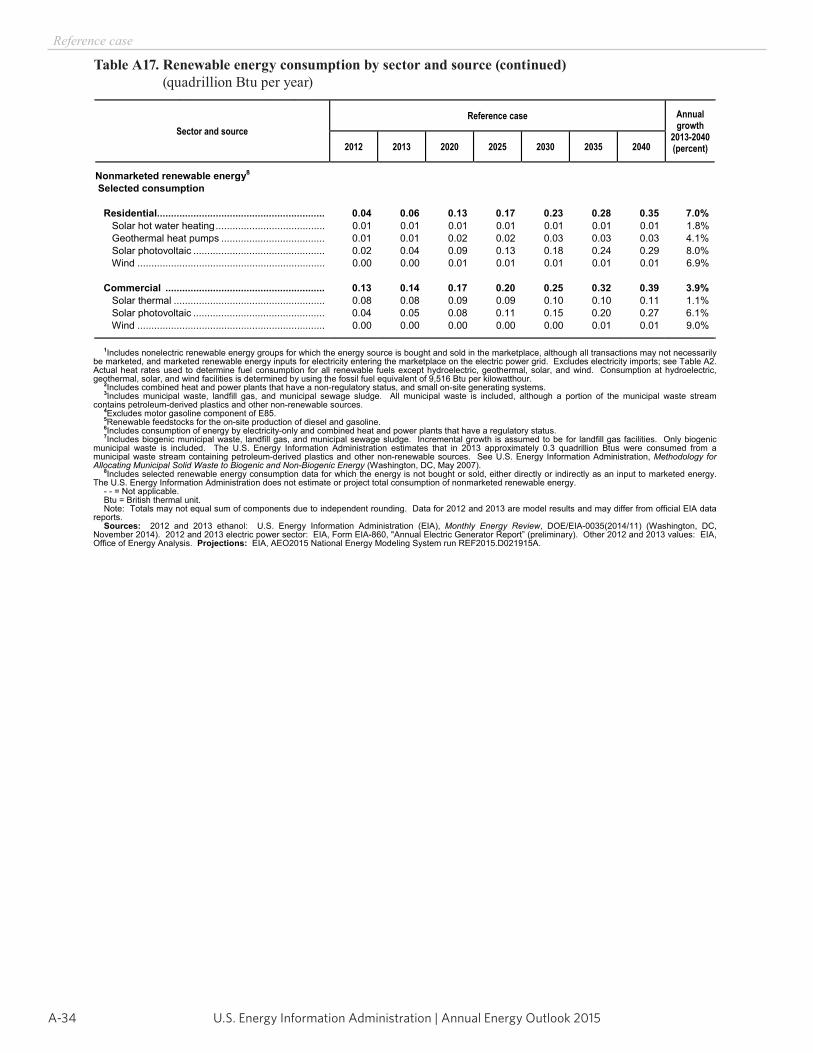
U.S. Energy Information Administration | Annual Energy Outlook 2015A-34
Reference case
Table A17. Renewable energy consumption by sector and source (continued) (quadrillion Btu per year)
Energy Information Administration / Annual Energy Outlook 2015
Table A17. Renewable energy consumption by sector and source (continued)(quadrillion Btu per year)
Sector and source Reference case Annual
growth 2013-2040(percent) 2012 2013 2020 2025 2030 2035 2040
Nonmarketed renewable energy8
Selected consumption
Residential............................................................ 0.04 0.06 0.13 0.17 0.23 0.28 0.35 7.0% Solar hot water heating ....................................... 0.01 0.01 0.01 0.01 0.01 0.01 0.01 1.8% Geothermal heat pumps ..................................... 0.01 0.01 0.02 0.02 0.03 0.03 0.03 4.1%
Solar photovoltaic ............................................... 0.02 0.04 0.09 0.13 0.18 0.24 0.29 8.0% Wind ................................................................... 0.00 0.00 0.01 0.01 0.01 0.01 0.01 6.9%
Commercial ......................................................... 0.13 0.14 0.17 0.20 0.25 0.32 0.39 3.9% Solar thermal ...................................................... 0.08 0.08 0.09 0.09 0.10 0.10 0.11 1.1%
Solar photovoltaic ............................................... 0.04 0.05 0.08 0.11 0.15 0.20 0.27 6.1% Wind ................................................................... 0.00 0.00 0.00 0.00 0.00 0.01 0.01 9.0%
1Includes nonelectric renewable energy groups for which the energy source is bought and sold in the marketplace, although all transactions may not necessarily be marketed, and marketed renewable energy inputs for electricity entering the marketplace on the electric power grid. Excludes electricity imports; see Table A2. Actual heat rates used to determine fuel consumption for all renewable fuels except hydroelectric, geothermal, solar, and wind. Consumption at hydroelectric, geothermal, solar, and wind facilities is determined by using the fossil fuel equivalent of 9,516 Btu per kilowatthour.
2Includes combined heat and power plants that have a non-regulatory status, and small on-site generating systems. 3Includes municipal waste, landfill gas, and municipal sewage sludge. All municipal waste is included, although a portion of the municipal waste stream
contains petroleum-derived plastics and other non-renewable sources. 4Excludes motor gasoline component of E85. 5Renewable feedstocks for the on-site production of diesel and gasoline. 6Includes consumption of energy by electricity-only and combined heat and power plants that have a regulatory status. 7Includes biogenic municipal waste, landfill gas, and municipal sewage sludge. Incremental growth is assumed to be for landfill gas facilities. Only biogenic
municipal waste is included. The U.S. Energy Information Administration estimates that in 2013 approximately 0.3 quadrillion Btus were consumed from a municipal waste stream containing petroleum-derived plastics and other non-renewable sources. See U.S. Energy Information Administration, Methodology for Allocating Municipal Solid Waste to Biogenic and Non-Biogenic Energy (Washington, DC, May 2007).
8Includes selected renewable energy consumption data for which the energy is not bought or sold, either directly or indirectly as an input to marketed energy. The U.S. Energy Information Administration does not estimate or project total consumption of nonmarketed renewable energy.
- - = Not applicable. Btu = British thermal unit. Note: Totals may not equal sum of components due to independent rounding. Data for 2012 and 2013 are model results and may differ from official EIA data
reports. Sources: 2012 and 2013 ethanol: U.S. Energy Information Administration (EIA), Monthly Energy Review, DOE/EIA-0035(2014/11) (Washington, DC,
November 2014). 2012 and 2013 electric power sector: EIA, Form EIA-860, "Annual Electric Generator Report” (preliminary). Other 2012 and 2013 values: EIA, Office of Energy Analysis. Projections: EIA, AEO2015 National Energy Modeling System run REF2015.D021915A.
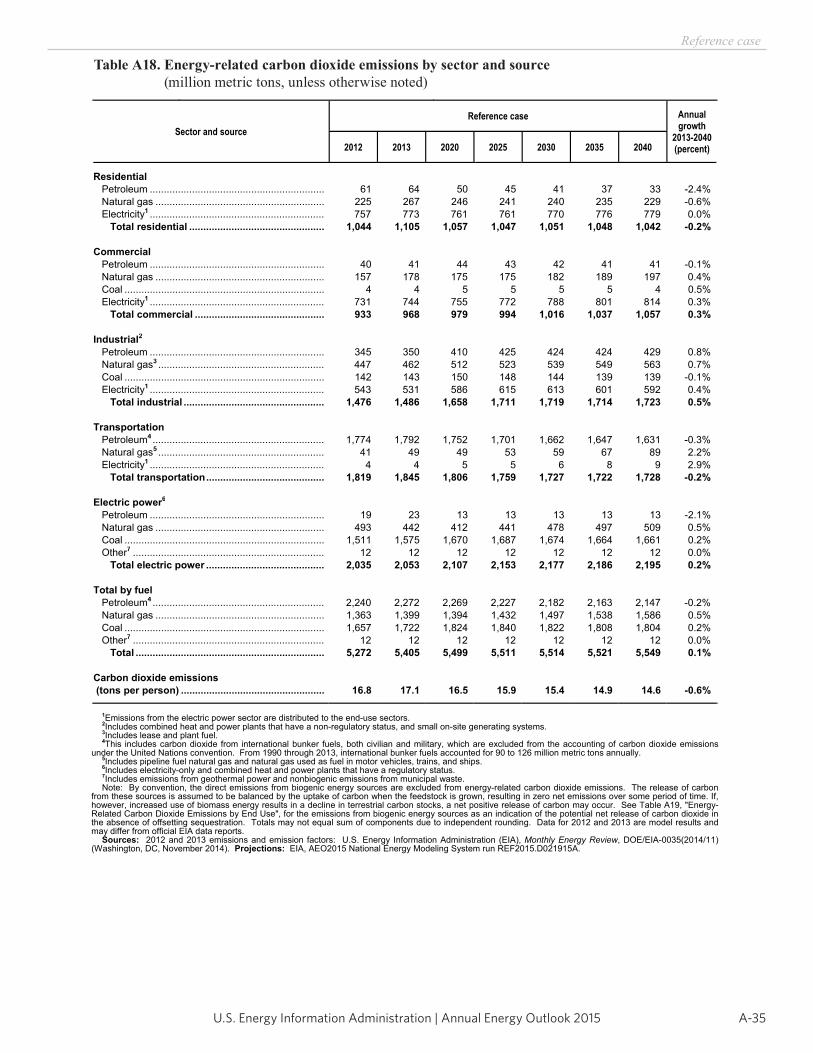
A-35U.S. Energy Information Administration | Annual Energy Outlook 2015
Reference case
Energy Information Administration / Annual Energy Outlook 2015
Table A18. Energy-related carbon dioxide emissions by sector and source(million metric tons, unless otherwise noted)
Sector and source Reference case Annual
growth 2013-2040(percent) 2012 2013 2020 2025 2030 2035 2040
Residential Petroleum .............................................................. 61 64 50 45 41 37 33 -2.4% Natural gas ............................................................ 225 267 246 241 240 235 229 -0.6%
Electricity1 .............................................................. 757 773 761 761 770 776 779 0.0% Total residential ................................................ 1,044 1,105 1,057 1,047 1,051 1,048 1,042 -0.2%
Commercial Petroleum .............................................................. 40 41 44 43 42 41 41 -0.1% Natural gas ............................................................ 157 178 175 175 182 189 197 0.4% Coal ....................................................................... 4 4 5 5 5 5 4 0.5% Electricity1 .............................................................. 731 744 755 772 788 801 814 0.3%
Total commercial .............................................. 933 968 979 994 1,016 1,037 1,057 0.3%
Industrial2 Petroleum .............................................................. 345 350 410 425 424 424 429 0.8% Natural gas3 ........................................................... 447 462 512 523 539 549 563 0.7% Coal ....................................................................... 142 143 150 148 144 139 139 -0.1% Electricity1 .............................................................. 543 531 586 615 613 601 592 0.4%
Total industrial .................................................. 1,476 1,486 1,658 1,711 1,719 1,714 1,723 0.5%
Transportation Petroleum4 ............................................................. 1,774 1,792 1,752 1,701 1,662 1,647 1,631 -0.3% Natural gas5 ........................................................... 41 49 49 53 59 67 89 2.2% Electricity1 .............................................................. 4 4 5 5 6 8 9 2.9%
Total transportation .......................................... 1,819 1,845 1,806 1,759 1,727 1,722 1,728 -0.2%
Electric power6
Petroleum .............................................................. 19 23 13 13 13 13 13 -2.1% Natural gas ............................................................ 493 442 412 441 478 497 509 0.5% Coal ....................................................................... 1,511 1,575 1,670 1,687 1,674 1,664 1,661 0.2% Other7 .................................................................... 12 12 12 12 12 12 12 0.0%
Total electric power .......................................... 2,035 2,053 2,107 2,153 2,177 2,186 2,195 0.2%
Total by fuel Petroleum4 ............................................................. 2,240 2,272 2,269 2,227 2,182 2,163 2,147 -0.2% Natural gas ............................................................ 1,363 1,399 1,394 1,432 1,497 1,538 1,586 0.5% Coal ....................................................................... 1,657 1,722 1,824 1,840 1,822 1,808 1,804 0.2% Other7 .................................................................... 12 12 12 12 12 12 12 0.0%
Total ................................................................... 5,272 5,405 5,499 5,511 5,514 5,521 5,549 0.1%
Carbon dioxide emissions (tons per person) ................................................... 16.8 17.1 16.5 15.9 15.4 14.9 14.6 -0.6%
1Emissions from the electric power sector are distributed to the end-use sectors. 2Includes combined heat and power plants that have a non-regulatory status, and small on-site generating systems. 3Includes lease and plant fuel. 4This includes carbon dioxide from international bunker fuels, both civilian and military, which are excluded from the accounting of carbon dioxide emissions
under the United Nations convention. From 1990 through 2013, international bunker fuels accounted for 90 to 126 million metric tons annually. 5Includes pipeline fuel natural gas and natural gas used as fuel in motor vehicles, trains, and ships. 6Includes electricity-only and combined heat and power plants that have a regulatory status. 7Includes emissions from geothermal power and nonbiogenic emissions from municipal waste. Note: By convention, the direct emissions from biogenic energy sources are excluded from energy-related carbon dioxide emissions. The release of carbon
from these sources is assumed to be balanced by the uptake of carbon when the feedstock is grown, resulting in zero net emissions over some period of time. If, however, increased use of biomass energy results in a decline in terrestrial carbon stocks, a net positive release of carbon may occur. See Table A19, "Energy-Related Carbon Dioxide Emissions by End Use", for the emissions from biogenic energy sources as an indication of the potential net release of carbon dioxide in the absence of offsetting sequestration. Totals may not equal sum of components due to independent rounding. Data for 2012 and 2013 are model results and may differ from official EIA data reports.
Sources: 2012 and 2013 emissions and emission factors: U.S. Energy Information Administration (EIA), Monthly Energy Review, DOE/EIA-0035(2014/11) (Washington, DC, November 2014). Projections: EIA, AEO2015 National Energy Modeling System run REF2015.D021915A.
Table A18. Energy-related carbon dioxide emissions by sector and source (million metric tons, unless otherwise noted)
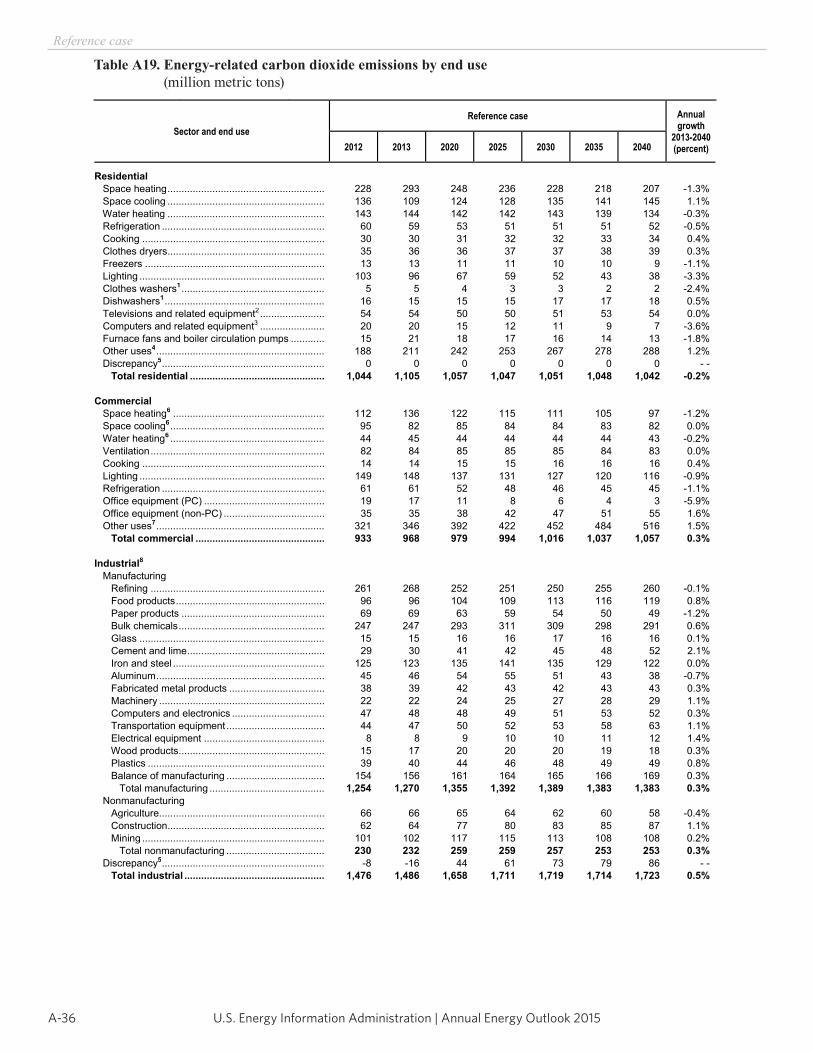
U.S. Energy Information Administration | Annual Energy Outlook 2015A-36
Reference case
Table A19. Energy-related carbon dioxide emissions by end use (million metric tons)
Energy Information Administration / Annual Energy Outlook 2015
Table A19. Energy-related carbon dioxide emissions by end use(million metric tons)
Sector and end use Reference case Annual
growth 2013-2040(percent) 2012 2013 2020 2025 2030 2035 2040
Residential Space heating ........................................................ 228 293 248 236 228 218 207 -1.3% Space cooling ........................................................ 136 109 124 128 135 141 145 1.1% Water heating ........................................................ 143 144 142 142 143 139 134 -0.3% Refrigeration .......................................................... 60 59 53 51 51 51 52 -0.5% Cooking ................................................................. 30 30 31 32 32 33 34 0.4% Clothes dryers ........................................................ 35 36 36 37 37 38 39 0.3% Freezers ................................................................ 13 13 11 11 10 10 9 -1.1% Lighting .................................................................. 103 96 67 59 52 43 38 -3.3% Clothes washers1 ................................................... 5 5 4 3 3 2 2 -2.4% Dishwashers1 ......................................................... 16 15 15 15 17 17 18 0.5% Televisions and related equipment2 ....................... 54 54 50 50 51 53 54 0.0% Computers and related equipment3 ....................... 20 20 15 12 11 9 7 -3.6% Furnace fans and boiler circulation pumps ............ 15 21 18 17 16 14 13 -1.8% Other uses4 ............................................................ 188 211 242 253 267 278 288 1.2% Discrepancy5.......................................................... 0 0 0 0 0 0 0 - -
Total residential ................................................ 1,044 1,105 1,057 1,047 1,051 1,048 1,042 -0.2%
Commercial Space heating6 ...................................................... 112 136 122 115 111 105 97 -1.2% Space cooling6 ....................................................... 95 82 85 84 84 83 82 0.0% Water heating6 ....................................................... 44 45 44 44 44 44 43 -0.2% Ventilation .............................................................. 82 84 85 85 85 84 83 0.0% Cooking ................................................................. 14 14 15 15 16 16 16 0.4%
Lighting .................................................................. 149 148 137 131 127 120 116 -0.9% Refrigeration .......................................................... 61 61 52 48 46 45 45 -1.1% Office equipment (PC) ........................................... 19 17 11 8 6 4 3 -5.9% Office equipment (non-PC) .................................... 35 35 38 42 47 51 55 1.6% Other uses7 ............................................................ 321 346 392 422 452 484 516 1.5%
Total commercial .............................................. 933 968 979 994 1,016 1,037 1,057 0.3%
Industrial8 Manufacturing Refining .............................................................. 261 268 252 251 250 255 260 -0.1%
Food products ..................................................... 96 96 104 109 113 116 119 0.8% Paper products ................................................... 69 69 63 59 54 50 49 -1.2% Bulk chemicals .................................................... 247 247 293 311 309 298 291 0.6% Glass .................................................................. 15 15 16 16 17 16 16 0.1% Cement and lime ................................................. 29 30 41 42 45 48 52 2.1% Iron and steel ...................................................... 125 123 135 141 135 129 122 0.0%
Aluminum ............................................................ 45 46 54 55 51 43 38 -0.7% Fabricated metal products .................................. 38 39 42 43 42 43 43 0.3%
Machinery ........................................................... 22 22 24 25 27 28 29 1.1% Computers and electronics ................................. 47 48 48 49 51 53 52 0.3% Transportation equipment ................................... 44 47 50 52 53 58 63 1.1% Electrical equipment ........................................... 8 8 9 10 10 11 12 1.4%
Wood products .................................................... 15 17 20 20 20 19 18 0.3% Plastics ............................................................... 39 40 44 46 48 49 49 0.8%
Balance of manufacturing ................................... 154 156 161 164 165 166 169 0.3% Total manufacturing ......................................... 1,254 1,270 1,355 1,392 1,389 1,383 1,383 0.3%
Nonmanufacturing Agriculture........................................................... 66 66 65 64 62 60 58 -0.4%
Construction ........................................................ 62 64 77 80 83 85 87 1.1% Mining ................................................................. 101 102 117 115 113 108 108 0.2% Total nonmanufacturing ................................... 230 232 259 259 257 253 253 0.3%
Discrepancy5.......................................................... -8 -16 44 61 73 79 86 - - Total industrial .................................................. 1,476 1,486 1,658 1,711 1,719 1,714 1,723 0.5%
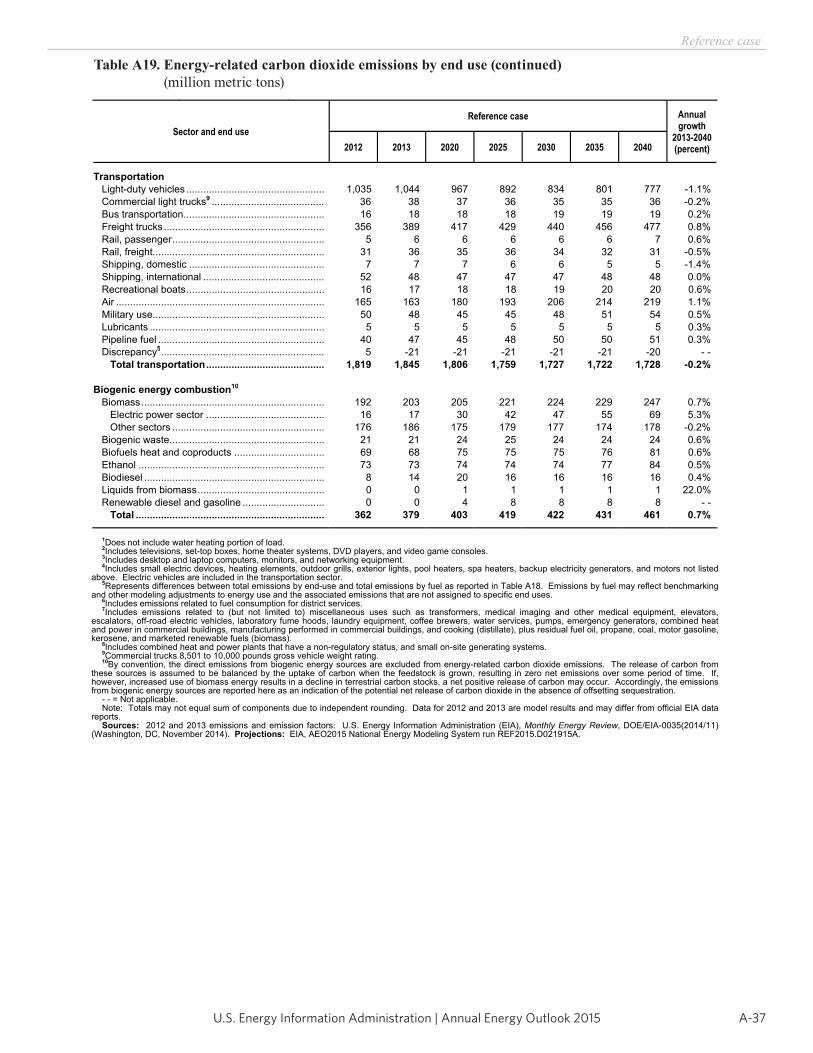
A-37U.S. Energy Information Administration | Annual Energy Outlook 2015
Reference case
Energy Information Administration / Annual Energy Outlook 2015
Table A19. Energy-related carbon dioxide emissions by end use (continued)(million metric tons)
Sector and end use Reference case Annual
growth 2013-2040(percent) 2012 2013 2020 2025 2030 2035 2040
Transportation Light-duty vehicles ................................................. 1,035 1,044 967 892 834 801 777 -1.1% Commercial light trucks9 ........................................ 36 38 37 36 35 35 36 -0.2% Bus transportation .................................................. 16 18 18 18 19 19 19 0.2% Freight trucks ......................................................... 356 389 417 429 440 456 477 0.8% Rail, passenger ...................................................... 5 6 6 6 6 6 7 0.6% Rail, freight............................................................. 31 36 35 36 34 32 31 -0.5% Shipping, domestic ................................................ 7 7 7 6 6 5 5 -1.4% Shipping, international ........................................... 52 48 47 47 47 48 48 0.0% Recreational boats ................................................. 16 17 18 18 19 20 20 0.6% Air .......................................................................... 165 163 180 193 206 214 219 1.1% Military use............................................................. 50 48 45 45 48 51 54 0.5% Lubricants .............................................................. 5 5 5 5 5 5 5 0.3%
Pipeline fuel ........................................................... 40 47 45 48 50 50 51 0.3% Discrepancy5.......................................................... 5 -21 -21 -21 -21 -21 -20 - -
Total transportation .......................................... 1,819 1,845 1,806 1,759 1,727 1,722 1,728 -0.2%
Biogenic energy combustion10
Biomass ................................................................. 192 203 205 221 224 229 247 0.7% Electric power sector .......................................... 16 17 30 42 47 55 69 5.3% Other sectors ...................................................... 176 186 175 179 177 174 178 -0.2%
Biogenic waste ....................................................... 21 21 24 25 24 24 24 0.6% Biofuels heat and coproducts ................................ 69 68 75 75 75 76 81 0.6% Ethanol .................................................................. 73 73 74 74 74 77 84 0.5% Biodiesel ................................................................ 8 14 20 16 16 16 16 0.4% Liquids from biomass ............................................. 0 0 1 1 1 1 1 22.0% Renewable diesel and gasoline ............................. 0 0 4 8 8 8 8 - -
Total ................................................................... 362 379 403 419 422 431 461 0.7%
1Does not include water heating portion of load. 2Includes televisions, set-top boxes, home theater systems, DVD players, and video game consoles. 3Includes desktop and laptop computers, monitors, and networking equipment. 4Includes small electric devices, heating elements, outdoor grills, exterior lights, pool heaters, spa heaters, backup electricity generators, and motors not listed
above. Electric vehicles are included in the transportation sector. 5Represents differences between total emissions by end-use and total emissions by fuel as reported in Table A18. Emissions by fuel may reflect benchmarking
and other modeling adjustments to energy use and the associated emissions that are not assigned to specific end uses. 6Includes emissions related to fuel consumption for district services. 7Includes emissions related to (but not limited to) miscellaneous uses such as transformers, medical imaging and other medical equipment, elevators,
escalators, off-road electric vehicles, laboratory fume hoods, laundry equipment, coffee brewers, water services, pumps, emergency generators, combined heat and power in commercial buildings, manufacturing performed in commercial buildings, and cooking (distillate), plus residual fuel oil, propane, coal, motor gasoline, kerosene, and marketed renewable fuels (biomass).
8Includes combined heat and power plants that have a non-regulatory status, and small on-site generating systems. 9Commercial trucks 8,501 to 10,000 pounds gross vehicle weight rating. 10By convention, the direct emissions from biogenic energy sources are excluded from energy-related carbon dioxide emissions. The release of carbon from
these sources is assumed to be balanced by the uptake of carbon when the feedstock is grown, resulting in zero net emissions over some period of time. If, however, increased use of biomass energy results in a decline in terrestrial carbon stocks, a net positive release of carbon may occur. Accordingly, the emissions from biogenic energy sources are reported here as an indication of the potential net release of carbon dioxide in the absence of offsetting sequestration.
- - = Not applicable. Note: Totals may not equal sum of components due to independent rounding. Data for 2012 and 2013 are model results and may differ from official EIA data
reports. Sources: 2012 and 2013 emissions and emission factors: U.S. Energy Information Administration (EIA), Monthly Energy Review, DOE/EIA-0035(2014/11)
(Washington, DC, November 2014). Projections: EIA, AEO2015 National Energy Modeling System run REF2015.D021915A.
Table A19. Energy-related carbon dioxide emissions by end use (continued) (million metric tons)
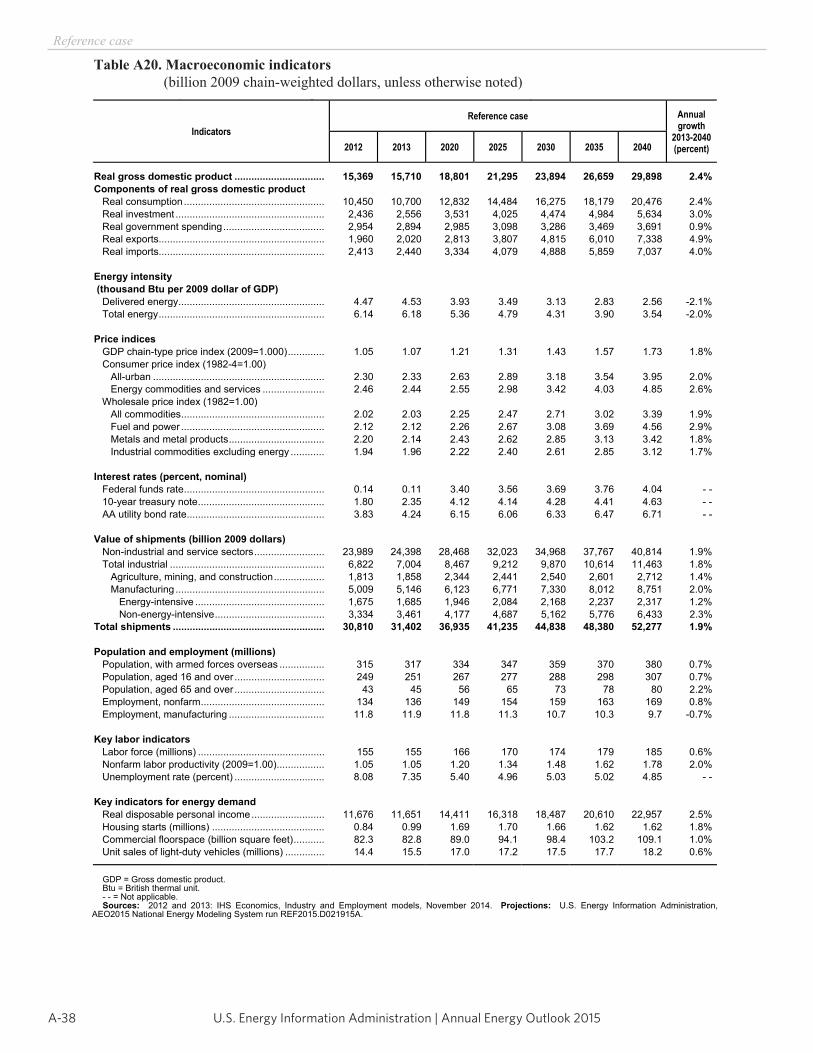
U.S. Energy Information Administration | Annual Energy Outlook 2015A-38
Reference case
Table A20. Macroeconomic indicators (billion 2009 chain-weighted dollars, unless otherwise noted)
Energy Information Administration / Annual Energy Outlook 2015
Table A20. Macroeconomic indicators(billion 2009 chain-weighted dollars, unless otherwise noted)
Indicators Reference case Annual
growth 2013-2040(percent) 2012 2013 2020 2025 2030 2035 2040
Real gross domestic product ................................ 15,369 15,710 18,801 21,295 23,894 26,659 29,898 2.4%Components of real gross domestic product Real consumption .................................................. 10,450 10,700 12,832 14,484 16,275 18,179 20,476 2.4% Real investment ..................................................... 2,436 2,556 3,531 4,025 4,474 4,984 5,634 3.0% Real government spending .................................... 2,954 2,894 2,985 3,098 3,286 3,469 3,691 0.9%
Real exports........................................................... 1,960 2,020 2,813 3,807 4,815 6,010 7,338 4.9% Real imports........................................................... 2,413 2,440 3,334 4,079 4,888 5,859 7,037 4.0%
Energy intensity (thousand Btu per 2009 dollar of GDP) Delivered energy .................................................... 4.47 4.53 3.93 3.49 3.13 2.83 2.56 -2.1% Total energy ........................................................... 6.14 6.18 5.36 4.79 4.31 3.90 3.54 -2.0%
Price indices GDP chain-type price index (2009=1.000) ............. 1.05 1.07 1.21 1.31 1.43 1.57 1.73 1.8% Consumer price index (1982-4=1.00)
All-urban ............................................................. 2.30 2.33 2.63 2.89 3.18 3.54 3.95 2.0% Energy commodities and services ...................... 2.46 2.44 2.55 2.98 3.42 4.03 4.85 2.6%
Wholesale price index (1982=1.00) All commodities ................................................... 2.02 2.03 2.25 2.47 2.71 3.02 3.39 1.9% Fuel and power ................................................... 2.12 2.12 2.26 2.67 3.08 3.69 4.56 2.9% Metals and metal products .................................. 2.20 2.14 2.43 2.62 2.85 3.13 3.42 1.8% Industrial commodities excluding energy ............ 1.94 1.96 2.22 2.40 2.61 2.85 3.12 1.7%
Interest rates (percent, nominal) Federal funds rate .................................................. 0.14 0.11 3.40 3.56 3.69 3.76 4.04 - - 10-year treasury note ............................................. 1.80 2.35 4.12 4.14 4.28 4.41 4.63 - - AA utility bond rate ................................................. 3.83 4.24 6.15 6.06 6.33 6.47 6.71 - -
Value of shipments (billion 2009 dollars) Non-industrial and service sectors ......................... 23,989 24,398 28,468 32,023 34,968 37,767 40,814 1.9% Total industrial ....................................................... 6,822 7,004 8,467 9,212 9,870 10,614 11,463 1.8%
Agriculture, mining, and construction .................. 1,813 1,858 2,344 2,441 2,540 2,601 2,712 1.4% Manufacturing ..................................................... 5,009 5,146 6,123 6,771 7,330 8,012 8,751 2.0% Energy-intensive .............................................. 1,675 1,685 1,946 2,084 2,168 2,237 2,317 1.2%
Non-energy-intensive ....................................... 3,334 3,461 4,177 4,687 5,162 5,776 6,433 2.3%Total shipments ...................................................... 30,810 31,402 36,935 41,235 44,838 48,380 52,277 1.9%
Population and employment (millions) Population, with armed forces overseas ................ 315 317 334 347 359 370 380 0.7% Population, aged 16 and over ................................ 249 251 267 277 288 298 307 0.7% Population, aged 65 and over ................................ 43 45 56 65 73 78 80 2.2%
Employment, nonfarm ............................................ 134 136 149 154 159 163 169 0.8% Employment, manufacturing .................................. 11.8 11.9 11.8 11.3 10.7 10.3 9.7 -0.7%
Key labor indicators Labor force (millions) ............................................. 155 155 166 170 174 179 185 0.6% Nonfarm labor productivity (2009=1.00) ................. 1.05 1.05 1.20 1.34 1.48 1.62 1.78 2.0% Unemployment rate (percent) ................................ 8.08 7.35 5.40 4.96 5.03 5.02 4.85 - -
Key indicators for energy demand Real disposable personal income .......................... 11,676 11,651 14,411 16,318 18,487 20,610 22,957 2.5%
Housing starts (millions) ........................................ 0.84 0.99 1.69 1.70 1.66 1.62 1.62 1.8% Commercial floorspace (billion square feet) ........... 82.3 82.8 89.0 94.1 98.4 103.2 109.1 1.0%
Unit sales of light-duty vehicles (millions) .............. 14.4 15.5 17.0 17.2 17.5 17.7 18.2 0.6%
GDP = Gross domestic product. Btu = British thermal unit. - - = Not applicable. Sources: 2012 and 2013: IHS Economics, Industry and Employment models, November 2014. Projections: U.S. Energy Information Administration,
AEO2015 National Energy Modeling System run REF2015.D021915A.
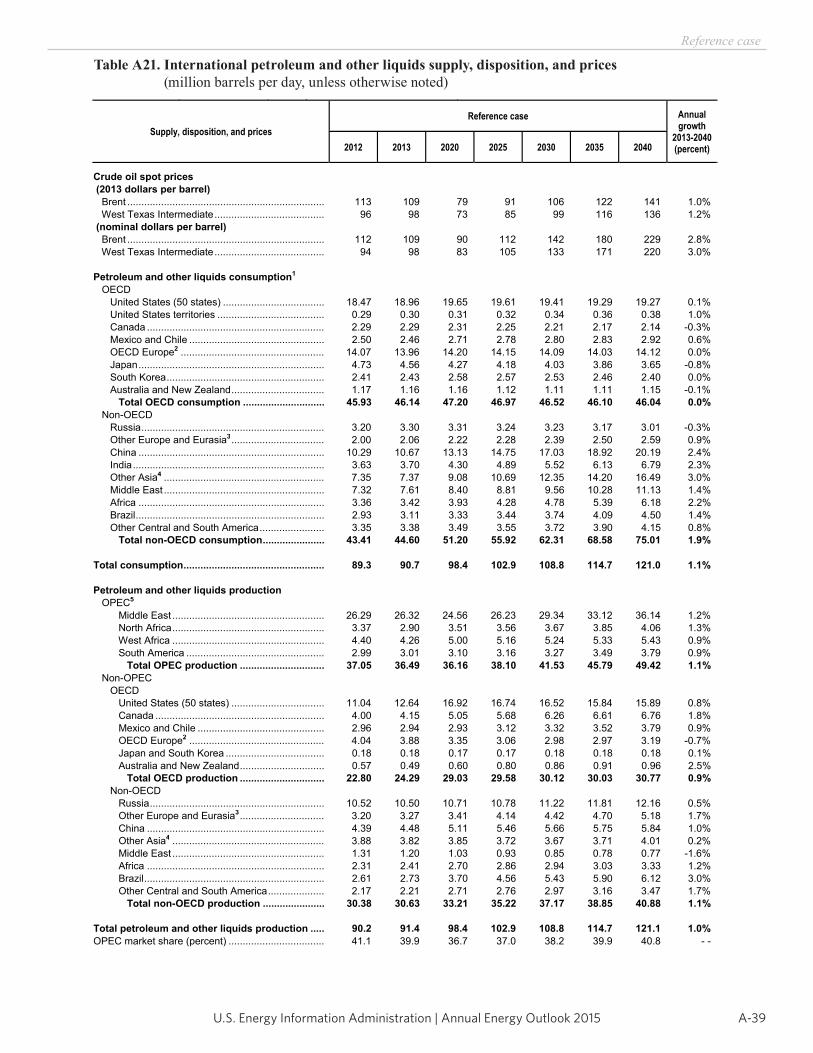
A-39U.S. Energy Information Administration | Annual Energy Outlook 2015
Reference case
Energy Information Administration / Annual Energy Outlook 2015
Table A21. International petroleum and other liquids supply, disposition, and prices(million barrels per day, unless otherwise noted)
Supply, disposition, and prices Reference case Annual
growth 2013-2040(percent) 2012 2013 2020 2025 2030 2035 2040
Crude oil spot prices (2013 dollars per barrel) Brent ...................................................................... 113 109 79 91 106 122 141 1.0% West Texas Intermediate ....................................... 96 98 73 85 99 116 136 1.2% (nominal dollars per barrel) Brent ...................................................................... 112 109 90 112 142 180 229 2.8% West Texas Intermediate ....................................... 94 98 83 105 133 171 220 3.0%
Petroleum and other liquids consumption1
OECD United States (50 states) .................................... 18.47 18.96 19.65 19.61 19.41 19.29 19.27 0.1% United States territories ...................................... 0.29 0.30 0.31 0.32 0.34 0.36 0.38 1.0%
Canada ............................................................... 2.29 2.29 2.31 2.25 2.21 2.17 2.14 -0.3% Mexico and Chile ................................................ 2.50 2.46 2.71 2.78 2.80 2.83 2.92 0.6% OECD Europe2 ................................................... 14.07 13.96 14.20 14.15 14.09 14.03 14.12 0.0%
Japan .................................................................. 4.73 4.56 4.27 4.18 4.03 3.86 3.65 -0.8% South Korea ........................................................ 2.41 2.43 2.58 2.57 2.53 2.46 2.40 0.0% Australia and New Zealand ................................. 1.17 1.16 1.16 1.12 1.11 1.11 1.15 -0.1% Total OECD consumption ............................. 45.93 46.14 47.20 46.97 46.52 46.10 46.04 0.0%
Non-OECD Russia ................................................................. 3.20 3.30 3.31 3.24 3.23 3.17 3.01 -0.3%
Other Europe and Eurasia3 ................................. 2.00 2.06 2.22 2.28 2.39 2.50 2.59 0.9% China .................................................................. 10.29 10.67 13.13 14.75 17.03 18.92 20.19 2.4%
India .................................................................... 3.63 3.70 4.30 4.89 5.52 6.13 6.79 2.3% Other Asia4 ......................................................... 7.35 7.37 9.08 10.69 12.35 14.20 16.49 3.0% Middle East ......................................................... 7.32 7.61 8.40 8.81 9.56 10.28 11.13 1.4%
Africa .................................................................. 3.36 3.42 3.93 4.28 4.78 5.39 6.18 2.2% Brazil ................................................................... 2.93 3.11 3.33 3.44 3.74 4.09 4.50 1.4%
Other Central and South America ....................... 3.35 3.38 3.49 3.55 3.72 3.90 4.15 0.8% Total non-OECD consumption ...................... 43.41 44.60 51.20 55.92 62.31 68.58 75.01 1.9%
Total consumption .................................................. 89.3 90.7 98.4 102.9 108.8 114.7 121.0 1.1%
Petroleum and other liquids production OPEC5
Middle East ...................................................... 26.29 26.32 24.56 26.23 29.34 33.12 36.14 1.2% North Africa ...................................................... 3.37 2.90 3.51 3.56 3.67 3.85 4.06 1.3% West Africa ...................................................... 4.40 4.26 5.00 5.16 5.24 5.33 5.43 0.9% South America ................................................. 2.99 3.01 3.10 3.16 3.27 3.49 3.79 0.9%
Total OPEC production .............................. 37.05 36.49 36.16 38.10 41.53 45.79 49.42 1.1% Non-OPEC OECD
United States (50 states) ................................. 11.04 12.64 16.92 16.74 16.52 15.84 15.89 0.8% Canada ............................................................ 4.00 4.15 5.05 5.68 6.26 6.61 6.76 1.8% Mexico and Chile ............................................. 2.96 2.94 2.93 3.12 3.32 3.52 3.79 0.9% OECD Europe2 ................................................ 4.04 3.88 3.35 3.06 2.98 2.97 3.19 -0.7% Japan and South Korea ................................... 0.18 0.18 0.17 0.17 0.18 0.18 0.18 0.1% Australia and New Zealand .............................. 0.57 0.49 0.60 0.80 0.86 0.91 0.96 2.5%
Total OECD production .............................. 22.80 24.29 29.03 29.58 30.12 30.03 30.77 0.9% Non-OECD
Russia .............................................................. 10.52 10.50 10.71 10.78 11.22 11.81 12.16 0.5% Other Europe and Eurasia3 .............................. 3.20 3.27 3.41 4.14 4.42 4.70 5.18 1.7% China ............................................................... 4.39 4.48 5.11 5.46 5.66 5.75 5.84 1.0% Other Asia4 ...................................................... 3.88 3.82 3.85 3.72 3.67 3.71 4.01 0.2% Middle East ...................................................... 1.31 1.20 1.03 0.93 0.85 0.78 0.77 -1.6% Africa ............................................................... 2.31 2.41 2.70 2.86 2.94 3.03 3.33 1.2% Brazil ................................................................ 2.61 2.73 3.70 4.56 5.43 5.90 6.12 3.0% Other Central and South America .................... 2.17 2.21 2.71 2.76 2.97 3.16 3.47 1.7%
Total non-OECD production ...................... 30.38 30.63 33.21 35.22 37.17 38.85 40.88 1.1%
Total petroleum and other liquids production ..... 90.2 91.4 98.4 102.9 108.8 114.7 121.1 1.0%OPEC market share (percent) .................................. 41.1 39.9 36.7 37.0 38.2 39.9 40.8 - -
Table A21. International petroleum and other liquids supply, disposition, and prices (million barrels per day, unless otherwise noted)
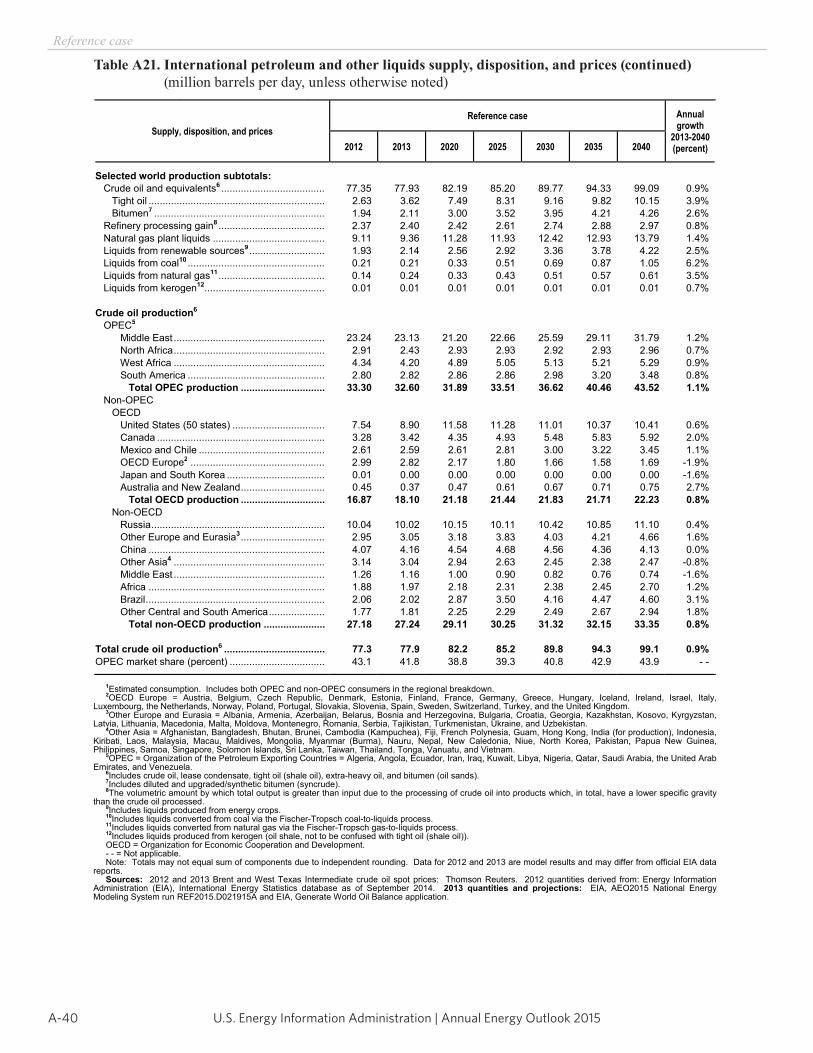
U.S. Energy Information Administration | Annual Energy Outlook 2015A-40
Reference case
Table A21. International petroleum and other liquids supply, disposition, and prices (continued) (million barrels per day, unless otherwise noted)
Energy Information Administration / Annual Energy Outlook 2015
Table A21. International petroleum and other liquids supply, disposition, and prices (continued)(million barrels per day, unless otherwise noted)
Supply, disposition, and prices Reference case Annual
growth 2013-2040(percent) 2012 2013 2020 2025 2030 2035 2040
Selected world production subtotals: Crude oil and equivalents6 ..................................... 77.35 77.93 82.19 85.20 89.77 94.33 99.09 0.9%
Tight oil ............................................................... 2.63 3.62 7.49 8.31 9.16 9.82 10.15 3.9% Bitumen7 ............................................................. 1.94 2.11 3.00 3.52 3.95 4.21 4.26 2.6%
Refinery processing gain8 ...................................... 2.37 2.40 2.42 2.61 2.74 2.88 2.97 0.8% Natural gas plant liquids ........................................ 9.11 9.36 11.28 11.93 12.42 12.93 13.79 1.4% Liquids from renewable sources9 ........................... 1.93 2.14 2.56 2.92 3.36 3.78 4.22 2.5% Liquids from coal10 ................................................. 0.21 0.21 0.33 0.51 0.69 0.87 1.05 6.2% Liquids from natural gas11 ...................................... 0.14 0.24 0.33 0.43 0.51 0.57 0.61 3.5% Liquids from kerogen12........................................... 0.01 0.01 0.01 0.01 0.01 0.01 0.01 0.7%
Crude oil production6
OPEC5
Middle East ...................................................... 23.24 23.13 21.20 22.66 25.59 29.11 31.79 1.2% North Africa ...................................................... 2.91 2.43 2.93 2.93 2.92 2.93 2.96 0.7% West Africa ...................................................... 4.34 4.20 4.89 5.05 5.13 5.21 5.29 0.9% South America ................................................. 2.80 2.82 2.86 2.86 2.98 3.20 3.48 0.8%
Total OPEC production .............................. 33.30 32.60 31.89 33.51 36.62 40.46 43.52 1.1% Non-OPEC OECD
United States (50 states) ................................. 7.54 8.90 11.58 11.28 11.01 10.37 10.41 0.6% Canada ............................................................ 3.28 3.42 4.35 4.93 5.48 5.83 5.92 2.0% Mexico and Chile ............................................. 2.61 2.59 2.61 2.81 3.00 3.22 3.45 1.1% OECD Europe2 ................................................ 2.99 2.82 2.17 1.80 1.66 1.58 1.69 -1.9% Japan and South Korea ................................... 0.01 0.00 0.00 0.00 0.00 0.00 0.00 -1.6% Australia and New Zealand .............................. 0.45 0.37 0.47 0.61 0.67 0.71 0.75 2.7%
Total OECD production .............................. 16.87 18.10 21.18 21.44 21.83 21.71 22.23 0.8% Non-OECD
Russia .............................................................. 10.04 10.02 10.15 10.11 10.42 10.85 11.10 0.4% Other Europe and Eurasia3 .............................. 2.95 3.05 3.18 3.83 4.03 4.21 4.66 1.6% China ............................................................... 4.07 4.16 4.54 4.68 4.56 4.36 4.13 0.0% Other Asia4 ...................................................... 3.14 3.04 2.94 2.63 2.45 2.38 2.47 -0.8% Middle East ...................................................... 1.26 1.16 1.00 0.90 0.82 0.76 0.74 -1.6% Africa ............................................................... 1.88 1.97 2.18 2.31 2.38 2.45 2.70 1.2% Brazil ................................................................ 2.06 2.02 2.87 3.50 4.16 4.47 4.60 3.1% Other Central and South America .................... 1.77 1.81 2.25 2.29 2.49 2.67 2.94 1.8%
Total non-OECD production ...................... 27.18 27.24 29.11 30.25 31.32 32.15 33.35 0.8%
Total crude oil production6 .................................... 77.3 77.9 82.2 85.2 89.8 94.3 99.1 0.9%OPEC market share (percent) .................................. 43.1 41.8 38.8 39.3 40.8 42.9 43.9 - -
1Estimated consumption. Includes both OPEC and non-OPEC consumers in the regional breakdown. 2OECD Europe = Austria, Belgium, Czech Republic, Denmark, Estonia, Finland, France, Germany, Greece, Hungary, Iceland, Ireland, Israel, Italy,
Luxembourg, the Netherlands, Norway, Poland, Portugal, Slovakia, Slovenia, Spain, Sweden, Switzerland, Turkey, and the United Kingdom. 3Other Europe and Eurasia = Albania, Armenia, Azerbaijan, Belarus, Bosnia and Herzegovina, Bulgaria, Croatia, Georgia, Kazakhstan, Kosovo, Kyrgyzstan,
Latvia, Lithuania, Macedonia, Malta, Moldova, Montenegro, Romania, Serbia, Tajikistan, Turkmenistan, Ukraine, and Uzbekistan. 4Other Asia = Afghanistan, Bangladesh, Bhutan, Brunei, Cambodia (Kampuchea), Fiji, French Polynesia, Guam, Hong Kong, India (for production), Indonesia,
Kiribati, Laos, Malaysia, Macau, Maldives, Mongolia, Myanmar (Burma), Nauru, Nepal, New Caledonia, Niue, North Korea, Pakistan, Papua New Guinea, Philippines, Samoa, Singapore, Solomon Islands, Sri Lanka, Taiwan, Thailand, Tonga, Vanuatu, and Vietnam.
5OPEC = Organization of the Petroleum Exporting Countries = Algeria, Angola, Ecuador, Iran, Iraq, Kuwait, Libya, Nigeria, Qatar, Saudi Arabia, the United Arab Emirates, and Venezuela.
6Includes crude oil, lease condensate, tight oil (shale oil), extra-heavy oil, and bitumen (oil sands). 7Includes diluted and upgraded/synthetic bitumen (syncrude). 8The volumetric amount by which total output is greater than input due to the processing of crude oil into products which, in total, have a lower specific gravity
than the crude oil processed. 9Includes liquids produced from energy crops. 10Includes liquids converted from coal via the Fischer-Tropsch coal-to-liquids process. 11Includes liquids converted from natural gas via the Fischer-Tropsch gas-to-liquids process. 12Includes liquids produced from kerogen (oil shale, not to be confused with tight oil (shale oil)). OECD = Organization for Economic Cooperation and Development. - - = Not applicable. Note: Totals may not equal sum of components due to independent rounding. Data for 2012 and 2013 are model results and may differ from official EIA data
reports. Sources: 2012 and 2013 Brent and West Texas Intermediate crude oil spot prices: Thomson Reuters. 2012 quantities derived from: Energy Information
Administration (EIA), International Energy Statistics database as of September 2014. 2013 quantities and projections: EIA, AEO2015 National Energy Modeling System run REF2015.D021915A and EIA, Generate World Oil Balance application.
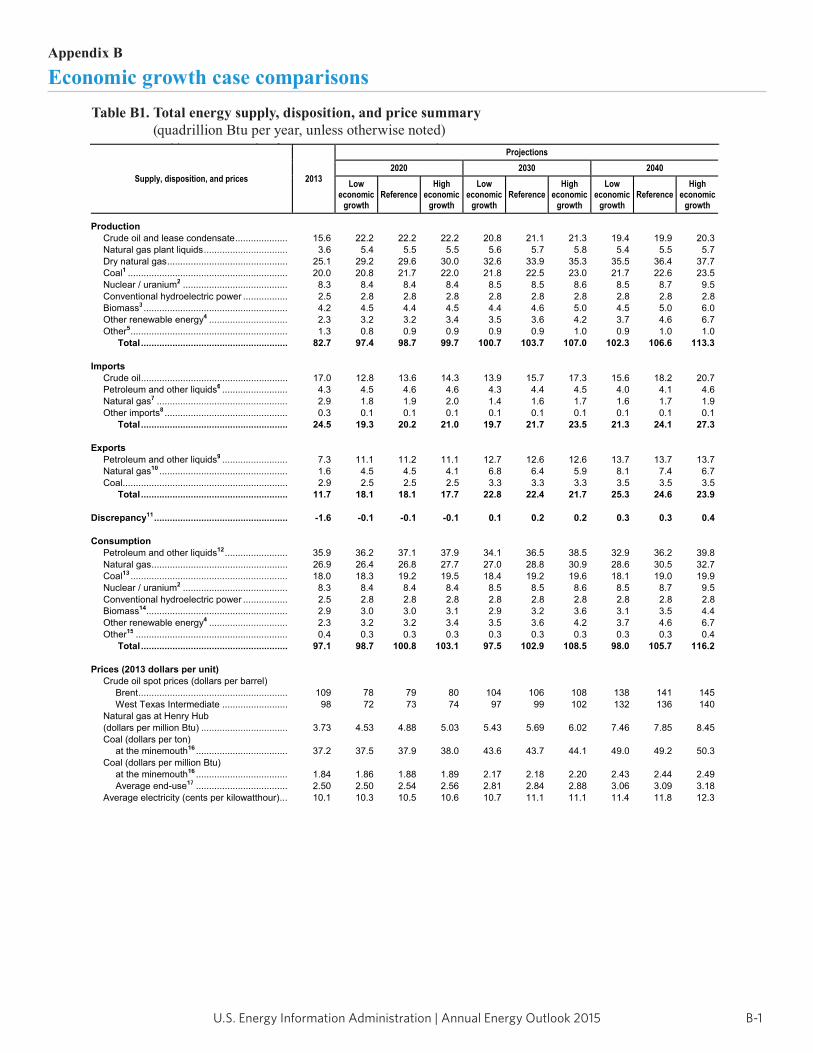
B-1U.S. Energy Information Administration | Annual Energy Outlook 2015
Table B1. Total energy supply, disposition, and price summary(quadrillion Btu per year, unless otherwise noted)
Supply, disposition, and prices 2013
Projections2020 2030 2040
Loweconomic
growth Reference
High economic
growth
Loweconomic
growth Reference
High economic
growth
Loweconomic
growth Reference
High economic
growth
Production Crude oil and lease condensate .................... 15.6 22.2 22.2 22.2 20.8 21.1 21.3 19.4 19.9 20.3
Natural gas plant liquids ................................ 3.6 5.4 5.5 5.5 5.6 5.7 5.8 5.4 5.5 5.7 Dry natural gas .............................................. 25.1 29.2 29.6 30.0 32.6 33.9 35.3 35.5 36.4 37.7 Coal1 ............................................................. 20.0 20.8 21.7 22.0 21.8 22.5 23.0 21.7 22.6 23.5 Nuclear / uranium2 ........................................ 8.3 8.4 8.4 8.4 8.5 8.5 8.6 8.5 8.7 9.5 Conventional hydroelectric power ................. 2.5 2.8 2.8 2.8 2.8 2.8 2.8 2.8 2.8 2.8 Biomass3 ....................................................... 4.2 4.5 4.4 4.5 4.4 4.6 5.0 4.5 5.0 6.0 Other renewable energy4 .............................. 2.3 3.2 3.2 3.4 3.5 3.6 4.2 3.7 4.6 6.7 Other5 ............................................................ 1.3 0.8 0.9 0.9 0.9 0.9 1.0 0.9 1.0 1.0 Total ........................................................ 82.7 97.4 98.7 99.7 100.7 103.7 107.0 102.3 106.6 113.3
Imports Crude oil ........................................................ 17.0 12.8 13.6 14.3 13.9 15.7 17.3 15.6 18.2 20.7
Petroleum and other liquids6 ......................... 4.3 4.5 4.6 4.6 4.3 4.4 4.5 4.0 4.1 4.6 Natural gas7 .................................................. 2.9 1.8 1.9 2.0 1.4 1.6 1.7 1.6 1.7 1.9 Other imports8 ............................................... 0.3 0.1 0.1 0.1 0.1 0.1 0.1 0.1 0.1 0.1 Total ........................................................ 24.5 19.3 20.2 21.0 19.7 21.7 23.5 21.3 24.1 27.3
Exports Petroleum and other liquids9 ......................... 7.3 11.1 11.2 11.1 12.7 12.6 12.6 13.7 13.7 13.7
Natural gas10 ................................................. 1.6 4.5 4.5 4.1 6.8 6.4 5.9 8.1 7.4 6.7 Coal ............................................................... 2.9 2.5 2.5 2.5 3.3 3.3 3.3 3.5 3.5 3.5 Total ........................................................ 11.7 18.1 18.1 17.7 22.8 22.4 21.7 25.3 24.6 23.9
Discrepancy11 ................................................... -1.6 -0.1 -0.1 -0.1 0.1 0.2 0.2 0.3 0.3 0.4
Consumption Petroleum and other liquids12 ........................ 35.9 36.2 37.1 37.9 34.1 36.5 38.5 32.9 36.2 39.8
Natural gas .................................................... 26.9 26.4 26.8 27.7 27.0 28.8 30.9 28.6 30.5 32.7 Coal13 ............................................................ 18.0 18.3 19.2 19.5 18.4 19.2 19.6 18.1 19.0 19.9 Nuclear / uranium2 ........................................ 8.3 8.4 8.4 8.4 8.5 8.5 8.6 8.5 8.7 9.5 Conventional hydroelectric power ................. 2.5 2.8 2.8 2.8 2.8 2.8 2.8 2.8 2.8 2.8 Biomass14...................................................... 2.9 3.0 3.0 3.1 2.9 3.2 3.6 3.1 3.5 4.4 Other renewable energy4 .............................. 2.3 3.2 3.2 3.4 3.5 3.6 4.2 3.7 4.6 6.7 Other15 .......................................................... 0.4 0.3 0.3 0.3 0.3 0.3 0.3 0.3 0.3 0.4 Total ........................................................ 97.1 98.7 100.8 103.1 97.5 102.9 108.5 98.0 105.7 116.2
Prices (2013 dollars per unit) Crude oil spot prices (dollars per barrel)
Brent ......................................................... 109 78 79 80 104 106 108 138 141 145 West Texas Intermediate ......................... 98 72 73 74 97 99 102 132 136 140 Natural gas at Henry Hub
(dollars per million Btu) ................................. 3.73 4.53 4.88 5.03 5.43 5.69 6.02 7.46 7.85 8.45 Coal (dollars per ton) at the minemouth16 ................................... 37.2 37.5 37.9 38.0 43.6 43.7 44.1 49.0 49.2 50.3 Coal (dollars per million Btu) at the minemouth16 ................................... 1.84 1.86 1.88 1.89 2.17 2.18 2.20 2.43 2.44 2.49 Average end-use17 ................................... 2.50 2.50 2.54 2.56 2.81 2.84 2.88 3.06 3.09 3.18 Average electricity (cents per kilowatthour) ... 10.1 10.3 10.5 10.6 10.7 11.1 11.1 11.4 11.8 12.3
Appendix B
Economic growth case comparisonsTable B1. Total energy supply, disposition, and price summary
(quadrillion Btu per year, unless otherwise noted)
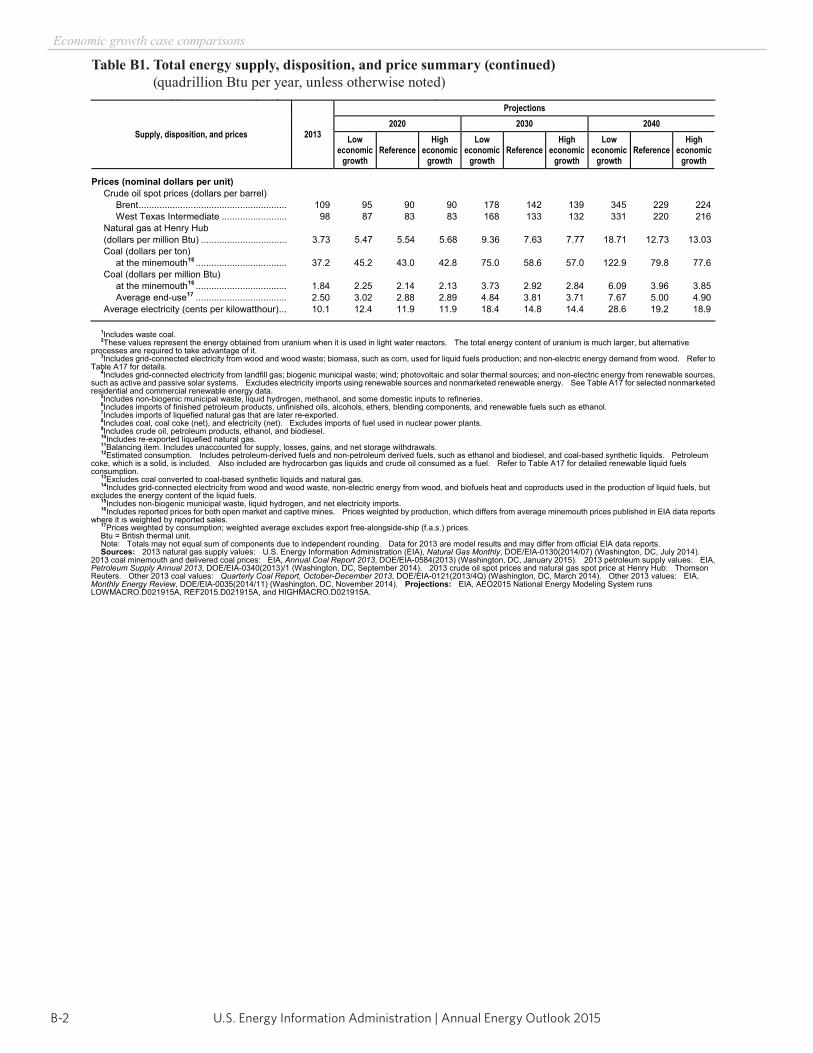
U.S. Energy Information Administration | Annual Energy Outlook 2015B-2
Economic growth case comparisons
Table B1. Total energy supply, disposition, and price summary (continued) (quadrillion Btu per year, unless otherwise noted)
Energy Information Administration / Annual Energy Outlook 2015
Table B1. Total energy supply, disposition, and price summary (continued)(quadrillion Btu per year, unless otherwise noted)
Supply, disposition, and prices 2013
Projections2020 2030 2040
Loweconomic
growth Reference
High economic
growth
Loweconomic
growth Reference
High economic
growth
Loweconomic
growth Reference
High economic
growth
Prices (nominal dollars per unit) Crude oil spot prices (dollars per barrel)
Brent ......................................................... 109 95 90 90 178 142 139 345 229 224 West Texas Intermediate ......................... 98 87 83 83 168 133 132 331 220 216 Natural gas at Henry Hub
(dollars per million Btu) ................................. 3.73 5.47 5.54 5.68 9.36 7.63 7.77 18.71 12.73 13.03 Coal (dollars per ton) at the minemouth16 ................................... 37.2 45.2 43.0 42.8 75.0 58.6 57.0 122.9 79.8 77.6 Coal (dollars per million Btu) at the minemouth16 ................................... 1.84 2.25 2.14 2.13 3.73 2.92 2.84 6.09 3.96 3.85 Average end-use17 ................................... 2.50 3.02 2.88 2.89 4.84 3.81 3.71 7.67 5.00 4.90 Average electricity (cents per kilowatthour) ... 10.1 12.4 11.9 11.9 18.4 14.8 14.4 28.6 19.2 18.9
1Includes waste coal. 2These values represent the energy obtained from uranium when it is used in light water reactors. The total energy content of uranium is much larger, but alternative
processes are required to take advantage of it. 3Includes grid-connected electricity from wood and wood waste; biomass, such as corn, used for liquid fuels production; and non-electric energy demand from wood. Refer to
Table A17 for details. 4Includes grid-connected electricity from landfill gas; biogenic municipal waste; wind; photovoltaic and solar thermal sources; and non-electric energy from renewable sources,
such as active and passive solar systems. Excludes electricity imports using renewable sources and nonmarketed renewable energy. See Table A17 for selected nonmarketed residential and commercial renewable energy data.
5Includes non-biogenic municipal waste, liquid hydrogen, methanol, and some domestic inputs to refineries. 6Includes imports of finished petroleum products, unfinished oils, alcohols, ethers, blending components, and renewable fuels such as ethanol. 7Includes imports of liquefied natural gas that are later re-exported. 8Includes coal, coal coke (net), and electricity (net). Excludes imports of fuel used in nuclear power plants. 9Includes crude oil, petroleum products, ethanol, and biodiesel. 10Includes re-exported liquefied natural gas. 11Balancing item. Includes unaccounted for supply, losses, gains, and net storage withdrawals. 12Estimated consumption. Includes petroleum-derived fuels and non-petroleum derived fuels, such as ethanol and biodiesel, and coal-based synthetic liquids. Petroleum
coke, which is a solid, is included. Also included are hydrocarbon gas liquids and crude oil consumed as a fuel. Refer to Table A17 for detailed renewable liquid fuels consumption.
13Excludes coal converted to coal-based synthetic liquids and natural gas. 14Includes grid-connected electricity from wood and wood waste, non-electric energy from wood, and biofuels heat and coproducts used in the production of liquid fuels, but
excludes the energy content of the liquid fuels. 15Includes non-biogenic municipal waste, liquid hydrogen, and net electricity imports. 16Includes reported prices for both open market and captive mines. Prices weighted by production, which differs from average minemouth prices published in EIA data reports
where it is weighted by reported sales. 17Prices weighted by consumption; weighted average excludes export free-alongside-ship (f.a.s.) prices. Btu = British thermal unit. Note: Totals may not equal sum of components due to independent rounding. Data for 2013 are model results and may differ from official EIA data reports. Sources: 2013 natural gas supply values: U.S. Energy Information Administration (EIA), Natural Gas Monthly, DOE/EIA-0130(2014/07) (Washington, DC, July 2014).
2013 coal minemouth and delivered coal prices: EIA, Annual Coal Report 2013, DOE/EIA-0584(2013) (Washington, DC, January 2015). 2013 petroleum supply values: EIA, Petroleum Supply Annual 2013, DOE/EIA-0340(2013)/1 (Washington, DC, September 2014). 2013 crude oil spot prices and natural gas spot price at Henry Hub: Thomson Reuters. Other 2013 coal values: Quarterly Coal Report, October-December 2013, DOE/EIA-0121(2013/4Q) (Washington, DC, March 2014). Other 2013 values: EIA, Monthly Energy Review, DOE/EIA-0035(2014/11) (Washington, DC, November 2014). Projections: EIA, AEO2015 National Energy Modeling System runs LOWMACRO.D021915A, REF2015.D021915A, and HIGHMACRO.D021915A.
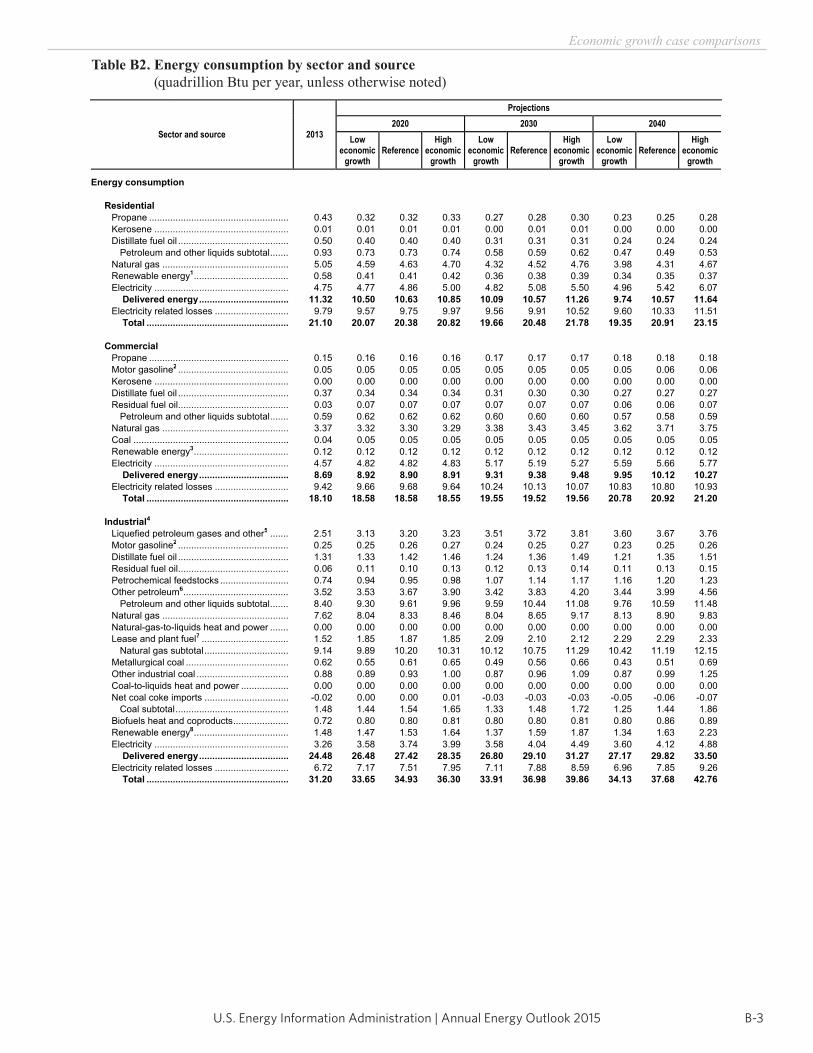
B-3U.S. Energy Information Administration | Annual Energy Outlook 2015
Economic growth case comparisons
Table B2. Energy consumption by sector and source (quadrillion Btu per year, unless otherwise noted)
Energy Information Administration / Annual Energy Outlook 2015
Table B2. Energy consumption by sector and source(quadrillion Btu per year, unless otherwise noted)
Sector and source 2013
Projections2020 2030 2040
Loweconomic
growth Reference
High economic
growth
Loweconomic
growth Reference
High economic
growth
Loweconomic
growth Reference
High economic
growth
Energy consumption
Residential Propane ..................................................... 0.43 0.32 0.32 0.33 0.27 0.28 0.30 0.23 0.25 0.28 Kerosene ................................................... 0.01 0.01 0.01 0.01 0.00 0.01 0.01 0.00 0.00 0.00 Distillate fuel oil .......................................... 0.50 0.40 0.40 0.40 0.31 0.31 0.31 0.24 0.24 0.24 Petroleum and other liquids subtotal ....... 0.93 0.73 0.73 0.74 0.58 0.59 0.62 0.47 0.49 0.53 Natural gas ................................................ 5.05 4.59 4.63 4.70 4.32 4.52 4.76 3.98 4.31 4.67 Renewable energy1 .................................... 0.58 0.41 0.41 0.42 0.36 0.38 0.39 0.34 0.35 0.37 Electricity ................................................... 4.75 4.77 4.86 5.00 4.82 5.08 5.50 4.96 5.42 6.07 Delivered energy .................................. 11.32 10.50 10.63 10.85 10.09 10.57 11.26 9.74 10.57 11.64 Electricity related losses ............................ 9.79 9.57 9.75 9.97 9.56 9.91 10.52 9.60 10.33 11.51 Total ...................................................... 21.10 20.07 20.38 20.82 19.66 20.48 21.78 19.35 20.91 23.15
Commercial Propane ..................................................... 0.15 0.16 0.16 0.16 0.17 0.17 0.17 0.18 0.18 0.18 Motor gasoline2 .......................................... 0.05 0.05 0.05 0.05 0.05 0.05 0.05 0.05 0.06 0.06 Kerosene ................................................... 0.00 0.00 0.00 0.00 0.00 0.00 0.00 0.00 0.00 0.00 Distillate fuel oil .......................................... 0.37 0.34 0.34 0.34 0.31 0.30 0.30 0.27 0.27 0.27 Residual fuel oil .......................................... 0.03 0.07 0.07 0.07 0.07 0.07 0.07 0.06 0.06 0.07 Petroleum and other liquids subtotal ....... 0.59 0.62 0.62 0.62 0.60 0.60 0.60 0.57 0.58 0.59 Natural gas ................................................ 3.37 3.32 3.30 3.29 3.38 3.43 3.45 3.62 3.71 3.75 Coal ........................................................... 0.04 0.05 0.05 0.05 0.05 0.05 0.05 0.05 0.05 0.05 Renewable energy3 .................................... 0.12 0.12 0.12 0.12 0.12 0.12 0.12 0.12 0.12 0.12 Electricity ................................................... 4.57 4.82 4.82 4.83 5.17 5.19 5.27 5.59 5.66 5.77 Delivered energy .................................. 8.69 8.92 8.90 8.91 9.31 9.38 9.48 9.95 10.12 10.27 Electricity related losses ............................ 9.42 9.66 9.68 9.64 10.24 10.13 10.07 10.83 10.80 10.93 Total ...................................................... 18.10 18.58 18.58 18.55 19.55 19.52 19.56 20.78 20.92 21.20
Industrial4 Liquefied petroleum gases and other5 ....... 2.51 3.13 3.20 3.23 3.51 3.72 3.81 3.60 3.67 3.76 Motor gasoline2 .......................................... 0.25 0.25 0.26 0.27 0.24 0.25 0.27 0.23 0.25 0.26 Distillate fuel oil .......................................... 1.31 1.33 1.42 1.46 1.24 1.36 1.49 1.21 1.35 1.51 Residual fuel oil .......................................... 0.06 0.11 0.10 0.13 0.12 0.13 0.14 0.11 0.13 0.15 Petrochemical feedstocks .......................... 0.74 0.94 0.95 0.98 1.07 1.14 1.17 1.16 1.20 1.23 Other petroleum6 ........................................ 3.52 3.53 3.67 3.90 3.42 3.83 4.20 3.44 3.99 4.56 Petroleum and other liquids subtotal ....... 8.40 9.30 9.61 9.96 9.59 10.44 11.08 9.76 10.59 11.48 Natural gas ................................................ 7.62 8.04 8.33 8.46 8.04 8.65 9.17 8.13 8.90 9.83 Natural-gas-to-liquids heat and power ....... 0.00 0.00 0.00 0.00 0.00 0.00 0.00 0.00 0.00 0.00 Lease and plant fuel7 ................................. 1.52 1.85 1.87 1.85 2.09 2.10 2.12 2.29 2.29 2.33 Natural gas subtotal ................................ 9.14 9.89 10.20 10.31 10.12 10.75 11.29 10.42 11.19 12.15 Metallurgical coal ....................................... 0.62 0.55 0.61 0.65 0.49 0.56 0.66 0.43 0.51 0.69 Other industrial coal ................................... 0.88 0.89 0.93 1.00 0.87 0.96 1.09 0.87 0.99 1.25 Coal-to-liquids heat and power .................. 0.00 0.00 0.00 0.00 0.00 0.00 0.00 0.00 0.00 0.00 Net coal coke imports ................................ -0.02 0.00 0.00 0.01 -0.03 -0.03 -0.03 -0.05 -0.06 -0.07 Coal subtotal ........................................... 1.48 1.44 1.54 1.65 1.33 1.48 1.72 1.25 1.44 1.86 Biofuels heat and coproducts ..................... 0.72 0.80 0.80 0.81 0.80 0.80 0.81 0.80 0.86 0.89 Renewable energy8 .................................... 1.48 1.47 1.53 1.64 1.37 1.59 1.87 1.34 1.63 2.23 Electricity ................................................... 3.26 3.58 3.74 3.99 3.58 4.04 4.49 3.60 4.12 4.88 Delivered energy .................................. 24.48 26.48 27.42 28.35 26.80 29.10 31.27 27.17 29.82 33.50 Electricity related losses ............................ 6.72 7.17 7.51 7.95 7.11 7.88 8.59 6.96 7.85 9.26 Total ...................................................... 31.20 33.65 34.93 36.30 33.91 36.98 39.86 34.13 37.68 42.76
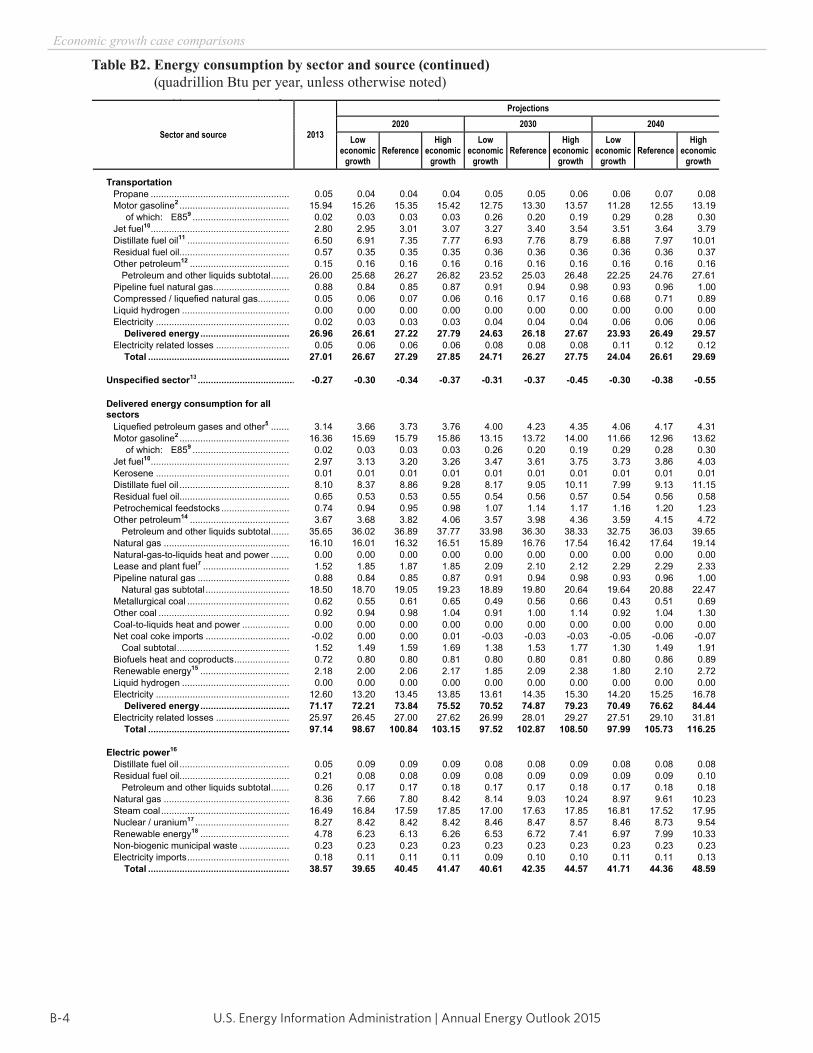
U.S. Energy Information Administration | Annual Energy Outlook 2015B-4
Economic growth case comparisons
Table B2. Energy consumption by sector and source (continued) (quadrillion Btu per year, unless otherwise noted)
Energy Information Administration / Annual Energy Outlook 2015
Table B2. Energy consumption by sector and source (continued)(quadrillion Btu per year, unless otherwise noted)
Sector and source 2013
Projections2020 2030 2040
Loweconomic
growth Reference
High economic
growth
Loweconomic
growth Reference
High economic
growth
Loweconomic
growth Reference
High economic
growth
Transportation Propane ..................................................... 0.05 0.04 0.04 0.04 0.05 0.05 0.06 0.06 0.07 0.08 Motor gasoline2 .......................................... 15.94 15.26 15.35 15.42 12.75 13.30 13.57 11.28 12.55 13.19 of which: E859 ..................................... 0.02 0.03 0.03 0.03 0.26 0.20 0.19 0.29 0.28 0.30 Jet fuel10..................................................... 2.80 2.95 3.01 3.07 3.27 3.40 3.54 3.51 3.64 3.79 Distillate fuel oil11 ....................................... 6.50 6.91 7.35 7.77 6.93 7.76 8.79 6.88 7.97 10.01 Residual fuel oil .......................................... 0.57 0.35 0.35 0.35 0.36 0.36 0.36 0.36 0.36 0.37 Other petroleum12 ...................................... 0.15 0.16 0.16 0.16 0.16 0.16 0.16 0.16 0.16 0.16 Petroleum and other liquids subtotal ....... 26.00 25.68 26.27 26.82 23.52 25.03 26.48 22.25 24.76 27.61 Pipeline fuel natural gas ............................. 0.88 0.84 0.85 0.87 0.91 0.94 0.98 0.93 0.96 1.00 Compressed / liquefied natural gas ............ 0.05 0.06 0.07 0.06 0.16 0.17 0.16 0.68 0.71 0.89 Liquid hydrogen ......................................... 0.00 0.00 0.00 0.00 0.00 0.00 0.00 0.00 0.00 0.00 Electricity ................................................... 0.02 0.03 0.03 0.03 0.04 0.04 0.04 0.06 0.06 0.06 Delivered energy .................................. 26.96 26.61 27.22 27.79 24.63 26.18 27.67 23.93 26.49 29.57 Electricity related losses ............................ 0.05 0.06 0.06 0.06 0.08 0.08 0.08 0.11 0.12 0.12 Total ...................................................... 27.01 26.67 27.29 27.85 24.71 26.27 27.75 24.04 26.61 29.69
Unspecified sector13 ..................................... -0.27 -0.30 -0.34 -0.37 -0.31 -0.37 -0.45 -0.30 -0.38 -0.55
Delivered energy consumption for all sectors Liquefied petroleum gases and other5 ....... 3.14 3.66 3.73 3.76 4.00 4.23 4.35 4.06 4.17 4.31 Motor gasoline2 .......................................... 16.36 15.69 15.79 15.86 13.15 13.72 14.00 11.66 12.96 13.62 of which: E859 ..................................... 0.02 0.03 0.03 0.03 0.26 0.20 0.19 0.29 0.28 0.30 Jet fuel10..................................................... 2.97 3.13 3.20 3.26 3.47 3.61 3.75 3.73 3.86 4.03 Kerosene ................................................... 0.01 0.01 0.01 0.01 0.01 0.01 0.01 0.01 0.01 0.01 Distillate fuel oil .......................................... 8.10 8.37 8.86 9.28 8.17 9.05 10.11 7.99 9.13 11.15 Residual fuel oil .......................................... 0.65 0.53 0.53 0.55 0.54 0.56 0.57 0.54 0.56 0.58 Petrochemical feedstocks .......................... 0.74 0.94 0.95 0.98 1.07 1.14 1.17 1.16 1.20 1.23 Other petroleum14 ...................................... 3.67 3.68 3.82 4.06 3.57 3.98 4.36 3.59 4.15 4.72 Petroleum and other liquids subtotal ....... 35.65 36.02 36.89 37.77 33.98 36.30 38.33 32.75 36.03 39.65 Natural gas ................................................ 16.10 16.01 16.32 16.51 15.89 16.76 17.54 16.42 17.64 19.14 Natural-gas-to-liquids heat and power ....... 0.00 0.00 0.00 0.00 0.00 0.00 0.00 0.00 0.00 0.00 Lease and plant fuel7 ................................. 1.52 1.85 1.87 1.85 2.09 2.10 2.12 2.29 2.29 2.33 Pipeline natural gas ................................... 0.88 0.84 0.85 0.87 0.91 0.94 0.98 0.93 0.96 1.00 Natural gas subtotal ................................ 18.50 18.70 19.05 19.23 18.89 19.80 20.64 19.64 20.88 22.47 Metallurgical coal ....................................... 0.62 0.55 0.61 0.65 0.49 0.56 0.66 0.43 0.51 0.69 Other coal .................................................. 0.92 0.94 0.98 1.04 0.91 1.00 1.14 0.92 1.04 1.30 Coal-to-liquids heat and power .................. 0.00 0.00 0.00 0.00 0.00 0.00 0.00 0.00 0.00 0.00 Net coal coke imports ................................ -0.02 0.00 0.00 0.01 -0.03 -0.03 -0.03 -0.05 -0.06 -0.07 Coal subtotal ........................................... 1.52 1.49 1.59 1.69 1.38 1.53 1.77 1.30 1.49 1.91 Biofuels heat and coproducts ..................... 0.72 0.80 0.80 0.81 0.80 0.80 0.81 0.80 0.86 0.89 Renewable energy15 .................................. 2.18 2.00 2.06 2.17 1.85 2.09 2.38 1.80 2.10 2.72 Liquid hydrogen ......................................... 0.00 0.00 0.00 0.00 0.00 0.00 0.00 0.00 0.00 0.00 Electricity ................................................... 12.60 13.20 13.45 13.85 13.61 14.35 15.30 14.20 15.25 16.78 Delivered energy .................................. 71.17 72.21 73.84 75.52 70.52 74.87 79.23 70.49 76.62 84.44 Electricity related losses ............................ 25.97 26.45 27.00 27.62 26.99 28.01 29.27 27.51 29.10 31.81 Total ...................................................... 97.14 98.67 100.84 103.15 97.52 102.87 108.50 97.99 105.73 116.25
Electric power16
Distillate fuel oil .......................................... 0.05 0.09 0.09 0.09 0.08 0.08 0.09 0.08 0.08 0.08 Residual fuel oil .......................................... 0.21 0.08 0.08 0.09 0.08 0.09 0.09 0.09 0.09 0.10 Petroleum and other liquids subtotal ....... 0.26 0.17 0.17 0.18 0.17 0.17 0.18 0.17 0.18 0.18 Natural gas ................................................ 8.36 7.66 7.80 8.42 8.14 9.03 10.24 8.97 9.61 10.23 Steam coal ................................................. 16.49 16.84 17.59 17.85 17.00 17.63 17.85 16.81 17.52 17.95 Nuclear / uranium17 .................................... 8.27 8.42 8.42 8.42 8.46 8.47 8.57 8.46 8.73 9.54 Renewable energy18 .................................. 4.78 6.23 6.13 6.26 6.53 6.72 7.41 6.97 7.99 10.33 Non-biogenic municipal waste ................... 0.23 0.23 0.23 0.23 0.23 0.23 0.23 0.23 0.23 0.23 Electricity imports ....................................... 0.18 0.11 0.11 0.11 0.09 0.10 0.10 0.11 0.11 0.13 Total ...................................................... 38.57 39.65 40.45 41.47 40.61 42.35 44.57 41.71 44.36 48.59
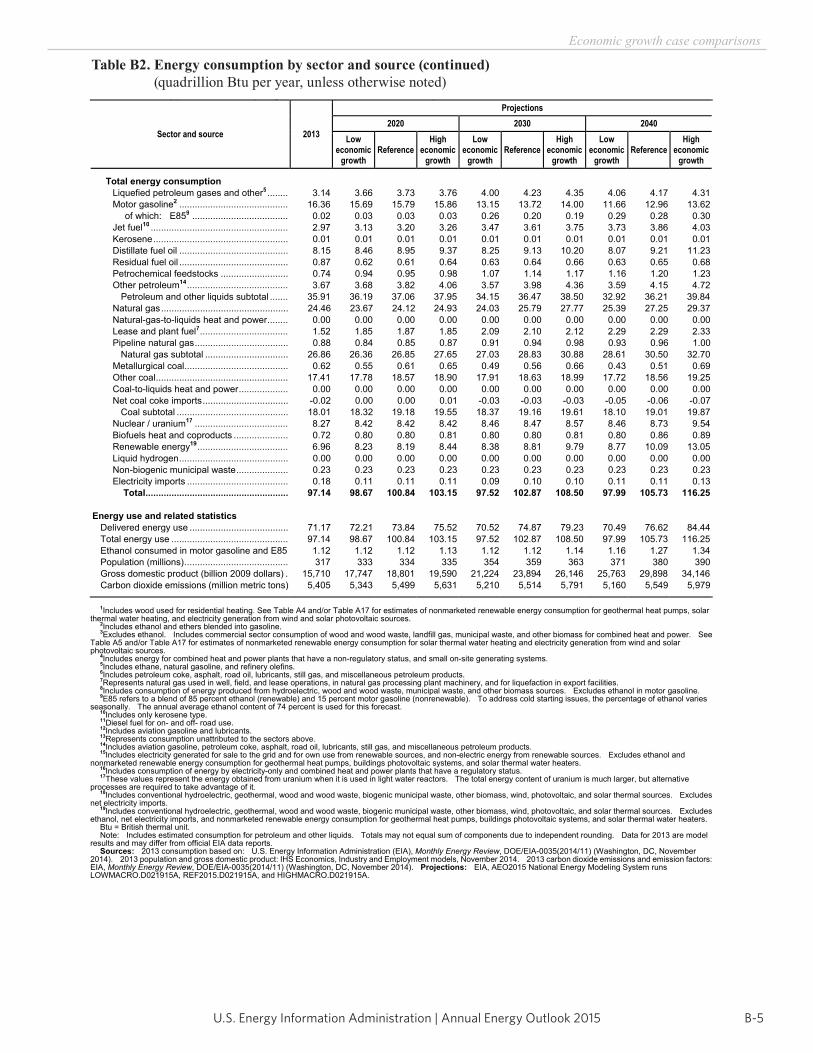
B-5U.S. Energy Information Administration | Annual Energy Outlook 2015
Economic growth case comparisons
Table B2. Energy consumption by sector and source (continued) (quadrillion Btu per year, unless otherwise noted)
Energy Information Administration / Annual Energy Outlook 2015
Table B2. Energy consumption by sector and source (continued)(quadrillion Btu per year, unless otherwise noted)
Sector and source 2013
Projections2020 2030 2040
Loweconomic
growth Reference
High economic
growth
Loweconomic
growth Reference
High economic
growth
Loweconomic
growth Reference
High economic
growth
Total energy consumption Liquefied petroleum gases and other5 ........ 3.14 3.66 3.73 3.76 4.00 4.23 4.35 4.06 4.17 4.31 Motor gasoline2 .......................................... 16.36 15.69 15.79 15.86 13.15 13.72 14.00 11.66 12.96 13.62 of which: E859 ..................................... 0.02 0.03 0.03 0.03 0.26 0.20 0.19 0.29 0.28 0.30 Jet fuel10 ..................................................... 2.97 3.13 3.20 3.26 3.47 3.61 3.75 3.73 3.86 4.03 Kerosene .................................................... 0.01 0.01 0.01 0.01 0.01 0.01 0.01 0.01 0.01 0.01 Distillate fuel oil .......................................... 8.15 8.46 8.95 9.37 8.25 9.13 10.20 8.07 9.21 11.23 Residual fuel oil .......................................... 0.87 0.62 0.61 0.64 0.63 0.64 0.66 0.63 0.65 0.68 Petrochemical feedstocks .......................... 0.74 0.94 0.95 0.98 1.07 1.14 1.17 1.16 1.20 1.23 Other petroleum14 ....................................... 3.67 3.68 3.82 4.06 3.57 3.98 4.36 3.59 4.15 4.72 Petroleum and other liquids subtotal ....... 35.91 36.19 37.06 37.95 34.15 36.47 38.50 32.92 36.21 39.84 Natural gas ................................................. 24.46 23.67 24.12 24.93 24.03 25.79 27.77 25.39 27.25 29.37 Natural-gas-to-liquids heat and power ........ 0.00 0.00 0.00 0.00 0.00 0.00 0.00 0.00 0.00 0.00 Lease and plant fuel7 .................................. 1.52 1.85 1.87 1.85 2.09 2.10 2.12 2.29 2.29 2.33 Pipeline natural gas .................................... 0.88 0.84 0.85 0.87 0.91 0.94 0.98 0.93 0.96 1.00 Natural gas subtotal ................................ 26.86 26.36 26.85 27.65 27.03 28.83 30.88 28.61 30.50 32.70 Metallurgical coal ........................................ 0.62 0.55 0.61 0.65 0.49 0.56 0.66 0.43 0.51 0.69 Other coal ................................................... 17.41 17.78 18.57 18.90 17.91 18.63 18.99 17.72 18.56 19.25 Coal-to-liquids heat and power ................... 0.00 0.00 0.00 0.00 0.00 0.00 0.00 0.00 0.00 0.00 Net coal coke imports ................................. -0.02 0.00 0.00 0.01 -0.03 -0.03 -0.03 -0.05 -0.06 -0.07 Coal subtotal ........................................... 18.01 18.32 19.18 19.55 18.37 19.16 19.61 18.10 19.01 19.87 Nuclear / uranium17 .................................... 8.27 8.42 8.42 8.42 8.46 8.47 8.57 8.46 8.73 9.54 Biofuels heat and coproducts ..................... 0.72 0.80 0.80 0.81 0.80 0.80 0.81 0.80 0.86 0.89 Renewable energy19 ................................... 6.96 8.23 8.19 8.44 8.38 8.81 9.79 8.77 10.09 13.05 Liquid hydrogen .......................................... 0.00 0.00 0.00 0.00 0.00 0.00 0.00 0.00 0.00 0.00 Non-biogenic municipal waste .................... 0.23 0.23 0.23 0.23 0.23 0.23 0.23 0.23 0.23 0.23 Electricity imports ....................................... 0.18 0.11 0.11 0.11 0.09 0.10 0.10 0.11 0.11 0.13 Total ....................................................... 97.14 98.67 100.84 103.15 97.52 102.87 108.50 97.99 105.73 116.25
Energy use and related statistics Delivered energy use ...................................... 71.17 72.21 73.84 75.52 70.52 74.87 79.23 70.49 76.62 84.44
Total energy use ............................................. 97.14 98.67 100.84 103.15 97.52 102.87 108.50 97.99 105.73 116.25 Ethanol consumed in motor gasoline and E85 1.12 1.12 1.12 1.13 1.12 1.12 1.14 1.16 1.27 1.34
Population (millions) ........................................ 317 333 334 335 354 359 363 371 380 390 Gross domestic product (billion 2009 dollars) . 15,710 17,747 18,801 19,590 21,224 23,894 26,146 25,763 29,898 34,146 Carbon dioxide emissions (million metric tons) 5,405 5,343 5,499 5,631 5,210 5,514 5,791 5,160 5,549 5,979
1Includes wood used for residential heating. See Table A4 and/or Table A17 for estimates of nonmarketed renewable energy consumption for geothermal heat pumps, solar thermal water heating, and electricity generation from wind and solar photovoltaic sources.
2Includes ethanol and ethers blended into gasoline. 3Excludes ethanol. Includes commercial sector consumption of wood and wood waste, landfill gas, municipal waste, and other biomass for combined heat and power. See
Table A5 and/or Table A17 for estimates of nonmarketed renewable energy consumption for solar thermal water heating and electricity generation from wind and solar photovoltaic sources.
4Includes energy for combined heat and power plants that have a non-regulatory status, and small on-site generating systems. 5Includes ethane, natural gasoline, and refinery olefins. 6Includes petroleum coke, asphalt, road oil, lubricants, still gas, and miscellaneous petroleum products. 7Represents natural gas used in well, field, and lease operations, in natural gas processing plant machinery, and for liquefaction in export facilities. 8Includes consumption of energy produced from hydroelectric, wood and wood waste, municipal waste, and other biomass sources. Excludes ethanol in motor gasoline. 9E85 refers to a blend of 85 percent ethanol (renewable) and 15 percent motor gasoline (nonrenewable). To address cold starting issues, the percentage of ethanol varies
seasonally. The annual average ethanol content of 74 percent is used for this forecast. 10Includes only kerosene type. 11Diesel fuel for on- and off- road use. 12Includes aviation gasoline and lubricants. 13Represents consumption unattributed to the sectors above. 14Includes aviation gasoline, petroleum coke, asphalt, road oil, lubricants, still gas, and miscellaneous petroleum products. 15Includes electricity generated for sale to the grid and for own use from renewable sources, and non-electric energy from renewable sources. Excludes ethanol and
nonmarketed renewable energy consumption for geothermal heat pumps, buildings photovoltaic systems, and solar thermal water heaters. 16Includes consumption of energy by electricity-only and combined heat and power plants that have a regulatory status. 17These values represent the energy obtained from uranium when it is used in light water reactors. The total energy content of uranium is much larger, but alternative
processes are required to take advantage of it. 18Includes conventional hydroelectric, geothermal, wood and wood waste, biogenic municipal waste, other biomass, wind, photovoltaic, and solar thermal sources. Excludes
net electricity imports. 19Includes conventional hydroelectric, geothermal, wood and wood waste, biogenic municipal waste, other biomass, wind, photovoltaic, and solar thermal sources. Excludes
ethanol, net electricity imports, and nonmarketed renewable energy consumption for geothermal heat pumps, buildings photovoltaic systems, and solar thermal water heaters. Btu = British thermal unit. Note: Includes estimated consumption for petroleum and other liquids. Totals may not equal sum of components due to independent rounding. Data for 2013 are model
results and may differ from official EIA data reports. Sources: 2013 consumption based on: U.S. Energy Information Administration (EIA), Monthly Energy Review, DOE/EIA-0035(2014/11) (Washington, DC, November
2014). 2013 population and gross domestic product: IHS Economics, Industry and Employment models, November 2014. 2013 carbon dioxide emissions and emission factors: EIA, Monthly Energy Review, DOE/EIA-0035(2014/11) (Washington, DC, November 2014). Projections: EIA, AEO2015 National Energy Modeling System runs LOWMACRO.D021915A, REF2015.D021915A, and HIGHMACRO.D021915A.
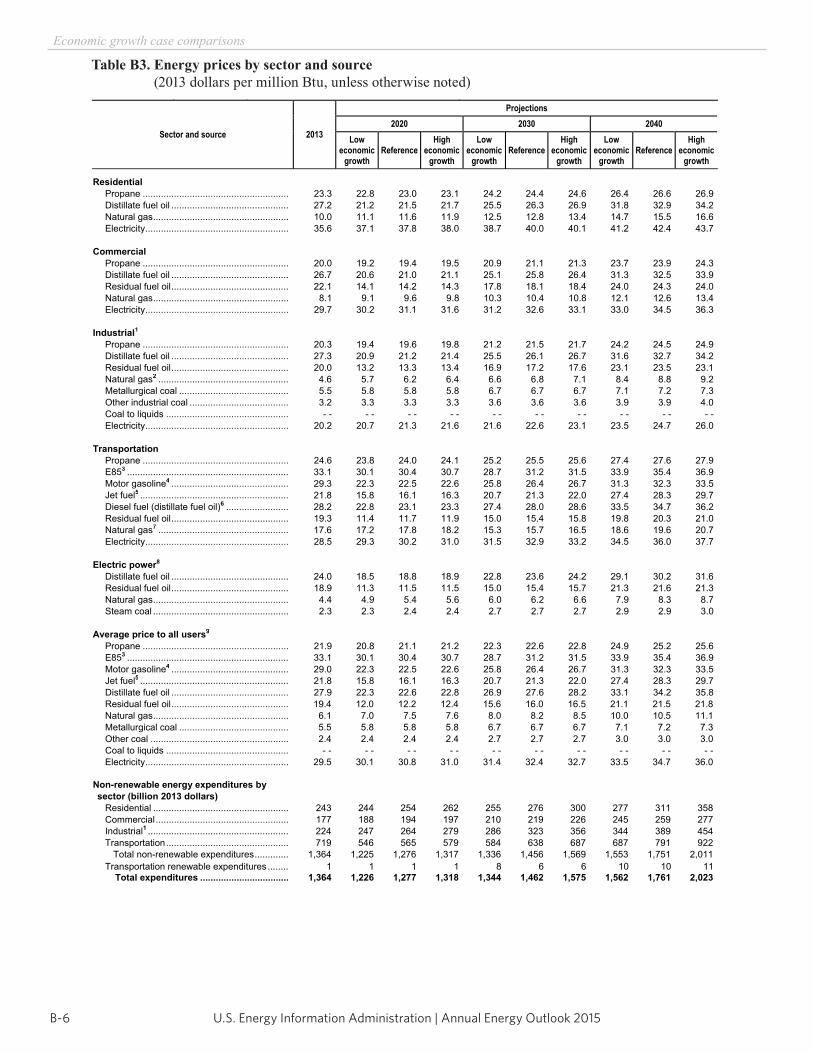
U.S. Energy Information Administration | Annual Energy Outlook 2015B-6
Economic growth case comparisons
Energy Information Administration / Annual Energy Outlook 2015
Table B3. Energy prices by sector and source(2013 dollars per million Btu, unless otherwise noted)
Sector and source 2013
Projections2020 2030 2040
Loweconomic
growth Reference
High economic
growth
Loweconomic
growth Reference
High economic
growth
Loweconomic
growth Reference
High economic
growth
Residential Propane ........................................................ 23.3 22.8 23.0 23.1 24.2 24.4 24.6 26.4 26.6 26.9 Distillate fuel oil ............................................. 27.2 21.2 21.5 21.7 25.5 26.3 26.9 31.8 32.9 34.2 Natural gas .................................................... 10.0 11.1 11.6 11.9 12.5 12.8 13.4 14.7 15.5 16.6 Electricity ....................................................... 35.6 37.1 37.8 38.0 38.7 40.0 40.1 41.2 42.4 43.7
Commercial Propane ........................................................ 20.0 19.2 19.4 19.5 20.9 21.1 21.3 23.7 23.9 24.3 Distillate fuel oil ............................................. 26.7 20.6 21.0 21.1 25.1 25.8 26.4 31.3 32.5 33.9 Residual fuel oil ............................................. 22.1 14.1 14.2 14.3 17.8 18.1 18.4 24.0 24.3 24.0 Natural gas .................................................... 8.1 9.1 9.6 9.8 10.3 10.4 10.8 12.1 12.6 13.4 Electricity ....................................................... 29.7 30.2 31.1 31.6 31.2 32.6 33.1 33.0 34.5 36.3
Industrial1 Propane ........................................................ 20.3 19.4 19.6 19.8 21.2 21.5 21.7 24.2 24.5 24.9 Distillate fuel oil ............................................. 27.3 20.9 21.2 21.4 25.5 26.1 26.7 31.6 32.7 34.2 Residual fuel oil ............................................. 20.0 13.2 13.3 13.4 16.9 17.2 17.6 23.1 23.5 23.1 Natural gas2 .................................................. 4.6 5.7 6.2 6.4 6.6 6.8 7.1 8.4 8.8 9.2 Metallurgical coal .......................................... 5.5 5.8 5.8 5.8 6.7 6.7 6.7 7.1 7.2 7.3 Other industrial coal ...................................... 3.2 3.3 3.3 3.3 3.6 3.6 3.6 3.9 3.9 4.0
Coal to liquids ............................................... - - - - - - - - - - - - - - - - - - - - Electricity ....................................................... 20.2 20.7 21.3 21.6 21.6 22.6 23.1 23.5 24.7 26.0
Transportation Propane ........................................................ 24.6 23.8 24.0 24.1 25.2 25.5 25.6 27.4 27.6 27.9 E853 .............................................................. 33.1 30.1 30.4 30.7 28.7 31.2 31.5 33.9 35.4 36.9 Motor gasoline4 ............................................. 29.3 22.3 22.5 22.6 25.8 26.4 26.7 31.3 32.3 33.5 Jet fuel5 ......................................................... 21.8 15.8 16.1 16.3 20.7 21.3 22.0 27.4 28.3 29.7 Diesel fuel (distillate fuel oil)6 ........................ 28.2 22.8 23.1 23.3 27.4 28.0 28.6 33.5 34.7 36.2 Residual fuel oil ............................................. 19.3 11.4 11.7 11.9 15.0 15.4 15.8 19.8 20.3 21.0 Natural gas7 .................................................. 17.6 17.2 17.8 18.2 15.3 15.7 16.5 18.6 19.6 20.7 Electricity ....................................................... 28.5 29.3 30.2 31.0 31.5 32.9 33.2 34.5 36.0 37.7
Electric power8
Distillate fuel oil ............................................. 24.0 18.5 18.8 18.9 22.8 23.6 24.2 29.1 30.2 31.6 Residual fuel oil ............................................. 18.9 11.3 11.5 11.5 15.0 15.4 15.7 21.3 21.6 21.3 Natural gas .................................................... 4.4 4.9 5.4 5.6 6.0 6.2 6.6 7.9 8.3 8.7 Steam coal .................................................... 2.3 2.3 2.4 2.4 2.7 2.7 2.7 2.9 2.9 3.0
Average price to all users9
Propane ........................................................ 21.9 20.8 21.1 21.2 22.3 22.6 22.8 24.9 25.2 25.6 E853 .............................................................. 33.1 30.1 30.4 30.7 28.7 31.2 31.5 33.9 35.4 36.9 Motor gasoline4 ............................................. 29.0 22.3 22.5 22.6 25.8 26.4 26.7 31.3 32.3 33.5 Jet fuel5 ......................................................... 21.8 15.8 16.1 16.3 20.7 21.3 22.0 27.4 28.3 29.7 Distillate fuel oil ............................................. 27.9 22.3 22.6 22.8 26.9 27.6 28.2 33.1 34.2 35.8 Residual fuel oil ............................................. 19.4 12.0 12.2 12.4 15.6 16.0 16.5 21.1 21.5 21.8 Natural gas .................................................... 6.1 7.0 7.5 7.6 8.0 8.2 8.5 10.0 10.5 11.1 Metallurgical coal .......................................... 5.5 5.8 5.8 5.8 6.7 6.7 6.7 7.1 7.2 7.3 Other coal ..................................................... 2.4 2.4 2.4 2.4 2.7 2.7 2.7 3.0 3.0 3.0
Coal to liquids ............................................... - - - - - - - - - - - - - - - - - - - - Electricity ....................................................... 29.5 30.1 30.8 31.0 31.4 32.4 32.7 33.5 34.7 36.0
Non-renewable energy expenditures by sector (billion 2013 dollars) Residential .................................................... 243 244 254 262 255 276 300 277 311 358 Commercial ................................................... 177 188 194 197 210 219 226 245 259 277 Industrial1 ...................................................... 224 247 264 279 286 323 356 344 389 454 Transportation ............................................... 719 546 565 579 584 638 687 687 791 922 Total non-renewable expenditures ............. 1,364 1,225 1,276 1,317 1,336 1,456 1,569 1,553 1,751 2,011 Transportation renewable expenditures ........ 1 1 1 1 8 6 6 10 10 11 Total expenditures .................................. 1,364 1,226 1,277 1,318 1,344 1,462 1,575 1,562 1,761 2,023
Table B3. Energy prices by sector and source (2013 dollars per million Btu, unless otherwise noted)
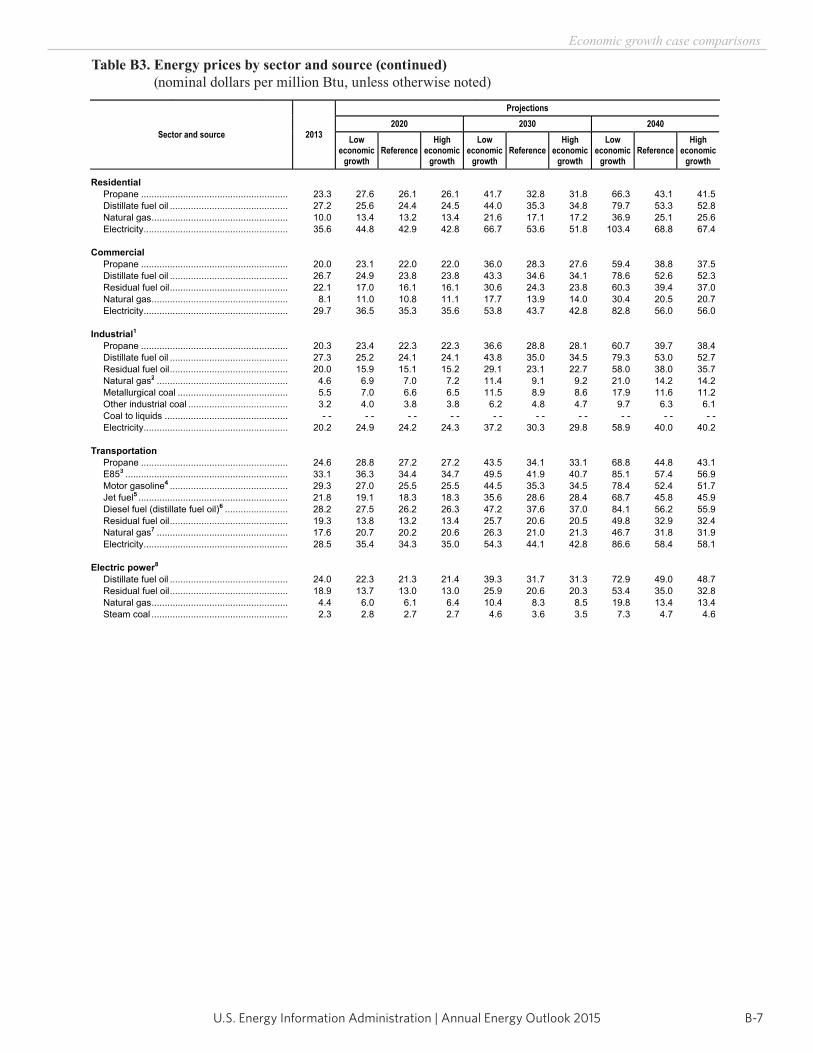
B-7U.S. Energy Information Administration | Annual Energy Outlook 2015
Economic growth case comparisons
Table B3. Energy prices by sector and source (continued) (nominal dollars per million Btu, unless otherwise noted)
Energy Information Administration / Annual Energy Outlook 2015
Table B3. Energy prices by sector and source (continued)(nominal dollars per million Btu, unless otherwise noted)
Sector and source 2013
Projections2020 2030 2040
Loweconomic
growth Reference
High economic
growth
Loweconomic
growth Reference
High economic
growth
Loweconomic
growth Reference
High economic
growth
Residential Propane ........................................................ 23.3 27.6 26.1 26.1 41.7 32.8 31.8 66.3 43.1 41.5 Distillate fuel oil ............................................. 27.2 25.6 24.4 24.5 44.0 35.3 34.8 79.7 53.3 52.8 Natural gas .................................................... 10.0 13.4 13.2 13.4 21.6 17.1 17.2 36.9 25.1 25.6 Electricity ....................................................... 35.6 44.8 42.9 42.8 66.7 53.6 51.8 103.4 68.8 67.4
Commercial Propane ........................................................ 20.0 23.1 22.0 22.0 36.0 28.3 27.6 59.4 38.8 37.5 Distillate fuel oil ............................................. 26.7 24.9 23.8 23.8 43.3 34.6 34.1 78.6 52.6 52.3 Residual fuel oil ............................................. 22.1 17.0 16.1 16.1 30.6 24.3 23.8 60.3 39.4 37.0 Natural gas .................................................... 8.1 11.0 10.8 11.1 17.7 13.9 14.0 30.4 20.5 20.7 Electricity ....................................................... 29.7 36.5 35.3 35.6 53.8 43.7 42.8 82.8 56.0 56.0
Industrial1 Propane ........................................................ 20.3 23.4 22.3 22.3 36.6 28.8 28.1 60.7 39.7 38.4 Distillate fuel oil ............................................. 27.3 25.2 24.1 24.1 43.8 35.0 34.5 79.3 53.0 52.7 Residual fuel oil ............................................. 20.0 15.9 15.1 15.2 29.1 23.1 22.7 58.0 38.0 35.7 Natural gas2 .................................................. 4.6 6.9 7.0 7.2 11.4 9.1 9.2 21.0 14.2 14.2 Metallurgical coal .......................................... 5.5 7.0 6.6 6.5 11.5 8.9 8.6 17.9 11.6 11.2 Other industrial coal ...................................... 3.2 4.0 3.8 3.8 6.2 4.8 4.7 9.7 6.3 6.1
Coal to liquids ............................................... - - - - - - - - - - - - - - - - - - - - Electricity ....................................................... 20.2 24.9 24.2 24.3 37.2 30.3 29.8 58.9 40.0 40.2
Transportation Propane ........................................................ 24.6 28.8 27.2 27.2 43.5 34.1 33.1 68.8 44.8 43.1 E853 .............................................................. 33.1 36.3 34.4 34.7 49.5 41.9 40.7 85.1 57.4 56.9 Motor gasoline4 ............................................. 29.3 27.0 25.5 25.5 44.5 35.3 34.5 78.4 52.4 51.7 Jet fuel5 ......................................................... 21.8 19.1 18.3 18.3 35.6 28.6 28.4 68.7 45.8 45.9 Diesel fuel (distillate fuel oil)6 ........................ 28.2 27.5 26.2 26.3 47.2 37.6 37.0 84.1 56.2 55.9 Residual fuel oil ............................................. 19.3 13.8 13.2 13.4 25.7 20.6 20.5 49.8 32.9 32.4 Natural gas7 .................................................. 17.6 20.7 20.2 20.6 26.3 21.0 21.3 46.7 31.8 31.9 Electricity ....................................................... 28.5 35.4 34.3 35.0 54.3 44.1 42.8 86.6 58.4 58.1
Electric power8
Distillate fuel oil ............................................. 24.0 22.3 21.3 21.4 39.3 31.7 31.3 72.9 49.0 48.7 Residual fuel oil ............................................. 18.9 13.7 13.0 13.0 25.9 20.6 20.3 53.4 35.0 32.8 Natural gas .................................................... 4.4 6.0 6.1 6.4 10.4 8.3 8.5 19.8 13.4 13.4 Steam coal .................................................... 2.3 2.8 2.7 2.7 4.6 3.6 3.5 7.3 4.7 4.6
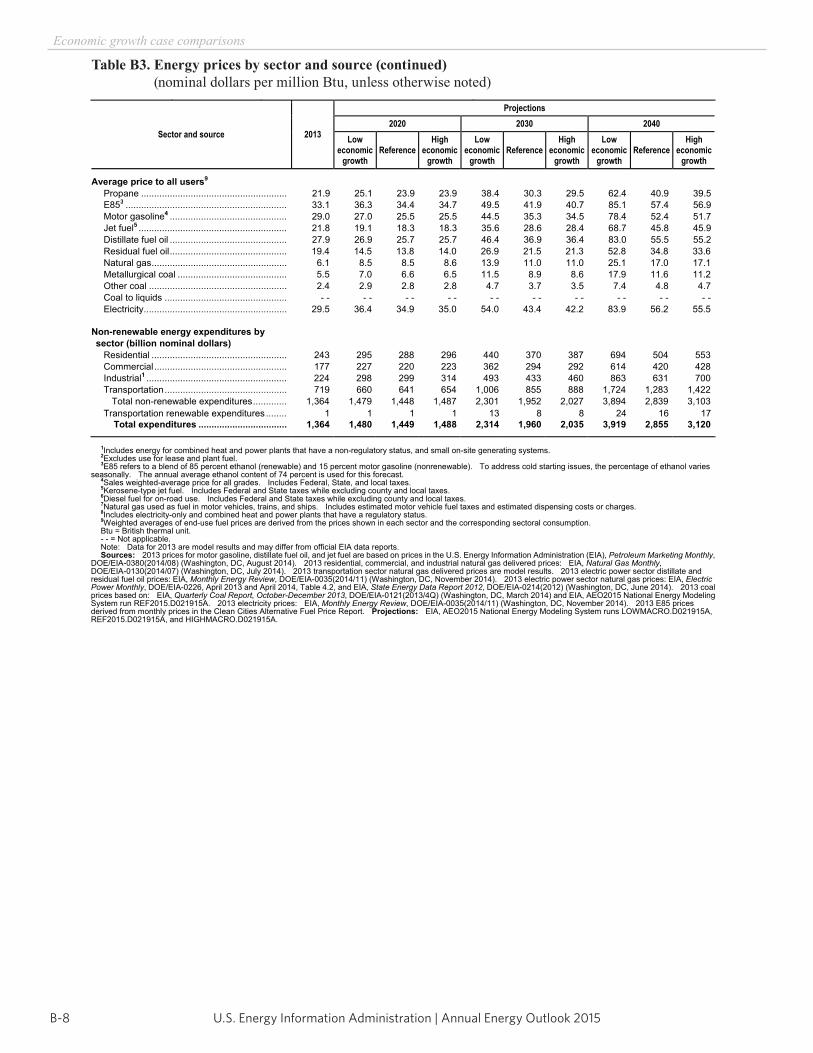
U.S. Energy Information Administration | Annual Energy Outlook 2015B-8
Economic growth case comparisons
Table B3. Energy prices by sector and source (continued) (nominal dollars per million Btu, unless otherwise noted)
Energy Information Administration / Annual Energy Outlook 2015
Table B3. Energy prices by sector and source (continued)(nominal dollars per million Btu, unless otherwise noted)
Sector and source 2013
Projections2020 2030 2040
Loweconomic
growth Reference
High economic
growth
Loweconomic
growth Reference
High economic
growth
Loweconomic
growth Reference
High economic
growth
Average price to all users9
Propane ........................................................ 21.9 25.1 23.9 23.9 38.4 30.3 29.5 62.4 40.9 39.5 E853 .............................................................. 33.1 36.3 34.4 34.7 49.5 41.9 40.7 85.1 57.4 56.9 Motor gasoline4 ............................................. 29.0 27.0 25.5 25.5 44.5 35.3 34.5 78.4 52.4 51.7 Jet fuel5 ......................................................... 21.8 19.1 18.3 18.3 35.6 28.6 28.4 68.7 45.8 45.9 Distillate fuel oil ............................................. 27.9 26.9 25.7 25.7 46.4 36.9 36.4 83.0 55.5 55.2 Residual fuel oil ............................................. 19.4 14.5 13.8 14.0 26.9 21.5 21.3 52.8 34.8 33.6 Natural gas .................................................... 6.1 8.5 8.5 8.6 13.9 11.0 11.0 25.1 17.0 17.1 Metallurgical coal .......................................... 5.5 7.0 6.6 6.5 11.5 8.9 8.6 17.9 11.6 11.2 Other coal ..................................................... 2.4 2.9 2.8 2.8 4.7 3.7 3.5 7.4 4.8 4.7
Coal to liquids ............................................... - - - - - - - - - - - - - - - - - - - - Electricity ....................................................... 29.5 36.4 34.9 35.0 54.0 43.4 42.2 83.9 56.2 55.5
Non-renewable energy expenditures by sector (billion nominal dollars) Residential .................................................... 243 295 288 296 440 370 387 694 504 553 Commercial ................................................... 177 227 220 223 362 294 292 614 420 428 Industrial1 ...................................................... 224 298 299 314 493 433 460 863 631 700 Transportation ............................................... 719 660 641 654 1,006 855 888 1,724 1,283 1,422 Total non-renewable expenditures ............. 1,364 1,479 1,448 1,487 2,301 1,952 2,027 3,894 2,839 3,103 Transportation renewable expenditures ........ 1 1 1 1 13 8 8 24 16 17 Total expenditures .................................. 1,364 1,480 1,449 1,488 2,314 1,960 2,035 3,919 2,855 3,120
1Includes energy for combined heat and power plants that have a non-regulatory status, and small on-site generating systems. 2Excludes use for lease and plant fuel. 3E85 refers to a blend of 85 percent ethanol (renewable) and 15 percent motor gasoline (nonrenewable). To address cold starting issues, the percentage of ethanol varies
seasonally. The annual average ethanol content of 74 percent is used for this forecast. 4Sales weighted-average price for all grades. Includes Federal, State, and local taxes. 5Kerosene-type jet fuel. Includes Federal and State taxes while excluding county and local taxes. 6Diesel fuel for on-road use. Includes Federal and State taxes while excluding county and local taxes. 7Natural gas used as fuel in motor vehicles, trains, and ships. Includes estimated motor vehicle fuel taxes and estimated dispensing costs or charges. 8Includes electricity-only and combined heat and power plants that have a regulatory status. 9Weighted averages of end-use fuel prices are derived from the prices shown in each sector and the corresponding sectoral consumption. Btu = British thermal unit. - - = Not applicable. Note: Data for 2013 are model results and may differ from official EIA data reports. Sources: 2013 prices for motor gasoline, distillate fuel oil, and jet fuel are based on prices in the U.S. Energy Information Administration (EIA), Petroleum Marketing Monthly,
DOE/EIA-0380(2014/08) (Washington, DC, August 2014). 2013 residential, commercial, and industrial natural gas delivered prices: EIA, Natural Gas Monthly,DOE/EIA-0130(2014/07) (Washington, DC, July 2014). 2013 transportation sector natural gas delivered prices are model results. 2013 electric power sector distillate and residual fuel oil prices: EIA, Monthly Energy Review, DOE/EIA-0035(2014/11) (Washington, DC, November 2014). 2013 electric power sector natural gas prices: EIA, Electric Power Monthly, DOE/EIA-0226, April 2013 and April 2014, Table 4.2, and EIA, State Energy Data Report 2012, DOE/EIA-0214(2012) (Washington, DC, June 2014). 2013 coal prices based on: EIA, Quarterly Coal Report, October-December 2013, DOE/EIA-0121(2013/4Q) (Washington, DC, March 2014) and EIA, AEO2015 National Energy Modeling System run REF2015.D021915A. 2013 electricity prices: EIA, Monthly Energy Review, DOE/EIA-0035(2014/11) (Washington, DC, November 2014). 2013 E85 prices derived from monthly prices in the Clean Cities Alternative Fuel Price Report. Projections: EIA, AEO2015 National Energy Modeling System runs LOWMACRO.D021915A, REF2015.D021915A, and HIGHMACRO.D021915A.
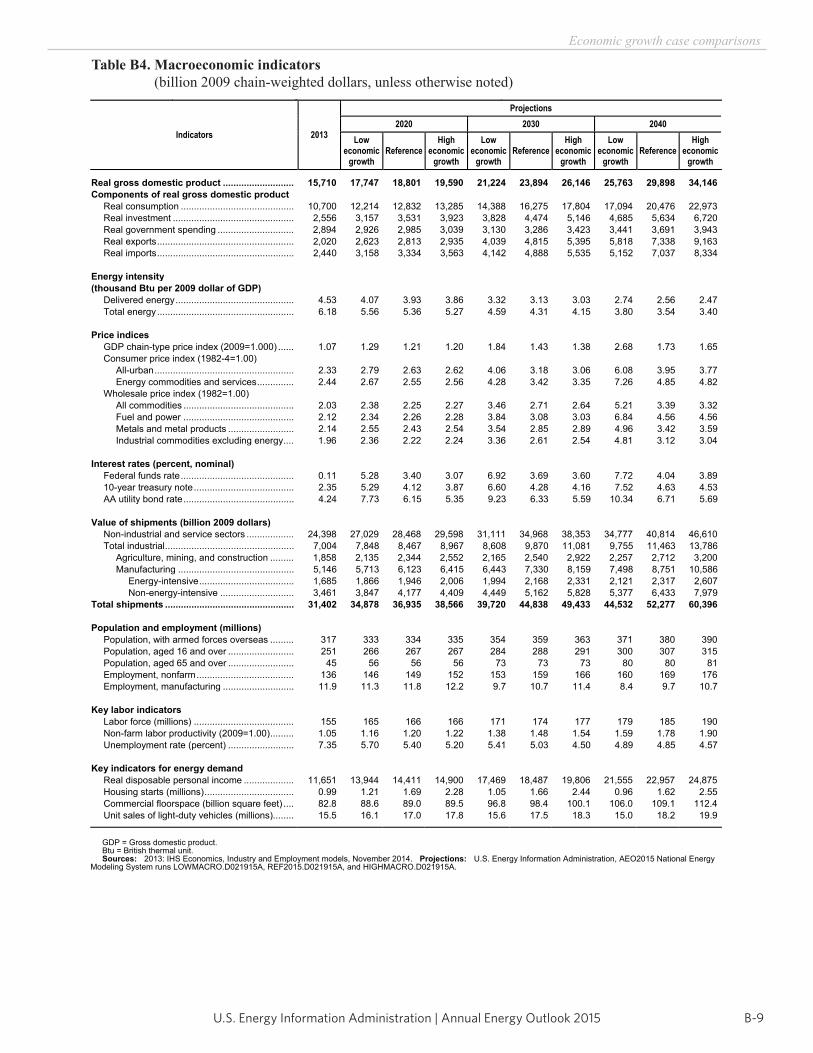
B-9U.S. Energy Information Administration | Annual Energy Outlook 2015
Economic growth case comparisons
Table B4. Macroeconomic indicators (billion 2009 chain-weighted dollars, unless otherwise noted)
Energy Information Administration / Annual Energy Outlook 2015
Table B4. Macroeconomic indicators(billion 2009 chain-weighted dollars, unless otherwise noted)
Indicators 2013
Projections2020 2030 2040
Loweconomic
growth Reference
High economic
growth
Loweconomic
growth Reference
High economic
growth
Loweconomic
growth Reference
High economic
growth
Real gross domestic product ........................... 15,710 17,747 18,801 19,590 21,224 23,894 26,146 25,763 29,898 34,146Components of real gross domestic product Real consumption ........................................... 10,700 12,214 12,832 13,285 14,388 16,275 17,804 17,094 20,476 22,973 Real investment .............................................. 2,556 3,157 3,531 3,923 3,828 4,474 5,146 4,685 5,634 6,720 Real government spending ............................. 2,894 2,926 2,985 3,039 3,130 3,286 3,423 3,441 3,691 3,943 Real exports .................................................... 2,020 2,623 2,813 2,935 4,039 4,815 5,395 5,818 7,338 9,163 Real imports .................................................... 2,440 3,158 3,334 3,563 4,142 4,888 5,535 5,152 7,037 8,334
Energy intensity(thousand Btu per 2009 dollar of GDP) Delivered energy ............................................. 4.53 4.07 3.93 3.86 3.32 3.13 3.03 2.74 2.56 2.47 Total energy .................................................... 6.18 5.56 5.36 5.27 4.59 4.31 4.15 3.80 3.54 3.40
Price indices GDP chain-type price index (2009=1.000) ...... 1.07 1.29 1.21 1.20 1.84 1.43 1.38 2.68 1.73 1.65
Consumer price index (1982-4=1.00) All-urban ..................................................... 2.33 2.79 2.63 2.62 4.06 3.18 3.06 6.08 3.95 3.77 Energy commodities and services .............. 2.44 2.67 2.55 2.56 4.28 3.42 3.35 7.26 4.85 4.82
Wholesale price index (1982=1.00) All commodities .......................................... 2.03 2.38 2.25 2.27 3.46 2.71 2.64 5.21 3.39 3.32 Fuel and power .......................................... 2.12 2.34 2.26 2.28 3.84 3.08 3.03 6.84 4.56 4.56 Metals and metal products ......................... 2.14 2.55 2.43 2.54 3.54 2.85 2.89 4.96 3.42 3.59 Industrial commodities excluding energy .... 1.96 2.36 2.22 2.24 3.36 2.61 2.54 4.81 3.12 3.04
Interest rates (percent, nominal) Federal funds rate ........................................... 0.11 5.28 3.40 3.07 6.92 3.69 3.60 7.72 4.04 3.89 10-year treasury note ...................................... 2.35 5.29 4.12 3.87 6.60 4.28 4.16 7.52 4.63 4.53 AA utility bond rate .......................................... 4.24 7.73 6.15 5.35 9.23 6.33 5.59 10.34 6.71 5.69
Value of shipments (billion 2009 dollars) Non-industrial and service sectors .................. 24,398 27,029 28,468 29,598 31,111 34,968 38,353 34,777 40,814 46,610 Total industrial ................................................. 7,004 7,848 8,467 8,967 8,608 9,870 11,081 9,755 11,463 13,786 Agriculture, mining, and construction ......... 1,858 2,135 2,344 2,552 2,165 2,540 2,922 2,257 2,712 3,200 Manufacturing ............................................ 5,146 5,713 6,123 6,415 6,443 7,330 8,159 7,498 8,751 10,586
Energy-intensive .................................... 1,685 1,866 1,946 2,006 1,994 2,168 2,331 2,121 2,317 2,607 Non-energy-intensive ............................ 3,461 3,847 4,177 4,409 4,449 5,162 5,828 5,377 6,433 7,979
Total shipments ................................................. 31,402 34,878 36,935 38,566 39,720 44,838 49,433 44,532 52,277 60,396
Population and employment (millions) Population, with armed forces overseas ......... 317 333 334 335 354 359 363 371 380 390 Population, aged 16 and over ......................... 251 266 267 267 284 288 291 300 307 315 Population, aged 65 and over ......................... 45 56 56 56 73 73 73 80 80 81
Employment, nonfarm ..................................... 136 146 149 152 153 159 166 160 169 176 Employment, manufacturing ........................... 11.9 11.3 11.8 12.2 9.7 10.7 11.4 8.4 9.7 10.7
Key labor indicators Labor force (millions) ...................................... 155 165 166 166 171 174 177 179 185 190
Non-farm labor productivity (2009=1.00) ......... 1.05 1.16 1.20 1.22 1.38 1.48 1.54 1.59 1.78 1.90 Unemployment rate (percent) ......................... 7.35 5.70 5.40 5.20 5.41 5.03 4.50 4.89 4.85 4.57
Key indicators for energy demand Real disposable personal income ................... 11,651 13,944 14,411 14,900 17,469 18,487 19,806 21,555 22,957 24,875
Housing starts (millions) .................................. 0.99 1.21 1.69 2.28 1.05 1.66 2.44 0.96 1.62 2.55 Commercial floorspace (billion square feet) .... 82.8 88.6 89.0 89.5 96.8 98.4 100.1 106.0 109.1 112.4 Unit sales of light-duty vehicles (millions)........ 15.5 16.1 17.0 17.8 15.6 17.5 18.3 15.0 18.2 19.9
GDP = Gross domestic product. Btu = British thermal unit. Sources: 2013: IHS Economics, Industry and Employment models, November 2014. Projections: U.S. Energy Information Administration, AEO2015 National Energy
Modeling System runs LOWMACRO.D021915A, REF2015.D021915A, and HIGHMACRO.D021915A.

This page inTenTionally lefT blank
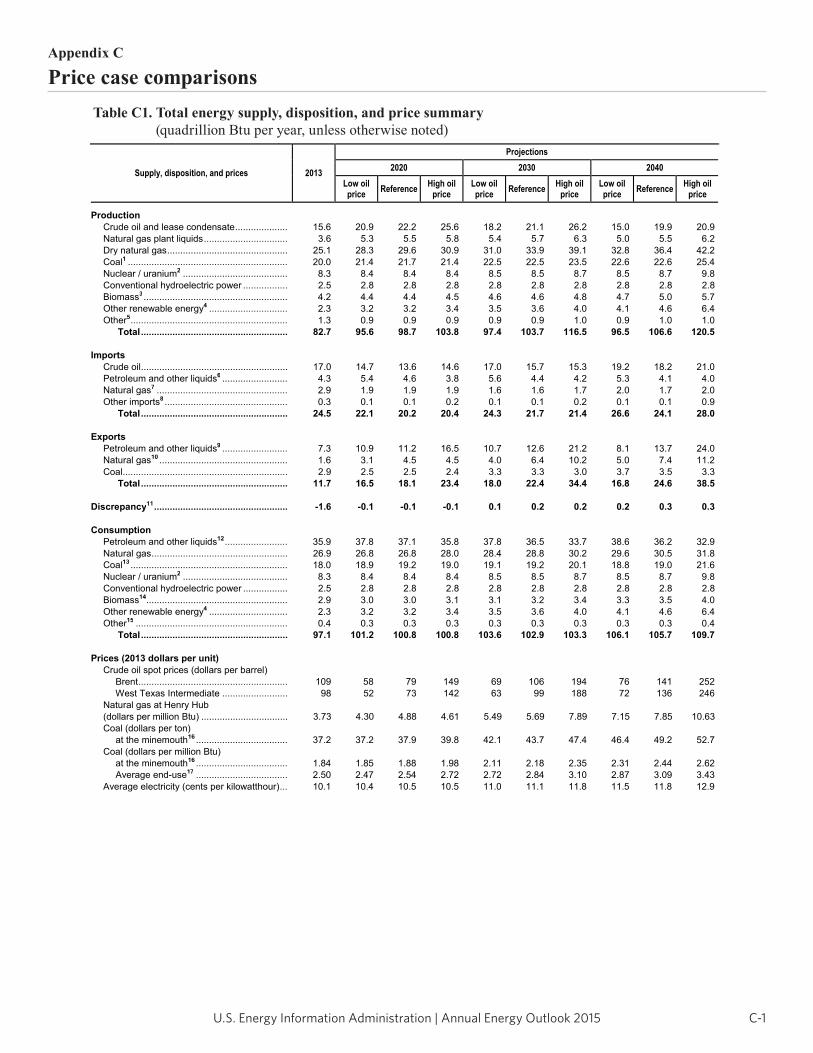
C-1U.S. Energy Information Administration | Annual Energy Outlook 2015
Table C1. Total energy supply, disposition, and price summary(quadrillion Btu per year, unless otherwise noted)
Supply, disposition, and prices 2013
Projections2020 2030 2040
Low oilprice Reference High oil
price Low oilprice Reference High oil
price Low oil price Reference High oil
price
Production Crude oil and lease condensate .................... 15.6 20.9 22.2 25.6 18.2 21.1 26.2 15.0 19.9 20.9
Natural gas plant liquids ................................ 3.6 5.3 5.5 5.8 5.4 5.7 6.3 5.0 5.5 6.2 Dry natural gas .............................................. 25.1 28.3 29.6 30.9 31.0 33.9 39.1 32.8 36.4 42.2 Coal1 ............................................................. 20.0 21.4 21.7 21.4 22.5 22.5 23.5 22.6 22.6 25.4 Nuclear / uranium2 ........................................ 8.3 8.4 8.4 8.4 8.5 8.5 8.7 8.5 8.7 9.8 Conventional hydroelectric power ................. 2.5 2.8 2.8 2.8 2.8 2.8 2.8 2.8 2.8 2.8 Biomass3 ....................................................... 4.2 4.4 4.4 4.5 4.6 4.6 4.8 4.7 5.0 5.7 Other renewable energy4 .............................. 2.3 3.2 3.2 3.4 3.5 3.6 4.0 4.1 4.6 6.4 Other5 ............................................................ 1.3 0.9 0.9 0.9 0.9 0.9 1.0 0.9 1.0 1.0 Total ........................................................ 82.7 95.6 98.7 103.8 97.4 103.7 116.5 96.5 106.6 120.5
Imports Crude oil ........................................................ 17.0 14.7 13.6 14.6 17.0 15.7 15.3 19.2 18.2 21.0
Petroleum and other liquids6 ......................... 4.3 5.4 4.6 3.8 5.6 4.4 4.2 5.3 4.1 4.0 Natural gas7 .................................................. 2.9 1.9 1.9 1.9 1.6 1.6 1.7 2.0 1.7 2.0 Other imports8 ............................................... 0.3 0.1 0.1 0.2 0.1 0.1 0.2 0.1 0.1 0.9 Total ........................................................ 24.5 22.1 20.2 20.4 24.3 21.7 21.4 26.6 24.1 28.0
Exports Petroleum and other liquids9 ......................... 7.3 10.9 11.2 16.5 10.7 12.6 21.2 8.1 13.7 24.0
Natural gas10 ................................................. 1.6 3.1 4.5 4.5 4.0 6.4 10.2 5.0 7.4 11.2 Coal ............................................................... 2.9 2.5 2.5 2.4 3.3 3.3 3.0 3.7 3.5 3.3 Total ........................................................ 11.7 16.5 18.1 23.4 18.0 22.4 34.4 16.8 24.6 38.5
Discrepancy11 ................................................... -1.6 -0.1 -0.1 -0.1 0.1 0.2 0.2 0.2 0.3 0.3
Consumption Petroleum and other liquids12 ........................ 35.9 37.8 37.1 35.8 37.8 36.5 33.7 38.6 36.2 32.9
Natural gas .................................................... 26.9 26.8 26.8 28.0 28.4 28.8 30.2 29.6 30.5 31.8 Coal13 ............................................................ 18.0 18.9 19.2 19.0 19.1 19.2 20.1 18.8 19.0 21.6 Nuclear / uranium2 ........................................ 8.3 8.4 8.4 8.4 8.5 8.5 8.7 8.5 8.7 9.8 Conventional hydroelectric power ................. 2.5 2.8 2.8 2.8 2.8 2.8 2.8 2.8 2.8 2.8 Biomass14...................................................... 2.9 3.0 3.0 3.1 3.1 3.2 3.4 3.3 3.5 4.0 Other renewable energy4 .............................. 2.3 3.2 3.2 3.4 3.5 3.6 4.0 4.1 4.6 6.4 Other15 .......................................................... 0.4 0.3 0.3 0.3 0.3 0.3 0.3 0.3 0.3 0.4 Total ........................................................ 97.1 101.2 100.8 100.8 103.6 102.9 103.3 106.1 105.7 109.7
Prices (2013 dollars per unit) Crude oil spot prices (dollars per barrel)
Brent ......................................................... 109 58 79 149 69 106 194 76 141 252 West Texas Intermediate ......................... 98 52 73 142 63 99 188 72 136 246 Natural gas at Henry Hub
(dollars per million Btu) ................................. 3.73 4.30 4.88 4.61 5.49 5.69 7.89 7.15 7.85 10.63 Coal (dollars per ton) at the minemouth16 ................................... 37.2 37.2 37.9 39.8 42.1 43.7 47.4 46.4 49.2 52.7 Coal (dollars per million Btu) at the minemouth16 ................................... 1.84 1.85 1.88 1.98 2.11 2.18 2.35 2.31 2.44 2.62 Average end-use17 ................................... 2.50 2.47 2.54 2.72 2.72 2.84 3.10 2.87 3.09 3.43 Average electricity (cents per kilowatthour) ... 10.1 10.4 10.5 10.5 11.0 11.1 11.8 11.5 11.8 12.9
Appendix C
Price case comparisonsTable C1. Total energy supply, disposition, and price summary
(quadrillion Btu per year, unless otherwise noted)
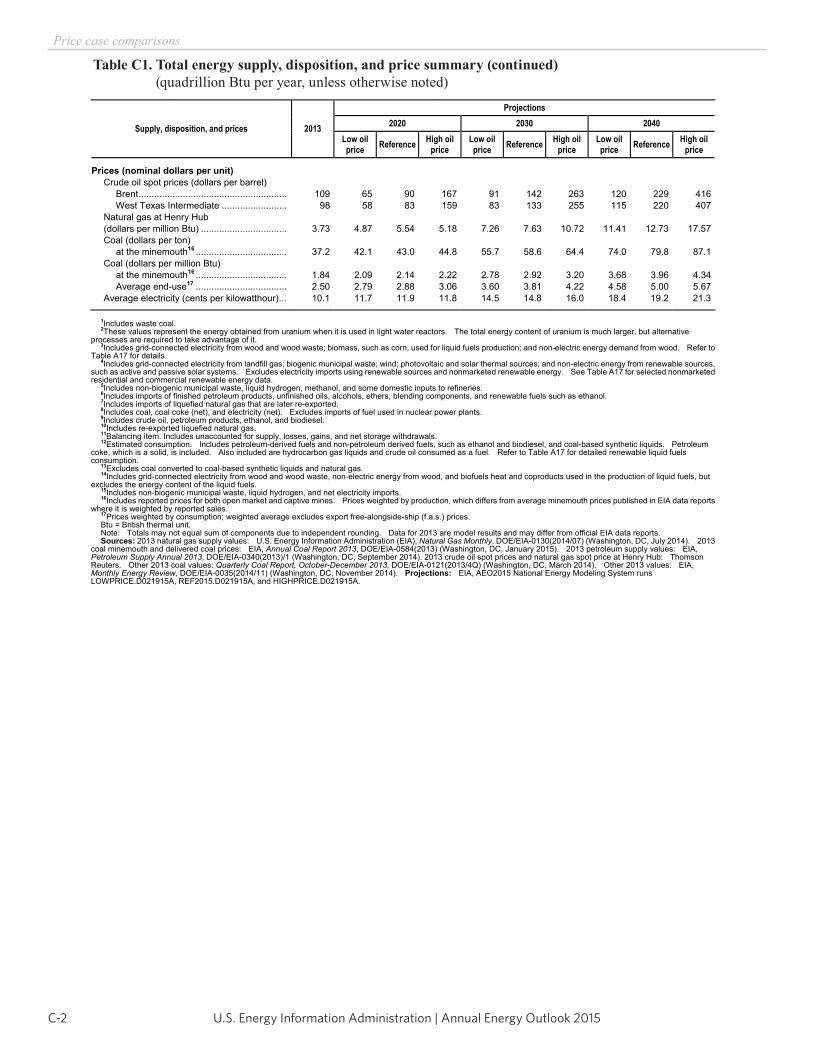
U.S. Energy Information Administration | Annual Energy Outlook 2015C-2
Price case comparisons
Table C1. Total energy supply, disposition, and price summary (continued) (quadrillion Btu per year, unless otherwise noted)
Energy Information Administration / Annual Energy Outlook 2015
Table C1. Total energy supply, disposition, and price summary (continued)(quadrillion Btu per year, unless otherwise noted)
Supply, disposition, and prices 2013
Projections2020 2030 2040
Low oilprice Reference High oil
price Low oilprice Reference High oil
price Low oil price Reference High oil
price
Prices (nominal dollars per unit) Crude oil spot prices (dollars per barrel)
Brent ......................................................... 109 65 90 167 91 142 263 120 229 416 West Texas Intermediate ......................... 98 58 83 159 83 133 255 115 220 407 Natural gas at Henry Hub
(dollars per million Btu) ................................. 3.73 4.87 5.54 5.18 7.26 7.63 10.72 11.41 12.73 17.57 Coal (dollars per ton) at the minemouth16 ................................... 37.2 42.1 43.0 44.8 55.7 58.6 64.4 74.0 79.8 87.1 Coal (dollars per million Btu) at the minemouth16 ................................... 1.84 2.09 2.14 2.22 2.78 2.92 3.20 3.68 3.96 4.34 Average end-use17 ................................... 2.50 2.79 2.88 3.06 3.60 3.81 4.22 4.58 5.00 5.67 Average electricity (cents per kilowatthour) ... 10.1 11.7 11.9 11.8 14.5 14.8 16.0 18.4 19.2 21.3
1Includes waste coal. 2These values represent the energy obtained from uranium when it is used in light water reactors. The total energy content of uranium is much larger, but alternative
processes are required to take advantage of it. 3Includes grid-connected electricity from wood and wood waste; biomass, such as corn, used for liquid fuels production; and non-electric energy demand from wood. Refer to
Table A17 for details. 4Includes grid-connected electricity from landfill gas; biogenic municipal waste; wind; photovoltaic and solar thermal sources; and non-electric energy from renewable sources,
such as active and passive solar systems. Excludes electricity imports using renewable sources and nonmarketed renewable energy. See Table A17 for selected nonmarketed residential and commercial renewable energy data.
5Includes non-biogenic municipal waste, liquid hydrogen, methanol, and some domestic inputs to refineries. 6Includes imports of finished petroleum products, unfinished oils, alcohols, ethers, blending components, and renewable fuels such as ethanol. 7Includes imports of liquefied natural gas that are later re-exported. 8Includes coal, coal coke (net), and electricity (net). Excludes imports of fuel used in nuclear power plants. 9Includes crude oil, petroleum products, ethanol, and biodiesel. 10Includes re-exported liquefied natural gas. 11Balancing item. Includes unaccounted for supply, losses, gains, and net storage withdrawals. 12Estimated consumption. Includes petroleum-derived fuels and non-petroleum derived fuels, such as ethanol and biodiesel, and coal-based synthetic liquids. Petroleum
coke, which is a solid, is included. Also included are hydrocarbon gas liquids and crude oil consumed as a fuel. Refer to Table A17 for detailed renewable liquid fuels consumption.
13Excludes coal converted to coal-based synthetic liquids and natural gas. 14Includes grid-connected electricity from wood and wood waste, non-electric energy from wood, and biofuels heat and coproducts used in the production of liquid fuels, but
excludes the energy content of the liquid fuels. 15Includes non-biogenic municipal waste, liquid hydrogen, and net electricity imports. 16Includes reported prices for both open market and captive mines. Prices weighted by production, which differs from average minemouth prices published in EIA data reports
where it is weighted by reported sales. 17Prices weighted by consumption; weighted average excludes export free-alongside-ship (f.a.s.) prices. Btu = British thermal unit. Note: Totals may not equal sum of components due to independent rounding. Data for 2013 are model results and may differ from official EIA data reports. Sources: 2013 natural gas supply values: U.S. Energy Information Administration (EIA), Natural Gas Monthly, DOE/EIA-0130(2014/07) (Washington, DC, July 2014). 2013
coal minemouth and delivered coal prices: EIA, Annual Coal Report 2013, DOE/EIA-0584(2013) (Washington, DC, January 2015). 2013 petroleum supply values: EIA, Petroleum Supply Annual 2013, DOE/EIA-0340(2013)/1 (Washington, DC, September 2014). 2013 crude oil spot prices and natural gas spot price at Henry Hub: Thomson Reuters. Other 2013 coal values: Quarterly Coal Report, October-December 2013, DOE/EIA-0121(2013/4Q) (Washington, DC, March 2014). Other 2013 values: EIA, Monthly Energy Review, DOE/EIA-0035(2014/11) (Washington, DC, November 2014). Projections: EIA, AEO2015 National Energy Modeling System runs LOWPRICE.D021915A, REF2015.D021915A, and HIGHPRICE.D021915A.
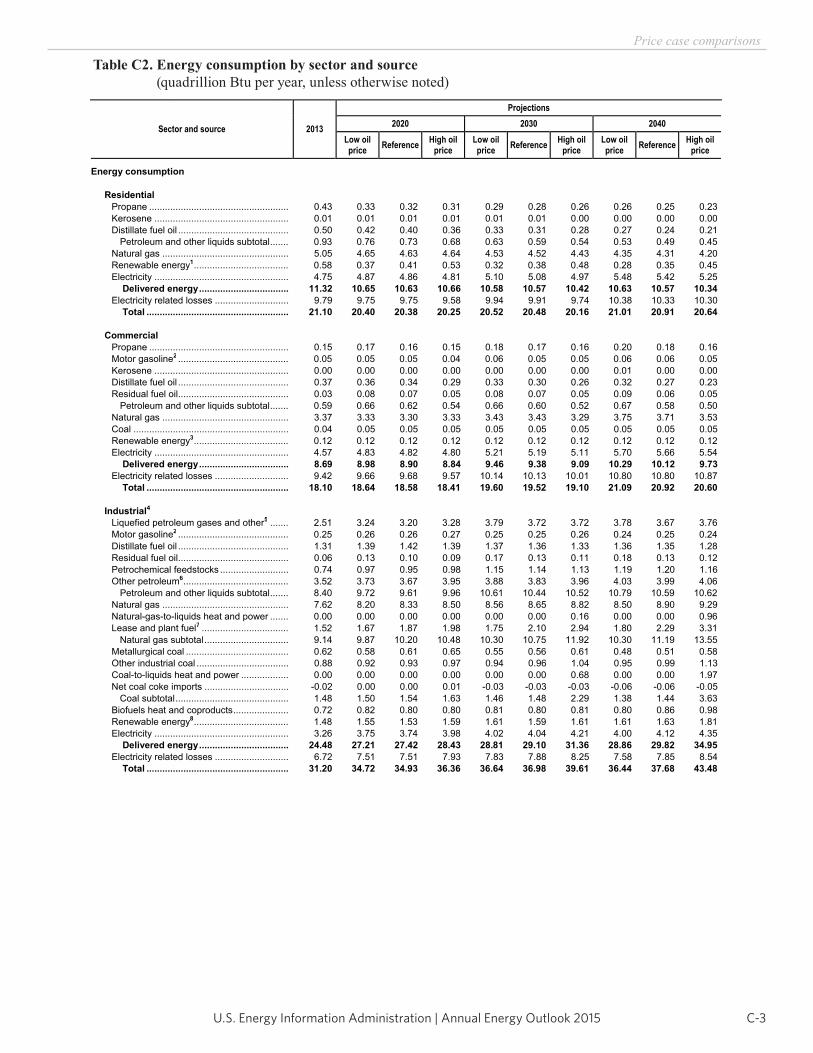
C-3U.S. Energy Information Administration | Annual Energy Outlook 2015
Price case comparisons
Table C2. Energy consumption by sector and source (quadrillion Btu per year, unless otherwise noted)
Energy Information Administration / Annual Energy Outlook 2015
Table C2. Energy consumption by sector and source(quadrillion Btu per year, unless otherwise noted)
Sector and source 2013
Projections2020 2030 2040
Low oilprice Reference High oil
price Low oilprice Reference High oil
price Low oil price Reference High oil
price
Energy consumption
Residential Propane ..................................................... 0.43 0.33 0.32 0.31 0.29 0.28 0.26 0.26 0.25 0.23 Kerosene ................................................... 0.01 0.01 0.01 0.01 0.01 0.01 0.00 0.00 0.00 0.00 Distillate fuel oil .......................................... 0.50 0.42 0.40 0.36 0.33 0.31 0.28 0.27 0.24 0.21 Petroleum and other liquids subtotal ....... 0.93 0.76 0.73 0.68 0.63 0.59 0.54 0.53 0.49 0.45 Natural gas ................................................ 5.05 4.65 4.63 4.64 4.53 4.52 4.43 4.35 4.31 4.20 Renewable energy1 .................................... 0.58 0.37 0.41 0.53 0.32 0.38 0.48 0.28 0.35 0.45 Electricity ................................................... 4.75 4.87 4.86 4.81 5.10 5.08 4.97 5.48 5.42 5.25 Delivered energy .................................. 11.32 10.65 10.63 10.66 10.58 10.57 10.42 10.63 10.57 10.34 Electricity related losses ............................ 9.79 9.75 9.75 9.58 9.94 9.91 9.74 10.38 10.33 10.30 Total ...................................................... 21.10 20.40 20.38 20.25 20.52 20.48 20.16 21.01 20.91 20.64
Commercial Propane ..................................................... 0.15 0.17 0.16 0.15 0.18 0.17 0.16 0.20 0.18 0.16 Motor gasoline2 .......................................... 0.05 0.05 0.05 0.04 0.06 0.05 0.05 0.06 0.06 0.05 Kerosene ................................................... 0.00 0.00 0.00 0.00 0.00 0.00 0.00 0.01 0.00 0.00 Distillate fuel oil .......................................... 0.37 0.36 0.34 0.29 0.33 0.30 0.26 0.32 0.27 0.23 Residual fuel oil .......................................... 0.03 0.08 0.07 0.05 0.08 0.07 0.05 0.09 0.06 0.05 Petroleum and other liquids subtotal ....... 0.59 0.66 0.62 0.54 0.66 0.60 0.52 0.67 0.58 0.50 Natural gas ................................................ 3.37 3.33 3.30 3.33 3.43 3.43 3.29 3.75 3.71 3.53 Coal ........................................................... 0.04 0.05 0.05 0.05 0.05 0.05 0.05 0.05 0.05 0.05 Renewable energy3 .................................... 0.12 0.12 0.12 0.12 0.12 0.12 0.12 0.12 0.12 0.12 Electricity ................................................... 4.57 4.83 4.82 4.80 5.21 5.19 5.11 5.70 5.66 5.54 Delivered energy .................................. 8.69 8.98 8.90 8.84 9.46 9.38 9.09 10.29 10.12 9.73 Electricity related losses ............................ 9.42 9.66 9.68 9.57 10.14 10.13 10.01 10.80 10.80 10.87 Total ...................................................... 18.10 18.64 18.58 18.41 19.60 19.52 19.10 21.09 20.92 20.60
Industrial4 Liquefied petroleum gases and other5 ....... 2.51 3.24 3.20 3.28 3.79 3.72 3.72 3.78 3.67 3.76 Motor gasoline2 .......................................... 0.25 0.26 0.26 0.27 0.25 0.25 0.26 0.24 0.25 0.24 Distillate fuel oil .......................................... 1.31 1.39 1.42 1.39 1.37 1.36 1.33 1.36 1.35 1.28 Residual fuel oil .......................................... 0.06 0.13 0.10 0.09 0.17 0.13 0.11 0.18 0.13 0.12 Petrochemical feedstocks .......................... 0.74 0.97 0.95 0.98 1.15 1.14 1.13 1.19 1.20 1.16 Other petroleum6 ........................................ 3.52 3.73 3.67 3.95 3.88 3.83 3.96 4.03 3.99 4.06 Petroleum and other liquids subtotal ....... 8.40 9.72 9.61 9.96 10.61 10.44 10.52 10.79 10.59 10.62 Natural gas ................................................ 7.62 8.20 8.33 8.50 8.56 8.65 8.82 8.50 8.90 9.29 Natural-gas-to-liquids heat and power ....... 0.00 0.00 0.00 0.00 0.00 0.00 0.16 0.00 0.00 0.96 Lease and plant fuel7 ................................. 1.52 1.67 1.87 1.98 1.75 2.10 2.94 1.80 2.29 3.31 Natural gas subtotal ................................ 9.14 9.87 10.20 10.48 10.30 10.75 11.92 10.30 11.19 13.55 Metallurgical coal ....................................... 0.62 0.58 0.61 0.65 0.55 0.56 0.61 0.48 0.51 0.58 Other industrial coal ................................... 0.88 0.92 0.93 0.97 0.94 0.96 1.04 0.95 0.99 1.13 Coal-to-liquids heat and power .................. 0.00 0.00 0.00 0.00 0.00 0.00 0.68 0.00 0.00 1.97 Net coal coke imports ................................ -0.02 0.00 0.00 0.01 -0.03 -0.03 -0.03 -0.06 -0.06 -0.05 Coal subtotal ........................................... 1.48 1.50 1.54 1.63 1.46 1.48 2.29 1.38 1.44 3.63 Biofuels heat and coproducts ..................... 0.72 0.82 0.80 0.80 0.81 0.80 0.81 0.80 0.86 0.98 Renewable energy8 .................................... 1.48 1.55 1.53 1.59 1.61 1.59 1.61 1.61 1.63 1.81 Electricity ................................................... 3.26 3.75 3.74 3.98 4.02 4.04 4.21 4.00 4.12 4.35 Delivered energy .................................. 24.48 27.21 27.42 28.43 28.81 29.10 31.36 28.86 29.82 34.95 Electricity related losses ............................ 6.72 7.51 7.51 7.93 7.83 7.88 8.25 7.58 7.85 8.54 Total ...................................................... 31.20 34.72 34.93 36.36 36.64 36.98 39.61 36.44 37.68 43.48

U.S. Energy Information Administration | Annual Energy Outlook 2015C-4
Price case comparisons
Table C2. Energy consumption by sector and source (continued) (quadrillion Btu per year, unless otherwise noted)
Energy Information Administration / Annual Energy Outlook 2015
Table C2. Energy consumption by sector and source (continued)(quadrillion Btu per year, unless otherwise noted)
Sector and source 2013
Projections2020 2030 2040
Low oilprice Reference High oil
price Low oilprice Reference High oil
price Low oil price Reference High oil
price
Transportation Propane ..................................................... 0.05 0.04 0.04 0.06 0.05 0.05 0.07 0.05 0.07 0.09 Motor gasoline2 .......................................... 15.94 15.94 15.35 13.98 14.31 13.30 11.44 14.18 12.55 10.54 of which: E859 ..................................... 0.02 0.02 0.03 0.19 0.14 0.20 0.52 0.16 0.28 0.76 Jet fuel10..................................................... 2.80 3.02 3.01 2.97 3.42 3.40 3.37 3.65 3.64 3.61 Distillate fuel oil11 ....................................... 6.50 7.27 7.35 7.26 7.84 7.76 6.88 8.44 7.97 6.68 Residual fuel oil .......................................... 0.57 0.35 0.35 0.35 0.36 0.36 0.36 0.36 0.36 0.36 Other petroleum12 ...................................... 0.15 0.16 0.16 0.16 0.16 0.16 0.16 0.16 0.16 0.16 Petroleum and other liquids subtotal ....... 26.00 26.78 26.27 24.79 26.13 25.03 22.28 26.84 24.76 21.46 Pipeline fuel natural gas ............................. 0.88 0.83 0.85 0.89 0.90 0.94 1.04 0.91 0.96 1.07 Compressed / liquefied natural gas ............ 0.05 0.06 0.07 0.39 0.06 0.17 1.31 0.06 0.71 2.47 Liquid hydrogen ......................................... 0.00 0.00 0.00 0.00 0.00 0.00 0.00 0.00 0.00 0.00 Electricity ................................................... 0.02 0.03 0.03 0.03 0.04 0.04 0.05 0.05 0.06 0.08 Delivered energy .................................. 26.96 27.70 27.22 26.10 27.13 26.18 24.68 27.87 26.49 25.08 Electricity related losses ............................ 0.05 0.06 0.06 0.07 0.08 0.08 0.10 0.10 0.12 0.16 Total ...................................................... 27.01 27.76 27.29 26.17 27.21 26.27 24.78 27.98 26.61 25.24
Unspecified sector13 ..................................... -0.27 -0.33 -0.34 -0.35 -0.37 -0.37 -0.31 -0.41 -0.38 -0.29
Delivered energy consumption for all sectors Liquefied petroleum gases and other5 ....... 3.14 3.78 3.73 3.79 4.31 4.23 4.21 4.29 4.17 4.25 Motor gasoline2 .......................................... 16.36 16.38 15.79 14.41 14.74 13.72 11.84 14.60 12.96 10.91 of which: E859 ..................................... 0.02 0.02 0.03 0.19 0.14 0.20 0.52 0.16 0.28 0.76 Jet fuel10..................................................... 2.97 3.20 3.20 3.15 3.62 3.61 3.57 3.88 3.86 3.83 Kerosene ................................................... 0.01 0.01 0.01 0.01 0.01 0.01 0.01 0.01 0.01 0.01 Distillate fuel oil .......................................... 8.10 8.80 8.86 8.66 9.18 9.05 8.14 9.63 9.13 7.81 Residual fuel oil .......................................... 0.65 0.57 0.53 0.50 0.61 0.56 0.52 0.63 0.56 0.53 Petrochemical feedstocks .......................... 0.74 0.97 0.95 0.98 1.15 1.14 1.13 1.19 1.20 1.16 Other petroleum14 ...................................... 3.67 3.89 3.82 4.11 4.04 3.98 4.12 4.19 4.15 4.22 Petroleum and other liquids subtotal ....... 35.65 37.59 36.89 35.61 37.66 36.30 33.54 38.43 36.03 32.73 Natural gas ................................................ 16.10 16.24 16.32 16.86 16.57 16.76 17.84 16.67 17.64 19.48 Natural-gas-to-liquids heat and power ....... 0.00 0.00 0.00 0.00 0.00 0.00 0.16 0.00 0.00 0.96 Lease and plant fuel7 ................................. 1.52 1.67 1.87 1.98 1.75 2.10 2.94 1.80 2.29 3.31 Pipeline natural gas ................................... 0.88 0.83 0.85 0.89 0.90 0.94 1.04 0.91 0.96 1.07 Natural gas subtotal ................................ 18.50 18.73 19.05 19.73 19.21 19.80 21.99 19.37 20.88 24.81 Metallurgical coal ....................................... 0.62 0.58 0.61 0.65 0.55 0.56 0.61 0.48 0.51 0.58 Other coal .................................................. 0.92 0.97 0.98 1.02 0.99 1.00 1.09 1.00 1.04 1.18 Coal-to-liquids heat and power .................. 0.00 0.00 0.00 0.00 0.00 0.00 0.68 0.00 0.00 1.97 Net coal coke imports ................................ -0.02 0.00 0.00 0.01 -0.03 -0.03 -0.03 -0.06 -0.06 -0.05 Coal subtotal ........................................... 1.52 1.55 1.59 1.67 1.51 1.53 2.34 1.42 1.49 3.68 Biofuels heat and coproducts ..................... 0.72 0.82 0.80 0.80 0.81 0.80 0.81 0.80 0.86 0.98 Renewable energy15 .................................. 2.18 2.04 2.06 2.23 2.05 2.09 2.22 2.01 2.10 2.38 Liquid hydrogen ......................................... 0.00 0.00 0.00 0.00 0.00 0.00 0.00 0.00 0.00 0.00 Electricity ................................................... 12.60 13.48 13.45 13.63 14.37 14.35 14.34 15.23 15.25 15.21 Delivered energy .................................. 71.17 74.22 73.84 73.68 75.61 74.87 75.24 77.25 76.62 79.80 Electricity related losses ............................ 25.97 26.98 27.00 27.15 27.99 28.01 28.09 28.86 29.10 29.87 Total ...................................................... 97.14 101.20 100.84 100.84 103.60 102.87 103.34 106.11 105.73 109.67
Electric power16
Distillate fuel oil .......................................... 0.05 0.09 0.09 0.09 0.08 0.08 0.08 0.08 0.08 0.08 Residual fuel oil .......................................... 0.21 0.08 0.08 0.09 0.09 0.09 0.09 0.11 0.09 0.09 Petroleum and other liquids subtotal ....... 0.26 0.17 0.17 0.17 0.18 0.17 0.17 0.19 0.18 0.18 Natural gas ................................................ 8.36 8.07 7.80 8.28 9.21 9.03 8.25 10.19 9.61 7.02 Steam coal ................................................. 16.49 17.37 17.59 17.33 17.58 17.63 17.77 17.41 17.52 17.88 Nuclear / uranium17 .................................... 8.27 8.42 8.42 8.42 8.46 8.47 8.67 8.52 8.73 9.78 Renewable energy18 .................................. 4.78 6.08 6.13 6.24 6.59 6.72 7.22 7.46 7.99 9.85 Non-biogenic municipal waste ................... 0.23 0.23 0.23 0.23 0.23 0.23 0.23 0.23 0.23 0.23 Electricity imports ....................................... 0.18 0.11 0.11 0.11 0.10 0.10 0.12 0.11 0.11 0.15 Total ...................................................... 38.57 40.46 40.45 40.78 42.36 42.35 42.43 44.09 44.36 45.08
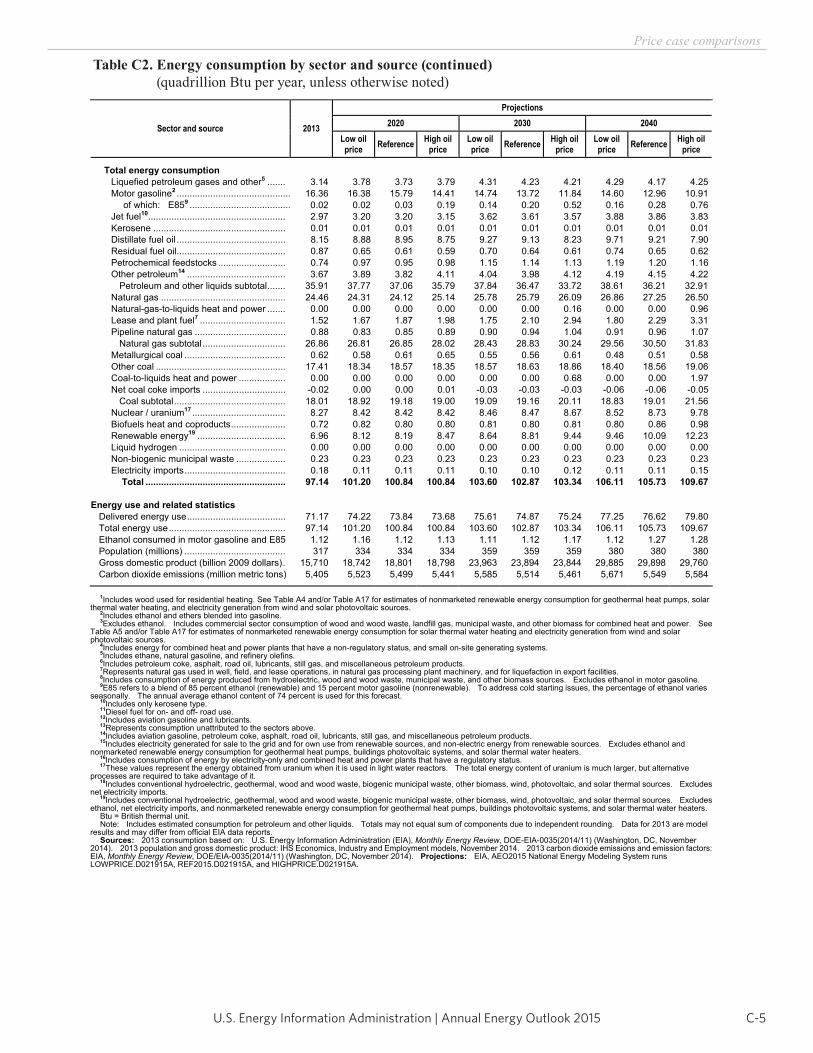
C-5U.S. Energy Information Administration | Annual Energy Outlook 2015
Price case comparisons
Table C2. Energy consumption by sector and source (continued) (quadrillion Btu per year, unless otherwise noted)
Energy Information Administration / Annual Energy Outlook 2015
Table C2. Energy consumption by sector and source (continued)(quadrillion Btu per year, unless otherwise noted)
Sector and source 2013
Projections2020 2030 2040
Low oilprice Reference High oil
price Low oilprice Reference High oil
price Low oil price Reference High oil
price
Total energy consumption Liquefied petroleum gases and other5 ....... 3.14 3.78 3.73 3.79 4.31 4.23 4.21 4.29 4.17 4.25 Motor gasoline2 ............................................ 16.36 16.38 15.79 14.41 14.74 13.72 11.84 14.60 12.96 10.91 of which: E859 ....................................... 0.02 0.02 0.03 0.19 0.14 0.20 0.52 0.16 0.28 0.76 Jet fuel10..................................................... 2.97 3.20 3.20 3.15 3.62 3.61 3.57 3.88 3.86 3.83 Kerosene ................................................... 0.01 0.01 0.01 0.01 0.01 0.01 0.01 0.01 0.01 0.01 Distillate fuel oil .......................................... 8.15 8.88 8.95 8.75 9.27 9.13 8.23 9.71 9.21 7.90 Residual fuel oil .......................................... 0.87 0.65 0.61 0.59 0.70 0.64 0.61 0.74 0.65 0.62 Petrochemical feedstocks .......................... 0.74 0.97 0.95 0.98 1.15 1.14 1.13 1.19 1.20 1.16 Other petroleum14 ...................................... 3.67 3.89 3.82 4.11 4.04 3.98 4.12 4.19 4.15 4.22 Petroleum and other liquids subtotal ....... 35.91 37.77 37.06 35.79 37.84 36.47 33.72 38.61 36.21 32.91 Natural gas ................................................ 24.46 24.31 24.12 25.14 25.78 25.79 26.09 26.86 27.25 26.50 Natural-gas-to-liquids heat and power ....... 0.00 0.00 0.00 0.00 0.00 0.00 0.16 0.00 0.00 0.96 Lease and plant fuel7 ................................. 1.52 1.67 1.87 1.98 1.75 2.10 2.94 1.80 2.29 3.31 Pipeline natural gas ................................... 0.88 0.83 0.85 0.89 0.90 0.94 1.04 0.91 0.96 1.07 Natural gas subtotal ................................ 26.86 26.81 26.85 28.02 28.43 28.83 30.24 29.56 30.50 31.83 Metallurgical coal ....................................... 0.62 0.58 0.61 0.65 0.55 0.56 0.61 0.48 0.51 0.58 Other coal .................................................. 17.41 18.34 18.57 18.35 18.57 18.63 18.86 18.40 18.56 19.06 Coal-to-liquids heat and power .................. 0.00 0.00 0.00 0.00 0.00 0.00 0.68 0.00 0.00 1.97 Net coal coke imports ................................ -0.02 0.00 0.00 0.01 -0.03 -0.03 -0.03 -0.06 -0.06 -0.05 Coal subtotal ........................................... 18.01 18.92 19.18 19.00 19.09 19.16 20.11 18.83 19.01 21.56 Nuclear / uranium17 .................................... 8.27 8.42 8.42 8.42 8.46 8.47 8.67 8.52 8.73 9.78 Biofuels heat and coproducts ..................... 0.72 0.82 0.80 0.80 0.81 0.80 0.81 0.80 0.86 0.98 Renewable energy19 .................................. 6.96 8.12 8.19 8.47 8.64 8.81 9.44 9.46 10.09 12.23 Liquid hydrogen ......................................... 0.00 0.00 0.00 0.00 0.00 0.00 0.00 0.00 0.00 0.00 Non-biogenic municipal waste ................... 0.23 0.23 0.23 0.23 0.23 0.23 0.23 0.23 0.23 0.23 Electricity imports ....................................... 0.18 0.11 0.11 0.11 0.10 0.10 0.12 0.11 0.11 0.15
Total ...................................................... 97.14 101.20 100.84 100.84 103.60 102.87 103.34 106.11 105.73 109.67
Energy use and related statistics Delivered energy use ...................................... 71.17 74.22 73.84 73.68 75.61 74.87 75.24 77.25 76.62 79.80
Total energy use ............................................. 97.14 101.20 100.84 100.84 103.60 102.87 103.34 106.11 105.73 109.67 Ethanol consumed in motor gasoline and E85 1.12 1.16 1.12 1.13 1.11 1.12 1.17 1.12 1.27 1.28
Population (millions) ....................................... 317 334 334 334 359 359 359 380 380 380 Gross domestic product (billion 2009 dollars) . 15,710 18,742 18,801 18,798 23,963 23,894 23,844 29,885 29,898 29,760 Carbon dioxide emissions (million metric tons) 5,405 5,523 5,499 5,441 5,585 5,514 5,461 5,671 5,549 5,584
1Includes wood used for residential heating. See Table A4 and/or Table A17 for estimates of nonmarketed renewable energy consumption for geothermal heat pumps, solar thermal water heating, and electricity generation from wind and solar photovoltaic sources.
2Includes ethanol and ethers blended into gasoline. 3Excludes ethanol. Includes commercial sector consumption of wood and wood waste, landfill gas, municipal waste, and other biomass for combined heat and power. See
Table A5 and/or Table A17 for estimates of nonmarketed renewable energy consumption for solar thermal water heating and electricity generation from wind and solar photovoltaic sources.
4Includes energy for combined heat and power plants that have a non-regulatory status, and small on-site generating systems. 5Includes ethane, natural gasoline, and refinery olefins. 6Includes petroleum coke, asphalt, road oil, lubricants, still gas, and miscellaneous petroleum products. 7Represents natural gas used in well, field, and lease operations, in natural gas processing plant machinery, and for liquefaction in export facilities. 8Includes consumption of energy produced from hydroelectric, wood and wood waste, municipal waste, and other biomass sources. Excludes ethanol in motor gasoline. 9E85 refers to a blend of 85 percent ethanol (renewable) and 15 percent motor gasoline (nonrenewable). To address cold starting issues, the percentage of ethanol varies
seasonally. The annual average ethanol content of 74 percent is used for this forecast. 10Includes only kerosene type. 11Diesel fuel for on- and off- road use. 12Includes aviation gasoline and lubricants. 13Represents consumption unattributed to the sectors above. 14Includes aviation gasoline, petroleum coke, asphalt, road oil, lubricants, still gas, and miscellaneous petroleum products. 15Includes electricity generated for sale to the grid and for own use from renewable sources, and non-electric energy from renewable sources. Excludes ethanol and
nonmarketed renewable energy consumption for geothermal heat pumps, buildings photovoltaic systems, and solar thermal water heaters. 16Includes consumption of energy by electricity-only and combined heat and power plants that have a regulatory status. 17These values represent the energy obtained from uranium when it is used in light water reactors. The total energy content of uranium is much larger, but alternative
processes are required to take advantage of it. 18Includes conventional hydroelectric, geothermal, wood and wood waste, biogenic municipal waste, other biomass, wind, photovoltaic, and solar thermal sources. Excludes
net electricity imports. 19Includes conventional hydroelectric, geothermal, wood and wood waste, biogenic municipal waste, other biomass, wind, photovoltaic, and solar thermal sources. Excludes
ethanol, net electricity imports, and nonmarketed renewable energy consumption for geothermal heat pumps, buildings photovoltaic systems, and solar thermal water heaters. Btu = British thermal unit. Note: Includes estimated consumption for petroleum and other liquids. Totals may not equal sum of components due to independent rounding. Data for 2013 are model
results and may differ from official EIA data reports. Sources: 2013 consumption based on: U.S. Energy Information Administration (EIA), Monthly Energy Review, DOE-EIA-0035(2014/11) (Washington, DC, November
2014). 2013 population and gross domestic product: IHS Economics, Industry and Employment models, November 2014. 2013 carbon dioxide emissions and emission factors: EIA, Monthly Energy Review, DOE/EIA-0035(2014/11) (Washington, DC, November 2014). Projections: EIA, AEO2015 National Energy Modeling System runs LOWPRICE.D021915A, REF2015.D021915A, and HIGHPRICE.D021915A.
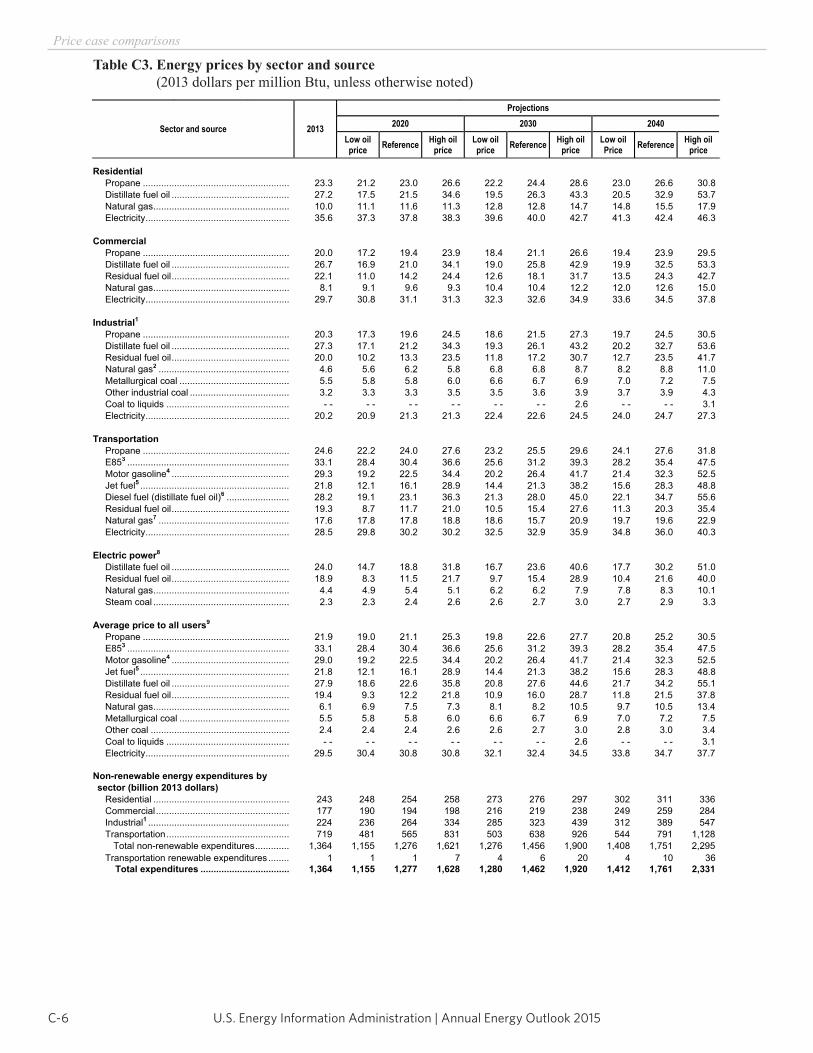
U.S. Energy Information Administration | Annual Energy Outlook 2015C-6
Price case comparisons
Energy Information Administration / Annual Energy Outlook 2015
Table C3. Energy prices by sector and source(2013 dollars per million Btu, unless otherwise noted)
Sector and source 2013
Projections2020 2030 2040
Low oilprice Reference High oil
price Low oilprice Reference High oil
price Low oil Price Reference High oil
price
Residential Propane ........................................................ 23.3 21.2 23.0 26.6 22.2 24.4 28.6 23.0 26.6 30.8 Distillate fuel oil ............................................. 27.2 17.5 21.5 34.6 19.5 26.3 43.3 20.5 32.9 53.7 Natural gas .................................................... 10.0 11.1 11.6 11.3 12.8 12.8 14.7 14.8 15.5 17.9 Electricity ....................................................... 35.6 37.3 37.8 38.3 39.6 40.0 42.7 41.3 42.4 46.3
Commercial Propane ........................................................ 20.0 17.2 19.4 23.9 18.4 21.1 26.6 19.4 23.9 29.5 Distillate fuel oil ............................................. 26.7 16.9 21.0 34.1 19.0 25.8 42.9 19.9 32.5 53.3 Residual fuel oil ............................................. 22.1 11.0 14.2 24.4 12.6 18.1 31.7 13.5 24.3 42.7 Natural gas .................................................... 8.1 9.1 9.6 9.3 10.4 10.4 12.2 12.0 12.6 15.0 Electricity ....................................................... 29.7 30.8 31.1 31.3 32.3 32.6 34.9 33.6 34.5 37.8
Industrial1 Propane ........................................................ 20.3 17.3 19.6 24.5 18.6 21.5 27.3 19.7 24.5 30.5 Distillate fuel oil ............................................. 27.3 17.1 21.2 34.3 19.3 26.1 43.2 20.2 32.7 53.6 Residual fuel oil ............................................. 20.0 10.2 13.3 23.5 11.8 17.2 30.7 12.7 23.5 41.7 Natural gas2 .................................................. 4.6 5.6 6.2 5.8 6.8 6.8 8.7 8.2 8.8 11.0 Metallurgical coal .......................................... 5.5 5.8 5.8 6.0 6.6 6.7 6.9 7.0 7.2 7.5 Other industrial coal ...................................... 3.2 3.3 3.3 3.5 3.5 3.6 3.9 3.7 3.9 4.3
Coal to liquids ............................................... - - - - - - - - - - - - 2.6 - - - - 3.1 Electricity ....................................................... 20.2 20.9 21.3 21.3 22.4 22.6 24.5 24.0 24.7 27.3
Transportation Propane ........................................................ 24.6 22.2 24.0 27.6 23.2 25.5 29.6 24.1 27.6 31.8 E853 .............................................................. 33.1 28.4 30.4 36.6 25.6 31.2 39.3 28.2 35.4 47.5 Motor gasoline4 ............................................. 29.3 19.2 22.5 34.4 20.2 26.4 41.7 21.4 32.3 52.5 Jet fuel5 ......................................................... 21.8 12.1 16.1 28.9 14.4 21.3 38.2 15.6 28.3 48.8 Diesel fuel (distillate fuel oil)6 ........................ 28.2 19.1 23.1 36.3 21.3 28.0 45.0 22.1 34.7 55.6 Residual fuel oil ............................................. 19.3 8.7 11.7 21.0 10.5 15.4 27.6 11.3 20.3 35.4 Natural gas7 .................................................. 17.6 17.8 17.8 18.8 18.6 15.7 20.9 19.7 19.6 22.9 Electricity ....................................................... 28.5 29.8 30.2 30.2 32.5 32.9 35.9 34.8 36.0 40.3
Electric power8
Distillate fuel oil ............................................. 24.0 14.7 18.8 31.8 16.7 23.6 40.6 17.7 30.2 51.0 Residual fuel oil ............................................. 18.9 8.3 11.5 21.7 9.7 15.4 28.9 10.4 21.6 40.0 Natural gas .................................................... 4.4 4.9 5.4 5.1 6.2 6.2 7.9 7.8 8.3 10.1 Steam coal .................................................... 2.3 2.3 2.4 2.6 2.6 2.7 3.0 2.7 2.9 3.3
Average price to all users9
Propane ........................................................ 21.9 19.0 21.1 25.3 19.8 22.6 27.7 20.8 25.2 30.5 E853 .............................................................. 33.1 28.4 30.4 36.6 25.6 31.2 39.3 28.2 35.4 47.5 Motor gasoline4 ............................................. 29.0 19.2 22.5 34.4 20.2 26.4 41.7 21.4 32.3 52.5 Jet fuel5 ......................................................... 21.8 12.1 16.1 28.9 14.4 21.3 38.2 15.6 28.3 48.8 Distillate fuel oil ............................................. 27.9 18.6 22.6 35.8 20.8 27.6 44.6 21.7 34.2 55.1 Residual fuel oil ............................................. 19.4 9.3 12.2 21.8 10.9 16.0 28.7 11.8 21.5 37.8 Natural gas .................................................... 6.1 6.9 7.5 7.3 8.1 8.2 10.5 9.7 10.5 13.4 Metallurgical coal .......................................... 5.5 5.8 5.8 6.0 6.6 6.7 6.9 7.0 7.2 7.5 Other coal ..................................................... 2.4 2.4 2.4 2.6 2.6 2.7 3.0 2.8 3.0 3.4
Coal to liquids ............................................... - - - - - - - - - - - - 2.6 - - - - 3.1 Electricity ....................................................... 29.5 30.4 30.8 30.8 32.1 32.4 34.5 33.8 34.7 37.7
Non-renewable energy expenditures by sector (billion 2013 dollars) Residential .................................................... 243 248 254 258 273 276 297 302 311 336 Commercial ................................................... 177 190 194 198 216 219 238 249 259 284 Industrial1 ...................................................... 224 236 264 334 285 323 439 312 389 547 Transportation ............................................... 719 481 565 831 503 638 926 544 791 1,128 Total non-renewable expenditures ............. 1,364 1,155 1,276 1,621 1,276 1,456 1,900 1,408 1,751 2,295 Transportation renewable expenditures ........ 1 1 1 7 4 6 20 4 10 36 Total expenditures .................................. 1,364 1,155 1,277 1,628 1,280 1,462 1,920 1,412 1,761 2,331
Table C3. Energy prices by sector and source (2013 dollars per million Btu, unless otherwise noted)
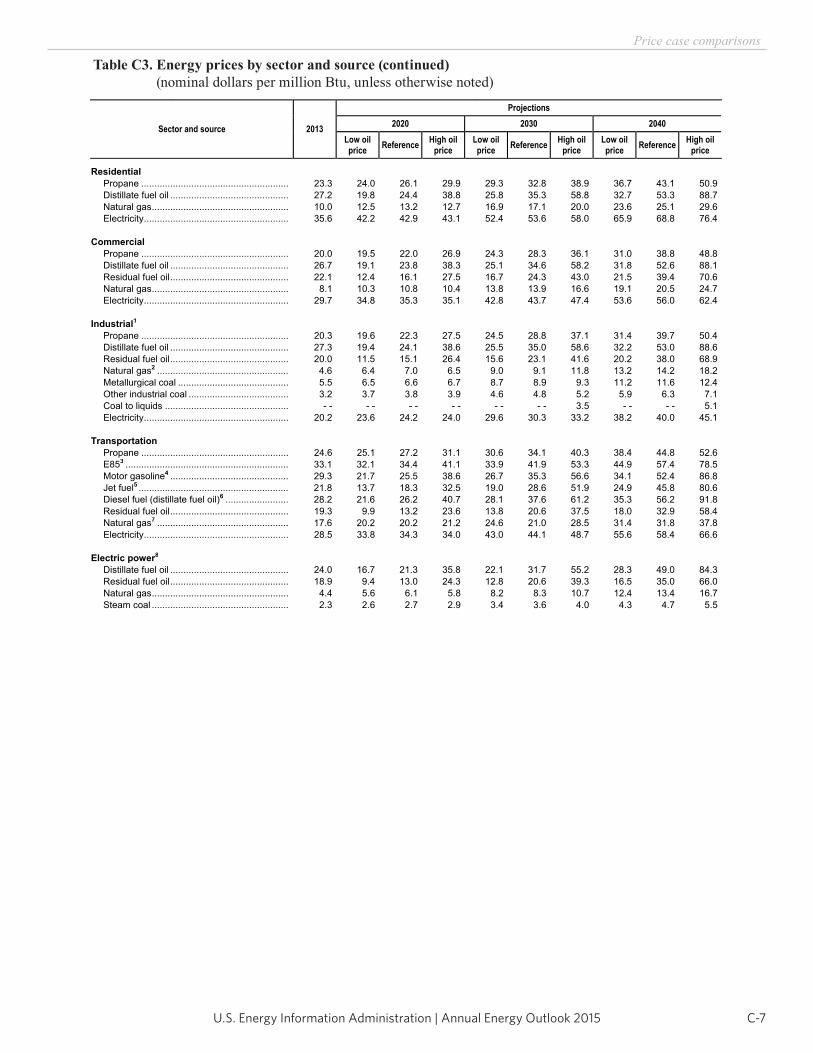
C-7U.S. Energy Information Administration | Annual Energy Outlook 2015
Price case comparisons
Table C3. Energy prices by sector and source (continued) (nominal dollars per million Btu, unless otherwise noted)
Energy Information Administration / Annual Energy Outlook 2015
Table C3. Energy prices by sector and source (continued)(nominal dollars per million Btu, unless otherwise noted)
Sector and source 2013
Projections2020 2030 2040
Low oilprice Reference High oil
price Low oilprice Reference High oil
price Low oil price Reference High oil
price
Residential Propane ........................................................ 23.3 24.0 26.1 29.9 29.3 32.8 38.9 36.7 43.1 50.9 Distillate fuel oil ............................................. 27.2 19.8 24.4 38.8 25.8 35.3 58.8 32.7 53.3 88.7 Natural gas .................................................... 10.0 12.5 13.2 12.7 16.9 17.1 20.0 23.6 25.1 29.6 Electricity ....................................................... 35.6 42.2 42.9 43.1 52.4 53.6 58.0 65.9 68.8 76.4
Commercial Propane ........................................................ 20.0 19.5 22.0 26.9 24.3 28.3 36.1 31.0 38.8 48.8 Distillate fuel oil ............................................. 26.7 19.1 23.8 38.3 25.1 34.6 58.2 31.8 52.6 88.1 Residual fuel oil ............................................. 22.1 12.4 16.1 27.5 16.7 24.3 43.0 21.5 39.4 70.6 Natural gas .................................................... 8.1 10.3 10.8 10.4 13.8 13.9 16.6 19.1 20.5 24.7 Electricity ....................................................... 29.7 34.8 35.3 35.1 42.8 43.7 47.4 53.6 56.0 62.4
Industrial1 Propane ........................................................ 20.3 19.6 22.3 27.5 24.5 28.8 37.1 31.4 39.7 50.4 Distillate fuel oil ............................................. 27.3 19.4 24.1 38.6 25.5 35.0 58.6 32.2 53.0 88.6 Residual fuel oil ............................................. 20.0 11.5 15.1 26.4 15.6 23.1 41.6 20.2 38.0 68.9 Natural gas2 .................................................. 4.6 6.4 7.0 6.5 9.0 9.1 11.8 13.2 14.2 18.2 Metallurgical coal .......................................... 5.5 6.5 6.6 6.7 8.7 8.9 9.3 11.2 11.6 12.4 Other industrial coal ...................................... 3.2 3.7 3.8 3.9 4.6 4.8 5.2 5.9 6.3 7.1
Coal to liquids ............................................... - - - - - - - - - - - - 3.5 - - - - 5.1 Electricity ....................................................... 20.2 23.6 24.2 24.0 29.6 30.3 33.2 38.2 40.0 45.1
Transportation Propane ........................................................ 24.6 25.1 27.2 31.1 30.6 34.1 40.3 38.4 44.8 52.6 E853 .............................................................. 33.1 32.1 34.4 41.1 33.9 41.9 53.3 44.9 57.4 78.5 Motor gasoline4 ............................................. 29.3 21.7 25.5 38.6 26.7 35.3 56.6 34.1 52.4 86.8 Jet fuel5 ......................................................... 21.8 13.7 18.3 32.5 19.0 28.6 51.9 24.9 45.8 80.6 Diesel fuel (distillate fuel oil)6 ........................ 28.2 21.6 26.2 40.7 28.1 37.6 61.2 35.3 56.2 91.8 Residual fuel oil ............................................. 19.3 9.9 13.2 23.6 13.8 20.6 37.5 18.0 32.9 58.4 Natural gas7 .................................................. 17.6 20.2 20.2 21.2 24.6 21.0 28.5 31.4 31.8 37.8 Electricity ....................................................... 28.5 33.8 34.3 34.0 43.0 44.1 48.7 55.6 58.4 66.6
Electric power8
Distillate fuel oil ............................................. 24.0 16.7 21.3 35.8 22.1 31.7 55.2 28.3 49.0 84.3 Residual fuel oil ............................................. 18.9 9.4 13.0 24.3 12.8 20.6 39.3 16.5 35.0 66.0 Natural gas .................................................... 4.4 5.6 6.1 5.8 8.2 8.3 10.7 12.4 13.4 16.7 Steam coal .................................................... 2.3 2.6 2.7 2.9 3.4 3.6 4.0 4.3 4.7 5.5
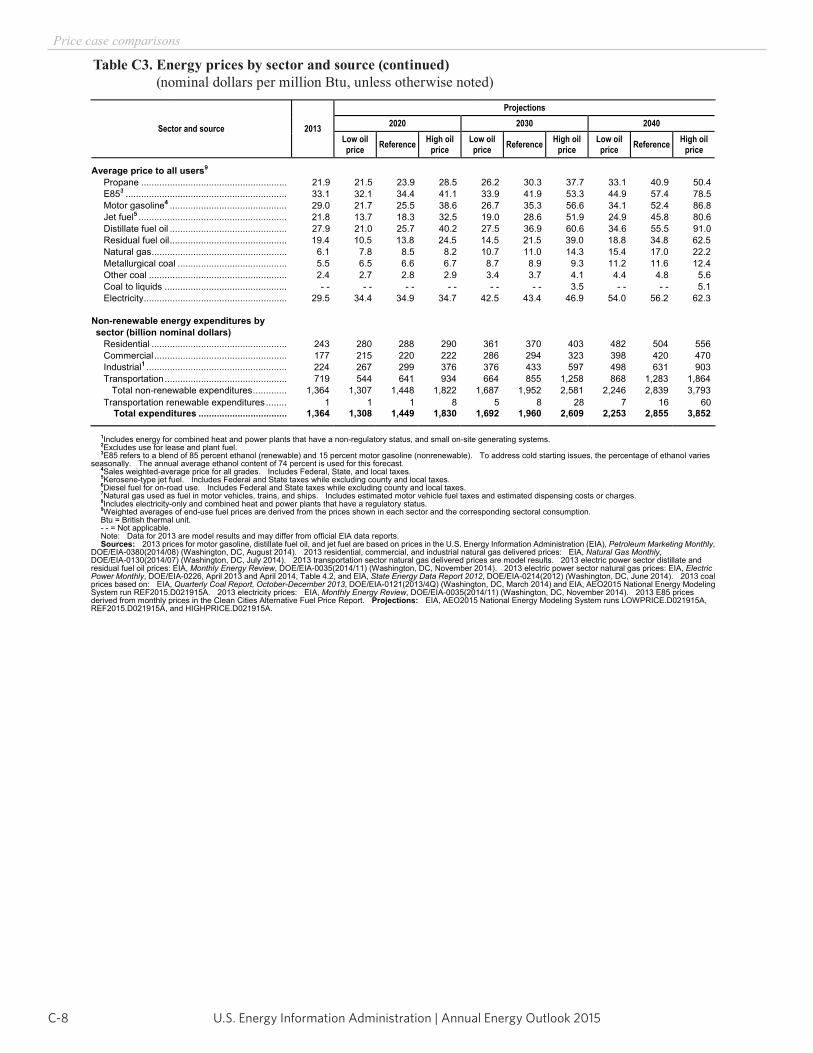
U.S. Energy Information Administration | Annual Energy Outlook 2015C-8
Price case comparisons
Table C3. Energy prices by sector and source (continued) (nominal dollars per million Btu, unless otherwise noted)
Energy Information Administration / Annual Energy Outlook 2015
Table C3. Energy prices by sector and source (continued)(nominal dollars per million Btu, unless otherwise noted)
Sector and source 2013
Projections2020 2030 2040
Low oilprice Reference High oil
price Low oilprice Reference High oil
price Low oil price Reference High oil
price
Average price to all users9
Propane ........................................................ 21.9 21.5 23.9 28.5 26.2 30.3 37.7 33.1 40.9 50.4 E853 .............................................................. 33.1 32.1 34.4 41.1 33.9 41.9 53.3 44.9 57.4 78.5 Motor gasoline4 ............................................. 29.0 21.7 25.5 38.6 26.7 35.3 56.6 34.1 52.4 86.8 Jet fuel5 ......................................................... 21.8 13.7 18.3 32.5 19.0 28.6 51.9 24.9 45.8 80.6 Distillate fuel oil ............................................. 27.9 21.0 25.7 40.2 27.5 36.9 60.6 34.6 55.5 91.0 Residual fuel oil ............................................. 19.4 10.5 13.8 24.5 14.5 21.5 39.0 18.8 34.8 62.5 Natural gas .................................................... 6.1 7.8 8.5 8.2 10.7 11.0 14.3 15.4 17.0 22.2 Metallurgical coal .......................................... 5.5 6.5 6.6 6.7 8.7 8.9 9.3 11.2 11.6 12.4 Other coal ..................................................... 2.4 2.7 2.8 2.9 3.4 3.7 4.1 4.4 4.8 5.6
Coal to liquids ............................................... - - - - - - - - - - - - 3.5 - - - - 5.1 Electricity ....................................................... 29.5 34.4 34.9 34.7 42.5 43.4 46.9 54.0 56.2 62.3
Non-renewable energy expenditures by sector (billion nominal dollars) Residential .................................................... 243 280 288 290 361 370 403 482 504 556 Commercial ................................................... 177 215 220 222 286 294 323 398 420 470 Industrial1 ...................................................... 224 267 299 376 376 433 597 498 631 903 Transportation ............................................... 719 544 641 934 664 855 1,258 868 1,283 1,864 Total non-renewable expenditures ............. 1,364 1,307 1,448 1,822 1,687 1,952 2,581 2,246 2,839 3,793 Transportation renewable expenditures ........ 1 1 1 8 5 8 28 7 16 60 Total expenditures .................................. 1,364 1,308 1,449 1,830 1,692 1,960 2,609 2,253 2,855 3,852
1Includes energy for combined heat and power plants that have a non-regulatory status, and small on-site generating systems. 2Excludes use for lease and plant fuel. 3E85 refers to a blend of 85 percent ethanol (renewable) and 15 percent motor gasoline (nonrenewable). To address cold starting issues, the percentage of ethanol varies
seasonally. The annual average ethanol content of 74 percent is used for this forecast. 4Sales weighted-average price for all grades. Includes Federal, State, and local taxes. 5Kerosene-type jet fuel. Includes Federal and State taxes while excluding county and local taxes. 6Diesel fuel for on-road use. Includes Federal and State taxes while excluding county and local taxes. 7Natural gas used as fuel in motor vehicles, trains, and ships. Includes estimated motor vehicle fuel taxes and estimated dispensing costs or charges. 8Includes electricity-only and combined heat and power plants that have a regulatory status. 9Weighted averages of end-use fuel prices are derived from the prices shown in each sector and the corresponding sectoral consumption. Btu = British thermal unit. - - = Not applicable. Note: Data for 2013 are model results and may differ from official EIA data reports. Sources: 2013 prices for motor gasoline, distillate fuel oil, and jet fuel are based on prices in the U.S. Energy Information Administration (EIA), Petroleum Marketing Monthly,
DOE/EIA-0380(2014/08) (Washington, DC, August 2014). 2013 residential, commercial, and industrial natural gas delivered prices: EIA, Natural Gas Monthly,DOE/EIA-0130(2014/07) (Washington, DC, July 2014). 2013 transportation sector natural gas delivered prices are model results. 2013 electric power sector distillate and residual fuel oil prices: EIA, Monthly Energy Review, DOE/EIA-0035(2014/11) (Washington, DC, November 2014). 2013 electric power sector natural gas prices: EIA, Electric Power Monthly, DOE/EIA-0226, April 2013 and April 2014, Table 4.2, and EIA, State Energy Data Report 2012, DOE/EIA-0214(2012) (Washington, DC, June 2014). 2013 coal prices based on: EIA, Quarterly Coal Report, October-December 2013, DOE/EIA-0121(2013/4Q) (Washington, DC, March 2014) and EIA, AEO2015 National Energy Modeling System run REF2015.D021915A. 2013 electricity prices: EIA, Monthly Energy Review, DOE/EIA-0035(2014/11) (Washington, DC, November 2014). 2013 E85 prices derived from monthly prices in the Clean Cities Alternative Fuel Price Report. Projections: EIA, AEO2015 National Energy Modeling System runs LOWPRICE.D021915A, REF2015.D021915A, and HIGHPRICE.D021915A.
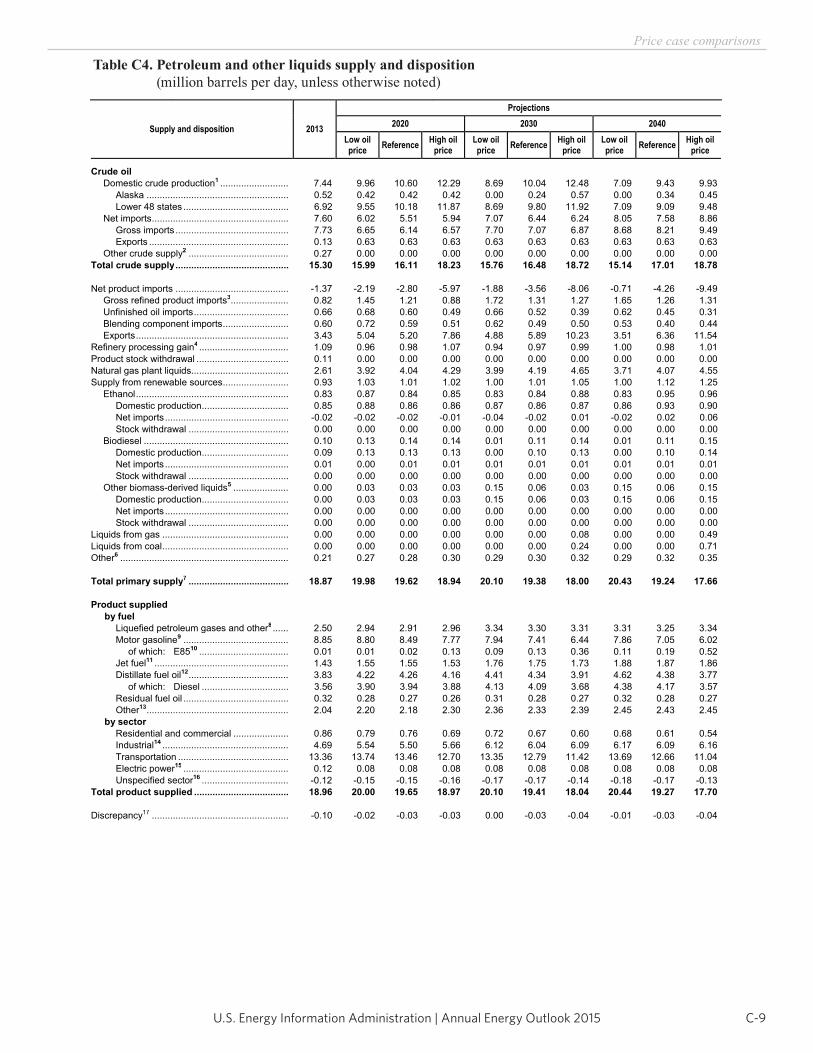
C-9U.S. Energy Information Administration | Annual Energy Outlook 2015
Price case comparisons
Table C4. Petroleum and other liquids supply and disposition (million barrels per day, unless otherwise noted)
Energy Information Administration / Annual Energy Outlook 2015
Table C4. Petroleum and other liquids supply and disposition(million barrels per day, unless otherwise noted)
Supply and disposition 2013
Projections2020 2030 2040
Low oilprice Reference High oil
price Low oilprice Reference High oil
price Low oil price Reference High oil
price
Crude oil Domestic crude production1 .......................... 7.44 9.96 10.60 12.29 8.69 10.04 12.48 7.09 9.43 9.93 Alaska ...................................................... 0.52 0.42 0.42 0.42 0.00 0.24 0.57 0.00 0.34 0.45 Lower 48 states ........................................ 6.92 9.55 10.18 11.87 8.69 9.80 11.92 7.09 9.09 9.48 Net imports .................................................... 7.60 6.02 5.51 5.94 7.07 6.44 6.24 8.05 7.58 8.86 Gross imports ........................................... 7.73 6.65 6.14 6.57 7.70 7.07 6.87 8.68 8.21 9.49 Exports ..................................................... 0.13 0.63 0.63 0.63 0.63 0.63 0.63 0.63 0.63 0.63 Other crude supply2 ...................................... 0.27 0.00 0.00 0.00 0.00 0.00 0.00 0.00 0.00 0.00Total crude supply ........................................... 15.30 15.99 16.11 18.23 15.76 16.48 18.72 15.14 17.01 18.78
Net product imports ........................................... -1.37 -2.19 -2.80 -5.97 -1.88 -3.56 -8.06 -0.71 -4.26 -9.49 Gross refined product imports3...................... 0.82 1.45 1.21 0.88 1.72 1.31 1.27 1.65 1.26 1.31 Unfinished oil imports .................................... 0.66 0.68 0.60 0.49 0.66 0.52 0.39 0.62 0.45 0.31 Blending component imports ......................... 0.60 0.72 0.59 0.51 0.62 0.49 0.50 0.53 0.40 0.44 Exports .......................................................... 3.43 5.04 5.20 7.86 4.88 5.89 10.23 3.51 6.36 11.54Refinery processing gain4 .................................. 1.09 0.96 0.98 1.07 0.94 0.97 0.99 1.00 0.98 1.01Product stock withdrawal ................................... 0.11 0.00 0.00 0.00 0.00 0.00 0.00 0.00 0.00 0.00Natural gas plant liquids..................................... 2.61 3.92 4.04 4.29 3.99 4.19 4.65 3.71 4.07 4.55Supply from renewable sources ......................... 0.93 1.03 1.01 1.02 1.00 1.01 1.05 1.00 1.12 1.25 Ethanol .......................................................... 0.83 0.87 0.84 0.85 0.83 0.84 0.88 0.83 0.95 0.96 Domestic production ................................. 0.85 0.88 0.86 0.86 0.87 0.86 0.87 0.86 0.93 0.90 Net imports ............................................... -0.02 -0.02 -0.02 -0.01 -0.04 -0.02 0.01 -0.02 0.02 0.06 Stock withdrawal ...................................... 0.00 0.00 0.00 0.00 0.00 0.00 0.00 0.00 0.00 0.00 Biodiesel ....................................................... 0.10 0.13 0.14 0.14 0.01 0.11 0.14 0.01 0.11 0.15 Domestic production ................................. 0.09 0.13 0.13 0.13 0.00 0.10 0.13 0.00 0.10 0.14
Net imports ............................................... 0.01 0.00 0.01 0.01 0.01 0.01 0.01 0.01 0.01 0.01 Stock withdrawal ...................................... 0.00 0.00 0.00 0.00 0.00 0.00 0.00 0.00 0.00 0.00 Other biomass-derived liquids5 ..................... 0.00 0.03 0.03 0.03 0.15 0.06 0.03 0.15 0.06 0.15 Domestic production ................................. 0.00 0.03 0.03 0.03 0.15 0.06 0.03 0.15 0.06 0.15
Net imports ............................................... 0.00 0.00 0.00 0.00 0.00 0.00 0.00 0.00 0.00 0.00 Stock withdrawal ...................................... 0.00 0.00 0.00 0.00 0.00 0.00 0.00 0.00 0.00 0.00Liquids from gas ................................................ 0.00 0.00 0.00 0.00 0.00 0.00 0.08 0.00 0.00 0.49Liquids from coal ................................................ 0.00 0.00 0.00 0.00 0.00 0.00 0.24 0.00 0.00 0.71Other6 ................................................................ 0.21 0.27 0.28 0.30 0.29 0.30 0.32 0.29 0.32 0.35
Total primary supply7 ...................................... 18.87 19.98 19.62 18.94 20.10 19.38 18.00 20.43 19.24 17.66
Product supplied by fuel Liquefied petroleum gases and other8 ...... 2.50 2.94 2.91 2.96 3.34 3.30 3.31 3.31 3.25 3.34 Motor gasoline9 ........................................ 8.85 8.80 8.49 7.77 7.94 7.41 6.44 7.86 7.05 6.02
of which: E8510 .................................. 0.01 0.01 0.02 0.13 0.09 0.13 0.36 0.11 0.19 0.52 Jet fuel11 ................................................... 1.43 1.55 1.55 1.53 1.76 1.75 1.73 1.88 1.87 1.86 Distillate fuel oil12 ...................................... 3.83 4.22 4.26 4.16 4.41 4.34 3.91 4.62 4.38 3.77
of which: Diesel ................................. 3.56 3.90 3.94 3.88 4.13 4.09 3.68 4.38 4.17 3.57 Residual fuel oil ........................................ 0.32 0.28 0.27 0.26 0.31 0.28 0.27 0.32 0.28 0.27 Other13...................................................... 2.04 2.20 2.18 2.30 2.36 2.33 2.39 2.45 2.43 2.45 by sector Residential and commercial ..................... 0.86 0.79 0.76 0.69 0.72 0.67 0.60 0.68 0.61 0.54 Industrial14 ................................................ 4.69 5.54 5.50 5.66 6.12 6.04 6.09 6.17 6.09 6.16 Transportation .......................................... 13.36 13.74 13.46 12.70 13.35 12.79 11.42 13.69 12.66 11.04 Electric power15 ........................................ 0.12 0.08 0.08 0.08 0.08 0.08 0.08 0.08 0.08 0.08 Unspecified sector16 ................................. -0.12 -0.15 -0.15 -0.16 -0.17 -0.17 -0.14 -0.18 -0.17 -0.13Total product supplied .................................... 18.96 20.00 19.65 18.97 20.10 19.41 18.04 20.44 19.27 17.70
Discrepancy17 .................................................... -0.10 -0.02 -0.03 -0.03 0.00 -0.03 -0.04 -0.01 -0.03 -0.04
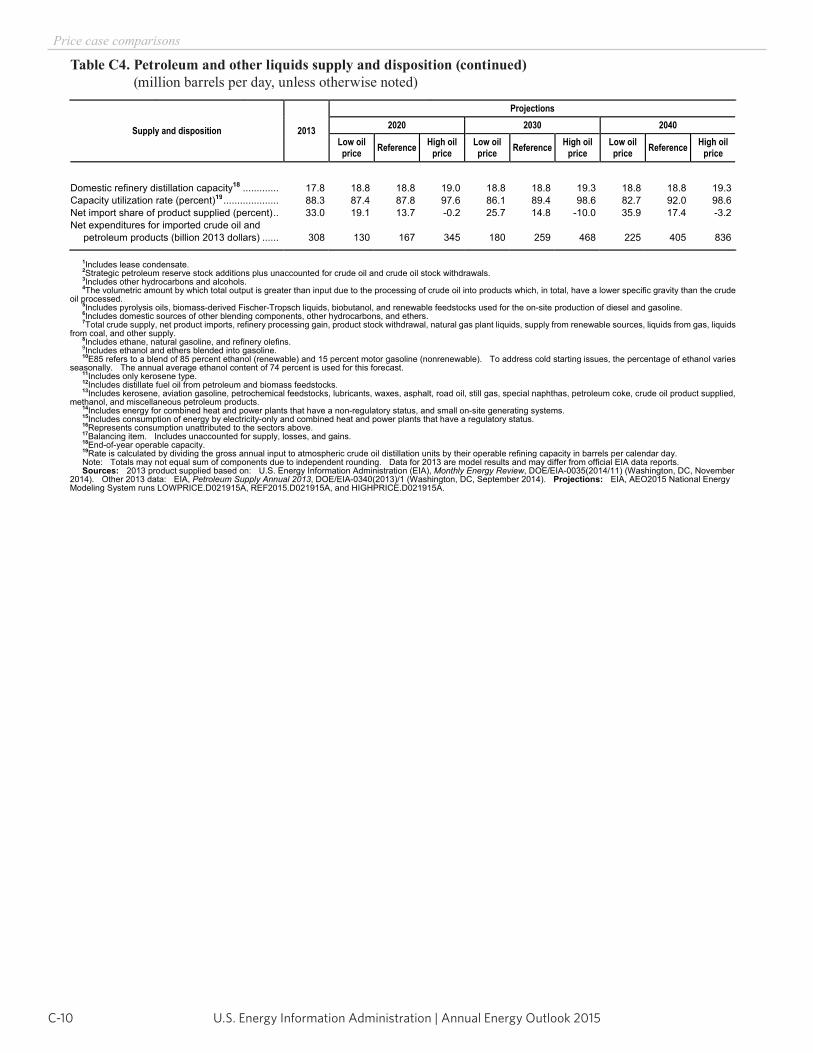
U.S. Energy Information Administration | Annual Energy Outlook 2015C-10
Price case comparisons
Table C4. Petroleum and other liquids supply and disposition (continued) (million barrels per day, unless otherwise noted)
Energy Information Administration / Annual Energy Outlook 2015
Table C4. Petroleum and other liquids supply and disposition (continued)(million barrels per day, unless otherwise noted)
Supply and disposition 2013
Projections2020 2030 2040
Low oilprice Reference High oil
price Low oilprice Reference High oil
price Low oil price Reference High oil
price
Domestic refinery distillation capacity18 ............. 17.8 18.8 18.8 19.0 18.8 18.8 19.3 18.8 18.8 19.3Capacity utilization rate (percent)19 .................... 88.3 87.4 87.8 97.6 86.1 89.4 98.6 82.7 92.0 98.6Net import share of product supplied (percent) .. 33.0 19.1 13.7 -0.2 25.7 14.8 -10.0 35.9 17.4 -3.2Net expenditures for imported crude oil and petroleum products (billion 2013 dollars) ...... 308 130 167 345 180 259 468 225 405 836
1Includes lease condensate. 2Strategic petroleum reserve stock additions plus unaccounted for crude oil and crude oil stock withdrawals. 3Includes other hydrocarbons and alcohols. 4The volumetric amount by which total output is greater than input due to the processing of crude oil into products which, in total, have a lower specific gravity than the crude
oil processed. 5Includes pyrolysis oils, biomass-derived Fischer-Tropsch liquids, biobutanol, and renewable feedstocks used for the on-site production of diesel and gasoline. 6Includes domestic sources of other blending components, other hydrocarbons, and ethers. 7Total crude supply, net product imports, refinery processing gain, product stock withdrawal, natural gas plant liquids, supply from renewable sources, liquids from gas, liquids
from coal, and other supply. 8Includes ethane, natural gasoline, and refinery olefins. 9Includes ethanol and ethers blended into gasoline. 10E85 refers to a blend of 85 percent ethanol (renewable) and 15 percent motor gasoline (nonrenewable). To address cold starting issues, the percentage of ethanol varies
seasonally. The annual average ethanol content of 74 percent is used for this forecast. 11Includes only kerosene type. 12Includes distillate fuel oil from petroleum and biomass feedstocks. 13Includes kerosene, aviation gasoline, petrochemical feedstocks, lubricants, waxes, asphalt, road oil, still gas, special naphthas, petroleum coke, crude oil product supplied,
methanol, and miscellaneous petroleum products. 14Includes energy for combined heat and power plants that have a non-regulatory status, and small on-site generating systems. 15Includes consumption of energy by electricity-only and combined heat and power plants that have a regulatory status. 16Represents consumption unattributed to the sectors above. 17Balancing item. Includes unaccounted for supply, losses, and gains. 18End-of-year operable capacity. 19Rate is calculated by dividing the gross annual input to atmospheric crude oil distillation units by their operable refining capacity in barrels per calendar day. Note: Totals may not equal sum of components due to independent rounding. Data for 2013 are model results and may differ from official EIA data reports. Sources: 2013 product supplied based on: U.S. Energy Information Administration (EIA), Monthly Energy Review, DOE/EIA-0035(2014/11) (Washington, DC, November
2014). Other 2013 data: EIA, Petroleum Supply Annual 2013, DOE/EIA-0340(2013)/1 (Washington, DC, September 2014). Projections: EIA, AEO2015 National Energy Modeling System runs LOWPRICE.D021915A, REF2015.D021915A, and HIGHPRICE.D021915A.
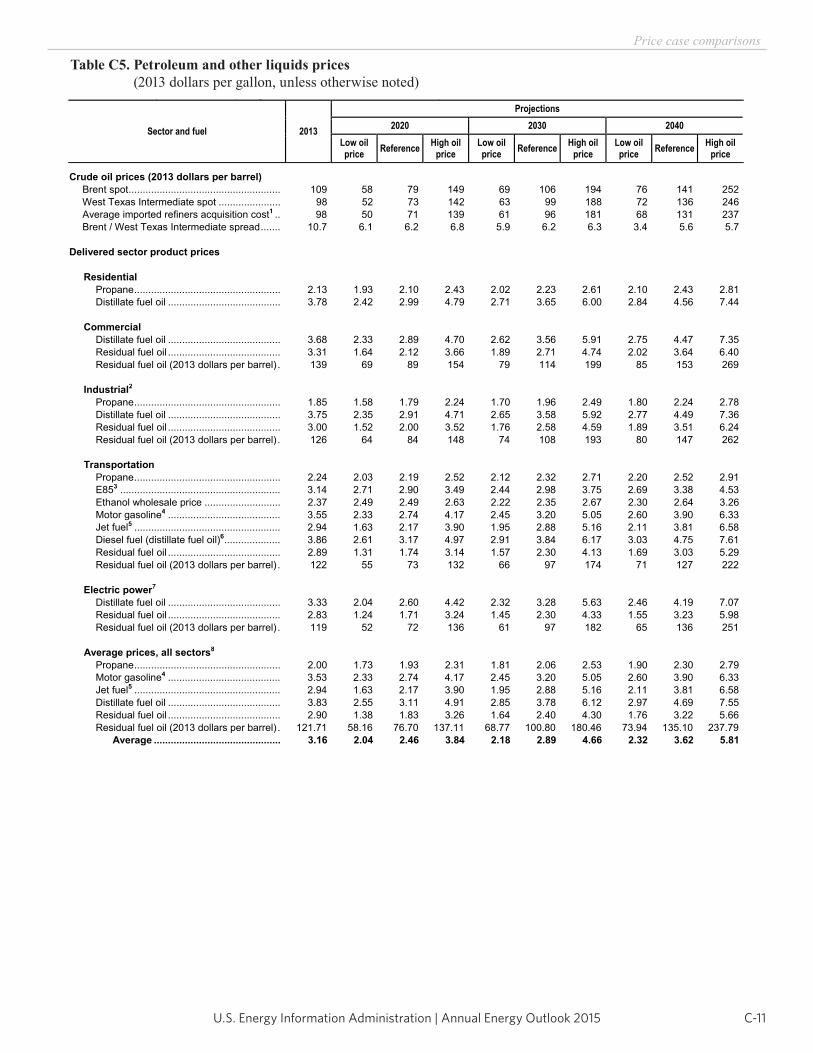
C-11U.S. Energy Information Administration | Annual Energy Outlook 2015
Price case comparisons
Table C5. Petroleum and other liquids prices (2013 dollars per gallon, unless otherwise noted)
Energy Information Administration / Annual Energy Outlook 2015
Table C5. Petroleum and other liquids prices(2013 dollars per gallon, unless otherwise noted)
Sector and fuel 2013
Projections2020 2030 2040
Low oilprice Reference High oil
price Low oilprice Reference High oil
price Low oil price Reference High oil
price
Crude oil prices (2013 dollars per barrel) Brent spot ...................................................... 109 58 79 149 69 106 194 76 141 252
West Texas Intermediate spot ...................... 98 52 73 142 63 99 188 72 136 246 Average imported refiners acquisition cost1 .. 98 50 71 139 61 96 181 68 131 237 Brent / West Texas Intermediate spread ....... 10.7 6.1 6.2 6.8 5.9 6.2 6.3 3.4 5.6 5.7
Delivered sector product prices
Residential Propane .................................................... 2.13 1.93 2.10 2.43 2.02 2.23 2.61 2.10 2.43 2.81 Distillate fuel oil ........................................ 3.78 2.42 2.99 4.79 2.71 3.65 6.00 2.84 4.56 7.44
Commercial Distillate fuel oil ........................................ 3.68 2.33 2.89 4.70 2.62 3.56 5.91 2.75 4.47 7.35 Residual fuel oil ........................................ 3.31 1.64 2.12 3.66 1.89 2.71 4.74 2.02 3.64 6.40 Residual fuel oil (2013 dollars per barrel) . 139 69 89 154 79 114 199 85 153 269
Industrial2 Propane .................................................... 1.85 1.58 1.79 2.24 1.70 1.96 2.49 1.80 2.24 2.78 Distillate fuel oil ........................................ 3.75 2.35 2.91 4.71 2.65 3.58 5.92 2.77 4.49 7.36 Residual fuel oil ........................................ 3.00 1.52 2.00 3.52 1.76 2.58 4.59 1.89 3.51 6.24 Residual fuel oil (2013 dollars per barrel) . 126 64 84 148 74 108 193 80 147 262
Transportation Propane .................................................... 2.24 2.03 2.19 2.52 2.12 2.32 2.71 2.20 2.52 2.91 E853 ......................................................... 3.14 2.71 2.90 3.49 2.44 2.98 3.75 2.69 3.38 4.53 Ethanol wholesale price ........................... 2.37 2.49 2.49 2.63 2.22 2.35 2.67 2.30 2.64 3.26 Motor gasoline4 ........................................ 3.55 2.33 2.74 4.17 2.45 3.20 5.05 2.60 3.90 6.33 Jet fuel5 .................................................... 2.94 1.63 2.17 3.90 1.95 2.88 5.16 2.11 3.81 6.58 Diesel fuel (distillate fuel oil)6.................... 3.86 2.61 3.17 4.97 2.91 3.84 6.17 3.03 4.75 7.61 Residual fuel oil ........................................ 2.89 1.31 1.74 3.14 1.57 2.30 4.13 1.69 3.03 5.29 Residual fuel oil (2013 dollars per barrel) . 122 55 73 132 66 97 174 71 127 222
Electric power7
Distillate fuel oil ........................................ 3.33 2.04 2.60 4.42 2.32 3.28 5.63 2.46 4.19 7.07 Residual fuel oil ........................................ 2.83 1.24 1.71 3.24 1.45 2.30 4.33 1.55 3.23 5.98 Residual fuel oil (2013 dollars per barrel) . 119 52 72 136 61 97 182 65 136 251
Average prices, all sectors8
Propane .................................................... 2.00 1.73 1.93 2.31 1.81 2.06 2.53 1.90 2.30 2.79 Motor gasoline4 ........................................ 3.53 2.33 2.74 4.17 2.45 3.20 5.05 2.60 3.90 6.33 Jet fuel5 .................................................... 2.94 1.63 2.17 3.90 1.95 2.88 5.16 2.11 3.81 6.58 Distillate fuel oil ........................................ 3.83 2.55 3.11 4.91 2.85 3.78 6.12 2.97 4.69 7.55 Residual fuel oil ........................................ 2.90 1.38 1.83 3.26 1.64 2.40 4.30 1.76 3.22 5.66 Residual fuel oil (2013 dollars per barrel) . 121.71 58.16 76.70 137.11 68.77 100.80 180.46 73.94 135.10 237.79
Average ............................................. 3.16 2.04 2.46 3.84 2.18 2.89 4.66 2.32 3.62 5.81
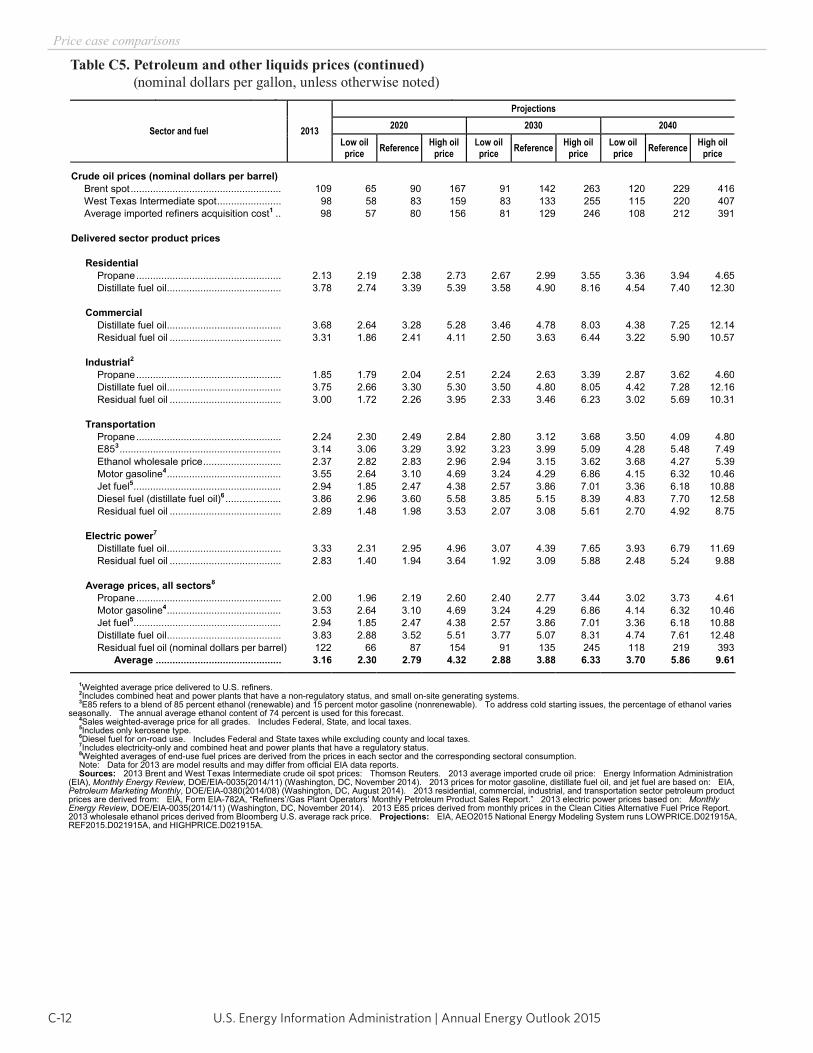
U.S. Energy Information Administration | Annual Energy Outlook 2015C-12
Price case comparisons
Table C5. Petroleum and other liquids prices (continued) (nominal dollars per gallon, unless otherwise noted)
Energy Information Administration / Annual Energy Outlook 2015
Table C5. Petroleum and other liquids prices (continued)(nominal dollars per gallon, unless otherwise noted)
Sector and fuel 2013
Projections2020 2030 2040
Low oilprice Reference High oil
price Low oilprice Reference High oil
price Low oil price Reference High oil
price
Crude oil prices (nominal dollars per barrel) Brent spot ...................................................... 109 65 90 167 91 142 263 120 229 416
West Texas Intermediate spot ....................... 98 58 83 159 83 133 255 115 220 407 Average imported refiners acquisition cost1 .. 98 57 80 156 81 129 246 108 212 391
Delivered sector product prices
Residential Propane .................................................... 2.13 2.19 2.38 2.73 2.67 2.99 3.55 3.36 3.94 4.65 Distillate fuel oil ......................................... 3.78 2.74 3.39 5.39 3.58 4.90 8.16 4.54 7.40 12.30
Commercial Distillate fuel oil ......................................... 3.68 2.64 3.28 5.28 3.46 4.78 8.03 4.38 7.25 12.14 Residual fuel oil ........................................ 3.31 1.86 2.41 4.11 2.50 3.63 6.44 3.22 5.90 10.57
Industrial2 Propane .................................................... 1.85 1.79 2.04 2.51 2.24 2.63 3.39 2.87 3.62 4.60 Distillate fuel oil ......................................... 3.75 2.66 3.30 5.30 3.50 4.80 8.05 4.42 7.28 12.16 Residual fuel oil ........................................ 3.00 1.72 2.26 3.95 2.33 3.46 6.23 3.02 5.69 10.31
Transportation Propane .................................................... 2.24 2.30 2.49 2.84 2.80 3.12 3.68 3.50 4.09 4.80 E853 .......................................................... 3.14 3.06 3.29 3.92 3.23 3.99 5.09 4.28 5.48 7.49 Ethanol wholesale price ............................ 2.37 2.82 2.83 2.96 2.94 3.15 3.62 3.68 4.27 5.39 Motor gasoline4 ......................................... 3.55 2.64 3.10 4.69 3.24 4.29 6.86 4.15 6.32 10.46 Jet fuel5..................................................... 2.94 1.85 2.47 4.38 2.57 3.86 7.01 3.36 6.18 10.88 Diesel fuel (distillate fuel oil)6 .................... 3.86 2.96 3.60 5.58 3.85 5.15 8.39 4.83 7.70 12.58 Residual fuel oil ........................................ 2.89 1.48 1.98 3.53 2.07 3.08 5.61 2.70 4.92 8.75
Electric power7
Distillate fuel oil ......................................... 3.33 2.31 2.95 4.96 3.07 4.39 7.65 3.93 6.79 11.69 Residual fuel oil ........................................ 2.83 1.40 1.94 3.64 1.92 3.09 5.88 2.48 5.24 9.88
Average prices, all sectors8
Propane .................................................... 2.00 1.96 2.19 2.60 2.40 2.77 3.44 3.02 3.73 4.61 Motor gasoline4 ......................................... 3.53 2.64 3.10 4.69 3.24 4.29 6.86 4.14 6.32 10.46 Jet fuel5..................................................... 2.94 1.85 2.47 4.38 2.57 3.86 7.01 3.36 6.18 10.88 Distillate fuel oil ......................................... 3.83 2.88 3.52 5.51 3.77 5.07 8.31 4.74 7.61 12.48 Residual fuel oil (nominal dollars per barrel) 122 66 87 154 91 135 245 118 219 393
Average ............................................. 3.16 2.30 2.79 4.32 2.88 3.88 6.33 3.70 5.86 9.61
1Weighted average price delivered to U.S. refiners. 2Includes combined heat and power plants that have a non-regulatory status, and small on-site generating systems. 3E85 refers to a blend of 85 percent ethanol (renewable) and 15 percent motor gasoline (nonrenewable). To address cold starting issues, the percentage of ethanol varies
seasonally. The annual average ethanol content of 74 percent is used for this forecast. 4Sales weighted-average price for all grades. Includes Federal, State, and local taxes. 5Includes only kerosene type. 6Diesel fuel for on-road use. Includes Federal and State taxes while excluding county and local taxes. 7Includes electricity-only and combined heat and power plants that have a regulatory status. 8Weighted averages of end-use fuel prices are derived from the prices in each sector and the corresponding sectoral consumption.Note: Data for 2013 are model results and may differ from official EIA data reports. Sources: 2013 Brent and West Texas Intermediate crude oil spot prices: Thomson Reuters. 2013 average imported crude oil price: Energy Information Administration
(EIA), Monthly Energy Review, DOE/EIA-0035(2014/11) (Washington, DC, November 2014). 2013 prices for motor gasoline, distillate fuel oil, and jet fuel are based on: EIA, Petroleum Marketing Monthly, DOE/EIA-0380(2014/08) (Washington, DC, August 2014). 2013 residential, commercial, industrial, and transportation sector petroleum product prices are derived from: EIA, Form EIA-782A, “Refiners’/Gas Plant Operators’ Monthly Petroleum Product Sales Report.” 2013 electric power prices based on: Monthly Energy Review, DOE/EIA-0035(2014/11) (Washington, DC, November 2014). 2013 E85 prices derived from monthly prices in the Clean Cities Alternative Fuel Price Report. 2013 wholesale ethanol prices derived from Bloomberg U.S. average rack price. Projections: EIA, AEO2015 National Energy Modeling System runs LOWPRICE.D021915A, REF2015.D021915A, and HIGHPRICE.D021915A.
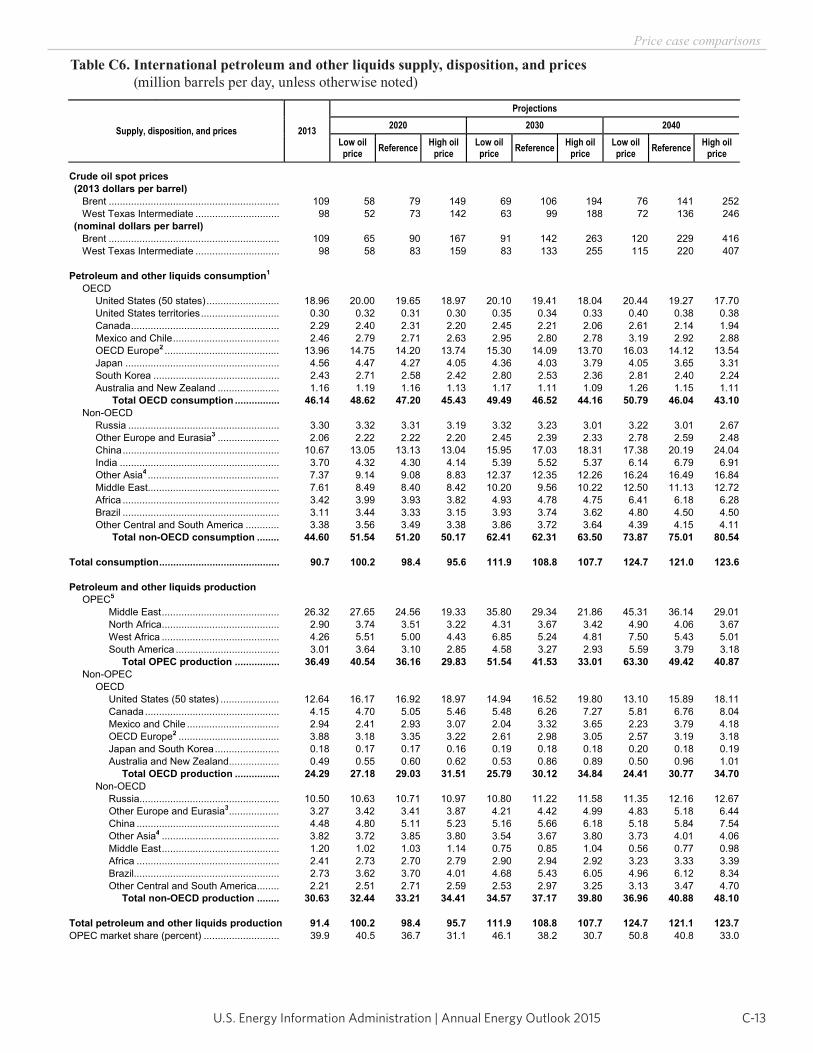
C-13U.S. Energy Information Administration | Annual Energy Outlook 2015
Price case comparisons
Table C6. International petroleum and other liquids supply, disposition, and prices (million barrels per day, unless otherwise noted)
Energy Information Administration / Annual Energy Outlook 2015
Table C6. International petroleum and other liquids supply, disposition, and prices(million barrels per day, unless otherwise noted)
Supply, disposition, and prices 2013
Projections2020 2030 2040
Low oilprice Reference High oil
price Low oilprice Reference High oil
price Low oil price Reference High oil
price
Crude oil spot prices (2013 dollars per barrel) Brent ............................................................. 109 58 79 149 69 106 194 76 141 252
West Texas Intermediate .............................. 98 52 73 142 63 99 188 72 136 246 (nominal dollars per barrel) Brent ............................................................. 109 65 90 167 91 142 263 120 229 416
West Texas Intermediate .............................. 98 58 83 159 83 133 255 115 220 407
Petroleum and other liquids consumption1
OECD United States (50 states) .......................... 18.96 20.00 19.65 18.97 20.10 19.41 18.04 20.44 19.27 17.70 United States territories ............................ 0.30 0.32 0.31 0.30 0.35 0.34 0.33 0.40 0.38 0.38 Canada ..................................................... 2.29 2.40 2.31 2.20 2.45 2.21 2.06 2.61 2.14 1.94 Mexico and Chile ...................................... 2.46 2.79 2.71 2.63 2.95 2.80 2.78 3.19 2.92 2.88 OECD Europe2 ......................................... 13.96 14.75 14.20 13.74 15.30 14.09 13.70 16.03 14.12 13.54 Japan ....................................................... 4.56 4.47 4.27 4.05 4.36 4.03 3.79 4.05 3.65 3.31 South Korea ............................................. 2.43 2.71 2.58 2.42 2.80 2.53 2.36 2.81 2.40 2.24 Australia and New Zealand ...................... 1.16 1.19 1.16 1.13 1.17 1.11 1.09 1.26 1.15 1.11
Total OECD consumption ................ 46.14 48.62 47.20 45.43 49.49 46.52 44.16 50.79 46.04 43.10 Non-OECD Russia ...................................................... 3.30 3.32 3.31 3.19 3.32 3.23 3.01 3.22 3.01 2.67 Other Europe and Eurasia3 ...................... 2.06 2.22 2.22 2.20 2.45 2.39 2.33 2.78 2.59 2.48 China ........................................................ 10.67 13.05 13.13 13.04 15.95 17.03 18.31 17.38 20.19 24.04 India ......................................................... 3.70 4.32 4.30 4.14 5.39 5.52 5.37 6.14 6.79 6.91 Other Asia4 ............................................... 7.37 9.14 9.08 8.83 12.37 12.35 12.26 16.24 16.49 16.84 Middle East............................................... 7.61 8.49 8.40 8.42 10.20 9.56 10.22 12.50 11.13 12.72 Africa ........................................................ 3.42 3.99 3.93 3.82 4.93 4.78 4.75 6.41 6.18 6.28 Brazil ........................................................ 3.11 3.44 3.33 3.15 3.93 3.74 3.62 4.80 4.50 4.50 Other Central and South America ............ 3.38 3.56 3.49 3.38 3.86 3.72 3.64 4.39 4.15 4.11
Total non-OECD consumption ........ 44.60 51.54 51.20 50.17 62.41 62.31 63.50 73.87 75.01 80.54
Total consumption ........................................... 90.7 100.2 98.4 95.6 111.9 108.8 107.7 124.7 121.0 123.6
Petroleum and other liquids production OPEC5
Middle East .......................................... 26.32 27.65 24.56 19.33 35.80 29.34 21.86 45.31 36.14 29.01 North Africa .......................................... 2.90 3.74 3.51 3.22 4.31 3.67 3.42 4.90 4.06 3.67 West Africa .......................................... 4.26 5.51 5.00 4.43 6.85 5.24 4.81 7.50 5.43 5.01 South America ..................................... 3.01 3.64 3.10 2.85 4.58 3.27 2.93 5.59 3.79 3.18 Total OPEC production ................ 36.49 40.54 36.16 29.83 51.54 41.53 33.01 63.30 49.42 40.87
Non-OPEC OECD
United States (50 states) ..................... 12.64 16.17 16.92 18.97 14.94 16.52 19.80 13.10 15.89 18.11 Canada ................................................ 4.15 4.70 5.05 5.46 5.48 6.26 7.27 5.81 6.76 8.04 Mexico and Chile ................................. 2.94 2.41 2.93 3.07 2.04 3.32 3.65 2.23 3.79 4.18 OECD Europe2 .................................... 3.88 3.18 3.35 3.22 2.61 2.98 3.05 2.57 3.19 3.18 Japan and South Korea ....................... 0.18 0.17 0.17 0.16 0.19 0.18 0.18 0.20 0.18 0.19 Australia and New Zealand .................. 0.49 0.55 0.60 0.62 0.53 0.86 0.89 0.50 0.96 1.01 Total OECD production ................ 24.29 27.18 29.03 31.51 25.79 30.12 34.84 24.41 30.77 34.70
Non-OECD Russia.................................................. 10.50 10.63 10.71 10.97 10.80 11.22 11.58 11.35 12.16 12.67 Other Europe and Eurasia3 .................. 3.27 3.42 3.41 3.87 4.21 4.42 4.99 4.83 5.18 6.44 China ................................................... 4.48 4.80 5.11 5.23 5.16 5.66 6.18 5.18 5.84 7.54 Other Asia4 .......................................... 3.82 3.72 3.85 3.80 3.54 3.67 3.80 3.73 4.01 4.06 Middle East .......................................... 1.20 1.02 1.03 1.14 0.75 0.85 1.04 0.56 0.77 0.98 Africa ................................................... 2.41 2.73 2.70 2.79 2.90 2.94 2.92 3.23 3.33 3.39 Brazil.................................................... 2.73 3.62 3.70 4.01 4.68 5.43 6.05 4.96 6.12 8.34 Other Central and South America ........ 2.21 2.51 2.71 2.59 2.53 2.97 3.25 3.13 3.47 4.70 Total non-OECD production ........ 30.63 32.44 33.21 34.41 34.57 37.17 39.80 36.96 40.88 48.10
Total petroleum and other liquids production 91.4 100.2 98.4 95.7 111.9 108.8 107.7 124.7 121.1 123.7OPEC market share (percent) ........................... 39.9 40.5 36.7 31.1 46.1 38.2 30.7 50.8 40.8 33.0
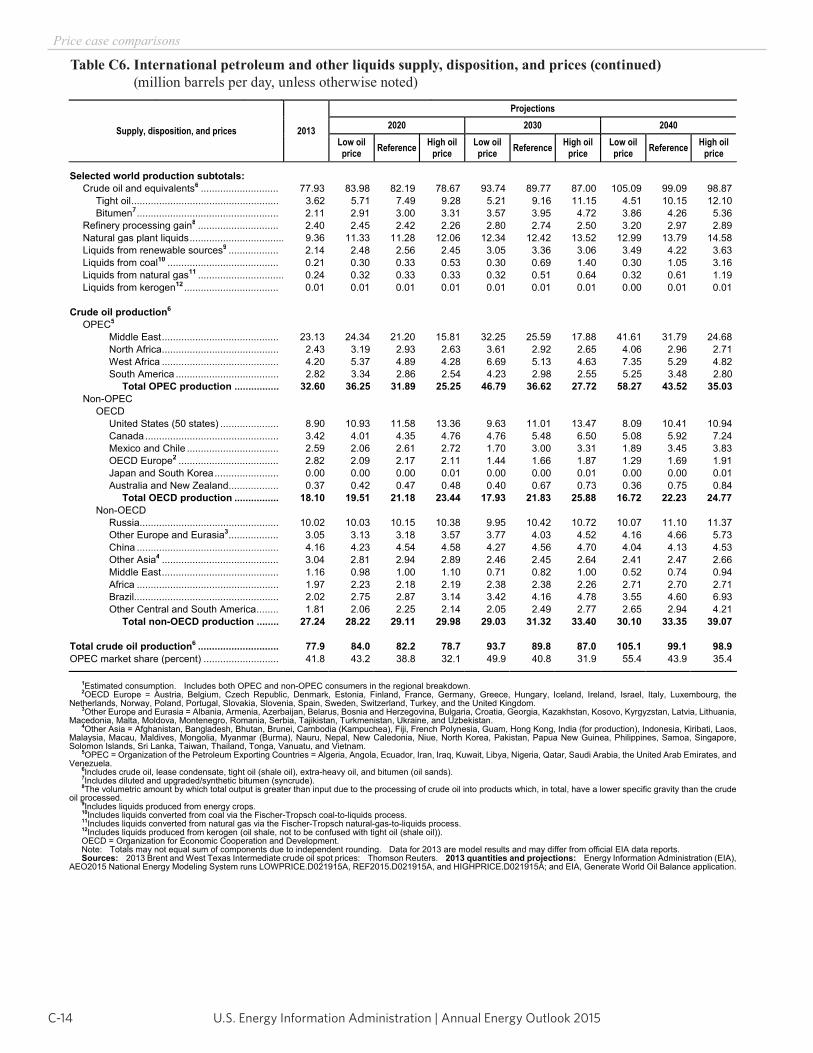
U.S. Energy Information Administration | Annual Energy Outlook 2015C-14
Price case comparisons
Table C6. International petroleum and other liquids supply, disposition, and prices (continued) (million barrels per day, unless otherwise noted)
Energy Information Administration / Annual Energy Outlook 2015
Table C6. International petroleum and other liquids supply, disposition, and prices (continued)(million barrels per day, unless otherwise noted)
Supply, disposition, and prices 2013
Projections2020 2030 2040
Low oilprice Reference High oil
price Low oilprice Reference High oil
price Low oil price Reference High oil
price
Selected world production subtotals: Crude oil and equivalents6 ............................ 77.93 83.98 82.19 78.67 93.74 89.77 87.00 105.09 99.09 98.87 Tight oil ..................................................... 3.62 5.71 7.49 9.28 5.21 9.16 11.15 4.51 10.15 12.10 Bitumen7 ................................................... 2.11 2.91 3.00 3.31 3.57 3.95 4.72 3.86 4.26 5.36 Refinery processing gain8 ............................. 2.40 2.45 2.42 2.26 2.80 2.74 2.50 3.20 2.97 2.89
Natural gas plant liquids .................................. 9.36 11.33 11.28 12.06 12.34 12.42 13.52 12.99 13.79 14.58 Liquids from renewable sources9 .................. 2.14 2.48 2.56 2.45 3.05 3.36 3.06 3.49 4.22 3.63
Liquids from coal10 ........................................ 0.21 0.30 0.33 0.53 0.30 0.69 1.40 0.30 1.05 3.16 Liquids from natural gas11 ............................... 0.24 0.32 0.33 0.33 0.32 0.51 0.64 0.32 0.61 1.19 Liquids from kerogen12 .................................. 0.01 0.01 0.01 0.01 0.01 0.01 0.01 0.00 0.01 0.01
Crude oil production6
OPEC5
Middle East .......................................... 23.13 24.34 21.20 15.81 32.25 25.59 17.88 41.61 31.79 24.68 North Africa .......................................... 2.43 3.19 2.93 2.63 3.61 2.92 2.65 4.06 2.96 2.71 West Africa .......................................... 4.20 5.37 4.89 4.28 6.69 5.13 4.63 7.35 5.29 4.82 South America ..................................... 2.82 3.34 2.86 2.54 4.23 2.98 2.55 5.25 3.48 2.80 Total OPEC production ................ 32.60 36.25 31.89 25.25 46.79 36.62 27.72 58.27 43.52 35.03
Non-OPEC OECD
United States (50 states) ..................... 8.90 10.93 11.58 13.36 9.63 11.01 13.47 8.09 10.41 10.94 Canada ................................................ 3.42 4.01 4.35 4.76 4.76 5.48 6.50 5.08 5.92 7.24 Mexico and Chile ................................. 2.59 2.06 2.61 2.72 1.70 3.00 3.31 1.89 3.45 3.83 OECD Europe2 .................................... 2.82 2.09 2.17 2.11 1.44 1.66 1.87 1.29 1.69 1.91 Japan and South Korea ....................... 0.00 0.00 0.00 0.01 0.00 0.00 0.01 0.00 0.00 0.01 Australia and New Zealand .................. 0.37 0.42 0.47 0.48 0.40 0.67 0.73 0.36 0.75 0.84 Total OECD production ................ 18.10 19.51 21.18 23.44 17.93 21.83 25.88 16.72 22.23 24.77
Non-OECD Russia.................................................. 10.02 10.03 10.15 10.38 9.95 10.42 10.72 10.07 11.10 11.37 Other Europe and Eurasia3 .................. 3.05 3.13 3.18 3.57 3.77 4.03 4.52 4.16 4.66 5.73 China ................................................... 4.16 4.23 4.54 4.58 4.27 4.56 4.70 4.04 4.13 4.53 Other Asia4 .......................................... 3.04 2.81 2.94 2.89 2.46 2.45 2.64 2.41 2.47 2.66 Middle East .......................................... 1.16 0.98 1.00 1.10 0.71 0.82 1.00 0.52 0.74 0.94 Africa ................................................... 1.97 2.23 2.18 2.19 2.38 2.38 2.26 2.71 2.70 2.71 Brazil.................................................... 2.02 2.75 2.87 3.14 3.42 4.16 4.78 3.55 4.60 6.93 Other Central and South America ........ 1.81 2.06 2.25 2.14 2.05 2.49 2.77 2.65 2.94 4.21 Total non-OECD production ........ 27.24 28.22 29.11 29.98 29.03 31.32 33.40 30.10 33.35 39.07
Total crude oil production6 ............................. 77.9 84.0 82.2 78.7 93.7 89.8 87.0 105.1 99.1 98.9OPEC market share (percent) ........................... 41.8 43.2 38.8 32.1 49.9 40.8 31.9 55.4 43.9 35.4
1Estimated consumption. Includes both OPEC and non-OPEC consumers in the regional breakdown. 2OECD Europe = Austria, Belgium, Czech Republic, Denmark, Estonia, Finland, France, Germany, Greece, Hungary, Iceland, Ireland, Israel, Italy, Luxembourg, the
Netherlands, Norway, Poland, Portugal, Slovakia, Slovenia, Spain, Sweden, Switzerland, Turkey, and the United Kingdom. 3Other Europe and Eurasia = Albania, Armenia, Azerbaijan, Belarus, Bosnia and Herzegovina, Bulgaria, Croatia, Georgia, Kazakhstan, Kosovo, Kyrgyzstan, Latvia, Lithuania,
Macedonia, Malta, Moldova, Montenegro, Romania, Serbia, Tajikistan, Turkmenistan, Ukraine, and Uzbekistan. 4Other Asia = Afghanistan, Bangladesh, Bhutan, Brunei, Cambodia (Kampuchea), Fiji, French Polynesia, Guam, Hong Kong, India (for production), Indonesia, Kiribati, Laos,
Malaysia, Macau, Maldives, Mongolia, Myanmar (Burma), Nauru, Nepal, New Caledonia, Niue, North Korea, Pakistan, Papua New Guinea, Philippines, Samoa, Singapore, Solomon Islands, Sri Lanka, Taiwan, Thailand, Tonga, Vanuatu, and Vietnam.
5OPEC = Organization of the Petroleum Exporting Countries = Algeria, Angola, Ecuador, Iran, Iraq, Kuwait, Libya, Nigeria, Qatar, Saudi Arabia, the United Arab Emirates, and Venezuela.
6Includes crude oil, lease condensate, tight oil (shale oil), extra-heavy oil, and bitumen (oil sands). 7Includes diluted and upgraded/synthetic bitumen (syncrude). 8The volumetric amount by which total output is greater than input due to the processing of crude oil into products which, in total, have a lower specific gravity than the crude
oil processed. 9Includes liquids produced from energy crops. 10Includes liquids converted from coal via the Fischer-Tropsch coal-to-liquids process. 11Includes liquids converted from natural gas via the Fischer-Tropsch natural-gas-to-liquids process. 12Includes liquids produced from kerogen (oil shale, not to be confused with tight oil (shale oil)). OECD = Organization for Economic Cooperation and Development. Note: Totals may not equal sum of components due to independent rounding. Data for 2013 are model results and may differ from official EIA data reports. Sources: 2013 Brent and West Texas Intermediate crude oil spot prices: Thomson Reuters. 2013 quantities and projections: Energy Information Administration (EIA),
AEO2015 National Energy Modeling System runs LOWPRICE.D021915A, REF2015.D021915A, and HIGHPRICE.D021915A; and EIA, Generate World Oil Balance application.
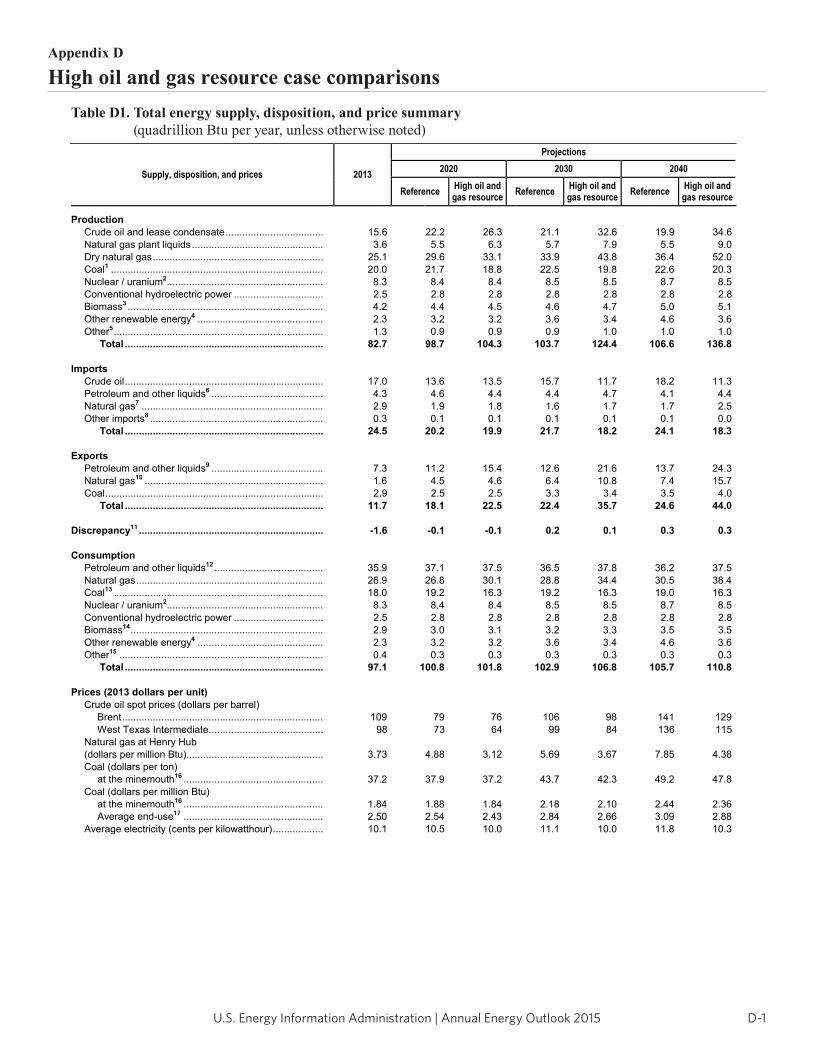
D-1U.S. Energy Information Administration | Annual Energy Outlook 2015
1
Table D1. Total energy supply, disposition, and price summary(quadrillion Btu per year, unless otherwise noted)
Supply, disposition, and prices 2013
Projections 2020 2030 2040
Reference High oil andgas resource Reference High oil and
gas resource Reference High oil andgas resource
Production Crude oil and lease condensate ................................... 15.6 22.2 26.3 21.1 32.6 19.9 34.6
Natural gas plant liquids ............................................... 3.6 5.5 6.3 5.7 7.9 5.5 9.0 Dry natural gas ............................................................. 25.1 29.6 33.1 33.9 43.8 36.4 52.0 Coal1 ............................................................................ 20.0 21.7 18.8 22.5 19.8 22.6 20.3 Nuclear / uranium2........................................................ 8.3 8.4 8.4 8.5 8.5 8.7 8.5 Conventional hydroelectric power ................................ 2.5 2.8 2.8 2.8 2.8 2.8 2.8 Biomass3 ...................................................................... 4.2 4.4 4.5 4.6 4.7 5.0 5.1 Other renewable energy4 ............................................. 2.3 3.2 3.2 3.6 3.4 4.6 3.6 Other5 ........................................................................... 1.3 0.9 0.9 0.9 1.0 1.0 1.0 Total ....................................................................... 82.7 98.7 104.3 103.7 124.4 106.6 136.8
Imports Crude oil ....................................................................... 17.0 13.6 13.5 15.7 11.7 18.2 11.3
Petroleum and other liquids6 ........................................ 4.3 4.6 4.4 4.4 4.7 4.1 4.4 Natural gas7 ................................................................. 2.9 1.9 1.8 1.6 1.7 1.7 2.5 Other imports8 .............................................................. 0.3 0.1 0.1 0.1 0.1 0.1 0.0 Total ....................................................................... 24.5 20.2 19.9 21.7 18.2 24.1 18.3
Exports Petroleum and other liquids9 ........................................ 7.3 11.2 15.4 12.6 21.6 13.7 24.3
Natural gas10 ................................................................ 1.6 4.5 4.6 6.4 10.8 7.4 15.7 Coal .............................................................................. 2.9 2.5 2.5 3.3 3.4 3.5 4.0 Total ....................................................................... 11.7 18.1 22.5 22.4 35.7 24.6 44.0
Discrepancy11 .................................................................. -1.6 -0.1 -0.1 0.2 0.1 0.3 0.3
Consumption Petroleum and other liquids12 ....................................... 35.9 37.1 37.5 36.5 37.8 36.2 37.5
Natural gas ................................................................... 26.9 26.8 30.1 28.8 34.4 30.5 38.4 Coal13 ........................................................................... 18.0 19.2 16.3 19.2 16.3 19.0 16.3 Nuclear / uranium2........................................................ 8.3 8.4 8.4 8.5 8.5 8.7 8.5 Conventional hydroelectric power ................................ 2.5 2.8 2.8 2.8 2.8 2.8 2.8 Biomass14 ..................................................................... 2.9 3.0 3.1 3.2 3.3 3.5 3.5 Other renewable energy4 ............................................. 2.3 3.2 3.2 3.6 3.4 4.6 3.6 Other15 ......................................................................... 0.4 0.3 0.3 0.3 0.3 0.3 0.3 Total ....................................................................... 97.1 100.8 101.8 102.9 106.8 105.7 110.8
Prices (2013 dollars per unit) Crude oil spot prices (dollars per barrel)
Brent ........................................................................ 109 79 76 106 98 141 129 West Texas Intermediate ......................................... 98 73 64 99 84 136 115 Natural gas at Henry Hub
(dollars per million Btu)................................................. 3.73 4.88 3.12 5.69 3.67 7.85 4.38 Coal (dollars per ton) at the minemouth16 .................................................. 37.2 37.9 37.2 43.7 42.3 49.2 47.8 Coal (dollars per million Btu) at the minemouth16 .................................................. 1.84 1.88 1.84 2.18 2.10 2.44 2.36 Average end-use17 .................................................. 2.50 2.54 2.43 2.84 2.66 3.09 2.88 Average electricity (cents per kilowatthour) .................. 10.1 10.5 10.0 11.1 10.0 11.8 10.3
Appendix D
High oil and gas resource case comparisonsTable D1. Total energy supply, disposition, and price summary
(quadrillion Btu per year, unless otherwise noted)
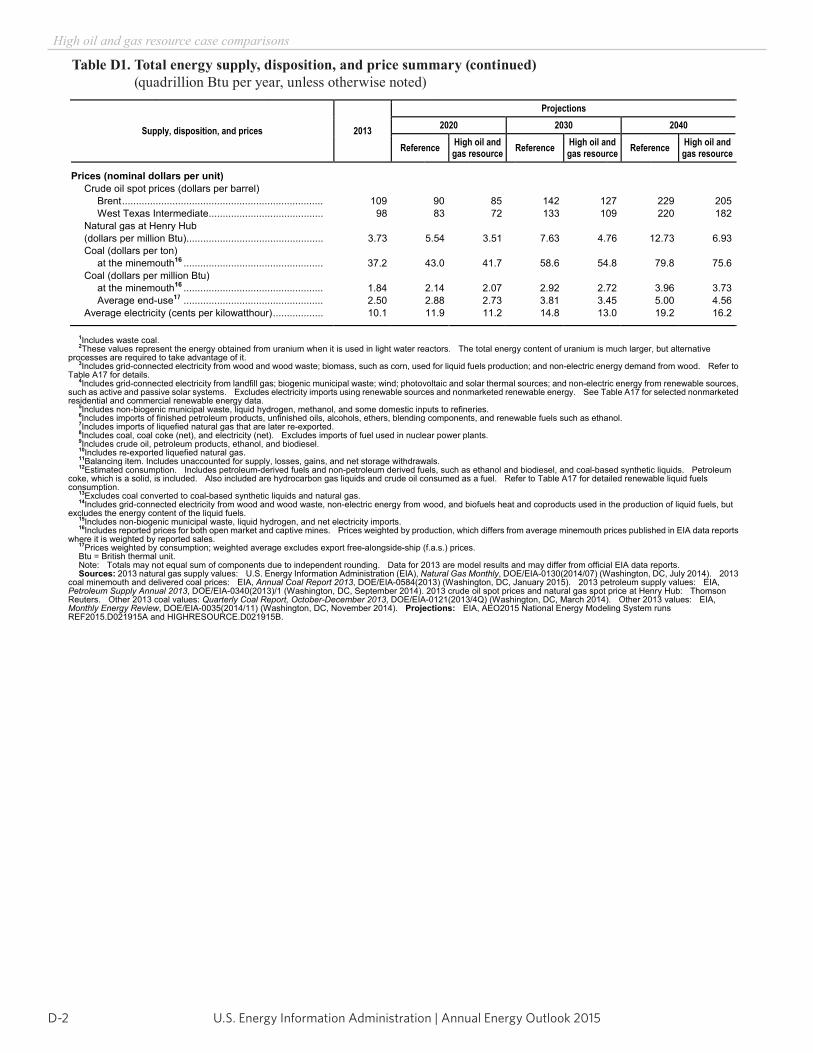
U.S. Energy Information Administration | Annual Energy Outlook 2015D-2
High oil and gas resource case comparisons
Table D1. Total energy supply, disposition, and price summary (continued) (quadrillion Btu per year, unless otherwise noted)
Energy Information Administration / Annual Energy Outlook 2015
Table D1. Total energy supply, disposition, and price summary (continued)(quadrillion Btu per year, unless otherwise noted)
Supply, disposition, and prices 2013
Projections 2020 2030 2040
Reference High oil andgas resource Reference High oil and
gas resource Reference High oil andgas resource
Prices (nominal dollars per unit) Crude oil spot prices (dollars per barrel)
Brent ........................................................................ 109 90 85 142 127 229 205 West Texas Intermediate ......................................... 98 83 72 133 109 220 182 Natural gas at Henry Hub
(dollars per million Btu)................................................. 3.73 5.54 3.51 7.63 4.76 12.73 6.93 Coal (dollars per ton) at the minemouth16 .................................................. 37.2 43.0 41.7 58.6 54.8 79.8 75.6 Coal (dollars per million Btu) at the minemouth16 .................................................. 1.84 2.14 2.07 2.92 2.72 3.96 3.73 Average end-use17 .................................................. 2.50 2.88 2.73 3.81 3.45 5.00 4.56 Average electricity (cents per kilowatthour) .................. 10.1 11.9 11.2 14.8 13.0 19.2 16.2
1Includes waste coal. 2These values represent the energy obtained from uranium when it is used in light water reactors. The total energy content of uranium is much larger, but alternative
processes are required to take advantage of it. 3Includes grid-connected electricity from wood and wood waste; biomass, such as corn, used for liquid fuels production; and non-electric energy demand from wood. Refer to
Table A17 for details. 4Includes grid-connected electricity from landfill gas; biogenic municipal waste; wind; photovoltaic and solar thermal sources; and non-electric energy from renewable sources,
such as active and passive solar systems. Excludes electricity imports using renewable sources and nonmarketed renewable energy. See Table A17 for selected nonmarketed residential and commercial renewable energy data.
5Includes non-biogenic municipal waste, liquid hydrogen, methanol, and some domestic inputs to refineries. 6Includes imports of finished petroleum products, unfinished oils, alcohols, ethers, blending components, and renewable fuels such as ethanol. 7Includes imports of liquefied natural gas that are later re-exported. 8Includes coal, coal coke (net), and electricity (net). Excludes imports of fuel used in nuclear power plants. 9Includes crude oil, petroleum products, ethanol, and biodiesel. 10Includes re-exported liquefied natural gas. 11Balancing item. Includes unaccounted for supply, losses, gains, and net storage withdrawals. 12Estimated consumption. Includes petroleum-derived fuels and non-petroleum derived fuels, such as ethanol and biodiesel, and coal-based synthetic liquids. Petroleum
coke, which is a solid, is included. Also included are hydrocarbon gas liquids and crude oil consumed as a fuel. Refer to Table A17 for detailed renewable liquid fuels consumption.
13Excludes coal converted to coal-based synthetic liquids and natural gas. 14Includes grid-connected electricity from wood and wood waste, non-electric energy from wood, and biofuels heat and coproducts used in the production of liquid fuels, but
excludes the energy content of the liquid fuels. 15Includes non-biogenic municipal waste, liquid hydrogen, and net electricity imports. 16Includes reported prices for both open market and captive mines. Prices weighted by production, which differs from average minemouth prices published in EIA data reports
where it is weighted by reported sales. 17Prices weighted by consumption; weighted average excludes export free-alongside-ship (f.a.s.) prices. Btu = British thermal unit. Note: Totals may not equal sum of components due to independent rounding. Data for 2013 are model results and may differ from official EIA data reports. Sources: 2013 natural gas supply values: U.S. Energy Information Administration (EIA), Natural Gas Monthly, DOE/EIA-0130(2014/07) (Washington, DC, July 2014). 2013
coal minemouth and delivered coal prices: EIA, Annual Coal Report 2013, DOE/EIA-0584(2013) (Washington, DC, January 2015). 2013 petroleum supply values: EIA, Petroleum Supply Annual 2013, DOE/EIA-0340(2013)/1 (Washington, DC, September 2014). 2013 crude oil spot prices and natural gas spot price at Henry Hub: Thomson Reuters. Other 2013 coal values: Quarterly Coal Report, October-December 2013, DOE/EIA-0121(2013/4Q) (Washington, DC, March 2014). Other 2013 values: EIA, Monthly Energy Review, DOE/EIA-0035(2014/11) (Washington, DC, November 2014). Projections: EIA, AEO2015 National Energy Modeling System runs REF2015.D021915A and HIGHRESOURCE.D021915B.
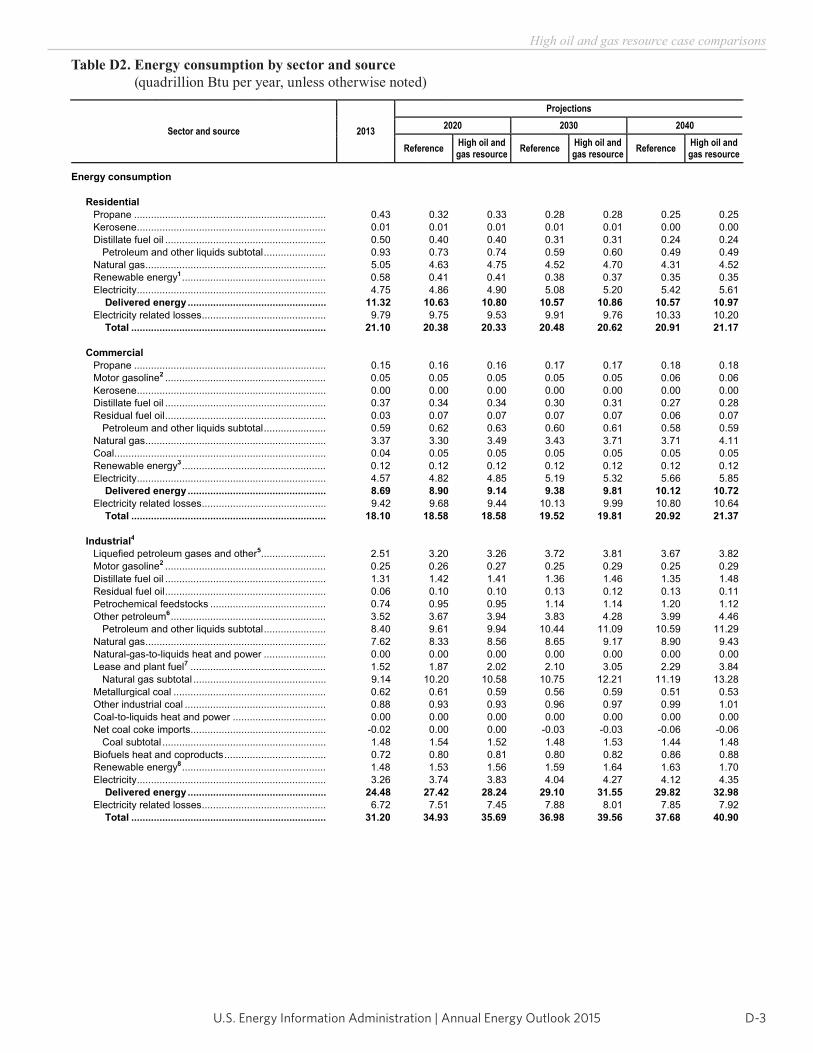
D-3U.S. Energy Information Administration | Annual Energy Outlook 2015
High oil and gas resource case comparisons
Table D2. Energy consumption by sector and source (quadrillion Btu per year, unless otherwise noted)
Energy Information Administration / Annual Energy Outlook 2015
Table D2. Energy consumption by sector and source(quadrillion Btu per year, unless otherwise noted)
Sector and source 2013
Projections 2020 2030 2040
Reference High oil andgas resource Reference High oil and
gas resource Reference High oil andgas resource
Energy consumption
Residential Propane .................................................................... 0.43 0.32 0.33 0.28 0.28 0.25 0.25 Kerosene ................................................................... 0.01 0.01 0.01 0.01 0.01 0.00 0.00 Distillate fuel oil ......................................................... 0.50 0.40 0.40 0.31 0.31 0.24 0.24 Petroleum and other liquids subtotal ...................... 0.93 0.73 0.74 0.59 0.60 0.49 0.49 Natural gas ................................................................ 5.05 4.63 4.75 4.52 4.70 4.31 4.52 Renewable energy1 ................................................... 0.58 0.41 0.41 0.38 0.37 0.35 0.35 Electricity ................................................................... 4.75 4.86 4.90 5.08 5.20 5.42 5.61 Delivered energy ................................................. 11.32 10.63 10.80 10.57 10.86 10.57 10.97 Electricity related losses ............................................ 9.79 9.75 9.53 9.91 9.76 10.33 10.20 Total ..................................................................... 21.10 20.38 20.33 20.48 20.62 20.91 21.17
Commercial Propane .................................................................... 0.15 0.16 0.16 0.17 0.17 0.18 0.18 Motor gasoline2 ......................................................... 0.05 0.05 0.05 0.05 0.05 0.06 0.06 Kerosene ................................................................... 0.00 0.00 0.00 0.00 0.00 0.00 0.00 Distillate fuel oil ......................................................... 0.37 0.34 0.34 0.30 0.31 0.27 0.28 Residual fuel oil ......................................................... 0.03 0.07 0.07 0.07 0.07 0.06 0.07 Petroleum and other liquids subtotal ...................... 0.59 0.62 0.63 0.60 0.61 0.58 0.59 Natural gas ................................................................ 3.37 3.30 3.49 3.43 3.71 3.71 4.11 Coal ........................................................................... 0.04 0.05 0.05 0.05 0.05 0.05 0.05 Renewable energy3 ................................................... 0.12 0.12 0.12 0.12 0.12 0.12 0.12 Electricity ................................................................... 4.57 4.82 4.85 5.19 5.32 5.66 5.85 Delivered energy ................................................. 8.69 8.90 9.14 9.38 9.81 10.12 10.72 Electricity related losses ............................................ 9.42 9.68 9.44 10.13 9.99 10.80 10.64 Total ..................................................................... 18.10 18.58 18.58 19.52 19.81 20.92 21.37
Industrial4 Liquefied petroleum gases and other5....................... 2.51 3.20 3.26 3.72 3.81 3.67 3.82 Motor gasoline2 ......................................................... 0.25 0.26 0.27 0.25 0.29 0.25 0.29 Distillate fuel oil ......................................................... 1.31 1.42 1.41 1.36 1.46 1.35 1.48 Residual fuel oil ......................................................... 0.06 0.10 0.10 0.13 0.12 0.13 0.11 Petrochemical feedstocks ......................................... 0.74 0.95 0.95 1.14 1.14 1.20 1.12 Other petroleum6 ....................................................... 3.52 3.67 3.94 3.83 4.28 3.99 4.46 Petroleum and other liquids subtotal ...................... 8.40 9.61 9.94 10.44 11.09 10.59 11.29 Natural gas ................................................................ 7.62 8.33 8.56 8.65 9.17 8.90 9.43 Natural-gas-to-liquids heat and power ...................... 0.00 0.00 0.00 0.00 0.00 0.00 0.00 Lease and plant fuel7 ................................................ 1.52 1.87 2.02 2.10 3.05 2.29 3.84 Natural gas subtotal ............................................... 9.14 10.20 10.58 10.75 12.21 11.19 13.28 Metallurgical coal ...................................................... 0.62 0.61 0.59 0.56 0.59 0.51 0.53 Other industrial coal .................................................. 0.88 0.93 0.93 0.96 0.97 0.99 1.01 Coal-to-liquids heat and power ................................. 0.00 0.00 0.00 0.00 0.00 0.00 0.00 Net coal coke imports ................................................ -0.02 0.00 0.00 -0.03 -0.03 -0.06 -0.06
Coal subtotal .......................................................... 1.48 1.54 1.52 1.48 1.53 1.44 1.48 Biofuels heat and coproducts .................................... 0.72 0.80 0.81 0.80 0.82 0.86 0.88 Renewable energy8 ................................................... 1.48 1.53 1.56 1.59 1.64 1.63 1.70 Electricity ................................................................... 3.26 3.74 3.83 4.04 4.27 4.12 4.35 Delivered energy ................................................. 24.48 27.42 28.24 29.10 31.55 29.82 32.98 Electricity related losses ............................................ 6.72 7.51 7.45 7.88 8.01 7.85 7.92 Total ..................................................................... 31.20 34.93 35.69 36.98 39.56 37.68 40.90

U.S. Energy Information Administration | Annual Energy Outlook 2015D-4
High oil and gas resource case comparisons
Energy Information Administration / Annual Energy Outlook 2015
Table D2. Energy consumption by sector and source (continued)(quadrillion Btu per year, unless otherwise noted)
Sector and source 2013
Projections 2020 2030 2040
Reference High oil andgas resource Reference High oil and
gas resource Reference High oil andgas resource
Transportation Propane .................................................................... 0.05 0.04 0.04 0.05 0.05 0.07 0.07 Motor gasoline2 ......................................................... 15.94 15.35 15.42 13.30 13.56 12.55 12.83 of which: E859 .................................................... 0.02 0.03 0.03 0.20 0.17 0.28 0.28 Jet fuel10 .................................................................... 2.80 3.01 3.01 3.40 3.42 3.64 3.65 Distillate fuel oil11 ...................................................... 6.50 7.35 7.42 7.76 8.22 7.97 8.33 Residual fuel oil ......................................................... 0.57 0.35 0.35 0.36 0.36 0.36 0.36 Other petroleum12 ..................................................... 0.15 0.16 0.16 0.16 0.16 0.16 0.16 Petroleum and other liquids subtotal ...................... 26.00 26.27 26.42 25.03 25.77 24.76 25.42 Pipeline fuel natural gas ............................................ 0.88 0.85 0.93 0.94 1.13 0.96 1.26 Compressed / liquefied natural gas ........................... 0.05 0.07 0.07 0.17 0.18 0.71 0.96 Liquid hydrogen ........................................................ 0.00 0.00 0.00 0.00 0.00 0.00 0.00 Electricity ................................................................... 0.02 0.03 0.03 0.04 0.04 0.06 0.06 Delivered energy ................................................. 26.96 27.22 27.44 26.18 27.12 26.49 27.70 Electricity related losses ............................................ 0.05 0.06 0.06 0.08 0.08 0.12 0.11 Total ..................................................................... 27.01 27.29 27.50 26.27 27.20 26.61 27.81
Unspecified sector13 .................................................. -0.27 -0.34 -0.34 -0.37 -0.41 -0.38 -0.41
Delivered energy consumption for all sectors Liquefied petroleum gases and other5....................... 3.14 3.73 3.80 4.23 4.31 4.17 4.33 Motor gasoline2 ......................................................... 16.36 15.79 15.87 13.72 14.01 12.96 13.28 of which: E859 .................................................... 0.02 0.03 0.03 0.20 0.17 0.28 0.28 Jet fuel10 .................................................................... 2.97 3.20 3.20 3.61 3.63 3.86 3.88 Kerosene ................................................................... 0.01 0.01 0.01 0.01 0.01 0.01 0.01 Distillate fuel oil ......................................................... 8.10 8.86 8.92 9.05 9.57 9.13 9.60 Residual fuel oil ......................................................... 0.65 0.53 0.53 0.56 0.55 0.56 0.54 Petrochemical feedstocks ......................................... 0.74 0.95 0.95 1.14 1.14 1.20 1.12 Other petroleum14 ..................................................... 3.67 3.82 4.10 3.98 4.44 4.15 4.62 Petroleum and other liquids subtotal ...................... 35.65 36.89 37.38 36.30 37.66 36.03 37.38 Natural gas ................................................................ 16.10 16.32 16.86 16.76 17.75 17.64 19.03 Natural-gas-to-liquids heat and power ...................... 0.00 0.00 0.00 0.00 0.00 0.00 0.00 Lease and plant fuel7 ................................................ 1.52 1.87 2.02 2.10 3.05 2.29 3.84 Pipeline natural gas................................................... 0.88 0.85 0.93 0.94 1.13 0.96 1.26 Natural gas subtotal ............................................... 18.50 19.05 19.81 19.80 21.93 20.88 24.13 Metallurgical coal ...................................................... 0.62 0.61 0.59 0.56 0.59 0.51 0.53 Other coal ................................................................. 0.92 0.98 0.98 1.00 1.01 1.04 1.05 Coal-to-liquids heat and power ................................. 0.00 0.00 0.00 0.00 0.00 0.00 0.00 Net coal coke imports ................................................ -0.02 0.00 0.00 -0.03 -0.03 -0.06 -0.06
Coal subtotal .......................................................... 1.52 1.59 1.57 1.53 1.57 1.49 1.53 Biofuels heat and coproducts .................................... 0.72 0.80 0.81 0.80 0.82 0.86 0.88 Renewable energy15 ................................................. 2.18 2.06 2.09 2.09 2.13 2.10 2.17 Liquid hydrogen ........................................................ 0.00 0.00 0.00 0.00 0.00 0.00 0.00 Electricity ................................................................... 12.60 13.45 13.62 14.35 14.83 15.25 15.87 Delivered energy ................................................. 71.17 73.84 75.27 74.87 78.94 76.62 81.97 Electricity related losses ............................................ 25.97 27.00 26.48 28.01 27.83 29.10 28.87 Total ..................................................................... 97.14 100.84 101.75 102.87 106.78 105.73 110.84
Electric power16
Distillate fuel oil ......................................................... 0.05 0.09 0.08 0.08 0.07 0.08 0.07 Residual fuel oil ......................................................... 0.21 0.08 0.09 0.09 0.09 0.09 0.10 Petroleum and other liquids subtotal ...................... 0.26 0.17 0.16 0.17 0.16 0.18 0.17 Natural gas ................................................................ 8.36 7.80 10.29 9.03 12.46 9.61 14.24 Steam coal ................................................................ 16.49 17.59 14.77 17.63 14.78 17.52 14.76 Nuclear / uranium17 ................................................... 8.27 8.42 8.42 8.47 8.46 8.73 8.46 Renewable energy18 ................................................. 4.78 6.13 6.11 6.72 6.50 7.99 6.82 Non-biogenic municipal waste .................................. 0.23 0.23 0.23 0.23 0.23 0.23 0.23 Electricity imports ...................................................... 0.18 0.11 0.11 0.10 0.08 0.11 0.07 Total ..................................................................... 38.57 40.45 40.10 42.35 42.67 44.36 44.74
Table D2. Energy consumption by sector and source (continued) (quadrillion Btu per year, unless otherwise noted)
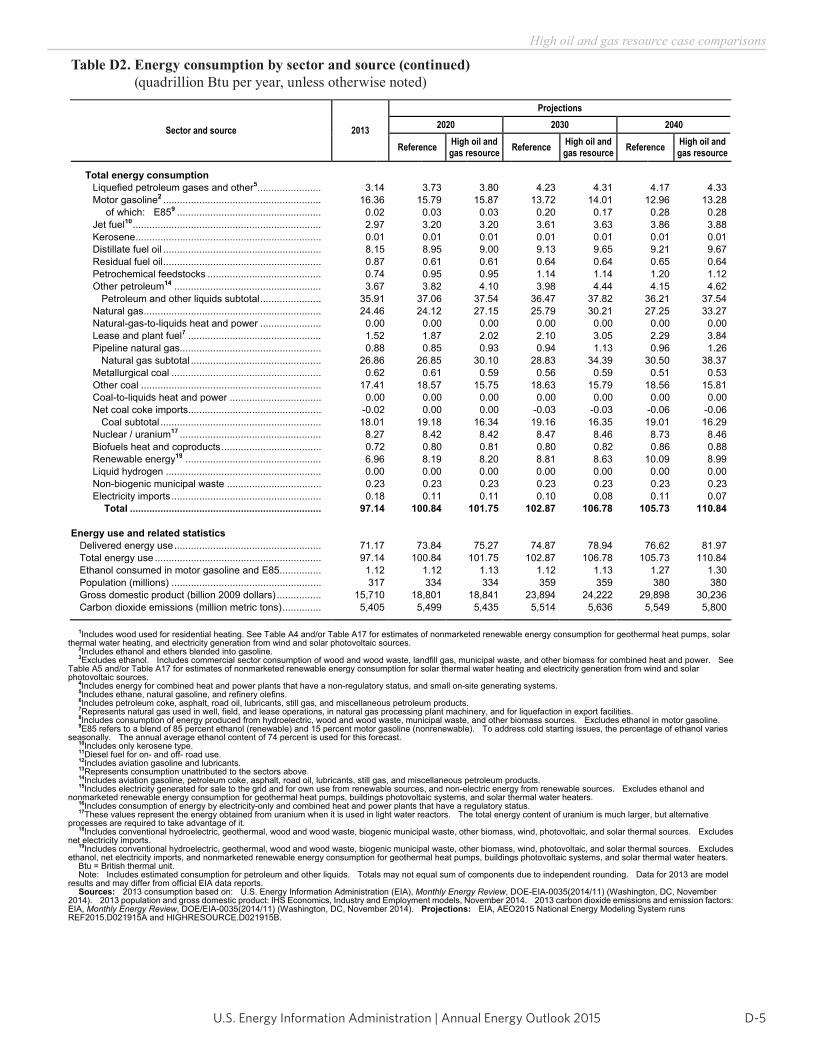
D-5U.S. Energy Information Administration | Annual Energy Outlook 2015
High oil and gas resource case comparisons
Table D2. Energy consumption by sector and source (continued) (quadrillion Btu per year, unless otherwise noted)
Energy Information Administration / Annual Energy Outlook 2015
Table D2. Energy consumption by sector and source (continued)(quadrillion Btu per year, unless otherwise noted)
Sector and source 2013
Projections 2020 2030 2040
Reference High oil andgas resource Reference High oil and
gas resource Reference High oil andgas resource
Total energy consumption Liquefied petroleum gases and other5....................... 3.14 3.73 3.80 4.23 4.31 4.17 4.33 Motor gasoline2 ......................................................... 16.36 15.79 15.87 13.72 14.01 12.96 13.28 of which: E859 .................................................... 0.02 0.03 0.03 0.20 0.17 0.28 0.28 Jet fuel10 .................................................................... 2.97 3.20 3.20 3.61 3.63 3.86 3.88 Kerosene ................................................................... 0.01 0.01 0.01 0.01 0.01 0.01 0.01 Distillate fuel oil ......................................................... 8.15 8.95 9.00 9.13 9.65 9.21 9.67 Residual fuel oil ......................................................... 0.87 0.61 0.61 0.64 0.64 0.65 0.64 Petrochemical feedstocks ......................................... 0.74 0.95 0.95 1.14 1.14 1.20 1.12 Other petroleum14 ..................................................... 3.67 3.82 4.10 3.98 4.44 4.15 4.62 Petroleum and other liquids subtotal ...................... 35.91 37.06 37.54 36.47 37.82 36.21 37.54 Natural gas ................................................................ 24.46 24.12 27.15 25.79 30.21 27.25 33.27 Natural-gas-to-liquids heat and power ...................... 0.00 0.00 0.00 0.00 0.00 0.00 0.00 Lease and plant fuel7 ................................................ 1.52 1.87 2.02 2.10 3.05 2.29 3.84 Pipeline natural gas................................................... 0.88 0.85 0.93 0.94 1.13 0.96 1.26 Natural gas subtotal ............................................... 26.86 26.85 30.10 28.83 34.39 30.50 38.37 Metallurgical coal ...................................................... 0.62 0.61 0.59 0.56 0.59 0.51 0.53 Other coal ................................................................. 17.41 18.57 15.75 18.63 15.79 18.56 15.81 Coal-to-liquids heat and power ................................. 0.00 0.00 0.00 0.00 0.00 0.00 0.00 Net coal coke imports ................................................ -0.02 0.00 0.00 -0.03 -0.03 -0.06 -0.06 Coal subtotal .......................................................... 18.01 19.18 16.34 19.16 16.35 19.01 16.29 Nuclear / uranium17 ................................................... 8.27 8.42 8.42 8.47 8.46 8.73 8.46 Biofuels heat and coproducts .................................... 0.72 0.80 0.81 0.80 0.82 0.86 0.88 Renewable energy19 ................................................. 6.96 8.19 8.20 8.81 8.63 10.09 8.99 Liquid hydrogen ........................................................ 0.00 0.00 0.00 0.00 0.00 0.00 0.00 Non-biogenic municipal waste .................................. 0.23 0.23 0.23 0.23 0.23 0.23 0.23 Electricity imports ...................................................... 0.18 0.11 0.11 0.10 0.08 0.11 0.07 Total ..................................................................... 97.14 100.84 101.75 102.87 106.78 105.73 110.84
Energy use and related statistics Delivered energy use ..................................................... 71.17 73.84 75.27 74.87 78.94 76.62 81.97
Total energy use ............................................................ 97.14 100.84 101.75 102.87 106.78 105.73 110.84 Ethanol consumed in motor gasoline and E85 ............... 1.12 1.12 1.13 1.12 1.13 1.27 1.30
Population (millions) ...................................................... 317 334 334 359 359 380 380 Gross domestic product (billion 2009 dollars) ................ 15,710 18,801 18,841 23,894 24,222 29,898 30,236 Carbon dioxide emissions (million metric tons) .............. 5,405 5,499 5,435 5,514 5,636 5,549 5,800
1Includes wood used for residential heating. See Table A4 and/or Table A17 for estimates of nonmarketed renewable energy consumption for geothermal heat pumps, solar thermal water heating, and electricity generation from wind and solar photovoltaic sources.
2Includes ethanol and ethers blended into gasoline. 3Excludes ethanol. Includes commercial sector consumption of wood and wood waste, landfill gas, municipal waste, and other biomass for combined heat and power. See
Table A5 and/or Table A17 for estimates of nonmarketed renewable energy consumption for solar thermal water heating and electricity generation from wind and solar photovoltaic sources.
4Includes energy for combined heat and power plants that have a non-regulatory status, and small on-site generating systems. 5Includes ethane, natural gasoline, and refinery olefins. 6Includes petroleum coke, asphalt, road oil, lubricants, still gas, and miscellaneous petroleum products. 7Represents natural gas used in well, field, and lease operations, in natural gas processing plant machinery, and for liquefaction in export facilities. 8Includes consumption of energy produced from hydroelectric, wood and wood waste, municipal waste, and other biomass sources. Excludes ethanol in motor gasoline. 9E85 refers to a blend of 85 percent ethanol (renewable) and 15 percent motor gasoline (nonrenewable). To address cold starting issues, the percentage of ethanol varies
seasonally. The annual average ethanol content of 74 percent is used for this forecast. 10Includes only kerosene type. 11Diesel fuel for on- and off- road use. 12Includes aviation gasoline and lubricants. 13Represents consumption unattributed to the sectors above. 14Includes aviation gasoline, petroleum coke, asphalt, road oil, lubricants, still gas, and miscellaneous petroleum products. 15Includes electricity generated for sale to the grid and for own use from renewable sources, and non-electric energy from renewable sources. Excludes ethanol and
nonmarketed renewable energy consumption for geothermal heat pumps, buildings photovoltaic systems, and solar thermal water heaters. 16Includes consumption of energy by electricity-only and combined heat and power plants that have a regulatory status. 17These values represent the energy obtained from uranium when it is used in light water reactors. The total energy content of uranium is much larger, but alternative
processes are required to take advantage of it. 18Includes conventional hydroelectric, geothermal, wood and wood waste, biogenic municipal waste, other biomass, wind, photovoltaic, and solar thermal sources. Excludes
net electricity imports. 19Includes conventional hydroelectric, geothermal, wood and wood waste, biogenic municipal waste, other biomass, wind, photovoltaic, and solar thermal sources. Excludes
ethanol, net electricity imports, and nonmarketed renewable energy consumption for geothermal heat pumps, buildings photovoltaic systems, and solar thermal water heaters. Btu = British thermal unit. Note: Includes estimated consumption for petroleum and other liquids. Totals may not equal sum of components due to independent rounding. Data for 2013 are model
results and may differ from official EIA data reports. Sources: 2013 consumption based on: U.S. Energy Information Administration (EIA), Monthly Energy Review, DOE-EIA-0035(2014/11) (Washington, DC, November
2014). 2013 population and gross domestic product: IHS Economics, Industry and Employment models, November 2014. 2013 carbon dioxide emissions and emission factors: EIA, Monthly Energy Review, DOE/EIA-0035(2014/11) (Washington, DC, November 2014). Projections: EIA, AEO2015 National Energy Modeling System runs REF2015.D021915A and HIGHRESOURCE.D021915B.
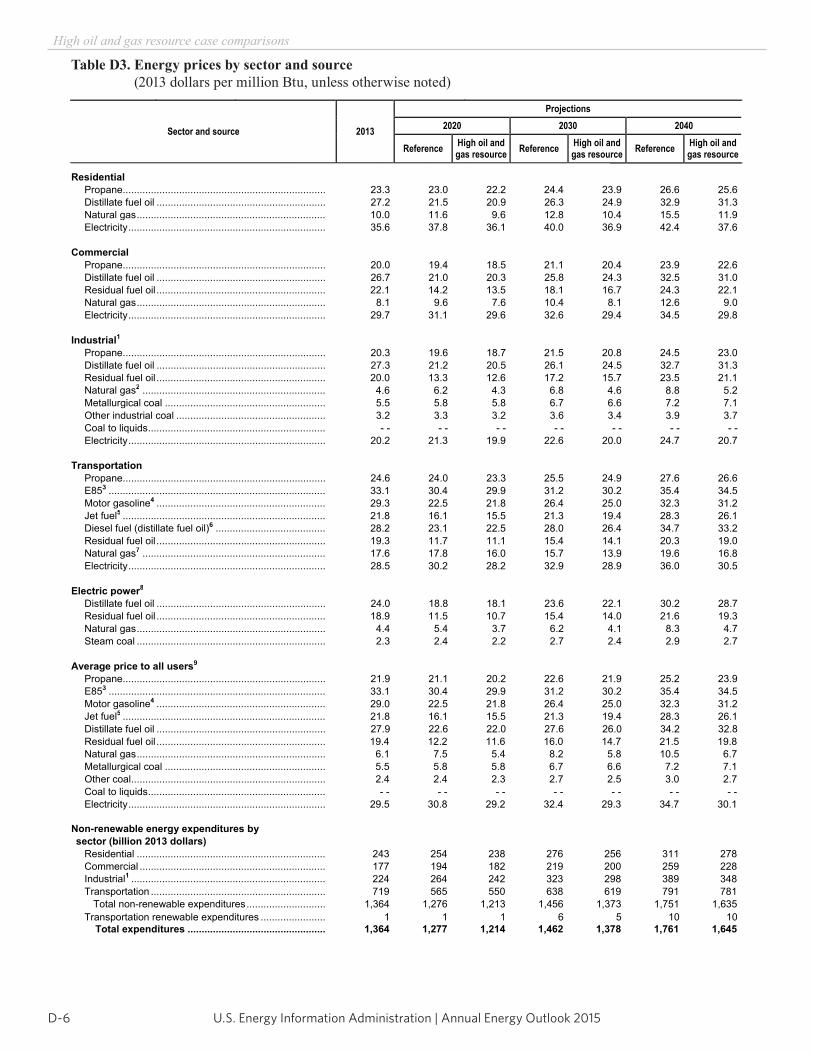
U.S. Energy Information Administration | Annual Energy Outlook 2015D-6
High oil and gas resource case comparisons
Table D3. Energy prices by sector and source (2013 dollars per million Btu, unless otherwise noted)
Energy Information Administration / Annual Energy Outlook 2015
Table D3. Energy prices by sector and source(2013 dollars per million Btu, unless otherwise noted)
Sector and source 2013
Projections 2020 2030 2040
Reference High oil andgas resource Reference High oil and
gas resource Reference High oil andgas resource
Residential Propane ........................................................................ 23.3 23.0 22.2 24.4 23.9 26.6 25.6 Distillate fuel oil ............................................................ 27.2 21.5 20.9 26.3 24.9 32.9 31.3 Natural gas ................................................................... 10.0 11.6 9.6 12.8 10.4 15.5 11.9 Electricity ...................................................................... 35.6 37.8 36.1 40.0 36.9 42.4 37.6
Commercial Propane ........................................................................ 20.0 19.4 18.5 21.1 20.4 23.9 22.6 Distillate fuel oil ............................................................ 26.7 21.0 20.3 25.8 24.3 32.5 31.0 Residual fuel oil ............................................................ 22.1 14.2 13.5 18.1 16.7 24.3 22.1 Natural gas ................................................................... 8.1 9.6 7.6 10.4 8.1 12.6 9.0 Electricity ...................................................................... 29.7 31.1 29.6 32.6 29.4 34.5 29.8
Industrial1 Propane ........................................................................ 20.3 19.6 18.7 21.5 20.8 24.5 23.0 Distillate fuel oil ............................................................ 27.3 21.2 20.5 26.1 24.5 32.7 31.3 Residual fuel oil ............................................................ 20.0 13.3 12.6 17.2 15.7 23.5 21.1 Natural gas2 ................................................................. 4.6 6.2 4.3 6.8 4.6 8.8 5.2 Metallurgical coal ......................................................... 5.5 5.8 5.8 6.7 6.6 7.2 7.1 Other industrial coal ..................................................... 3.2 3.3 3.2 3.6 3.4 3.9 3.7 Coal to liquids ............................................................... - - - - - - - - - - - - - - Electricity ...................................................................... 20.2 21.3 19.9 22.6 20.0 24.7 20.7
Transportation Propane ........................................................................ 24.6 24.0 23.3 25.5 24.9 27.6 26.6 E853 ............................................................................. 33.1 30.4 29.9 31.2 30.2 35.4 34.5 Motor gasoline4 ............................................................ 29.3 22.5 21.8 26.4 25.0 32.3 31.2 Jet fuel5 ........................................................................ 21.8 16.1 15.5 21.3 19.4 28.3 26.1 Diesel fuel (distillate fuel oil)6 ....................................... 28.2 23.1 22.5 28.0 26.4 34.7 33.2 Residual fuel oil ............................................................ 19.3 11.7 11.1 15.4 14.1 20.3 19.0 Natural gas7 ................................................................. 17.6 17.8 16.0 15.7 13.9 19.6 16.8 Electricity ...................................................................... 28.5 30.2 28.2 32.9 28.9 36.0 30.5
Electric power8
Distillate fuel oil ............................................................ 24.0 18.8 18.1 23.6 22.1 30.2 28.7 Residual fuel oil ............................................................ 18.9 11.5 10.7 15.4 14.0 21.6 19.3 Natural gas ................................................................... 4.4 5.4 3.7 6.2 4.1 8.3 4.7 Steam coal ................................................................... 2.3 2.4 2.2 2.7 2.4 2.9 2.7
Average price to all users9
Propane ........................................................................ 21.9 21.1 20.2 22.6 21.9 25.2 23.9 E853 ............................................................................. 33.1 30.4 29.9 31.2 30.2 35.4 34.5 Motor gasoline4 ............................................................ 29.0 22.5 21.8 26.4 25.0 32.3 31.2 Jet fuel5 ........................................................................ 21.8 16.1 15.5 21.3 19.4 28.3 26.1 Distillate fuel oil ............................................................ 27.9 22.6 22.0 27.6 26.0 34.2 32.8 Residual fuel oil ............................................................ 19.4 12.2 11.6 16.0 14.7 21.5 19.8 Natural gas ................................................................... 6.1 7.5 5.4 8.2 5.8 10.5 6.7 Metallurgical coal ......................................................... 5.5 5.8 5.8 6.7 6.6 7.2 7.1 Other coal ..................................................................... 2.4 2.4 2.3 2.7 2.5 3.0 2.7 Coal to liquids ............................................................... - - - - - - - - - - - - - - Electricity ...................................................................... 29.5 30.8 29.2 32.4 29.3 34.7 30.1
Non-renewable energy expenditures by sector (billion 2013 dollars) Residential ................................................................... 243 254 238 276 256 311 278 Commercial .................................................................. 177 194 182 219 200 259 228 Industrial1 ..................................................................... 224 264 242 323 298 389 348 Transportation .............................................................. 719 565 550 638 619 791 781 Total non-renewable expenditures ............................ 1,364 1,276 1,213 1,456 1,373 1,751 1,635 Transportation renewable expenditures ....................... 1 1 1 6 5 10 10 Total expenditures ................................................. 1,364 1,277 1,214 1,462 1,378 1,761 1,645

D-7U.S. Energy Information Administration | Annual Energy Outlook 2015
High oil and gas resource case comparisons
Table D3. Energy prices by sector and source (continued) (nominal dollars per million Btu, unless otherwise noted)
Energy Information Administration / Annual Energy Outlook 2015
Table D3. Energy prices by sector and source (continued)(nominal dollars per million Btu, unless otherwise noted)
Sector and source 2013
Projections 2020 2030 2040
Reference High oil andgas resource Reference High oil and
gas resource Reference High oil andgas resource
Residential Propane ........................................................................ 23.3 26.1 25.0 32.8 31.0 43.1 40.4 Distillate fuel oil ............................................................ 27.2 24.4 23.4 35.3 32.3 53.3 49.5 Natural gas ................................................................... 10.0 13.2 10.8 17.1 13.5 25.1 18.8 Electricity ...................................................................... 35.6 42.9 40.5 53.6 47.9 68.8 59.4
Commercial Propane ........................................................................ 20.0 22.0 20.7 28.3 26.5 38.8 35.7 Distillate fuel oil ............................................................ 26.7 23.8 22.8 34.6 31.5 52.6 49.1 Residual fuel oil ............................................................ 22.1 16.1 15.1 24.3 21.7 39.4 34.9 Natural gas ................................................................... 8.1 10.8 8.5 13.9 10.5 20.5 14.2 Electricity ...................................................................... 29.7 35.3 33.2 43.7 38.1 56.0 47.1
Industrial1 Propane ........................................................................ 20.3 22.3 21.0 28.8 26.9 39.7 36.4 Distillate fuel oil ............................................................ 27.3 24.1 23.0 35.0 31.8 53.0 49.4 Residual fuel oil ............................................................ 20.0 15.1 14.2 23.1 20.4 38.0 33.4 Natural gas2 ................................................................. 4.6 7.0 4.8 9.1 6.0 14.2 8.3 Metallurgical coal ......................................................... 5.5 6.6 6.5 8.9 8.5 11.6 11.2 Other industrial coal ..................................................... 3.2 3.8 3.6 4.8 4.5 6.3 5.9 Coal to liquids ............................................................... - - - - - - - - - - - - - - Electricity ...................................................................... 20.2 24.2 22.3 30.3 26.0 40.0 32.7
Transportation Propane ........................................................................ 24.6 27.2 26.1 34.1 32.3 44.8 42.0 E853 ............................................................................. 33.1 34.4 33.5 41.9 39.3 57.4 54.6 Motor gasoline4 ............................................................ 29.3 25.5 24.5 35.3 32.4 52.4 49.4 Jet fuel5 ........................................................................ 21.8 18.3 17.3 28.6 25.2 45.8 41.2 Diesel fuel (distillate fuel oil)6 ....................................... 28.2 26.2 25.2 37.6 34.3 56.2 52.5 Residual fuel oil ............................................................ 19.3 13.2 12.4 20.6 18.4 32.9 30.1 Natural gas7 ................................................................. 17.6 20.2 18.0 21.0 18.0 31.8 26.5 Electricity ...................................................................... 28.5 34.3 31.7 44.1 37.5 58.4 48.2
Electric power8
Distillate fuel oil ............................................................ 24.0 21.3 20.3 31.7 28.7 49.0 45.4 Residual fuel oil ............................................................ 18.9 13.0 12.0 20.6 18.2 35.0 30.6 Natural gas ................................................................... 4.4 6.1 4.1 8.3 5.4 13.4 7.4 Steam coal ................................................................... 2.3 2.7 2.5 3.6 3.2 4.7 4.2
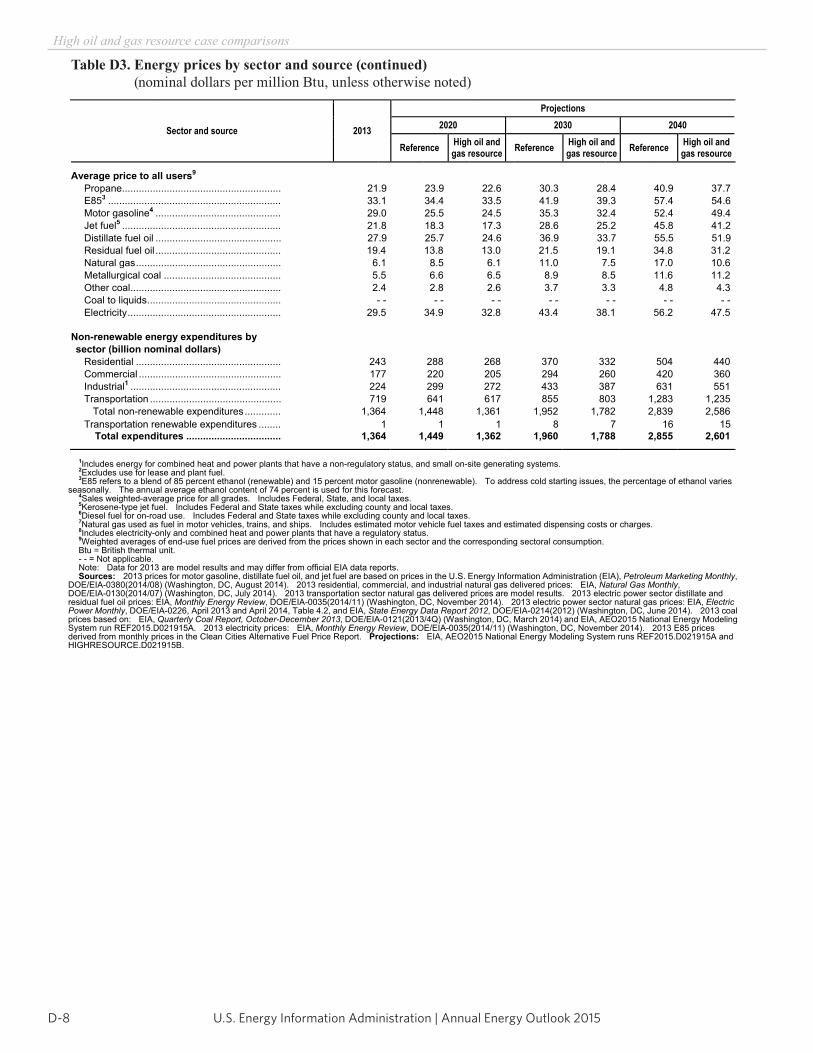
U.S. Energy Information Administration | Annual Energy Outlook 2015D-8
High oil and gas resource case comparisons
Table D3. Energy prices by sector and source (continued) (nominal dollars per million Btu, unless otherwise noted)Table D3. Energy prices by sector and source (continued)
(nominal dollars per million Btu, unless otherwise noted)
Sector and source 2013
Projections 2020 2030 2040
Reference High oil andgas resource Reference High oil and
gas resource Reference High oil andgas resource
Average price to all users9
Propane ......................................................... 21.9 23.9 22.6 30.3 28.4 40.9 37.7 E853 .............................................................. 33.1 34.4 33.5 41.9 39.3 57.4 54.6 Motor gasoline4 ............................................. 29.0 25.5 24.5 35.3 32.4 52.4 49.4 Jet fuel5 ......................................................... 21.8 18.3 17.3 28.6 25.2 45.8 41.2 Distillate fuel oil ............................................. 27.9 25.7 24.6 36.9 33.7 55.5 51.9 Residual fuel oil ............................................. 19.4 13.8 13.0 21.5 19.1 34.8 31.2 Natural gas .................................................... 6.1 8.5 6.1 11.0 7.5 17.0 10.6 Metallurgical coal .......................................... 5.5 6.6 6.5 8.9 8.5 11.6 11.2 Other coal ...................................................... 2.4 2.8 2.6 3.7 3.3 4.8 4.3 Coal to liquids ................................................ - - - - - - - - - - - - - - Electricity ....................................................... 29.5 34.9 32.8 43.4 38.1 56.2 47.5
Non-renewable energy expenditures by sector (billion nominal dollars) Residential .................................................... 243 288 268 370 332 504 440 Commercial ................................................... 177 220 205 294 260 420 360 Industrial1 ...................................................... 224 299 272 433 387 631 551 Transportation ............................................... 719 641 617 855 803 1,283 1,235 Total non-renewable expenditures ............. 1,364 1,448 1,361 1,952 1,782 2,839 2,586 Transportation renewable expenditures ........ 1 1 1 8 7 16 15 Total expenditures .................................. 1,364 1,449 1,362 1,960 1,788 2,855 2,601
1Includes energy for combined heat and power plants that have a non-regulatory status, and small on-site generating systems. 2Excludes use for lease and plant fuel. 3E85 refers to a blend of 85 percent ethanol (renewable) and 15 percent motor gasoline (nonrenewable). To address cold starting issues, the percentage of ethanol varies
seasonally. The annual average ethanol content of 74 percent is used for this forecast. 4Sales weighted-average price for all grades. Includes Federal, State, and local taxes. 5Kerosene-type jet fuel. Includes Federal and State taxes while excluding county and local taxes. 6Diesel fuel for on-road use. Includes Federal and State taxes while excluding county and local taxes. 7Natural gas used as fuel in motor vehicles, trains, and ships. Includes estimated motor vehicle fuel taxes and estimated dispensing costs or charges. 8Includes electricity-only and combined heat and power plants that have a regulatory status. 9Weighted averages of end-use fuel prices are derived from the prices shown in each sector and the corresponding sectoral consumption. Btu = British thermal unit. - - = Not applicable. Note: Data for 2013 are model results and may differ from official EIA data reports. Sources: 2013 prices for motor gasoline, distillate fuel oil, and jet fuel are based on prices in the U.S. Energy Information Administration (EIA), Petroleum Marketing Monthly,
DOE/EIA-0380(2014/08) (Washington, DC, August 2014). 2013 residential, commercial, and industrial natural gas delivered prices: EIA, Natural Gas Monthly,DOE/EIA-0130(2014/07) (Washington, DC, July 2014). 2013 transportation sector natural gas delivered prices are model results. 2013 electric power sector distillate and residual fuel oil prices: EIA, Monthly Energy Review, DOE/EIA-0035(2014/11) (Washington, DC, November 2014). 2013 electric power sector natural gas prices: EIA, Electric Power Monthly, DOE/EIA-0226, April 2013 and April 2014, Table 4.2, and EIA, State Energy Data Report 2012, DOE/EIA-0214(2012) (Washington, DC, June 2014). 2013 coal prices based on: EIA, Quarterly Coal Report, October-December 2013, DOE/EIA-0121(2013/4Q) (Washington, DC, March 2014) and EIA, AEO2015 National Energy Modeling System run REF2015.D021915A. 2013 electricity prices: EIA, Monthly Energy Review, DOE/EIA-0035(2014/11) (Washington, DC, November 2014). 2013 E85 prices derived from monthly prices in the Clean Cities Alternative Fuel Price Report. Projections: EIA, AEO2015 National Energy Modeling System runs REF2015.D021915A and HIGHRESOURCE.D021915B.
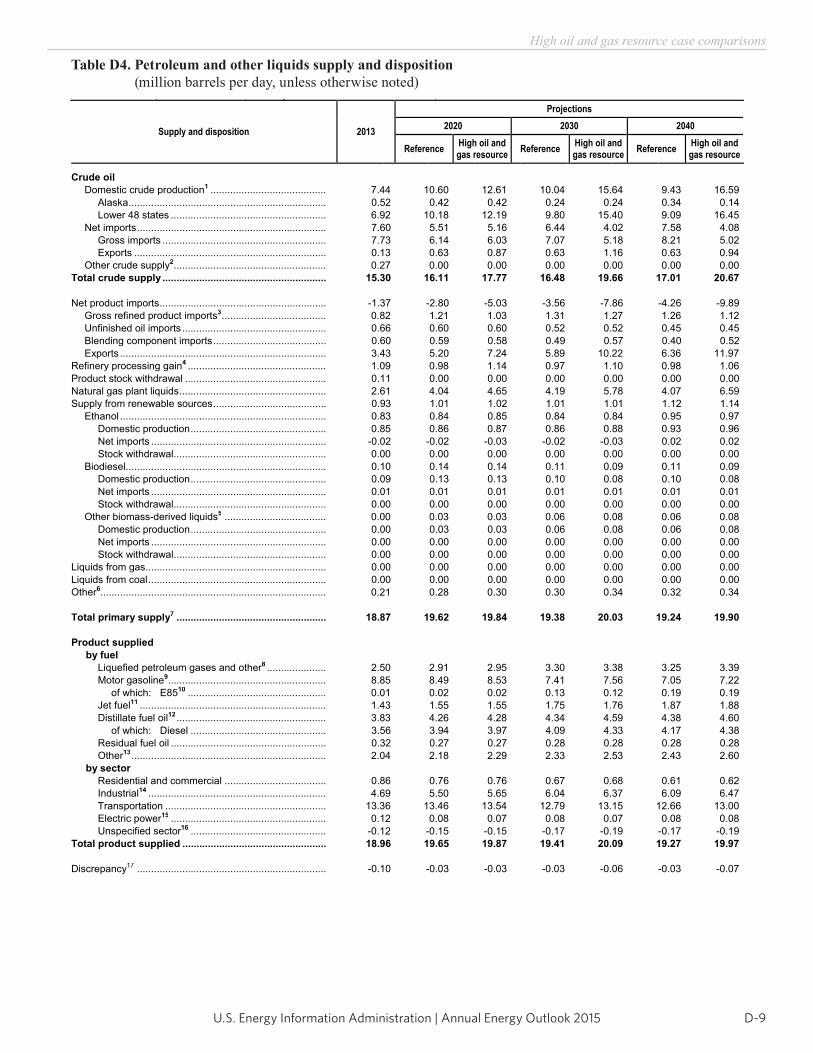
D-9U.S. Energy Information Administration | Annual Energy Outlook 2015
High oil and gas resource case comparisons
Table D4. Petroleum and other liquids supply and disposition (million barrels per day, unless otherwise noted)
Energy Information Administration / Annual Energy Outlook 2015
Table D4. Petroleum and other liquids supply and disposition(million barrels per day, unless otherwise noted)
Supply and disposition 2013
Projections 2020 2030 2040
Reference High oil andgas resource Reference High oil and
gas resource Reference High oil andgas resource
Crude oil Domestic crude production1 ......................................... 7.44 10.60 12.61 10.04 15.64 9.43 16.59 Alaska ...................................................................... 0.52 0.42 0.42 0.24 0.24 0.34 0.14 Lower 48 states ....................................................... 6.92 10.18 12.19 9.80 15.40 9.09 16.45 Net imports ................................................................... 7.60 5.51 5.16 6.44 4.02 7.58 4.08 Gross imports .......................................................... 7.73 6.14 6.03 7.07 5.18 8.21 5.02 Exports .................................................................... 0.13 0.63 0.87 0.63 1.16 0.63 0.94 Other crude supply2...................................................... 0.27 0.00 0.00 0.00 0.00 0.00 0.00Total crude supply .......................................................... 15.30 16.11 17.77 16.48 19.66 17.01 20.67
Net product imports ........................................................... -1.37 -2.80 -5.03 -3.56 -7.86 -4.26 -9.89 Gross refined product imports3 ..................................... 0.82 1.21 1.03 1.31 1.27 1.26 1.12 Unfinished oil imports ................................................... 0.66 0.60 0.60 0.52 0.52 0.45 0.45 Blending component imports ........................................ 0.60 0.59 0.58 0.49 0.57 0.40 0.52 Exports ......................................................................... 3.43 5.20 7.24 5.89 10.22 6.36 11.97Refinery processing gain4 ................................................. 1.09 0.98 1.14 0.97 1.10 0.98 1.06Product stock withdrawal .................................................. 0.11 0.00 0.00 0.00 0.00 0.00 0.00Natural gas plant liquids .................................................... 2.61 4.04 4.65 4.19 5.78 4.07 6.59Supply from renewable sources ........................................ 0.93 1.01 1.02 1.01 1.01 1.12 1.14 Ethanol ......................................................................... 0.83 0.84 0.85 0.84 0.84 0.95 0.97 Domestic production ................................................ 0.85 0.86 0.87 0.86 0.88 0.93 0.96 Net imports .............................................................. -0.02 -0.02 -0.03 -0.02 -0.03 0.02 0.02 Stock withdrawal...................................................... 0.00 0.00 0.00 0.00 0.00 0.00 0.00 Biodiesel ....................................................................... 0.10 0.14 0.14 0.11 0.09 0.11 0.09 Domestic production ................................................ 0.09 0.13 0.13 0.10 0.08 0.10 0.08 Net imports .............................................................. 0.01 0.01 0.01 0.01 0.01 0.01 0.01 Stock withdrawal...................................................... 0.00 0.00 0.00 0.00 0.00 0.00 0.00 Other biomass-derived liquids5 .................................... 0.00 0.03 0.03 0.06 0.08 0.06 0.08 Domestic production ................................................ 0.00 0.03 0.03 0.06 0.08 0.06 0.08 Net imports .............................................................. 0.00 0.00 0.00 0.00 0.00 0.00 0.00 Stock withdrawal...................................................... 0.00 0.00 0.00 0.00 0.00 0.00 0.00Liquids from gas ................................................................ 0.00 0.00 0.00 0.00 0.00 0.00 0.00Liquids from coal ............................................................... 0.00 0.00 0.00 0.00 0.00 0.00 0.00Other6................................................................................ 0.21 0.28 0.30 0.30 0.34 0.32 0.34
Total primary supply7 ..................................................... 18.87 19.62 19.84 19.38 20.03 19.24 19.90
Product supplied by fuel Liquefied petroleum gases and other8 ..................... 2.50 2.91 2.95 3.30 3.38 3.25 3.39 Motor gasoline9........................................................ 8.85 8.49 8.53 7.41 7.56 7.05 7.22
of which: E8510 ................................................. 0.01 0.02 0.02 0.13 0.12 0.19 0.19 Jet fuel11 .................................................................. 1.43 1.55 1.55 1.75 1.76 1.87 1.88 Distillate fuel oil12 ..................................................... 3.83 4.26 4.28 4.34 4.59 4.38 4.60
of which: Diesel ................................................ 3.56 3.94 3.97 4.09 4.33 4.17 4.38 Residual fuel oil ....................................................... 0.32 0.27 0.27 0.28 0.28 0.28 0.28 Other13 ..................................................................... 2.04 2.18 2.29 2.33 2.53 2.43 2.60 by sector Residential and commercial .................................... 0.86 0.76 0.76 0.67 0.68 0.61 0.62 Industrial14 ............................................................... 4.69 5.50 5.65 6.04 6.37 6.09 6.47 Transportation ......................................................... 13.36 13.46 13.54 12.79 13.15 12.66 13.00 Electric power15 ....................................................... 0.12 0.08 0.07 0.08 0.07 0.08 0.08 Unspecified sector16 ................................................ -0.12 -0.15 -0.15 -0.17 -0.19 -0.17 -0.19Total product supplied ................................................... 18.96 19.65 19.87 19.41 20.09 19.27 19.97
Discrepancy17 ................................................................... -0.10 -0.03 -0.03 -0.03 -0.06 -0.03 -0.07
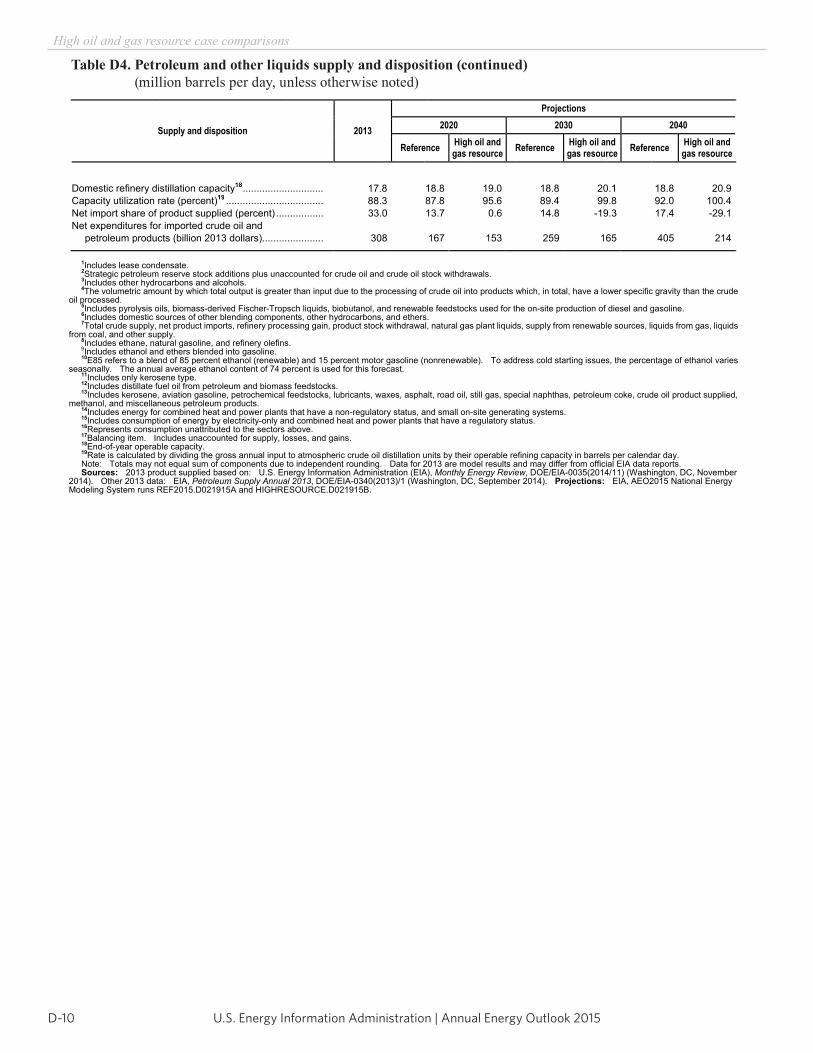
U.S. Energy Information Administration | Annual Energy Outlook 2015D-10
High oil and gas resource case comparisons
Table D4. Petroleum and other liquids supply and disposition (continued) (million barrels per day, unless otherwise noted)
Energy Information Administration / Annual Energy Outlook 2015
Table D4. Petroleum and other liquids supply and disposition (continued)(million barrels per day, unless otherwise noted)
Supply and disposition 2013
Projections 2020 2030 2040
Reference High oil andgas resource Reference High oil and
gas resource Reference High oil andgas resource
Domestic refinery distillation capacity18............................. 17.8 18.8 19.0 18.8 20.1 18.8 20.9Capacity utilization rate (percent)19 ................................... 88.3 87.8 95.6 89.4 99.8 92.0 100.4Net import share of product supplied (percent) ................. 33.0 13.7 0.6 14.8 -19.3 17.4 -29.1Net expenditures for imported crude oil and petroleum products (billion 2013 dollars)...................... 308 167 153 259 165 405 214
1Includes lease condensate. 2Strategic petroleum reserve stock additions plus unaccounted for crude oil and crude oil stock withdrawals. 3Includes other hydrocarbons and alcohols. 4The volumetric amount by which total output is greater than input due to the processing of crude oil into products which, in total, have a lower specific gravity than the crude
oil processed. 5Includes pyrolysis oils, biomass-derived Fischer-Tropsch liquids, biobutanol, and renewable feedstocks used for the on-site production of diesel and gasoline. 6Includes domestic sources of other blending components, other hydrocarbons, and ethers. 7Total crude supply, net product imports, refinery processing gain, product stock withdrawal, natural gas plant liquids, supply from renewable sources, liquids from gas, liquids
from coal, and other supply. 8Includes ethane, natural gasoline, and refinery olefins. 9Includes ethanol and ethers blended into gasoline. 10E85 refers to a blend of 85 percent ethanol (renewable) and 15 percent motor gasoline (nonrenewable). To address cold starting issues, the percentage of ethanol varies
seasonally. The annual average ethanol content of 74 percent is used for this forecast. 11Includes only kerosene type. 12Includes distillate fuel oil from petroleum and biomass feedstocks. 13Includes kerosene, aviation gasoline, petrochemical feedstocks, lubricants, waxes, asphalt, road oil, still gas, special naphthas, petroleum coke, crude oil product supplied,
methanol, and miscellaneous petroleum products. 14Includes energy for combined heat and power plants that have a non-regulatory status, and small on-site generating systems. 15Includes consumption of energy by electricity-only and combined heat and power plants that have a regulatory status. 16Represents consumption unattributed to the sectors above. 17Balancing item. Includes unaccounted for supply, losses, and gains. 18End-of-year operable capacity. 19Rate is calculated by dividing the gross annual input to atmospheric crude oil distillation units by their operable refining capacity in barrels per calendar day. Note: Totals may not equal sum of components due to independent rounding. Data for 2013 are model results and may differ from official EIA data reports. Sources: 2013 product supplied based on: U.S. Energy Information Administration (EIA), Monthly Energy Review, DOE/EIA-0035(2014/11) (Washington, DC, November
2014). Other 2013 data: EIA, Petroleum Supply Annual 2013, DOE/EIA-0340(2013)/1 (Washington, DC, September 2014). Projections: EIA, AEO2015 National Energy Modeling System runs REF2015.D021915A and HIGHRESOURCE.D021915B.
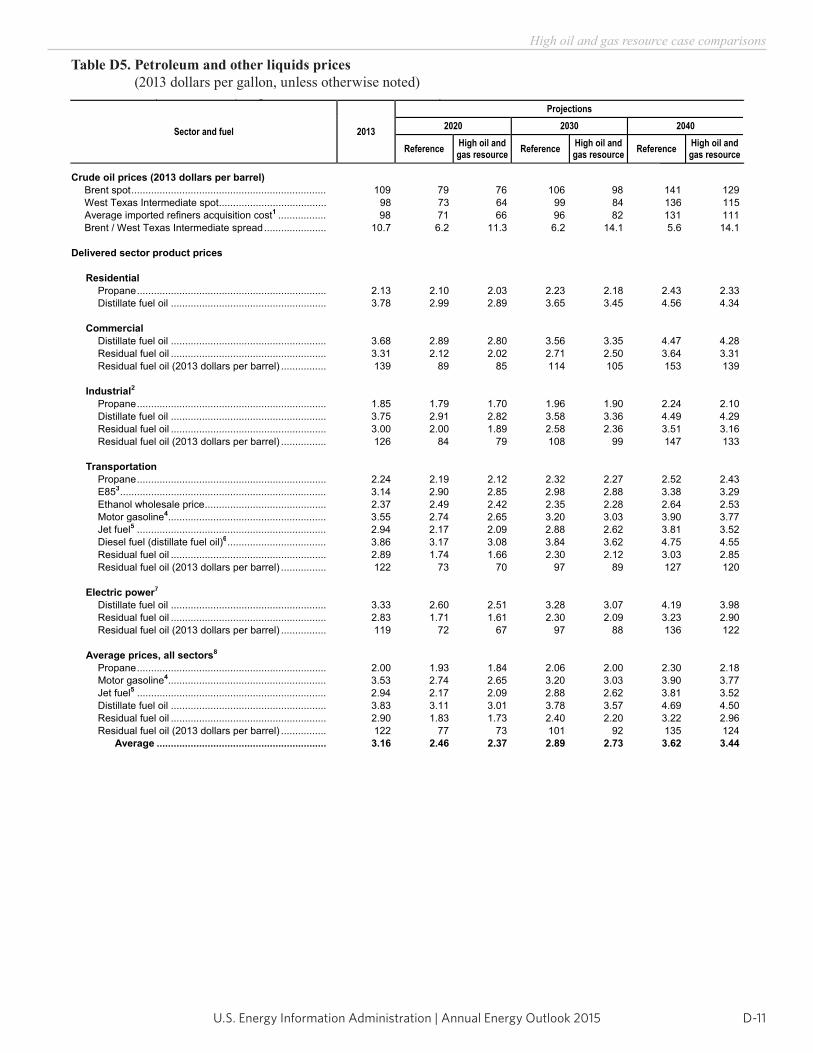
D-11U.S. Energy Information Administration | Annual Energy Outlook 2015
High oil and gas resource case comparisons
Table D5. Petroleum and other liquids prices (2013 dollars per gallon, unless otherwise noted)
Energy Information Administration / Annual Energy Outlook 2015
Table D5. Petroleum and other liquids prices(2013 dollars per gallon, unless otherwise noted)
Sector and fuel 2013
Projections 2020 2030 2040
Reference High oil andgas resource Reference High oil and
gas resource Reference High oil andgas resource
Crude oil prices (2013 dollars per barrel) Brent spot ..................................................................... 109 79 76 106 98 141 129
West Texas Intermediate spot ...................................... 98 73 64 99 84 136 115 Average imported refiners acquisition cost1 ................. 98 71 66 96 82 131 111 Brent / West Texas Intermediate spread ...................... 10.7 6.2 11.3 6.2 14.1 5.6 14.1
Delivered sector product prices
Residential Propane ................................................................... 2.13 2.10 2.03 2.23 2.18 2.43 2.33 Distillate fuel oil ....................................................... 3.78 2.99 2.89 3.65 3.45 4.56 4.34
Commercial Distillate fuel oil ....................................................... 3.68 2.89 2.80 3.56 3.35 4.47 4.28 Residual fuel oil ....................................................... 3.31 2.12 2.02 2.71 2.50 3.64 3.31 Residual fuel oil (2013 dollars per barrel) ................ 139 89 85 114 105 153 139
Industrial2 Propane ................................................................... 1.85 1.79 1.70 1.96 1.90 2.24 2.10 Distillate fuel oil ....................................................... 3.75 2.91 2.82 3.58 3.36 4.49 4.29 Residual fuel oil ....................................................... 3.00 2.00 1.89 2.58 2.36 3.51 3.16 Residual fuel oil (2013 dollars per barrel) ................ 126 84 79 108 99 147 133
Transportation Propane ................................................................... 2.24 2.19 2.12 2.32 2.27 2.52 2.43 E853 ......................................................................... 3.14 2.90 2.85 2.98 2.88 3.38 3.29 Ethanol wholesale price ........................................... 2.37 2.49 2.42 2.35 2.28 2.64 2.53 Motor gasoline4........................................................ 3.55 2.74 2.65 3.20 3.03 3.90 3.77 Jet fuel5 ................................................................... 2.94 2.17 2.09 2.88 2.62 3.81 3.52 Diesel fuel (distillate fuel oil)6 ................................... 3.86 3.17 3.08 3.84 3.62 4.75 4.55 Residual fuel oil ....................................................... 2.89 1.74 1.66 2.30 2.12 3.03 2.85 Residual fuel oil (2013 dollars per barrel) ................ 122 73 70 97 89 127 120
Electric power7
Distillate fuel oil ....................................................... 3.33 2.60 2.51 3.28 3.07 4.19 3.98 Residual fuel oil ....................................................... 2.83 1.71 1.61 2.30 2.09 3.23 2.90 Residual fuel oil (2013 dollars per barrel) ................ 119 72 67 97 88 136 122
Average prices, all sectors8
Propane ................................................................... 2.00 1.93 1.84 2.06 2.00 2.30 2.18 Motor gasoline4........................................................ 3.53 2.74 2.65 3.20 3.03 3.90 3.77 Jet fuel5 ................................................................... 2.94 2.17 2.09 2.88 2.62 3.81 3.52 Distillate fuel oil ....................................................... 3.83 3.11 3.01 3.78 3.57 4.69 4.50 Residual fuel oil ....................................................... 2.90 1.83 1.73 2.40 2.20 3.22 2.96 Residual fuel oil (2013 dollars per barrel) ................ 122 77 73 101 92 135 124
Average ............................................................ 3.16 2.46 2.37 2.89 2.73 3.62 3.44
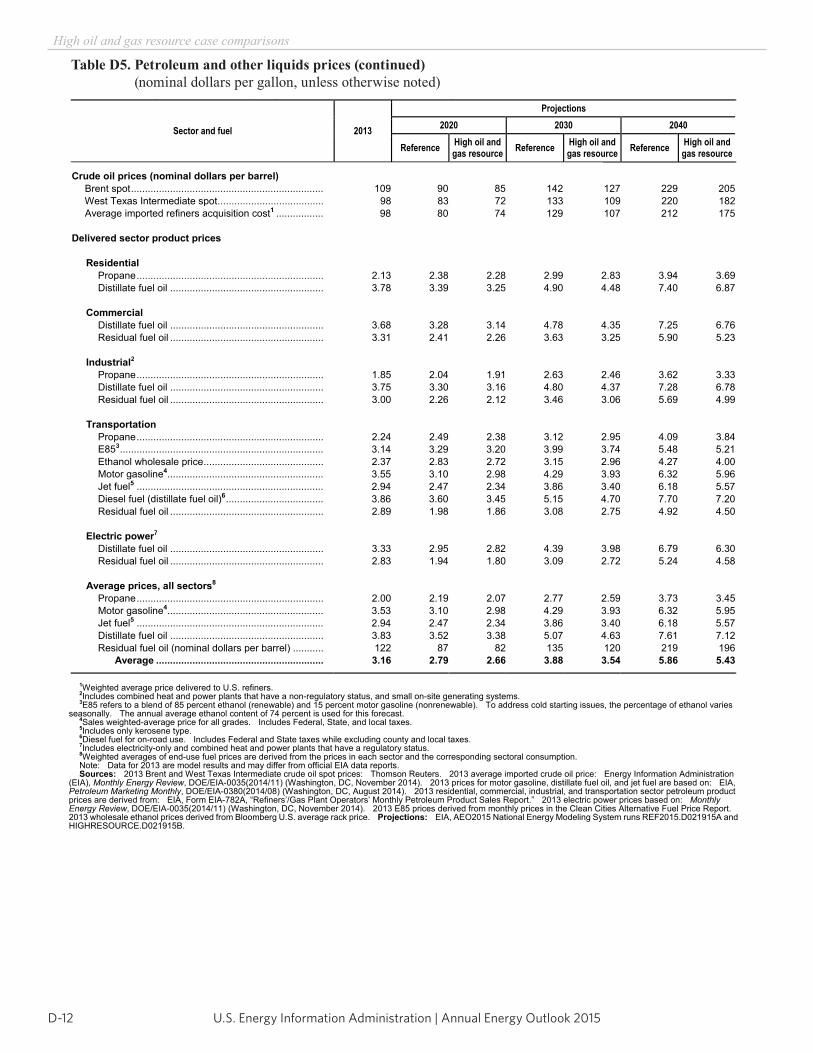
U.S. Energy Information Administration | Annual Energy Outlook 2015D-12
High oil and gas resource case comparisons
Table D5. Petroleum and other liquids prices (continued) (nominal dollars per gallon, unless otherwise noted)
Energy Information Administration / Annual Energy Outlook 2015
Table D5. Petroleum and other liquids prices (continued)(nominal dollars per gallon, unless otherwise noted)
Sector and fuel 2013
Projections 2020 2030 2040
Reference High oil andgas resource Reference High oil and
gas resource Reference High oil andgas resource
Crude oil prices (nominal dollars per barrel) Brent spot ..................................................................... 109 90 85 142 127 229 205
West Texas Intermediate spot ...................................... 98 83 72 133 109 220 182 Average imported refiners acquisition cost1 ................. 98 80 74 129 107 212 175
Delivered sector product prices
Residential Propane ................................................................... 2.13 2.38 2.28 2.99 2.83 3.94 3.69 Distillate fuel oil ....................................................... 3.78 3.39 3.25 4.90 4.48 7.40 6.87
Commercial Distillate fuel oil ....................................................... 3.68 3.28 3.14 4.78 4.35 7.25 6.76 Residual fuel oil ....................................................... 3.31 2.41 2.26 3.63 3.25 5.90 5.23
Industrial2 Propane ................................................................... 1.85 2.04 1.91 2.63 2.46 3.62 3.33 Distillate fuel oil ....................................................... 3.75 3.30 3.16 4.80 4.37 7.28 6.78 Residual fuel oil ....................................................... 3.00 2.26 2.12 3.46 3.06 5.69 4.99
Transportation Propane ................................................................... 2.24 2.49 2.38 3.12 2.95 4.09 3.84 E853 ......................................................................... 3.14 3.29 3.20 3.99 3.74 5.48 5.21 Ethanol wholesale price ........................................... 2.37 2.83 2.72 3.15 2.96 4.27 4.00 Motor gasoline4........................................................ 3.55 3.10 2.98 4.29 3.93 6.32 5.96 Jet fuel5 ................................................................... 2.94 2.47 2.34 3.86 3.40 6.18 5.57 Diesel fuel (distillate fuel oil)6 ................................... 3.86 3.60 3.45 5.15 4.70 7.70 7.20 Residual fuel oil ....................................................... 2.89 1.98 1.86 3.08 2.75 4.92 4.50
Electric power7
Distillate fuel oil ....................................................... 3.33 2.95 2.82 4.39 3.98 6.79 6.30 Residual fuel oil ....................................................... 2.83 1.94 1.80 3.09 2.72 5.24 4.58
Average prices, all sectors8
Propane ................................................................... 2.00 2.19 2.07 2.77 2.59 3.73 3.45 Motor gasoline4........................................................ 3.53 3.10 2.98 4.29 3.93 6.32 5.95 Jet fuel5 ................................................................... 2.94 2.47 2.34 3.86 3.40 6.18 5.57 Distillate fuel oil ....................................................... 3.83 3.52 3.38 5.07 4.63 7.61 7.12 Residual fuel oil (nominal dollars per barrel) ........... 122 87 82 135 120 219 196
Average ............................................................ 3.16 2.79 2.66 3.88 3.54 5.86 5.43
1Weighted average price delivered to U.S. refiners. 2Includes combined heat and power plants that have a non-regulatory status, and small on-site generating systems. 3E85 refers to a blend of 85 percent ethanol (renewable) and 15 percent motor gasoline (nonrenewable). To address cold starting issues, the percentage of ethanol varies
seasonally. The annual average ethanol content of 74 percent is used for this forecast. 4Sales weighted-average price for all grades. Includes Federal, State, and local taxes. 5Includes only kerosene type. 6Diesel fuel for on-road use. Includes Federal and State taxes while excluding county and local taxes. 7Includes electricity-only and combined heat and power plants that have a regulatory status. 8Weighted averages of end-use fuel prices are derived from the prices in each sector and the corresponding sectoral consumption.Note: Data for 2013 are model results and may differ from official EIA data reports. Sources: 2013 Brent and West Texas Intermediate crude oil spot prices: Thomson Reuters. 2013 average imported crude oil price: Energy Information Administration
(EIA), Monthly Energy Review, DOE/EIA-0035(2014/11) (Washington, DC, November 2014). 2013 prices for motor gasoline, distillate fuel oil, and jet fuel are based on: EIA, Petroleum Marketing Monthly, DOE/EIA-0380(2014/08) (Washington, DC, August 2014). 2013 residential, commercial, industrial, and transportation sector petroleum product prices are derived from: EIA, Form EIA-782A, “Refiners’/Gas Plant Operators’ Monthly Petroleum Product Sales Report.” 2013 electric power prices based on: Monthly Energy Review, DOE/EIA-0035(2014/11) (Washington, DC, November 2014). 2013 E85 prices derived from monthly prices in the Clean Cities Alternative Fuel Price Report. 2013 wholesale ethanol prices derived from Bloomberg U.S. average rack price. Projections: EIA, AEO2015 National Energy Modeling System runs REF2015.D021915A and HIGHRESOURCE.D021915B.
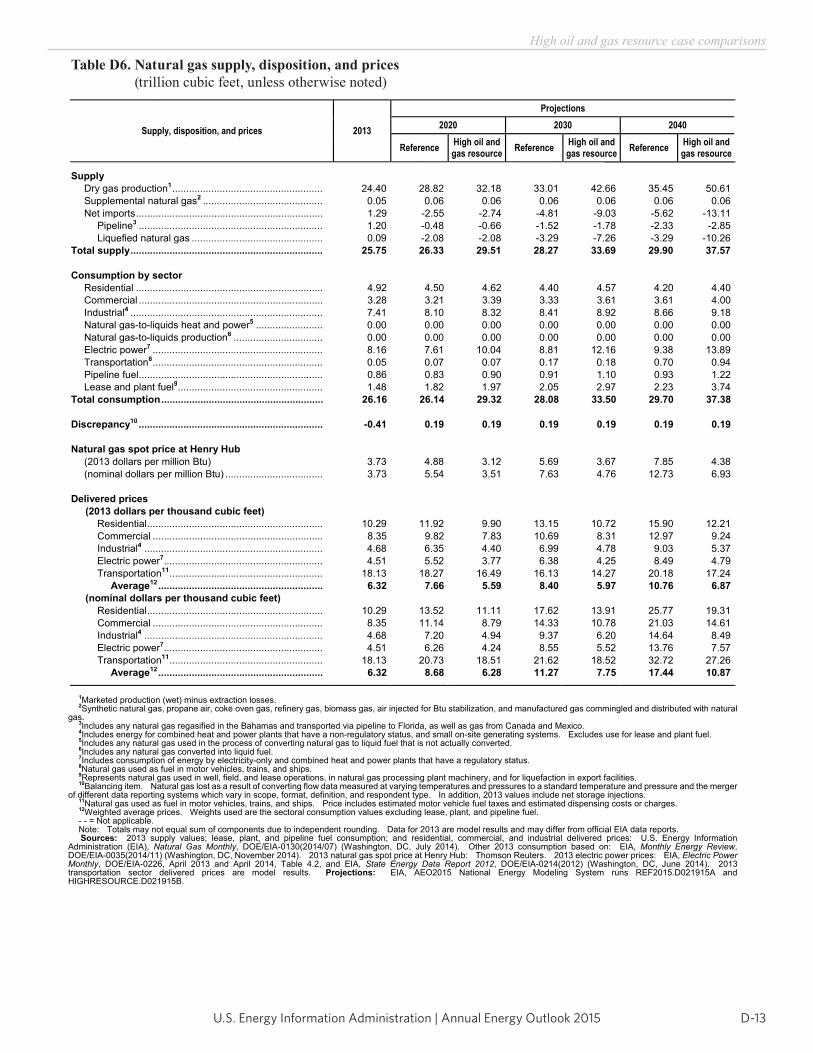
D-13U.S. Energy Information Administration | Annual Energy Outlook 2015
High oil and gas resource case comparisons
Table D6. Natural gas supply, disposition, and prices (trillion cubic feet, unless otherwise noted)
Energy Information Administration / Annual Energy Outlook 2015
Table D6. Natural gas supply, disposition, and prices(trillion cubic feet, unless otherwise noted)
Supply, disposition, and prices 2013
Projections 2020 2030 2040
Reference High oil andgas resource Reference High oil and
gas resource Reference High oil andgas resource
Supply Dry gas production1 ...................................................... 24.40 28.82 32.18 33.01 42.66 35.45 50.61 Supplemental natural gas2 ........................................... 0.05 0.06 0.06 0.06 0.06 0.06 0.06 Net imports ................................................................... 1.29 -2.55 -2.74 -4.81 -9.03 -5.62 -13.11 Pipeline3 .................................................................. 1.20 -0.48 -0.66 -1.52 -1.78 -2.33 -2.85 Liquefied natural gas ............................................... 0.09 -2.08 -2.08 -3.29 -7.26 -3.29 -10.26Total supply ..................................................................... 25.75 26.33 29.51 28.27 33.69 29.90 37.57
Consumption by sector Residential ................................................................... 4.92 4.50 4.62 4.40 4.57 4.20 4.40 Commercial .................................................................. 3.28 3.21 3.39 3.33 3.61 3.61 4.00 Industrial4 ..................................................................... 7.41 8.10 8.32 8.41 8.92 8.66 9.18
Natural gas-to-liquids heat and power5 ........................ 0.00 0.00 0.00 0.00 0.00 0.00 0.00 Natural gas-to-liquids production6 ................................ 0.00 0.00 0.00 0.00 0.00 0.00 0.00 Electric power7 ............................................................. 8.16 7.61 10.04 8.81 12.16 9.38 13.89 Transportation8 ............................................................. 0.05 0.07 0.07 0.17 0.18 0.70 0.94 Pipeline fuel .................................................................. 0.86 0.83 0.90 0.91 1.10 0.93 1.22 Lease and plant fuel9.................................................... 1.48 1.82 1.97 2.05 2.97 2.23 3.74Total consumption .......................................................... 26.16 26.14 29.32 28.08 33.50 29.70 37.38
Discrepancy10 .................................................................. -0.41 0.19 0.19 0.19 0.19 0.19 0.19
Natural gas spot price at Henry Hub (2013 dollars per million Btu) 3.73 4.88 3.12 5.69 3.67 7.85 4.38
(nominal dollars per million Btu) ................................... 3.73 5.54 3.51 7.63 4.76 12.73 6.93
Delivered prices (2013 dollars per thousand cubic feet)
Residential ............................................................... 10.29 11.92 9.90 13.15 10.72 15.90 12.21 Commercial ............................................................. 8.35 9.82 7.83 10.69 8.31 12.97 9.24 Industrial4 ................................................................ 4.68 6.35 4.40 6.99 4.78 9.03 5.37 Electric power7......................................................... 4.51 5.52 3.77 6.38 4.25 8.49 4.79 Transportation11 ....................................................... 18.13 18.27 16.49 16.13 14.27 20.18 17.24
Average12 ........................................................... 6.32 7.66 5.59 8.40 5.97 10.76 6.87 (nominal dollars per thousand cubic feet)
Residential ............................................................... 10.29 13.52 11.11 17.62 13.91 25.77 19.31 Commercial ............................................................. 8.35 11.14 8.79 14.33 10.78 21.03 14.61 Industrial4 ................................................................ 4.68 7.20 4.94 9.37 6.20 14.64 8.49 Electric power7......................................................... 4.51 6.26 4.24 8.55 5.52 13.76 7.57 Transportation11 ....................................................... 18.13 20.73 18.51 21.62 18.52 32.72 27.26
Average12 ........................................................... 6.32 8.68 6.28 11.27 7.75 17.44 10.87
1Marketed production (wet) minus extraction losses. 2Synthetic natural gas, propane air, coke oven gas, refinery gas, biomass gas, air injected for Btu stabilization, and manufactured gas commingled and distributed with natural
gas. 3Includes any natural gas regasified in the Bahamas and transported via pipeline to Florida, as well as gas from Canada and Mexico. 4Includes energy for combined heat and power plants that have a non-regulatory status, and small on-site generating systems. Excludes use for lease and plant fuel. 5Includes any natural gas used in the process of converting natural gas to liquid fuel that is not actually converted. 6Includes any natural gas converted into liquid fuel. 7Includes consumption of energy by electricity-only and combined heat and power plants that have a regulatory status. 8Natural gas used as fuel in motor vehicles, trains, and ships. 9Represents natural gas used in well, field, and lease operations, in natural gas processing plant machinery, and for liquefaction in export facilities. 10Balancing item. Natural gas lost as a result of converting flow data measured at varying temperatures and pressures to a standard temperature and pressure and the merger
of different data reporting systems which vary in scope, format, definition, and respondent type. In addition, 2013 values include net storage injections. 11Natural gas used as fuel in motor vehicles, trains, and ships. Price includes estimated motor vehicle fuel taxes and estimated dispensing costs or charges. 12Weighted average prices. Weights used are the sectoral consumption values excluding lease, plant, and pipeline fuel. - - = Not applicable. Note: Totals may not equal sum of components due to independent rounding. Data for 2013 are model results and may differ from official EIA data reports. Sources: 2013 supply values; lease, plant, and pipeline fuel consumption; and residential, commercial, and industrial delivered prices: U.S. Energy Information
Administration (EIA), Natural Gas Monthly, DOE/EIA-0130(2014/07) (Washington, DC, July 2014). Other 2013 consumption based on: EIA, Monthly Energy Review,DOE/EIA-0035(2014/11) (Washington, DC, November 2014). 2013 natural gas spot price at Henry Hub: Thomson Reuters. 2013 electric power prices: EIA, Electric Power Monthly, DOE/EIA-0226, April 2013 and April 2014, Table 4.2, and EIA, State Energy Data Report 2012, DOE/EIA-0214(2012) (Washington, DC, June 2014). 2013 transportation sector delivered prices are model results. Projections: EIA, AEO2015 National Energy Modeling System runs REF2015.D021915A and HIGHRESOURCE.D021915B.
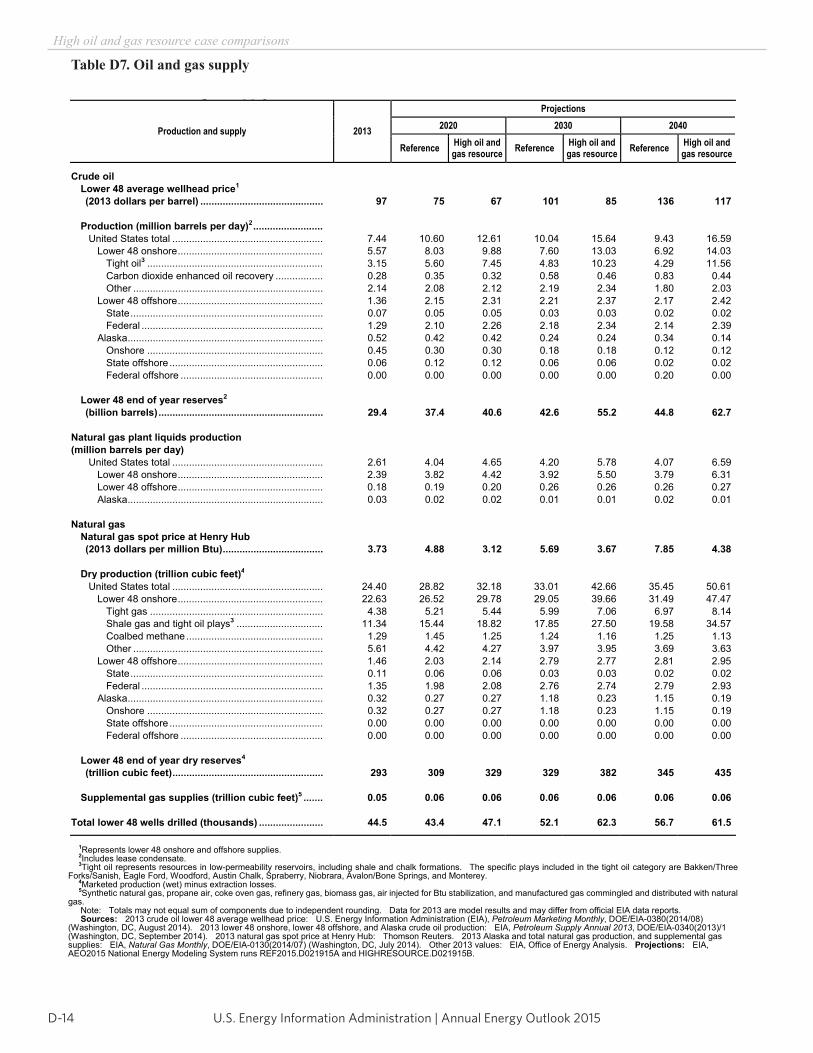
U.S. Energy Information Administration | Annual Energy Outlook 2015D-14
High oil and gas resource case comparisons
Table D7. Oil and gas supply
Energy Information Administration / Annual Energy Outlook 2015
Table D7. Oil and gas supply
Production and supply 2013
Projections 2020 2030 2040
Reference High oil andgas resource Reference High oil and
gas resource Reference High oil andgas resource
Crude oil Lower 48 average wellhead price1
(2013 dollars per barrel) ............................................ 97 75 67 101 85 136 117
Production (million barrels per day)2 ......................... United States total ...................................................... 7.44 10.60 12.61 10.04 15.64 9.43 16.59 Lower 48 onshore .................................................... 5.57 8.03 9.88 7.60 13.03 6.92 14.03 Tight oil3 ............................................................... 3.15 5.60 7.45 4.83 10.23 4.29 11.56 Carbon dioxide enhanced oil recovery ................. 0.28 0.35 0.32 0.58 0.46 0.83 0.44 Other .................................................................... 2.14 2.08 2.12 2.19 2.34 1.80 2.03 Lower 48 offshore .................................................... 1.36 2.15 2.31 2.21 2.37 2.17 2.42 State ..................................................................... 0.07 0.05 0.05 0.03 0.03 0.02 0.02 Federal ................................................................. 1.29 2.10 2.26 2.18 2.34 2.14 2.39 Alaska ...................................................................... 0.52 0.42 0.42 0.24 0.24 0.34 0.14 Onshore ............................................................... 0.45 0.30 0.30 0.18 0.18 0.12 0.12 State offshore ....................................................... 0.06 0.12 0.12 0.06 0.06 0.02 0.02 Federal offshore ................................................... 0.00 0.00 0.00 0.00 0.00 0.20 0.00
Lower 48 end of year reserves2
(billion barrels) ........................................................... 29.4 37.4 40.6 42.6 55.2 44.8 62.7
Natural gas plant liquids production (million barrels per day) United States total ...................................................... 2.61 4.04 4.65 4.20 5.78 4.07 6.59 Lower 48 onshore .................................................... 2.39 3.82 4.42 3.92 5.50 3.79 6.31 Lower 48 offshore .................................................... 0.18 0.19 0.20 0.26 0.26 0.26 0.27 Alaska ...................................................................... 0.03 0.02 0.02 0.01 0.01 0.02 0.01
Natural gas Natural gas spot price at Henry Hub (2013 dollars per million Btu) .................................... 3.73 4.88 3.12 5.69 3.67 7.85 4.38
Dry production (trillion cubic feet)4
United States total ...................................................... 24.40 28.82 32.18 33.01 42.66 35.45 50.61 Lower 48 onshore .................................................... 22.63 26.52 29.78 29.05 39.66 31.49 47.47 Tight gas .............................................................. 4.38 5.21 5.44 5.99 7.06 6.97 8.14 Shale gas and tight oil plays3 ............................... 11.34 15.44 18.82 17.85 27.50 19.58 34.57 Coalbed methane ................................................. 1.29 1.45 1.25 1.24 1.16 1.25 1.13 Other .................................................................... 5.61 4.42 4.27 3.97 3.95 3.69 3.63 Lower 48 offshore .................................................... 1.46 2.03 2.14 2.79 2.77 2.81 2.95 State ..................................................................... 0.11 0.06 0.06 0.03 0.03 0.02 0.02 Federal ................................................................. 1.35 1.98 2.08 2.76 2.74 2.79 2.93 Alaska ...................................................................... 0.32 0.27 0.27 1.18 0.23 1.15 0.19 Onshore ............................................................... 0.32 0.27 0.27 1.18 0.23 1.15 0.19 State offshore ....................................................... 0.00 0.00 0.00 0.00 0.00 0.00 0.00 Federal offshore ................................................... 0.00 0.00 0.00 0.00 0.00 0.00 0.00
Lower 48 end of year dry reserves4
(trillion cubic feet) ...................................................... 293 309 329 329 382 345 435
Supplemental gas supplies (trillion cubic feet)5 ....... 0.05 0.06 0.06 0.06 0.06 0.06 0.06
Total lower 48 wells drilled (thousands) ....................... 44.5 43.4 47.1 52.1 62.3 56.7 61.5
1Represents lower 48 onshore and offshore supplies. 2Includes lease condensate. 3Tight oil represents resources in low-permeability reservoirs, including shale and chalk formations. The specific plays included in the tight oil category are Bakken/Three
Forks/Sanish, Eagle Ford, Woodford, Austin Chalk, Spraberry, Niobrara, Avalon/Bone Springs, and Monterey. 4Marketed production (wet) minus extraction losses. 5Synthetic natural gas, propane air, coke oven gas, refinery gas, biomass gas, air injected for Btu stabilization, and manufactured gas commingled and distributed with natural
gas. Note: Totals may not equal sum of components due to independent rounding. Data for 2013 are model results and may differ from official EIA data reports. Sources: 2013 crude oil lower 48 average wellhead price: U.S. Energy Information Administration (EIA), Petroleum Marketing Monthly, DOE/EIA-0380(2014/08)
(Washington, DC, August 2014). 2013 lower 48 onshore, lower 48 offshore, and Alaska crude oil production: EIA, Petroleum Supply Annual 2013, DOE/EIA-0340(2013)/1 (Washington, DC, September 2014). 2013 natural gas spot price at Henry Hub: Thomson Reuters. 2013 Alaska and total natural gas production, and supplemental gas supplies: EIA, Natural Gas Monthly, DOE/EIA-0130(2014/07) (Washington, DC, July 2014). Other 2013 values: EIA, Office of Energy Analysis. Projections: EIA, AEO2015 National Energy Modeling System runs REF2015.D021915A and HIGHRESOURCE.D021915B.
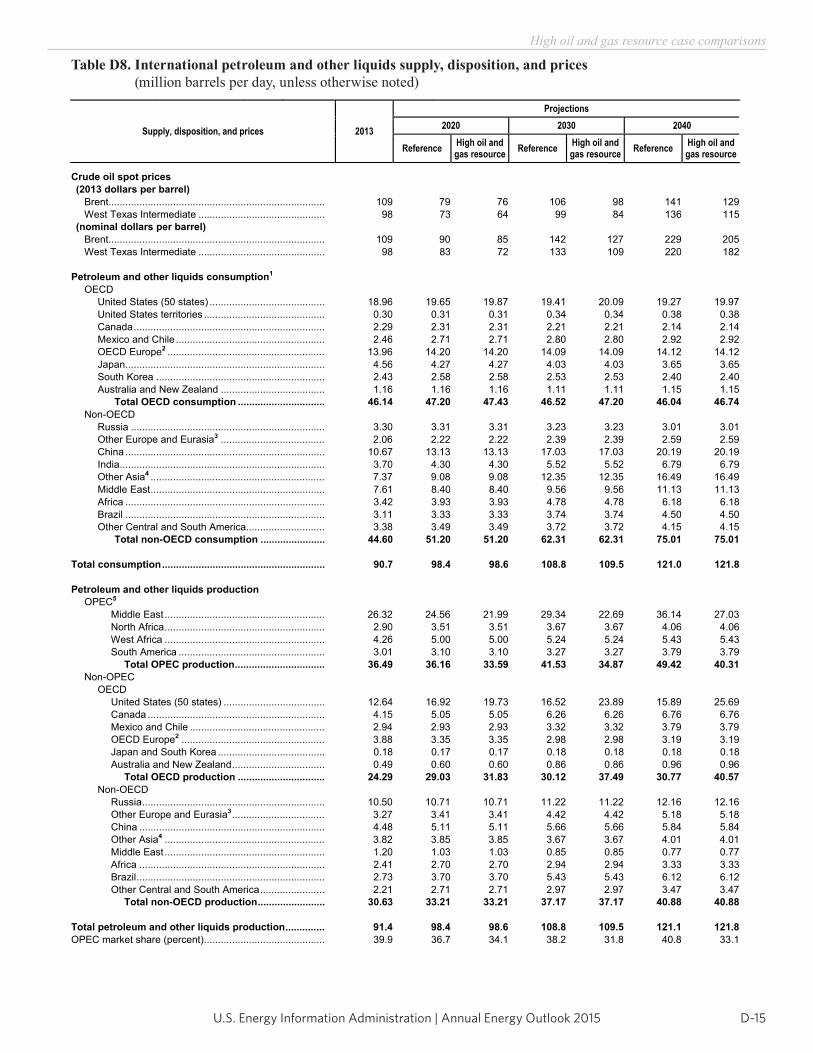
D-15U.S. Energy Information Administration | Annual Energy Outlook 2015
High oil and gas resource case comparisons
Table D8. International petroleum and other liquids supply, disposition, and prices (million barrels per day, unless otherwise noted)
Energy Information Administration / Annual Energy Outlook 2015
Table D8. International petroleum and other liquids supply, disposition, and prices(million barrels per day, unless otherwise noted)
Supply, disposition, and prices 2013
Projections 2020 2030 2040
Reference High oil andgas resource Reference High oil and
gas resource Reference High oil andgas resource
Crude oil spot prices (2013 dollars per barrel) Brent............................................................................. 109 79 76 106 98 141 129
West Texas Intermediate ............................................. 98 73 64 99 84 136 115 (nominal dollars per barrel) Brent............................................................................. 109 90 85 142 127 229 205
West Texas Intermediate ............................................. 98 83 72 133 109 220 182
Petroleum and other liquids consumption1
OECD United States (50 states) ......................................... 18.96 19.65 19.87 19.41 20.09 19.27 19.97 United States territories ........................................... 0.30 0.31 0.31 0.34 0.34 0.38 0.38 Canada .................................................................... 2.29 2.31 2.31 2.21 2.21 2.14 2.14 Mexico and Chile ..................................................... 2.46 2.71 2.71 2.80 2.80 2.92 2.92 OECD Europe2 ........................................................ 13.96 14.20 14.20 14.09 14.09 14.12 14.12 Japan ....................................................................... 4.56 4.27 4.27 4.03 4.03 3.65 3.65 South Korea ............................................................ 2.43 2.58 2.58 2.53 2.53 2.40 2.40 Australia and New Zealand ..................................... 1.16 1.16 1.16 1.11 1.11 1.15 1.15
Total OECD consumption ............................... 46.14 47.20 47.43 46.52 47.20 46.04 46.74 Non-OECD Russia ..................................................................... 3.30 3.31 3.31 3.23 3.23 3.01 3.01 Other Europe and Eurasia3 ..................................... 2.06 2.22 2.22 2.39 2.39 2.59 2.59 China ....................................................................... 10.67 13.13 13.13 17.03 17.03 20.19 20.19 India ......................................................................... 3.70 4.30 4.30 5.52 5.52 6.79 6.79 Other Asia4 .............................................................. 7.37 9.08 9.08 12.35 12.35 16.49 16.49 Middle East .............................................................. 7.61 8.40 8.40 9.56 9.56 11.13 11.13 Africa ....................................................................... 3.42 3.93 3.93 4.78 4.78 6.18 6.18 Brazil ....................................................................... 3.11 3.33 3.33 3.74 3.74 4.50 4.50 Other Central and South America............................ 3.38 3.49 3.49 3.72 3.72 4.15 4.15
Total non-OECD consumption ....................... 44.60 51.20 51.20 62.31 62.31 75.01 75.01
Total consumption .......................................................... 90.7 98.4 98.6 108.8 109.5 121.0 121.8
Petroleum and other liquids production OPEC5
Middle East ......................................................... 26.32 24.56 21.99 29.34 22.69 36.14 27.03 North Africa ......................................................... 2.90 3.51 3.51 3.67 3.67 4.06 4.06 West Africa ......................................................... 4.26 5.00 5.00 5.24 5.24 5.43 5.43 South America .................................................... 3.01 3.10 3.10 3.27 3.27 3.79 3.79 Total OPEC production ................................ 36.49 36.16 33.59 41.53 34.87 49.42 40.31
Non-OPEC OECD
United States (50 states) .................................... 12.64 16.92 19.73 16.52 23.89 15.89 25.69 Canada ............................................................... 4.15 5.05 5.05 6.26 6.26 6.76 6.76 Mexico and Chile ................................................ 2.94 2.93 2.93 3.32 3.32 3.79 3.79 OECD Europe2 ................................................... 3.88 3.35 3.35 2.98 2.98 3.19 3.19 Japan and South Korea ...................................... 0.18 0.17 0.17 0.18 0.18 0.18 0.18 Australia and New Zealand ................................. 0.49 0.60 0.60 0.86 0.86 0.96 0.96 Total OECD production ............................... 24.29 29.03 31.83 30.12 37.49 30.77 40.57
Non-OECD Russia ................................................................. 10.50 10.71 10.71 11.22 11.22 12.16 12.16 Other Europe and Eurasia3 ................................. 3.27 3.41 3.41 4.42 4.42 5.18 5.18 China .................................................................. 4.48 5.11 5.11 5.66 5.66 5.84 5.84 Other Asia4 ......................................................... 3.82 3.85 3.85 3.67 3.67 4.01 4.01 Middle East ......................................................... 1.20 1.03 1.03 0.85 0.85 0.77 0.77 Africa .................................................................. 2.41 2.70 2.70 2.94 2.94 3.33 3.33 Brazil ................................................................... 2.73 3.70 3.70 5.43 5.43 6.12 6.12 Other Central and South America ....................... 2.21 2.71 2.71 2.97 2.97 3.47 3.47 Total non-OECD production ........................ 30.63 33.21 33.21 37.17 37.17 40.88 40.88
Total petroleum and other liquids production .............. 91.4 98.4 98.6 108.8 109.5 121.1 121.8OPEC market share (percent) ........................................... 39.9 36.7 34.1 38.2 31.8 40.8 33.1
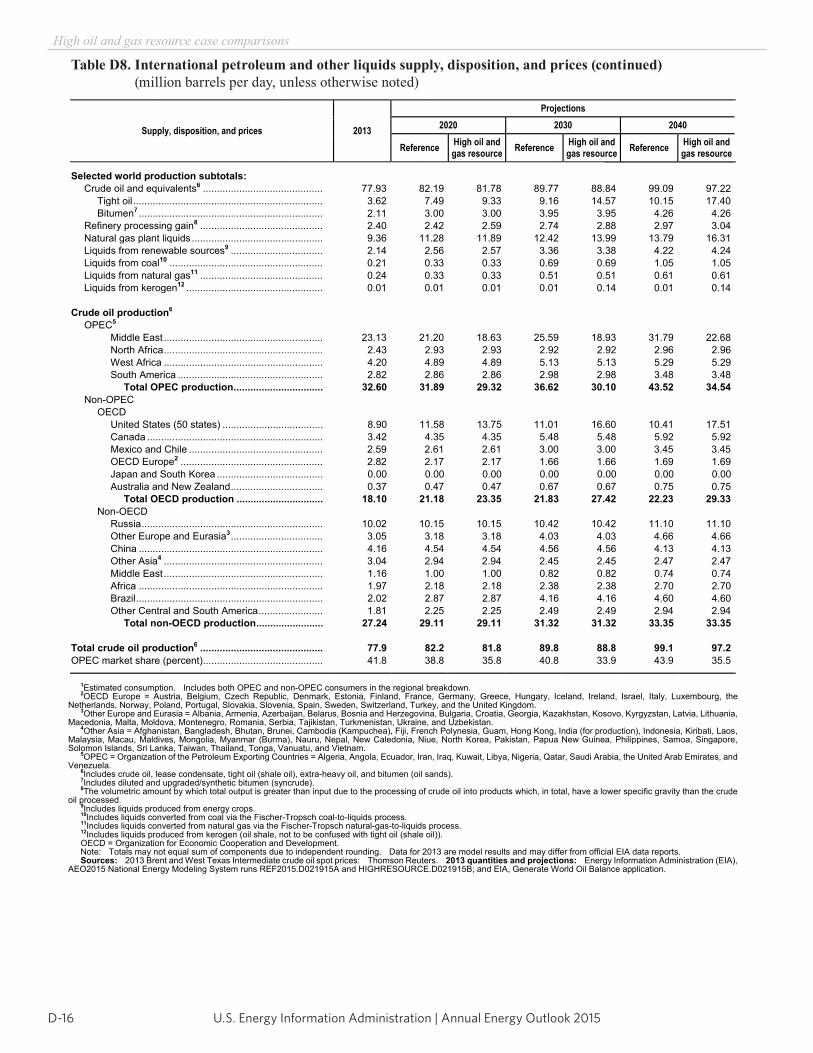
U.S. Energy Information Administration | Annual Energy Outlook 2015D-16
High oil and gas resource case comparisons
Table D8. International petroleum and other liquids supply, disposition, and prices (continued) (million barrels per day, unless otherwise noted)
Energy Information Administration / Annual Energy Outlook 2015
Table D8. International petroleum and other liquids supply, disposition, and prices (continued)(million barrels per day, unless otherwise noted)
Supply, disposition, and prices 2013
Projections 2020 2030 2040
Reference High oil andgas resource Reference High oil and
gas resource Reference High oil andgas resource
Selected world production subtotals: Crude oil and equivalents6 ........................................... 77.93 82.19 81.78 89.77 88.84 99.09 97.22 Tight oil .................................................................... 3.62 7.49 9.33 9.16 14.57 10.15 17.40 Bitumen7 .................................................................. 2.11 3.00 3.00 3.95 3.95 4.26 4.26 Refinery processing gain8 ............................................ 2.40 2.42 2.59 2.74 2.88 2.97 3.04
Natural gas plant liquids ............................................... 9.36 11.28 11.89 12.42 13.99 13.79 16.31 Liquids from renewable sources9 ................................. 2.14 2.56 2.57 3.36 3.38 4.22 4.24
Liquids from coal10 ....................................................... 0.21 0.33 0.33 0.69 0.69 1.05 1.05 Liquids from natural gas11 ............................................ 0.24 0.33 0.33 0.51 0.51 0.61 0.61 Liquids from kerogen12 ................................................. 0.01 0.01 0.01 0.01 0.14 0.01 0.14
Crude oil production6
OPEC5
Middle East ......................................................... 23.13 21.20 18.63 25.59 18.93 31.79 22.68 North Africa ......................................................... 2.43 2.93 2.93 2.92 2.92 2.96 2.96 West Africa ......................................................... 4.20 4.89 4.89 5.13 5.13 5.29 5.29 South America .................................................... 2.82 2.86 2.86 2.98 2.98 3.48 3.48 Total OPEC production ................................ 32.60 31.89 29.32 36.62 30.10 43.52 34.54
Non-OPEC OECD
United States (50 states) .................................... 8.90 11.58 13.75 11.01 16.60 10.41 17.51 Canada ............................................................... 3.42 4.35 4.35 5.48 5.48 5.92 5.92 Mexico and Chile ................................................ 2.59 2.61 2.61 3.00 3.00 3.45 3.45 OECD Europe2 ................................................... 2.82 2.17 2.17 1.66 1.66 1.69 1.69 Japan and South Korea ...................................... 0.00 0.00 0.00 0.00 0.00 0.00 0.00 Australia and New Zealand ................................. 0.37 0.47 0.47 0.67 0.67 0.75 0.75 Total OECD production ............................... 18.10 21.18 23.35 21.83 27.42 22.23 29.33
Non-OECD Russia ................................................................. 10.02 10.15 10.15 10.42 10.42 11.10 11.10 Other Europe and Eurasia3 ................................. 3.05 3.18 3.18 4.03 4.03 4.66 4.66 China .................................................................. 4.16 4.54 4.54 4.56 4.56 4.13 4.13 Other Asia4 ......................................................... 3.04 2.94 2.94 2.45 2.45 2.47 2.47 Middle East ......................................................... 1.16 1.00 1.00 0.82 0.82 0.74 0.74 Africa .................................................................. 1.97 2.18 2.18 2.38 2.38 2.70 2.70 Brazil ................................................................... 2.02 2.87 2.87 4.16 4.16 4.60 4.60 Other Central and South America ....................... 1.81 2.25 2.25 2.49 2.49 2.94 2.94 Total non-OECD production ........................ 27.24 29.11 29.11 31.32 31.32 33.35 33.35
Total crude oil production6 ............................................ 77.9 82.2 81.8 89.8 88.8 99.1 97.2OPEC market share (percent) ........................................... 41.8 38.8 35.8 40.8 33.9 43.9 35.5
1Estimated consumption. Includes both OPEC and non-OPEC consumers in the regional breakdown. 2OECD Europe = Austria, Belgium, Czech Republic, Denmark, Estonia, Finland, France, Germany, Greece, Hungary, Iceland, Ireland, Israel, Italy, Luxembourg, the
Netherlands, Norway, Poland, Portugal, Slovakia, Slovenia, Spain, Sweden, Switzerland, Turkey, and the United Kingdom. 3Other Europe and Eurasia = Albania, Armenia, Azerbaijan, Belarus, Bosnia and Herzegovina, Bulgaria, Croatia, Georgia, Kazakhstan, Kosovo, Kyrgyzstan, Latvia, Lithuania,
Macedonia, Malta, Moldova, Montenegro, Romania, Serbia, Tajikistan, Turkmenistan, Ukraine, and Uzbekistan. 4Other Asia = Afghanistan, Bangladesh, Bhutan, Brunei, Cambodia (Kampuchea), Fiji, French Polynesia, Guam, Hong Kong, India (for production), Indonesia, Kiribati, Laos,
Malaysia, Macau, Maldives, Mongolia, Myanmar (Burma), Nauru, Nepal, New Caledonia, Niue, North Korea, Pakistan, Papua New Guinea, Philippines, Samoa, Singapore, Solomon Islands, Sri Lanka, Taiwan, Thailand, Tonga, Vanuatu, and Vietnam.
5OPEC = Organization of the Petroleum Exporting Countries = Algeria, Angola, Ecuador, Iran, Iraq, Kuwait, Libya, Nigeria, Qatar, Saudi Arabia, the United Arab Emirates, and Venezuela.
6Includes crude oil, lease condensate, tight oil (shale oil), extra-heavy oil, and bitumen (oil sands). 7Includes diluted and upgraded/synthetic bitumen (syncrude). 8The volumetric amount by which total output is greater than input due to the processing of crude oil into products which, in total, have a lower specific gravity than the crude
oil processed. 9Includes liquids produced from energy crops. 10Includes liquids converted from coal via the Fischer-Tropsch coal-to-liquids process. 11Includes liquids converted from natural gas via the Fischer-Tropsch natural-gas-to-liquids process. 12Includes liquids produced from kerogen (oil shale, not to be confused with tight oil (shale oil)). OECD = Organization for Economic Cooperation and Development. Note: Totals may not equal sum of components due to independent rounding. Data for 2013 are model results and may differ from official EIA data reports. Sources: 2013 Brent and West Texas Intermediate crude oil spot prices: Thomson Reuters. 2013 quantities and projections: Energy Information Administration (EIA),
AEO2015 National Energy Modeling System runs REF2015.D021915A and HIGHRESOURCE.D021915B; and EIA, Generate World Oil Balance application.

E-1U.S. Energy Information Administration | Annual Energy Outlook 2015
Appendix E
Comparison of AEO2015 and AEO2014 Reference cases and key updates to models and dataIntroductionThis appendix provides a summary comparison of the Reference case for EIA’s Annual Energy Outlook 2015 (AEO2015) with the Reference case for the Annual Energy Outlook 2014 (AEO2014),1 which was released in April 2014, including a list of major model and data updates and discussion of key differences in results between the two projections. Table E1 compares projections from the AEO2014 and AEO2015 reports.
Model and data updatesKey model and data updates made for the AEO2015 Reference case include the following:
Macroeconomic• Incorporated the U.S. Bureau of Economic Analysis (BEA) gross domestic product component revision to 2009 dollars and investment
definitional changes.2 The AEO2015 macroeconomic projections are based on November 2014 IHS Global Insight projections.3
• Incorporated a new input-output matrix based on a 2007 benchmark year using 2009 dollars. The input-output matrix nowcontinues to change over time, based on historical relationships developed using previous benchmark matrices to 2013.
Residential, commercial, and industrial• Incorporated new standards for buildings equipment promulgated during the year, including standards affecting commercial
refrigeration equipment, metal halide lamp fixtures, residential furnace fans, external power supplies, and set-top boxes (voluntary agreement).
• Updated cost and performance assumptions for end-use equipment in the buildings sector, based on a report by NavigantConsulting, Inc. and Leidos, reflecting recent and expected technological progress.4
• Incorporated more rapid adoption of commercial building codes related to building shell efficiency, based on a Pacific Northwest National Laboratory report.5
• Revised and refined market niches used in developing residential distributed generation projections to more accurately reflectsolar insolation and marginal prices at the sub-Census division level, based on data from EIA’s 2009 Residential EnergyConsumption Survey and solar insolation data from the National Renewable Energy Laboratory. 6,7
• Incorporated 2012 State Energy Data System (SEDS) data for regional benchmarking in the industrial sector.8
• Updated and implemented historical natural gas feedstock data in the industrial sector through 2013, based on data from GlobalData.9
• Introduced a new Bayesian Dynamic Linear Model (DLM) for ethane and propane price projections in the industrial sector. Inthe DLM regression, parameters are allowed to vary over time to allow for a dynamic representation of various drivers of ethane and propane prices—such as oil price, natural gas price, hydrocarbon gas liquids (HGL) supply and demand, and bulk chemical shipments. The DLM projects base ethane and propane prices only at Mont Belvieu. To compute sectoral propane prices,historical differences between the base and sectoral prices for propane were applied to the DLM projections for propane. Theresulting AEO2015 ethane and propane price projections exhibit a dominant natural gas price influence in the near term and agrowing oil price influence in the long term.
1 U.S. Energy Information Administration, Annual Energy Outlook 2014, DOE/EIA-0383(2014) (Washington, DC, April 2014), www.eia.gov/forecasts/archive/aeo14.
2 S.H. McCulla, A.E. Holdren, and S. Smith, “Improved Estimates of the National Income and Product Accounts: Results of the 2013 Comprehensive Revision” (U.S. Department of Commerce, Bureau of Economic Analysis, Washington, DC, September 2013), http://www.bea.gov/scb/pdf/2013/09%20September/0913_comprehensive_nipa_revision.pdf.
3 The AEO2015 Reference case uses IHS Global Insight’s November 2014 T301114 workfile. The AEO2015 High Economic Growth case uses the optimistic projection, and the AEO2015 Low Economic Growth case uses the pessimistic projection. In all cases, IHSGI’s energy prices and quantities are replaced with EIA’s projections.
4 U.S. Energy Information Administration, EIA—Technology Forecast Updates—Residential and Commercial Building Technologies—Reference case (Navigant Consulting, Inc. with Leidos, May 2014).
5 O.V. Livingston, P.C. Cole, D.B. Elliott, and R. Bartlett, Building Energy Codes Program: National Benefits Assessment, 1992-2040 (Richland, WA, March 2014), prepared by Pacific Northwest National Laboratory for the U.S. Department of Energy, Building Energy Codes Program, http://www.energycodes.gov/building-energy-codes-program-national-benefits-assessment-1992-2040-0.
6 U.S. Energy Information Administration, “Residential Energy Consumption Survey (RECS): 2009 RECS Survey Data” (Washington, DC, January 2013), http://www.eia.gov/consumption/residential/data/2009/index.cfm?view=microdata.
7 National Renewable Energy Laboratory (NREL) “Zip Code Solar Insolation Data Source,” http://www.nrel.gov/gis/docs/SolarSummaries.xlsx.8 U.S. Energy Information Administration, “State Energy Data System (SEDS)” (Washington, DC, June 27, 2014), http://www.eia.gov/state/seds/seds-data-complete.cfm?sid=US.
9 GlobalData (New York, NY, 2014) http://www.globaldata.com (subscription site).
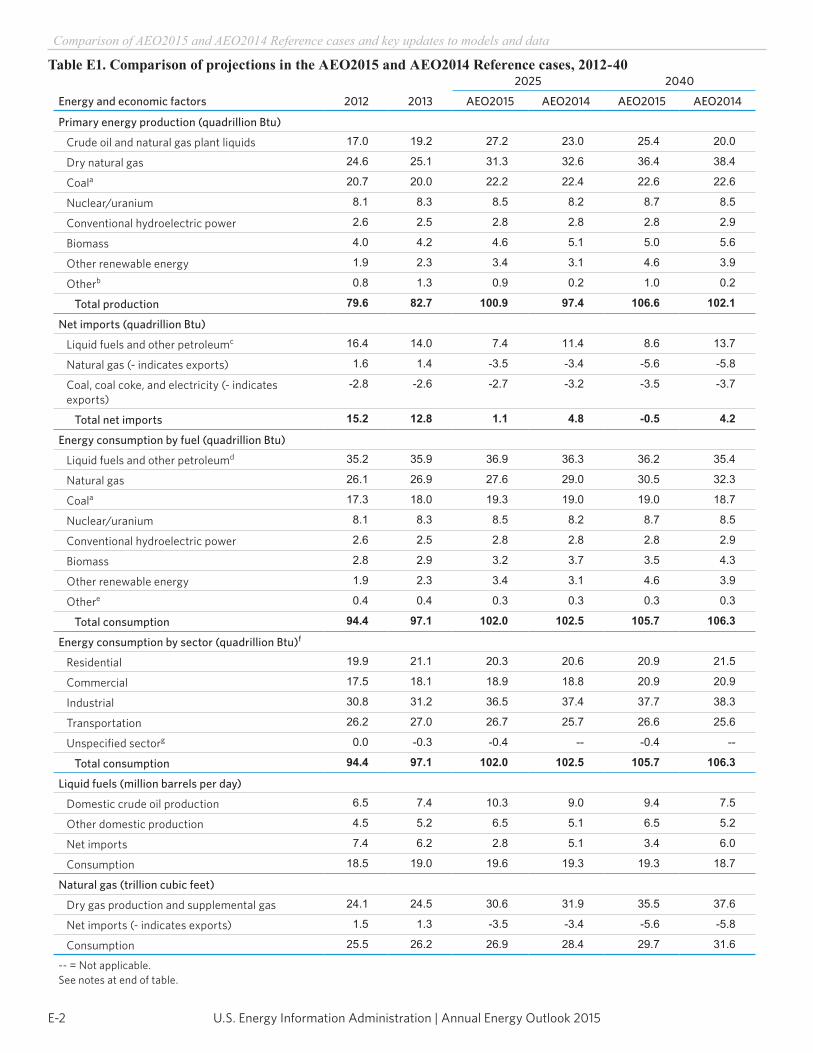
U.S. Energy Information Administration | Annual Energy Outlook 2015E-2
Comparison of AEO2015 and AEO2014 Reference cases and key updates to models and data
Energy and economic factors 2012 2013
2025 2040
AEO2015 AEO2014 AEO2015 AEO2014
Primary energy production (quadrillion Btu)
Crude oil and natural gas plant liquids 17.0 19.2 27.2 23.0 25.4 20.0
Dry natural gas 24.6 25.1 31.3 32.6 36.4 38.4
Coala 20.7 20.0 22.2 22.4 22.6 22.6
Nuclear/uranium 8.1 8.3 8.5 8.2 8.7 8.5
Conventional hydroelectric power 2.6 2.5 2.8 2.8 2.8 2.9
Biomass 4.0 4.2 4.6 5.1 5.0 5.6
Other renewable energy 1.9 2.3 3.4 3.1 4.6 3.9
Otherb 0.8 1.3 0.9 0.2 1.0 0.2
Total production 79.6 82.7 100.9 97.4 106.6 102.1
Net imports (quadrillion Btu)
Liquid fuels and other petroleumc 16.4 14.0 7.4 11.4 8.6 13.7
Natural gas (- indicates exports) 1.6 1.4 -3.5 -3.4 -5.6 -5.8
Coal, coal coke, and electricity (- indicates exports)
-2.8 -2.6 -2.7 -3.2 -3.5 -3.7
Total net imports 15.2 12.8 1.1 4.8 -0.5 4.2
Energy consumption by fuel (quadrillion Btu)
Liquid fuels and other petroleumd 35.2 35.9 36.9 36.3 36.2 35.4
Natural gas 26.1 26.9 27.6 29.0 30.5 32.3
Coala 17.3 18.0 19.3 19.0 19.0 18.7
Nuclear/uranium 8.1 8.3 8.5 8.2 8.7 8.5
Conventional hydroelectric power 2.6 2.5 2.8 2.8 2.8 2.9
Biomass 2.8 2.9 3.2 3.7 3.5 4.3
Other renewable energy 1.9 2.3 3.4 3.1 4.6 3.9
Othere 0.4 0.4 0.3 0.3 0.3 0.3
Total consumption 94.4 97.1 102.0 102.5 105.7 106.3
Energy consumption by sector (quadrillion Btu)f
Residential 19.9 21.1 20.3 20.6 20.9 21.5
Commercial 17.5 18.1 18.9 18.8 20.9 20.9
Industrial 30.8 31.2 36.5 37.4 37.7 38.3
Transportation 26.2 27.0 26.7 25.7 26.6 25.6
Unspecified sectorg 0.0 -0.3 -0.4 -- -0.4 --
Total consumption 94.4 97.1 102.0 102.5 105.7 106.3
Liquid fuels (million barrels per day)
Domestic crude oil production 6.5 7.4 10.3 9.0 9.4 7.5
Other domestic production 4.5 5.2 6.5 5.1 6.5 5.2
Net imports 7.4 6.2 2.8 5.1 3.4 6.0
Consumption 18.5 19.0 19.6 19.3 19.3 18.7
Natural gas (trillion cubic feet)
Dry gas production and supplemental gas 24.1 24.5 30.6 31.9 35.5 37.6
Net imports (- indicates exports) 1.5 1.3 -3.5 -3.4 -5.6 -5.8
Consumption 25.5 26.2 26.9 28.4 29.7 31.6
-- = Not applicable.See notes at end of table.
Table E1. Comparison of projections in the AEO2015 and AEO2014 Reference cases, 2012-40
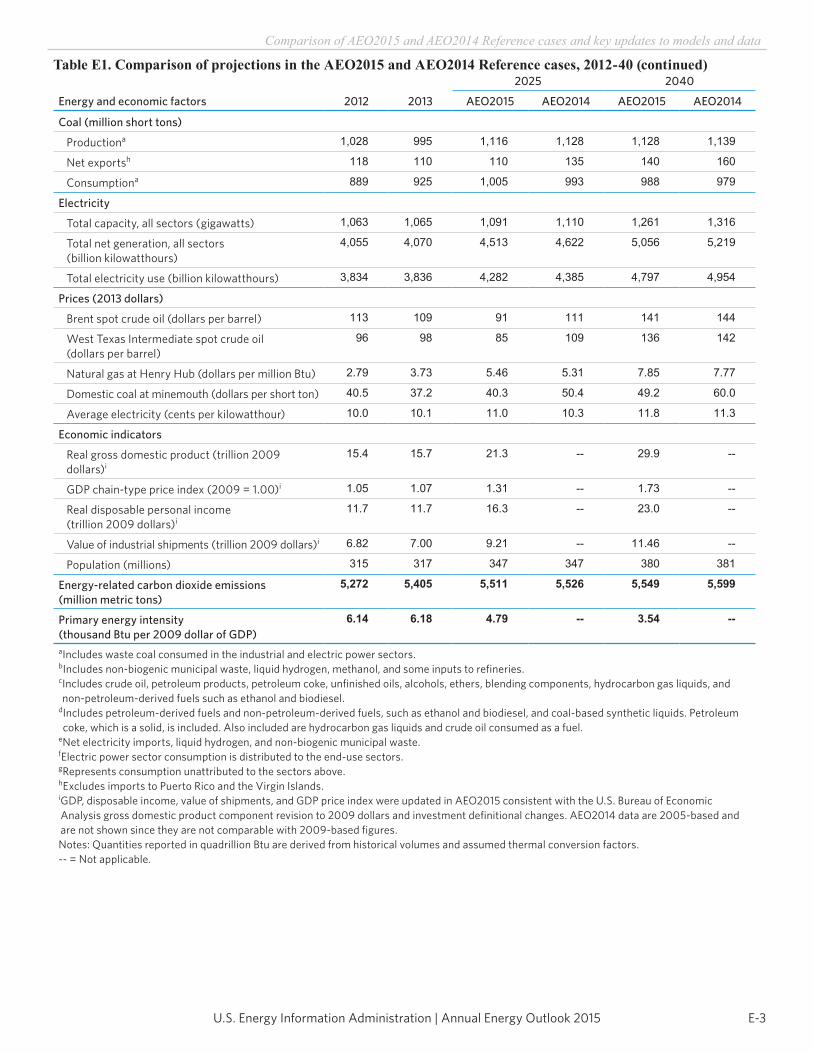
E-3U.S. Energy Information Administration | Annual Energy Outlook 2015
Comparison of AEO2015 and AEO2014 Reference cases and key updates to models and data
Table E1. Comparison of projections in the AEO2015 and AEO2014 Reference cases, 2012-40 (continued)
Energy and economic factors 2012 2013
2025 2040
AEO2015 AEO2014 AEO2015 AEO2014
Coal (million short tons)
Productiona 1,028 995 1,116 1,128 1,128 1,139
Net exportsh 118 110 110 135 140 160
Consumptiona 889 925 1,005 993 988 979
Electricity
Total capacity, all sectors (gigawatts) 1,063 1,065 1,091 1,110 1,261 1,316
Total net generation, all sectors (billion kilowatthours)
4,055 4,070 4,513 4,622 5,056 5,219
Total electricity use (billion kilowatthours) 3,834 3,836 4,282 4,385 4,797 4,954
Prices (2013 dollars)
Brent spot crude oil (dollars per barrel) 113 109 91 111 141 144
West Texas Intermediate spot crude oil (dollars per barrel)
96 98 85 109 136 142
Natural gas at Henry Hub (dollars per million Btu) 2.79 3.73 5.46 5.31 7.85 7.77
Domestic coal at minemouth (dollars per short ton) 40.5 37.2 40.3 50.4 49.2 60.0
Average electricity (cents per kilowatthour) 10.0 10.1 11.0 10.3 11.8 11.3
Economic indicators
Real gross domestic product (trillion 2009 dollars)i
15.4 15.7 21.3 -- 29.9 --
GDP chain-type price index (2009 = 1.00)i 1.05 1.07 1.31 -- 1.73 --
Real disposable personal income (trillion 2009 dollars)i
11.7 11.7 16.3 -- 23.0 --
Value of industrial shipments (trillion 2009 dollars)i 6.82 7.00 9.21 -- 11.46 --
Population (millions) 315 317 347 347 380 381
Energy-related carbon dioxide emissions (million metric tons)
5,272 5,405 5,511 5,526 5,549 5,599
Primary energy intensity (thousand Btu per 2009 dollar of GDP)
6.14 6.18 4.79 -- 3.54 --
aIncludes waste coal consumed in the industrial and electric power sectors.bIncludes non-biogenic municipal waste, liquid hydrogen, methanol, and some inputs to refineries.c Includes crude oil, petroleum products, petroleum coke, unfinished oils, alcohols, ethers, blending components, hydrocarbon gas liquids, and non-petroleum-derived fuels such as ethanol and biodiesel.
d Includes petroleum-derived fuels and non-petroleum-derived fuels, such as ethanol and biodiesel, and coal-based synthetic liquids. Petroleum coke, which is a solid, is included. Also included are hydrocarbon gas liquids and crude oil consumed as a fuel.
eNet electricity imports, liquid hydrogen, and non-biogenic municipal waste.fElectric power sector consumption is distributed to the end-use sectors.gRepresents consumption unattributed to the sectors above.hExcludes imports to Puerto Rico and the Virgin Islands.i GDP, disposable income, value of shipments, and GDP price index were updated in AEO2015 consistent with the U.S. Bureau of Economic Analysis gross domestic product component revision to 2009 dollars and investment definitional changes. AEO2014 data are 2005-based and are not shown since they are not comparable with 2009-based figures.Notes: Quantities reported in quadrillion Btu are derived from historical volumes and assumed thermal conversion factors.-- = Not applicable.
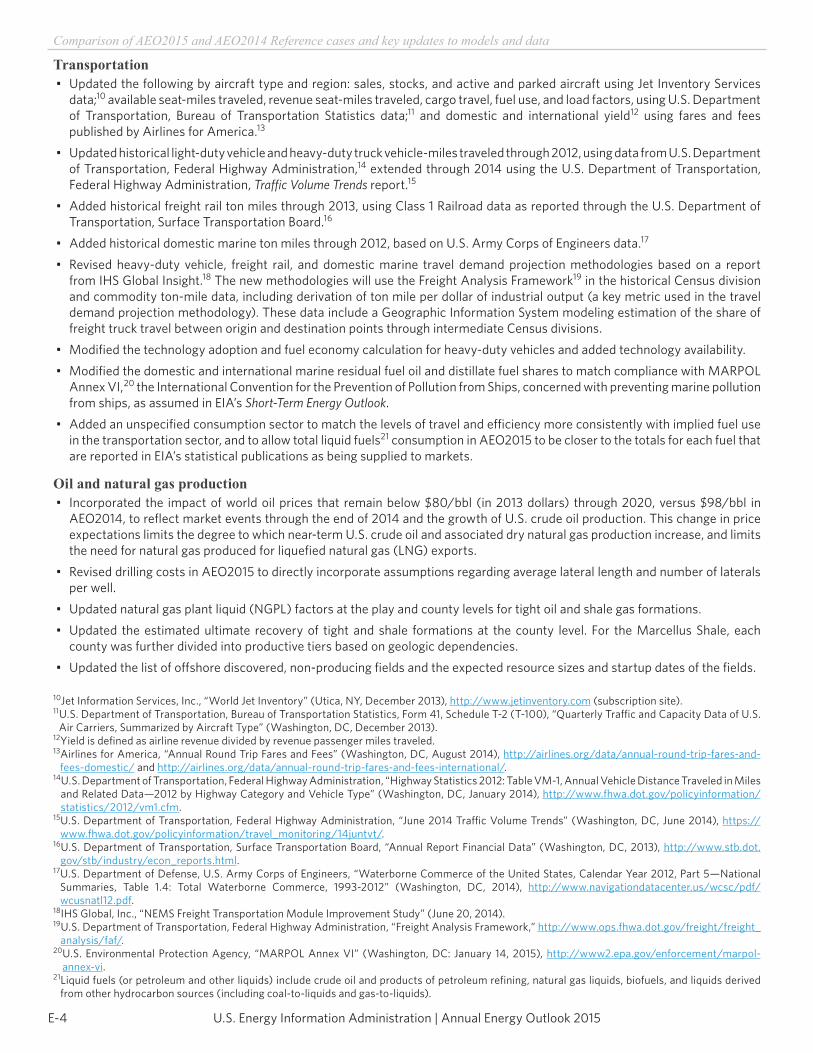
U.S. Energy Information Administration | Annual Energy Outlook 2015E-4
Comparison of AEO2015 and AEO2014 Reference cases and key updates to models and data
Transportation• Updated the following by aircraft type and region: sales, stocks, and active and parked aircraft using Jet Inventory Services
data;10 available seat-miles traveled, revenue seat-miles traveled, cargo travel, fuel use, and load factors, using U.S. Department of Transportation, Bureau of Transportation Statistics data;11 and domestic and international yield12 using fares and fees published by Airlines for America.13
• Updated historical light-duty vehicle and heavy-duty truck vehicle-miles traveled through 2012, using data from U.S. Department of Transportation, Federal Highway Administration,14 extended through 2014 using the U.S. Department of Transportation, Federal Highway Administration, Traffic Volume Trends report.15
• Added historical freight rail ton miles through 2013, using Class 1 Railroad data as reported through the U.S. Department ofTransportation, Surface Transportation Board.16
• Added historical domestic marine ton miles through 2012, based on U.S. Army Corps of Engineers data.17
• Revised heavy-duty vehicle, freight rail, and domestic marine travel demand projection methodologies based on a reportfrom IHS Global Insight.18 The new methodologies will use the Freight Analysis Framework19 in the historical Census divisionand commodity ton-mile data, including derivation of ton mile per dollar of industrial output (a key metric used in the traveldemand projection methodology). These data include a Geographic Information System modeling estimation of the share offreight truck travel between origin and destination points through intermediate Census divisions.
• Modified the technology adoption and fuel economy calculation for heavy-duty vehicles and added technology availability.• Modified the domestic and international marine residual fuel oil and distillate fuel shares to match compliance with MARPOL
Annex VI,20 the International Convention for the Prevention of Pollution from Ships, concerned with preventing marine pollution from ships, as assumed in EIA’s Short-Term Energy Outlook.
• Added an unspecified consumption sector to match the levels of travel and efficiency more consistently with implied fuel usein the transportation sector, and to allow total liquid fuels21 consumption in AEO2015 to be closer to the totals for each fuel that are reported in EIA’s statistical publications as being supplied to markets.
Oil and natural gas production• Incorporated the impact of world oil prices that remain below $80/bbl (in 2013 dollars) through 2020, versus $98/bbl in
AEO2014, to reflect market events through the end of 2014 and the growth of U.S. crude oil production. This change in price expectations limits the degree to which near-term U.S. crude oil and associated dry natural gas production increase, and limits the need for natural gas produced for liquefied natural gas (LNG) exports.
• Revised drilling costs in AEO2015 to directly incorporate assumptions regarding average lateral length and number of lateralsper well.
• Updated natural gas plant liquid (NGPL) factors at the play and county levels for tight oil and shale gas formations.• Updated the estimated ultimate recovery of tight and shale formations at the county level. For the Marcellus Shale, each
county was further divided into productive tiers based on geologic dependencies.• Updated the list of offshore discovered, non-producing fields and the expected resource sizes and startup dates of the fields.
10 Jet Information Services, Inc., “World Jet Inventory” (Utica, NY, December 2013), http://www.jetinventory.com (subscription site).11 U.S. Department of Transportation, Bureau of Transportation Statistics, Form 41, Schedule T-2 (T-100), “Quarterly Traffic and Capacity Data of U.S.
Air Carriers, Summarized by Aircraft Type” (Washington, DC, December 2013).12 Yield is defined as airline revenue divided by revenue passenger miles traveled.13 Airlines for America, “Annual Round Trip Fares and Fees” (Washington, DC, August 2014), http://airlines.org/data/annual-round-trip-fares-and-
fees-domestic/ and http://airlines.org/data/annual-round-trip-fares-and-fees-international/.14 U.S. Department of Transportation, Federal Highway Administration, “Highway Statistics 2012: Table VM-1, Annual Vehicle Distance Traveled in Miles
and Related Data—2012 by Highway Category and Vehicle Type” (Washington, DC, January 2014), http://www.fhwa.dot.gov/policyinformation/statistics/2012/vm1.cfm.
15 U.S. Department of Transportation, Federal Highway Administration, “June 2014 Traffic Volume Trends” (Washington, DC, June 2014), https://www.fhwa.dot.gov/policyinformation/travel_monitoring/14juntvt/.
16 U.S. Department of Transportation, Surface Transportation Board, “Annual Report Financial Data” (Washington, DC, 2013), http://www.stb.dot.gov/stb/industry/econ_reports.html.
17 U.S. Department of Defense, U.S. Army Corps of Engineers, “Waterborne Commerce of the United States, Calendar Year 2012, Part 5—National Summaries, Table 1.4: Total Waterborne Commerce, 1993-2012” (Washington, DC, 2014), http://www.navigationdatacenter.us/wcsc/pdf/wcusnatl12.pdf.
18 IHS Global, Inc., “NEMS Freight Transportation Module Improvement Study” (June 20, 2014).19 U.S. Department of Transportation, Federal Highway Administration, “Freight Analysis Framework,” http://www.ops.fhwa.dot.gov/freight/freight_
analysis/faf/.20 U.S. Environmental Protection Agency, “MARPOL Annex VI” (Washington, DC: January 14, 2015), http://www2.epa.gov/enforcement/marpol-
annex-vi.21 Liquid fuels (or petroleum and other liquids) include crude oil and products of petroleum refining, natural gas liquids, biofuels, and liquids derived
from other hydrocarbon sources (including coal-to-liquids and gas-to-liquids).
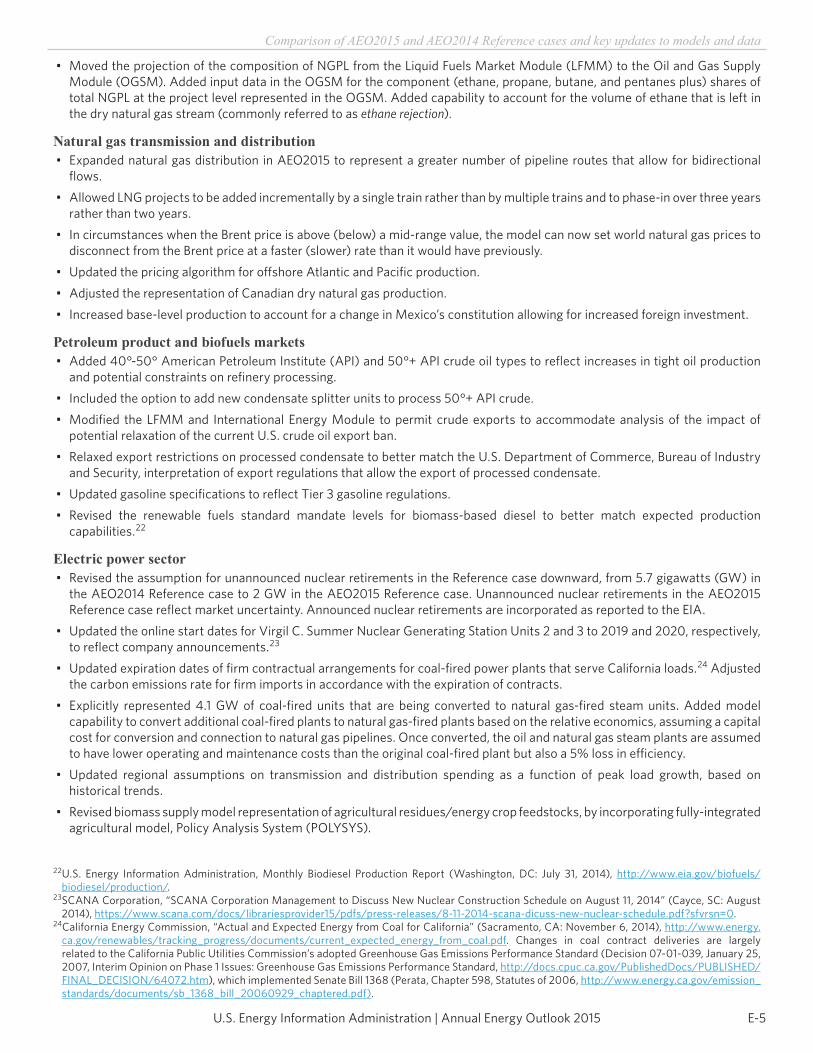
E-5U.S. Energy Information Administration | Annual Energy Outlook 2015
Comparison of AEO2015 and AEO2014 Reference cases and key updates to models and data
• Moved the projection of the composition of NGPL from the Liquid Fuels Market Module (LFMM) to the Oil and Gas Supply Module (OGSM). Added input data in the OGSM for the component (ethane, propane, butane, and pentanes plus) shares of total NGPL at the project level represented in the OGSM. Added capability to account for the volume of ethane that is left in the dry natural gas stream (commonly referred to as ethane rejection).
Natural gas transmission and distribution• Expanded natural gas distribution in AEO2015 to represent a greater number of pipeline routes that allow for bidirectional
flows.• Allowed LNG projects to be added incrementally by a single train rather than by multiple trains and to phase-in over three years
rather than two years.• In circumstances when the Brent price is above (below) a mid-range value, the model can now set world natural gas prices to
disconnect from the Brent price at a faster (slower) rate than it would have previously.• Updated the pricing algorithm for offshore Atlantic and Pacific production.• Adjusted the representation of Canadian dry natural gas production.• Increased base-level production to account for a change in Mexico’s constitution allowing for increased foreign investment.
Petroleum product and biofuels markets• Added 40°-50° American Petroleum Institute (API) and 50°+ API crude oil types to reflect increases in tight oil production
and potential constraints on refinery processing.
• Included the option to add new condensate splitter units to process 50°+ API crude.• Modified the LFMM and International Energy Module to permit crude exports to accommodate analysis of the impact of
potential relaxation of the current U.S. crude oil export ban.• Relaxed export restrictions on processed condensate to better match the U.S. Department of Commerce, Bureau of Industry
and Security, interpretation of export regulations that allow the export of processed condensate.• Updated gasoline specifications to reflect Tier 3 gasoline regulations.• Revised the renewable fuels standard mandate levels for biomass-based diesel to better match expected production
capabilities.22
Electric power sector• Revised the assumption for unannounced nuclear retirements in the Reference case downward, from 5.7 gigawatts (GW) in
the AEO2014 Reference case to 2 GW in the AEO2015 Reference case. Unannounced nuclear retirements in the AEO2015 Reference case reflect market uncertainty. Announced nuclear retirements are incorporated as reported to the EIA.
• Updated the online start dates for Virgil C. Summer Nuclear Generating Station Units 2 and 3 to 2019 and 2020, respectively, to reflect company announcements.23
• Updated expiration dates of firm contractual arrangements for coal-fired power plants that serve California loads.24 Adjusted the carbon emissions rate for firm imports in accordance with the expiration of contracts.
• Explicitly represented 4.1 GW of coal-fired units that are being converted to natural gas-fired steam units. Added model capability to convert additional coal-fired plants to natural gas-fired plants based on the relative economics, assuming a capital cost for conversion and connection to natural gas pipelines. Once converted, the oil and natural gas steam plants are assumed to have lower operating and maintenance costs than the original coal-fired plant but also a 5% loss in efficiency.
• Updated regional assumptions on transmission and distribution spending as a function of peak load growth, based on historical trends.
• Revised biomass supply model representation of agricultural residues/energy crop feedstocks, by incorporating fully-integrated agricultural model, Policy Analysis System (POLYSYS).
22 U.S. Energy Information Administration, Monthly Biodiesel Production Report (Washington, DC: July 31, 2014), http://www.eia.gov/biofuels/biodiesel/production/.
23 SCANA Corporation, “SCANA Corporation Management to Discuss New Nuclear Construction Schedule on August 11, 2014” (Cayce, SC: August 2014), https://www.scana.com/docs/librariesprovider15/pdfs/press-releases/8-11-2014-scana-dicuss-new-nuclear-schedule.pdf?sfvrsn=0.
24 California Energy Commission, “Actual and Expected Energy from Coal for California” (Sacramento, CA: November 6, 2014), http://www.energy.ca.gov/renewables/tracking_progress/documents/current_expected_energy_from_coal.pdf. Changes in coal contract deliveries are largely related to the California Public Utilities Commission’s adopted Greenhouse Gas Emissions Performance Standard (Decision 07-01-039, January 25, 2007, Interim Opinion on Phase 1 Issues: Greenhouse Gas Emissions Performance Standard, http://docs.cpuc.ca.gov/PublishedDocs/PUBLISHED/FINAL_DECISION/64072.htm), which implemented Senate Bill 1368 (Perata, Chapter 598, Statutes of 2006, http://www.energy.ca.gov/emission_standards/documents/sb_1368_bill_20060929_chaptered.pdf).
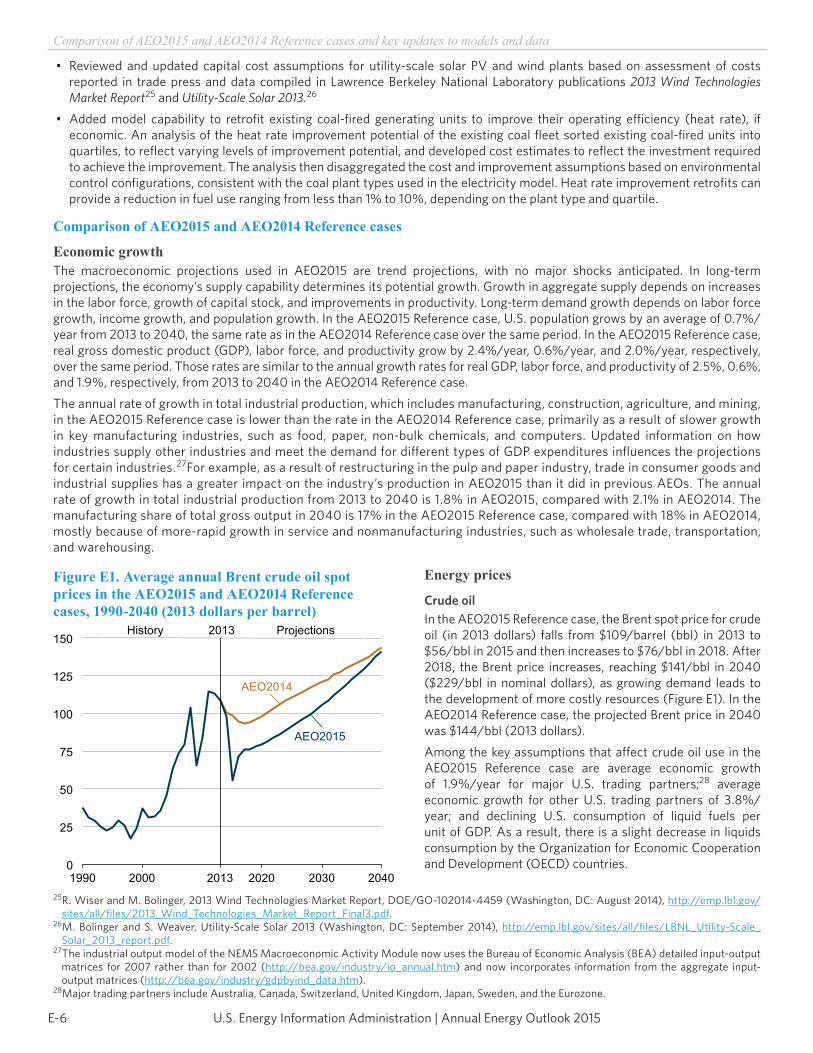
U.S. Energy Information Administration | Annual Energy Outlook 2015E-6
Comparison of AEO2015 and AEO2014 Reference cases and key updates to models and data
• Reviewed and updated capital cost assumptions for utility-scale solar PV and wind plants based on assessment of costsreported in trade press and data compiled in Lawrence Berkeley National Laboratory publications 2013 Wind TechnologiesMarket Report25 and Utility-Scale Solar 2013.26
• Added model capability to retrofit existing coal-fired generating units to improve their operating efficiency (heat rate), ifeconomic. An analysis of the heat rate improvement potential of the existing coal fleet sorted existing coal-fired units intoquartiles, to reflect varying levels of improvement potential, and developed cost estimates to reflect the investment requiredto achieve the improvement. The analysis then disaggregated the cost and improvement assumptions based on environmental control configurations, consistent with the coal plant types used in the electricity model. Heat rate improvement retrofits canprovide a reduction in fuel use ranging from less than 1% to 10%, depending on the plant type and quartile.
Comparison of AEO2015 and AEO2014 Reference cases
Economic growthThe macroeconomic projections used in AEO2015 are trend projections, with no major shocks anticipated. In long-term projections, the economy’s supply capability determines its potential growth. Growth in aggregate supply depends on increases in the labor force, growth of capital stock, and improvements in productivity. Long-term demand growth depends on labor force growth, income growth, and population growth. In the AEO2015 Reference case, U.S. population grows by an average of 0.7%/year from 2013 to 2040, the same rate as in the AEO2014 Reference case over the same period. In the AEO2015 Reference case, real gross domestic product (GDP), labor force, and productivity grow by 2.4%/year, 0.6%/year, and 2.0%/year, respectively, over the same period. Those rates are similar to the annual growth rates for real GDP, labor force, and productivity of 2.5%, 0.6%, and 1.9%, respectively, from 2013 to 2040 in the AEO2014 Reference case.The annual rate of growth in total industrial production, which includes manufacturing, construction, agriculture, and mining, in the AEO2015 Reference case is lower than the rate in the AEO2014 Reference case, primarily as a result of slower growth in key manufacturing industries, such as food, paper, non-bulk chemicals, and computers. Updated information on how industries supply other industries and meet the demand for different types of GDP expenditures influences the projections for certain industries.27For example, as a result of restructuring in the pulp and paper industry, trade in consumer goods and industrial supplies has a greater impact on the industry’s production in AEO2015 than it did in previous AEOs. The annual rate of growth in total industrial production from 2013 to 2040 is 1.8% in AEO2015, compared with 2.1% in AEO2014. The manufacturing share of total gross output in 2040 is 17% in the AEO2015 Reference case, compared with 18% in AEO2014, mostly because of more-rapid growth in service and nonmanufacturing industries, such as wholesale trade, transportation, and warehousing.
Energy prices
Crude oilIn the AEO2015 Reference case, the Brent spot price for crude oil (in 2013 dollars) falls from $109/barrel (bbl) in 2013 to $56/bbl in 2015 and then increases to $76/bbl in 2018. After 2018, the Brent price increases, reaching $141/bbl in 2040 ($229/bbl in nominal dollars), as growing demand leads to the development of more costly resources (Figure E1). In the AEO2014 Reference case, the projected Brent price in 2040 was $144/bbl (2013 dollars).Among the key assumptions that affect crude oil use in the AEO2015 Reference case are average economic growth of 1.9%/year for major U.S. trading partners;28 average economic growth for other U.S. trading partners of 3.8%/year; and declining U.S. consumption of liquid fuels per unit of GDP. As a result, there is a slight decrease in liquids consumption by the Organization for Economic Cooperation and Development (OECD) countries.
25 R. Wiser and M. Bolinger, 2013 Wind Technologies Market Report, DOE/GO-102014-4459 (Washington, DC: August 2014), http://emp.lbl.gov/sites/all/files/2013_Wind_Technologies_Market_Report_Final3.pdf.
26 M. Bolinger and S. Weaver, Utility-Scale Solar 2013 (Washington, DC: September 2014), http://emp.lbl.gov/sites/all/files/LBNL_Utility-Scale_Solar_2013_report.pdf.
27 The industrial output model of the NEMS Macroeconomic Activity Module now uses the Bureau of Economic Analysis (BEA) detailed input-output matrices for 2007 rather than for 2002 (http://bea.gov/industry/io_annual.htm) and now incorporates information from the aggregate input-output matrices (http://bea.gov/industry/gdpbyind_data.htm).
28 Major trading partners include Australia, Canada, Switzerland, United Kingdom, Japan, Sweden, and the Eurozone.
0
25
50
75
100
125
150
1990 2000 2013 2020 2030 2040
History 2013 Projections
AEO2014
AEO2015
Figure E1. Average annual Brent crude oil spot prices in the AEO2015 and AEO2014 Reference cases, 1990-2040 (2013 dollars per barrel)
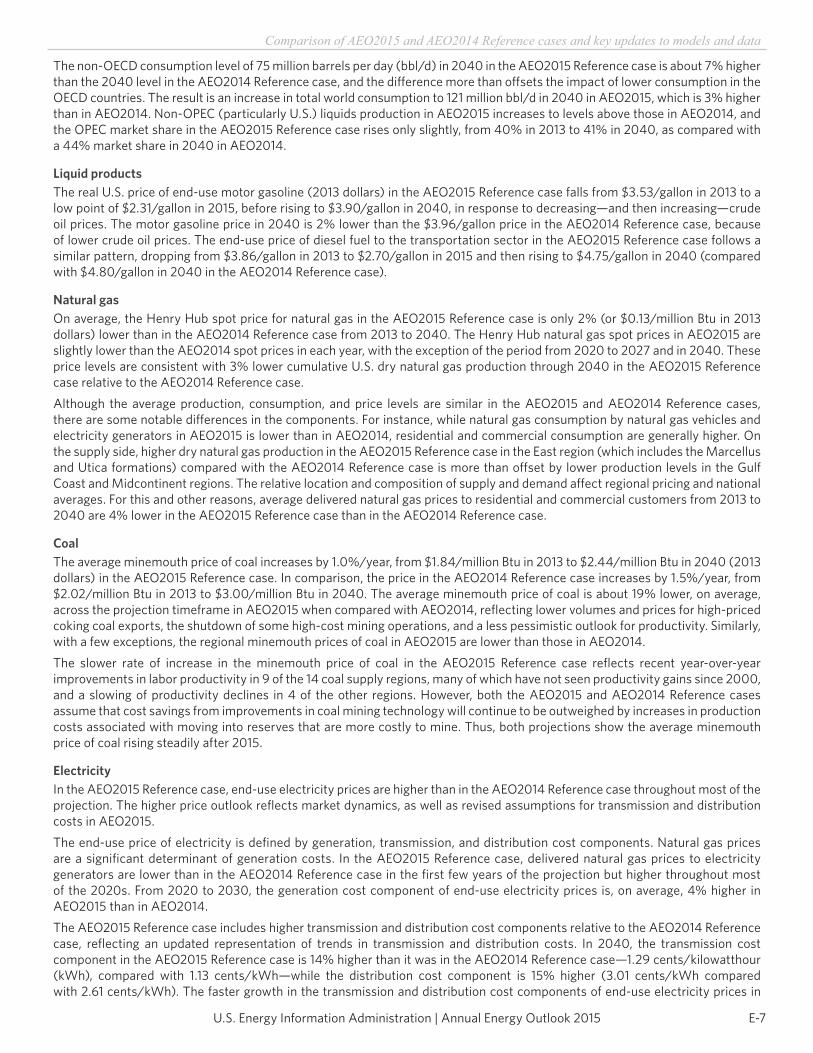
E-7U.S. Energy Information Administration | Annual Energy Outlook 2015
Comparison of AEO2015 and AEO2014 Reference cases and key updates to models and data
The non-OECD consumption level of 75 million barrels per day (bbl/d) in 2040 in the AEO2015 Reference case is about 7% higher than the 2040 level in the AEO2014 Reference case, and the difference more than offsets the impact of lower consumption in the OECD countries. The result is an increase in total world consumption to 121 million bbl/d in 2040 in AEO2015, which is 3% higher than in AEO2014. Non-OPEC (particularly U.S.) liquids production in AEO2015 increases to levels above those in AEO2014, and the OPEC market share in the AEO2015 Reference case rises only slightly, from 40% in 2013 to 41% in 2040, as compared with a 44% market share in 2040 in AEO2014.
Liquid productsThe real U.S. price of end-use motor gasoline (2013 dollars) in the AEO2015 Reference case falls from $3.53/gallon in 2013 to a low point of $2.31/gallon in 2015, before rising to $3.90/gallon in 2040, in response to decreasing—and then increasing—crude oil prices. The motor gasoline price in 2040 is 2% lower than the $3.96/gallon price in the AEO2014 Reference case, because of lower crude oil prices. The end-use price of diesel fuel to the transportation sector in the AEO2015 Reference case follows a similar pattern, dropping from $3.86/gallon in 2013 to $2.70/gallon in 2015 and then rising to $4.75/gallon in 2040 (compared with $4.80/gallon in 2040 in the AEO2014 Reference case).
Natural gasOn average, the Henry Hub spot price for natural gas in the AEO2015 Reference case is only 2% (or $0.13/million Btu in 2013 dollars) lower than in the AEO2014 Reference case from 2013 to 2040. The Henry Hub natural gas spot prices in AEO2015 are slightly lower than the AEO2014 spot prices in each year, with the exception of the period from 2020 to 2027 and in 2040. These price levels are consistent with 3% lower cumulative U.S. dry natural gas production through 2040 in the AEO2015 Reference case relative to the AEO2014 Reference case.Although the average production, consumption, and price levels are similar in the AEO2015 and AEO2014 Reference cases, there are some notable differences in the components. For instance, while natural gas consumption by natural gas vehicles and electricity generators in AEO2015 is lower than in AEO2014, residential and commercial consumption are generally higher. On the supply side, higher dry natural gas production in the AEO2015 Reference case in the East region (which includes the Marcellus and Utica formations) compared with the AEO2014 Reference case is more than offset by lower production levels in the Gulf Coast and Midcontinent regions. The relative location and composition of supply and demand affect regional pricing and national averages. For this and other reasons, average delivered natural gas prices to residential and commercial customers from 2013 to 2040 are 4% lower in the AEO2015 Reference case than in the AEO2014 Reference case.
CoalThe average minemouth price of coal increases by 1.0%/year, from $1.84/million Btu in 2013 to $2.44/million Btu in 2040 (2013 dollars) in the AEO2015 Reference case. In comparison, the price in the AEO2014 Reference case increases by 1.5%/year, from $2.02/million Btu in 2013 to $3.00/million Btu in 2040. The average minemouth price of coal is about 19% lower, on average, across the projection timeframe in AEO2015 when compared with AEO2014, reflecting lower volumes and prices for high-priced coking coal exports, the shutdown of some high-cost mining operations, and a less pessimistic outlook for productivity. Similarly, with a few exceptions, the regional minemouth prices of coal in AEO2015 are lower than those in AEO2014.The slower rate of increase in the minemouth price of coal in the AEO2015 Reference case reflects recent year-over-year improvements in labor productivity in 9 of the 14 coal supply regions, many of which have not seen productivity gains since 2000, and a slowing of productivity declines in 4 of the other regions. However, both the AEO2015 and AEO2014 Reference cases assume that cost savings from improvements in coal mining technology will continue to be outweighed by increases in production costs associated with moving into reserves that are more costly to mine. Thus, both projections show the average minemouth price of coal rising steadily after 2015.
ElectricityIn the AEO2015 Reference case, end-use electricity prices are higher than in the AEO2014 Reference case throughout most of the projection. The higher price outlook reflects market dynamics, as well as revised assumptions for transmission and distribution costs in AEO2015.The end-use price of electricity is defined by generation, transmission, and distribution cost components. Natural gas prices are a significant determinant of generation costs. In the AEO2015 Reference case, delivered natural gas prices to electricity generators are lower than in the AEO2014 Reference case in the first few years of the projection but higher throughout most of the 2020s. From 2020 to 2030, the generation cost component of end-use electricity prices is, on average, 4% higher in AEO2015 than in AEO2014.The AEO2015 Reference case includes higher transmission and distribution cost components relative to the AEO2014 Reference case, reflecting an updated representation of trends in transmission and distribution costs. In 2040, the transmission cost component in the AEO2015 Reference case is 14% higher than it was in the AEO2014 Reference case—1.29 cents/kilowatthour (kWh), compared with 1.13 cents/kWh—while the distribution cost component is 15% higher (3.01 cents/kWh compared with 2.61 cents/kWh). The faster growth in the transmission and distribution cost components of end-use electricity prices in
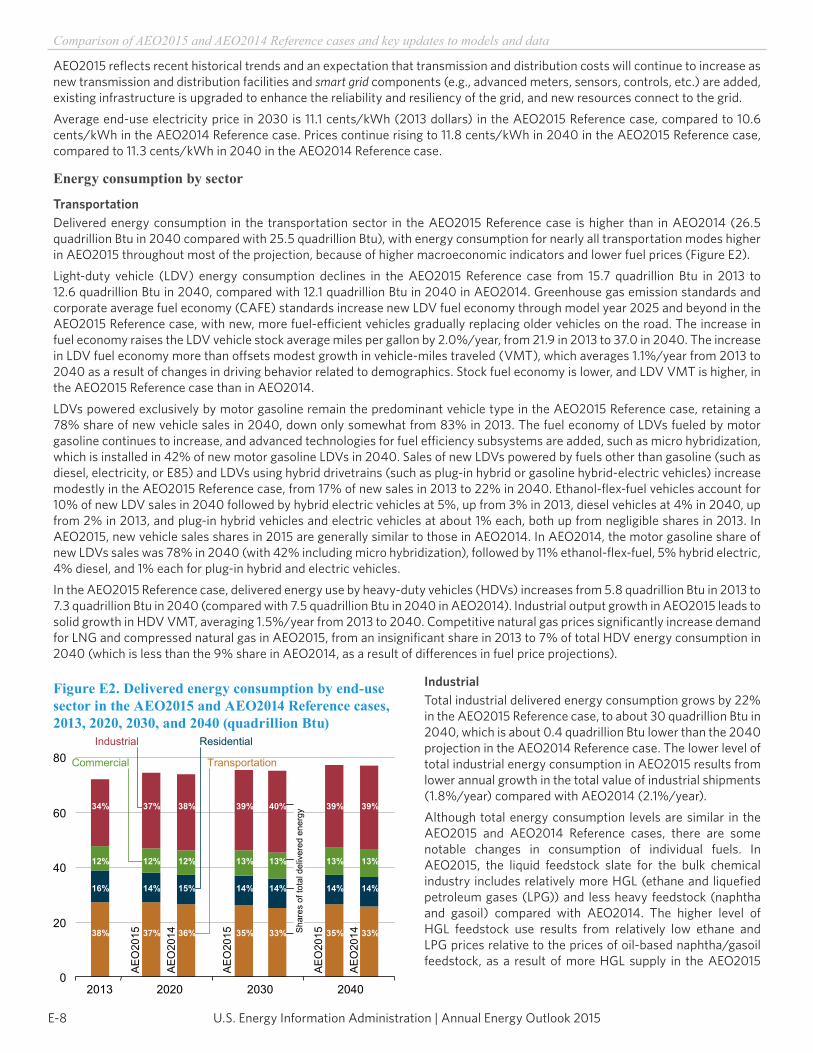
U.S. Energy Information Administration | Annual Energy Outlook 2015E-8
Comparison of AEO2015 and AEO2014 Reference cases and key updates to models and data
AEO2015 reflects recent historical trends and an expectation that transmission and distribution costs will continue to increase as new transmission and distribution facilities and smart grid components (e.g., advanced meters, sensors, controls, etc.) are added, existing infrastructure is upgraded to enhance the reliability and resiliency of the grid, and new resources connect to the grid.Average end-use electricity price in 2030 is 11.1 cents/kWh (2013 dollars) in the AEO2015 Reference case, compared to 10.6 cents/kWh in the AEO2014 Reference case. Prices continue rising to 11.8 cents/kWh in 2040 in the AEO2015 Reference case, compared to 11.3 cents/kWh in 2040 in the AEO2014 Reference case.
Energy consumption by sector
TransportationDelivered energy consumption in the transportation sector in the AEO2015 Reference case is higher than in AEO2014 (26.5 quadrillion Btu in 2040 compared with 25.5 quadrillion Btu), with energy consumption for nearly all transportation modes higher in AEO2015 throughout most of the projection, because of higher macroeconomic indicators and lower fuel prices (Figure E2).Light-duty vehicle (LDV) energy consumption declines in the AEO2015 Reference case from 15.7 quadrillion Btu in 2013 to 12.6 quadrillion Btu in 2040, compared with 12.1 quadrillion Btu in 2040 in AEO2014. Greenhouse gas emission standards and corporate average fuel economy (CAFE) standards increase new LDV fuel economy through model year 2025 and beyond in the AEO2015 Reference case, with new, more fuel-efficient vehicles gradually replacing older vehicles on the road. The increase in fuel economy raises the LDV vehicle stock average miles per gallon by 2.0%/year, from 21.9 in 2013 to 37.0 in 2040. The increase in LDV fuel economy more than offsets modest growth in vehicle-miles traveled (VMT), which averages 1.1%/year from 2013 to 2040 as a result of changes in driving behavior related to demographics. Stock fuel economy is lower, and LDV VMT is higher, in the AEO2015 Reference case than in AEO2014.LDVs powered exclusively by motor gasoline remain the predominant vehicle type in the AEO2015 Reference case, retaining a 78% share of new vehicle sales in 2040, down only somewhat from 83% in 2013. The fuel economy of LDVs fueled by motor gasoline continues to increase, and advanced technologies for fuel efficiency subsystems are added, such as micro hybridization, which is installed in 42% of new motor gasoline LDVs in 2040. Sales of new LDVs powered by fuels other than gasoline (such as diesel, electricity, or E85) and LDVs using hybrid drivetrains (such as plug-in hybrid or gasoline hybrid-electric vehicles) increase modestly in the AEO2015 Reference case, from 17% of new sales in 2013 to 22% in 2040. Ethanol-flex-fuel vehicles account for 10% of new LDV sales in 2040 followed by hybrid electric vehicles at 5%, up from 3% in 2013, diesel vehicles at 4% in 2040, up from 2% in 2013, and plug-in hybrid vehicles and electric vehicles at about 1% each, both up from negligible shares in 2013. In AEO2015, new vehicle sales shares in 2015 are generally similar to those in AEO2014. In AEO2014, the motor gasoline share of new LDVs sales was 78% in 2040 (with 42% including micro hybridization), followed by 11% ethanol-flex-fuel, 5% hybrid electric, 4% diesel, and 1% each for plug-in hybrid and electric vehicles.In the AEO2015 Reference case, delivered energy use by heavy-duty vehicles (HDVs) increases from 5.8 quadrillion Btu in 2013 to 7.3 quadrillion Btu in 2040 (compared with 7.5 quadrillion Btu in 2040 in AEO2014). Industrial output growth in AEO2015 leads to solid growth in HDV VMT, averaging 1.5%/year from 2013 to 2040. Competitive natural gas prices significantly increase demand for LNG and compressed natural gas in AEO2015, from an insignificant share in 2013 to 7% of total HDV energy consumption in 2040 (which is less than the 9% share in AEO2014, as a result of differences in fuel price projections).
IndustrialTotal industrial delivered energy consumption grows by 22% in the AEO2015 Reference case, to about 30 quadrillion Btu in 2040, which is about 0.4 quadrillion Btu lower than the 2040 projection in the AEO2014 Reference case. The lower level of total industrial energy consumption in AEO2015 results from lower annual growth in the total value of industrial shipments (1.8%/year) compared with AEO2014 (2.1%/year).Although total energy consumption levels are similar in the AEO2015 and AEO2014 Reference cases, there are some notable changes in consumption of individual fuels. In AEO2015, the liquid feedstock slate for the bulk chemical industry includes relatively more HGL (ethane and liquefied petroleum gases (LPG)) and less heavy feedstock (naphtha and gasoil) compared with AEO2014. The higher level of HGL feedstock use results from relatively low ethane and LPG prices relative to the prices of oil-based naphtha/gasoil feedstock, as a result of more HGL supply in the AEO2015
0
20
40
60
80
2013
AEO
2015
AEO
2014
2020 2030 2040
AEO
2015
AEO
2015
AEO
2014
Industrial
Transportation
Residential
Commercial
38%
16%
34%
12%
37%
14%
37%
12%
36%
15%
38%
12%
35%
14%
39%
13%
33%
14%
40%
13%
35%
14%
39%
13%
33%
14%
39%
13%
Sha
res
of to
tal d
eliv
ered
ene
rgy
Figure E2. Delivered energy consumption by end-use sector in the AEO2015 and AEO2014 Reference cases, 2013, 2020, 2030, and 2040 (quadrillion Btu)
E-9U.S. Energy Information Administration | Annual Energy Outlook 2015
Comparison of AEO2015 and AEO2014 Reference cases and key updates to models and data
Reference case than in AEO2014 and the implementation of a new ethane pricing model that links ethane prices more closely with natural gas prices.Another notable change from AEO2014 in the AEO2015 Reference case is that total consumption of renewable fuels is more than 0.5 quadrillion Btu lower in AEO2015 as a result of lower shipments from the paper and pulp industry. Industrial electricity consumption is also lower in AEO2015, in part as a result of lower shipments of metal-based durables, especially computers. Through 2022, natural gas consumption is higher in the AEO2015 Reference case than in AEO2014, as a result of higher lease and plant fuel use and an increase in feedstock use, reflecting more optimistic assumptions for ammonia and methanol plant operations based on recent trends. However, after 2022 natural gas consumption is lower in the AEO2015 Reference case, because of lower lease and plant fuel use stemming from lower dry natural gas production, and because of lower shipments in the natural gas-intensive paper and pulp industry.
ResidentialResidential delivered energy consumption decreases slightly in the AEO2015 Reference case from 2013 to 2040, with growth in electricity consumption offset by declining use of fossil fuels. Consumption levels are lower than those in the AEO2014 Reference case for most fuels, although natural gas use is slightly higher because of lower projected prices. Delivered electricity consumption is 5.4 quadrillion Btu and natural gas consumption is 4.3 quadrillion Btu in 2040 in AEO2015, compared with 5.7 quadrillion Btu and 4.2 quadrillion Btu, respectively, in AEO2014. The lower consumption levels in AEO2015 are explained in part by slower near-term growth in the number of households.
CommercialCommercial sector delivered energy consumption grows from 8.7 quadrillion Btu in 2013 to 10.1 quadrillion Btu in 2040 in the AEO2015 Reference case, similar to the AEO2014 Reference case, despite higher consumption in the near term. Commercial electricity consumption increases by 0.8%/year from 2013 to 2040 in AEO2015, lower than the 1.0% average annual growth in commercial floorspace, in part, because of lower demand for lighting and refrigeration than projected in AEO2014.
Energy consumption by primary fuelTotal primary energy consumption grows by 8.8% in the AEO2015 Reference case, from 97.1 quadrillion Btu in 2013 to 105.7 quadrillion Btu in 2040—600 trillion Btu less than in AEO2014, where total primary energy consumption grew by 10.2% to 106.3 quadrillion Btu in 2040 (Figure E3).Total liquid fuels consumption increases slightly (300 trillion Btu) in the AEO2015 Reference case (the AEO2014 Reference case showed a decline of 600 trillion Btu), as declining consumption of motor gasoline offsets most of the growth in other liquids uses from 2013 to 2040. However, total liquid fuel consumption is 0.9 quadrillion Btu higher in 2040 in the AEO2015 Reference case than in the AEO2014 Reference case. Jet fuel, motor gasoline, and industrial propane use are each about 500 trillion Btu higher in 2040 in AEO2015 than in AEO2014, as a result of updates and revisions made in the air transportation model and lower petroleum fuel prices, as well as upward revisions in output projections for the chemical industry. Liquids consumption in the transportation sector also increases in AEO2015 as the result of the addition of an unspecified consumption sector, which was added to improve the consistency of matching travel and efficiency levels with implied fuel use in the transportation sector, so that total consumption of liquid fuels in AEO2015 agrees more closely with the combined total for all fuels reported as being supplied to markets in EIA statistical publications.
In the AEO2015 Reference case, domestic natural gas consumption increases from 26.2 trillion cubic feet (Tcf) in 2013 to 29.7 Tcf in 2040, 1.9 Tcf lower than in the AEO2014 Reference case. The lower level of total natural gas consumption results from a 1.9 Tcf lower level of natural gas use in the electric power sector in 2040 in AEO2015. Natural gas consumption in the residential and commercial sectors is up slightly.In the electric power sector, natural gas faces increased competition from nuclear power and renewables, particularly wind. Also, demand for electricity in the buildings sector in 2040 is about 0.3 quadrillion Btu lower than in AEO2014, as a result of increases in building efficiency standards and updates to lighting parameters in AEO2015. Electricity demand is also lower in some industrial sectors where output does not increase as rapidly in AEO2015 as was projected in AEO2014.Total coal consumption in the AEO2015 Reference case is 19.0 quadrillion Btu (988 million short tons) in 2040—similar to the AEO2014 Reference case projection of 18.7 quadrillion Btu (979 million short tons) in 2040.0
10
20
30
40
Petro
leum
and
oth
er li
quid
s
Liqu
id b
iofu
els
Nuc
lear
Coa
lO
ther
rene
wab
les
Nat
ural
gas
Sha
res
of to
tal
prim
ary
ener
gy
8%
36%
1%
18%
8%27
%
8%
32%
1%
18%
10%
30%
8%
33%
1%
18%
10%
29%
2013 2040 2040
AEO2014 AEO2015
Figure E3. Primary energy consumption by fuel in the AEO2015 and AEO2014 Reference cases, 2013 and 2040 (quadrillion Btu)
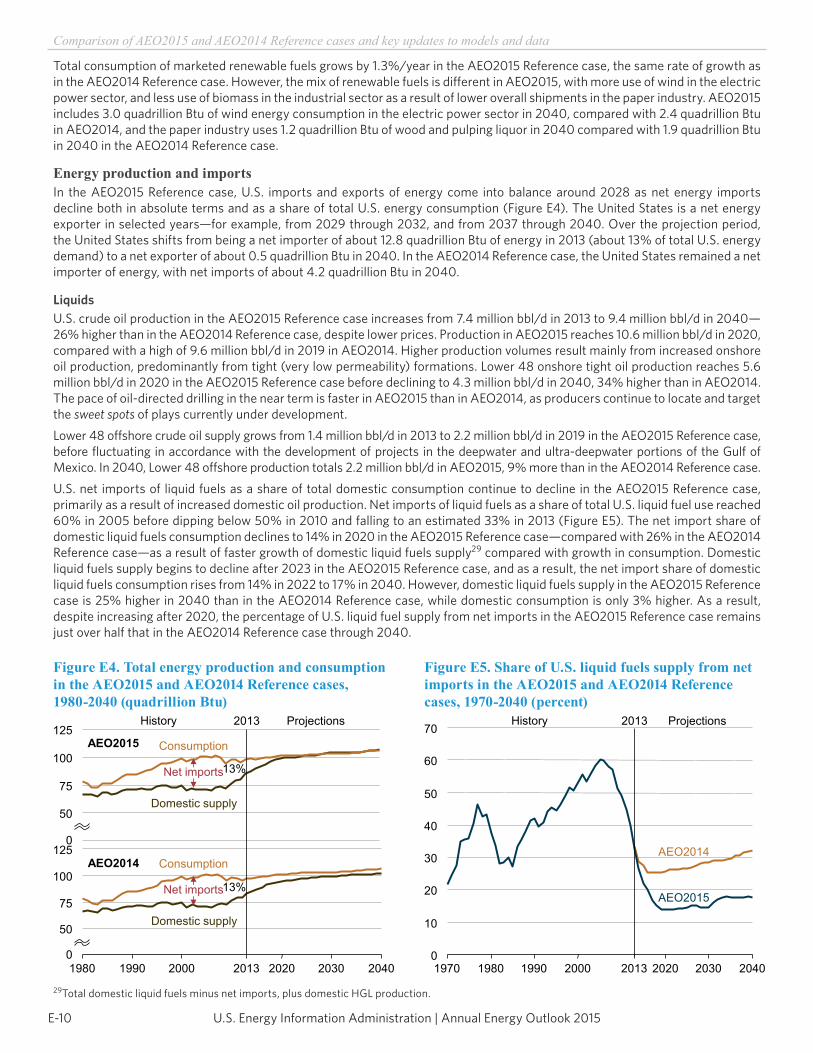
U.S. Energy Information Administration | Annual Energy Outlook 2015E-10
Comparison of AEO2015 and AEO2014 Reference cases and key updates to models and data
Total consumption of marketed renewable fuels grows by 1.3%/year in the AEO2015 Reference case, the same rate of growth as in the AEO2014 Reference case. However, the mix of renewable fuels is different in AEO2015, with more use of wind in the electric power sector, and less use of biomass in the industrial sector as a result of lower overall shipments in the paper industry. AEO2015 includes 3.0 quadrillion Btu of wind energy consumption in the electric power sector in 2040, compared with 2.4 quadrillion Btu in AEO2014, and the paper industry uses 1.2 quadrillion Btu of wood and pulping liquor in 2040 compared with 1.9 quadrillion Btu in 2040 in the AEO2014 Reference case.
Energy production and importsIn the AEO2015 Reference case, U.S. imports and exports of energy come into balance around 2028 as net energy imports decline both in absolute terms and as a share of total U.S. energy consumption (Figure E4). The United States is a net energy exporter in selected years—for example, from 2029 through 2032, and from 2037 through 2040. Over the projection period, the United States shifts from being a net importer of about 12.8 quadrillion Btu of energy in 2013 (about 13% of total U.S. energy demand) to a net exporter of about 0.5 quadrillion Btu in 2040. In the AEO2014 Reference case, the United States remained a net importer of energy, with net imports of about 4.2 quadrillion Btu in 2040.
LiquidsU.S. crude oil production in the AEO2015 Reference case increases from 7.4 million bbl/d in 2013 to 9.4 million bbl/d in 2040—26% higher than in the AEO2014 Reference case, despite lower prices. Production in AEO2015 reaches 10.6 million bbl/d in 2020, compared with a high of 9.6 million bbl/d in 2019 in AEO2014. Higher production volumes result mainly from increased onshore oil production, predominantly from tight (very low permeability) formations. Lower 48 onshore tight oil production reaches 5.6 million bbl/d in 2020 in the AEO2015 Reference case before declining to 4.3 million bbl/d in 2040, 34% higher than in AEO2014. The pace of oil-directed drilling in the near term is faster in AEO2015 than in AEO2014, as producers continue to locate and target the sweet spots of plays currently under development.Lower 48 offshore crude oil supply grows from 1.4 million bbl/d in 2013 to 2.2 million bbl/d in 2019 in the AEO2015 Reference case, before fluctuating in accordance with the development of projects in the deepwater and ultra-deepwater portions of the Gulf of Mexico. In 2040, Lower 48 offshore production totals 2.2 million bbl/d in AEO2015, 9% more than in the AEO2014 Reference case.U.S. net imports of liquid fuels as a share of total domestic consumption continue to decline in the AEO2015 Reference case, primarily as a result of increased domestic oil production. Net imports of liquid fuels as a share of total U.S. liquid fuel use reached 60% in 2005 before dipping below 50% in 2010 and falling to an estimated 33% in 2013 (Figure E5). The net import share of domestic liquid fuels consumption declines to 14% in 2020 in the AEO2015 Reference case—compared with 26% in the AEO2014 Reference case—as a result of faster growth of domestic liquid fuels supply29 compared with growth in consumption. Domestic liquid fuels supply begins to decline after 2023 in the AEO2015 Reference case, and as a result, the net import share of domestic liquid fuels consumption rises from 14% in 2022 to 17% in 2040. However, domestic liquid fuels supply in the AEO2015 Reference case is 25% higher in 2040 than in the AEO2014 Reference case, while domestic consumption is only 3% higher. As a result, despite increasing after 2020, the percentage of U.S. liquid fuel supply from net imports in the AEO2015 Reference case remains just over half that in the AEO2014 Reference case through 2040.
29 Total domestic liquid fuels minus net imports, plus domestic HGL production.
0
50
75
100
125
0
50
75
100
125
1980 1990 2000 2013 2020 2030 2040
2013 ProjectionsHistory
AEO2015
AEO2014
Net imports13%
Consumption
Domestic supply
Net imports
Consumption
Domestic supply
13%
Figure E4. Total energy production and consumption in the AEO2015 and AEO2014 Reference cases, 1980-2040 (quadrillion Btu)
0
10
20
30
40
50
60
70
1970 1980 1990 2000 2013 2020 2030 2040
2013 ProjectionsHistory
AEO2014
AEO2015
Figure E5. Share of U.S. liquid fuels supply from net imports in the AEO2015 and AEO2014 Reference cases, 1970-2040 (percent)
E-11U.S. Energy Information Administration | Annual Energy Outlook 2015
Comparison of AEO2015 and AEO2014 Reference cases and key updates to models and data
Natural gasIn the AEO2015 Reference case, U.S. production of dry natural gas after 2019 is lower than in the AEO2014 Reference case projection, and in 2040 it is lower by more than 2 trillion cubic feet (Tcf). Lower production levels are a result of lower natural gas prices and a decrease in demand for natural gas by electricity generators because of fewer nuclear plant retirements and more renewable generation capacity in AEO2015. However, dry natural gas production from shale gas and tight oil plays is generally higher in AEO2015, offsetting some of the decreases in other areas. Increases in shale gas production are made possible by the dual application of horizontal drilling and hydraulic fracturing. Another contributing factor is ongoing drilling in shale plays and other resources with high concentrations of natural gas liquids and crude oil, which, in energy-equivalent terms, have a higher value than dry natural gas, even with lower crude oil prices.In the AEO2015 Reference case, the United States becomes an overall net exporter of natural gas in 2017, one year earlier than in AEO2014, and a net pipeline exporter of natural gas in 2018, three years earlier than in AEO2014. In the AEO2015 Reference case, imports from Canada, which largely enter the western United States, and exports into Canada, which generally exit out of the East, are generally lower than in the AEO2014 Reference case. Imports from Canada remain lower in the AEO2015 Reference case than in the AEO2014 Reference case through 2040, while exports to Canada are higher in the AEO2015 Reference case from 2021 to 2028, before decreasing below AEO2014 levels through 2040. Net pipeline imports from Canada fall steadily until 2030 in AEO2015, then increase modestly through 2040, when growth in shale production stabilizes in the United States but continues to increase in Canada.Net pipeline exports to Mexico increase almost twofold in the AEO2015 Reference case from 2017 to 2040, with additional pipeline infrastructure added to enable the Mexican market to receive more natural gas via pipeline from the United States. However, pipeline exports to Mexico in the later years of the AEO2015 Reference case are lower than projected in the AEO2014 Reference case, because Mexico is assumed to increase domestic production as a result of constitutional reforms that permit more foreign investment in its oil and natural gas industry.Beginning in 2024, exports of liquefied natural gas (LNG) are slightly lower in the AEO2015 Reference case than in AEO2014, driven by lower crude oil prices. However, the impact of crude oil prices on the projection is dampened by changes in assumptions about how rapidly new LNG export terminals will be built.
CoalTotal U.S. coal production in the AEO2015 Reference case grows at an average rate of 0.5%/year, from 985 million short tons (19.9 quadrillion Btu) in 2013 to 1,117 million short tons (22.5 quadrillion Btu) in 2040. In comparison, U.S. production in the AEO2014 Reference case was projected to increase by 0.3%/year, from 1,022 million short tons (20.7 quadrillion Btu) in 2013 to 1,121 million short tons (22.4 quadrillion Btu) in 2040. Actual coal production in 2013 was 4% lower than projected in AEO2014, as a result of a large drawdown of coal inventories at coal-fired power plants.From 2013 through 2020, coal production in the AEO2015 Reference case is lower than projected in the AEO2014 Reference case, as lower natural gas prices result in the substitution of natural gas for coal in power generation. After 2020, total coal production in the AEO2014 and AEO2015 projections are nearly identical, with both hovering around 1.1 billion short tons through 2040, because of similar patterns of capacity additions and retirements at coal-fired power plants and similar coal-fired capacity utilization rates in the two projections. The outlook for U.S. coal exports is lower in AEO2015 than in AEO2014 throughout the projection period. Between 2013 and 2015, U.S. coal exports decline sharply in the AEO2015 Reference case as a result of strong international competition and lower international coal prices; but from 2015 through 2040 they increase gradually. Compared with AEO2014, coal exports in AEO2015 are 27% lower in 2015 and 13% lower in 2040.Overall, regional patterns of U.S. coal production are similar in the AEO2015 and AEO2014 Reference cases. Production in the Eastern Interior region increases in both projections by about 100 million short tons from 2013 to 2040. The AEO2015 outlook for Central Appalachian coal production is similar to the AEO2014, but is about 7 million short tons (7%) higher, on average, than the AEO2014 from 2015 through 2040. Northern Appalachian coal production in 2040 is 20 million short tons lower in AEO2015 than projected in the AEO2014 Reference case. Production from Wyoming’s Powder River Basin, currently the lead coal-producing region in the United States, is lower from 2013 through 2018 in AEO2015 than projected in AEO2014, but then increases at a more rapid pace through 2026 before declining slightly and eventually moving to levels consistent with the AEO2014 projection from 2032 through 2040.
Electricity generationTotal electricity consumption in the AEO2015 Reference case, including both purchases from electric power producers and on-site generation, grows from 3,836 billion kWh in 2013 to 4,797 billion kWh in 2040. The average annual increase of 0.8% from 2013 to 2040 is slightly below the 1.0% annual rate in the AEO2014 Reference case. In all the end-use sectors, electricity demand growth is slower than projected in AEO2014, with the largest difference in growth in the residential sector.Coal has traditionally been the largest energy source for electricity generation. However, the combination of slow growth in electricity demand, competitively priced natural gas, programs encouraging renewable fuel use, and the implementation of environmental rules dampens future coal use in both the AEO2015 and AEO2014 Reference cases. Beginning in 2019, coal-fired

U.S. Energy Information Administration | Annual Energy Outlook 2015E-12
Comparison of AEO2015 and AEO2014 Reference cases and key updates to models and data
electricity generation is between 2% and 4% percent higher in the AEO2015 Reference case than in AEO2014 through 2025, as a result of higher natural gas prices. After 2025, coal-fired generation remains between one and two percent higher in AEO2015 than in AEO2014 (Figure E6). The AEO2015 Reference case does not include the proposed Clean Power Plan30 for existing fossil-fuel-fired electric generating units, which, if implemented, could substantially change the generation mix.Coal accounted for 39% of total generation in 2013, and its share falls to 34% in 2040 in the AEO2015 Reference case. The coal share of total generation was lower at 32% in 2040 in the AEO2014 Reference case. With retirements of coal-fired generating capacity far outpacing new additions, total coal-fired generating capacity falls in the AEO2015 Reference case from 304 GW in 2013 to 260 GW in 2040, which is similar to the 2040 capacity projection in the AEO2014 Reference case.Electricity generation from natural gas grows at a slower rate in the AEO2015 Reference case than in the AEO2014 Reference case because of lower growth in overall electricity demand, higher natural gas prices in the midterm, fewer nuclear retirements, and more renewable capacity additions leading to less need for new natural gas-fired capacity. In the AEO2015 Reference case, natural gas-fired generation in 2040 is 15% lower than projected in the AEO2014 Reference case. Natural gas capacity additions still make up most (58%) of total capacity additions from 2014 to 2040 but represent a smaller share of new builds than the 74% of total additions projected in AEO2014. As a share of total generation, natural gas does not surpass the coal-fired generation share in the AEO2015 Reference case over the projection period as it did in the AEO2014 Reference case.Increased generation from renewable energy accounts for 38% of the overall growth in electricity generation from 2013 to 2040 in the AEO2015 Reference case. Generation from renewable resources grows in the near term as new capacity under construction comes online in response to federal tax credits, state-level policies, and declining capital costs for wind and solar projects. In the final decade of the projection, renewable generation growth is almost exclusively the result of the increasing cost-competiveness of renewable generation with other, nonrenewable technologies.Renewable generation is higher throughout most of the projection period in AEO2015 than was projected in AEO2014, and it is about 7% higher in 2040. Combined generation from solar and wind power in AEO2015 is about 28% higher in 2040 than projected in AEO2014, as a result of more planned renewable capacity additions and recent declines in the construction costs for new wind plants. Renewable generation accounts for 18% of total generation in 2040 in the AEO2015 Reference case, compared with 16% in AEO2014.In the AEO2015 Reference case, electricity generation from nuclear power plants increases by 6%, from 789 billion kWh in 2013 to 833 billion kWh in 2040, and accounts for about 16% of total generation in 2040, slightly above the share in AEO2014. Over the projection period, nuclear generation in AEO2015 is on average 3% higher than projected in AEO2014, with about 4 GW less nuclear capacity retired from 2013 to 2020 in the AEO2015 Reference case, compared to the AEO2014 Reference case.
Energy-related CO2 emissionsTotal U.S. energy-related CO2 emissions remain well below their 2005 level of 5,993 million metric tons (mt) through the end of the projection period in the AEO2015 Reference case.31 Energy-related CO2 emissions in 2040 are 5,549 million mt, or 50 million mt (0.9%) below the AEO2014 Reference case projection. This decrease may appear counterintuitive, since coal consumption is 1.4% higher, petroleum and other liquids consumption is 2.4% higher, and total renewable energy consumption is lower, all putting upward pressure on emissions. However, natural gas consumption is 5.6% lower, and while it has a lower carbon factor than the other fossil fuels, it does emit CO2. Nuclear energy consumption in 2040 is 2.8% higher in AEO2015 than in AEO2014, and total energy demand is 0.5% lower. The net result is somewhat lower energy-related CO2 emissions in the AEO2015 Reference case than in the AEO2014 Reference case.
30 U.S. Environmental Protection Agency, “Carbon Pollution Emission Guidelines for Existing Stationary Sources: Electric Utility Generating Units,” Federal Register, pp. 34829-34958 (Washington, DC: June 18, 2014) https://www.federalregister.gov/articles/2014/06/18/2014-13726/carbon-pollution-emission-guidelines-for-existing-stationary-sources-electric-utility-generating.
31 The year 2005 is the base year for the Obama Administration’s goal for emission reductions of 17% by 2020. In the AEO2015 Reference case, energy-related CO2 emissions in 2020 are 8% below the 2005 level.
0
2
4
6
AEO2014 AEO2015 AEO2014 AEO2015 AEO2014 AEO201520132020 2030 2040
Petroleum and other liquidsNuclearCoal
RenewablesNatural gas
Figure E6. Electricity generation by fuel in the AEO2015 and AEO2014 Reference cases, 2013, 2020, 2030, and 2040 (trillion kilowatthours)
E-13U.S. Energy Information Administration | Annual Energy Outlook 2015
Comparison of AEO2015 and AEO2014 Reference cases and key updates to models and data
Table E1. Comparison of projections in the AEO2015 and AEO2014 Reference cases, 2012-40: AEO2015 National Energy Modeling System, run REF2015.D021915A; and AEO2014 National Energy Modeling System, run REF2014.D102413A.Figure E1. Average annual Brent crude oil spot prices in the AEO2015 and AEO2014 Reference cases, 1990-2040: History: U.S. Energy Information Administration, Monthly Energy Review, November 2014, DOE/EIA-0035(2014/11). Projections: AEO2015 National Energy Modeling System, run REF2015.D021915A; and AEO2014 National Energy Modeling System, run REF2014.D102413A.Figure E2. Delivered energy consumption by end-use sector in the AEO2015 and AEO2014 Reference cases, 2013, 2020, 2030, and 2040: History: U.S. Energy Information Administration, Monthly Energy Review, November 2014, DOE/EIA-0035(2014/11). Projections: AEO2015 National Energy Modeling System, run REF2015.D021915A; and AEO2014 National Energy Modeling System, run REF2014.D102413A.Figure E3. Primary energy consumption by fuel in the AEO2015 and AEO2014 Reference cases, 2013 and 2040: History: U.S. Energy Information Administration, Monthly Energy Review, November 2014, DOE/EIA-0035(2014/11). Projections: AEO2015 National Energy Modeling System, run REF2015.D021915A; and AEO2014 National Energy Modeling System, run REF2014.D102413A.Figure E4. Total energy production and consumption in the AEO2015 and AEO2014 Reference cases, 1980-2040: History: U.S. Energy Information Administration, Monthly Energy Review, November 2014, DOE/EIA-0035(2014/11). Projections: AEO2015 National Energy Modeling System, run REF2015.D021915A; and AEO2014 National Energy Modeling System, run REF2014.D102413A.Figure E5. Share of U.S. liquid fuels supply from net imports in the AEO2015 and AEO2014 Reference cases, 1970-2040: History: U.S. Energy Information Administration, Monthly Energy Review, November 2014, DOE/EIA-0035(2014/11). Projections: AEO2015 National Energy Modeling System, run REF2015.D021915A; and AEO2014 National Energy Modeling System, run REF2014.D102413A.Figure E6. Electricity generation by fuel in the AEO2015 and AEO2014 Reference cases, 2013, 2020, 2030, and 2040: History: U.S. Energy Information Administration, Monthly Energy Review, November 2014, DOE/EIA-0035(2014/11). Projections: AEO2015 National Energy Modeling System, run REF2015.D021915A; and AEO2014 National Energy Modeling System, run REF2014.D102413A.
Figure and table sourcesLinks current as of April 2015

This page inTenTionally lefT blank
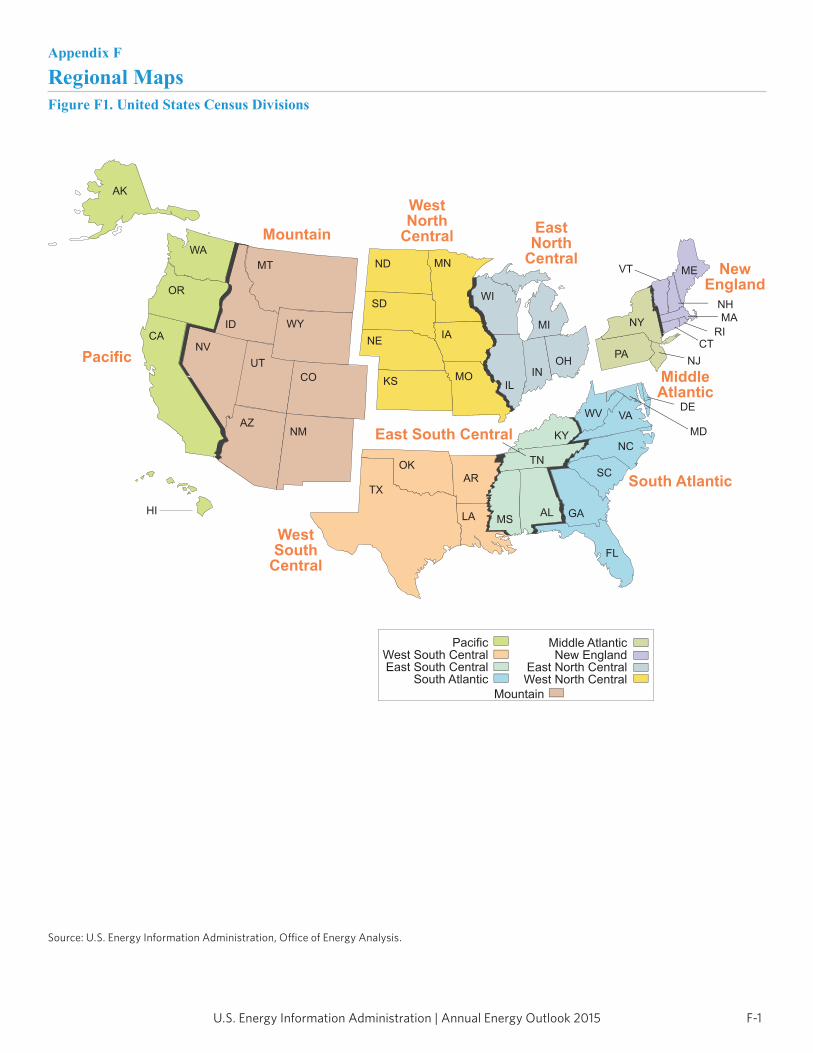
F-1U.S. Energy Information Administration | Annual Energy Outlook 2015
Source: U.S. Energy Information Administration, Office of Energy Analysis.
U.S. Energy Information Administration / Annual Energy Outlook 2010 213
Appendix F
Regional Maps
Figure F1. United States Census Divisions
Pacific
South Atlantic
MiddleAtlantic
NewEngland
WestSouth
Central
WestNorth
CentralEastNorth
Central
Mountain
AK
WA
MT
WYID
NV
UT
CO
AZNM
TX
OK
IA
KS MOIL
IN
KY
TN
MSAL
FL
GA
SC
NC
WV
PANJ
MD
DE
NY
CT
VT ME
RI
MA
NH
VA
WI
MI
OH
NE
SD
MNND
AR
LA
OR
CA
HI
Middle AtlanticNew England
East North CentralWest North Central
PacificWest South CentralEast South Central
South Atlantic
Mountain
Source: U.S. Energy Information Administration, Office of Integrated Analysis and Forecasting.
0
5
25
75
95
100
0
5
25
75
95
100
0
5
25
75
95
100
0
5
25
75
95
100
East South Central
Appendix F
Regional MapsFigure F1. United States Census Divisions

U.S. Energy Information Administration | Annual Energy Outlook 2015F-2
Regional maps
Figure F1. United States Census Divisions (continued)
Source: U.S. Energy Information Administration, Office of Energy Analysis.
Division 1New England
ConnecticutMaineMassachusettsNew HampshireRhode IslandVermont
Division 2Middle Atlantic
New JerseyNew YorkPennsylvania
Division 3East North Central
IllinoisIndianaMichiganOhioWisconsin
Division 4West North Central
IowaKansasMinnesotaMissouriNebraskaNorth DakotaSouth Dakota
Division 5South Atlantic
DelawareDistrict of ColumbiaFloridaGeorgiaMarylandNorth CarolinaSouth CarolinaVirginiaWest Virginia
Division 6East South Central
AlabamaKentuckyMississippiTennessee
Division 7West South Central
ArkansasLouisianaOklahomaTexas
Division 8Mountain
ArizonaColoradoIdahoMontanaNevadaNew MexicoUtahWyoming
Division 9Pacific
AlaskaCaliforniaHawaiiOregonWashington

F-3U.S. Energy Information Administration | Annual Energy Outlook 2015
Regional maps
Figure F2. Electricity market module regions
Source: U.S. Energy Information Administration, Office of Energy Analysis.
1
2
3
4
5 8
9
10
11
12
13
14
15 16
17
18 19
20
21
22
6
7
1. ERCT TRE All2. FRCC FRCC All3. MROE MRO East4. MROW MRO West5. NEWE NPCC New England6. NYCW NPCC NYC/Westchester7. NYLI NPCC Long Island8. NYUP NPCC Upstate NY9. RFCE RFC East
10. RFCM RFC Michigan11. RFCW RFC West
12. SRDA SERC Delta13. SRGW SERC Gateway14. SRSE SERC Southeastern15. SRCE SERC Central16. SRVC SERC VACAR17. SPNO SPP North18. SPSO SPP South19. AZNM WECC Southwest20. CAMX WECC California21. NWPP WECC Northwest22. RMPA WECC Rockies

U.S. Energy Information Administration | Annual Energy Outlook 2015F-4
Regional maps
Maritime Canada
Caribbean
PADD V -other
PADD IIlakes
PADD V -California
PADD V -other PADD III -
Gulf
PADD III -inland
PADD IPADD II -
inland
PADD IV
dadinirT dadinirTogaboT & ogaboT &
NewfoundlandNewfoundland
avoN avoNaitocS aitocS
weN weNkciwsnurB kciwsnurB
Puerto RicoPuerto Rico
LFMM regions
PADD IPADD II inlandPADD II lakes
PADD III GulfPADD III inlandPADD IV
PADD V CaliforniaPADD V otherMaritime Canada; Caribbean
PADD boundary
Figure F3. Liquid fuels market module regions
Source: U.S. Energy Information Administration, Office of Energy Analysis.
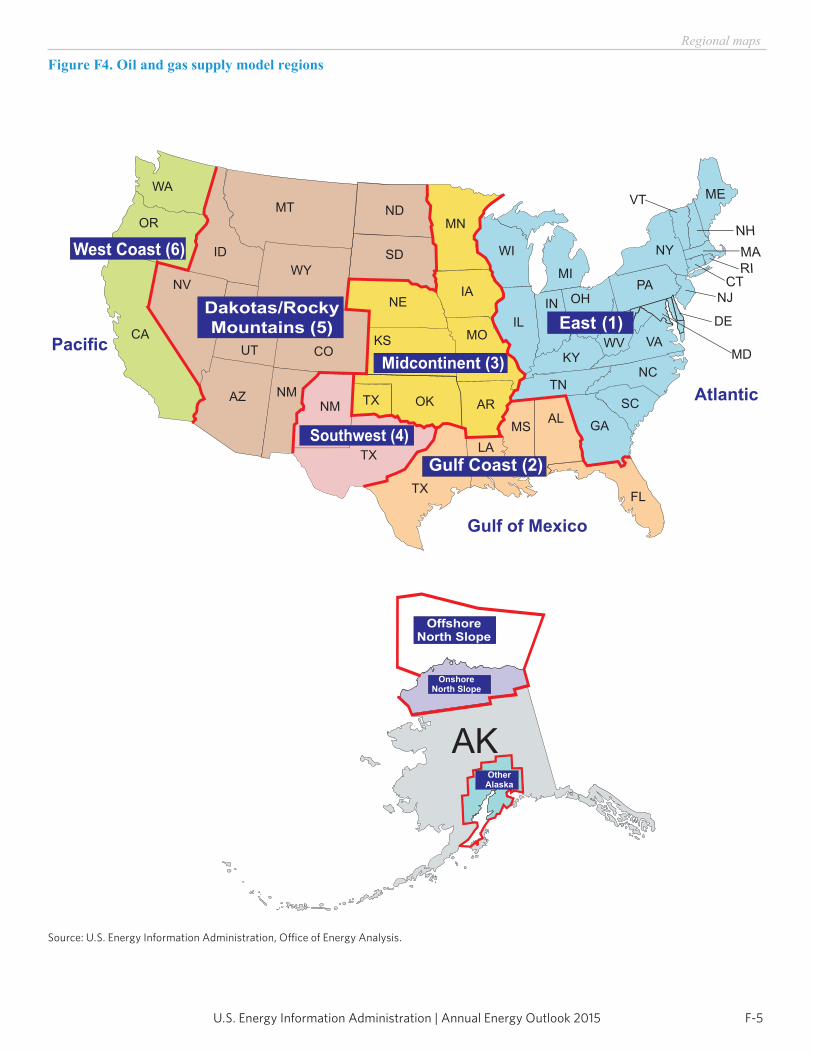
F-5U.S. Energy Information Administration | Annual Energy Outlook 2015
Regional maps
Figure F4. Oil and gas supply model regions
F-5U.S. Energy Information Administration | Annual Energy Outlook 2014
Regional maps
Figure F4. Oil and gas supply model regions
U.S. Energy Information Administration / Annual Energy Outlook 2010 217
Regional Maps
Figure F4. Oil and Gas Supply Model Regions
Atlantic
WA
MT
WY
ID
NV
UT CO
AZ NMOK
IA
KS MOIL
IN
KY
TN
MSAL
FL
GA
SC
NC
WV
PANJ
MD
DE
NY
CT
ME
RI
MA
NH
VA
WI
MI
OHNE
SD
MNND
AR
OR
CA
VT
East (1)
Gulf of Mexico
LA
Gulf Coast (2)
Midcontinent (3)
Dakotas/Rocky Mountains (5)
West Coast (6)
Pacific
OffshoreNorth Slope
AK
TX
TX
NM
TX
Southwest (4)
OnshoreNorth Slope
OtherAlaska
Source: U.S. Energy Information Administration, Office of Integrated Analysis and Forecasting.
0
5
25
75
95
100
0
5
25
75
95
100
0
5
25
75
95
100
0
5
25
75
95
100Source: U.S. Energy Information Administration, Office of Energy Analysis.Source: U.S. Energy Information Administration, Office of Energy Analysis.
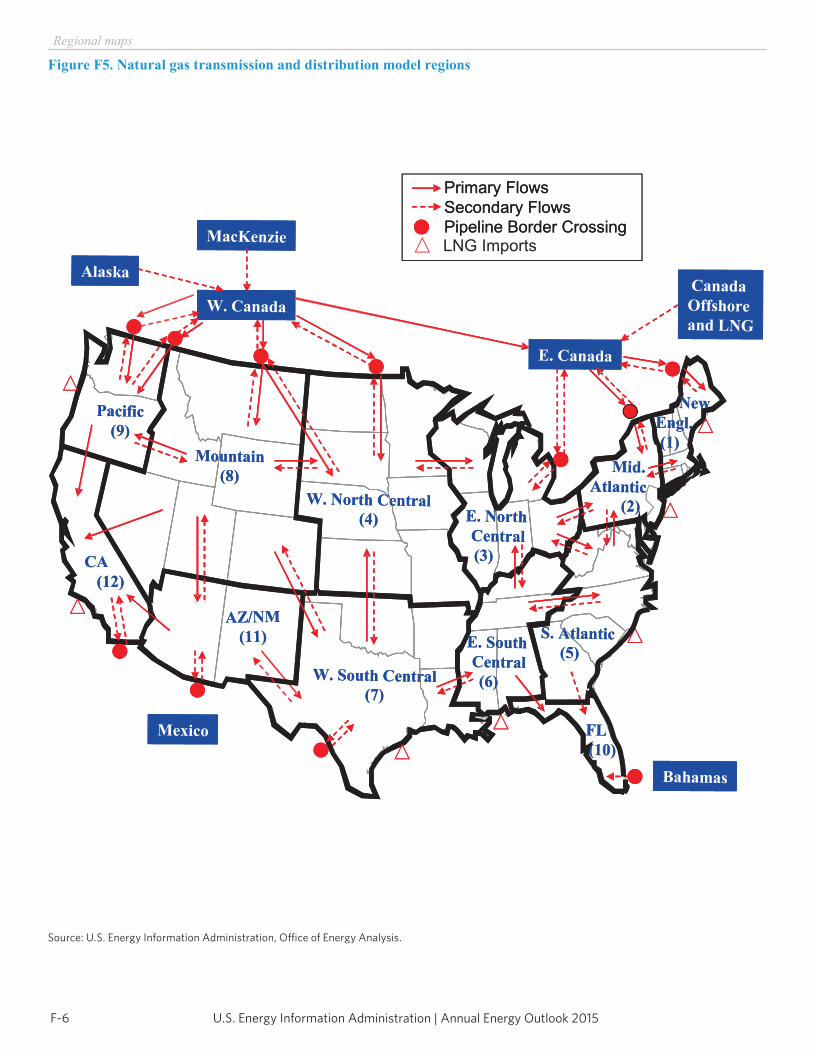
U.S. Energy Information Administration | Annual Energy Outlook 2015F-6
Regional maps
Figure F5. Natural gas transmission and distribution model regions
218 U.S. Energy Information Administration / Annual Energy Outlook 2010
Regional Maps
Figure F5. Natural Gas Transmission and Distribution Model Regions
Pacific
(9)
Mountain
(8)
CA
(12)
AZ/NM
(11)
W. North Central(4)
W. South Central(7)
E. South
Central
(6)
E. North
Central
(3)
S. Atlantic
(5)
FL
(10)
Mid.
Atlantic
(2)
New
Engl.
(1)
W. Canada
E. Canada
MacKenzie
AlaskaCanada
Offshore
and LNG
Mexico
Bahamas
Primary Flows
Secondary Flows
Pipeline Border CrossingLNG Imports
Pacific
(9)
Mountain
(8)
CA
(12)
AZ/NM
(11)
W. North Central(4)
W. South Central(7)
E. South
Central
(6)
E. North
Central
(3)
S. Atlantic
(5)
FL
(10)
Mid.
Atlantic
(2)
New
Engl.
(1)
W. Canada
E. Canada
MacKenzie
AlaskaCanada
Offshore
and LNG
Mexico
Bahamas
Primary Flows
Secondary Flows
Pipeline Border Crossing
Source: U.S. Energy Information Administration, Office of Integrated Analysis and Forecasting.
0
5
25
75
95
100
0
5
25
75
95
100
0
5
25
75
95
100
0
5
25
75
95
100
Source: U.S. Energy Information Administration, Office of Energy Analysis.
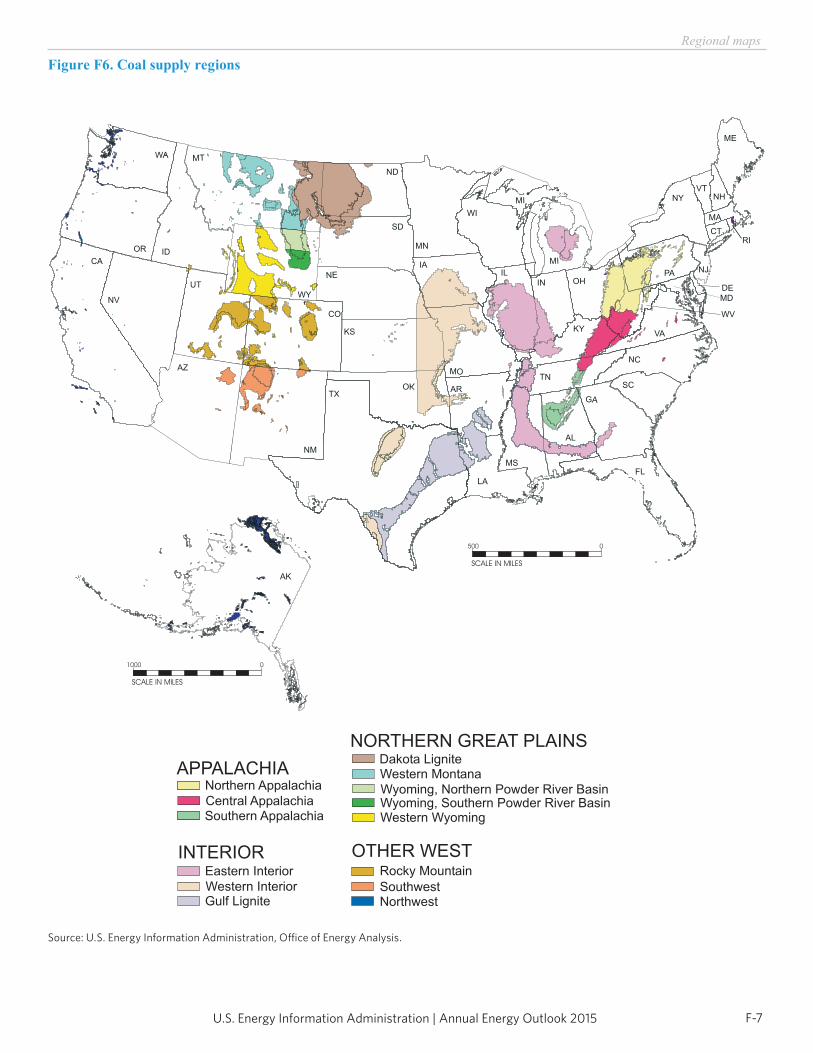
F-7U.S. Energy Information Administration | Annual Energy Outlook 2015
Regional maps
Figure F6. Coal supply regions
WA
IDOR
CA
NV
UT
TX
OKAR
MO
LA
MS
AL
GA
FL
TNSC
NC
KYVA
WV
WY
CO
SD
ND
MI
MN
WI
IL
INOH
MD
PA NJ
DE
CT
MA
NHVT
NY
ME
RI
MT
NE
IA
KS
MI
AZ
NM
500 0
SCALE IN MILES
APPALACHIANorthern Appalachia
Central AppalachiaSouthern Appalachia
INTERIOR
NORTHERN GREAT PLAINS
Eastern Interior
Western InteriorGulf Lignite
Dakota LigniteWestern Montana
Wyoming, Northern Powder River BasinWyoming, Southern Powder River BasinWestern Wyoming
OTHER WESTRocky Mountain
SouthwestNorthwest
KY
AK
1000 0
SCALE IN MILES
Source: U.S. Energy Information Administration, Office of Energy Analysis.
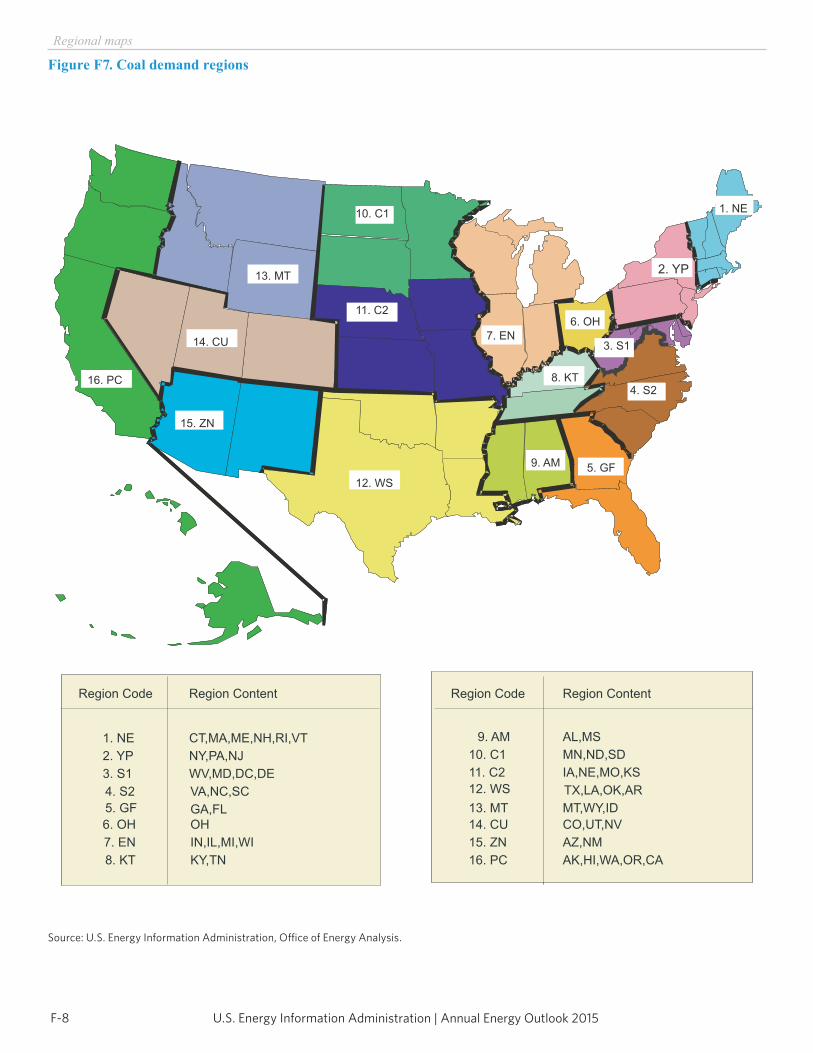
U.S. Energy Information Administration | Annual Energy Outlook 2015F-8
Regional maps
Figure F7. Coal demand regions
220 U.S. Energy Information Administration / Annual Energy Outlook 2010
Regional Maps
Figure F7. Coal Demand Regions
CT,MA,ME,NH,RI,VT
OH
1. NE
3. S1
4. S2
5. GF
6. OH
7. EN
AL,MS
MN,ND,SD
IA,NE,MO,KS
TX,LA,OK,AR
MT,WY,ID
CO,UT,NV
AZ,NM
9. AM
11. C2
12. WS
13. MT
14. CU
15. ZN
WV,MD,DC,DE
2. YP
Region ContentRegion Code
NY,PA,NJ
VA,NC,SC
GA,FL
IN,IL,MI,WI
Region ContentRegion Code
14. CU
13. MT
16. PC
15. ZN
12. WS
11. C2
9. AM 5. GF
8. KT4. S2
7. EN
6. OH
2. YP
1. NE
3. S1
10. C1
KY,TN8. KT 16. PC AK,HI,WA,OR,CA
10. C1
Source: U.S. Energy Information Administration, Office of Integrated Analysis and Forecasting.
0
5
25
75
95
100
0
5
25
75
95
100
0
5
25
75
95
100
0
5
25
75
95
100
Source: U.S. Energy Information Administration, Office of Energy Analysis.

G-1U.S. Energy Information Administration | Annual Energy Outlook 2015
Energy Information Administration / Annual Energy Outlook 20151
Table G1. Heat contentsFuel Units Approximate
heat content
Coal1
Production .................................................. million Btu per short ton 20.169 Consumption .............................................. million Btu per short ton 19.664
Coke plants ............................................. million Btu per short ton 28.710 Industrial .................................................. million Btu per short ton 21.622
Commercial and institutional ................... million Btu per short ton 21.246 Electric power sector ............................... million Btu per short ton 19.210
Imports ........................................................ million Btu per short ton 23.256 Exports ....................................................... million Btu per short ton 24.562
Coal coke ...................................................... million Btu per short ton 24.800
Crude oil1 Production .................................................. million Btu per barrel 5.751
Imports ........................................................ million Btu per barrel 6.012
Petroleum products and other liquids Consumption1 ............................................. million Btu per barrel 5.188 Motor gasoline1........................................ million Btu per barrel 5.101 Jet fuel ..................................................... million Btu per barrel 5.670 Distillate fuel oil1 ...................................... million Btu per barrel 5.760 Diesel fuel1 .............................................. million Btu per barrel 5.755 Residual fuel oil ....................................... million Btu per barrel 6.287 Liquefied petroleum gases and other1,2 ... million Btu per barrel 3.565 Kerosene ................................................. million Btu per barrel 5.670 Petrochemical feedstocks1 ...................... million Btu per barrel 4.944 Unfinished oils1 ........................................ million Btu per barrel 6.098 Imports1 ...................................................... million Btu per barrel 5.575 Exports1 ...................................................... million Btu per barrel 5.506 Ethanol3 ...................................................... million Btu per barrel 3.559 Biodiesel ..................................................... million Btu per barrel 5.359
Natural gas plant liquids1
Production .................................................. million Btu per barrel 3.735
Natural gas1
Production, dry ........................................... Btu per cubic foot 1,027 Consumption .............................................. Btu per cubic foot 1,027
End-use sectors....................................... Btu per cubic foot 1,028 Electric power sector ............................... Btu per cubic foot 1,025
Imports ........................................................ Btu per cubic foot 1,025 Exports ....................................................... Btu per cubic foot 1,009
Electricity consumption .............................. Btu per kilowatthour 3,412
1Conversion factor varies from year to year. The value shown is for 2013. 2Includes ethane, natural gasoline, and refinery olefins. 3Includes denaturant.
Btu = British thermal unit. Sources: U.S. Energy Information Administration (EIA), Monthly Energy Review, DOE/EIA-0035(2014/11) (Washington, DC,
November 2014), and EIA, AEO2015 National Energy Modeling System run REF2015.D021915A.
Appendix G
Conversion factorsTable G1. Heat contents

This page inTenTionally lefT blank