eia-914 monthly crude oil, lease condensate, and …. energy information administration | eia-94...
TRANSCRIPT

EIA-914 Monthly Crude Oil,
Lease Condensate, and Natural
Gas Production Report
Methodology
February 2017
Independent Statistics & Analysis
www.eia.gov
U.S. Department of Energy
Washington, DC 20585
U.S. Energy Information Administration | EIA-94 Monthly Crude Oil, Lease Condensate, and Natural Gas Production Report Methodology i
This methodology was prepared by the U.S. Energy Information Administration (EIA), the statistical and
analytical agency within the U.S. Department of Energy. By law, EIA’s data, analyses, and forecasts are
independent of approval by any other officer or employee of the United States Government. The views
in this therefore should not be construed as representing those of the U.S. Department of Energy or
other federal agencies.
February 2017
U.S. Energy Information Administration | EIA-94 Monthly Crude Oil, Lease Condensate, and Natural Gas Production Report Methodology i
Table of Contents
EIA-914 Monthly Crude Oil, Lease Condensate, and Natural Gas Production Report Methodology ........... 1
Executive summary .................................................................................................................................. 1
Background .............................................................................................................................................. 2
Sampling methodology ............................................................................................................................ 2
Data preparation ............................................................................................................................... 3
Cutoff sample .................................................................................................................................... 3
Adding and dropping companies ...................................................................................................... 3
Other ways companies are added or dropped ................................................................................. 4
Other states group ............................................................................................................................ 4
Estimation methodology ......................................................................................................................... 4
Lag times ........................................................................................................................................... 5
Other states ratio .............................................................................................................................. 6
Estimates of natural gas lease production and oil sales by API gravity ............................................ 7
Potential sources of errors ................................................................................................................ 7
Data quality control checks ............................................................................................................... 9
Outlier process ................................................................................................................................ 10
Imputation ....................................................................................................................................... 10
Suppression ..................................................................................................................................... 10
Coverage and Response Rate .......................................................................................................... 11

February 2017
U.S. Energy Information Administration | EIA-94 Monthly Crude Oil, Lease Condensate, and Natural Gas Production Report Methodology ii
Tables
Table 1. State lags, 2015 ............................................................................................................................... 6
Table 2. RSEs for first three months of estimates, 2015............................................................................... 9

February 2017
U.S. Energy Information Administration | EIA-94 Monthly Crude Oil, Lease Condensate, and Natural Gas Production Report Methodology 1
EIA-914 Monthly Crude Oil, Lease Condensate, and Natural Gas
Production Report Methodology
Executive summary The U.S. Energy Information Administration (EIA) currently collects survey data directly from crude oil
and natural gas producers in 15 states,1 the federal Gulf of Mexico (GOM), and other states, 2 and uses
the survey data to estimate total production for the 15 states, the GOM, other states, and the United
States. This methodology applies to estimates for natural gas production beginning with January 2015.
This methodology also applies to crude oil (and lease condensate) produced in Arkansas, California,
Colorado, Kansas, Louisiana, Montana, New Mexico, North Dakota, Ohio, Oklahoma, Pennsylvania,
Texas, Utah, West Virginia, and Wyoming, and the federal Gulf of Mexico.
EIA continues to rely on data from state and other federal agencies to estimate crude oil production for
the states within other states, which are not separately surveyed, using the Average Lagged Ratio (ALR)
method.3 The ALR method only applies to crude oil (including lease condensate) for all states through
December 2014, and only to crude oil (including lease condensate) for the states included in other states
thereafter.
EIA estimates monthly production for all individually sampled states by modeling the relationship
between final state-level data from DrillingInfo (DI), a third-party vendor of well-level data collected by
state agencies, and data reported on the EIA-914 survey. This relationship is modeled using a Weighted
Least Squares (WLS) linear regression.
Summarizing the estimation process in terms of approximate percent of U.S. oil production: 4
92% based on WLS estimates
5% is state-reported data from Alaska
3% based on ALR estimates5
1 The states directly sampled by Form EIA-914 are Arkansas, California, Colorado, Kansas, Louisiana, Montana, New Mexico,
North Dakota, Ohio, Oklahoma, Pennsylvania, Texas, Utah, West Virginia, and Wyoming, and the federal Gulf of Mexico. 2 The states not directly sampled and included in Other States are Alabama, Arizona, Florida, Illinois, Indiana, Kentucky,
Maryland, Michigan, Mississippi, Missouri, Nebraska, Nevada, New York, Oregon, South Dakota, Tennessee, and Virginia, and
federal Pacific Offshore. 3 The Average Lagged Ratio methodology used for EIA crude oil production estimation is available at
http://www.eia.gov/petroleum/supply/monthly/pdf/crudemeth.pdf. 4 The percentages of U.S. natural gas production for each, based on 2013 volumes, differs slightly as none are estimated using
the ALR method. The breakout is: 89% based on WLS estimates and 11% is state reported by Alaska. Note that 3% of the
volume estimated using WLS is for Other States, which are not individually estimated with the ALR method, which is used only
for oil production. 5 EIA continues to estimate all state crude oil production using ALR as a quality check of the WLS estimates. If EIA-914 sample
data for a state do not pass quality control checks, then the ALR estimate for the state temporarily may be substituted for the
WLS estimate for the state.

February 2017
U.S. Energy Information Administration | EIA-94 Monthly Crude Oil, Lease Condensate, and Natural Gas Production Report Methodology 2
Background The EIA-914 began collecting natural gas production data in 2005 from Texas, Oklahoma, Louisiana, New
Mexico, Wyoming, the federal Gulf of Mexico, and other states (as a group) excluding Alaska. In 2010,
EIA updated and improved the sampling and estimation methodologies. In 2015, EIA improved the EIA-
914 form to begin collecting crude oil and lease condensate production6, oil and lease condensate sales
volumes by API gravity categories,7 and expanded the collection to 16 individual states/areas adding
Arkansas, California, Colorado, Kansas, Montana, North Dakota, Ohio, Pennsylvania, Utah, and West
Virginia, while the other states category was reduced in coverage from 28 states/areas to 18
states/areas.
There are two parts to the EIA-914 process: the sampling and the estimation. There are significant
similarities to the sampling and estimation methodologies used through May 2015 reporting,8 and each
is described separately below.
Sampling methodology The EIA-914 report collects crude oil and lease condensate (combined), and natural gas production
volume data on a monthly basis by state from a sample of well operators (oil and gas companies).
(Hereafter crude oil and lease condensate are referred to as oil, and natural gas as gas.) In addition to oil
production volumes, oil sales volumes for nine API gravity categories are also collected by state/area.
Two samples, one for oil and one for gas, are drawn each month for each state/area (including other
states). Each is a cutoff sample with the cutoff production rate designed to provide 85 percent
production coverage for both oil and gas in every state/area. A sampled company reports all of its
operated oil and gas production for every state where it operates oil and gas wells if it is sampled in any
state for either its oil or gas production. This means that many states will have more than 85 percent
coverage and will yield a lower 48 states coverage of roughly 90 percent for both oil and gas production.
The total sample consists of approximately 450 operators out of roughly 13,000 oil and gas operators in
the United States. The sampled group of companies can change by as much as a dozen, but usually by
only four or five, each month by adding and dropping companies, and accounting for company
acquisitions and sales. If a sampled company’s oil and gas production falls below the cutoff production
rates in every state for six consecutive months, then it is dropped from the sample. If a nonsampled
company’s oil or gas production exceeds a sample cutoff rate in any state for four consecutive months, it
is added to the sample. Monthly sampling in this manner keeps the sample current and avoids a major
change in the sample caused by less frequent updating while minimizing sample turnover.
6 Although the survey specifies that respondent companies report their production volumes, some companies are only able to
report their crude oil and lease condensate sales volumes. EIA expects that the deviation between a company’s production and
sales will not be a large amount and that sales typically are a reasonable proxy for production. 7 During the public comment period for the expanded form, some companies reported they can more easily collect and report
API gravity information by production rather than sales. As a result, some respondent companies are reporting API gravity for
their production volumes rather than their sales volumes. 8 Natural gas estimates for April using this new methodology were released at the end of June 2015. At that time revised
estimates for January-March using this new methodology were also released.

February 2017
U.S. Energy Information Administration | EIA-94 Monthly Crude Oil, Lease Condensate, and Natural Gas Production Report Methodology 3
Data preparation
A file containing each company’s latest oil and gas production by state is prepared every month for use
in the monthly sample selection process. The latest available DrillingInfo (DI) monthly production data
are used to create this file (DI is a commercial vendor of state oil and gas production data). DI acquires
well or lease level data from state regulatory agencies, then places these data in a database format,
which it sells to third parties, such as EIA. An updated DI database is acquired by EIA every month. The
DI database is used for both the sampling and the estimation processes. Data for four of the smaller
producing states are not available from DI. For Illinois, Indiana, Kentucky, and Tennessee, annual
production data from the EIA-23 survey (Annual Survey of Domestic Oil and Gas Reserves) are used to
supplement the state data from DI. Hereafter, references to state data from DI in this document include
supplemental data from the EIA-23 report for these four states.
Cutoff sample
The oil and gas production cutoff rates for each state/area are determined once per year and then used
every month until the next year. The cutoff rates are designed to yield sample coverage of at least 85
percent of the total oil and gas production of each state. Although operators are selected based on their
oil or gas production in a particular state/area, all operators added because of their oil production have
an additional selection criterion of producing at least 500 barrels per day in at least one state/area.9
This constraint limits the number of very small operators in the sample. The application of the 500 barrel
per day minimum roughly reduces the sample size by one-half, but also yields less than the 85 percent
target coverage for oil in a few states. The loss of some state coverage is an acceptable compromise to
dramatically reduce the reporting burden on the industry. Testing has shown that this sample
methodology yields reasonable relative standard errors.10 The sample is based on coverage of
production volume to guard against model failure (see the section “Potential Sources of Errors").
Adding and dropping companies
Each operator’s recent monthly oil and gas production data are compared to the sampling cutoff rates
for oil and gas in each state (according to the sampling criteria stated above) to determine if a company
is in the sample each month. Companies meeting the criteria to be dropped from the sample are
contacted to confirm that their continued production will remain below all cutoff rates in all states for
the foreseeable future. Companies providing confirmation are dropped from the sample. Likewise,
companies meeting the criteria to be added to the sample are notified of their selection and given
instructions on how to proceed with monthly reporting. Companies with production in DI above the
cutoff for four consecutive months in any state for oil or gas are added to the sample. Conversely,
companies with survey-reported production below the cutoff for six consecutive months for oil and gas
in all states where they operate are dropped from the sample.
9 Many included operators do produce less than 500 barrels per day of oil in at least one state/area, but, if they are selected
because of their oil production, they produce at least 500 barrels per day in the state/area for which they are included in the
sample. Operators selected because of their natural gas production may produce less than 500 barrels per day of oil in all the
states/areas in which they operate, but this does not eliminate them from the sample. 10 See “Sampling Error” in the “Potential Sources of Errors” section below for more discussion of relative standard errors.
February 2017
U.S. Energy Information Administration | EIA-94 Monthly Crude Oil, Lease Condensate, and Natural Gas Production Report Methodology 4
Other ways companies are added or dropped
Mergers and acquisitions, or buying and selling properties can cause a company’s production level to
move above or below a sample cutoff value. EIA accommodates the larger company changes in the
sample as soon as possible after they occur. Large events in terms of overall production, or share of
production in one or more states/area, that involve a company currently in the sample and another that
is not in the sample are the most important to quickly accommodate in order to minimize estimation
errors (see the section “Potential Sources of Errors”). These larger events are usually in news reports,
newsletters, press releases, industry trade journals, and other media outlets. Both companies involved
in the transaction may be contacted to assure continued full accounting of production without potential
double counting. Accommodating minor events involving small companies or small volumes of
production usually are delayed if they involve only companies in the nonsampled group. Most smaller
mergers and property sales outside the sample are unknown. Information on mergers and property
acquisitions is also requested on the EIA-914 form.
Other states group
The other states group of states accounts for roughly 3 percent of lower 48 States oil and gas production
and includes 18 states. Some of these states are extremely small producers. Other states also includes
four states (Illinois, Indiana, Kentucky, and Tennessee) that are not in the DI database. Some of the 18
states do not require any production reporting for regulatory purposes, or only require annual
reporting. The largest producing states within other states typically dominate the sample and the
smallest producing states may be underrepresented by sample companies chosen because of their
production in other states. Also, sampling is affected by the absence of a precise and complete list of all
producers and their production in other states. These circumstances make it difficult to quantify sample
coverage for other states.
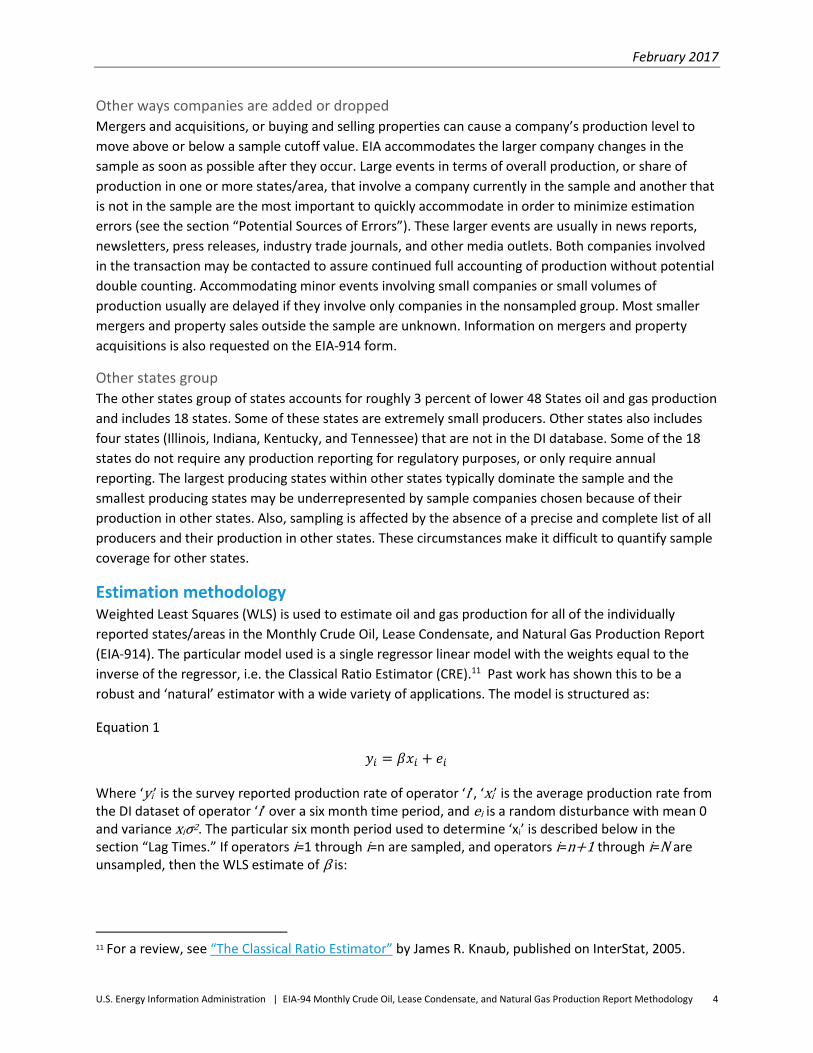
Estimation methodology Weighted Least Squares (WLS) is used to estimate oil and gas production for all of the individually
reported states/areas in the Monthly Crude Oil, Lease Condensate, and Natural Gas Production Report
(EIA-914). The particular model used is a single regressor linear model with the weights equal to the
inverse of the regressor, i.e. the Classical Ratio Estimator (CRE).11 Past work has shown this to be a
robust and ‘natural’ estimator with a wide variety of applications. The model is structured as:
Equation 1
𝑦𝑖 = 𝛽𝑥𝑖 + 𝑒𝑖 Where ‘yi’ is the survey reported production rate of operator ‘i’, ‘xi’ is the average production rate from the DI dataset of operator ‘i’ over a six month time period, and ei is a random disturbance with mean 0 and variance xiσ2. The particular six month period used to determine ‘xi’ is described below in the section “Lag Times.” If operators i=1 through i=n are sampled, and operators i=n+1 through i=N are unsampled, then the WLS estimate of β is:
11 For a review, see “The Classical Ratio Estimator” by James R. Knaub, published on InterStat, 2005.

February 2017
U.S. Energy Information Administration | EIA-94 Monthly Crude Oil, Lease Condensate, and Natural Gas Production Report Methodology 5
𝛽 =∑ 𝑦𝑖𝑛𝑖=1
∑ 𝑥𝑖𝑛𝑖=1
And the estimate of the total production for a state is equal to:
�̂� =∑ 𝑥𝑖𝑁𝑖=1 ∑ 𝑦𝑖
𝑛𝑖=1
∑ 𝑥𝑖𝑛𝑖=1
The difference between this estimate of the total and the true total has expected value 0 and variance equal to:
Equation 212
𝑉(𝑇 − �̂�) = 𝜎2 ( ∑ 𝑥𝑖
𝑁
𝑖=𝑛+1
+(∑ 𝑥𝑖
𝑁𝑖=𝑛+1 )
2
∑ 𝑥𝑖𝑁𝑖=1
)
The Standard Error described in the section “Potential Sources of Errors” is the square root of this variance. The estimator for 𝜎2 is:
𝜎2̂ =1
𝑛 − 1∑
(𝑦𝑖 − 𝑦�̂�)2
𝑥𝑖
𝑛
𝑖=1
Each month an estimate for the current month and the previous two months is generated using each month’s sample reported volumes and the latest DI database, revising the previous two month estimates.
Lag times
As described above, the ‘xi’ used in the estimation routine is a six month average production rate from
the DI dataset. The DI dataset contains all the data that DI has been able to acquire and process. The
data are released as they become available, and so are not released on the same schedule. Some states
report their data faster than others, and similarly some operators report their data faster. In addition,
revisions to the data are common for recently submitted data. As a result of these considerations, EIA
calculates a ‘most recently complete month’ for each state in the DI dataset. The methodology for this
calculation is the same as Step 1 of the ALR method as described in EIA’s methodology for crude oil
production estimates. Briefly, the methodology calculates the number of months between the report
month and the month at which the state total production volume is anticipated to be within half a
percent of its final value. The ‘xi’ are based on the most recent month with complete data and the five
months previous to it. Typical lags are given in table 1, but may be adjusted occasionally depending on
changing circumstances. For states that only report annually it is necessary to adjust their lag each
month.
12 Found in “Projected Variance for the Model-Based Classical Ratio Estimator” by James R. Knaub, published on InterStat.

February 2017
U.S. Energy Information Administration | EIA-94 Monthly Crude Oil, Lease Condensate, and Natural Gas Production Report Methodology 6
Table 1. State lags, September 2015
State Oil Lags Gas Lags
(number of months) (number of months)
Arkansas 3 3
California 4 5
Colorado 13 13
Federal Gulf of Mexico 6 5
Kansas 5 5
Louisiana 4 4
Montana 5 5
New Mexico 5 5
North Dakota 6 6
Ohio 9 9
Oklahoma 11 16
Pennsylvania 9 9
Texas 5 9
Utah 5 5
West Virginia 9 9
Wyoming 9 5
Ohio, Pennsylvania, and West Virginia report their data annually. For these states, the lag is set to place
the most recently complete month on December of the most recently reported year.
Other states ratio
For the other states, the ratio of total state reported data to the EIA-914 reported data is calculated
based on calendar year volumes and is multiplied by the current month’s EIA-914 reported volume to
determine the estimate. State production data for the other states are collected directly from the
states,13 and also may be incomplete in recent months just as the state data from DI often are for
individually sampled states. As mentioned earlier, complete production for some of the other states may
not be available. Therefore, the estimate for the other states may be lower than an estimate based on
complete production data for other states. Because one year of reported EIA-914 data will not be
available until 2016, an estimated startup ratio is determined based on historical state data from DI and
state data for both oil and gas. Until 2015 calendar year EIA-914 reported data are collected the startup
ratio will be used.
13 EIA analysts and contractors visit state websites and correspond with state officials to acquire the most recently available
production data of those states.

February 2017
U.S. Energy Information Administration | EIA-94 Monthly Crude Oil, Lease Condensate, and Natural Gas Production Report Methodology 7
Because EIA will continue publishing oil production estimates for all states individually, including states
in the other states category, EIA uses its previous oil production estimation methodology that is based
on the EIA-182 (Domestic Crude Oil First Purchase Report) data and lagged state reported data as the
official other states oil production estimation method.14 (This is the ALR method15 mentioned earlier.)
The oil production estimate described in the paragraph above is used for comparative analysis of the
individual state oil production estimates provided by the ALR method. The other states category
accounts for roughly 3 percent of the total lower 48 states production for both oil and gas.
Estimates of natural gas lease production and oil sales by API gravity
The EIA-914 collects production data for two separate gas volumes: gas gross withdrawals and lease gas
production. Natural gas gross withdrawals are generally gas production measured after lease separation.
Natural gas lease production is generally gas that comes off the lease or gas sales. The difference
between the two accounts for gas that is used on the lease for fuel, vented and flared, injected, and the
removal of non-hydrocarbon gases. Lease production is used to determine EIA’s estimates of dry gas
production. The WLS model is used to estimate gross withdrawals, and the ratio of estimated total to
sampled gross withdrawals is multiplied by sampled lease production to estimate lease production.
The EIA-914 collects production data for two separate oil volumes: oil production and oil sales by API
gravity category.16 In order to estimate state production by API category, it is assumed that state
production has the same proportional distribution of API categories as the reported API category
volumes. That is, the reported distribution of API gravity volumes (including the unknown category) is
applied to the estimated total production volume to estimate the total API gravity volumes. Although
EIA collects API gravity for 10 categories, including “unknown,” the categories are collapsed into four
categories for the reporting of state-level API gravity estimates. Many categories at the state level have
too few respondents to be reported separately because of confidentially rules. Suppression of these
under-reported categories was accomplished by collapsing categories. For example, the 40.1-45.0
category and the 45.1-50.0 category were combined to create a 40.1-50.0 category. Suppression of
these under-reported categories was accomplished by collapsing categories. Further, the state-level
volumes reported in the “unknown” category are allocated to the individual categories rather than
reported separately.
Potential sources of errors
Alignment of survey and DI datasets
Unknown, deficient reporting of, or incorrectly handled mergers and property sales are likely the largest
cause of errors. These events may occur every month, making the alignment of the survey and DI
datasets a continuous and critical task. The company production in the historical DI dataset must be
matched to the reported sample data every month. If an operator in one dataset corresponds to
different properties than in the other, the modeled relationship between ‘yi’ and ‘xi’ is invalid. The
14 An asymmetry in the estimation of gas production for Other States exists because no EIA survey collects state-level gas sales
volumes aside from Form EIA-914. Alternatively Form EIA-182 collects oil sales volumes, which may be used to estimate Other
State oil production. 15 The ALR methodology can be found at http://www.eia.gov/petroleum/supply/monthly/pdf/crudemeth.pdf. 16 Respondent companies are allowed to report production or sales volumes by API gravity category on Form EIA-914. However,
it is expected that sales are predominately reported in the API gravity portion of the survey (Part 4).

February 2017
U.S. Energy Information Administration | EIA-94 Monthly Crude Oil, Lease Condensate, and Natural Gas Production Report Methodology 8
unknown or missed events are usually small and do not contribute to significant large errors, but it is still
possible to miss a larger event. In addition to mergers, sales, and acquisitions, the following are
examples of items that can contribute to errors in the alignment of survey data with state data from DI:
name changes, multiple name spellings, companies that report under multiple names, and lags between
the time of a merger and the time of its appearance in the DI dataset. In practice, these misalignments
result in a larger estimated RSE (see below), and so are partially accounted for under ‘sampling error.’
Frame coverage
If the sampling frame (state data from DI) does not include all of the operators in a state, then part of
the population will be missing in both sampling and estimation, and estimates will be low. This is frame
coverage error. In some states, such as the previously mentioned Illinois, Indiana, Kentucky, and
Tennessee, the state data from DI are known to be missing or incomplete, and so another method is
used to estimate these states, described in the Estimation Methodology below. In other states with long
time lags (in which the most recent state data from DI may be more than a year old) frame coverage
becomes a concern, as well, since new operators may exist that are not in the frame. EIA attempts to
identify and resolve such errors through the use of additional data sources such as State reports and
publications.
Reporting errors
Reporting errors such as incorrect units or incomplete or otherwise incorrect accounting can occur on
the EIA-914. The survey instrument itself was carefully developed and includes detailed instructions for
filing data, subject to a common set of definitions similar to those already used by the industry. Editing
software has been developed to detect different kinds of probable reporting errors and to flag them for
resolution by analysts, either through confirmation of the data by the respondent or through submission
of amendments to the filed data (see the section “Data Quality Control Checks”).
Model failure
Both experience and experiment show that the model in Equation 1 holds very well. However, very
dynamic events can cause the population to behave abnormally and, particularly when combined with
long time lags in the state data from DI, the model may deviate from reality. For example, the rapid
development of the Haynesville shale in Louisiana caused a change in the State production trend that, in
turn, caused the method to overestimate for a short time late in the 2000s. EIA attempts to identify
regions that may be likely to behave in such a way, and if the deviations were to become substantial a
change to the estimation methodology, such as a stratification, would have to be made. As an additional
safeguard against model failure, EIA targets sample coverage of 85 percent in all states, so that the
effects of model failure would be minimized.
Sampling error
Sampling error may be defined as the difference between the estimates obtained from a sample and the
results that would have been obtained from a complete enumeration of the frame population. The
standard error statistic is a measure of this sampling error, and is the square root of the quantity given
in Equation 2. When presented as a percentage of the estimated total, it is called the relative standard
error (RSE). The sampling methodology described in this report has yielded RSE’s of the following
magnitudes for the first three months of gas collection.
February 2017
U.S. Energy Information Administration | EIA-94 Monthly Crude Oil, Lease Condensate, and Natural Gas Production Report Methodology 9
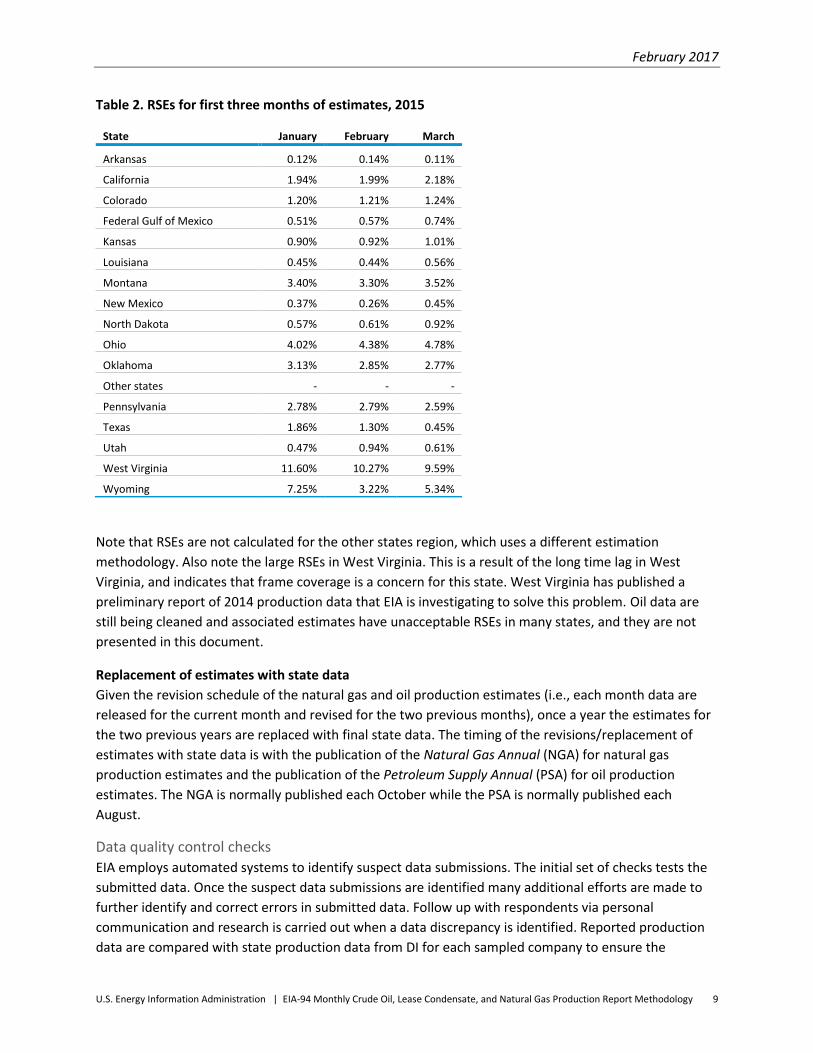
Table 2. RSEs for first three months of estimates, 2015
State January February March
Arkansas 0.12% 0.14% 0.11%
California 1.94% 1.99% 2.18%
Colorado 1.20% 1.21% 1.24%
Federal Gulf of Mexico 0.51% 0.57% 0.74%
Kansas 0.90% 0.92% 1.01%
Louisiana 0.45% 0.44% 0.56%
Montana 3.40% 3.30% 3.52%
New Mexico 0.37% 0.26% 0.45%
North Dakota 0.57% 0.61% 0.92%
Ohio 4.02% 4.38% 4.78%
Oklahoma 3.13% 2.85% 2.77%
Other states - - -
Pennsylvania 2.78% 2.79% 2.59%
Texas 1.86% 1.30% 0.45%
Utah 0.47% 0.94% 0.61%
West Virginia 11.60% 10.27% 9.59%
Wyoming 7.25% 3.22% 5.34%
Note that RSEs are not calculated for the other states region, which uses a different estimation
methodology. Also note the large RSEs in West Virginia. This is a result of the long time lag in West
Virginia, and indicates that frame coverage is a concern for this state. West Virginia has published a
preliminary report of 2014 production data that EIA is investigating to solve this problem. Oil data are
still being cleaned and associated estimates have unacceptable RSEs in many states, and they are not
presented in this document.
Replacement of estimates with state data
Given the revision schedule of the natural gas and oil production estimates (i.e., each month data are
released for the current month and revised for the two previous months), once a year the estimates for
the two previous years are replaced with final state data. The timing of the revisions/replacement of
estimates with state data is with the publication of the Natural Gas Annual (NGA) for natural gas
production estimates and the publication of the Petroleum Supply Annual (PSA) for oil production
estimates. The NGA is normally published each October while the PSA is normally published each
August.
Data quality control checks
EIA employs automated systems to identify suspect data submissions. The initial set of checks tests the
submitted data. Once the suspect data submissions are identified many additional efforts are made to
further identify and correct errors in submitted data. Follow up with respondents via personal
communication and research is carried out when a data discrepancy is identified. Reported production
data are compared with state production data from DI for each sampled company to ensure the
February 2017
U.S. Energy Information Administration | EIA-94 Monthly Crude Oil, Lease Condensate, and Natural Gas Production Report Methodology 10
companies are correctly identified and matched. Company reported data may also be compared with
their state-reported data to assure correct reporting. Mergers and property acquisitions reported in
trade press and other media are tracked and companies are routinely contacted to ensure complete
accounting without double counting or under reporting production. Companies are also contacted if an
unusual or large change in a company’s production is reported without explanation. Production
estimates are continuously compared to state reported production to check for significant differences.
Outlier process
Some responses from respondent companies are far outside the anticipated value. For example, a
company may have extreme growth or decline in recent months. Evaluations of these atypical
responses are made and, if, in the opinion of the data analysts and the survey manager, these responses
are excessively affecting the survey results, then they may be omitted from the normal estimation
process, but added-in later in the process.
Imputation
Company nonresponse occurs from time to time, and occasionally, a company may report a value that is
out of the expected range. Omitted submissions, incomplete submissions, and unexplained submitted
values that considerably deviate from historically submitted values may require an imputation. Typically,
efforts to collect accurate data from nonrespondent companies continue until they submit their data.
However, if missing data or suspicious data cannot be acquired from the company or satisfactorily
explained by the company, data are imputed at the time of estimation. For natural gas production and
sales, and oil production, imputed values are derived by using a three-month average of the most
recently available data.
If the company has been a respondent company for at least three months, then the company’s historic
EIA-914 values are used. In the absence of sufficient 914 company data, data from DI are used to
calculate the imputed values.
Oil sales volumes (oil volumes by API gravity category) may be imputed if the data are missing,
incomplete, or the distribution of submitted data across the API gravity categories deviates considerably
from those historically submitted by the respondent company. The imputed volumes are calculated
using the weighted-average distribution from the previous three months. Every effort is made to obtain
accurate data from the respondent before using an imputed value.
On rare occasions, weather events, pipeline disruptions, plant outages, or other unusual events occur
that may prevent standard imputation methods from providing reasonable values. In this situation,
EIA’s expert analysts will determine an imputed value based on industry knowledge, weather data,
information from respondents, trade press and news reports, information from state and federal
agencies, past performance, and expert judgement.
Suppression
EIA employs statistical disclosure limitation techniques to preserve the confidentiality of the information
collected on the EIA-914. The p-percent rule is applied to the statistical aggregates.

February 2017
U.S. Energy Information Administration | EIA-94 Monthly Crude Oil, Lease Condensate, and Natural Gas Production Report Methodology 11
Coverage and Response Rate
Coverage and Response Rates are published to give some insight to the quality of the data collection and
processing. Coverage is determined by dividing the reported values by the estimated values for each
state. Response rate is calculated as the volume reported by companies responding to the survey
divided by the volume of reporting companies plus the expected volume for non-reporting companies.