eia energy conference panel session -crude exports · pdf fileeia energy conference panel...
TRANSCRIPT

EIA Energy ConferencePanel session - Crude exportsAlan GelderJune 2017
Trusted commercial intelligencewww.woodmac.com
Trusted commercial intelligencewww.woodmac.com
2
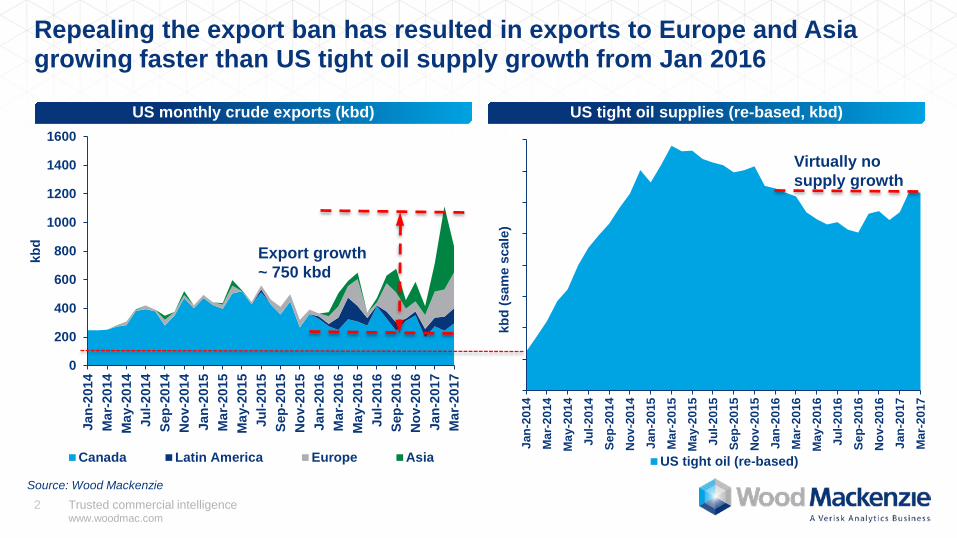
Repealing the export ban has resulted in exports to Europe and Asia growing faster than US tight oil supply growth from Jan 2016
US monthly crude exports (kbd) US tight oil supplies (re-based, kbd)
Source: Wood Mackenzie
0
200
400
600
800
1000
1200
1400
1600
Jan-
2014
Mar
-201
4M
ay-2
014
Jul-2
014
Sep-
2014
Nov
-201
4Ja
n-20
15M
ar-2
015
May
-201
5Ju
l-201
5Se
p-20
15N
ov-2
015
Jan-
2016
Mar
-201
6M
ay-2
016
Jul-2
016
Sep-
2016
Nov
-201
6Ja
n-20
17M
ar-2
017
kbd
Canada Latin America Europe Asia
Jan-
2014
Mar
-201
4M
ay-2
014
Jul-2
014
Sep-
2014
Nov
-201
4Ja
n-20
15M
ar-2
015
May
-201
5Ju
l-201
5Se
p-20
15N
ov-2
015
Jan-
2016
Mar
-201
6M
ay-2
016
Jul-2
016
Sep-
2016
Nov
-201
6Ja
n-20
17M
ar-2
017
kbd
(sam
e sc
ale)
US tight oil (re-based)
Export growth ~ 750 kbd
Virtually nosupply growth
Trusted commercial intelligencewww.woodmac.com
3
0123456789
Mill
ion
b/d
Vertical/Other HZ Wolfcamp/Bone SpringEagle Ford BakkenNiobrara Mid-Con
Source: Wood Mackenzie
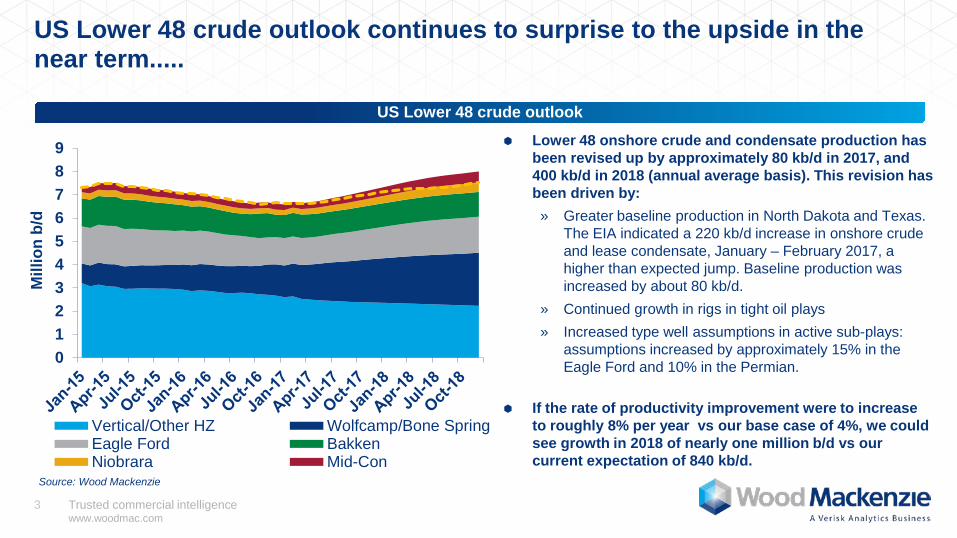
US Lower 48 crude outlook continues to surprise to the upside in the near term.....
Lower 48 onshore crude and condensate production has been revised up by approximately 80 kb/d in 2017, and 400 kb/d in 2018 (annual average basis). This revision has been driven by:» Greater baseline production in North Dakota and Texas.
The EIA indicated a 220 kb/d increase in onshore crude and lease condensate, January – February 2017, a higher than expected jump. Baseline production was increased by about 80 kb/d.
» Continued growth in rigs in tight oil plays» Increased type well assumptions in active sub-plays:
assumptions increased by approximately 15% in the Eagle Ford and 10% in the Permian.
If the rate of productivity improvement were to increase to roughly 8% per year vs our base case of 4%, we could see growth in 2018 of nearly one million b/d vs our current expectation of 840 kb/d.
US Lower 48 crude outlook
Trusted commercial intelligencewww.woodmac.com
4
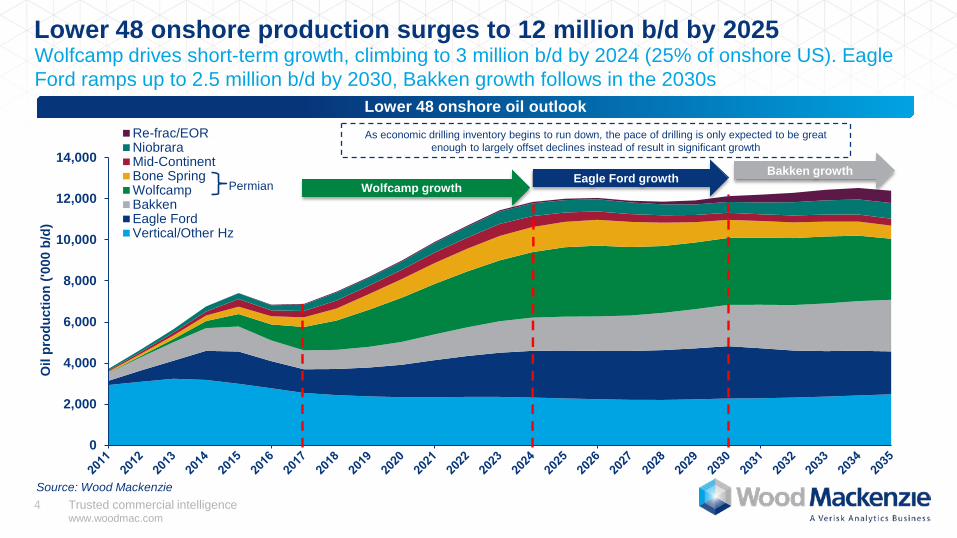
Lower 48 onshore production surges to 12 million b/d by 2025
Lower 48 onshore oil outlook
Wolfcamp drives short-term growth, climbing to 3 million b/d by 2024 (25% of onshore US). Eagle Ford ramps up to 2.5 million b/d by 2030, Bakken growth follows in the 2030s
0
2,000
4,000
6,000
8,000
10,000
12,000
14,000
Oil
prod
uctio
n ('0
00 b
/d)
Re-frac/EORNiobraraMid-ContinentBone SpringWolfcampBakkenEagle FordVertical/Other Hz
Permian
As economic drilling inventory begins to run down, the pace of drilling is only expected to be great enough to largely offset declines instead of result in significant growth
Wolfcamp growthEagle Ford growth Bakken growth
Source: Wood Mackenzie
Trusted commercial intelligencewww.woodmac.com
5
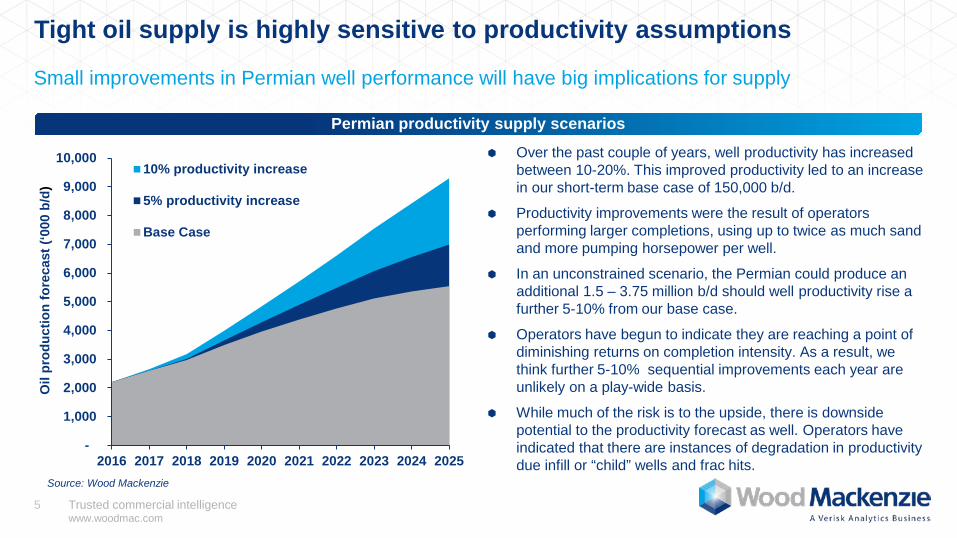
Tight oil supply is highly sensitive to productivity assumptions
-
1,000
2,000
3,000
4,000
5,000
6,000
7,000
8,000
9,000
10,000
2016 2017 2018 2019 2020 2021 2022 2023 2024 2025
Oil
prod
uctio
n fo
reca
st (‘
000
b/d)
10% productivity increase
5% productivity increase
Base Case
Source: Wood Mackenzie
Over the past couple of years, well productivity has increased between 10-20%. This improved productivity led to an increase in our short-term base case of 150,000 b/d.
Productivity improvements were the result of operators performing larger completions, using up to twice as much sand and more pumping horsepower per well.
In an unconstrained scenario, the Permian could produce an additional 1.5 – 3.75 million b/d should well productivity rise a further 5-10% from our base case.
Operators have begun to indicate they are reaching a point of diminishing returns on completion intensity. As a result, we think further 5-10% sequential improvements each year are unlikely on a play-wide basis.
While much of the risk is to the upside, there is downside potential to the productivity forecast as well. Operators have indicated that there are instances of degradation in productivity due infill or “child” wells and frac hits.
Small improvements in Permian well performance will have big implications for supply
Permian productivity supply scenarios

Trusted commercial intelligencewww.woodmac.com
6
-
5.0
10.0
15.0
20.0
2010 2011 2012 2013 2014 2015 2016 2017 2018 2019 2020 2021 2022 2023 2024 2025Heavy Medium Light
Growth in heavy Canadian oil supply outpaces declines in heavy Mexican oil supply; but crude slate gets lighterNorth American crude supply to get lighter due to US tight oil growth (excluding condensates)
North America crude oil supply outlook by quality (million bpd)
Source: Wood Mackenzie
Heavy Mexican oil production has declined for a decade while the Canadian oil sands surges ahead. We have not included the potential impact of on-going Mexican energy reform.
Note 1. < 28 API Heavy crudeNote 2. 28 – 38 API Medium crude Note 3. >38 – 51 API Light crude
Trusted commercial intelligencewww.woodmac.com
7
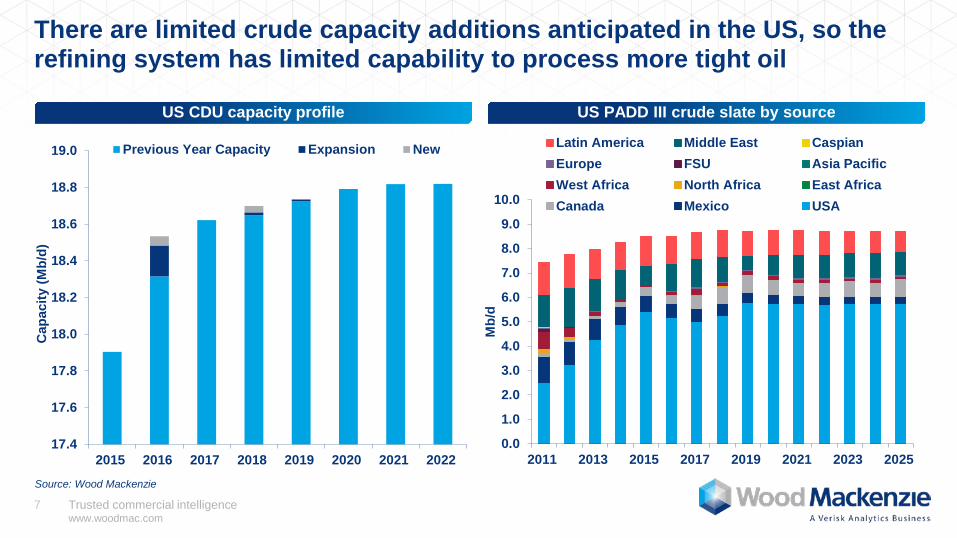
There are limited crude capacity additions anticipated in the US, so the refining system has limited capability to process more tight oil
US CDU capacity profile US PADD III crude slate by source
Source: Wood Mackenzie
0.0
1.0
2.0
3.0
4.0
5.0
6.0
7.0
8.0
9.0
10.0
2011 2013 2015 2017 2019 2021 2023 2025
Mb/
d
Latin America Middle East CaspianEurope FSU Asia PacificWest Africa North Africa East AfricaCanada Mexico USA
17.4
17.6
17.8
18.0
18.2
18.4
18.6
18.8
19.0
2015 2016 2017 2018 2019 2020 2021 2022
Cap
acity
(Mb/
d)
Previous Year Capacity Expansion New

Trusted commercial intelligencewww.woodmac.com
8
US crude export freights 2016 - 2035, $/bbl
IndiaUS
Europe
China/Korea
Canada
2015 Freight 2016-2025 Avg. Freight
$2.0/2.4
$2.8/3.5
$2.4/3.0$2.3/2.7
SuezmaxVLCC
Assuming a combination of Suezmax from Houston to Caribbean/Gulf of Mexico and then VLCC onwards after co-loading
To China/Korea
Assume a transit toll of $4.4/Ton for panama canal
Assume a transit toll of $2.2/Ton for Suez canal$1.1/1.3
US tight oil exports could hence be the order of 2 – 3 million bpd, targeting European and Asian marketsFreight costs to North Asia is double that of Europe due to longer freight distances. Export logistics infrastructure is key to facilitate the growing trade
Source: Wood Mackenzie
Trusted commercial intelligencewww.woodmac.com
9
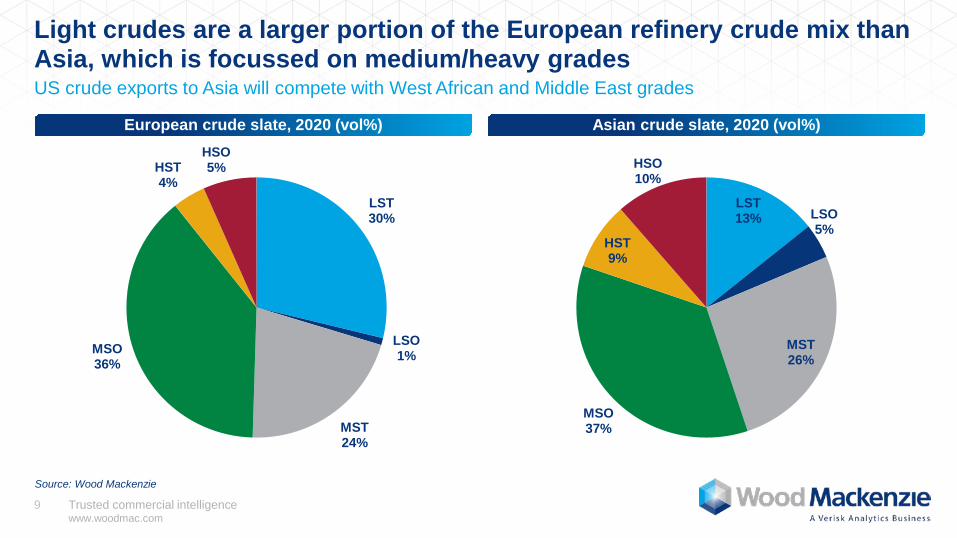
Light crudes are a larger portion of the European refinery crude mix than Asia, which is focussed on medium/heavy grades
European crude slate, 2020 (vol%) Asian crude slate, 2020 (vol%)
Source: Wood Mackenzie
LST30%
LSO1%
MST24%
MSO36%
HST4%
HSO5%
LST13% LSO
5%
MST26%
MSO37%
HST9%
HSO10%
US crude exports to Asia will compete with West African and Middle East grades

Trusted commercial intelligencewww.woodmac.com
10
European and Asian crude runs have different seasonality, suggesting crude export destinations will show such patterns
European crude runs (million bpd) Asian crude runs (million bpd)
20
22
24
26
28
30
32
Jan
Feb
Mar
Apr
May Jun
Jul
Aug Se
p
Oct
Nov Dec
Cru
de ru
ns (M
illio
n b/
d)
5 year range2016 20172018 5-yr avg
Source: History IEA MODS, APEC; Forecast Wood Mackenzie
10.0
10.5
11.0
11.5
12.0
12.5
13.0
13.5
14.0
Jan
Feb
Mar
Apr
May Jun
Jul
Aug Se
p
Oct
Nov Dec
Cru
de ru
ns (M
illio
n b/
d)
Series1 5 year range2016 20172018 5-yr avg
Source: History IEA MODS, Forecast Wood Mackenzie
Trusted commercial intelligencewww.woodmac.com
11
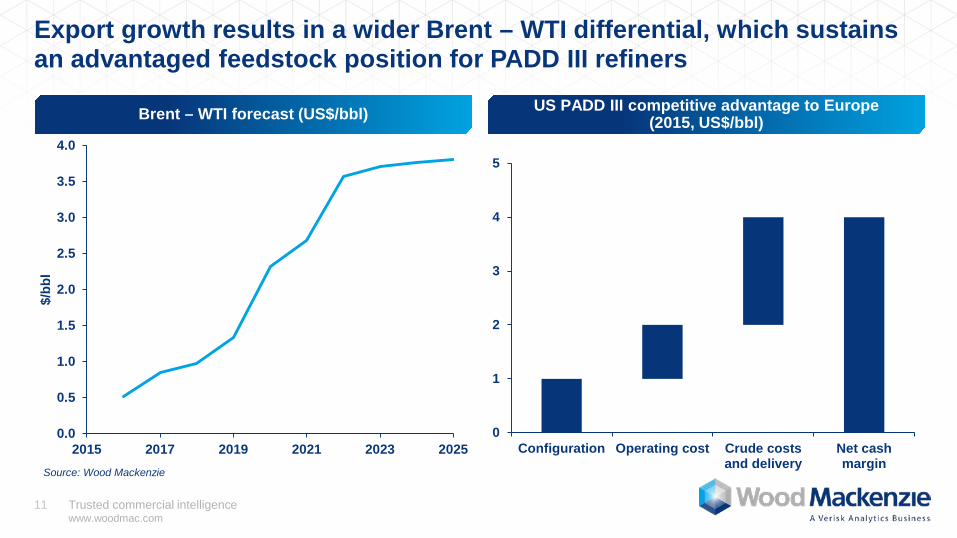
Export growth results in a wider Brent – WTI differential, which sustains an advantaged feedstock position for PADD III refiners
Brent – WTI forecast (US$/bbl) US PADD III competitive advantage to Europe(2015, US$/bbl)
0.0
0.5
1.0
1.5
2.0
2.5
3.0
3.5
4.0
2015 2017 2019 2021 2023 2025
$/bb
l
Source: Wood Mackenzie
0
1
2
3
4
5
Configuration Operating cost Crude costsand delivery
Net cashmargin
Trusted commercial intelligencewww.woodmac.com
12 Trusted commercial intelligencewww.woodmac.com
12
Conclusions
Key takeaways
US crude exports have grown strongly since the export ban was repealed and US tight oil supplies returned to growth
Further export growth is projected as:» US tight oil supply volumes double» Limited further investment in US refining anticipated
US crude exports will flow to both European and Asian refining centres, in significant volumes reflecting:
» Refining value of the crude» Seasonality» Freight and logistics costs
High quality export logistics are key to facilitate the future trade

Trusted commercial intelligencewww.woodmac.com
13
Disclaimer
This presentation has been prepared by Wood Mackenzie Limited. The presentation is intended solely for the benefit of attendees and its contents and conclusions are confidential and may not be disclosed to any other persons or companies without Wood Mackenzie’s prior written permission.
The information upon which this presentation comes from our own experience, knowledge and databases. The opinions expressed in this report are those of Wood Mackenzie. They have been arrived at following careful consideration and enquiry but we do not guarantee their fairness, completeness or accuracy. The opinions, as of this date, are subject to change. We do not accept any liability for your reliance upon them.
Strictly Private & Confidential

Wood Mackenzie™, a Verisk Analytics business, is a trusted source of commercial intelligence for the world'snatural resources sector. We empower clients to make better strategic decisions, providing objective analysisand advice on assets, companies and markets. For more information visit: www.woodmac.comWOOD MACKENZIE is a trade mark of Wood Mackenzie Limited and is the subject of trade mark registrations and/or applications inthe European Community, the USA and other countries around the world.
Europe +44 131 243 4400Americas +1 713 470 1600Asia Pacific +65 6518 0800
Email [email protected] www.woodmac.com